Article

Unraveling Patient Safety Culture Trends in U.S. Hospital Settings: A Yearly Retrospective Analysis

by
Hassan Alabdullah
1,2,* and
Waldemar Karwowski
1
1
Department of Industrial Engineering and Management Systems, University of Central Florida, Orlando, FL 32816, USA
2
Department of Mechanical and Industrial Engineering, Umm Al-Qura University, Makkah 24381, Saudi Arabia
*
Author to whom correspondence should be addressed.
Appl. Sci. 2025, 15(10), 5365; https://doi.org/10.3390/app15105365
Submission received: 13 April 2025 / Revised: 7 May 2025 / Accepted: 9 May 2025 / Published: 11 May 2025
(This article belongs to the Special Issue Work Environment Effects on Health and Safety of Employees)

Abstract

:
Background: Patient safety culture (PSC) is a fundamental aspect of healthcare that significantly impacts care quality and patient outcomes. Examining PSC is vital for identifying areas of improvement and implementing effective, targeted interventions. Objective: This study aimed to evaluate trends in PSC across U.S. hospitals to identify strengths and weaknesses in PSC over time. Methodology: A retrospective descriptive analysis was performed using the Hospital Survey on Patient Safety Culture version 1.0 (HSOPSC 1.0) comparative dataset. This study comprised responses from 1601 hospitals and over 993,000 healthcare providers. Twelve dimensions of PSC, reporting events, and safety grade were analyzed using descriptive statistics to evaluate variations in several indicators, such as means and average positive, negative, and neutral response percentages, across different PSC dimensions and hospital characteristics over time. Considering this study’s exploratory nature, no corrections for multiple testing were applied. Results: The overall PSC scores averaged 65% across years, declining from 67% in 2013 to 64% in 2020, reflecting a moderately positive perception of PSC over time. Key strengths across all years included “Supervisor/Manager Expectations” and “Teamwork within Units”, while persistent weaknesses were observed in “Nonpunitive Response to Error” and “Handoffs and Transitions”. Hospitals in the Southern and Central regions reported the highest positive perceptions. Smaller hospitals and non-teaching hospitals also reported more positive perceptions of PSC. Conclusions: This study underscores the complexities of enhancing PSC and, more importantly, the challenges of sustaining a consistently positive culture over time. The findings highlight the importance of ongoing monitoring and tailored interventions to improve PSC. Promoting a “Just Culture” that prioritizes learning from errors is critical for advancing patient safety in healthcare settings, and enhancing reporting systems is required.

1. Introduction

Patient safety culture (PSC) has gained significant attention in healthcare research, as the safety of patients is increasingly recognized as a vital element of high-quality healthcare. The Institute of Medicine (IOM) emphasizes patient safety as a fundamental component in improving healthcare quality, noting that enhancing hospital safety is crucial for overall care improvement [1]. A strong patient safety culture is essential for reducing medical errors, improving patient outcomes, and creating a supportive environment for healthcare professionals. This aligns with the international patient safety goals set by the World Health Organization [2], which provide a framework for addressing critical safety issues in healthcare settings.
Safety culture in general refers to the collective beliefs, attitudes, and behaviors within an organization that shape its approach to safety management [3]. In healthcare, PSC specifically focuses on minimizing harm and ensuring that safety practices are effectively integrated into daily care processes [4]. PSC encompasses multiple dimensions, including leadership commitment, communication, teamwork, and continuous learning, all of which contribute to a culture where patient safety is prioritized. While PSC is often discussed alongside healthcare quality, it is distinct in its focus on risk prevention and harm reduction [5,6].
To assess PSC, various instruments have been developed [7], with the Hospital Survey on Patient Safety Culture (HSOPSC) being one of the most widely adopted tools. Developed by the Agency for Healthcare Research and Quality (AHRQ) in collaboration with the Quality Interagency Coordination Task Force, the HSOPSC measures hospital staff’s perceptions of safety culture [8]. The first version of the HSOPSC (1.0), introduced in 2004, includes 42 items across 12 dimensions, assessing factors such as organizational learning, teamwork, supervisor support, and nonpunitive responses to error [8]. These dimensions offer insights into the hospital’s safety culture and guide safety improvements.
Tracking trends in PSC is essential for evaluating the effectiveness of safety interventions and measuring long-term improvements in healthcare settings. Understanding these changes allows hospitals to assess the impact of safety initiatives and identify areas needing attention [9]. However, there is a lack of research analyzing PSC trends over time, leaving a gap in understanding the improvement and sustainability of patient safety culture over time.
This research aims to address that by examining trends in PSC within U.S. hospitals using the HSOPSC 1.0 database. It will track key PSC dimensions over time to assess changes, focusing on both strong and weak areas. By analyzing these trends, this study should identify and evaluate the critical dimensions that contribute to fostering a positive patient safety culture and the potential areas for improvement. Ultimately, this research seeks to provide a comprehensive understanding of the state of PSC and offer insights into its year-by-year evolution within U.S. hospitals.

2. Methodology

2.1. Study Design and Data Sources

This retrospective analysis utilized secondary data from the Agency for Healthcare Research and Quality (AHRQ) Hospital Survey on Patient Safety Culture version 1.0 (HSOPSC 1.0) database, initially developed by Westat® (Rockville, MD, USA) under a contract with AHRQ [8]. The dataset includes responses from healthcare professionals working in a diverse range of U.S. hospitals, encompassing government, private, non-teaching, and teaching hospitals. Participants represented hospitals across various regions and varied in size, staffing positions, and levels of experience. The data period spanned from 2013 to 2020, utilizing voluntarily submitted survey data from hospitals across the United States. All necessary ethical approvals and informed consent procedures were followed during the data collection process, as stipulated by AHRQ [9].
The analysis incorporated data from 993,245 healthcare providers and 1601 hospitals whose staff completed the HSOPSC 1.0 over time. A formal written request to access the HSOPSC 1.0 database was submitted. Westat® officially accepted, finalized, and electronically delivered the U.S. HSOPSC 1.0 datasets.

2.2. Instrument for Assessing PSC

The AHRQ developed the HSOPSC instrument to evaluate multiple PSC dimensions. This study utilizes version 1.0, which served as the primary tool for assessing PSC from 2013 to 2020. The HSOPSC comprises 42 items that assess 12 key dimensions of patient safety culture. The survey is organized into 12 main sections, each containing 3 to 5 subitems. These items are rated on a 5-point Likert scale, ranging from “strongly disagree” to “strongly agree”, or on a frequency scale, ranging from “never” to “always”. The dimensions of PSC measured by the instrument include two main outcome dimensions—overall perceptions of patient safety and frequency of events reported—and ten additional dimensions that assess the perceptions of healthcare workers of supervisor/manager expectations and actions promoting patient safety, organizational learning, teamwork within units, communication openness, feedback and communication about error, nonpunitive response to error, staffing, management support for patient safety, teamwork across units, and handoffs and transitions. The survey also asked the workers to rate the safety grade of their work area/unit and the frequency of error reporting in the past 12 months [9]. The AHRQ website provides the HSOPSC questionnaires, outlining key dimensions, comprehensive information, and guidelines about HSOPSC [10].

2.3. Data Analysis

The analytical approach began with data processing in Statistical Analysis System (SAS) software version 9.4, encompassing exploration, formatting, and standardization [11]. Subsequent statistical analyses were performed using IBM SPSS for Windows, version 26.0 (Chicago, IL, USA) [12]. Descriptive statistics, including frequencies and percentages, were used to summarize response distributions. Several measures were employed to examine trends. Positive response percentages were calculated by aggregating responses indicating agreement or positive sentiment (e.g., “agree” and “strongly agree”, etc.), contingent on question wording. Conversely, negative responses were analyzed similarly, with neutral responses also considered. Means and standard deviations (SDs) were also calculated for each item. An analysis of variance (ANOVA) was conducted to investigate variations in mean positive responses across years and hospital characteristics within each PSC domain. Statistical significance was determined at p < 0.05, and Tukey’s post hoc test was applied to compare means across years and other factors. Percentile benchmarks (10th, 25th, 50th, 75th, and 90th) were established to facilitate comparisons with year-to-year findings from the database. Hospital-level trends in PSC scores were tracked and compared across multiple time periods to assess changes in patient safety culture dimensions. A 5% threshold was applied to identify meaningful changes over time [9].

3. Results

3.1. Hospital and Respondent Characteristics

Over multiple years, this study analyzed data from 1601 hospitals, representing various characteristics, such as geographic location, size, type, and survey administration methods. In addition, it examined respondent characteristics, including their work areas, weekly working hours, and levels of experience. The analysis highlights key respondent features, including the predominance of registered nurses, the proportion of staff involved in direct patient care, and the diversity in experience levels. A comprehensive overview of hospital and respondent characteristics is presented in Table 1.
Table 1 presents the categorization of hospitals based on their characteristics. Regionally, hospitals are categorized by the AHRQ based on regions defined by the American Hospital Association, including the states within each region [9,13,14], reorganized into four main regions: Northeast, South, Central, and West. The Central region had the highest number of participating hospitals (44.3%, 366,108 participants), followed by the South (30.6%, 338,743 participants). The West had the smallest representation (11.4%, 183 hospitals, 108,556 participants). Hospitals in the 400+ bed category represented the largest proportion (14.2%), while hospitals in the 6–49 bed category had the smallest representation (20.5%, 328 hospitals, 43,007 respondents). Data collection spanned 2013–2020, peaking in 2015 (23.9%, 372 hospitals, 237,135 respondents), with the lowest participation in 2013 (<1%) and 2020 (2.5%). Web-based surveys were the primary mode of administration (81.8%, 1310 hospitals, 844,469 respondents), followed by mixed-mode and paper-based surveys (71 hospitals, 18,757 respondents). The sample included both non-teaching (1015 hospitals, 420,819 respondents) and teaching hospitals (586 hospitals, 572,426 respondents).
Regarding participants’ characteristics, 13% had less than 1 year of hospital experience, 34% had 1–5 years, and 19% had 6–10 years. In terms of specialty/profession experience, 27% had 1–5 years, and 24% had 21+ years. Registered Nurses comprised the largest group (35%), followed by patient care assistants/hospital aides/care partners (6%). In their work area/unit, 40% had 1–5 years of experience, 16% had less than 1 year, and 19% had 6–10 years. Most participants worked 40–59 h per week (48%), followed by 20–39 h (41%) and less than 20 h (5%). Direct patient interaction was reported by 78% of participants.
As shown in Figure 1, the number of distributed surveys peaked at 514,839 in 2015 and reached a low of 15,583 in 2013. However, these fluctuations were not statistically significant (p = 0.134). Valid responses also peaked in 2015 (237,135) and reached a low in 2013 (9094), with no significant difference between these years (p = 0.598). However, the average response rate significantly increased from 0.59 in 2013 to 0.63 in 2020 (p = 0.002), suggesting improved engagement or survey processes. The surveys were rigorously cleaned by Westat® [9], with incomplete surveys excluded before the response rate was calculated. Hospitals with missing values in PSC domains were also excluded. While the yearly total of surveys distributed and valid responses showed no significant differences, the response rate varied significantly.

3.2. Patient Safety Culture Overview

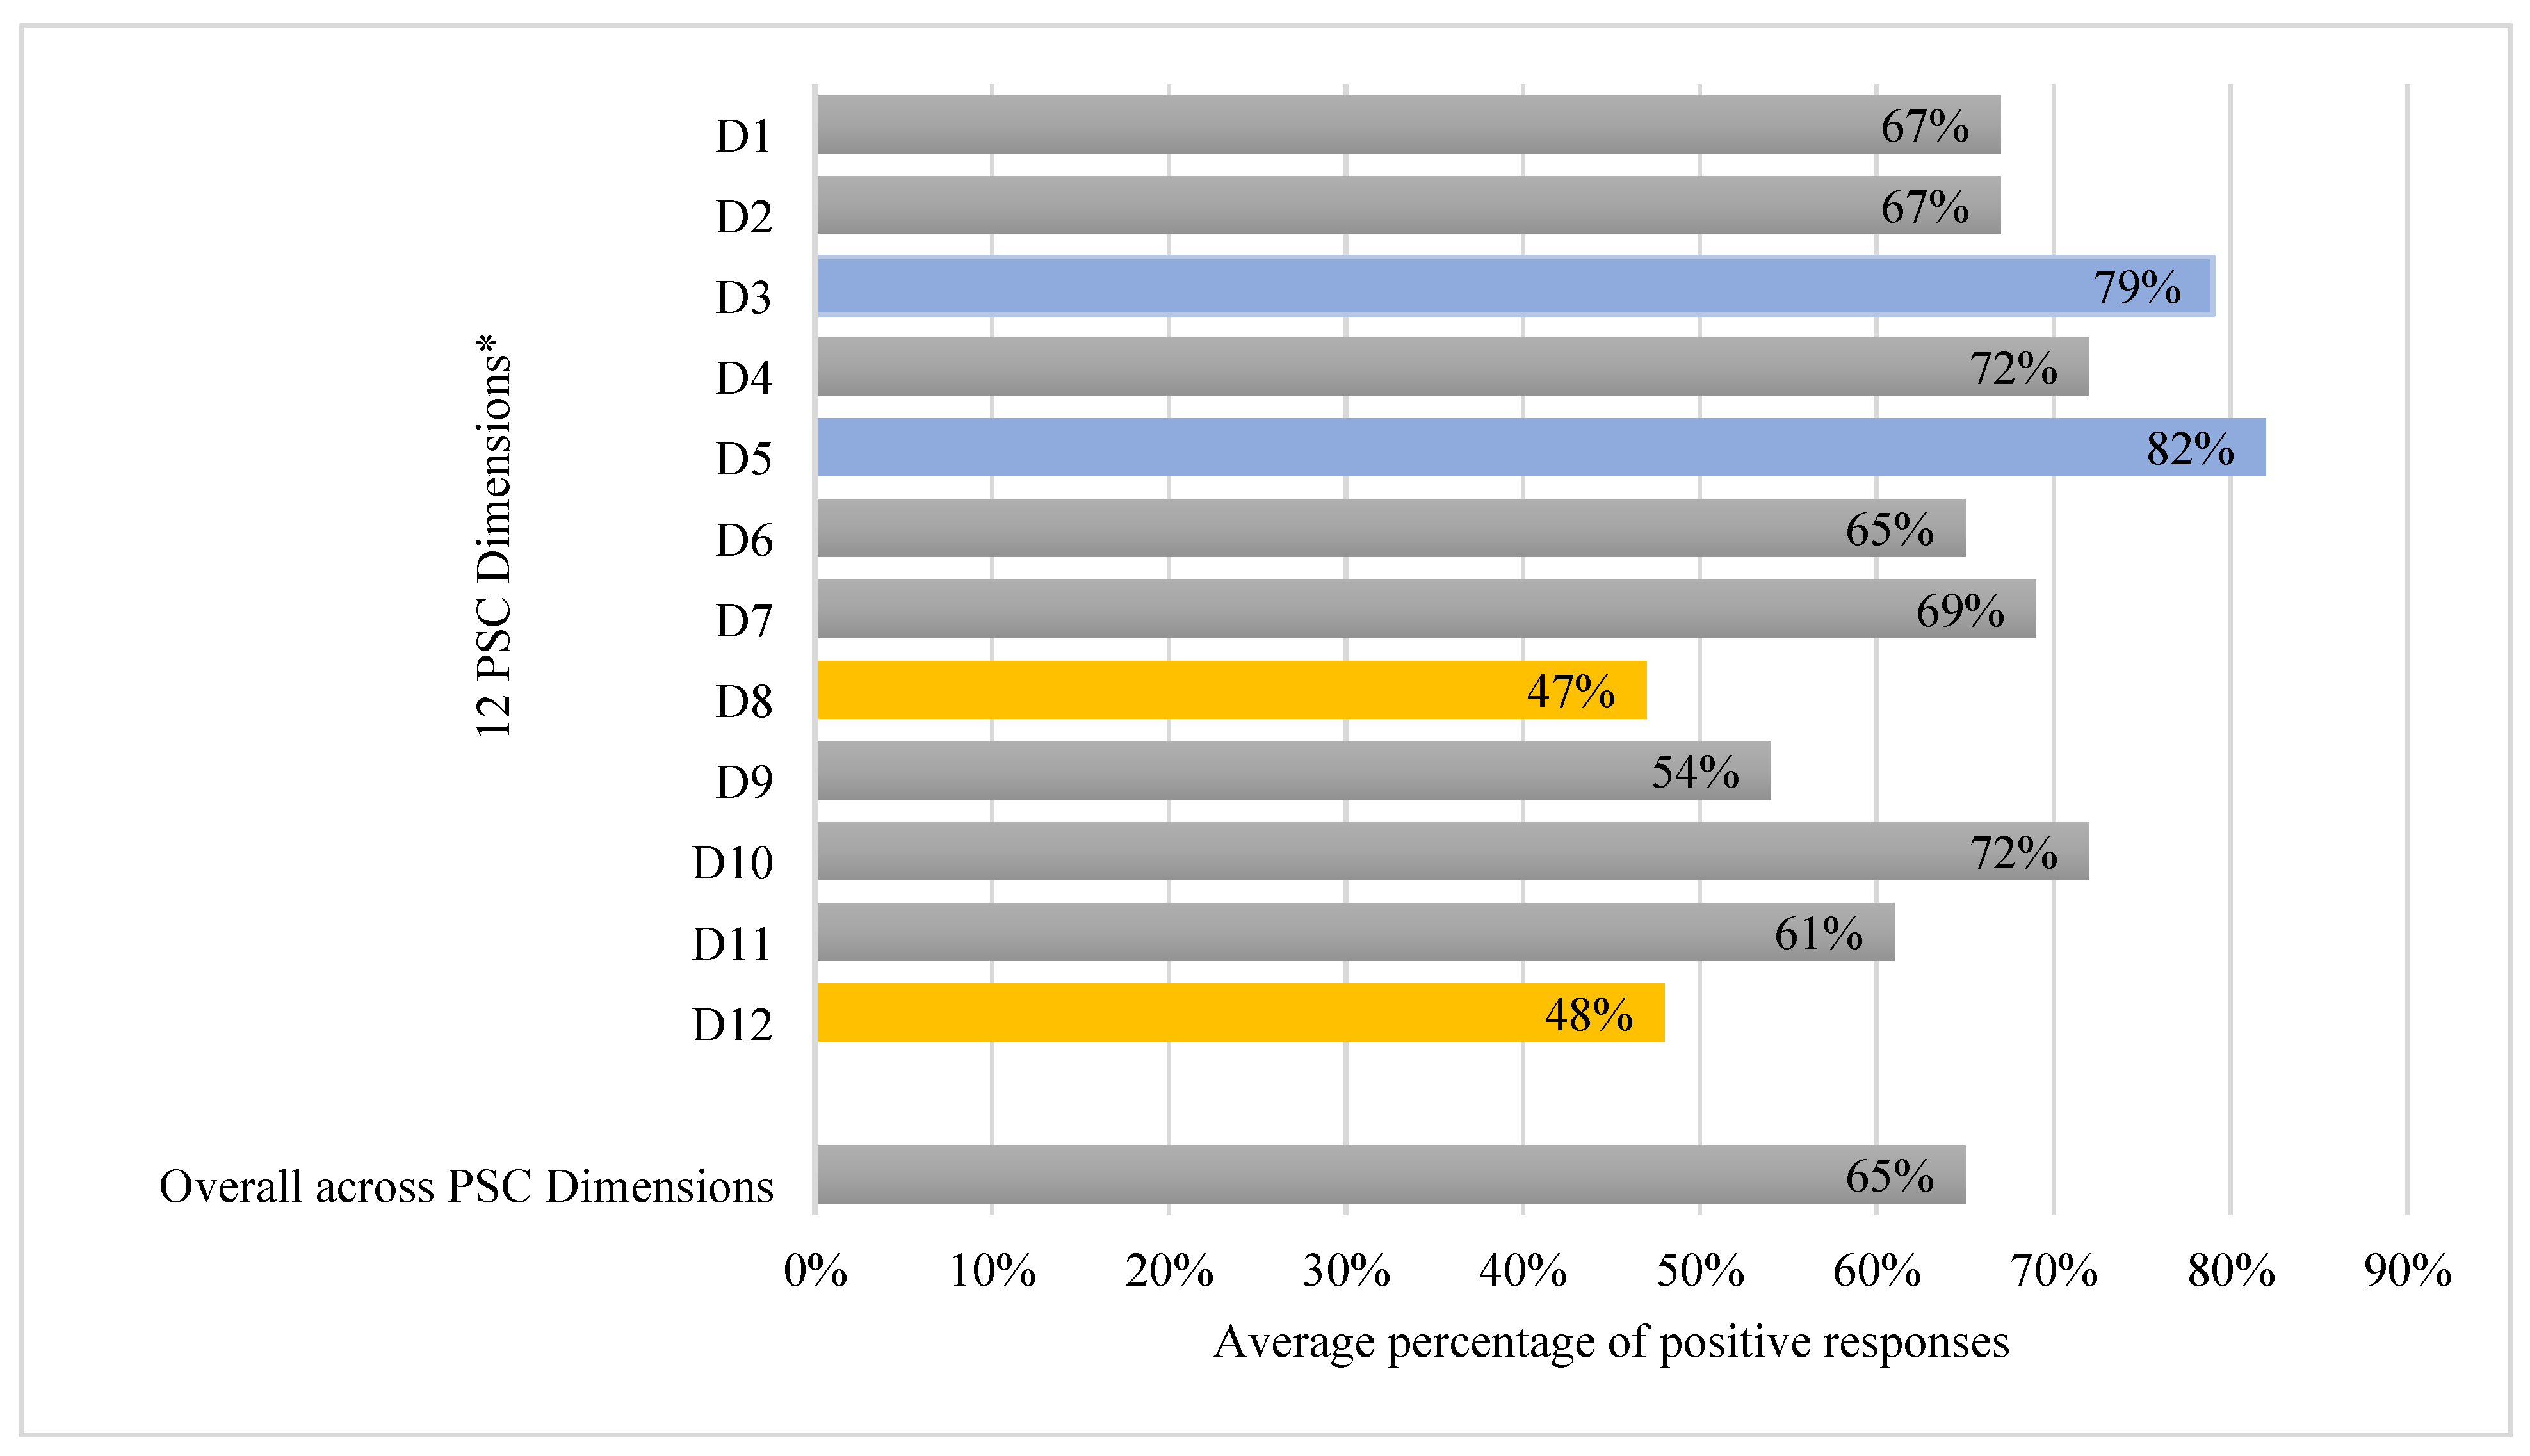
Figure 2 shows the overall PSC in U.S. hospital settings, combining data from 2013 to 2020. These aggregated data capture the general perceptions of healthcare workers regarding safety policies, practices, and organizational priorities in healthcare settings. Because culture is a group characteristic, each hospital contributes equally to the overall averages. Figure 2 presents the overall PSC score, calculated as the average of PSC dimensions over time, highlighting the average positive response percentages (APR%) at the hospital level.
The overall PSC rate in U.S. hospital settings averaged 65% across the years studied. Areas of strength, with the highest average positive response rates, were Teamwork Within Units (82%) and Supervisor/Manager Expectations and Actions Promoting Patient Safety (79%). Organizational Learning—Continuous Improvement and Management Support for Patient Safety also showed relatively strong scores (72%). Conversely, areas needing improvement, with the lowest average positive response rates, included Nonpunitive Response to Error (47%) and Handoffs and Transitions (48%). Staffing (54%) was identified as an area approaching the lower end of performance.
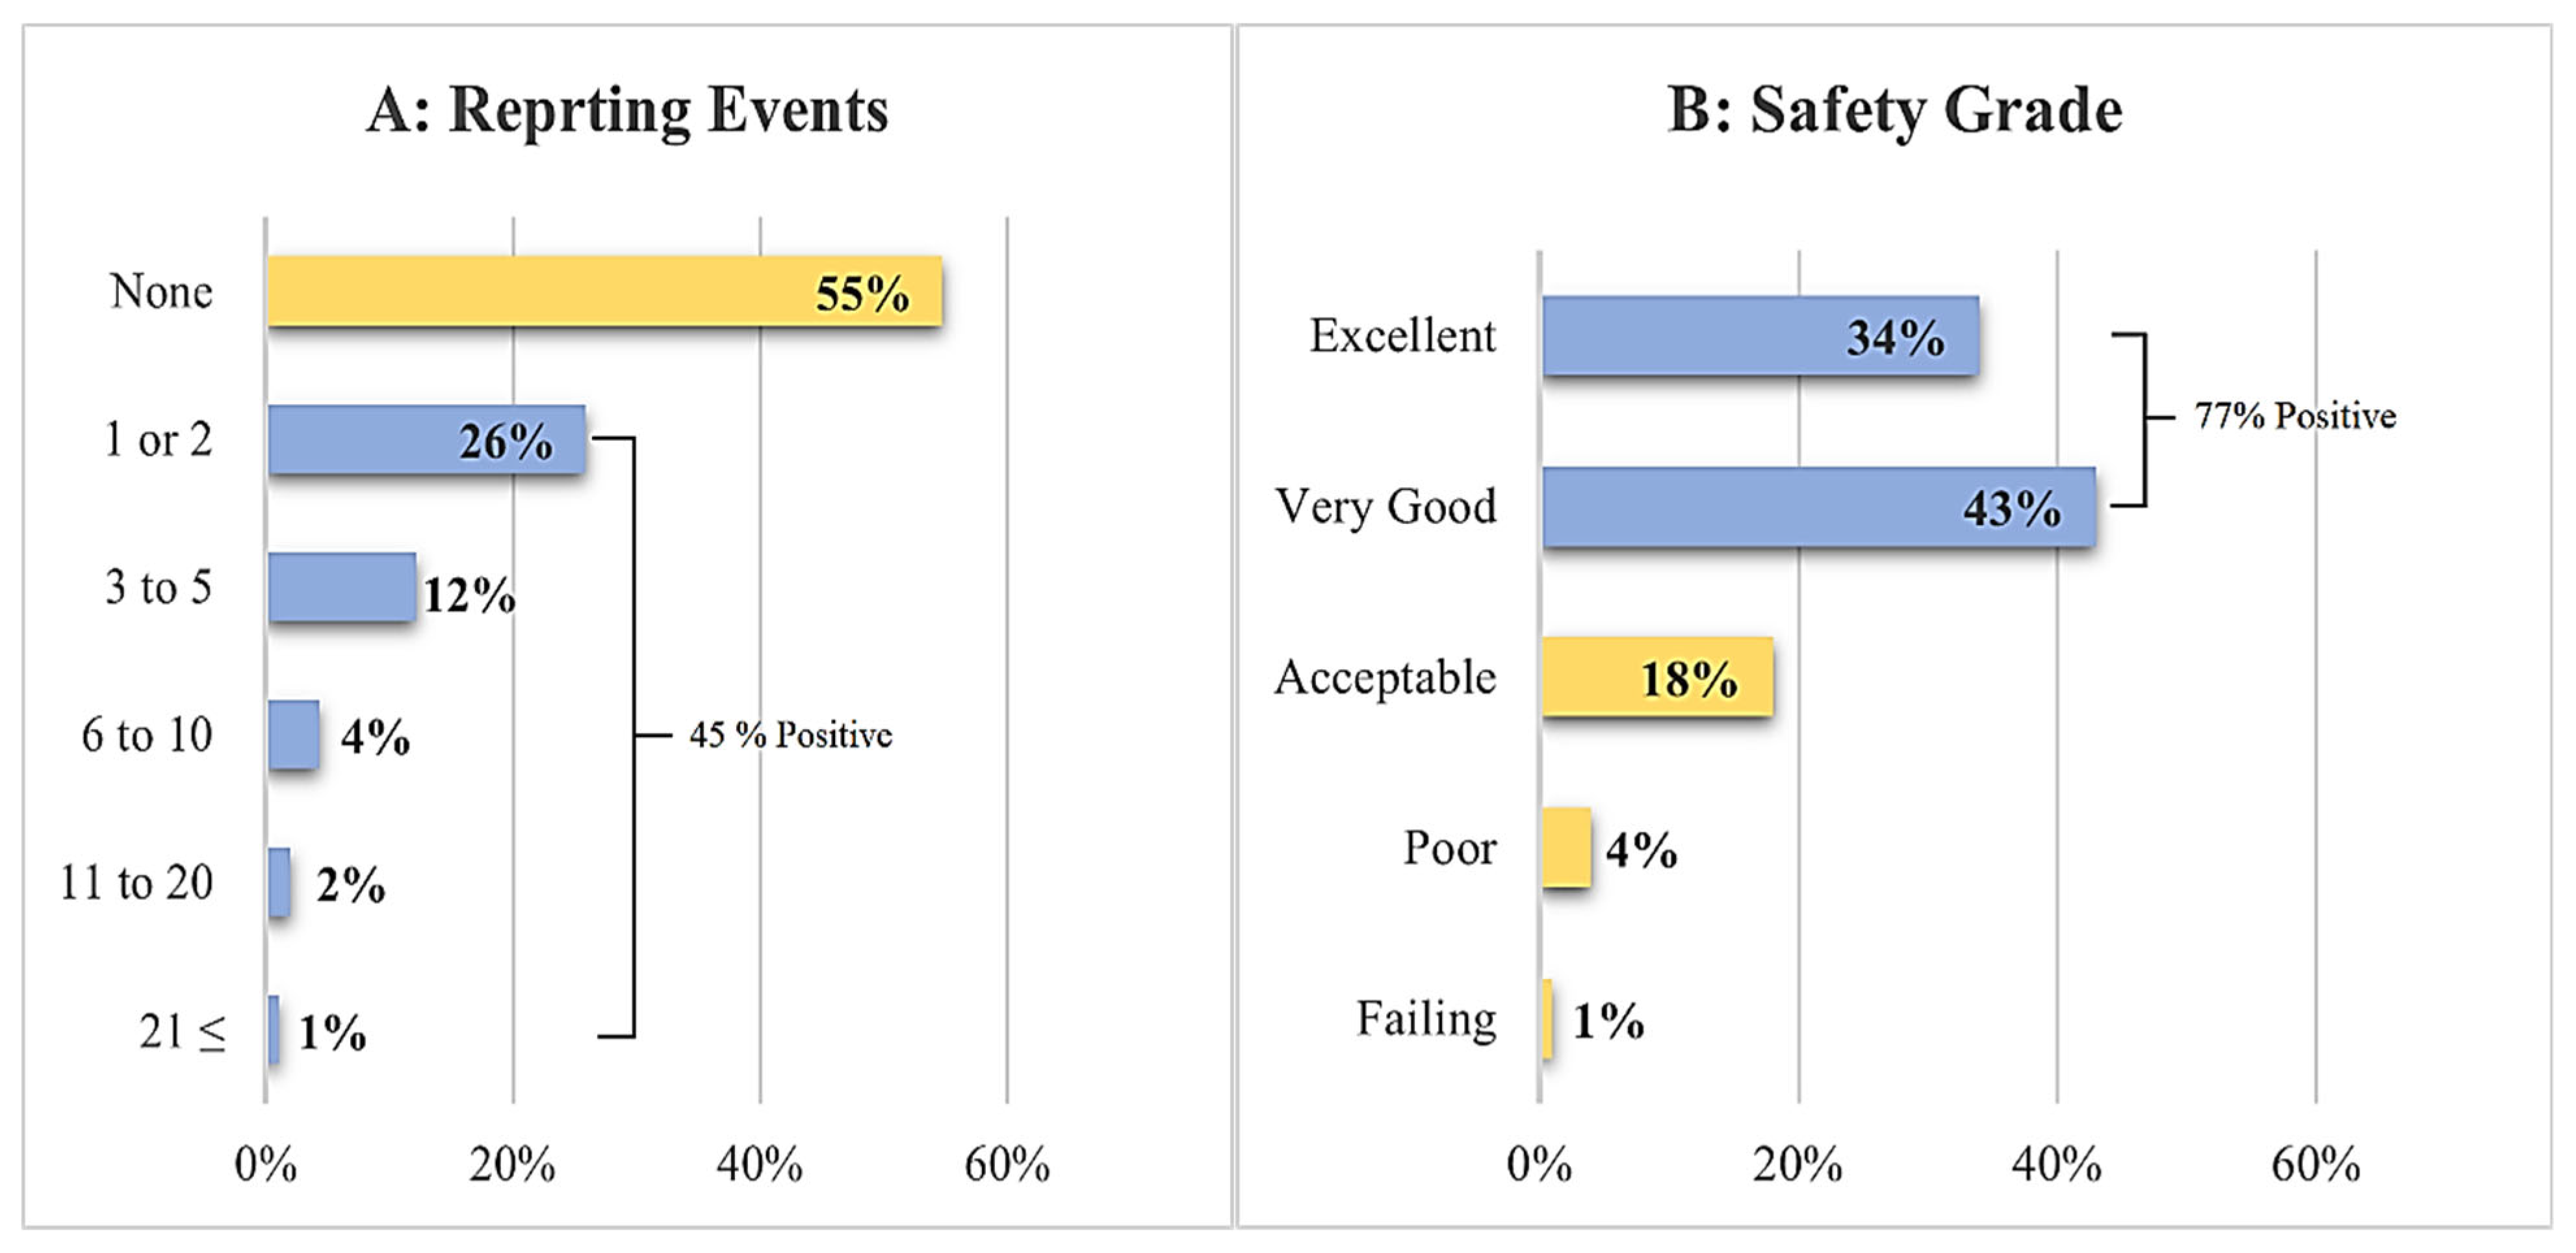
The two outcome dimensions—reported error frequency and safety grade (Figure 3A,B)—provide insight into error reporting behaviors and perceptions of workplace safety. Over the years, the majority of respondents (55%) reported no errors in the past 12 months; 26% reported 1–2 errors; 12% reported 3–5; 4% reported 6–10; 2% reported 11–20; and 1% reported 21 or more errors.
Regarding safety grades, 34% rated their work area as excellent, 43% as very good, 18% as acceptable, 4% as poor, and 1% as failing, indicating predominantly positive perceptions of workplace safety.
Table 2 presents percentile assessments, offering hospitals a valuable benchmarking tool for performance improvement. Comparing their results to a larger database enables hospitals to assess their relative standing, identify strengths, and pinpoint areas for enhancement. This, in turn, allows hospitals to set realistic goals and focus on targeted interventions to improve their culture of patient safety.
Key dimensions, such as Supervisor/Manager Expectations and Actions Promoting Patient Safety (17–98% positive) and Teamwork within Units (26–99%) showed the highest scores, reaching 87% and 88%, respectively, at the 90th percentile (meaning that 90% of hospitals scored at or below this level, and 10% higher). Furthermore, Management Support for Patient Safety (36–96%) and Organizational Learning (15–93%) also showed positive scores, reaching 83% and 81% at the 90th percentile. However, Nonpunitive Response to Error and Handoffs and Transitions showed significant score variation, reaching only 58% and 62%, respectively, at the 90th percentile. These lower 90th percentile scores indicate that many hospitals struggle with these aspects, highlighting the need for immediate attention. Other dimensions, such as Staffing (66% in the 90th percentile), showed room for improvement, suggesting that substantial gaps remain in ensuring adequate staffing.
Table 3 summarizes survey responses across 12 dimensions (D1–D12), categorized by region, hospital bed size, survey mode, staff surveyed, and hospital type. The results reveal notable variations in positive response rates, with ANOVA analysis indicating statistically significant differences (p < 0.05) across most comparisons, particularly for region, bed size, and hospital type.
Regionally, hospitals in the Central and South regions demonstrated the highest positive response rates across all dimensions, significantly exceeding those in the Northeast and West (p < 0.001). Methodologically, the paper-based surveys yielded higher positive responses, especially in dimensions D9 and D12, where significant differences were observed. While variations in staff selection methods were less pronounced, surveys of selected departments or units showed marginally higher responses for some dimensions, although most comparisons in this category lacked statistical significance. Institutionally, non-teaching hospitals scored significantly higher across all dimensions compared to teaching hospitals (p < 0.001). Smaller hospitals (6–49 beds) consistently reported higher positive responses than larger hospitals (400+ beds) (p < 0.001).

3.3. Annual Changes in Patient Safety Culture

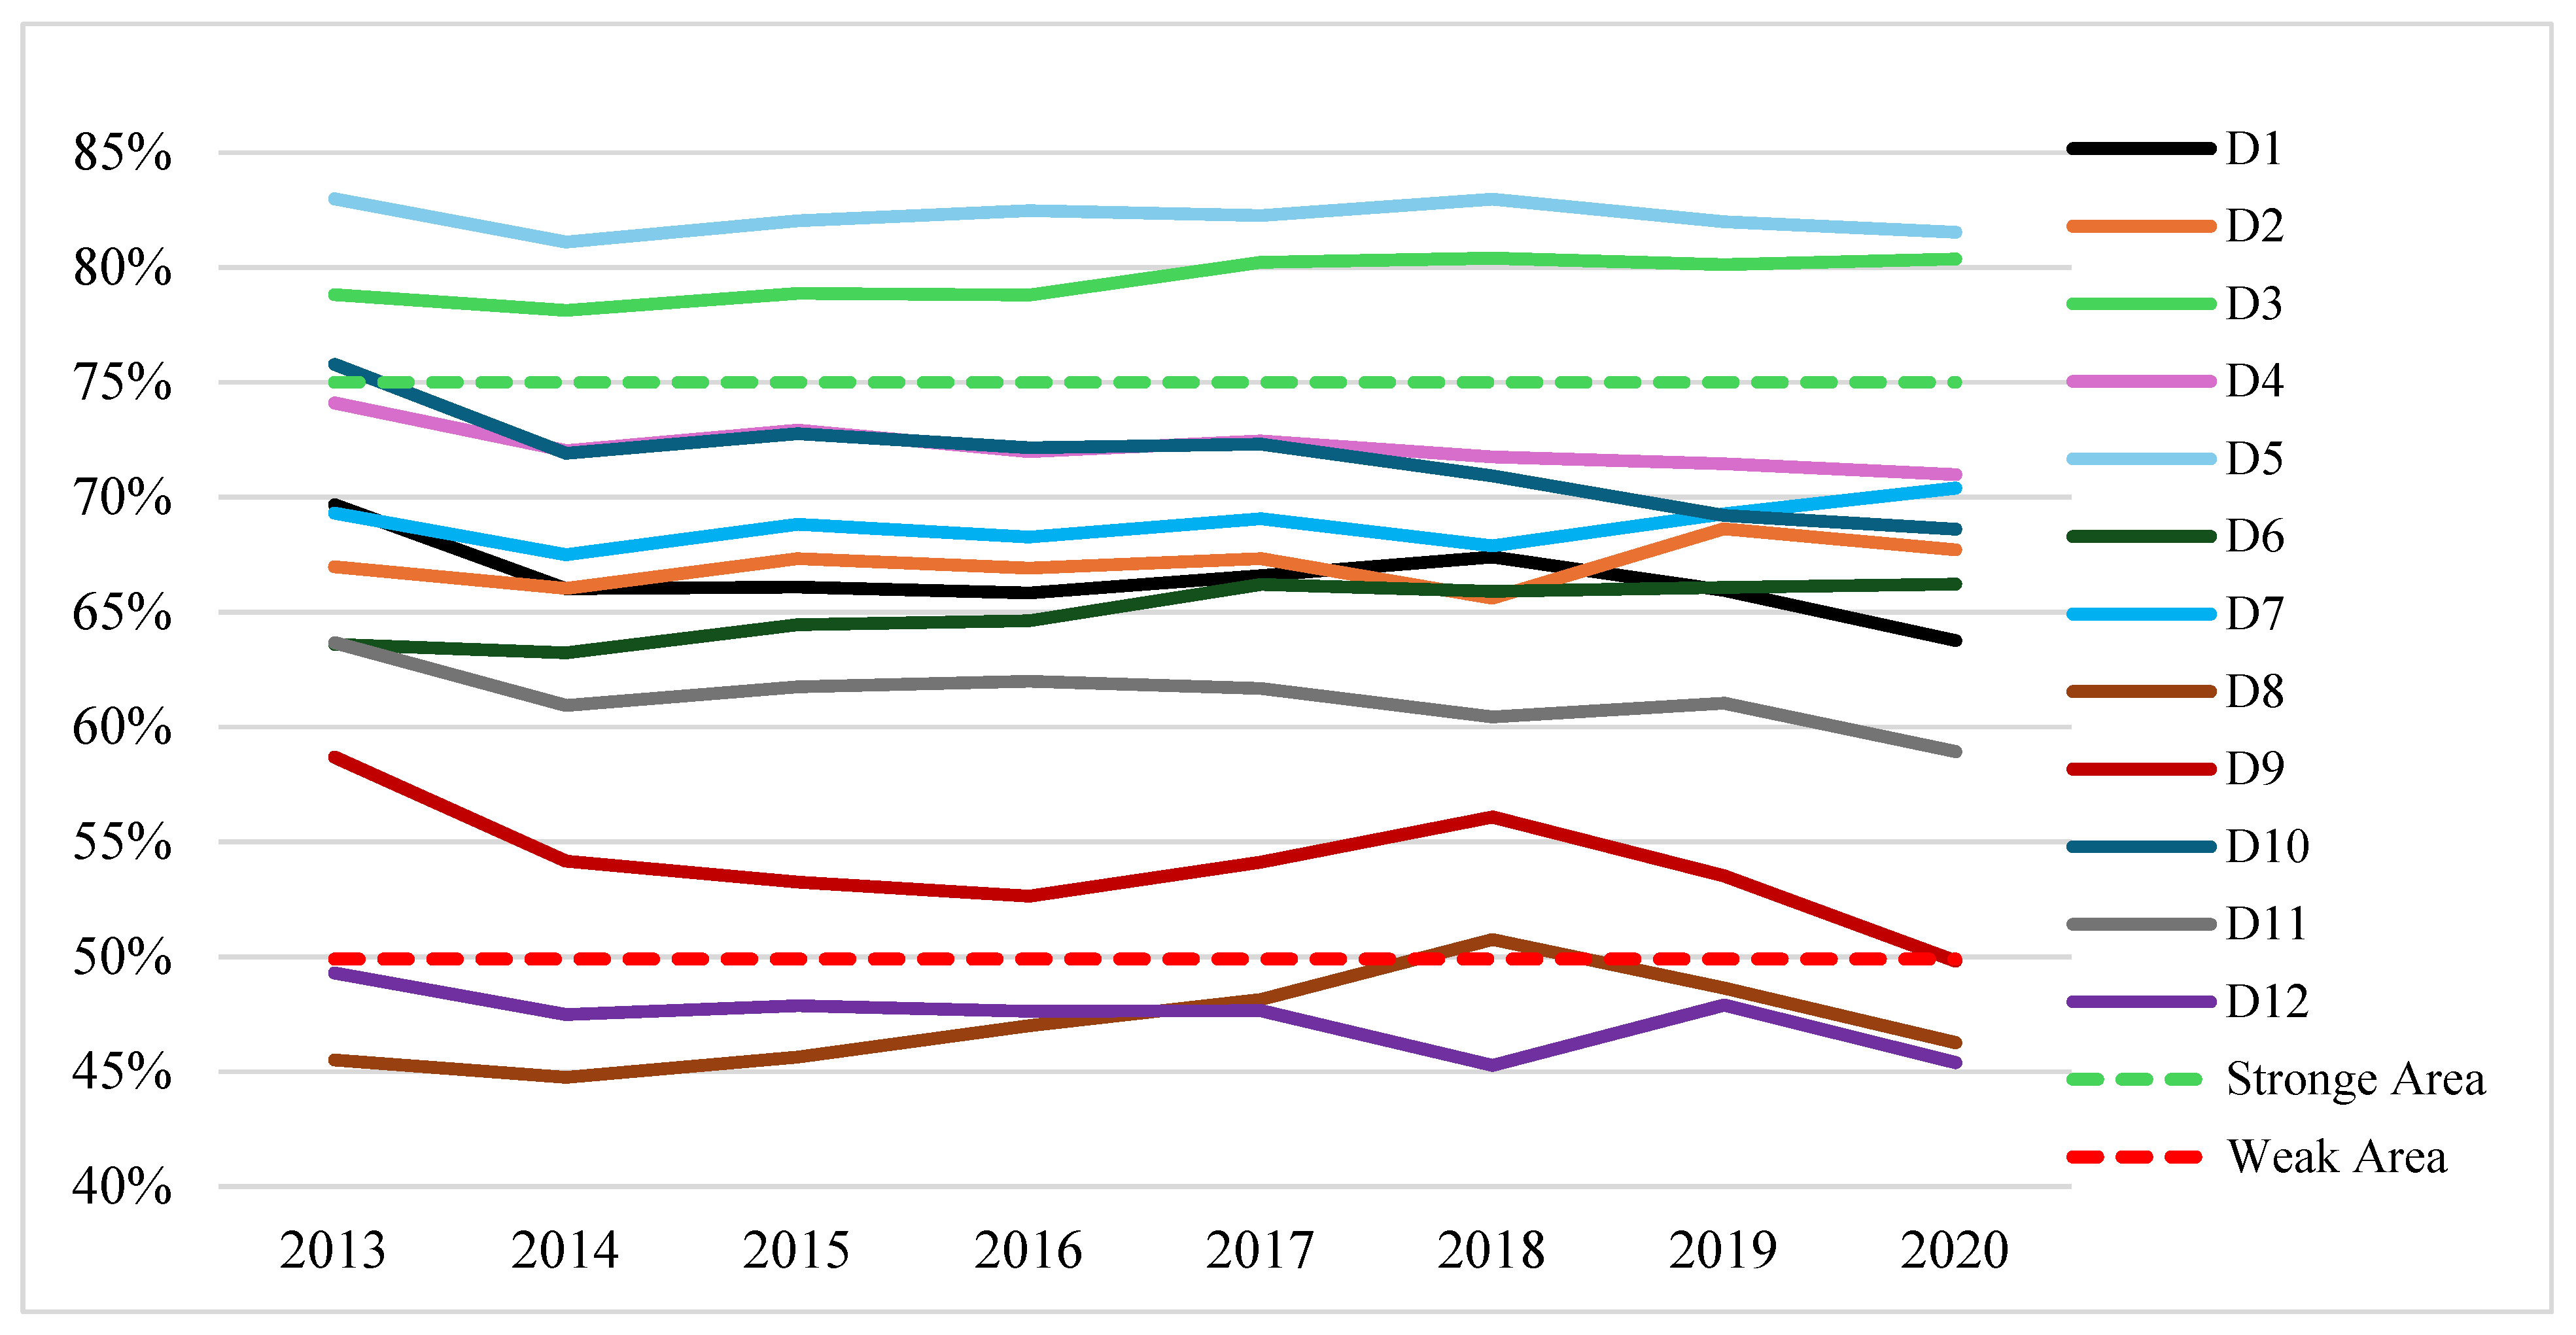
Having illustrated the overall average results for the dimensions of PSC, the focus now shifts to analyzing year-to-year trends, providing an overview of PSC in U.S. hospital settings over time. This analysis will showcase annual change based on four measurement indicators: the mean, standard deviation, and average percentages of positive, neutral, and negative responses, as shown in Table 4. Figure 4 and Figure 5 also show the trends in average positive response percentages for the 12 PSC dimensions and overall PSC scores across the years studied.
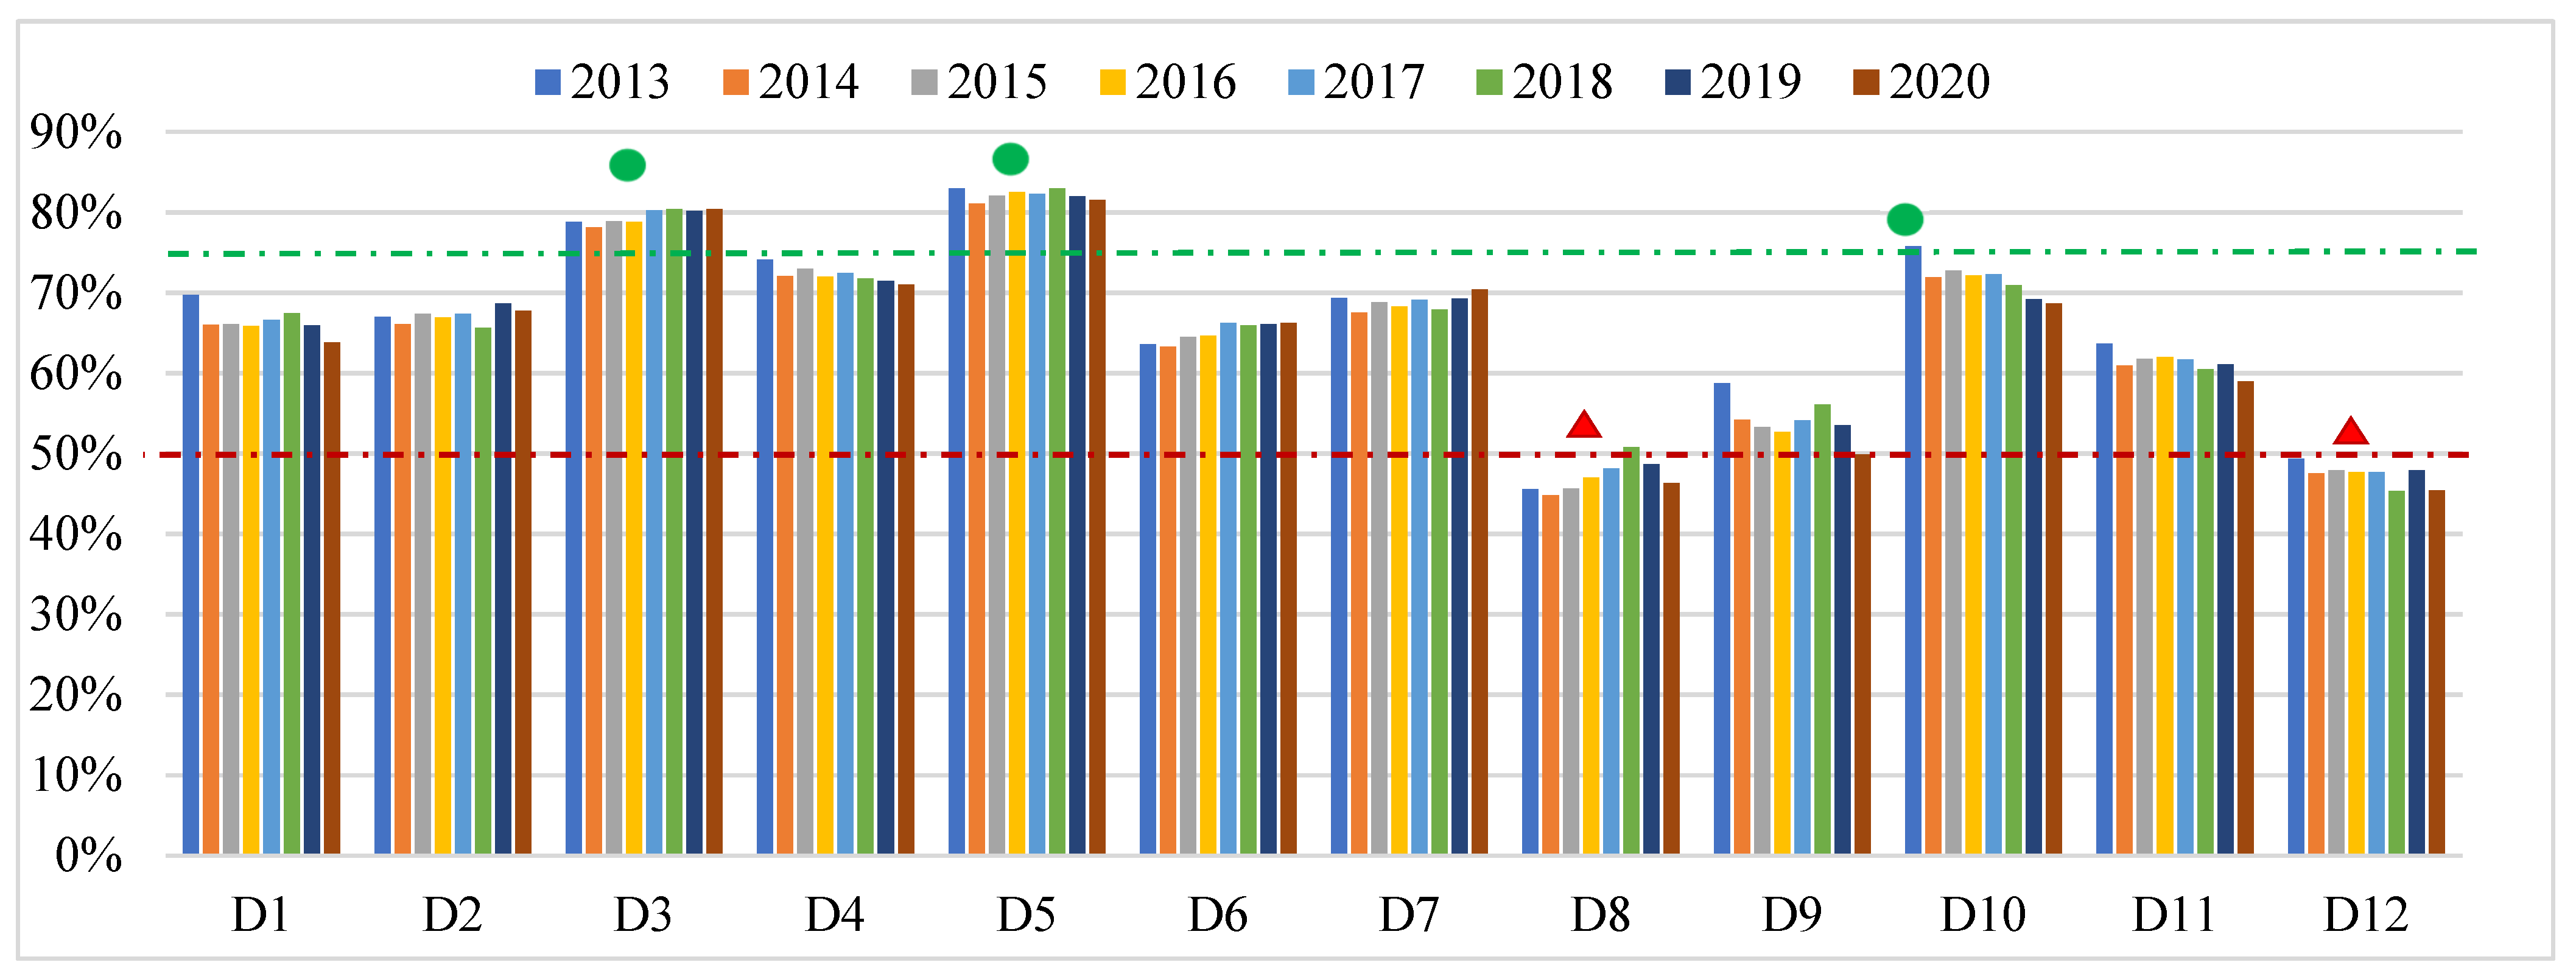
As shown in Figure 4, D5 (Teamwork within Units) and D3 (Supervisor/Manager Expectations and Actions Promoting Patient Safety) consistently remained strengths. Most other dimensions fluctuated within the moderate range (between 50% and 75%), exhibiting both improvements and declines over time. D9 (Staffing) transitioned from a neutral to a weak area, while D12 (Handoffs and Transitions) remained weak, showing a continuous decline. D8 (Nonpunitive Response to Error) initially improved, peaking in 2018 when it moved out of the weak category, but later regressed.
Overall PSC scores (Figure 5), calculated as the average of all dimensions each year, declined from 67% in 2013 to 64% in 2020. Although the scores fluctuated around 65% for most years, a notable drop occurred in 2020.
From 2013 to 2020, the PSC dimensions showed mixed trends (Table 4). D1 (Overall Perceptions of Patient Safety) remained stable (mean ≈ 3.68 ± 0.2, p = 0.391). D2 (Frequency of Events Reported) improved, with the mean increasing from 3.85 to 3.91 (p < 0.001) and the APR% rising from 67% to 68%. D3 (Supervisor/Manager Expectations and Actions Promoting Patient Safety) remained high, with a mean of ≈4.01 ± 0.2 and the APR% increasing from 79% to 80% (p < 0.001). D4 (Organizational Learning) and D5 (Teamwork within Units) remained stable, with the APR% around 72% and 82%, respectively.
D6 (Communication Openness) showed significant improvement, with the mean increasing from 3.70 to 3.81 (p < 0.001), and the same trend was observed in D7 (Feedback and Communication about Error) (mean rising from 3.89 to 3.95, p = 0.007). In contrast, D9 (Staffing) declined (mean dropping from 3.53 to 3.29, p = 0.009), and D10 (Management Support for Patient Safety) also decreased (mean from 3.86 to 3.72, p = 0.007). Persistent challenges in D12 (Handoffs and Transitions) highlighted areas needing improvement, as it remained weak with no statistically significant change observed.
Many PSC dimensions showed statistically significant changes over time (Table 4), likely due to the large sample size affecting the one-way ANOVA results. D1 (Overall Perceptions of Patient Safety), D9 (Staffing), and D10 (Management Support for Patient Safety) declined in positive responses and increased in negative responses (p < 0.05). D1’s positive responses dropped from 70% (2013) to 64% (2020), while the negative responses rose from 13% to 18%. D9 and D10 also showed declines. D6 and D7 showed improvement. D6’s neutral responses decreased from 23% to 21%, and the positive responses increased from 64% to 66%. D7’s neutral responses declined from 22% to 21%, and the positive responses increased from 69% to 70% (0.23% change, p = 0.115).
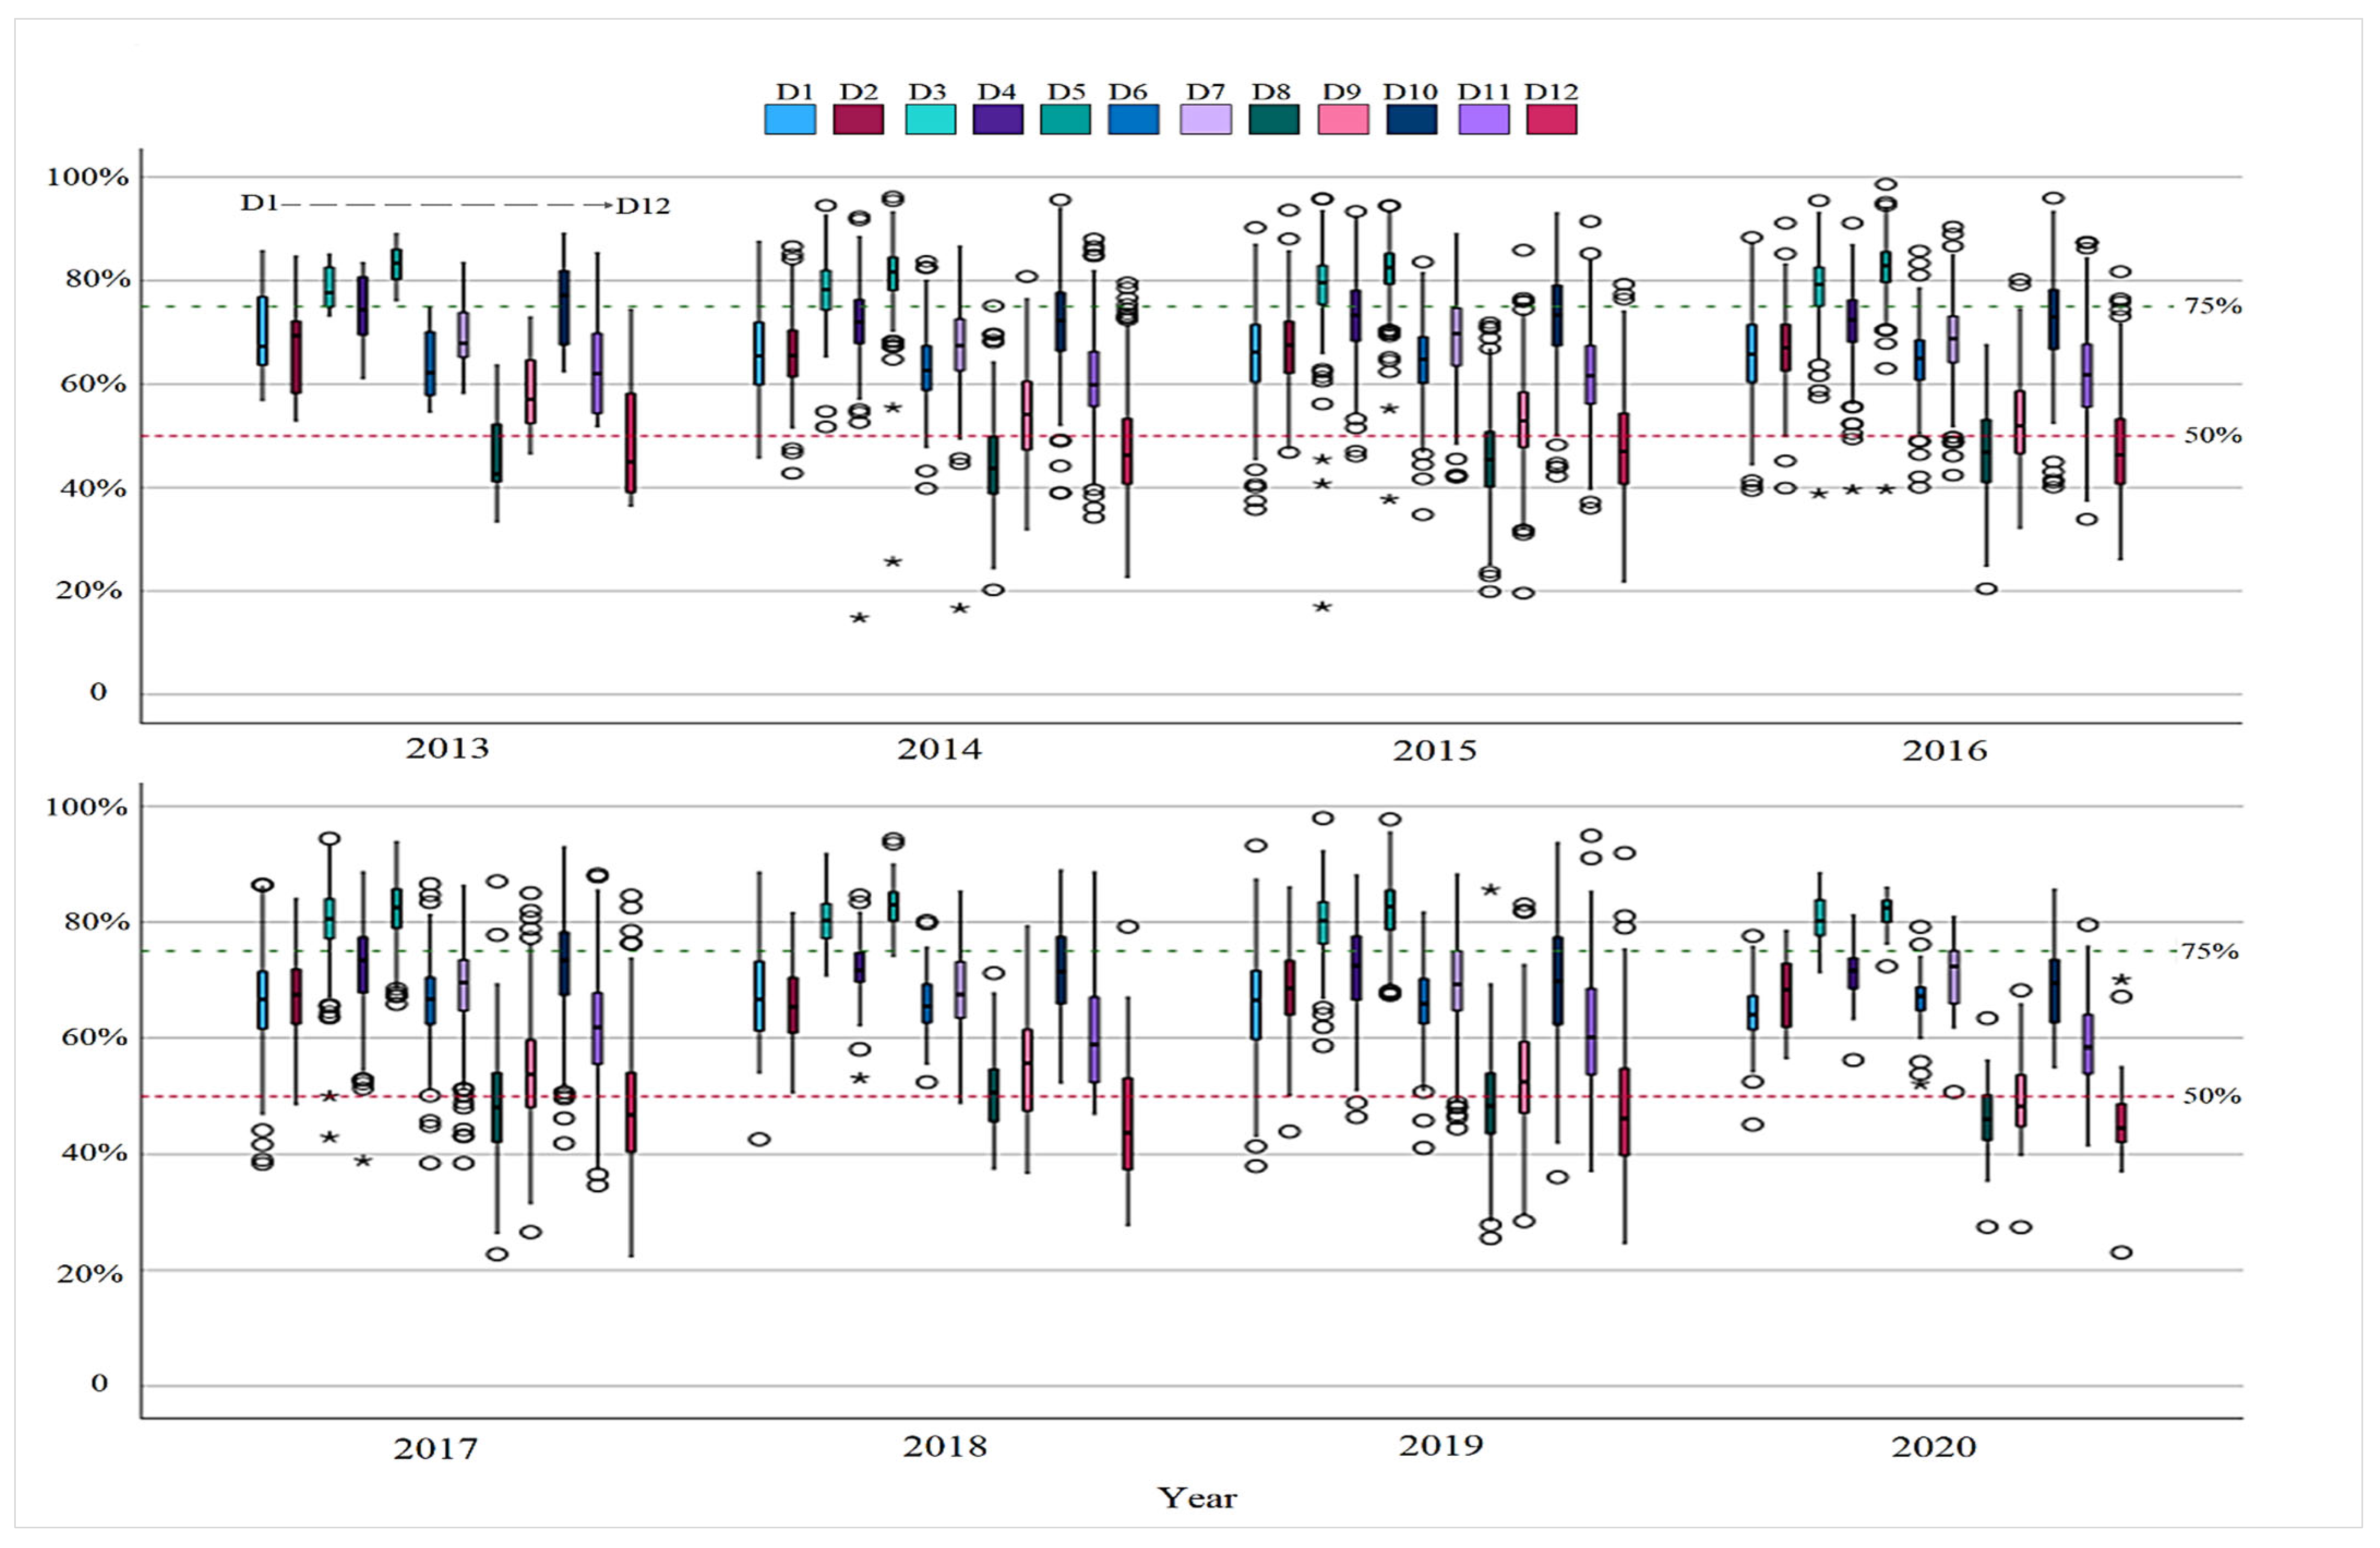
The boxplot (Figure 6) illustrates the consistency and variability of the 12 PSC dimensions across the observed years.
Some dimensions showed remarkable stability. For instance, D5 consistently achieved high percentages of positive response, and D3 exhibited similar, though less pronounced, consistency. D12 showed the greatest variability, reflecting significant perceptual divergence. At the year level, 2020 displayed the highest overall consistency across the 12 dimensions. However, outliers were notable in earlier years (2014–2017 and 2019), indicated by the (O) symbol, with some hospitals reporting exceptionally high or low percentages of positive responses. Some hospitals reported perceptions exceeding outlier values, representing extreme deviations, indicated by the (Applsci 15 05365 i003) symbol. A more detailed view of the year-by-year variation for each dimension is provided in Figure S1 in the Supplementary Material.
Figure 7 presents the distribution of safety grades and reported events. In Part A, the percentage of “Excellent” grades increased slightly from 32% (2013) to 36% (2019) before decreasing to 34% (2020) (p = 0.003). The “Very Good” grades consistently declined from 47% (2013) to 40% (2020) (p < 0.001). The “Acceptable” grades remained relatively stable (17–20%, p = 0.134). The “Poor” grades increased from 2% (2013) to 5% (2020) (p = 0.038). The “Failing” grades remained constant at 1% (p = 0.354).
Part B of Figure 7 reveals that the proportion of respondents reporting “No events” varied between 52% and 58%, with a statistically significant downward trend (p < 0.001). Reports with “1–2” events ranged from 23% to 27%, and reports with “3–5” events varied between 11% and 14%. The “6–10” events remained between 4% and 5%, while the “11–20” events increased from 1% to 4% (all p < 0.001). The “21+” events remained constant at 1% (p = 0.465).
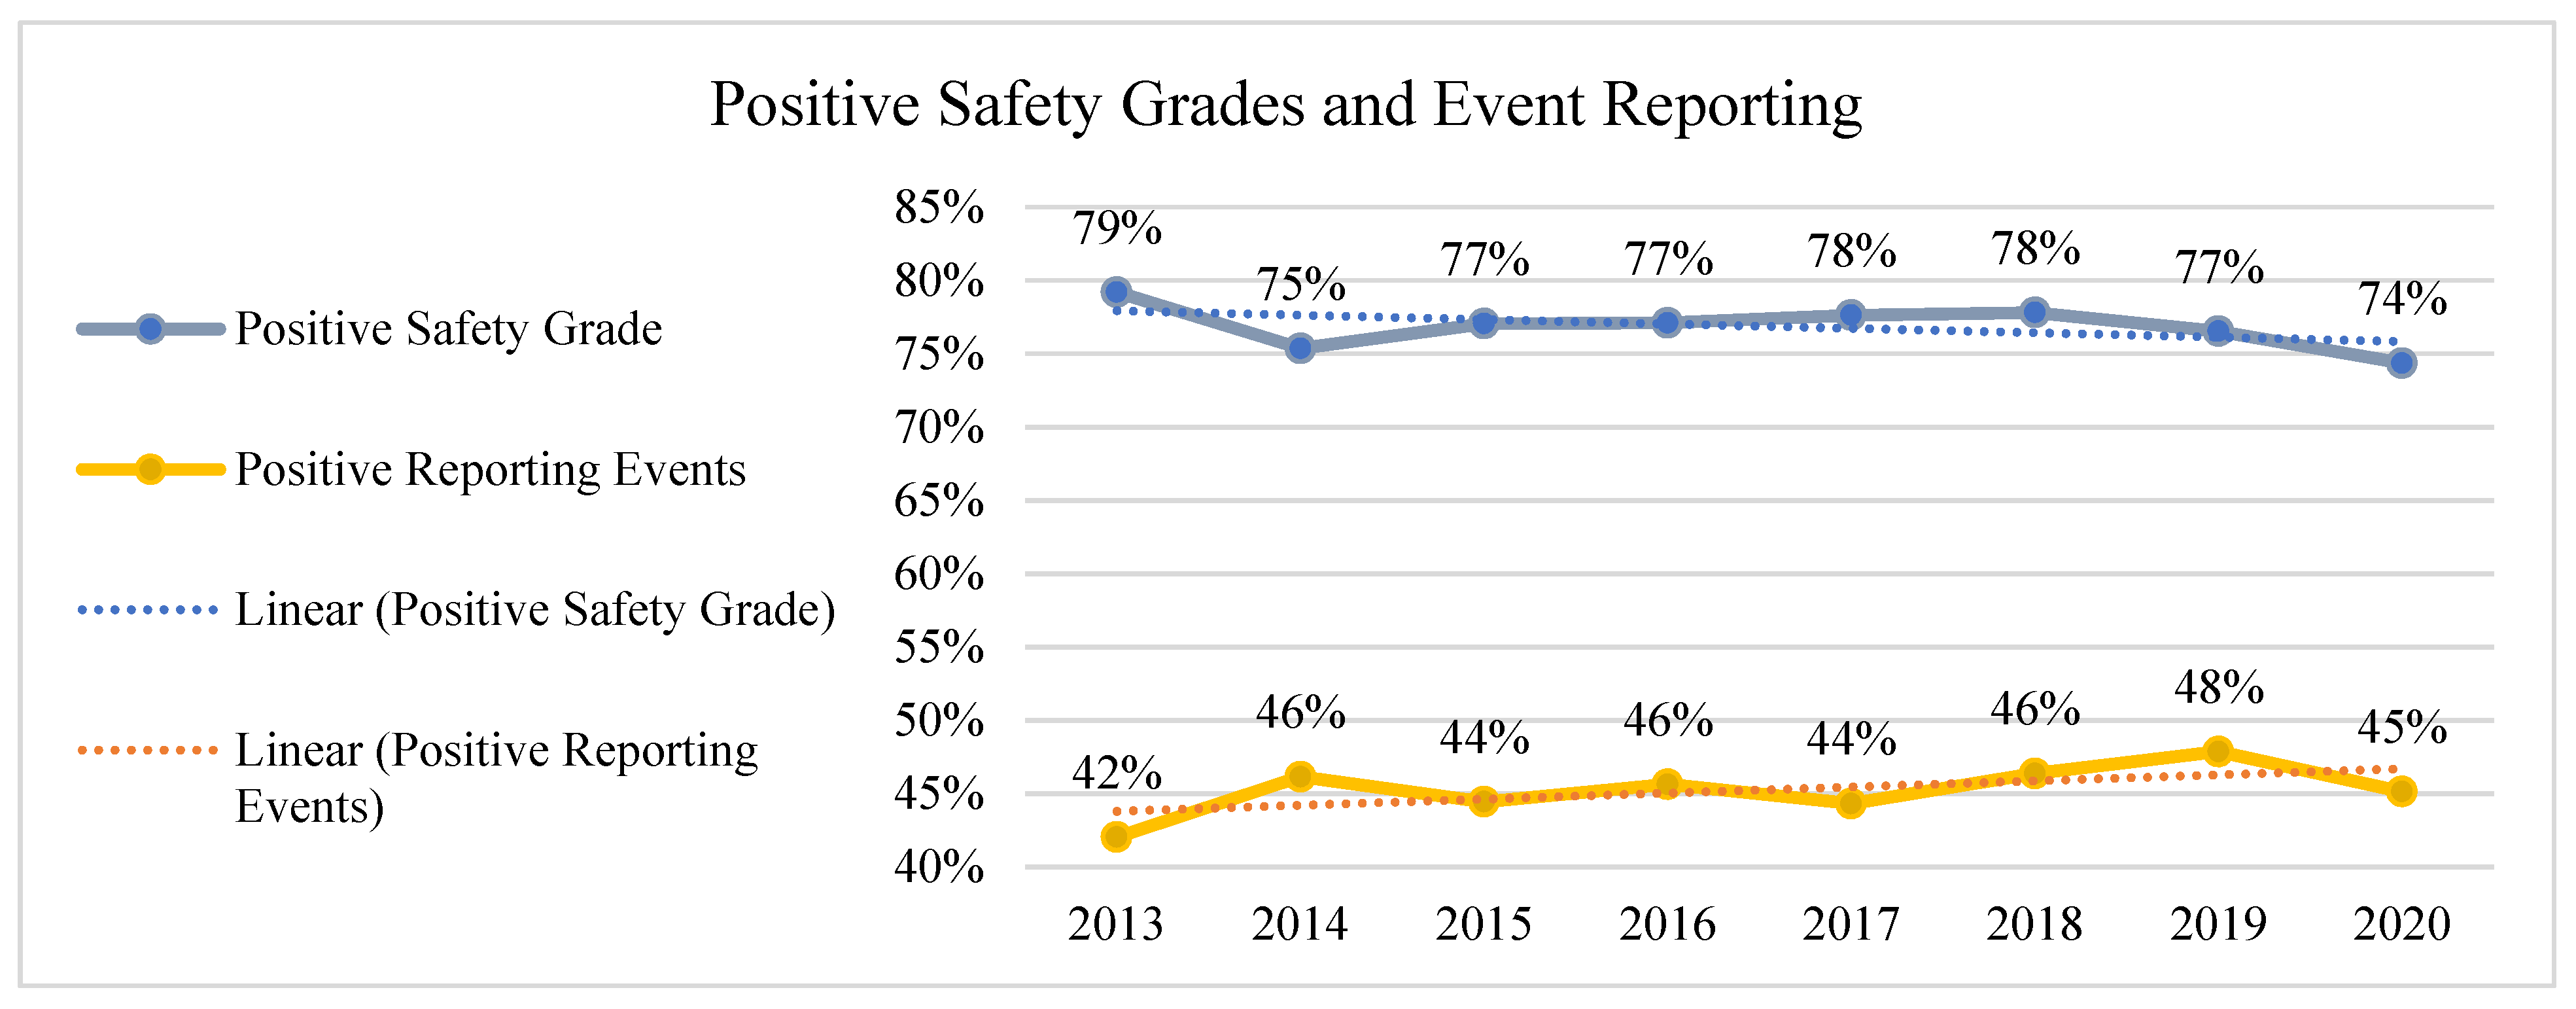
Fluctuations and increases are observed in positive event reporting (42–48%, avg. 45%). However, a decrease in worker perception of their work area over time can be recognized from positive safety grades (74–79%, avg. 77%) from 2013 to 2020, as shown in Figure 8. This indicates varying trends in reporting practices and workers’ perceptions of safety within their work units or departments over time.
The results revealed significant regional variations in U.S. healthcare PSC over the years, as shown in Table S1, Supplementary Materials. The South, followed by the Central region, consistently achieved significantly higher scores than other regions, with the highest scores observed in D5 (Teamwork within Units), D3 (Supervisor/Manager Expectations), and D4 (Organizational Learning), averaging between 75% and 83%. In contrast, the Northeast and West reported lower scores, particularly in D8 (Nonpunitive Response to Error) and D12 (Handoffs and Transitions), averaging between 42% and 45%. Overall, regional and dimensional differences were statistically significant (p < 0.001).
Over the years, PSC analysis highlighted trends across hospitals of varying sizes and types. In smaller hospitals (6–49 beds), D5 (Teamwork within Units) and D3 (Supervisor/Manager Expectations) remained consistently high (84–86%), while D8 (Nonpunitive Response to Error) and D12 (Handoffs and Transitions) showed lower scores, averaging 52% and 57%, respectively. D4 (Organizational Learning) remained relatively strong, above 74%. The scores exhibit greater variability in medium-sized hospitals (50–199 beds). D3 and D5 remained relatively stable (80–82%), while D8 and D12 continued to show lower scores (44–51%). Additionally, D5 and D10 (Management Support for Patient Safety) experienced a slight downward trend in recent years. Regarding hospital type, non-teaching hospitals consistently achieved significantly higher scores than teaching hospitals, which exhibited more variability and a decline in recent years (Table S1, Supplementary Materials).

3.4. Areas of Strength and Weakness in PSC over Time

The dimensions reflecting areas of strength (≥75%) and weakness (<50%) over time are illustrated in Figure 9. Most dimensions fall within the neutral range, representing scores greater than 50% but less than 75%. Some dimensions exceeded the 75% threshold, indicating areas of strength that contribute to enhancing patient safety culture, such as D3 and D5. In 2013, dimension D10 was considered a strength, but it shifted to the neutral zone in the subsequent years. The dimensions representing weaknesses in patient safety culture over time are D12 and D8. While D8 surpassed the 50% threshold in 2018, it declined again in the following years.

3.5. Tracking Trends in Patient Safety Culture Across U.S. Hospitals

Many hospitals demonstrated their commitment to regularly conducting the hospital survey to monitor and evaluate changes in patient safety over time. While the previous analysis reflects the overall results for all participating hospitals, whether they participated once or multiple times, some hospitals conducted the survey repeatedly, enabling comparisons across different time periods. An analysis of the data revealed that 331 hospitals submitted survey results twice, and 78 hospitals submitted results three times between 2013 and 2020. These findings provide valuable insights into how dimensions of PSC evolved over time, highlighting improvements of at least five percentage points in key areas, as well as instances of stagnation or decline. The analysis of PSC trends in these hospitals is summarized in Table 5.
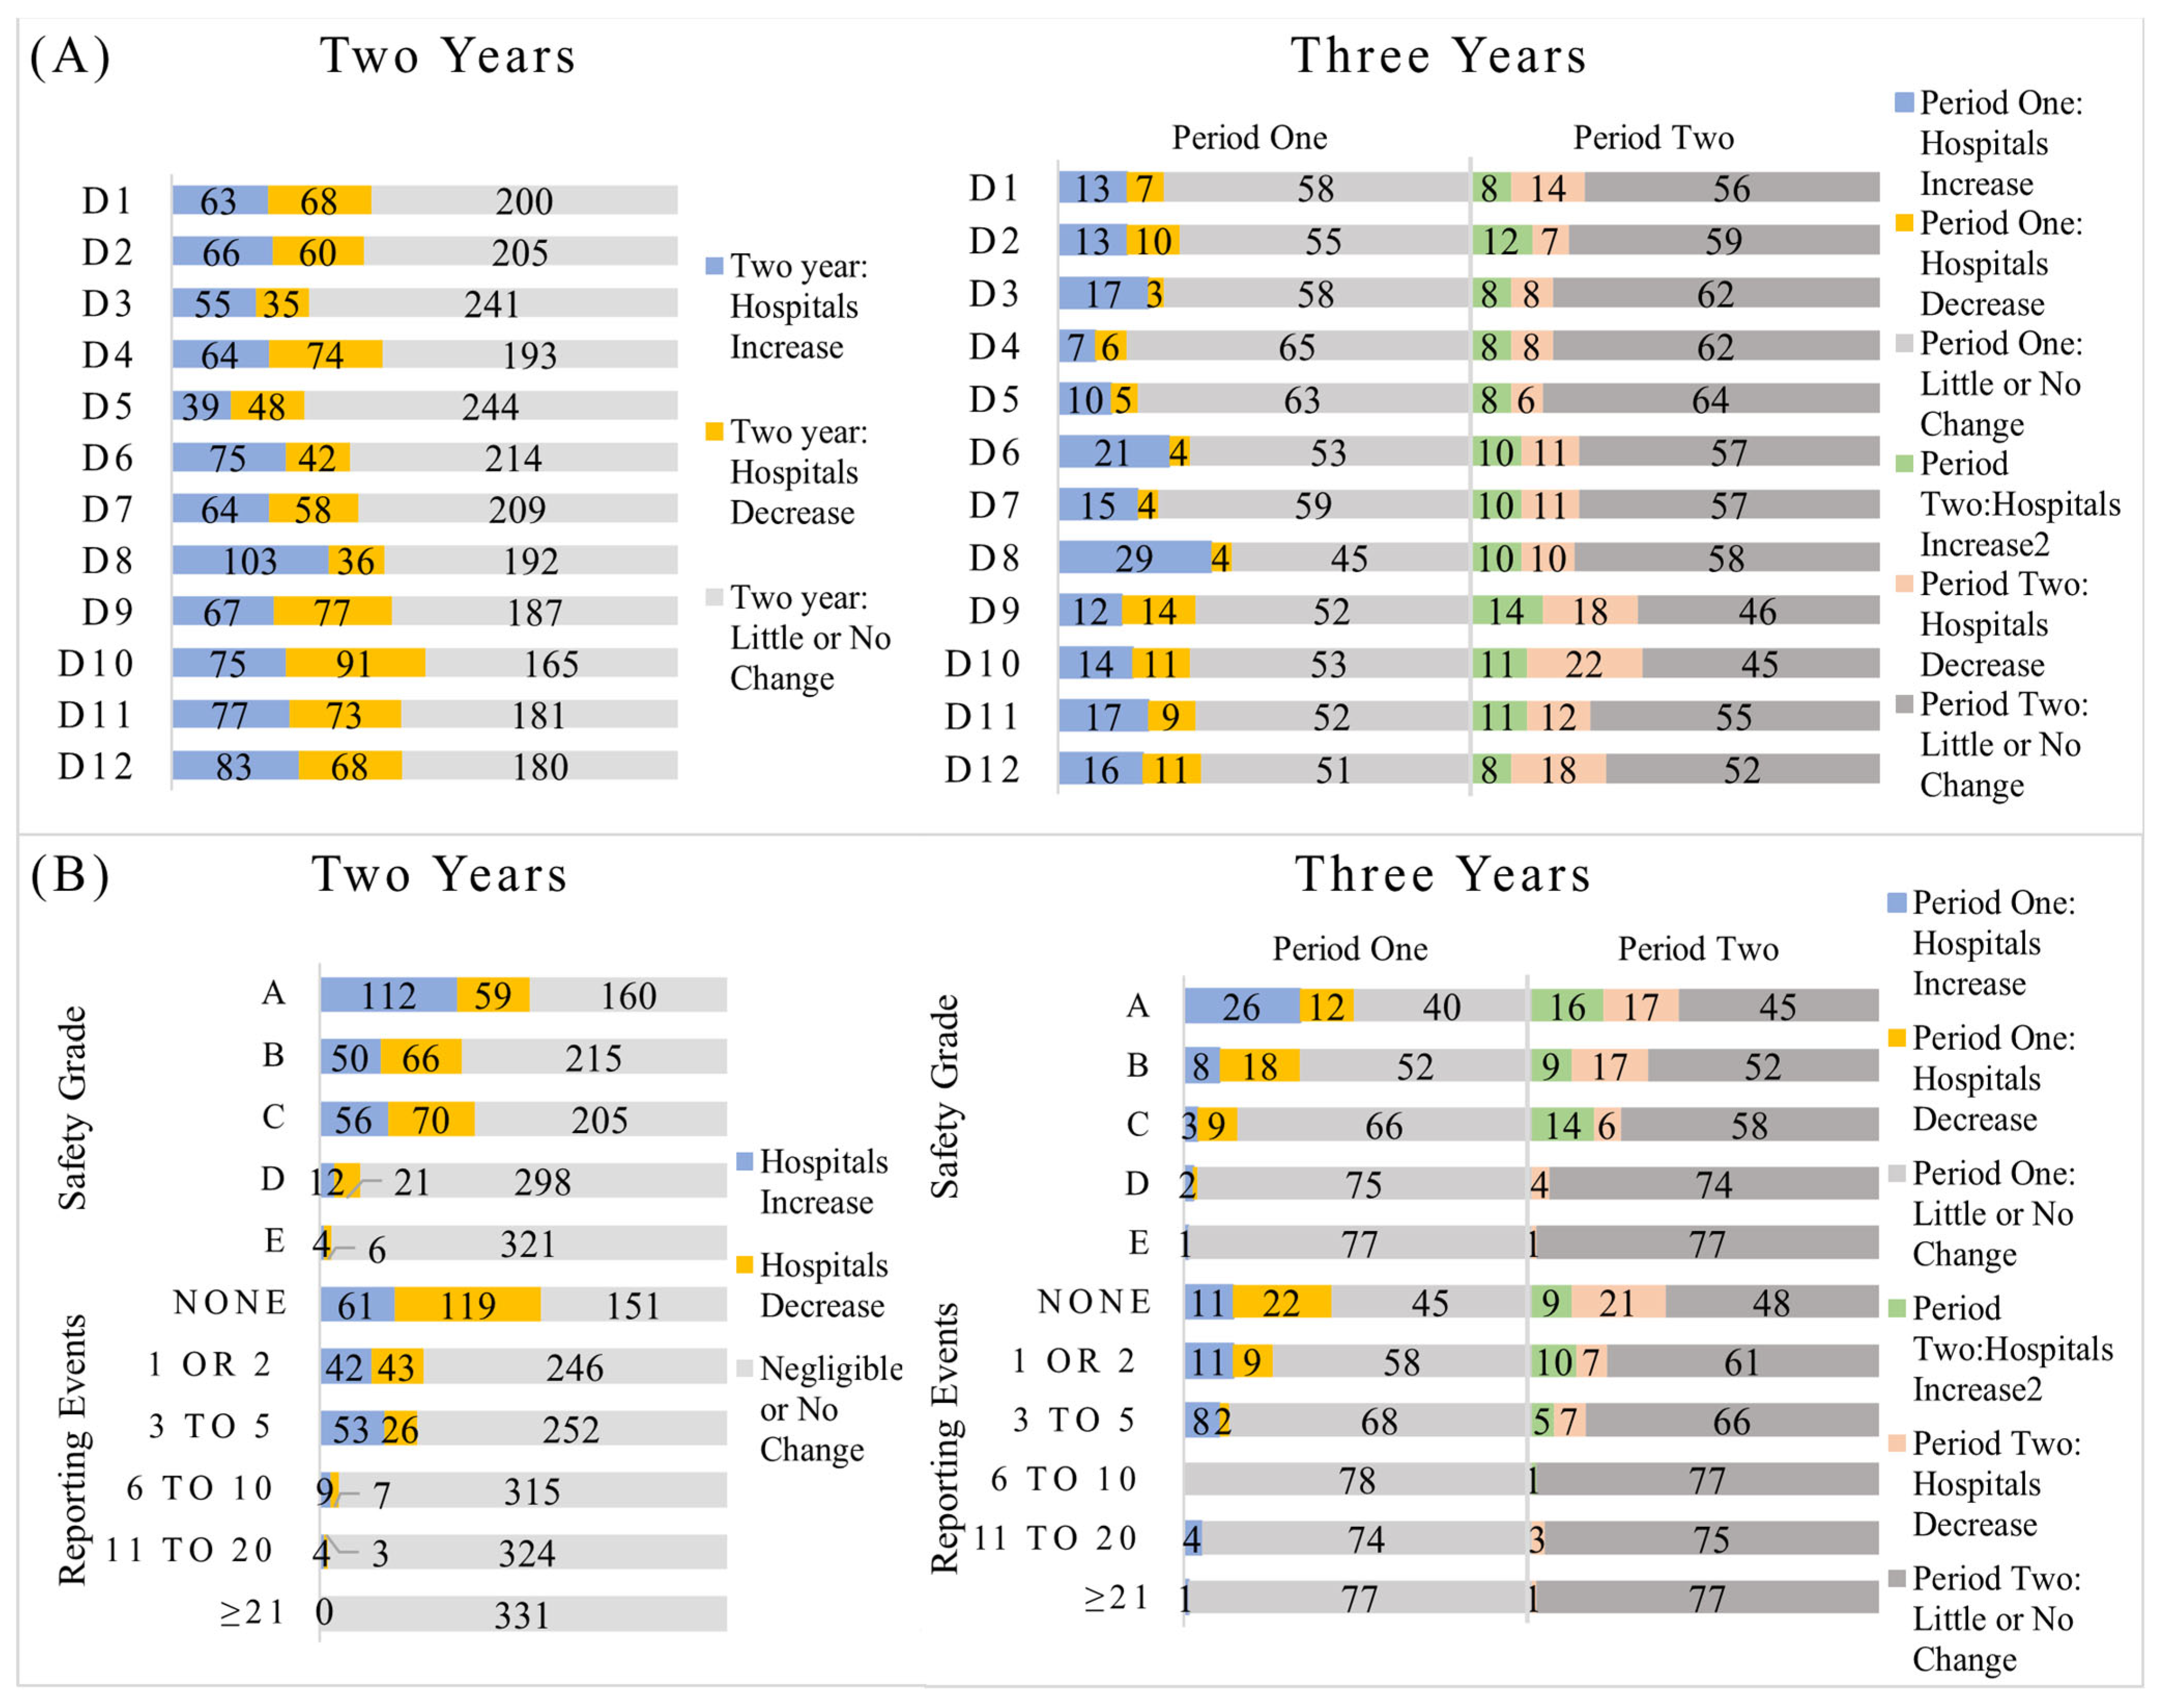
Figure 10 shows the number of hospitals that improved by 5%, declined, or showed no change or similarly small changes in PSC dimensions in part A, overall safety grades, and event reporting rates, as shown in part B. Based on Table 5 and Figure 10, most hospitals showed no changes in PSC dimensions, safety grades, or event reporting, with variations of approximately ±5% compared to previous survey results. This suggests a degree of stability in these measures across hospitals. However, some hospitals exhibited notable improvements, particularly in dimensions D2, D3, D6, D7, D8, D11, and D12. The “Excellent” safety grade category recorded the most significant increase, reflecting a higher number of hospitals achieving this rating. Conversely, the percentage of hospitals reporting no events decreased, while those reporting three to five events experienced a slight improvement. This change suggests that hospitals reported more events within this range, which may reflect changes in event reporting practices.

4. Discussion

Healthcare systems worldwide face the challenge of improving PSC [15]. Assessing PSC helps identify safety strengths, weaknesses, and areas for improvement within organizations [8,16,17], fostering supportive environments for staff to implement safety measures effectively [18,19]. This study analyzed trends in PSC within U.S. hospitals from 2013 to 2020, using participant data from the HSOPSC 1.0 survey, which was developed and managed by the AHRQ. The longitudinal analysis presented the development of PSC over time, revealing persistent strengths, concerning declines, and the influence of various hospital characteristics on the results of the PSC survey.
Regarding survey processing, the overall survey distribution and response numbers remained relatively stable across participating hospitals, but the likelihood of hospital staff responding to surveys improved significantly over time. This could indicate a growing interest in PSC or improvements in survey engagement processes at U.S. hospitals. Additionally, this study showed that the overall perception of healthcare workers regarding PSC was moderate throughout this study’s timeframe, ranging from 64.2% to 66.5%, with an average score of approximately 65%. This indicates that while some improvements were observed, there is still a need for continued efforts to enhance safety culture across U.S. hospitals.
When analyzing the dimensions of safety culture, clear sustainable strengths were noted in areas such as “Supervisor/Manager Expectations and Actions Promoting Patient Safety” and “Teamwork within Units”, with “Organizational Learning” approaching classification as an area of strength. These dimensions demonstrated good perception, indicating that they are key areas that can be built upon to further enhance safety culture. Strong scores in Organizational Learning reflect a commitment to learning from mistakes and improving practices [20]. Meanwhile, effective collaboration improves communication and decision-making, contributing to better patient safety outcomes [21,22]. On the other hand, other dimensions, such as “Nonpunitive Response to Error” and “Handoffs and Transitions”, consistently showed noticeable weaknesses, requiring urgent interventions. These areas fall short of the Institute of Medicine’s recommendations to foster a strong, blame-free culture that learns from mistakes to prevent harm [1].
The participating U.S. hospitals generally exhibit stronger perceptions of PSC dimensions compared to hospitals from other continents [23]. However, comparable strengths and weaknesses in PSC are also evident, particularly in some dimensions, both globally [23] and locally [24]. Specifically, they demonstrate strengths in supervisor and manager support for patient safety and teamwork within units, while showing weaknesses in fostering a blame-free environment and ensuring effective handoffs and transitions.
The fear of reporting errors significantly hinders open communication and prevents proactive safety improvements [25,26]. Critically, insufficient staffing compromises patient care quality and safety by increasing the likelihood of errors [27,28,29]. A notable connection has been observed between both professional and personal burnout and an increased risk of patient safety issues and medical errors, as well as diminished perceptions of safety culture. A previous study found that the slow development of PSC is primarily due to challenges related to organizational structure, leadership, and teamwork [30]. Cultivating a “Just Culture” that prioritizes learning over blame, alongside addressing staffing shortages, is essential for enhancing PSC and improving patient outcomes [25,31].
Regarding hospital characteristics, hospitals in the southern and central U.S. regions consistently showed higher perceptions of PSC than those in other regions. Smaller-sized hospitals exhibited more positive perceptions compared to larger hospitals, and non-teaching hospitals demonstrated higher scores in PSC dimensions than teaching hospitals. These findings could be supported by the correlations between hospital characteristics and the identified PSC dimensions [32].
The results over the years showed that 2013 had the highest overall PSC scores and the highest ratings for workers’ grades within their work units. This may be attributed to the relatively low number of participating hospitals that year, with two-thirds being small, non-teaching hospitals located in central regions. Two distinct trends emerged over time. First, there was a positive trend in overall PSC scores from 2014 to 2017, accompanied by an increase in positive safety grade perceptions that extended into 2018. However, this was followed by a downward trend in subsequent years. The decline in hospital participation in 2020 may be attributed to the adoption of the latest HSOPSC (version 2.0), which was released in 2019 [33]. Additionally, the drop in PSC scores could be influenced by the impact of the COVID-19 pandemic [34]. The global effects of COVID-19 on patient safety were widely anticipated, prompting the development of frameworks and initiatives aimed at improving healthcare quality and patient safety [35,36].
Interestingly, while event reporting is generally considered a positive indicator of PSC [9], this study observed that reporting rates tended to move in the opposite direction of safety grades and overall PSC scores over time. Given these findings, further research is strongly recommended to explore the underlying dynamics between these factors and their implications for strengthening PSC.
The results of tracking changes in PSC across participating hospitals revealed that, although many PSC dimensions showed statistically significant changes over time, not all reflected meaningful shifts. Guided by the HSOPSC manual [9], this analysis determined changes greater than 5%, which are considered practically significant and more indicative of real progress or decline in the dimensions of PSC. The 5% threshold was adopted because it reflects a meaningful and practical change, helping this study distinguish hospitals that showed actual improvement or deterioration in safety culture over time. While the overall perception of PSC remained moderate—ranging from 64.2% to 66.5%, with an average of approximately 65%—some hospitals with repeated participation demonstrated noticeable improvement in specific areas.
Key enhancements were seen in dimensions related to communication and feedback (such as Communication Openness, Feedback and Communication About Error, and Nonpunitive Response to Error), leadership and management support (including Supervisor/Manager Expectations and Actions Promoting Patient Safety and Management Support for Patient Safety), and teamwork (such as Teamwork Within Units, Teamwork Across Units, and Handoffs and Transitions). Additionally, the proportion of participating hospitals reporting “Excellent” safety grades increased, signaling advancements in safety perceptions and practices.
Event reporting trends also pointed to a shift toward more frequent and transparent reporting, with more hospitals documenting 3 to 5 events annually. This may reflect stronger engagement in safety practices and growing openness in reporting. However, the majority of participating hospitals experienced either no change or shifts below the 5% threshold. Variability in safety grade distribution and event reporting further emphasizes the ongoing need to strengthen institutional support and cultivate a culture focused on continuous learning and improvement in patient safety.
The overall pattern of this study’s findings is consistent with some studies that have reported fluctuations in PSC dimensions, event reporting, and employees’ perceptions of safety in their work areas [37,38].

5. Conclusions

In conclusion, this study underscores the ongoing challenges and opportunities in improving patient safety culture in U.S. hospitals. This study highlights the challenges of improving the culture of PSC and, more importantly, the difficulty of maintaining it consistently positive over time. While strengths such as teamwork within units and supervisor expectations are evident, critical issues in areas such as inadequate staffing, declining management support, and weaknesses in nonpunitive error reporting and care transitions demand urgent attention. Targeted interventions must prioritize adequate staffing, more substantial management commitment, nonpunitive error-reporting systems, and improved handoff protocols through interprofessional training. Ongoing trend tracking and root cause research are essential for developing solutions and ensuring a safe, resilient healthcare environment for patients and staff.

6. Strengths, Limitations, and Future Research Directions

The strength of this study lies in its comprehensive analysis of PSC through multiple metrics, incorporating diverse perspectives, including both positive and negative perceptions. This study also contributed to identifying areas of strength and weakness in PSC both annually and over the long term. However, this study has several limitations, including the use of HSOPSC 1.0, reliance on self-reported data, voluntary participation, and a cross-sectional design. The concentration of participating hospitals, along with the exclusion of sites that did not authorize data inclusion may affect the national representativeness of the findings. Since the hospitals in this study voluntarily participated in the HSOPSC survey, the sample may not fully reflect the diversity of U.S. hospitals. The American Hospital Association reports that the total number of U.S. hospitals ranged from 5724 in 2013 to 6146 in 2020 [39], indicating that the generalizability of the findings may be limited. Additionally, the use of former data does not capture the current state of PSC in U.S. hospitals, and the data focus on the overall number of reported events rather than the types or levels of harm caused by incidents. In future work, it is strongly recommended that the underlying correlations between overall PSC scores, safety grades, and reporting events over time be explored, as well as their implications for strengthening patient safety culture.

Supplementary Materials

The following supporting information can be downloaded at: https://www.mdpi.com/article/10.3390/app15105365/s1. Table S1: Classifications of results based on hospital characteristics over the years. Figure S1: Boxplots showing yearly changes in APR% for each of 12 patient safety culture dimensions.

Author Contributions

H.A. contributed to the conceptualization, formal analysis, methodology, and original draft writing, including subsequent editing and revisions. W.K. was responsible for review, editing, and supervision. All authors have read and agreed to the published version of the manuscript.

Funding

The article processing charges were covered by the UCF College of Engineering and Computer Science.

Institutional Review Board Statement

Not applicable.

Informed Consent Statement

Not applicable. The data used in this study were secondary and de-identified, collected and processed by the Agency for Healthcare Research and Quality (AHRQ). All data cleaning and preparation were performed by the agency prior to release. The study was determined to be exempt from IRB review, and a waiver was obtained.

Data Availability Statement

The data used in this study were obtained from a third party, the Agency for Healthcare Research and Quality, and are subject to the restrictions outlined in the confidentiality agreement for data requesters. Requests for access to these datasets should be directed to the SOPS Research Databases at SOPSResearchData@westat.com.

Acknowledgments

The SOPS® data used in this analysis were provided by the SOPS Database. The SOPS Database was funded by the U.S. Agency for Healthcare Research and Quality (AHRQ) and is administered by Westat under Contract No. GS-00F-009DA/75Q80123F80005.

Conflicts of Interest

The authors declare that the research was conducted in the absence of any commercial or financial relationships that could be construed as a potential conflict of interest.

Abbreviations

The following abbreviations are used in this manuscript:
AHRQAgency for Healthcare Research and Quality
ANegR%Average Negative Response Percentage
ANeuR%Average neutral response percentage
ANOVAAnalysis of variance
APR%Average positive response percentage
DeptsDepartments
D1Overall Perceptions of Patient Safety
D2Frequency of Events Reported
D3Supervisor/Manager Expectations and Actions Promoting Patient Safety
D4Organizational Learning
D5Teamwork within Units
D6Communication Openness
D7Feedback and Communication about Error
D8Nonpunitive Response to Error
D9Staffing
D10Management Support for Patient Safety
D11Teamwork across Units
D12Handoffs and Transitions
HSOPSC 1.0Hospital Survey on Patient Safety Culture version 1.0
IOMInstitute of Medicine
LVNLicensed Vocational Nurse
LPNLicensed Practical Nurse
Safety Grade AExcellent
Safety Grade BVery good
Safety Grade CAcceptable
Safety Grade DPoor
Safety Grade EFailing
SASStatistical Analysis System
SDStandard deviation
PSCPatient Safety Culture

References

  1. Institute of Medicine. To Err Is Human: Building a Safer Health System; National Academies Press: Washington, DC, USA, 2000; p. 9728. [Google Scholar] [CrossRef]
  2. World Health Organization. The Conceptual Framework for the International Classification for Patient Safety. Available online: https://www.who.int/publications/i/item/WHO-IER-PSP-2010.2 (accessed on 25 April 2024).
  3. Health and Safety Commission Advisory Committee. Organizing for Safety; Third Report of the ACSNI (Advisory Committee on the Safety of Nuclear Installations) Study Group on Human Factors; HSE Books: Sudbury, UK, 1993. [Google Scholar]
  4. Runciman, W.; Hibbert, P.; Thomson, R.; Van Der Schaaf, T.; Sherman, H.; Lewalle, P. Towards an International Classification for Patient Safety: Key concepts and terms. Int. J. Qual. Health Care 2009, 21, 18–26. [Google Scholar] [CrossRef] [PubMed]
  5. Lee, S.E.; Scott, L.D.; Dahinten, V.S.; Vincent, C.; Lopez, K.D.; Park, C.G. Safety Culture, Patient Safety, and Quality of Care Outcomes: A Literature Review. West J. Nurs. Res. 2019, 41, 279–304. [Google Scholar] [CrossRef]
  6. Mosadeghrad, A.M. Healthcare service quality: Towards a broad definition. Int. J. Health Care Qual. Assur. 2013, 26, 203–219. [Google Scholar] [CrossRef]
  7. Bartonickova, D.; Kalankova, D.; Ziakova, K. How to Measure Patient Safety Culture? A Literature Review of Instruments. Acta Medica Martiniana 2021, 21, 69–79. [Google Scholar] [CrossRef]
  8. Sorra, J.; Nieva, V.F. Hospital Survey on Patient Safety Culture; Agency for Healthcare Research and Quality: Rockville, MD, USA, 2004. [Google Scholar]
  9. Sorra, J.; Gray, L.; Streagle, S.; Famolaro, T.; Yount, N.; Behm, J. AHRQ Hospital Survey on Patient Safety Culture: User’s Guide; Agency for Healthcare Research and Quality: Rockville, MD, USA, 2016. [Google Scholar]
  10. Agency for Healthcare Research and Quality. Hospital Survey on Patient Safety Culture. Available online: https://www.ahrq.gov/sops/surveys/index.html (accessed on 22 December 2024).
  11. SAS Institute Inc. SAS Programming Tips: A Guide to Efficient SAS Processing; SAS Institute Inc.: Cary, NC, USA, 1990. [Google Scholar]
  12. George, D.; Mallery, P. IBM SPSS Statistics 26 Step by Step: A Simple Guide and Reference, 6th ed.; Routledge: London, UK, 2019. [Google Scholar] [CrossRef]
  13. American Hospital Association. American Hospital Association Regions. 2020. Available online: https://trustees.aha.org/system/files/media/file/2020/12/American%20Hospital%20Association%20Regions.pdf (accessed on 22 December 2024).
  14. American Hospital Association. American Hospital Association Regions. Available online: https://www.aha.org/about/leadership/regional-execs (accessed on 5 November 2024).
  15. Longo, D.R.; Hewett, J.E.; Ge, B.; Schubert, S. The Long Road to Patient Safety: A Status Report on Patient Safety Systems. JAMA 2005, 294, 2858–2865. [Google Scholar] [CrossRef]
  16. Gershon, R.R.M.; Karkashian, C.D.; Grosch, J.W.; Murphy, L.R.; Escamilla-Cejudo, A.; Flanagan, P.A.; Bernacki, E.; Kasting, C.; Martin, L. Hospital safety climate and its relationship with safe work practices and workplace exposure incidents. Am. J. Infect. Control 2000, 28, 211–221. [Google Scholar] [CrossRef] [PubMed]
  17. Scott, T.; Mannion, R.; Marshall, M.; Davies, H. Does organisational culture influence health care performance? A review of the evidence. J. Health Serv. Res. Policy 2003, 8, 105–117. [Google Scholar] [CrossRef] [PubMed]
  18. Gottlieb, L.N.; Gottlieb, B.; Bitzas, V. Creating Empowering Conditions for Nurses with Workplace Autonomy and Agency: How Healthcare Leaders Could Be Guided by Strengths-Based Nursing and Healthcare Leadership (SBNH-L). J. Healthc. Leadersh. 2021, 13, 169–181. [Google Scholar] [CrossRef]
  19. Johnson, M.O. The Shifting Landscape of Health Care: Toward a Model of Health Care Empowerment. Am. J. Public Health 2011, 101, 265–270. [Google Scholar] [CrossRef]
  20. De Long, D.W.; Fahey, L. Diagnosing cultural barriers to knowledge management. Acad. Manag. Perspect. 2000, 14, 113–127. [Google Scholar] [CrossRef]
  21. O’Daniel, M.; Rosenstein, A. Professional Communication and Team Collaboration. In Patient Safety and Quality: An Evidence-Based Handbook for Nurses; Hughes, R.G., Ed.; Agency for Healthcare Research and Quality (US): Rockville, MD, USA, 2008; Chapter 33. Available online: https://www.ncbi.nlm.nih.gov/books/NBK2637/ (accessed on 17 May 2023).
  22. Rosen, M.A.; DiazGranados, D.; Dietz, A.S.; Benishek, L.E.; Thompson, D.; Pronovost, P.J.; Weaver, S.J. Teamwork in healthcare: Key discoveries enabling safer, high-quality care. Am. Psychol. 2018, 73, 433–450. [Google Scholar] [CrossRef] [PubMed]
  23. Alabdullah, H.; Karwowski, W. Patient Safety Culture in Hospital Settings Across Continents: A Systematic Review. Appl. Sci. 2024, 14, 8496. [Google Scholar] [CrossRef]
  24. Chilukuri, G.; Westerman, S.T. Healthcare Workers’ Perceptions of Patient Safety Culture in United States Hospitals: A Systematic Review and Meta-Analysis. Int. J. Med. Stud. 2024, 12, 422–436. [Google Scholar] [CrossRef]
  25. Marx, D. Patient Safety and the ‘Just Culture’: A Primer for Health Care Executives; Lung and Blood Institute: Bethesda, MD, USA, 2001; Report for Columbia University Under a Grant Provided by the National Heart. [Google Scholar]
  26. Sorra, J.; Nieva, V.; Fastman, B.R.; Kaplan, H.; Schreiber, G.; King, M. Staff attitudes about event reporting and patient safety culture in hospital transfusion services. Transfusion 2008, 48, 1934–1942. [Google Scholar] [CrossRef]
  27. Khater, W.A.; Akhu-Zaheya, L.M.; AL-Mahasneh, S.I.; Khater, R. Nurses’ perceptions of patient safety culture in J ordanian hospitals. Int. Nurs. Rev. 2015, 62, 82–91. [Google Scholar] [CrossRef]
  28. Lasater, K.B.; Aiken, L.H.; Sloane, D.M.; French, R.; Martin, B.; Reneau, K.; Alexander, M.; McHugh, M.D. Chronic hospital nurse understaffing meets COVID-19: An observational study. BMJ Qual. Saf. 2021, 30, 639–647. [Google Scholar] [CrossRef]
  29. You, L.-M.; Aiken, L.H.; Sloane, D.M.; Liu, K.; He, G.-P.; Hu, Y.; Jiang, X.-L.; Li, X.-H.; Li, X.-M.; Liu, H.-P.; et al. Hospital nursing, care quality, and patient satisfaction: Cross-sectional surveys of nurses and patients in hospitals in China and Europe. Int. J. Nurs. Stud. 2013, 50, 154–161. [Google Scholar] [CrossRef] [PubMed]
  30. Farokhzadian, J.; Nayeri, N.D.; Borhani, F. The long way ahead to achieve an effective patient safety culture: Challenges perceived by nurses. BMC Health Serv. Res. 2018, 18, 654. [Google Scholar] [CrossRef] [PubMed]
  31. Copeland, D. Targeting the Fear of Safety Reporting on a Unit Level. JONA J. Nurs. Adm. 2019, 49, 121–124. [Google Scholar] [CrossRef]
  32. Azyabi, A.; Karwowski, W.; Hancock, P.; Wan, T.T.H.; Elshennawy, A. Assessing Patient Safety Culture in United States Hospitals. Int. J. Environ. Res. Public Health 2022, 19, 2353. [Google Scholar] [CrossRef]
  33. Agency for Healthcare Research and Quality, Rockville, MD, USA. Hospital Survey Version 2.0: Background and Information for Translators. Available online: https://www.ahrq.gov/sops/international/hospital/translators-version-2.html (accessed on 23 January 2025).
  34. Schulson, L.; Bandini, J.; Bialas, A.; Huilgol, S.; Timmins, G.; Ahluwalia, S.; Gidengil, C. Patient safety and the COVID-19 pandemic: A qualitative study of perspectives of front-line clinicians. BMJ Open Qual. 2024, 13, e002692. [Google Scholar] [CrossRef] [PubMed]
  35. Staines, A.; Amalberti, R.; Berwick, D.M.; Braithwaite, J.; Lachman, P.; Vincent, C.A. COVID-19: Patient safety and quality improvement skills to deploy during the surge. Int. J. Qual. Health Care 2021, 33, mzaa050. [Google Scholar] [CrossRef] [PubMed]
  36. Sterling, R.S.; Berry, S.A.; Herzke, C.A.; Haut, E.R. Patient Safety and Quality Improvement Adaptation During the COVID-19 Pandemic. Am. J. Med. Qual. 2021, 36, 57–59. [Google Scholar] [CrossRef] [PubMed]
  37. Alaska, Y.A.; Alkutbe, R.B. What Do We Know About Patient Safety Culture in Saudi Arabia? A Descriptive Study. J. Patient Saf. 2023, 19, 517–524. [Google Scholar] [CrossRef]
  38. Tereanu, C.; Noll, A. Trends in the Staff’s Perception of Patient Safety Culture in Romanian Hospitals. Curr. Health Sci. J. 2020, 46, 236–243. [Google Scholar] [CrossRef]
  39. American Hospital Association. ARCHIVED: Fast Facts on U.S. Hospitals, 2019. Available online: https://www.aha.org/statistics/2020-01-07-archived-fast-facts-us-hospitals-2019 (accessed on 4 May 2025).
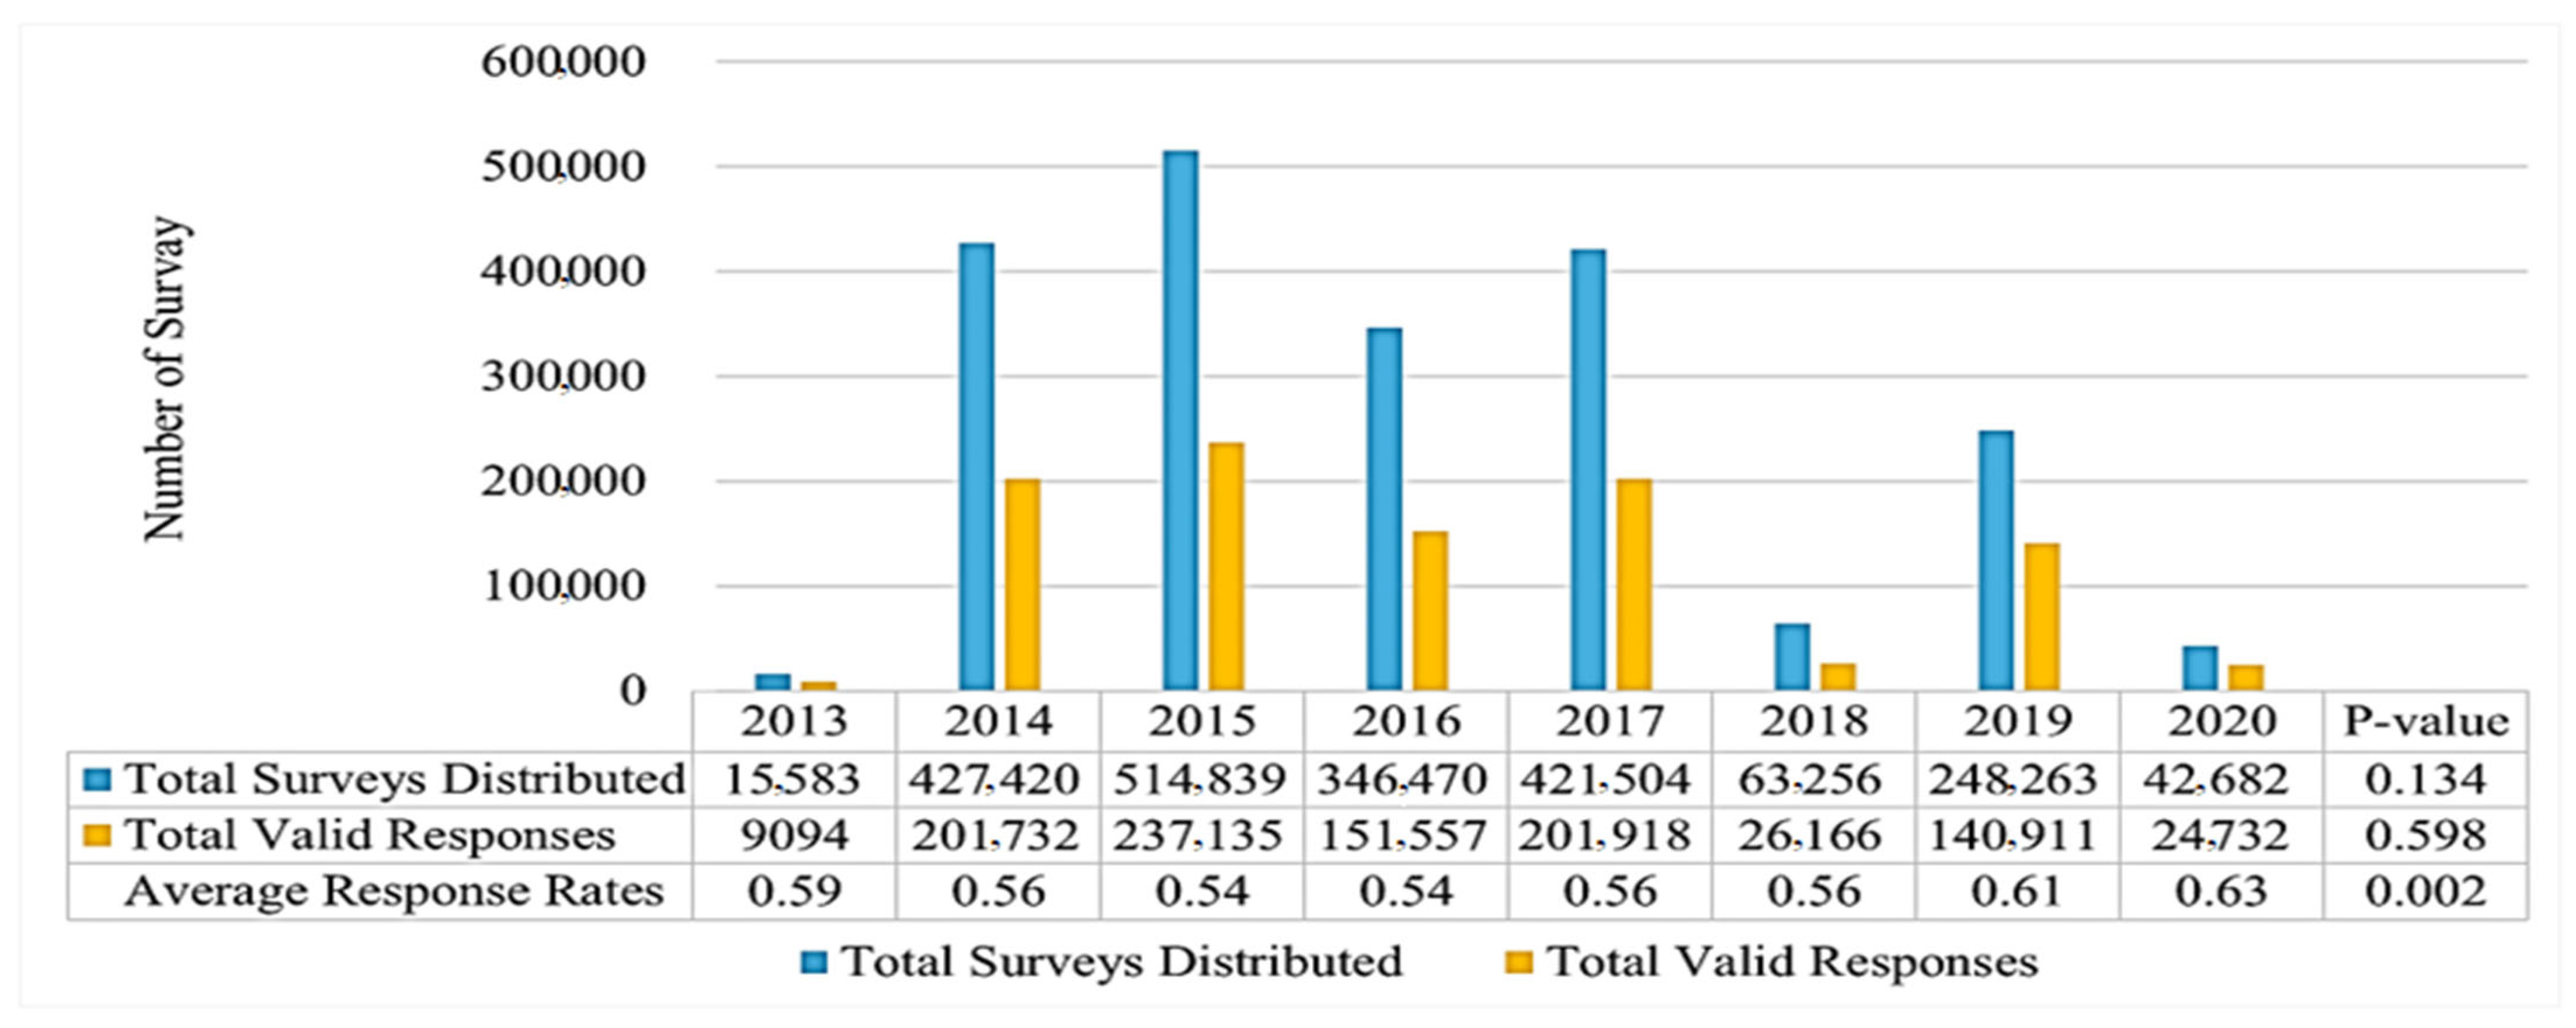
Figure 1. Annual distribution of surveys, valid responses, and response rate. Note: p-values were obtained using ANOVA to compare the means across different years.
Applsci 15 05365 g001
Figure 2. Overall dimension-level average percentage of positive responses across years. * PSC dimensions: D1: Overall Perceptions of Patient Safety; D2: Frequency of Events Reported; D3: Supervisor/Manager Expectations and Actions Promoting Patient Safety; D4: Organizational Learning; D5: Teamwork within Units; D6: Communication Openness; D7: Feedback and Communication about Error; D8: Nonpunitive Response to Error; D9: Staffing; D10: Management Support for Patient Safety; D11: Teamwork across Units; and D12: Handoffs and Transitions.
Applsci 15 05365 g002
Figure 3. The average percentage of responses across years for event reporting and safety grade.
Applsci 15 05365 g003
Figure 4. Trends in APR% across the 12 PSC dimensions over time. Note: the red dotted line represents the threshold for areas of weakness (composite scores < 50%). The green dotted line represents the threshold for areas of strength (composite scores ≥ 75%). PSC dimensions: D1: Overall Perceptions of Patient Safety; D2: Frequency of Events Reported; D3: Supervisor/Manager Expectations and Actions Promoting Patient Safety; D4: Organizational Learning; D5: Teamwork within Units; D6: Communication Openness; D7: Feedback and Communication about Error; D8: Nonpunitive Response to Error; D9: Staffing; D10: Management Support for Patient Safety; D11: Teamwork across Units; and D12: Handoffs and Transitions.
Applsci 15 05365 g004
Figure 5. Trends in the overall PSC scores over time.
Applsci 15 05365 g005
Figure 6. Boxplot analysis of 12 PSC dimensions across years. Note: the red dotted line represents the threshold for areas of weakness (composite scores < 50%). The green dotted line represents the threshold for areas of strength (composite scores ≥ 75%). (O) indicates outlier hospitals; (★) indicates hospitals with extreme deviations beyond the outlier range. PSC dimensions: D1: Overall Perceptions of Patient Safety; D2: Frequency of Events Reported; D3: Supervisor/Manager Expectations and Actions Promoting Patient Safety; D4: Organizational Learning; D5: Teamwork within Units; D6: Communication Openness; D7: Feedback and Communication about Error; D8: Nonpunitive Response to Error; D9: Staffing; D10: Management Support for Patient Safety; D11: Teamwork across Units; and D12: Handoffs and Transitions.
Applsci 15 05365 g006
Figure 7. Yearly changes in safety grade distribution and reported events.
Applsci 15 05365 g007
Figure 8. Trends in positive safety grades and event reporting (2013–2020).
Applsci 15 05365 g008
Figure 9. Area of strength and weakness across PSC dimensions over time. Note: the red dotted line represents the threshold for areas of weakness (composite scores < 50%), while the green dotted line represents the threshold for areas of strength (composite scores ≥ 75%). The symbols highlight dimensions in these areas: () indicates a dimension in the weakness area, and () indicates a dimension in the strength area. PSC dimensions: D1: Overall Perceptions of Patient Safety; D2: Frequency of Events Reported; D3: Supervisor/Manager Expectations and Actions Promoting Patient Safety; D4: Organizational Learning; D5: Teamwork within Units; D6: Communication Openness; D7: Feedback and Communication about Error; sD8: Nonpunitive Response to Error; D9: Staffing; D10: Management Support for Patient Safety; D11: Teamwork across Units; and D12: Handoffs and Transitions.
Applsci 15 05365 g009
Figure 10. The number of hospitals that showed a 5% change in PSC dimensions, safety grade, and reporting events. PSC dimensions: D1: Overall Perceptions of Patient Safety; D2: Frequency of Events Reported; D3: Supervisor/Manager Expectations and Actions Promoting Patient Safety; D4: Organizational Learning; D5: Teamwork within Units; D6: Communication Openness; D7: Feedback and Communication about Error; D8: Nonpunitive Response to Error; D9: Staffing; D10: Management Support for Patient Safety; D11: Teamwork across Units; and D12: Handoffs and Transitions. Safety grades: Grade A indicates excellent, B indicates very good, C indicates acceptable, D indicates poor, and E indicates failing.
Applsci 15 05365 g010
Table 1. Hospital and respondent characteristics.
Hospital
Characteristics
Hospital
Frequency (%)
Participant
Frequency (%)
Respondent
Characteristics
Participant
Frequency (%)
Total1601993,245Worked in the Current Hospital Work Area/Unit(N = 922,422)
RegionLess than 1 year148,756 (16%)
Northeast218 (13%)179,838 (18%)1 to 5 years367,235 (40%)
South490 (31%)338,743 (34%)6 to 10 years173,619 (19%)
Center710 (44%)366,108 (37%)11 to 15 years102,539 (11%)
West183 (12%)108,556 (11%)16 to 20 years58,729 (6%)
Bed Size21 years or more71,544 (8%)
6–49328 (21%)43,007 (4%)Hours per Week(N = 915,770)
50–99271 (17%)67,951 (7%)Less than 20 h per week44,462 (5%)
100–199366 (23%)180,487 (18%)20 to 39 h per week372,840 (41%)
200–299263 (16%)193,429 (20%)40 to 59 h per week438,288 (48%)
300–399145 (9%)139,056 (14%)60 to 79 h per week39,022 (4%)
≥400228 (14%)369,315 (37%)80 to 99 h per week19,076 (2%)
Survey Mode100 h per week or more2082 (<1%)
Paper71 (4%)18,757 (2%)Direct Contact with Patients(N = 942,840)
Web1310 (82%)844,469 (85%)Yes731,042 (78%)
Mixed Mode220 (14%)130,019 (13%)No211,798 (22%)
Hospital TypeStaff Position(N = 934,067)
Non-teaching1015 (63%)420,819 (42%)Registered Nurse331,314 (35%)
Teaching586 (37%)572,426 (58%)Physician Assistant/Nurse Practitioner12,254 (1%)
YearsLVN/LPN8657 (1%)
201312 (1%)9094 (1%)Patient Care Assistant/Hospital Aide/Care Partner59,366 (6%)
2014312 (20%)201,732 (20%)Attending/Staff Physician25,926 (3%)
2015372 (23%)237,135 (24%)Resident/Training Physician11,210 (1%)
2016248 (15%)151,557 (15%)Pharmacist18,152 (2%)
2017339 (21%)201,918 (20%)Dietician5568 (1%)
201846 (3%)26,166 (3%)Unit Assistant/Clerk/Secretary45,916 (5%)
2019243 (15%)140,911 (14%)Respiratory Therapist19,455 (2%)
202029 (2%)24,732 (3%)Physical, Occupational, or Speech Therapist27,747 (2%)
Staff SurveyedTechnician (e.g., Lab, Radiology)102,834 (3%)
All staff/sample of all1480 (92%)913,729 (92%)Administration/Management65,969 (7%)
Selected depts/units58 (4%)31,753 (3%)Other199,699 (21%)
Selected staff positions2 (<1%)3716 (<1%)Worked in Current Specialty or
Profession
(N = 897,411)
Selected depts/units and selected staff positions61 (4%)44,047 (4%)
Respondent
Characteristics
Participant
Frequency (%)
Less than 1 year65,760 (7%)
1 to 5 years240,824 (27%)
Worked in a Hospital(* N = 899,076)6 to 10 years163,133 (18%)
Less than 1 year114,366 (13%)11 to 15 years118,060 (13%)
1 to 5 years302,106 (34%)16 to 20 years97,249 (11%)
6 to 10 years171,946 (19%)21 years or more212,385 (24%)
11 to 15 years115,538 (13%)
16 to 20 years73,194 (8%)
21 years or more121,926 (14%)
* N is the total valid number of respondents out of the total survey participants.
Table 2. Overall APR%, SD, and percentiles for the 12 PSC dimensions.
PSCMeanSDMin10th
%ile
25th
%ile
50th
%ile
75th
%ile
90th
%ile
Max
D166%9%36%56%60%66%72%77%93%
D267%7%40%58%62%67%72%76%94%
D379%6%17%72%76%80%83%87%98%
D472%7%15%63%68%73%77%81%93%
D582%6%26%76%79%82%85%88%99%
D665%7%35%56%61%65%69%73%87%
D769%8%17%59%64%69%74%78%90%
D847%9%20%36%41%46%53%58%87%
D954%9%20%42%47%53%59%66%86%
D1072%9%36%60%66%73%78%83%96%
D1161%10%34%50%55%61%68%74%95%
D1248%11%22%35%40%46%54%62%92%
PSC dimensions: D1: Overall Perceptions of Patient Safety; D2: Frequency of Events Reported; D3: Supervisor/Manager Expectations and Actions Promoting Patient Safety; D4: Organizational Learning; D5: Teamwork within Units; D6: Communication Openness; D7: Feedback and Communication about Error; D8: Nonpunitive Response to Error; D9: Staffing; D10: Management Support for Patient Safety; D11: Teamwork across Units; and D12: Handoffs and Transitions.
Table 3. Analysis of survey responses across dimensions by region, hospital characteristics, and survey method.
CategoryD1D2D3D4D5D6D7D8D9D10D11D12
Region
Northeast62%64%76%68%79%62%63%44%49%68%56%42%
South67%70%81%75%83%66%72%48%54%74%63%50%
Center68%66%80%72%82%65%69%48%56%72%62%49%
West62%66%77%70%82%63%66%43%51%69%60%45%
p-value<0.001<0.001<0.001<0.001<0.001<0.001<0.001<0.001<0.001<0.001<0.001<0.001
Bed Size
6–49 beds72%70%82%74%84%68%70%52%61%77%69%57%
50–99 beds68%68%81%73%83%66%69%49%56%74%63%49%
100–199 beds66%68%79%73%82%65%69%47%53%72%61%47%
200–299 beds63%65%77%70%81%63%67%44%50%68%57%43%
300–399 beds62%65%76%70%80%62%67%42%48%68%57%42%
400 or more beds62%65%77%71%81%63%67%43%49%68%57%44%
p-value<0.001<0.001<0.001<0.001<0.001<0.001<0.001<0.001<0.001<0.001<0.001<0.001
Survey Mode
Paper69%67%81%73%83%65%68%46%59%74%64%52%
Web66%67%79%72%82%65%69%47%53%72%61%47%
Mixed Mode66%67%79%72%81%65%69%47%53%71%62%50%
p-value0.0350.7230.0230.3160.0940.8450.7410.656<.0010.0550.048<.001
Staff Surveyed
All staff/sample66%67%79%72%82%65%69%47%54%72%61%48%
Selected departments/units only67%66%79%73%84%63%66%46%54%71%63%49%
Selected staff positions only59%64%78%69%84%68%66%48%49%61%55%44%
Selected departments/units and selected staff65%67%79%73%83%66%69%49%54%71%60%47%
p-value0.2930.6040.9860.4860.0160.0640.0930.2620.8470.3150.3550.877
Type of Hospital
Non-teaching
hospital
68%68%80%73%83%66%70%48%55%73%63%49%
Teaching hospital64%65%78%71%81%63%67%45%51%70%59%44%
p-value<0.001<0.001<0.001<0.001<0.001<0.001<0.001<0.001<0.001<0.001<0.001<0.001
Note: p-values were obtained using ANOVA to compare the means across different groups. PSC dimensions: D1: Overall Perceptions of Patient Safety; D2: Frequency of Events Reported; D3: Supervisor/Manager Expectations and Actions Promoting Patient Safety; D4: Organizational Learning; D5: Teamwork within Units; D6: Communication Openness; D7: Feedback and Communication about Error; D8: Nonpunitive Response to Error; D9: Staffing; D10: Management Support for Patient Safety; D11: Teamwork across Units; and D12: Handoffs and Transitions.
Table 4. Summary of survey dimensions and response metrics across years.
Dimensions PSCMeasure20132014201520162017201820192020Overall YearsAverage Change% ‡P-V.
D1: Overall Perceptions of Patient SafetyMean (SD)3.76 (0.2)3.67 (0.2)3.68 (0.2)3.68 (0.2)3.70 (0.2)3.71 (0.2)3.69 (0.2)3.63 (0.2)3.68 (0.2)−0.500.391
APR% *7066Applsci 15 05365 i00166 66 67Applsci 15 05365 i00267 66Applsci 15 05365 i00164Applsci 15 05365 i00166−1.250.445
ANeuR%1717 17 18Applsci 15 05365 i00218 Applsci 15 05365 i00217Applsci 15 05365 i00118Applsci 15 05365 i00218 170.890.096
ANegR%1317Applsci 15 05365 i00217 16Applsci 15 05365 i00116 16 17Applsci 15 05365 i00218Applsci 15 05365 i002165.290.012
D2: Frequency of Events ReportedMean (SD)3.85 (0.2)3.86 (0.2)3.89 (0.2)3.88 (0.2)3.89 (0.2)3.85 (0.2)3.94 (0.2)3.91 (0.2)3.89 (0.2)0.23<001
APR%6766Applsci 15 05365 i00167Applsci 15 05365 i00267 67 66Applsci 15 05365 i00169Applsci 15 05365 i00268Applsci 15 05365 i001670.230.004
ANeuR%2122Applsci 15 05365 i00221Applsci 15 05365 i00122Applsci 15 05365 i00222 23Applsci 15 05365 i00221Applsci 15 05365 i00121 220.120.004
ANegR%1212 11Applsci 15 05365 i00111 11 12Applsci 15 05365 i00211Applsci 15 05365 i00112Applsci 15 05365 i002110.220.096
D3: Supervisor/Manager Expectations and Actions Promoting Patient SafetyMean (SD)3.98 (0.1)3.97 (0.2)4.00 (0.2)4.00 (0.2)4.04 (0.2)4.04 (0.1)4.05 (0.2)4.06 (0.1)4.01 (0.2)0.29<001
APR%7978Applsci 15 05365 i00179 Applsci 15 05365 i00279 80Applsci 15 05365 i00280 80 80 790.18<001
ANeuR%1212 11Applsci 15 05365 i00111 11 11 11 11 11−1.190.097
ANegR%910Applsci 15 05365 i00210 10 9Applsci 15 05365 i0019 9 9 100.16<001
D4: Organizational LearningMean (SD)3.84 (0.2)3.81 (0.2)3.83 (0.2)3.81 (0.2)3.83 (0.2)3.80 (0.1)3.82 (0.2)3.81 (0.1)3.82 (0.2)−0.110.379
APR%7472Applsci 15 05365 i00173Applsci 15 05365 i00272Applsci 15 05365 i00172 72 71Applsci 15 05365 i00171 72−0.580.273
ANeuR%1920Applsci 15 05365 i00219Applsci 15 05365 i00120Applsci 15 05365 i00220 20 20 20 200.790.193
ANegR%78Applsci 15 05365 i0028 8 8 8 8 983.830.058
D5: Teamwork within UnitsMean (SD)4.05 (0.1)4.00 (0.2)4.04 (0.2)4.05 (0.2)4.06 (0.2)4.06 (0.1)4.06 (0.1)4.04 (0.1)4.04 (0.2)−0.03<001
APR%8381Applsci 15 05365 i00182Applsci 15 05365 i00282Applsci 15 05365 i00182 83Applsci 15 05365 i00282Applsci 15 05365 i00182 82−0.170.74
ANeuR%89Applsci 15 05365 i0029 9 9 8Applsci 15 05365 i0019Applsci 15 05365 i0029 91.980.035
ANegR%910Applsci 15 05365 i0029Applsci 15 05365 i0019 9 9 9 10Applsci 15 05365 i00291.750.001
D6: Communication OpennessMean (SD)3.70 (0.2)3.72 (0.2)3.75 (0.2)3.76 (0.2)3.79 (0.2)3.79 (0.1)3.81 (0.2)3.81 (0.2)3.77 (0.2)0.42<001
APR%6463Applsci 15 05365 i00164Applsci 15 05365 i00265Applsci 15 05365 i00266Applsci 15 05365 i00266 66 66 650.45<001
ANeuR%2323 22Applsci 15 05365 i00123Applsci 15 05365 i00222Applsci 15 05365 i00122 22 21Applsci 15 05365 i00122−1.24<001
ANegR%1314Applsci 15 05365 i00213Applsci 15 05365 i00113 12Applsci 15 05365 i00112 12 13Applsci 15 05365 i002130.17<001
D7: Feedback and Communication about ErrorMean (SD)3.89 (0.2)3.86 (0.2)3.89 (0.2)3.88 (0.2)3.90 (0.2)3.88 (0.2)3.92 (0.2)3.95 (0.2)3.89 (0.2)0.220.007
APR%6967Applsci 15 05365 i00169Applsci 15 05365 i00268Applsci 15 05365 i00169Applsci 15 05365 i00268Applsci 15 05365 i00169Applsci 15 05365 i00270Applsci 15 05365 i002690.230.115
ANeuR%2222 21Applsci 15 05365 i00122Applsci 15 05365 i00222 22 21Applsci 15 05365 i00120Applsci 15 05365 i00122−1.300.015
ANegR%910Applsci 15 05365 i00210 10 9Applsci 15 05365 i00110Applsci 15 05365 i00210 10 101.750.468
D8: Nonpunitive Response to ErrorMean (SD)3.23 (0.2)3.23 (0.2)3.25 (0.2)3.30 (0.2)3.34 (0.2)3.39 (0.2)3.35 (0.2)3.28 (0.2)3.29 (0.2)0.23<001
APR%4645Applsci 15 05365 i00146Applsci 15 05365 i00247Applsci 15 05365 i00248Applsci 15 05365 i00251Applsci 15 05365 i00249Applsci 15 05365 i00146Applsci 15 05365 i001470.08<001
ANeuR%2727 27 28Applsci 15 05365 i00228 27Applsci 15 05365 i00128 27Applsci 15 05365 i001270.04<001
ANegR%2829Applsci 15 05365 i00228Applsci 15 05365 i00125Applsci 15 05365 i00124Applsci 15 05365 i00122Applsci 15 05365 i00123Applsci 15 05365 i00226Applsci 15 05365 i00226−0.76<001
D9: StaffingMean (SD)3.53 (0.2)3.41 (0.3)3.37 (0.2)3.37 (0.2)3.41 (0.2)3.45 (0.2)3.39 (0.2)3.29 (0.2)3.39 (0.2)−0.990.009
APR%5954Applsci 15 05365 i00153Applsci 15 05365 i00153 54Applsci 15 05365 i00256Applsci 15 05365 i00254Applsci 15 05365 i00150Applsci 15 05365 i00154−2.240.015
ANeuR%2121 21 22Applsci 15 05365 i00222 21Applsci 15 05365 i00121 21 210.03<001
ANegR%2025Applsci 15 05365 i00226Applsci 15 05365 i00226 24Applsci 15 05365 i00123Applsci 15 05365 i00125Applsci 15 05365 i00229Applsci 15 05365 i002255.98<001
D10: Management Support for Patient SafetyMean (SD)3.86 (0.2)3.78 (0.2)3.81 (0.2)3.79 (0.2)3.81 (0.2)3.75 (0.2)3.74 (0.3)3.72 (0.2)3.79 (0.2)−0.520.007
APR%7672Applsci 15 05365 i00173Applsci 15 05365 i00272Applsci 15 05365 i00172 71Applsci 15 05365 i00169Applsci 15 05365 i00169 72−1.35<001
ANeuR%1314Applsci 15 05365 i00213Applsci 15 05365 i00114Applsci 15 05365 i00214 14 15Applsci 15 05365 i00215 142.20<001
ANegR%1114Applsci 15 05365 i00214 14 13Applsci 15 05365 i00215Applsci 15 05365 i00216Applsci 15 05365 i00217Applsci 15 05365 i002146.92<001
D11: Teamwork across UnitsMean (SD)3.60 (0.2)3.56 (0.2)3.58 (0.2)3.59 (0.2)3.59 (0.2)3.55 (0.2)3.58 (0.2)3.53 (0.2)3.58 (0.2)−0.280.369
APR%6461Applsci 15 05365 i00162Applsci 15 05365 i00262 62 60Applsci 15 05365 i00161Applsci 15 05365 i00259Applsci 15 05365 i00161−1.130.566
ANeuR%2122Applsci 15 05365 i00222 22 23Applsci 15 05365 i00223 23 23 221.330.069
ANegR%1617Applsci 15 05365 i00216Applsci 15 05365 i00116 15Applsci 15 05365 i00117Applsci 15 05365 i00216Applsci 15 05365 i00118Applsci 15 05365 i002162.010.014
D12: Handoffs and TransitionsMean (SD)3.37 (0.3)3.33 (0.2)3.33 (0.2)3.34 (0.2)3.35 (0.2)3.29 (0.3)3.35 (0.3)3.28 (0.2)3.34 (0.2)−0.380.567
APR%4947Applsci 15 05365 i00148Applsci 15 05365 i00248 48 45Applsci 15 05365 i00148Applsci 15 05365 i00245Applsci 15 05365 i00148−1.110.747
ANeuR%3031Applsci 15 05365 i00230Applsci 15 05365 i00131Applsci 15 05365 i00231 31 31 30Applsci 15 05365 i001310.030.169
ANegR%2122Applsci 15 05365 i00222 22 21Applsci 15 05365 i00123Applsci 15 05365 i00221Applsci 15 05365 i00124Applsci 15 05365 i002222.190.105
Note: p-values were obtained using ANOVA to compare the means across different groups. *: APR%: average positive response %; ANeuR%: average neutral response %; and ANegR%: average negative response %. ‡: The average change is the calculation of the mean change between annual values over a time period, by computing the yearly changes and then taking their average to represent the overall trend. Applsci 15 05365 i001: The average positive response % decreased compared to the previous year. Applsci 15 05365 i002: The average positive response % increased compared to the previous year. : Average positive response % remains the same compared to the previous year.
Table 5. Changes in patient safety culture trends in hospitals across survey years.
PSCTwo-YearsThree-Years
ChangeSDMax
Increase
Max
Decrease
Period One *Period Two ‡
ChangeSDMax
Increase
Max
Decrease
ChangeSDMax
Increase
Max
Decrease
D10%6%16%−20%1%6%28%−15%0%5%14%−8%
D20%6%23%−23%1%4%14%−10%1%5%13%−12%
D31%6%57%−26%2%5%34%−7%0%4%11%−7%
D4−1%7%15%−39%1%4%18%−13%0%4%11%−8%
D50%4%20%−13%1%3%8%−8%0%3%6%−14%
D61%5%22%−23%2%5%18%−7%0%4%15%−9%
D70%6%16%−40%2%4%10%−15%0%5%13%−9%
D82%6%16%−16%4%5%25%−8%0%5%14%−11%
D9−1%6%18%−21%0%7%23%−26%0%5%14%−11%
D10−1%7%19%−24%0%5%16%−16%−1%5%15%−13%
D110%7%24%−21%1%5%11%−16%0%5%13%−10%
D120%7%27%−19%1%5%13%−15%−1%5%17%−9%
Reporting Events
None−2%8%47%−27%−1%6%25%−16%−1%6%16%−16%
1 or 20%6%21%−30%−1%8%12%−41%1%6%21%−20%
3 to 51%5%22%−20%2%4%20%−6%0%5%8%−23%
6 to 100%2%8%−8%0%2%4%−4%1%2%5%−4%
11 to 200%2%12%−14%1%2%8%−3%0%2%3%−8%
≥210%1%4%−4%0%1%5%−2%0%1%3%−5%
Safety Grade
A:
Excellent
2%8%27%−30%2%6%19%−13%0%6%18%−19%
B:
Very Good
0%7%39%−29%−1%6%15%−24%−1%5%14%−19%
C:
Acceptable
0%6%34%−17%0%4%11%−12%0%4%11%−12%
D:
Poor
0%4%10%−38%0%2%6%−6%0%2%4%−6%
E:
Failing
0%3%8%−29%0%1%5%−2%0%1%1%−5%
*: Period one presents the second-year survey results subtracted from the first-year results. ‡: Period two presents the third-year survey results subtracted from the second-year results. PSC dimensions: D1: Overall Perceptions of Patient Safety; D2: Frequency of Events Reported; D3: Supervisor/Manager Expectations and Actions Promoting Patient Safety; D4: Organizational Learning; D5: Teamwork within Units; D6: Communication Openness; D7: Feedback and Communication about Error; D8: Nonpunitive Response to Error; D9: Staffing; D10: Management Support for Patient Safety; D11: Teamwork across Units; and D12: Handoffs and Transitions.
Disclaimer/Publisher’s Note: The statements, opinions and data contained in all publications are solely those of the individual author(s) and contributor(s) and not of MDPI and/or the editor(s). MDPI and/or the editor(s) disclaim responsibility for any injury to people or property resulting from any ideas, methods, instructions or products referred to in the content.