

Unraveling Patient Safety Culture Trends in U.S. Hospital Settings: A Yearly Retrospective Analysis


Abstract
1. Introduction
2. Methodology
2.1. Study Design and Data Sources
2.2. Instrument for Assessing PSC
2.3. Data Analysis
3. Results
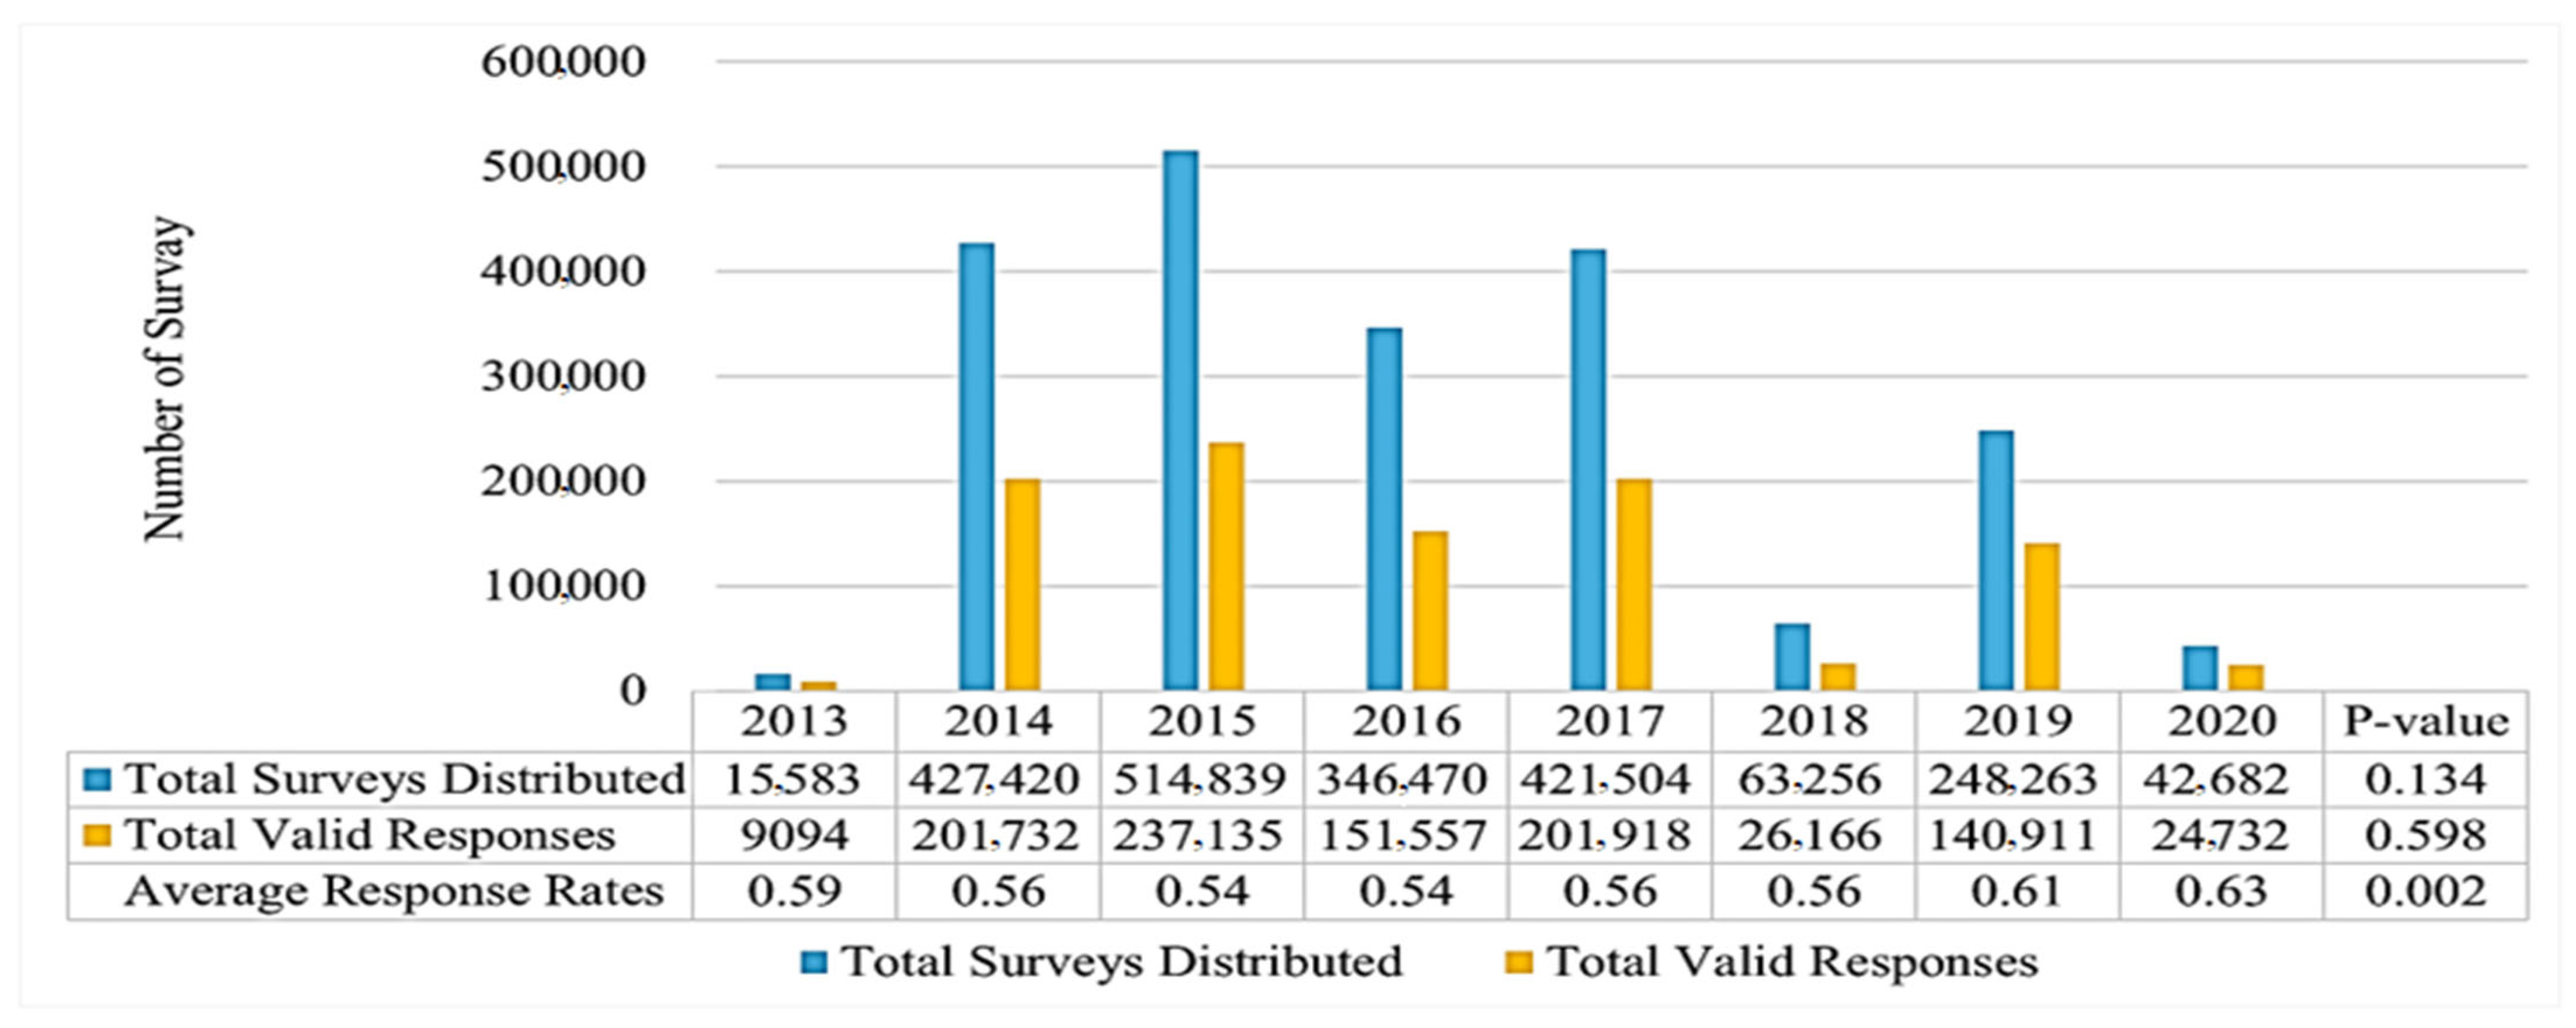
3.1. Hospital and Respondent Characteristics
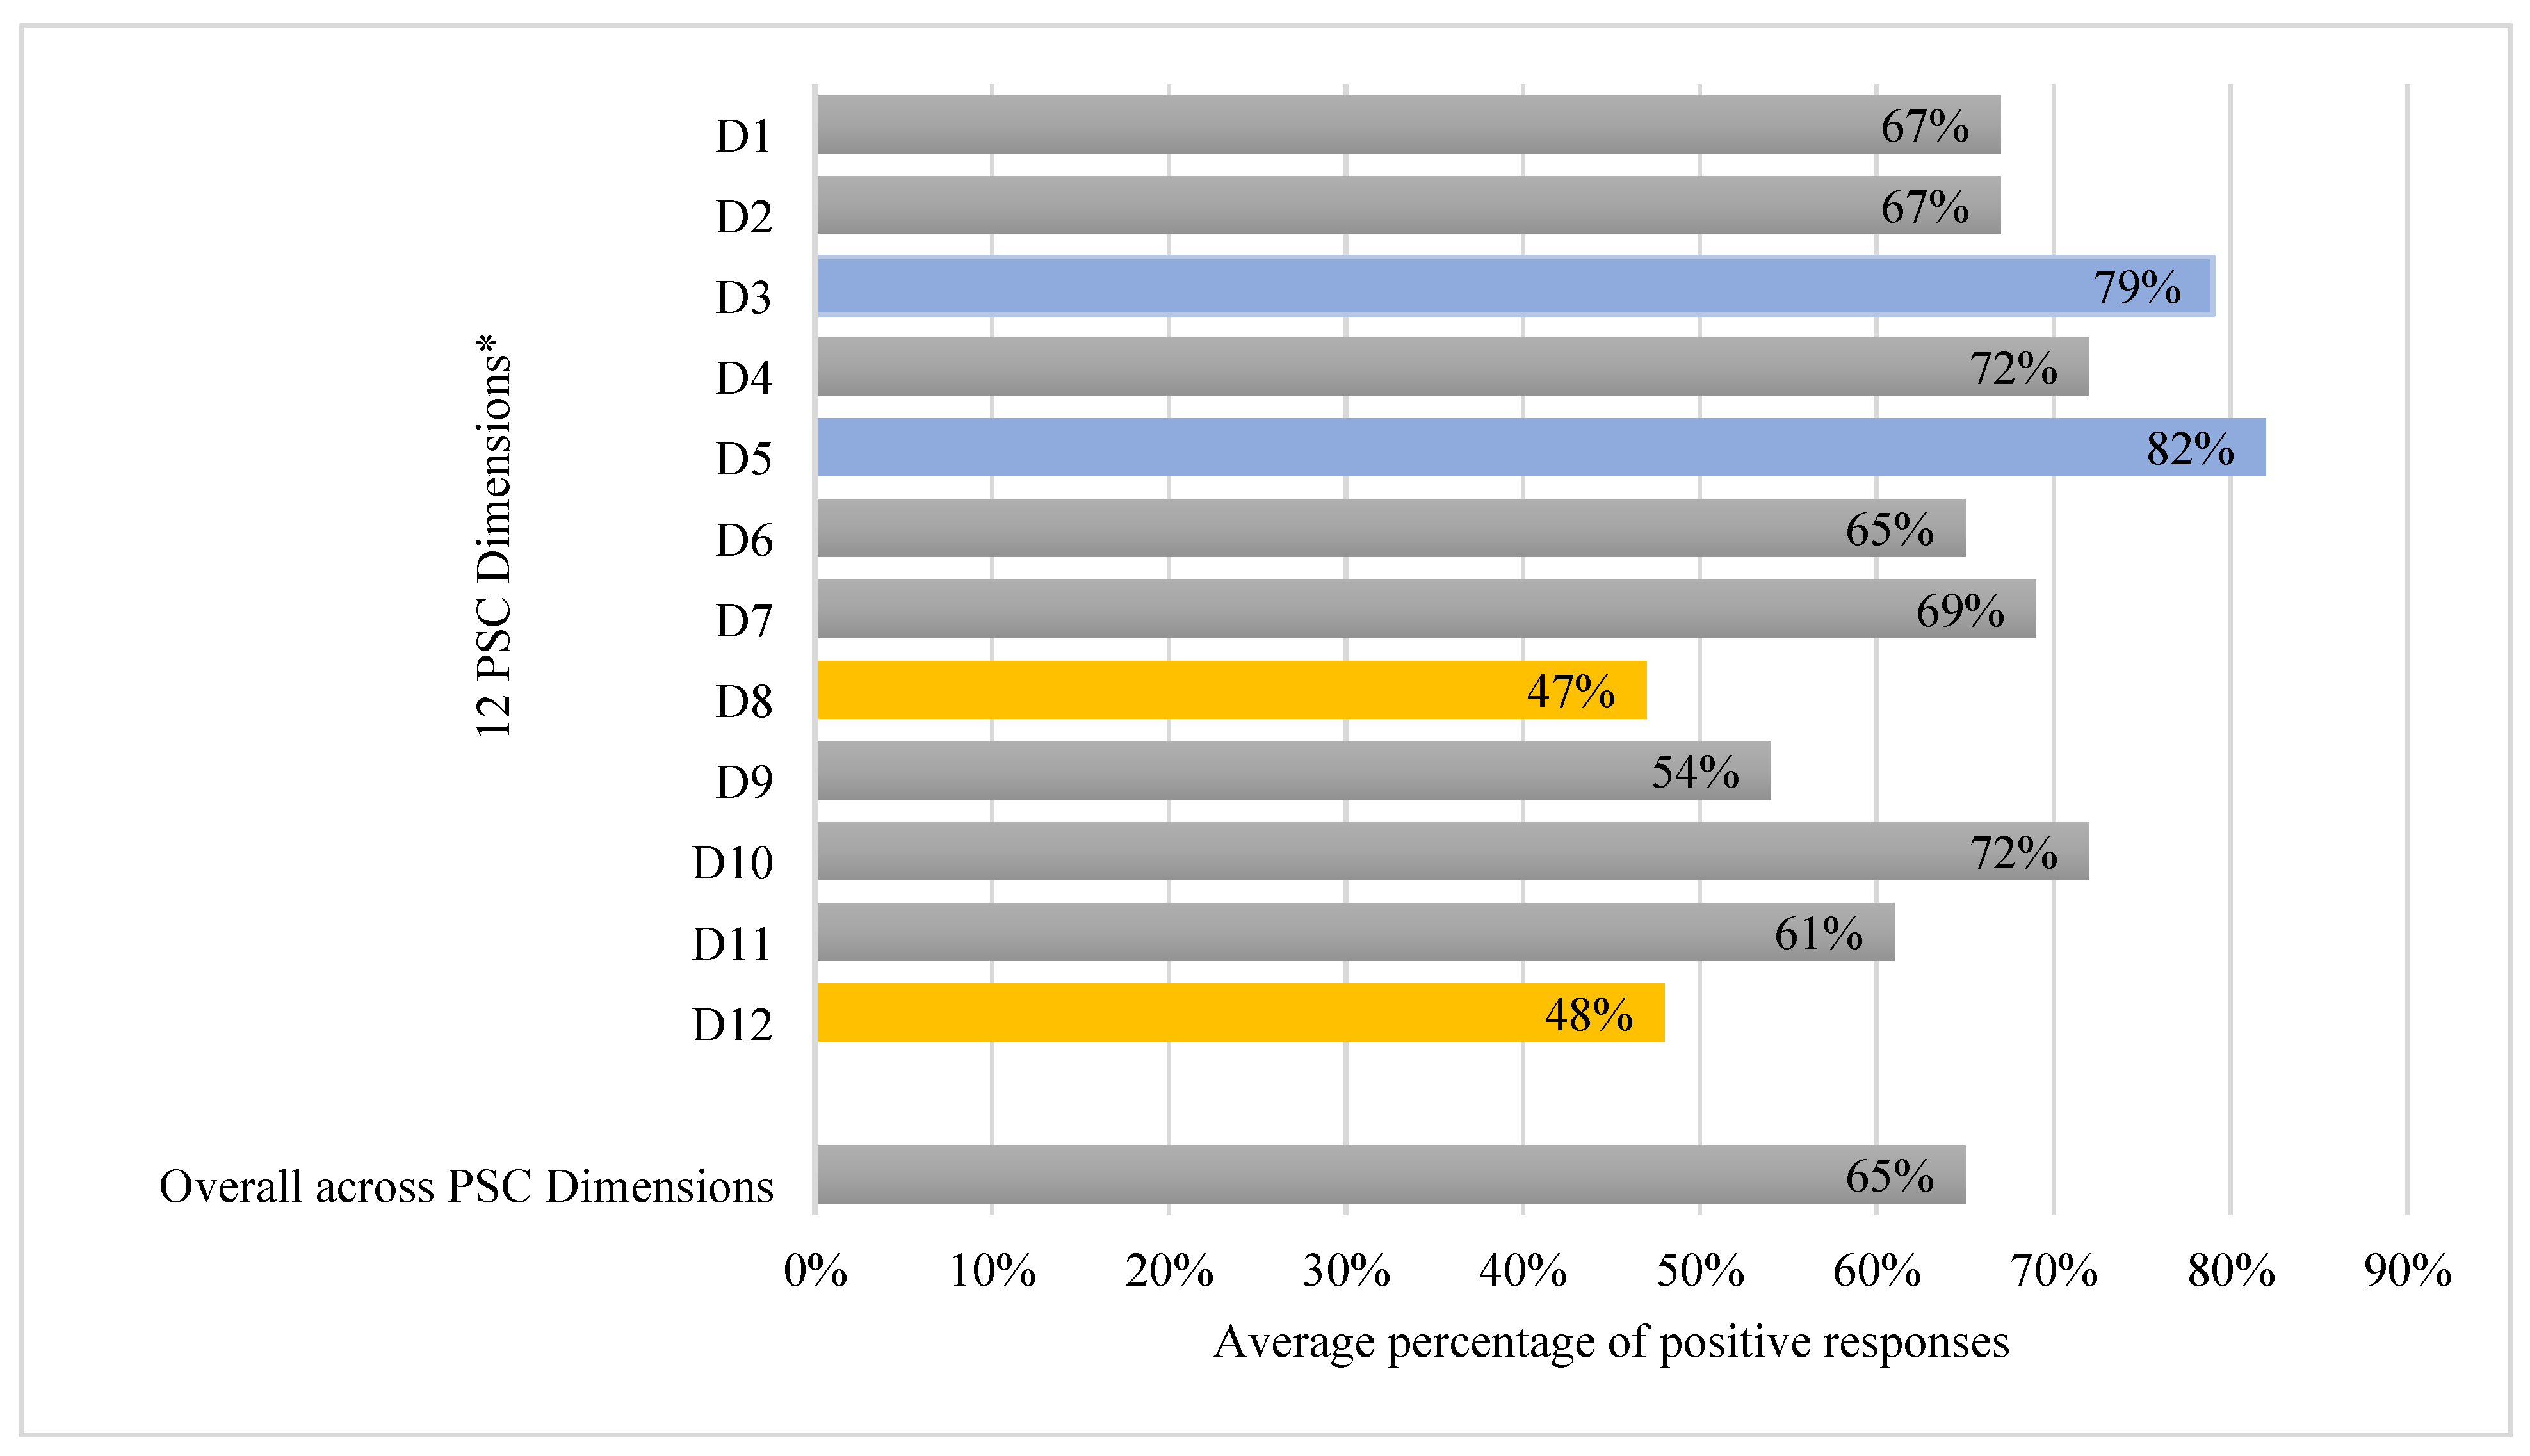
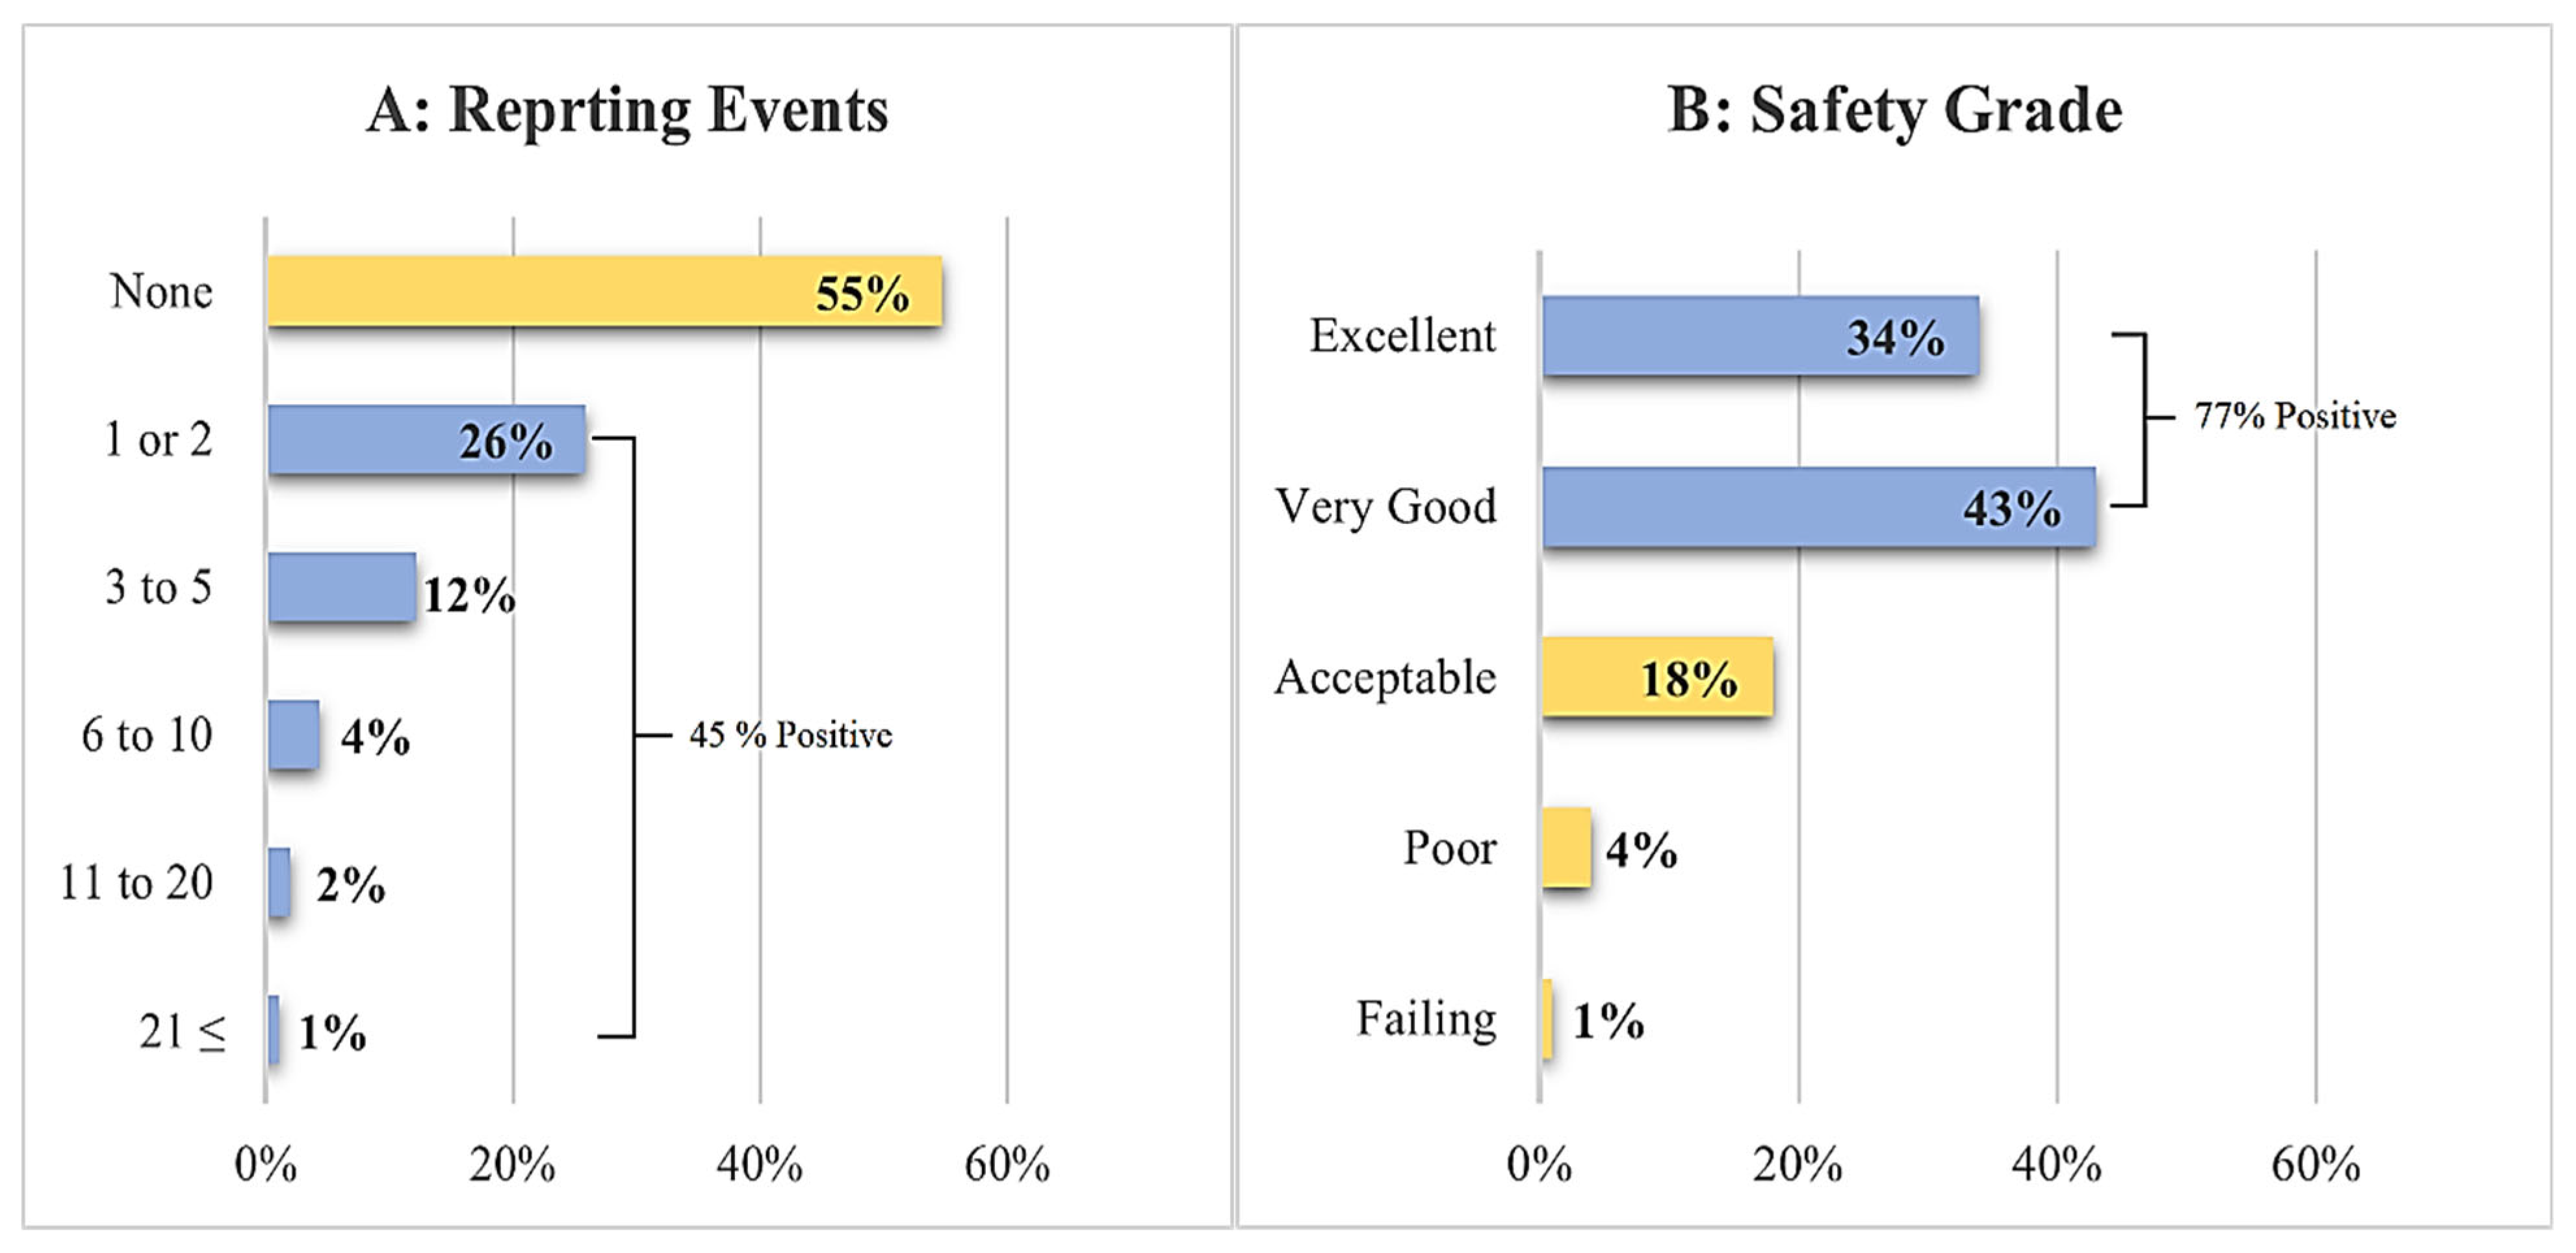
3.2. Patient Safety Culture Overview
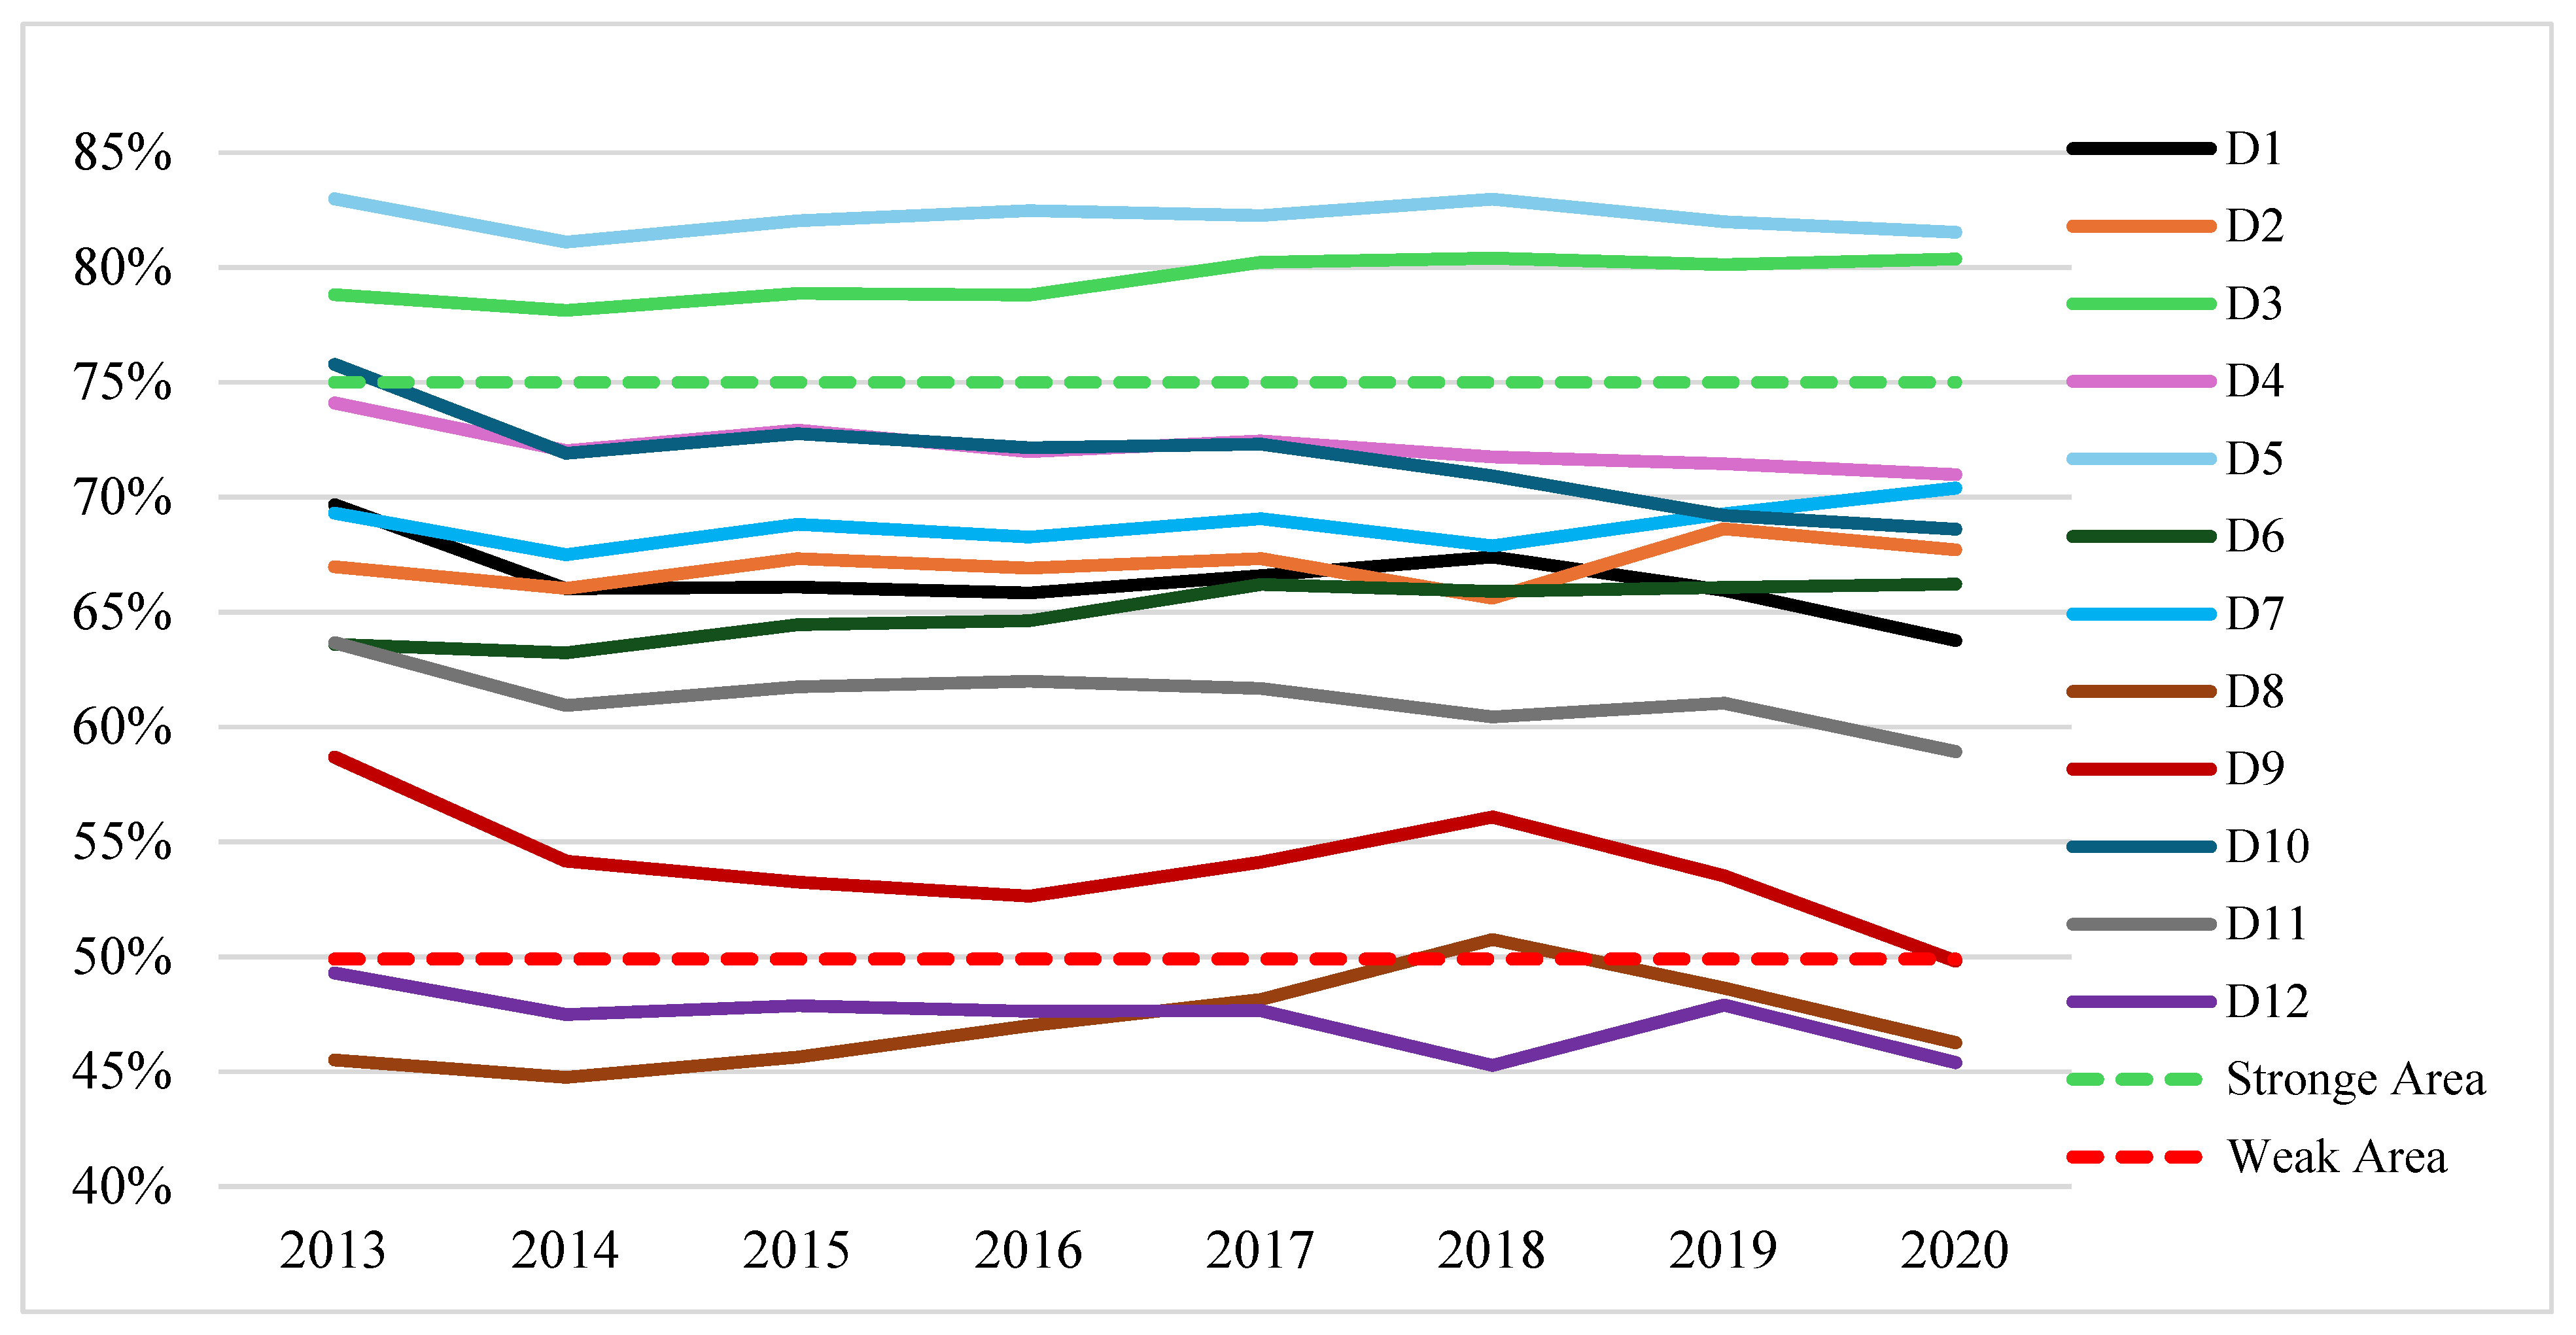
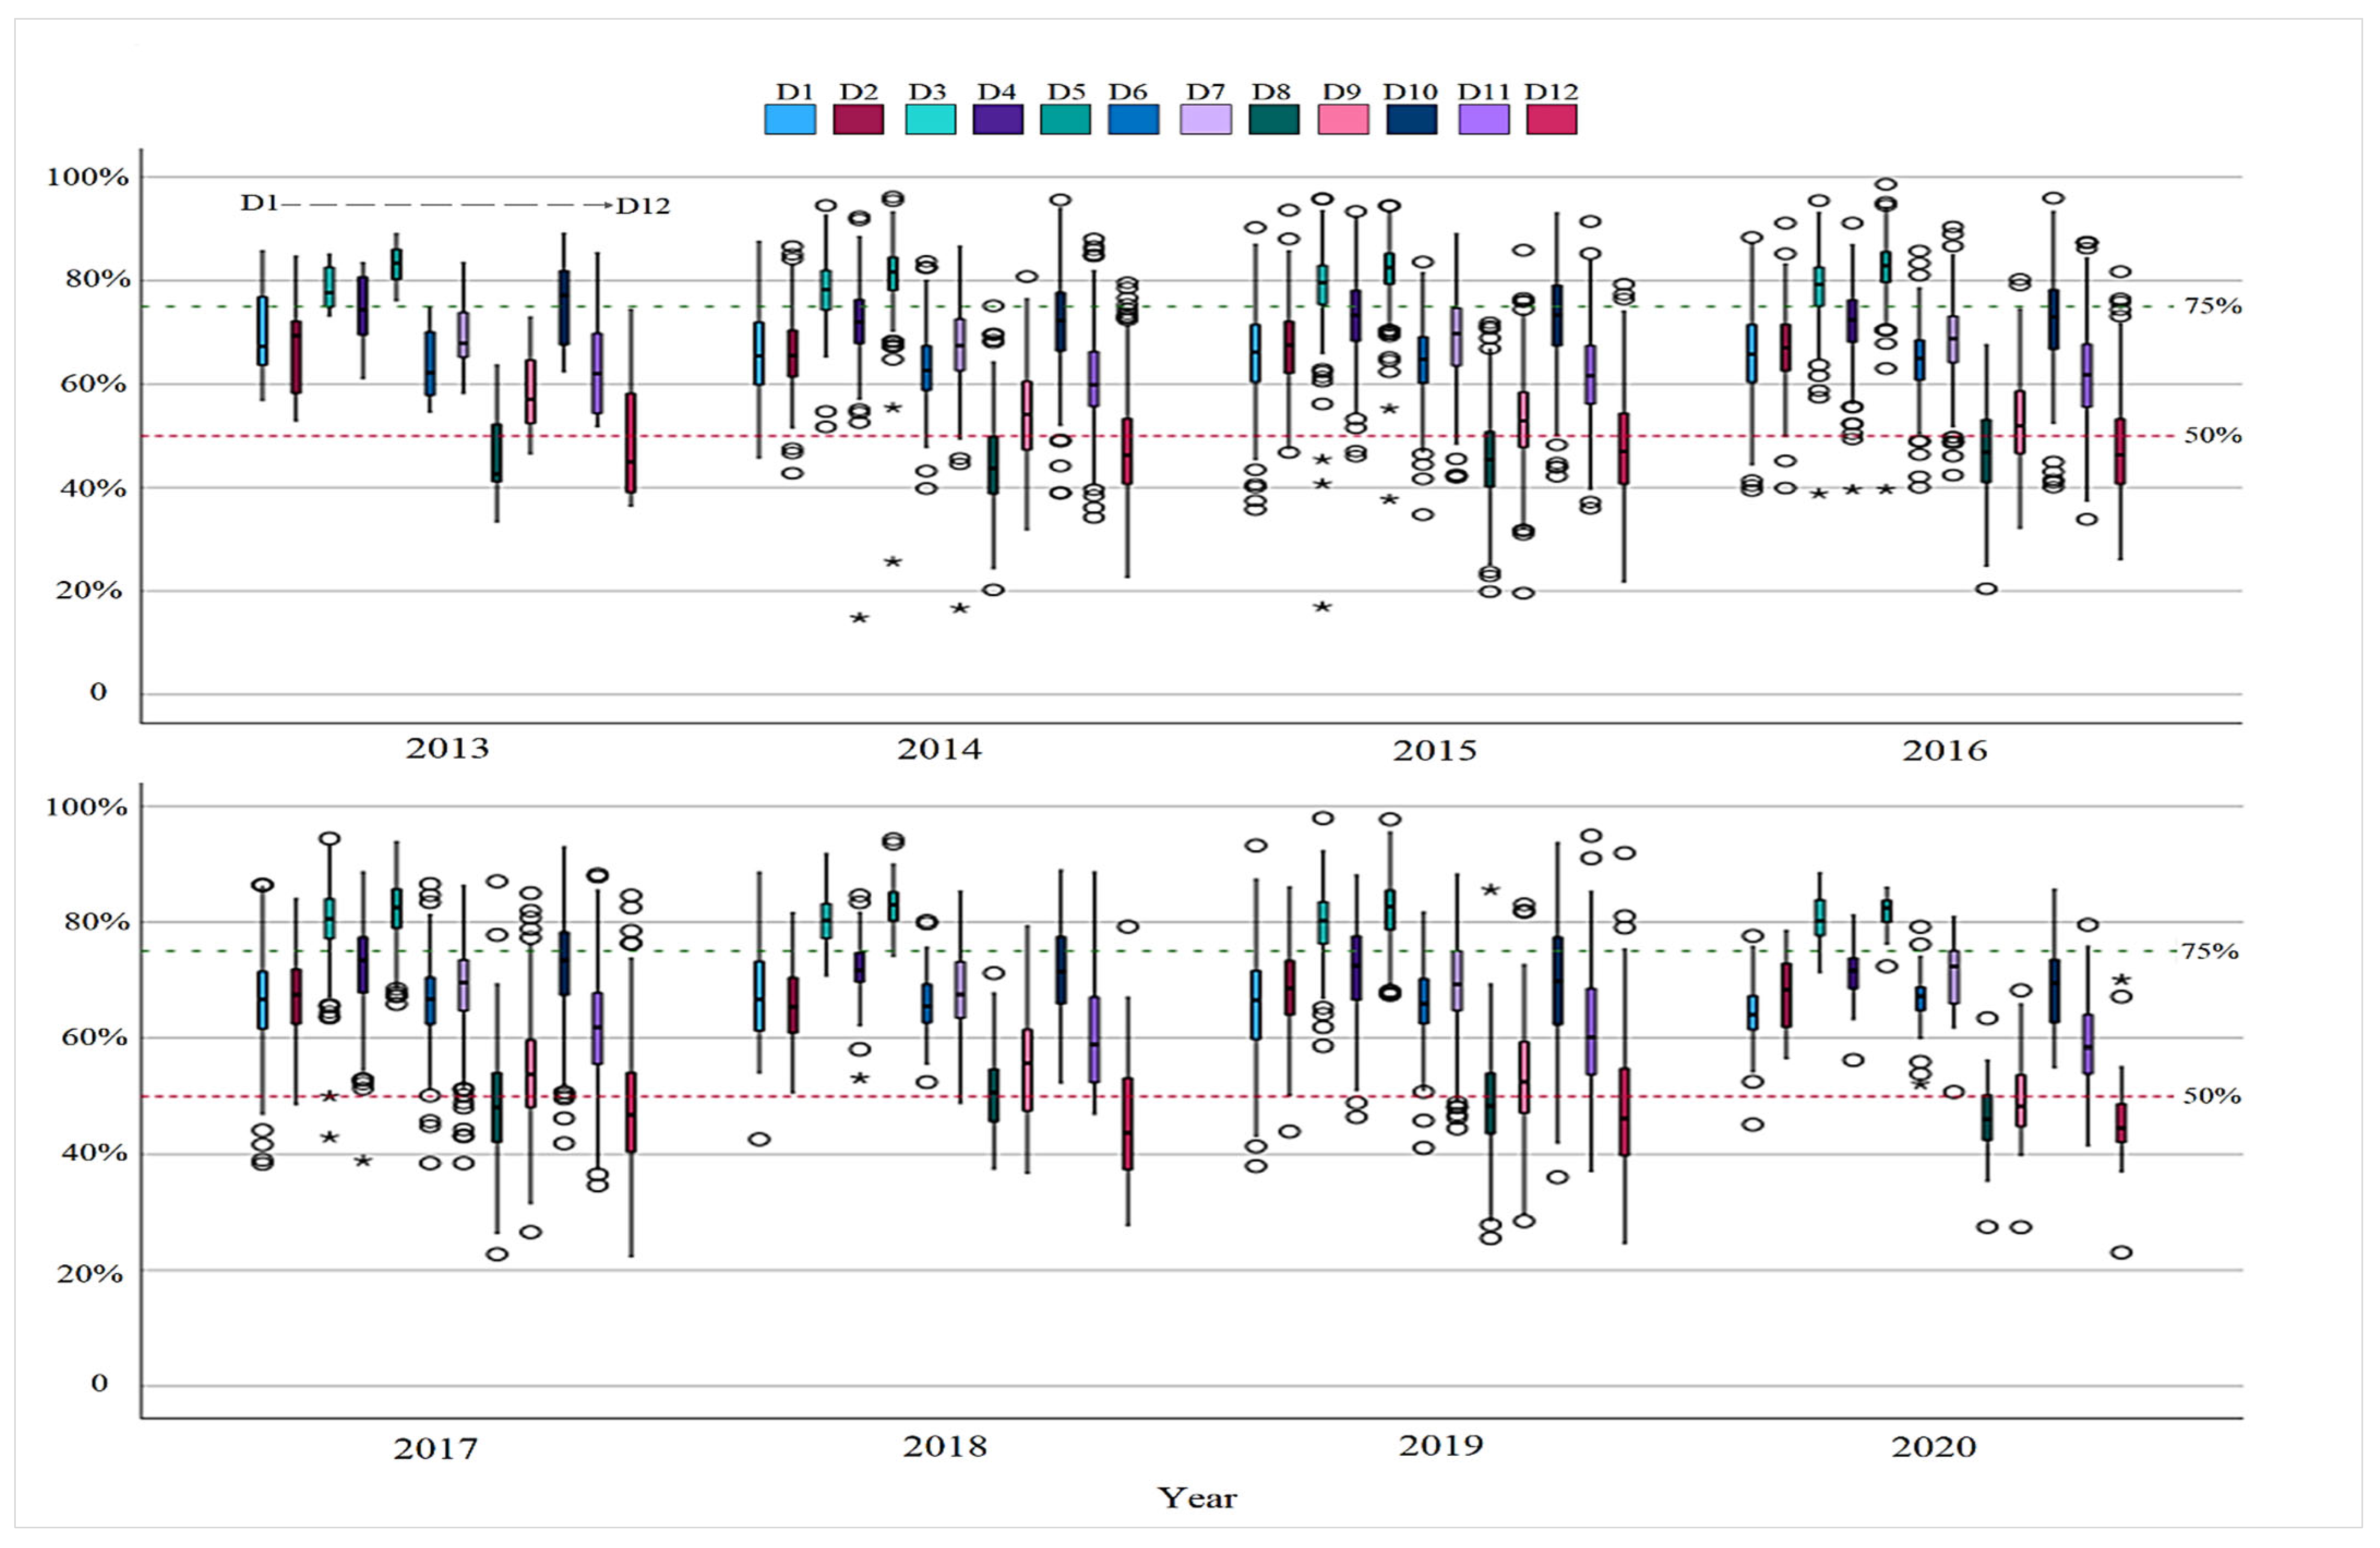
3.3. Annual Changes in Patient Safety Culture
 ) symbol. A more detailed view of the year-by-year variation for each dimension is provided in Figure S1 in the Supplementary Material.
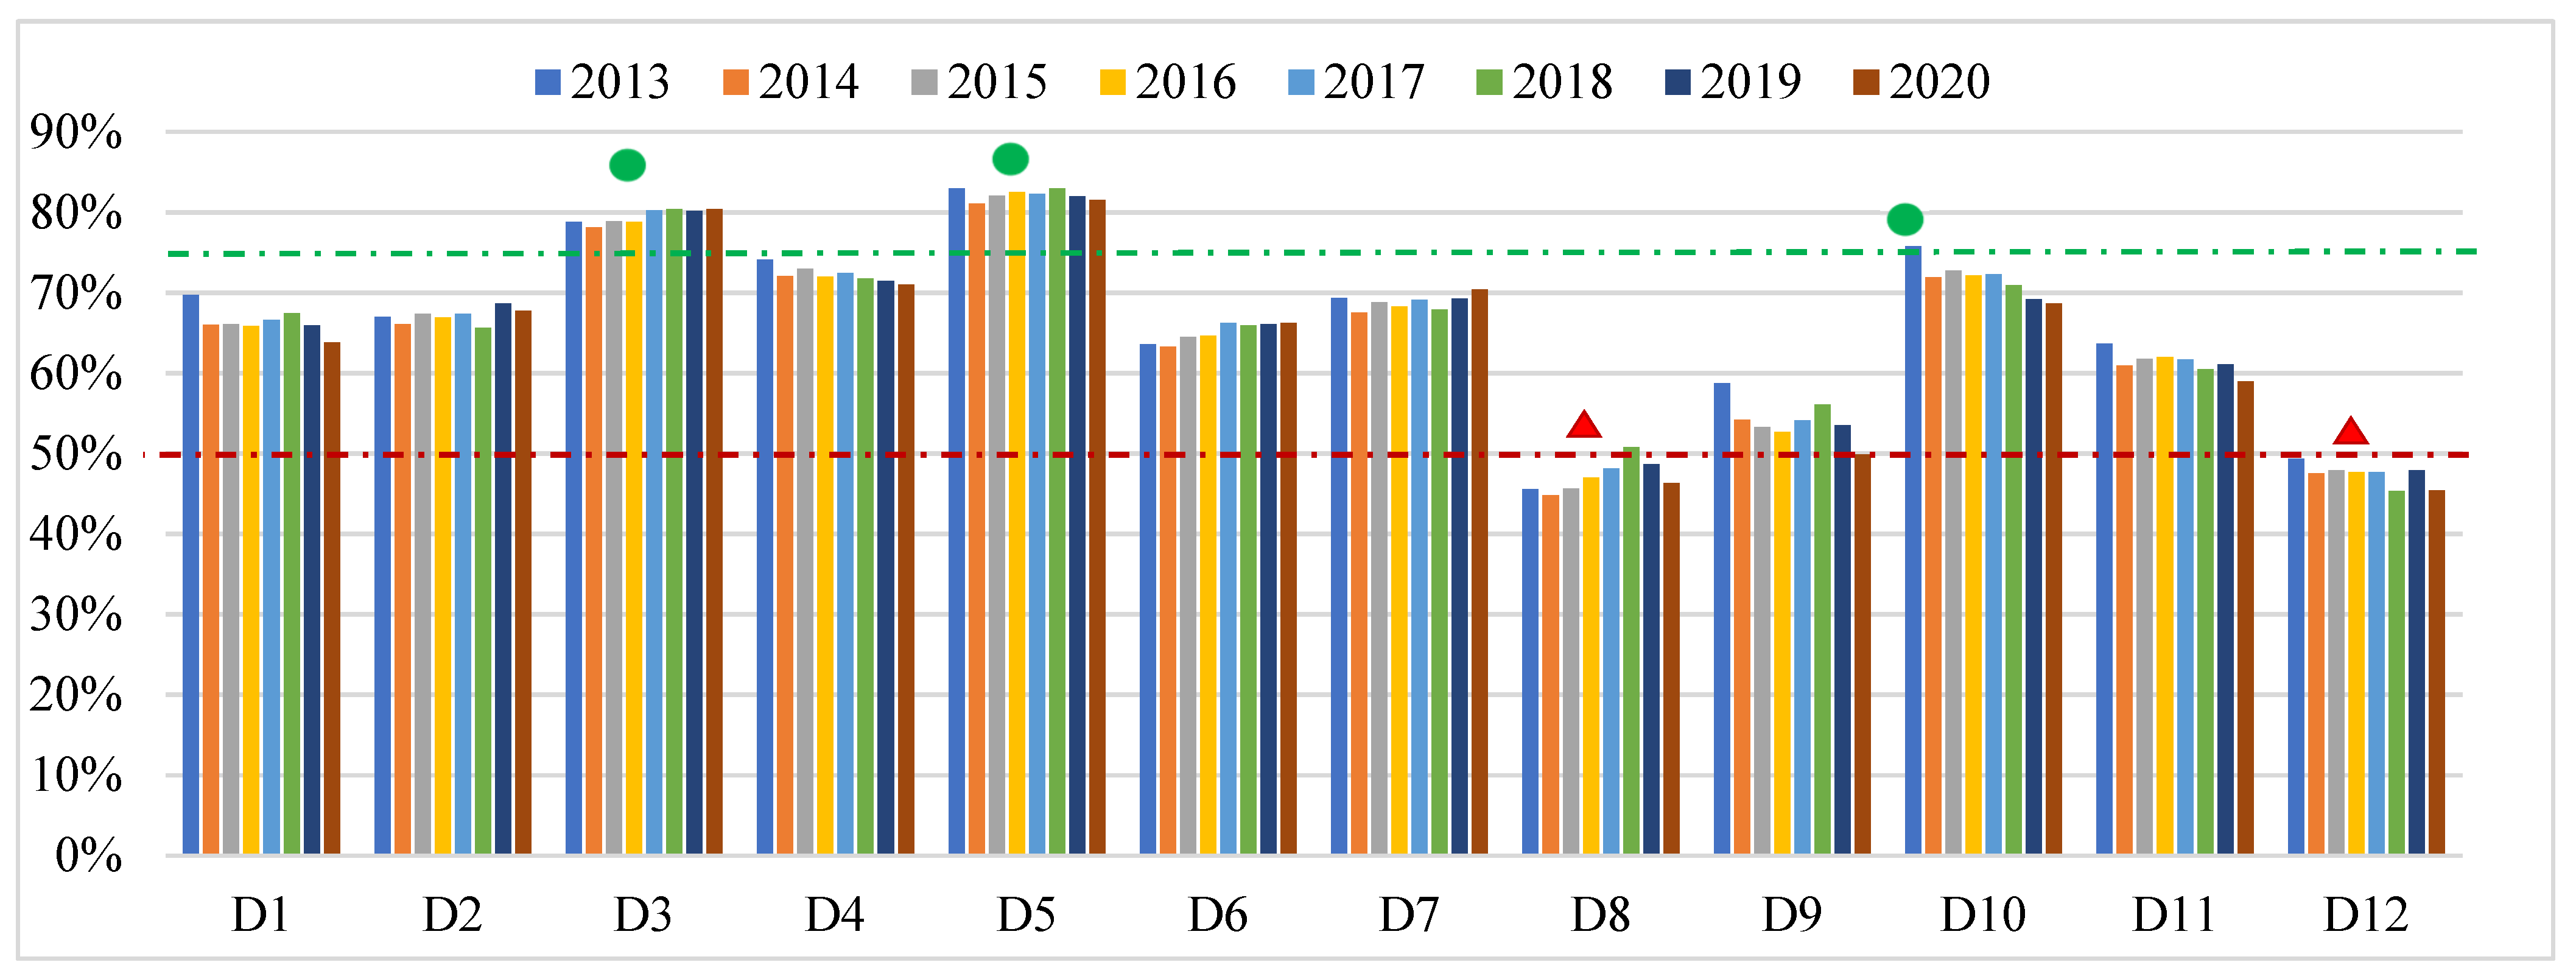
3.4. Areas of Strength and Weakness in PSC over Time
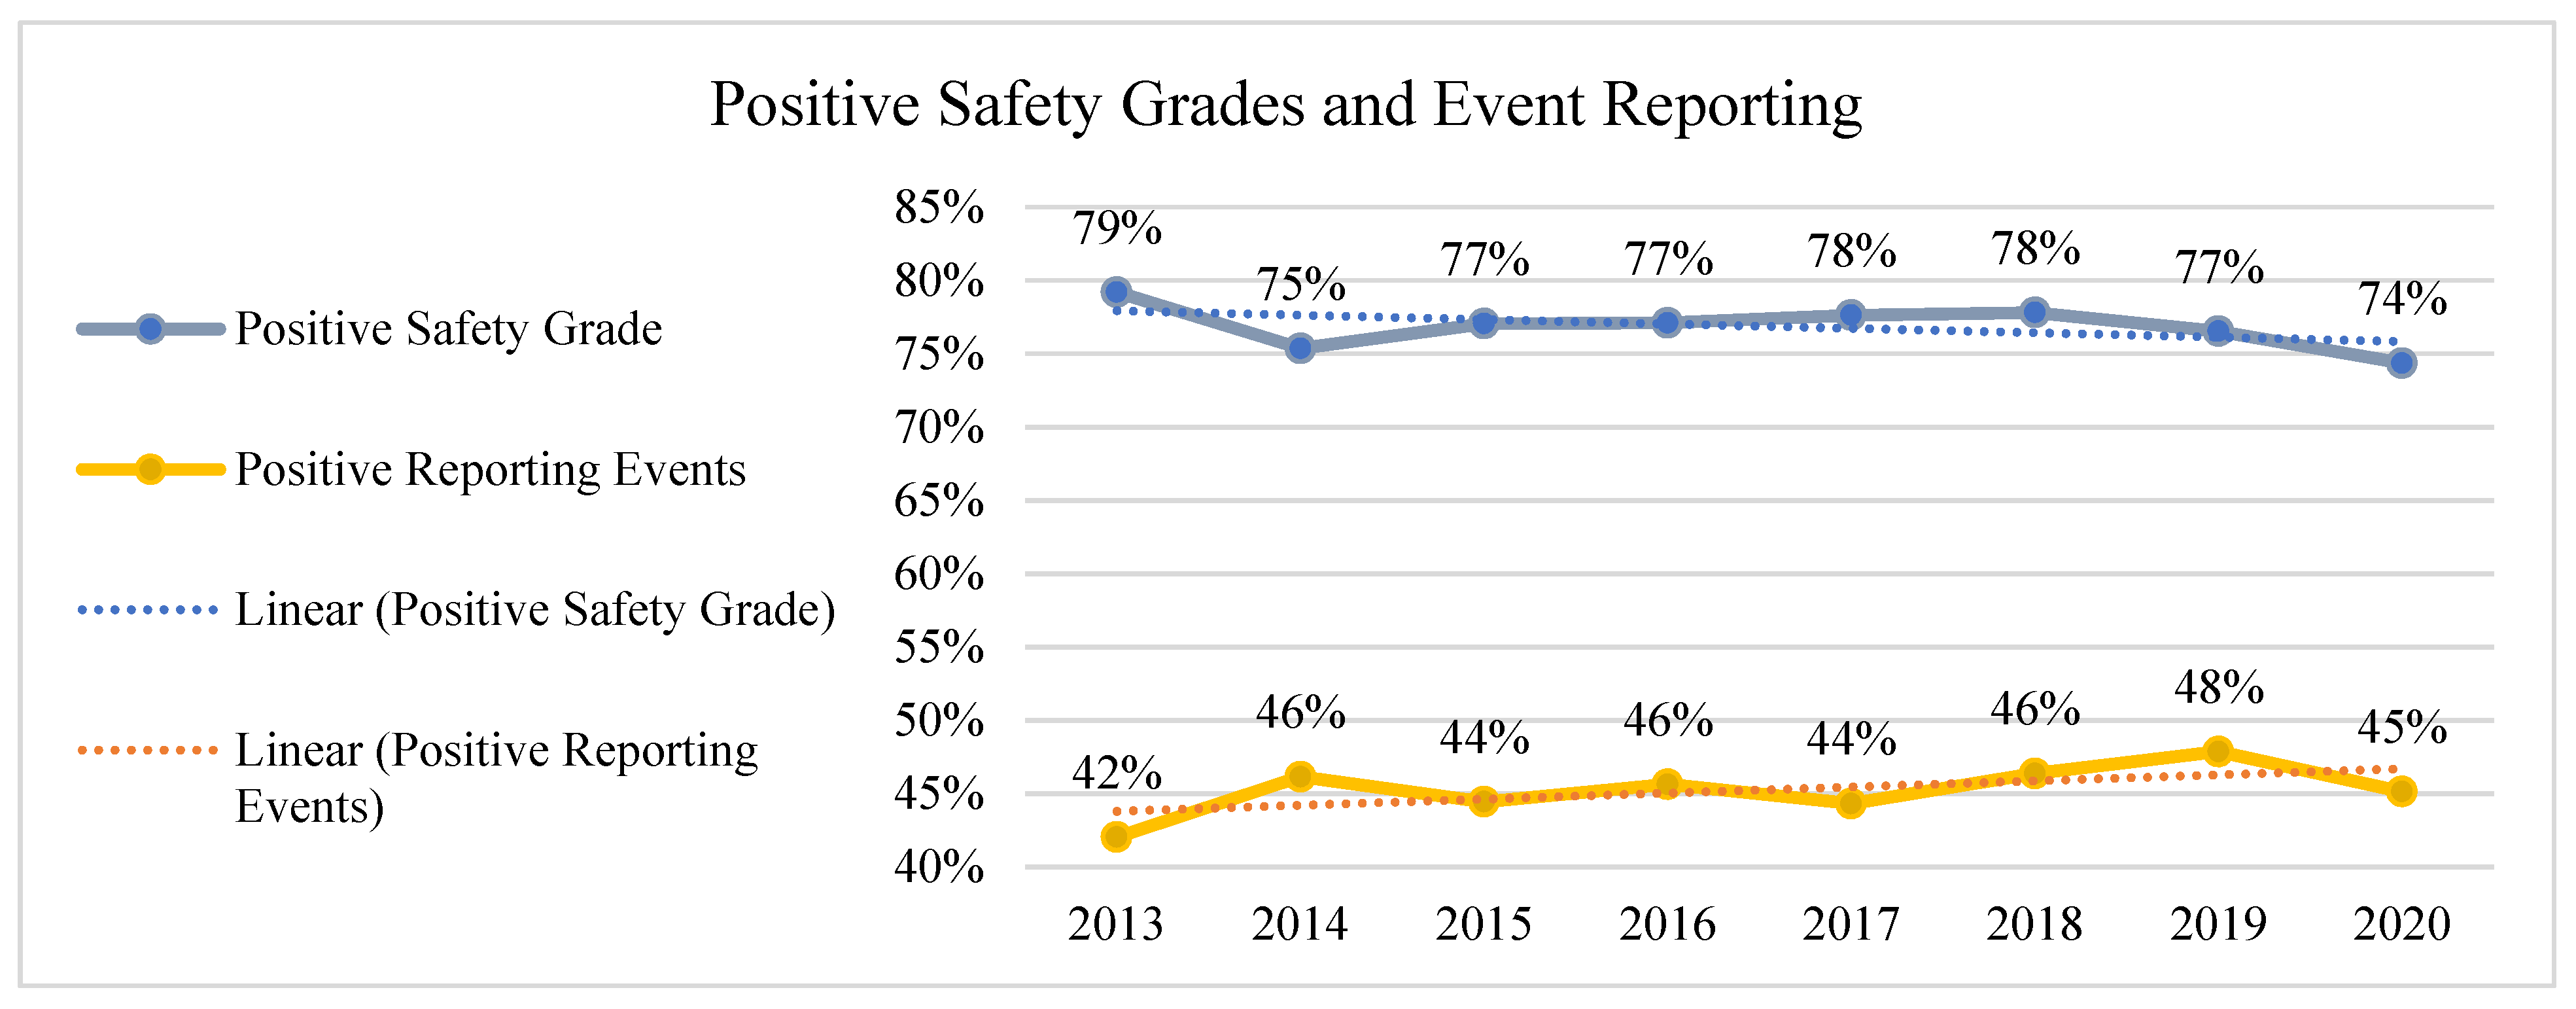
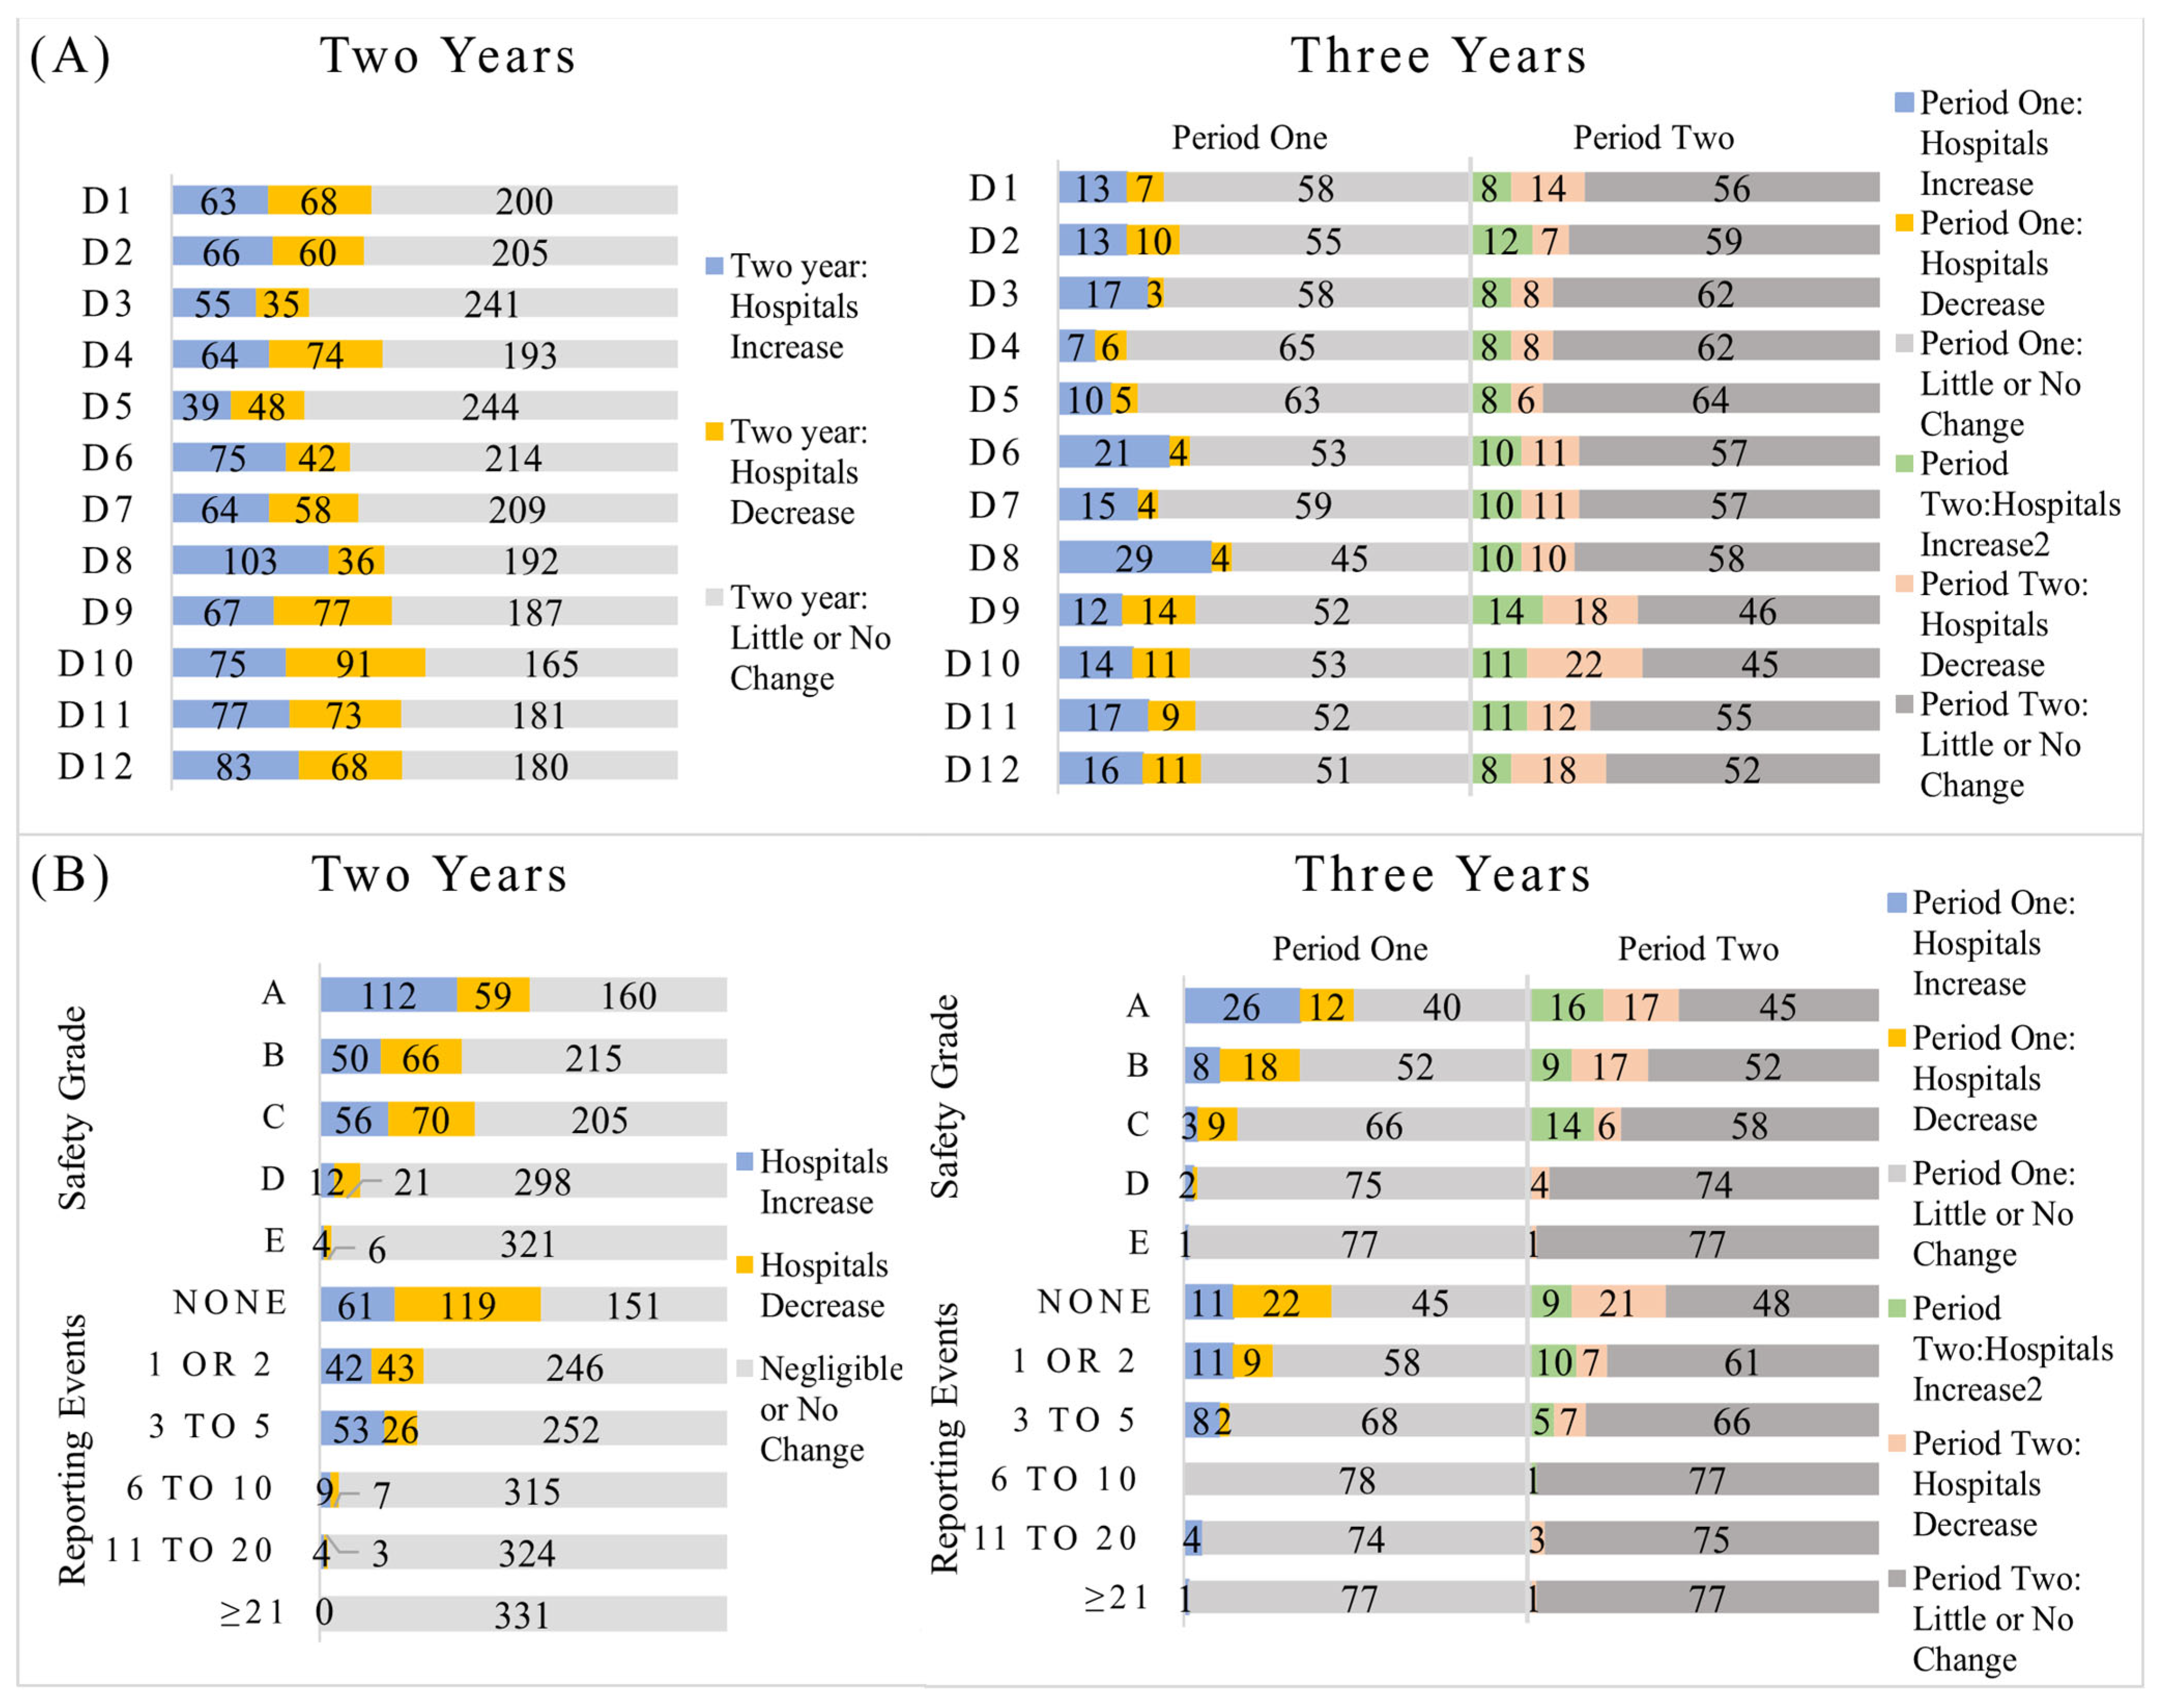
3.5. Tracking Trends in Patient Safety Culture Across U.S. Hospitals
4. Discussion
5. Conclusions
6. Strengths, Limitations, and Future Research Directions
Supplementary Materials
Author Contributions
Funding
Institutional Review Board Statement
Informed Consent Statement
Data Availability Statement
Acknowledgments
Conflicts of Interest
Abbreviations
| AHRQ | Agency for Healthcare Research and Quality |
| ANegR% | Average Negative Response Percentage |
| ANeuR% | Average neutral response percentage |
| ANOVA | Analysis of variance |
| APR% | Average positive response percentage |
| Depts | Departments |
| D1 | Overall Perceptions of Patient Safety |
| D2 | Frequency of Events Reported |
| D3 | Supervisor/Manager Expectations and Actions Promoting Patient Safety |
| D4 | Organizational Learning |
| D5 | Teamwork within Units |
| D6 | Communication Openness |
| D7 | Feedback and Communication about Error |
| D8 | Nonpunitive Response to Error |
| D9 | Staffing |
| D10 | Management Support for Patient Safety |
| D11 | Teamwork across Units |
| D12 | Handoffs and Transitions |
| HSOPSC 1.0 | Hospital Survey on Patient Safety Culture version 1.0 |
| IOM | Institute of Medicine |
| LVN | Licensed Vocational Nurse |
| LPN | Licensed Practical Nurse |
| Safety Grade A | Excellent |
| Safety Grade B | Very good |
| Safety Grade C | Acceptable |
| Safety Grade D | Poor |
| Safety Grade E | Failing |
| SAS | Statistical Analysis System |
| SD | Standard deviation |
| PSC | Patient Safety Culture |
References
- Institute of Medicine. To Err Is Human: Building a Safer Health System; National Academies Press: Washington, DC, USA, 2000; p. 9728. [Google Scholar] [CrossRef]
- World Health Organization. The Conceptual Framework for the International Classification for Patient Safety. Available online: https://www.who.int/publications/i/item/WHO-IER-PSP-2010.2 (accessed on 25 April 2024).
- Health and Safety Commission Advisory Committee. Organizing for Safety; Third Report of the ACSNI (Advisory Committee on the Safety of Nuclear Installations) Study Group on Human Factors; HSE Books: Sudbury, UK, 1993. [Google Scholar]
- Runciman, W.; Hibbert, P.; Thomson, R.; Van Der Schaaf, T.; Sherman, H.; Lewalle, P. Towards an International Classification for Patient Safety: Key concepts and terms. Int. J. Qual. Health Care 2009, 21, 18–26. [Google Scholar] [CrossRef] [PubMed]
- Lee, S.E.; Scott, L.D.; Dahinten, V.S.; Vincent, C.; Lopez, K.D.; Park, C.G. Safety Culture, Patient Safety, and Quality of Care Outcomes: A Literature Review. West J. Nurs. Res. 2019, 41, 279–304. [Google Scholar] [CrossRef]
- Mosadeghrad, A.M. Healthcare service quality: Towards a broad definition. Int. J. Health Care Qual. Assur. 2013, 26, 203–219. [Google Scholar] [CrossRef]
- Bartonickova, D.; Kalankova, D.; Ziakova, K. How to Measure Patient Safety Culture? A Literature Review of Instruments. Acta Medica Martiniana 2021, 21, 69–79. [Google Scholar] [CrossRef]
- Sorra, J.; Nieva, V.F. Hospital Survey on Patient Safety Culture; Agency for Healthcare Research and Quality: Rockville, MD, USA, 2004. [Google Scholar]
- Sorra, J.; Gray, L.; Streagle, S.; Famolaro, T.; Yount, N.; Behm, J. AHRQ Hospital Survey on Patient Safety Culture: User’s Guide; Agency for Healthcare Research and Quality: Rockville, MD, USA, 2016. [Google Scholar]
- Agency for Healthcare Research and Quality. Hospital Survey on Patient Safety Culture. Available online: https://www.ahrq.gov/sops/surveys/index.html (accessed on 22 December 2024).
- SAS Institute Inc. SAS Programming Tips: A Guide to Efficient SAS Processing; SAS Institute Inc.: Cary, NC, USA, 1990. [Google Scholar]
- George, D.; Mallery, P. IBM SPSS Statistics 26 Step by Step: A Simple Guide and Reference, 6th ed.; Routledge: London, UK, 2019. [Google Scholar] [CrossRef]
- American Hospital Association. American Hospital Association Regions. 2020. Available online: https://trustees.aha.org/system/files/media/file/2020/12/American%20Hospital%20Association%20Regions.pdf (accessed on 22 December 2024).
- American Hospital Association. American Hospital Association Regions. Available online: https://www.aha.org/about/leadership/regional-execs (accessed on 5 November 2024).
- Longo, D.R.; Hewett, J.E.; Ge, B.; Schubert, S. The Long Road to Patient Safety: A Status Report on Patient Safety Systems. JAMA 2005, 294, 2858–2865. [Google Scholar] [CrossRef]
- Gershon, R.R.M.; Karkashian, C.D.; Grosch, J.W.; Murphy, L.R.; Escamilla-Cejudo, A.; Flanagan, P.A.; Bernacki, E.; Kasting, C.; Martin, L. Hospital safety climate and its relationship with safe work practices and workplace exposure incidents. Am. J. Infect. Control 2000, 28, 211–221. [Google Scholar] [CrossRef] [PubMed]
- Scott, T.; Mannion, R.; Marshall, M.; Davies, H. Does organisational culture influence health care performance? A review of the evidence. J. Health Serv. Res. Policy 2003, 8, 105–117. [Google Scholar] [CrossRef] [PubMed]
- Gottlieb, L.N.; Gottlieb, B.; Bitzas, V. Creating Empowering Conditions for Nurses with Workplace Autonomy and Agency: How Healthcare Leaders Could Be Guided by Strengths-Based Nursing and Healthcare Leadership (SBNH-L). J. Healthc. Leadersh. 2021, 13, 169–181. [Google Scholar] [CrossRef]
- Johnson, M.O. The Shifting Landscape of Health Care: Toward a Model of Health Care Empowerment. Am. J. Public Health 2011, 101, 265–270. [Google Scholar] [CrossRef]
- De Long, D.W.; Fahey, L. Diagnosing cultural barriers to knowledge management. Acad. Manag. Perspect. 2000, 14, 113–127. [Google Scholar] [CrossRef]
- O’Daniel, M.; Rosenstein, A. Professional Communication and Team Collaboration. In Patient Safety and Quality: An Evidence-Based Handbook for Nurses; Hughes, R.G., Ed.; Agency for Healthcare Research and Quality (US): Rockville, MD, USA, 2008; Chapter 33. Available online: https://www.ncbi.nlm.nih.gov/books/NBK2637/ (accessed on 17 May 2023).
- Rosen, M.A.; DiazGranados, D.; Dietz, A.S.; Benishek, L.E.; Thompson, D.; Pronovost, P.J.; Weaver, S.J. Teamwork in healthcare: Key discoveries enabling safer, high-quality care. Am. Psychol. 2018, 73, 433–450. [Google Scholar] [CrossRef] [PubMed]
- Alabdullah, H.; Karwowski, W. Patient Safety Culture in Hospital Settings Across Continents: A Systematic Review. Appl. Sci. 2024, 14, 8496. [Google Scholar] [CrossRef]
- Chilukuri, G.; Westerman, S.T. Healthcare Workers’ Perceptions of Patient Safety Culture in United States Hospitals: A Systematic Review and Meta-Analysis. Int. J. Med. Stud. 2024, 12, 422–436. [Google Scholar] [CrossRef]
- Marx, D. Patient Safety and the ‘Just Culture’: A Primer for Health Care Executives; Lung and Blood Institute: Bethesda, MD, USA, 2001; Report for Columbia University Under a Grant Provided by the National Heart. [Google Scholar]
- Sorra, J.; Nieva, V.; Fastman, B.R.; Kaplan, H.; Schreiber, G.; King, M. Staff attitudes about event reporting and patient safety culture in hospital transfusion services. Transfusion 2008, 48, 1934–1942. [Google Scholar] [CrossRef]
- Khater, W.A.; Akhu-Zaheya, L.M.; AL-Mahasneh, S.I.; Khater, R. Nurses’ perceptions of patient safety culture in J ordanian hospitals. Int. Nurs. Rev. 2015, 62, 82–91. [Google Scholar] [CrossRef]
- Lasater, K.B.; Aiken, L.H.; Sloane, D.M.; French, R.; Martin, B.; Reneau, K.; Alexander, M.; McHugh, M.D. Chronic hospital nurse understaffing meets COVID-19: An observational study. BMJ Qual. Saf. 2021, 30, 639–647. [Google Scholar] [CrossRef]
- You, L.-M.; Aiken, L.H.; Sloane, D.M.; Liu, K.; He, G.-P.; Hu, Y.; Jiang, X.-L.; Li, X.-H.; Li, X.-M.; Liu, H.-P.; et al. Hospital nursing, care quality, and patient satisfaction: Cross-sectional surveys of nurses and patients in hospitals in China and Europe. Int. J. Nurs. Stud. 2013, 50, 154–161. [Google Scholar] [CrossRef] [PubMed]
- Farokhzadian, J.; Nayeri, N.D.; Borhani, F. The long way ahead to achieve an effective patient safety culture: Challenges perceived by nurses. BMC Health Serv. Res. 2018, 18, 654. [Google Scholar] [CrossRef] [PubMed]
- Copeland, D. Targeting the Fear of Safety Reporting on a Unit Level. JONA J. Nurs. Adm. 2019, 49, 121–124. [Google Scholar] [CrossRef]
- Azyabi, A.; Karwowski, W.; Hancock, P.; Wan, T.T.H.; Elshennawy, A. Assessing Patient Safety Culture in United States Hospitals. Int. J. Environ. Res. Public Health 2022, 19, 2353. [Google Scholar] [CrossRef]
- Agency for Healthcare Research and Quality, Rockville, MD, USA. Hospital Survey Version 2.0: Background and Information for Translators. Available online: https://www.ahrq.gov/sops/international/hospital/translators-version-2.html (accessed on 23 January 2025).
- Schulson, L.; Bandini, J.; Bialas, A.; Huilgol, S.; Timmins, G.; Ahluwalia, S.; Gidengil, C. Patient safety and the COVID-19 pandemic: A qualitative study of perspectives of front-line clinicians. BMJ Open Qual. 2024, 13, e002692. [Google Scholar] [CrossRef] [PubMed]
- Staines, A.; Amalberti, R.; Berwick, D.M.; Braithwaite, J.; Lachman, P.; Vincent, C.A. COVID-19: Patient safety and quality improvement skills to deploy during the surge. Int. J. Qual. Health Care 2021, 33, mzaa050. [Google Scholar] [CrossRef] [PubMed]
- Sterling, R.S.; Berry, S.A.; Herzke, C.A.; Haut, E.R. Patient Safety and Quality Improvement Adaptation During the COVID-19 Pandemic. Am. J. Med. Qual. 2021, 36, 57–59. [Google Scholar] [CrossRef] [PubMed]
- Alaska, Y.A.; Alkutbe, R.B. What Do We Know About Patient Safety Culture in Saudi Arabia? A Descriptive Study. J. Patient Saf. 2023, 19, 517–524. [Google Scholar] [CrossRef]
- Tereanu, C.; Noll, A. Trends in the Staff’s Perception of Patient Safety Culture in Romanian Hospitals. Curr. Health Sci. J. 2020, 46, 236–243. [Google Scholar] [CrossRef]
- American Hospital Association. ARCHIVED: Fast Facts on U.S. Hospitals, 2019. Available online: https://www.aha.org/statistics/2020-01-07-archived-fast-facts-us-hospitals-2019 (accessed on 4 May 2025).


| Hospital Characteristics | Hospital Frequency (%) | Participant Frequency (%) | Respondent Characteristics | Participant Frequency (%) |
|---|---|---|---|---|
| Total | 1601 | 993,245 | Worked in the Current Hospital Work Area/Unit | (N = 922,422) |
| Region | Less than 1 year | 148,756 (16%) | ||
| Northeast | 218 (13%) | 179,838 (18%) | 1 to 5 years | 367,235 (40%) |
| South | 490 (31%) | 338,743 (34%) | 6 to 10 years | 173,619 (19%) |
| Center | 710 (44%) | 366,108 (37%) | 11 to 15 years | 102,539 (11%) |
| West | 183 (12%) | 108,556 (11%) | 16 to 20 years | 58,729 (6%) |
| Bed Size | 21 years or more | 71,544 (8%) | ||
| 6–49 | 328 (21%) | 43,007 (4%) | Hours per Week | (N = 915,770) |
| 50–99 | 271 (17%) | 67,951 (7%) | Less than 20 h per week | 44,462 (5%) |
| 100–199 | 366 (23%) | 180,487 (18%) | 20 to 39 h per week | 372,840 (41%) |
| 200–299 | 263 (16%) | 193,429 (20%) | 40 to 59 h per week | 438,288 (48%) |
| 300–399 | 145 (9%) | 139,056 (14%) | 60 to 79 h per week | 39,022 (4%) |
| ≥400 | 228 (14%) | 369,315 (37%) | 80 to 99 h per week | 19,076 (2%) |
| Survey Mode | 100 h per week or more | 2082 (<1%) | ||
| Paper | 71 (4%) | 18,757 (2%) | Direct Contact with Patients | (N = 942,840) |
| Web | 1310 (82%) | 844,469 (85%) | Yes | 731,042 (78%) |
| Mixed Mode | 220 (14%) | 130,019 (13%) | No | 211,798 (22%) |
| Hospital Type | Staff Position | (N = 934,067) | ||
| Non-teaching | 1015 (63%) | 420,819 (42%) | Registered Nurse | 331,314 (35%) |
| Teaching | 586 (37%) | 572,426 (58%) | Physician Assistant/Nurse Practitioner | 12,254 (1%) |
| Years | LVN/LPN | 8657 (1%) | ||
| 2013 | 12 (1%) | 9094 (1%) | Patient Care Assistant/Hospital Aide/Care Partner | 59,366 (6%) |
| 2014 | 312 (20%) | 201,732 (20%) | Attending/Staff Physician | 25,926 (3%) |
| 2015 | 372 (23%) | 237,135 (24%) | Resident/Training Physician | 11,210 (1%) |
| 2016 | 248 (15%) | 151,557 (15%) | Pharmacist | 18,152 (2%) |
| 2017 | 339 (21%) | 201,918 (20%) | Dietician | 5568 (1%) |
| 2018 | 46 (3%) | 26,166 (3%) | Unit Assistant/Clerk/Secretary | 45,916 (5%) |
| 2019 | 243 (15%) | 140,911 (14%) | Respiratory Therapist | 19,455 (2%) |
| 2020 | 29 (2%) | 24,732 (3%) | Physical, Occupational, or Speech Therapist | 27,747 (2%) |
| Staff Surveyed | Technician (e.g., Lab, Radiology) | 102,834 (3%) | ||
| All staff/sample of all | 1480 (92%) | 913,729 (92%) | Administration/Management | 65,969 (7%) |
| Selected depts/units | 58 (4%) | 31,753 (3%) | Other | 199,699 (21%) |
| Selected staff positions | 2 (<1%) | 3716 (<1%) | Worked in Current Specialty or Profession | (N = 897,411) |
| Selected depts/units and selected staff positions | 61 (4%) | 44,047 (4%) | ||
| Respondent Characteristics | Participant Frequency (%) | Less than 1 year | 65,760 (7%) | |
| 1 to 5 years | 240,824 (27%) | |||
| Worked in a Hospital | (* N = 899,076) | 6 to 10 years | 163,133 (18%) | |
| Less than 1 year | 114,366 (13%) | 11 to 15 years | 118,060 (13%) | |
| 1 to 5 years | 302,106 (34%) | 16 to 20 years | 97,249 (11%) | |
| 6 to 10 years | 171,946 (19%) | 21 years or more | 212,385 (24%) | |
| 11 to 15 years | 115,538 (13%) | |||
| 16 to 20 years | 73,194 (8%) | |||
| 21 years or more | 121,926 (14%) | |||
| PSC | Mean | SD | Min | 10th %ile | 25th %ile | 50th %ile | 75th %ile | 90th %ile | Max |
|---|---|---|---|---|---|---|---|---|---|
| D1 | 66% | 9% | 36% | 56% | 60% | 66% | 72% | 77% | 93% |
| D2 | 67% | 7% | 40% | 58% | 62% | 67% | 72% | 76% | 94% |
| D3 | 79% | 6% | 17% | 72% | 76% | 80% | 83% | 87% | 98% |
| D4 | 72% | 7% | 15% | 63% | 68% | 73% | 77% | 81% | 93% |
| D5 | 82% | 6% | 26% | 76% | 79% | 82% | 85% | 88% | 99% |
| D6 | 65% | 7% | 35% | 56% | 61% | 65% | 69% | 73% | 87% |
| D7 | 69% | 8% | 17% | 59% | 64% | 69% | 74% | 78% | 90% |
| D8 | 47% | 9% | 20% | 36% | 41% | 46% | 53% | 58% | 87% |
| D9 | 54% | 9% | 20% | 42% | 47% | 53% | 59% | 66% | 86% |
| D10 | 72% | 9% | 36% | 60% | 66% | 73% | 78% | 83% | 96% |
| D11 | 61% | 10% | 34% | 50% | 55% | 61% | 68% | 74% | 95% |
| D12 | 48% | 11% | 22% | 35% | 40% | 46% | 54% | 62% | 92% |
| Category | D1 | D2 | D3 | D4 | D5 | D6 | D7 | D8 | D9 | D10 | D11 | D12 |
|---|---|---|---|---|---|---|---|---|---|---|---|---|
| Region | ||||||||||||
| Northeast | 62% | 64% | 76% | 68% | 79% | 62% | 63% | 44% | 49% | 68% | 56% | 42% |
| South | 67% | 70% | 81% | 75% | 83% | 66% | 72% | 48% | 54% | 74% | 63% | 50% |
| Center | 68% | 66% | 80% | 72% | 82% | 65% | 69% | 48% | 56% | 72% | 62% | 49% |
| West | 62% | 66% | 77% | 70% | 82% | 63% | 66% | 43% | 51% | 69% | 60% | 45% |
| p-value | <0.001 | <0.001 | <0.001 | <0.001 | <0.001 | <0.001 | <0.001 | <0.001 | <0.001 | <0.001 | <0.001 | <0.001 |
| Bed Size | ||||||||||||
| 6–49 beds | 72% | 70% | 82% | 74% | 84% | 68% | 70% | 52% | 61% | 77% | 69% | 57% |
| 50–99 beds | 68% | 68% | 81% | 73% | 83% | 66% | 69% | 49% | 56% | 74% | 63% | 49% |
| 100–199 beds | 66% | 68% | 79% | 73% | 82% | 65% | 69% | 47% | 53% | 72% | 61% | 47% |
| 200–299 beds | 63% | 65% | 77% | 70% | 81% | 63% | 67% | 44% | 50% | 68% | 57% | 43% |
| 300–399 beds | 62% | 65% | 76% | 70% | 80% | 62% | 67% | 42% | 48% | 68% | 57% | 42% |
| 400 or more beds | 62% | 65% | 77% | 71% | 81% | 63% | 67% | 43% | 49% | 68% | 57% | 44% |
| p-value | <0.001 | <0.001 | <0.001 | <0.001 | <0.001 | <0.001 | <0.001 | <0.001 | <0.001 | <0.001 | <0.001 | <0.001 |
| Survey Mode | ||||||||||||
| Paper | 69% | 67% | 81% | 73% | 83% | 65% | 68% | 46% | 59% | 74% | 64% | 52% |
| Web | 66% | 67% | 79% | 72% | 82% | 65% | 69% | 47% | 53% | 72% | 61% | 47% |
| Mixed Mode | 66% | 67% | 79% | 72% | 81% | 65% | 69% | 47% | 53% | 71% | 62% | 50% |
| p-value | 0.035 | 0.723 | 0.023 | 0.316 | 0.094 | 0.845 | 0.741 | 0.656 | <.001 | 0.055 | 0.048 | <.001 |
| Staff Surveyed | ||||||||||||
| All staff/sample | 66% | 67% | 79% | 72% | 82% | 65% | 69% | 47% | 54% | 72% | 61% | 48% |
| Selected departments/units only | 67% | 66% | 79% | 73% | 84% | 63% | 66% | 46% | 54% | 71% | 63% | 49% |
| Selected staff positions only | 59% | 64% | 78% | 69% | 84% | 68% | 66% | 48% | 49% | 61% | 55% | 44% |
| Selected departments/units and selected staff | 65% | 67% | 79% | 73% | 83% | 66% | 69% | 49% | 54% | 71% | 60% | 47% |
| p-value | 0.293 | 0.604 | 0.986 | 0.486 | 0.016 | 0.064 | 0.093 | 0.262 | 0.847 | 0.315 | 0.355 | 0.877 |
| Type of Hospital | ||||||||||||
| Non-teaching hospital | 68% | 68% | 80% | 73% | 83% | 66% | 70% | 48% | 55% | 73% | 63% | 49% |
| Teaching hospital | 64% | 65% | 78% | 71% | 81% | 63% | 67% | 45% | 51% | 70% | 59% | 44% |
| p-value | <0.001 | <0.001 | <0.001 | <0.001 | <0.001 | <0.001 | <0.001 | <0.001 | <0.001 | <0.001 | <0.001 | <0.001 |
| Dimensions PSC | Measure | 2013 | 2014 | 2015 | 2016 | 2017 | 2018 | 2019 | 2020 | Overall Years | Average Change% ‡ | P-V. |
|---|---|---|---|---|---|---|---|---|---|---|---|---|
| D1: Overall Perceptions of Patient Safety | Mean (SD) | 3.76 (0.2) | 3.67 (0.2) | 3.68 (0.2) | 3.68 (0.2) | 3.70 (0.2) | 3.71 (0.2) | 3.69 (0.2) | 3.63 (0.2) | 3.68 (0.2) | −0.50 | 0.391 |
| APR% * | 70 | 66 | 66 ● | 66 ● | 67 | 67 ● | 66 | 64 | 66 | −1.25 | 0.445 | |
| ANeuR% | 17 | 17 ● | 17 ● | 18 | 18 | 17 | 18 | 18 ● | 17 | 0.89 | 0.096 | |
| ANegR% | 13 | 17 | 17 ● | 16 | 16 ● | 16 ● | 17 | 18 | 16 | 5.29 | 0.012 | |
| D2: Frequency of Events Reported | Mean (SD) | 3.85 (0.2) | 3.86 (0.2) | 3.89 (0.2) | 3.88 (0.2) | 3.89 (0.2) | 3.85 (0.2) | 3.94 (0.2) | 3.91 (0.2) | 3.89 (0.2) | 0.23 | <001 |
| APR% | 67 | 66 | 67 | 67 ● | 67 ● | 66 | 69 | 68 | 67 | 0.23 | 0.004 | |
| ANeuR% | 21 | 22 | 21 | 22 | 22 ● | 23 | 21 | 21 ● | 22 | 0.12 | 0.004 | |
| ANegR% | 12 | 12 ● | 11 | 11 ● | 11 ● | 12 | 11 | 12 | 11 | 0.22 | 0.096 | |
| D3: Supervisor/Manager Expectations and Actions Promoting Patient Safety | Mean (SD) | 3.98 (0.1) | 3.97 (0.2) | 4.00 (0.2) | 4.00 (0.2) | 4.04 (0.2) | 4.04 (0.1) | 4.05 (0.2) | 4.06 (0.1) | 4.01 (0.2) | 0.29 | <001 |
| APR% | 79 | 78 | 79 | 79 ● | 80 | 80 ● | 80 ● | 80 ● | 79 | 0.18 | <001 | |
| ANeuR% | 12 | 12 ● | 11 | 11 ● | 11 ● | 11 ● | 11 ● | 11 ● | 11 | −1.19 | 0.097 | |
| ANegR% | 9 | 10 | 10 ● | 10 ● | 9 | 9 ● | 9 ● | 9 ● | 10 | 0.16 | <001 | |
| D4: Organizational Learning | Mean (SD) | 3.84 (0.2) | 3.81 (0.2) | 3.83 (0.2) | 3.81 (0.2) | 3.83 (0.2) | 3.80 (0.1) | 3.82 (0.2) | 3.81 (0.1) | 3.82 (0.2) | −0.11 | 0.379 |
| APR% | 74 | 72 | 73 | 72 | 72 ● | 72 ● | 71 | 71 ● | 72 | −0.58 | 0.273 | |
| ANeuR% | 19 | 20 | 19 | 20 | 20 ● | 20 ● | 20 ● | 20 ● | 20 | 0.79 | 0.193 | |
| ANegR% | 7 | 8 | 8 ● | 8 ● | 8 ● | 8 ● | 8 ● | 9 | 8 | 3.83 | 0.058 | |
| D5: Teamwork within Units | Mean (SD) | 4.05 (0.1) | 4.00 (0.2) | 4.04 (0.2) | 4.05 (0.2) | 4.06 (0.2) | 4.06 (0.1) | 4.06 (0.1) | 4.04 (0.1) | 4.04 (0.2) | −0.03 | <001 |
| APR% | 83 | 81 | 82 | 82 | 82 ● | 83 | 82 | 82 ● | 82 | −0.17 | 0.74 | |
| ANeuR% | 8 | 9 | 9 ● | 9 ● | 9 ● | 8 | 9 | 9 ● | 9 | 1.98 | 0.035 | |
| ANegR% | 9 | 10 | 9 | 9 ● | 9 ● | 9 ● | 9 ● | 10 | 9 | 1.75 | 0.001 | |
| D6: Communication Openness | Mean (SD) | 3.70 (0.2) | 3.72 (0.2) | 3.75 (0.2) | 3.76 (0.2) | 3.79 (0.2) | 3.79 (0.1) | 3.81 (0.2) | 3.81 (0.2) | 3.77 (0.2) | 0.42 | <001 |
| APR% | 64 | 63 | 64 | 65 | 66 | 66 ● | 66 ● | 66 ● | 65 | 0.45 | <001 | |
| ANeuR% | 23 | 23 ● | 22 | 23 | 22 | 22 ● | 22 ● | 21 | 22 | −1.24 | <001 | |
| ANegR% | 13 | 14 | 13 | 13 ● | 12 | 12 ● | 12 ● | 13 | 13 | 0.17 | <001 | |
| D7: Feedback and Communication about Error | Mean (SD) | 3.89 (0.2) | 3.86 (0.2) | 3.89 (0.2) | 3.88 (0.2) | 3.90 (0.2) | 3.88 (0.2) | 3.92 (0.2) | 3.95 (0.2) | 3.89 (0.2) | 0.22 | 0.007 |
| APR% | 69 | 67 | 69 | 68 | 69 | 68 | 69 | 70 | 69 | 0.23 | 0.115 | |
| ANeuR% | 22 | 22 ● | 21 | 22 | 22 ● | 22 ● | 21 | 20 | 22 | −1.30 | 0.015 | |
| ANegR% | 9 | 10 | 10 ● | 10 ● | 9 | 10 | 10 ● | 10 ● | 10 | 1.75 | 0.468 | |
| D8: Nonpunitive Response to Error | Mean (SD) | 3.23 (0.2) | 3.23 (0.2) | 3.25 (0.2) | 3.30 (0.2) | 3.34 (0.2) | 3.39 (0.2) | 3.35 (0.2) | 3.28 (0.2) | 3.29 (0.2) | 0.23 | <001 |
| APR% | 46 | 45 | 46 | 47 | 48 | 51 | 49 | 46 | 47 | 0.08 | <001 | |
| ANeuR% | 27 | 27 ● | 27 ● | 28 | 28 ● | 27 | 28 ● | 27 | 27 | 0.04 | <001 | |
| ANegR% | 28 | 29 | 28 | 25 | 24 | 22 | 23 | 26 | 26 | −0.76 | <001 | |
| D9: Staffing | Mean (SD) | 3.53 (0.2) | 3.41 (0.3) | 3.37 (0.2) | 3.37 (0.2) | 3.41 (0.2) | 3.45 (0.2) | 3.39 (0.2) | 3.29 (0.2) | 3.39 (0.2) | −0.99 | 0.009 |
| APR% | 59 | 54 | 53 | 53 ● | 54 | 56 | 54 | 50 | 54 | −2.24 | 0.015 | |
| ANeuR% | 21 | 21 ● | 21 ● | 22 | 22 ● | 21 | 21 ● | 21 ● | 21 | 0.03 | <001 | |
| ANegR% | 20 | 25 | 26 | 26 ● | 24 | 23 | 25 | 29 | 25 | 5.98 | <001 | |
| D10: Management Support for Patient Safety | Mean (SD) | 3.86 (0.2) | 3.78 (0.2) | 3.81 (0.2) | 3.79 (0.2) | 3.81 (0.2) | 3.75 (0.2) | 3.74 (0.3) | 3.72 (0.2) | 3.79 (0.2) | −0.52 | 0.007 |
| APR% | 76 | 72 | 73 | 72 | 72 ● | 71 | 69 | 69 ● | 72 | −1.35 | <001 | |
| ANeuR% | 13 | 14 | 13 | 14 | 14 ● | 14 ● | 15 | 15 ● | 14 | 2.20 | <001 | |
| ANegR% | 11 | 14 | 14 ● | 14 ● | 13 | 15 | 16 | 17 | 14 | 6.92 | <001 | |
| D11: Teamwork across Units | Mean (SD) | 3.60 (0.2) | 3.56 (0.2) | 3.58 (0.2) | 3.59 (0.2) | 3.59 (0.2) | 3.55 (0.2) | 3.58 (0.2) | 3.53 (0.2) | 3.58 (0.2) | −0.28 | 0.369 |
| APR% | 64 | 61 | 62 | 62 ● | 62 ● | 60 | 61 | 59 | 61 | −1.13 | 0.566 | |
| ANeuR% | 21 | 22 | 22 ● | 22 ● | 23 | 23 ● | 23 ● | 23 ● | 22 | 1.33 | 0.069 | |
| ANegR% | 16 | 17 | 16 | 16 ● | 15 | 17 | 16 | 18 | 16 | 2.01 | 0.014 | |
| D12: Handoffs and Transitions | Mean (SD) | 3.37 (0.3) | 3.33 (0.2) | 3.33 (0.2) | 3.34 (0.2) | 3.35 (0.2) | 3.29 (0.3) | 3.35 (0.3) | 3.28 (0.2) | 3.34 (0.2) | −0.38 | 0.567 |
| APR% | 49 | 47 | 48 | 48 ● | 48 ● | 45 | 48 | 45 | 48 | −1.11 | 0.747 | |
| ANeuR% | 30 | 31 | 30 | 31 | 31 ● | 31 ● | 31 ● | 30 | 31 | 0.03 | 0.169 | |
| ANegR% | 21 | 22 | 22 ● | 22 ● | 21 | 23 | 21 | 24 | 22 | 2.19 | 0.105 |
: The average positive response % decreased compared to the previous year. : The average positive response % increased compared to the previous year. ●: Average positive response % remains the same compared to the previous year.| PSC | Two-Years | Three-Years | ||||||||||
|---|---|---|---|---|---|---|---|---|---|---|---|---|
| Change | SD | Max Increase | Max Decrease | Period One * | Period Two ‡ | |||||||
| Change | SD | Max Increase | Max Decrease | Change | SD | Max Increase | Max Decrease | |||||
| D1 | 0% | 6% | 16% | −20% | 1% | 6% | 28% | −15% | 0% | 5% | 14% | −8% |
| D2 | 0% | 6% | 23% | −23% | 1% | 4% | 14% | −10% | 1% | 5% | 13% | −12% |
| D3 | 1% | 6% | 57% | −26% | 2% | 5% | 34% | −7% | 0% | 4% | 11% | −7% |
| D4 | −1% | 7% | 15% | −39% | 1% | 4% | 18% | −13% | 0% | 4% | 11% | −8% |
| D5 | 0% | 4% | 20% | −13% | 1% | 3% | 8% | −8% | 0% | 3% | 6% | −14% |
| D6 | 1% | 5% | 22% | −23% | 2% | 5% | 18% | −7% | 0% | 4% | 15% | −9% |
| D7 | 0% | 6% | 16% | −40% | 2% | 4% | 10% | −15% | 0% | 5% | 13% | −9% |
| D8 | 2% | 6% | 16% | −16% | 4% | 5% | 25% | −8% | 0% | 5% | 14% | −11% |
| D9 | −1% | 6% | 18% | −21% | 0% | 7% | 23% | −26% | 0% | 5% | 14% | −11% |
| D10 | −1% | 7% | 19% | −24% | 0% | 5% | 16% | −16% | −1% | 5% | 15% | −13% |
| D11 | 0% | 7% | 24% | −21% | 1% | 5% | 11% | −16% | 0% | 5% | 13% | −10% |
| D12 | 0% | 7% | 27% | −19% | 1% | 5% | 13% | −15% | −1% | 5% | 17% | −9% |
| Reporting Events | ||||||||||||
| None | −2% | 8% | 47% | −27% | −1% | 6% | 25% | −16% | −1% | 6% | 16% | −16% |
| 1 or 2 | 0% | 6% | 21% | −30% | −1% | 8% | 12% | −41% | 1% | 6% | 21% | −20% |
| 3 to 5 | 1% | 5% | 22% | −20% | 2% | 4% | 20% | −6% | 0% | 5% | 8% | −23% |
| 6 to 10 | 0% | 2% | 8% | −8% | 0% | 2% | 4% | −4% | 1% | 2% | 5% | −4% |
| 11 to 20 | 0% | 2% | 12% | −14% | 1% | 2% | 8% | −3% | 0% | 2% | 3% | −8% |
| ≥21 | 0% | 1% | 4% | −4% | 0% | 1% | 5% | −2% | 0% | 1% | 3% | −5% |
| Safety Grade | ||||||||||||
| A: Excellent | 2% | 8% | 27% | −30% | 2% | 6% | 19% | −13% | 0% | 6% | 18% | −19% |
| B: Very Good | 0% | 7% | 39% | −29% | −1% | 6% | 15% | −24% | −1% | 5% | 14% | −19% |
| C: Acceptable | 0% | 6% | 34% | −17% | 0% | 4% | 11% | −12% | 0% | 4% | 11% | −12% |
| D: Poor | 0% | 4% | 10% | −38% | 0% | 2% | 6% | −6% | 0% | 2% | 4% | −6% |
| E: Failing | 0% | 3% | 8% | −29% | 0% | 1% | 5% | −2% | 0% | 1% | 1% | −5% |
Disclaimer/Publisher’s Note: The statements, opinions and data contained in all publications are solely those of the individual author(s) and contributor(s) and not of MDPI and/or the editor(s). MDPI and/or the editor(s) disclaim responsibility for any injury to people or property resulting from any ideas, methods, instructions or products referred to in the content. |
© 2025 by the authors. Licensee MDPI, Basel, Switzerland. This article is an open access article distributed under the terms and conditions of the Creative Commons Attribution (CC BY) license (https://creativecommons.org/licenses/by/4.0/).
Share and Cite
Alabdullah, H.; Karwowski, W. Unraveling Patient Safety Culture Trends in U.S. Hospital Settings: A Yearly Retrospective Analysis. Appl. Sci. 2025, 15, 5365. https://doi.org/10.3390/app15105365
Alabdullah H, Karwowski W. Unraveling Patient Safety Culture Trends in U.S. Hospital Settings: A Yearly Retrospective Analysis. Applied Sciences. 2025; 15(10):5365. https://doi.org/10.3390/app15105365
Chicago/Turabian StyleAlabdullah, Hassan, and Waldemar Karwowski. 2025. "Unraveling Patient Safety Culture Trends in U.S. Hospital Settings: A Yearly Retrospective Analysis" Applied Sciences 15, no. 10: 5365. https://doi.org/10.3390/app15105365
APA StyleAlabdullah, H., & Karwowski, W. (2025). Unraveling Patient Safety Culture Trends in U.S. Hospital Settings: A Yearly Retrospective Analysis. Applied Sciences, 15(10), 5365. https://doi.org/10.3390/app15105365