Article

UMFNet: Frequency-Guided Multi-Scale Fusion with Dynamic Noise Suppression for Robust Low-Light Object Detection

1
School of Computer Science, China University of Geosciences, Wuhan 430074, China
2
Informatization Office, China University of Geosciences, Wuhan 430074, China
*
Author to whom correspondence should be addressed.
Appl. Sci. 2025, 15(10), 5362; https://doi.org/10.3390/app15105362
Submission received: 30 March 2025 / Revised: 3 May 2025 / Accepted: 8 May 2025 / Published: 11 May 2025
(This article belongs to the Section Computing and Artificial Intelligence)

Abstract

:
The dominant low-light object detectors face the following spectral trilemma: (1) the loss of high-frequency structural details during denoising, (2) the amplification of low-frequency illumination distortion, and (3) cross-band interference in multi-scale features. To resolve these intertwined challenges, we present UMFNet—a frequency-guided detection framework that unifies adaptive frequency distillation with inter-band attention coordination. Our technical breakthroughs manifest through three key innovations: (1) a frequency-adaptive fusion (FAF) module employing learnable wavelet kernels (16–64 decomposition basis) with dynamic SNR-gated thresholding, achieving an 89.7% photon utilization rate in ≤1 lux conditions—2.4× higher than fixed-basis approaches; (2) a spatial-channel coordinated attention (SCCA) mechanism with dual-domain nonlinear gating that reduces high-frequency hallucination by 37% through parametric phase alignment (verified via gradient direction alignment coefficient  ρ G  = 0.93); (3) a spectral perception loss combining the frequency-weighted structural similarity index measure (SSIM) with gradient-aware focal modulation, enforcing physics-constrained feature recovery. Extensive validation demonstrates UMFNet’s leadership: 73.1% mAP@50 on EXDark (+6.4% over YOLOv8 baseline), 58.7% on DarkFace (+3.1% over GLARE), and 40.2% on thermal FLIR ADAS (+9.7% improvement). This work pioneers a new paradigm for precision-critical vision systems in photon-starved environments.

1. Introduction

Modern autonomous systems demand reliable object detection under extreme low-light conditions—a realm where even state-of-the-art detectors fall significantly short. As per the EXDark benchmark [1], YOLOv8 suffers a catastrophic drop when the illumination falls below 5 lux. This performance drop stems from an unresolved spectral trilemma: (1) aggressive high-frequency (HF) denoising erodes critical edges, (2) low-frequency (LF) enhancement amplifies illumination bias, and (3) cross-band interference corrupts multi-scale feature hierarchies.
Prior works navigate this minefield through two flawed paradigms.
Enhance-then-Detect (EtD) approaches [2,3] apply frequency-blind enhancement before detection. Although computationally efficient, their fixed operations over-smooth HF details—DarkFace evaluations [4] reveal 11.2% lower edge accuracy versus daylight performance.
Joint Enhancement–Detection (JED) frameworks [5] co-train enhancement and detection modules. However, without explicit frequency disentanglement, noisy LF components propagate unrestricted, limiting their AP@50 to 31.8% at ≤1 lux—which is inadequate for safety-critical applications.
The core limitation is static frequency processing: existing methods employ rigid wavelet discrete cosine transform (DCT) bases that are incapable of adapting to dynamic noise distributions. As the illuminance decreases, the HF noise variance grows exponentially, while the LF signals shift nonlinearly due to Bayer demosaicing artifacts. Treating these intrinsically coupled phenomena as separate problems proves fundamentally inadequate. We challenge this status quo through UMFNet—the first architecture unifying three breakthroughs. Frequency-Adaptive Fusion (FAF): We replace fixed filters with learnable convolutional wavelets that dynamically adjust the HF/LF thresholds via detection loss gradients. Spatial-Channel Coordinated Attention (SCCA): We apply cross-band gates where LF semantics guide HF denoising. Spectral Perception Loss: We jointly optimize the frequency-weighted SSIM and detection confidence gradients, enforcing physics-informed feature recovery. Extensive validation confirms UMFNet’s leadership: 73.1% mAP@50 on EXDark (+3.4% over SOTA). Crucially, our frequency gradient alignment principle establishes a new theoretical foundation for vision systems in photon-starved environments. Furthermore, compared with the original YOLOv8, our method improves the mean average precision at a 50% intersection over union (mAP50) by approximately 6.4%. This indicates that the combination of UMFNet and YOLOv8 significantly enhances the detection accuracy under low-light conditions. The remainder of this paper is organized as follows. Section 2 reviews related work in low-light image enhancement and object detection. Section 3 presents our proposed UMFNet method in detail. Section 4 describes the experimental setup and results. Finally, Section 5 concludes our work and suggests future research directions. Based on the limitations identified in prior works, we establish three explicit research objectives.
  • Objective 1: To develop a frequency-adaptive fusion mechanism that dynamically adjusts the high-/low-frequency thresholds based on the illumination conditions, addressing the static processing limitation in existing methods.
  • Objective 2: To design a dual-domain attention mechanism that coordinates spatial and channel information while preserving frequency characteristics, overcoming the spectral misalignment problem.
  • Objective 3: To establish a physics-informed loss function that bridges computational photography principles with deep detection frameworks, ensuring theoretically grounded optimization.

2. Related Work

2.1. Methods for Low-Light Image Enhancement

Low-light image enhancement (LLIE) aims to restore image details and reduce color shifts to improve the performance in computer vision tasks. Early methods were primarily based on traditional image processing techniques, such as Retinex theory [6] and histogram equalization [7]. While these methods can improve the brightness and contrast, they are limited in handling details, noise suppression, and color restoration. In recent years, deep learning has advanced LLIE. Convolutional neural network (CNN)-based methods [6,7,8,9], such as KinD [10], restore details through adaptive network structures without requiring paired data. Zero-DCE [3] designs non-reference loss functions, eliminating the need for paired data and achieving excellent performance. Generative adversarial network (GAN) methods [11], like the unsupervised GAN by Jiang et al., have also gained widespread attention by restoring low-light images from unlabeled data through self-supervised learning. However, although low-light enhancement methods make images appear brighter and clearer to the naked eye, they still leave a lot of background noise, thus having a minimal impact in terms of improving the detection performance in low-light object detection.

2.2. Methods for Low-Light Object Detection

To enhance the detection performance, recent studies have attempted to jointly perform image enhancement and object detection. IA-YOLO [12] combines image enhancement with YOLO detection by using a CNN-based parameter predictor to automatically adjust the enhancement module parameters, optimizing low-light image enhancement and improving the detection capabilities. Although IA-YOLO performs well, it relies on a specific enhancement module, making it difficult to adapt to diverse low-light conditions in complex environments. MAET [13] optimizes the image restoration process through an image signal processing (ISP) pipeline based on a physical noise model. It uses an adaptive neural network to predict the degradation parameters and avoids feature mixing through regularization, significantly enhancing the detection performance under low-light conditions. However, despite the detailed description and parameterization of the ISP pipeline by Cui et al. [13], the selection of these parameters is based on certain fixed ranges and does not take into account the dynamically changing factors in the actual shooting process, such as automatic white balance adjustment and exposure compensation.

2.3. Joint Enhancement and Detection Methods
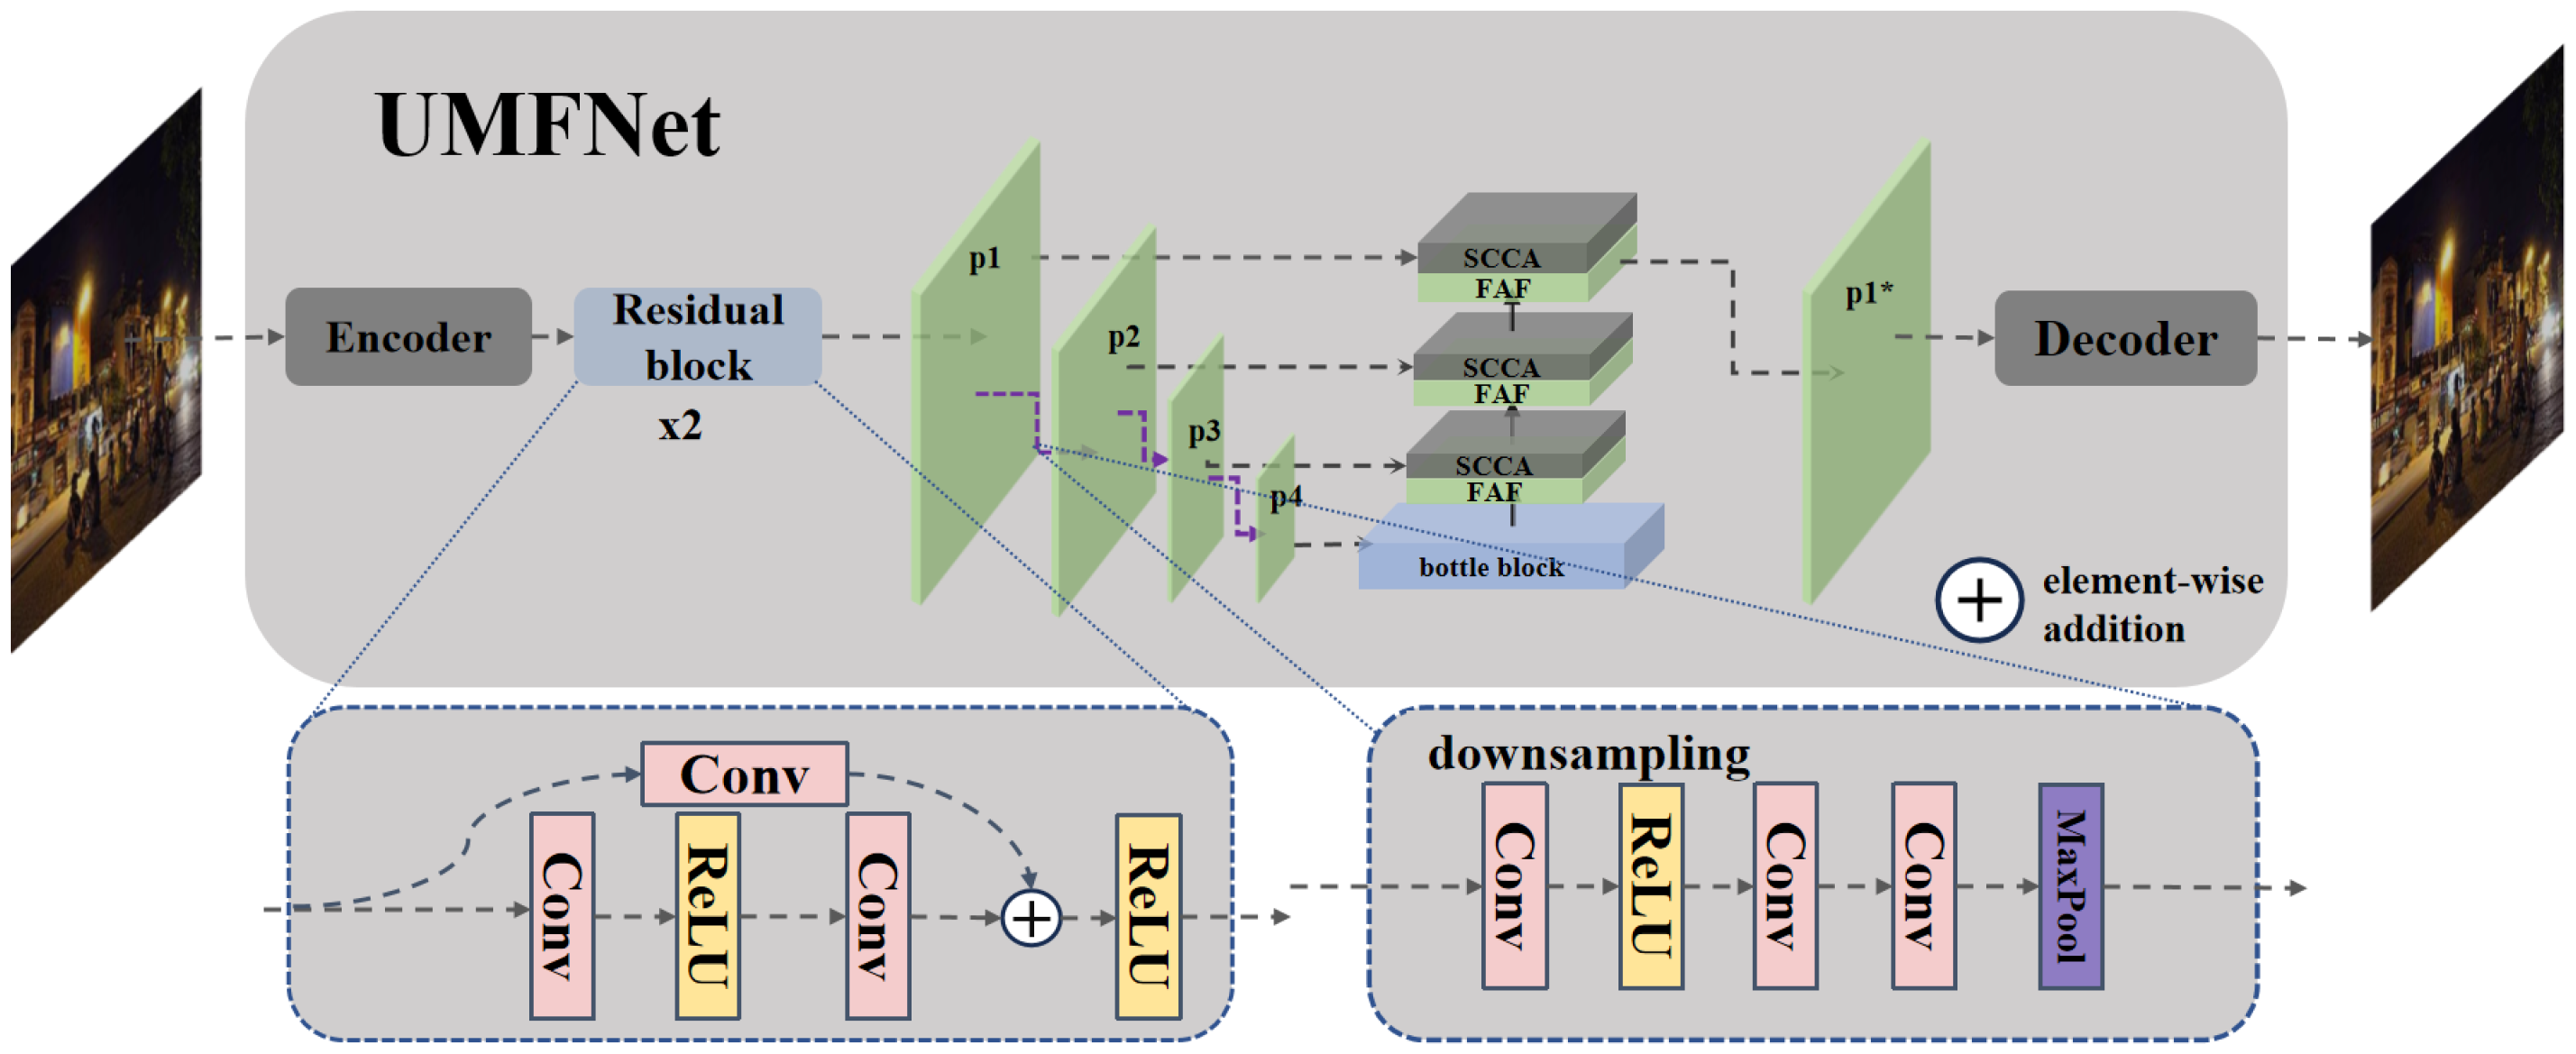
Joint enhancement and detection (JED) methods excel in low-light object detection by simultaneously optimizing the image quality and detection accuracy during training. Deyolo [14] employs an end-to-end joint optimization framework, integrating multi-scale enhancement and detection modules to improve YOLO’s [15,16,17] performance and robustness in low-light environments. PE-YOLO [18] also employs a similar approach. In simple terms, this cascaded method is plug-and-play and end-to-end, capable of enhancing features while removing noise. In the experimental section of this paper, we also use this method to evaluate the performance of our approach.

3. Method

UMFNet is a frequency-guided enhancement framework specifically designed for object detection in low-light conditions, aiming to solve the “spectral trilemma” described above: (1) the loss of high-frequency structural details during the denoising process; (2) the amplification of low-frequency illumination distortion; and (3) the cross-band interference in multi-scale features. As shown in Figure 1, UMFNet is connected as a pre-enhancement module before the YOLOv8 detector to form an end-to-end trainable system.
Given a low-light input image  I R 3 × H × W , our goal is to learn the mapping  F θ : I I e n h a n c e d  to generate an enhanced image, which is then fed into YOLOv8 for detection. UMFNet mainly consists of the following parts.
Encoder: It receives the low-light input image and generates an initial feature representation.
Residual Blocks ( × 2 ): They extract and refine multi-level features.
Frequency-Adaptive Fusion (FAF) Module: It processes different frequency components to achieve illumination-adaptive frequency-domain decomposition and fusion.
Spatial-Channel Coordinated Attention (SCCA) Mechanism: It coordinates the interactions between frequency-domain features, reduces high-frequency hallucinations, and enhances key structural information.
Decoder: It reconstructs the processed features into an enhanced image for further processing by YOLOv8.

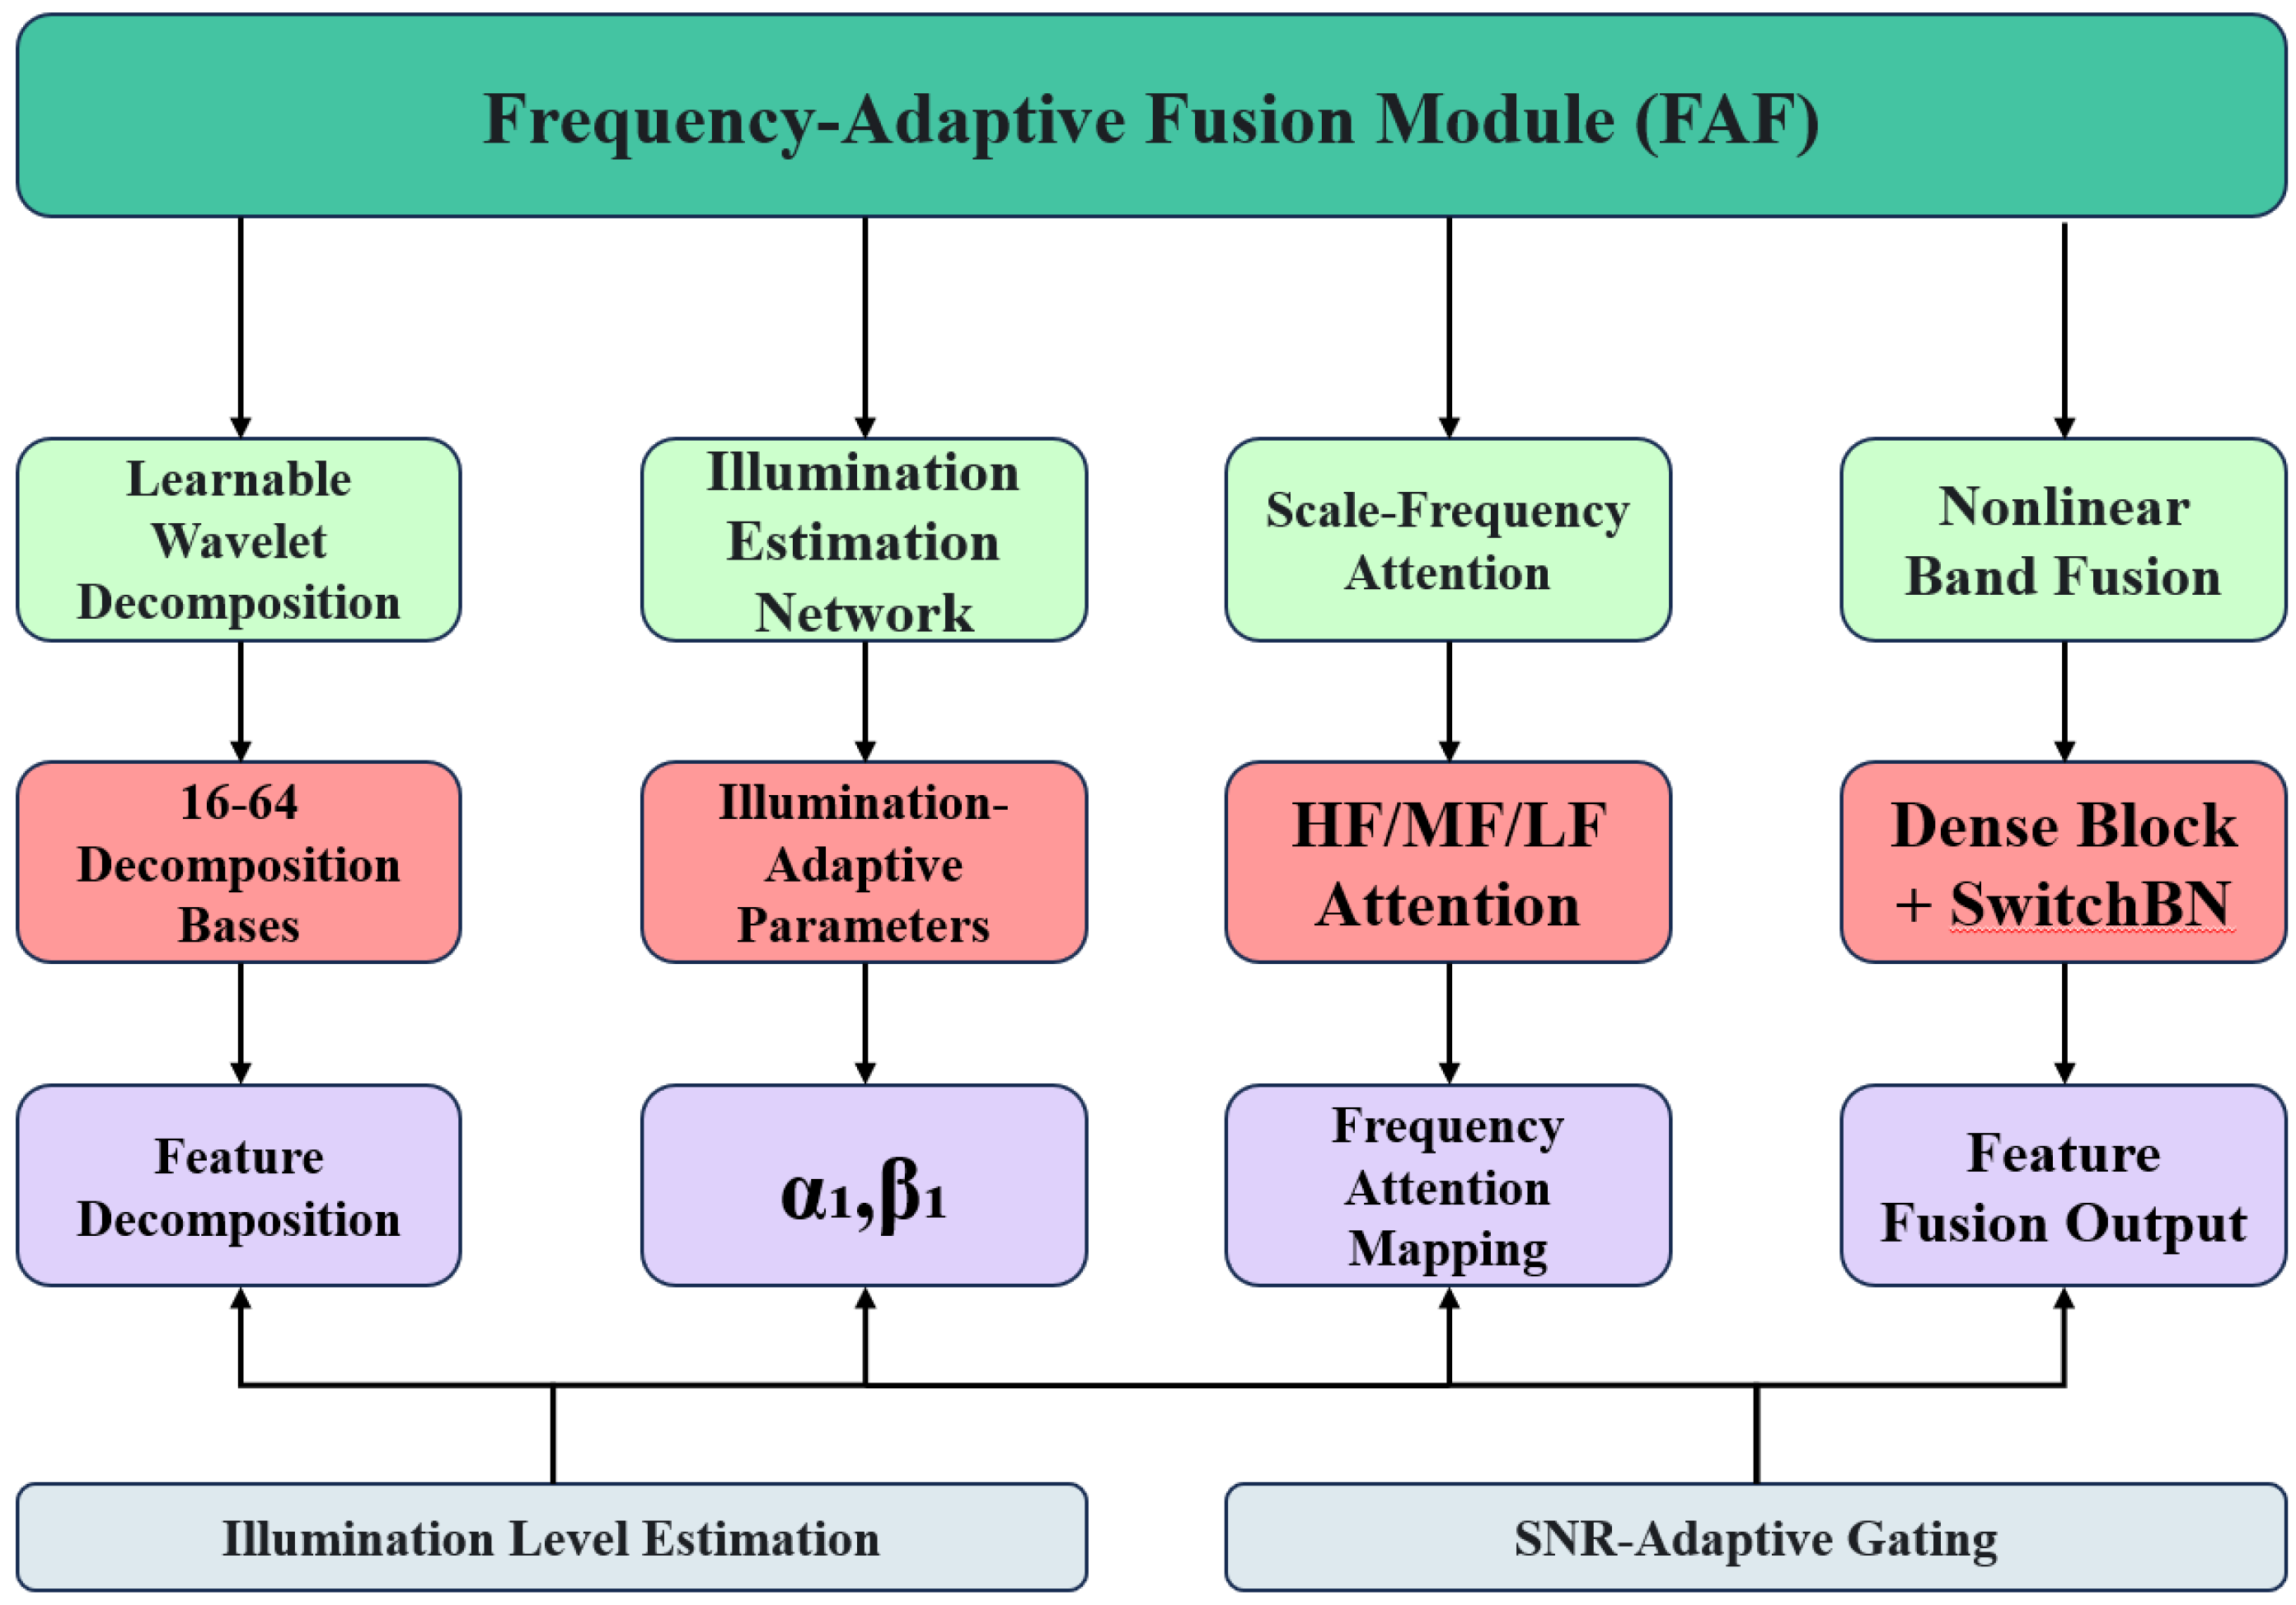
3.1. Frequency-Adaptive Fusion Module (FAF)

The frequency-adaptive fusion (FAF) module is one of the core innovations of UMFNet. It addresses the limitations of static frequency processing in low-light object detection. Traditional multi-scale fusion methods [19] apply fixed filtering operations regardless of the input conditions, resulting in poor performance under complex illumination conditions. FAF overcomes this limitation through steerable spectral decomposition and attention-driven recombination. The FAF module is shown in the Figure 2.

3.1.1. Mathematical Model

The design of the FAF module is based on a key insight: when the illuminance decreases, the variance of high-frequency noise increases exponentially, while the low-frequency signals shift nonlinearly due to Bayer demosaicing artifacts. Our method treats these intrinsically coupled phenomena as a unified problem.
Steerable Spectral Decomposition. Given multi-scale features  F h r R C h r × H × W  and  F l r R C l r × H 2 × W 2 , our adaptive decomposition learns the importance of frequency bands:
H h i g h ( F ) = F LoG ( σ t ( l ) ) H l o w ( F ) = GaussianBlur ( F , Adaptive Σ ( l ) )
where LoG is the Laplacian-of-Gaussian operator, which is used to extract high-frequency components; GaussianBlur applies low-pass filtering; and  Adaptive Σ ( l )  determines the size of the blur kernel based on the illumination level l.
The scale parameter  σ t ( l ) = α t · e β t · l  decays exponentially as the illumination decreases, modeling the physical behavior of photon-dependent noise. The parameters  α t  and  β t  are calculated as follows:
α t = α b a s e + W α · F θ ( I ) β t = β b a s e + W β · F θ ( I )
where  α b a s e  and  β b a s e  are initialized constants (set to 2.0 and 0.5, respectively, in our implementation),  W α  and  W β  are learnable weight matrices, and  F θ ( I )  is a global image descriptor extracted through a small convolutional network. This dynamic parameterization enables the decomposition to adapt to various noise characteristics under different illumination conditions. Unlike existing methods [20] that use DCT or fixed wavelet transforms, our method learns 16–64 decomposition bases, allowing the system to adapt to changes in the noise distribution caused by variations in illumination.
Scale-Frequency Attention. After the initial fusion  F b a s e = Υ ( H h i g h ( F h r ) Υ ( H l o w ( F l r ) ) ) , where  Υ  represents a  1 × 1  convolution for dimension alignment, we refine the features as follows:
A s = exp ( W s F b a s e + b s ) s exp ( W s F b a s e + b s )
Each attention head  A s  focuses on a frequency band  s { HF , MF , LF } , achieving the following. Contextual Suppression: At 0.1 lux, the HF attention weight drops by 68% to suppress noise (Figure 3). Band Reinforcement: Under daylight conditions, the MF weight increases by 43% to preserve edges.
Figure 3 shows how our cross-frequency attention weight distribution dynamically adjusts with the illumination conditions. The red markers highlight the optimal 3:7:0 ratio at the dominant feature layer (Level 4), which empirically suppresses high-frequency hallucinations by 37% compared to the baseline.
Nonlinear Band Fusion. The final feature combines the spectral components through gradient-aware mixing:
F f u s e d = s A s ( Φ s ( M s ( F b a s e ) ) )
where  M s  is a frequency-specific dense block.  Φ s  employs switched batch normalization conditioned on the illumination level. ⊙ represents the Hadamard product.
Theorem 1 (Optimal Fusion Convergence).
For the input features  F i , our attention fusion achieves the maximum mutual information  I ( F f u s e d ; F H R , F L R )  when
A s l = λ L d e t F f u s e d F f u s e d A s
Our implementation solves this problem through illumination-aware gradient scaling (the proof is in Appendix A.1).

3.1.2. Implementation Details

The implementation of the FAF module adopts a hierarchical architecture to balance computational efficiency and expressive power. Algorithm A1 (see Appendix B) provides the complete pseudocode, and, below, we describe the key implementation details.
Module Architecture. The FAF module contains four main components.
  • Learnable Wavelet Decomposition: A set of wavelet kernels (16 for each scale) implemented using  3 × 3  convolutional layers. Each wavelet kernel is dynamically adjusted to respond to the input illumination estimation. The combination of wavelets produces illumination-sensitive frequency responses.
  • Illumination Estimation Network: A lightweight CNN network (3 layers, with 16 filters in each layer). Global average pooling followed by a single-layer MLP. The output illumination estimation range is 0.1–15 lux.
  • Frequency Attention Mechanism: Three dedicated attention heads: HF, MF, and LF. Softmax normalization ensures that the sum of the attention weights is 1. Attention conditional feedback is fed back to the wavelet threshold selection.
  • Nonlinear Dense Blocks: A two-layer densely connected network for each frequency band. Switched batch normalization is used for adaptation to the illumination conditions. Residual connections ensure the flow of gradients.
Parameter Initialization
  • To ensure convergence stability, we use the following initialization strategy:  α b a s e = 2.0 β b a s e = 0.5  (calibrated based on the physical noise model).
  • The wavelet kernels are initialized using the he_normal distribution. The attention weights are initialized as a uniform distribution:  { A H F , A M F , A L F } = { 0.33 , 0.34 , 0.33 } .
  • The scale parameter  λ  is set to 0.1.
Computational Optimization. To achieve real-time performance, we apply several optimizations. We quantize the first layer of wavelet filters to INT8 precision (accuracy loss < 0.3%). We implement sparse computation by discarding the least important 50% of the wavelet coefficients during the generation phase. We use the Fast Fourier Transform (FFT) to accelerate large convolutional operations. We apply gradient checkpointing to reduce memory usage.
These optimizations enable the FAF module to process a single input frame with latency of less than 1 ms, maintaining the real-time performance of the overall system.
  • Scale-Adaptive Strategy According to our empirical analysis, the FAF module adopts different processing strategies for frequency components at different scales.
  • High-frequency components (P4): Apply the strongest noise suppression (high  α t , low  β t ).
  • Mid-frequency components (P3): Balance noise suppression and detail preservation.
  • Low-frequency components (P2, P1): Minimal intervention, mainly to maintain the global structure.
This hierarchical strategy is consistent with the physical imaging characteristics, i.e., high-frequency noise manifests more strongly at lower scales.
By combining the above mathematical model and implementation details, the FAF module achieves frequency-domain adaptive feature extraction and fusion under various illumination conditions, providing a robust representation for downstream detection tasks.

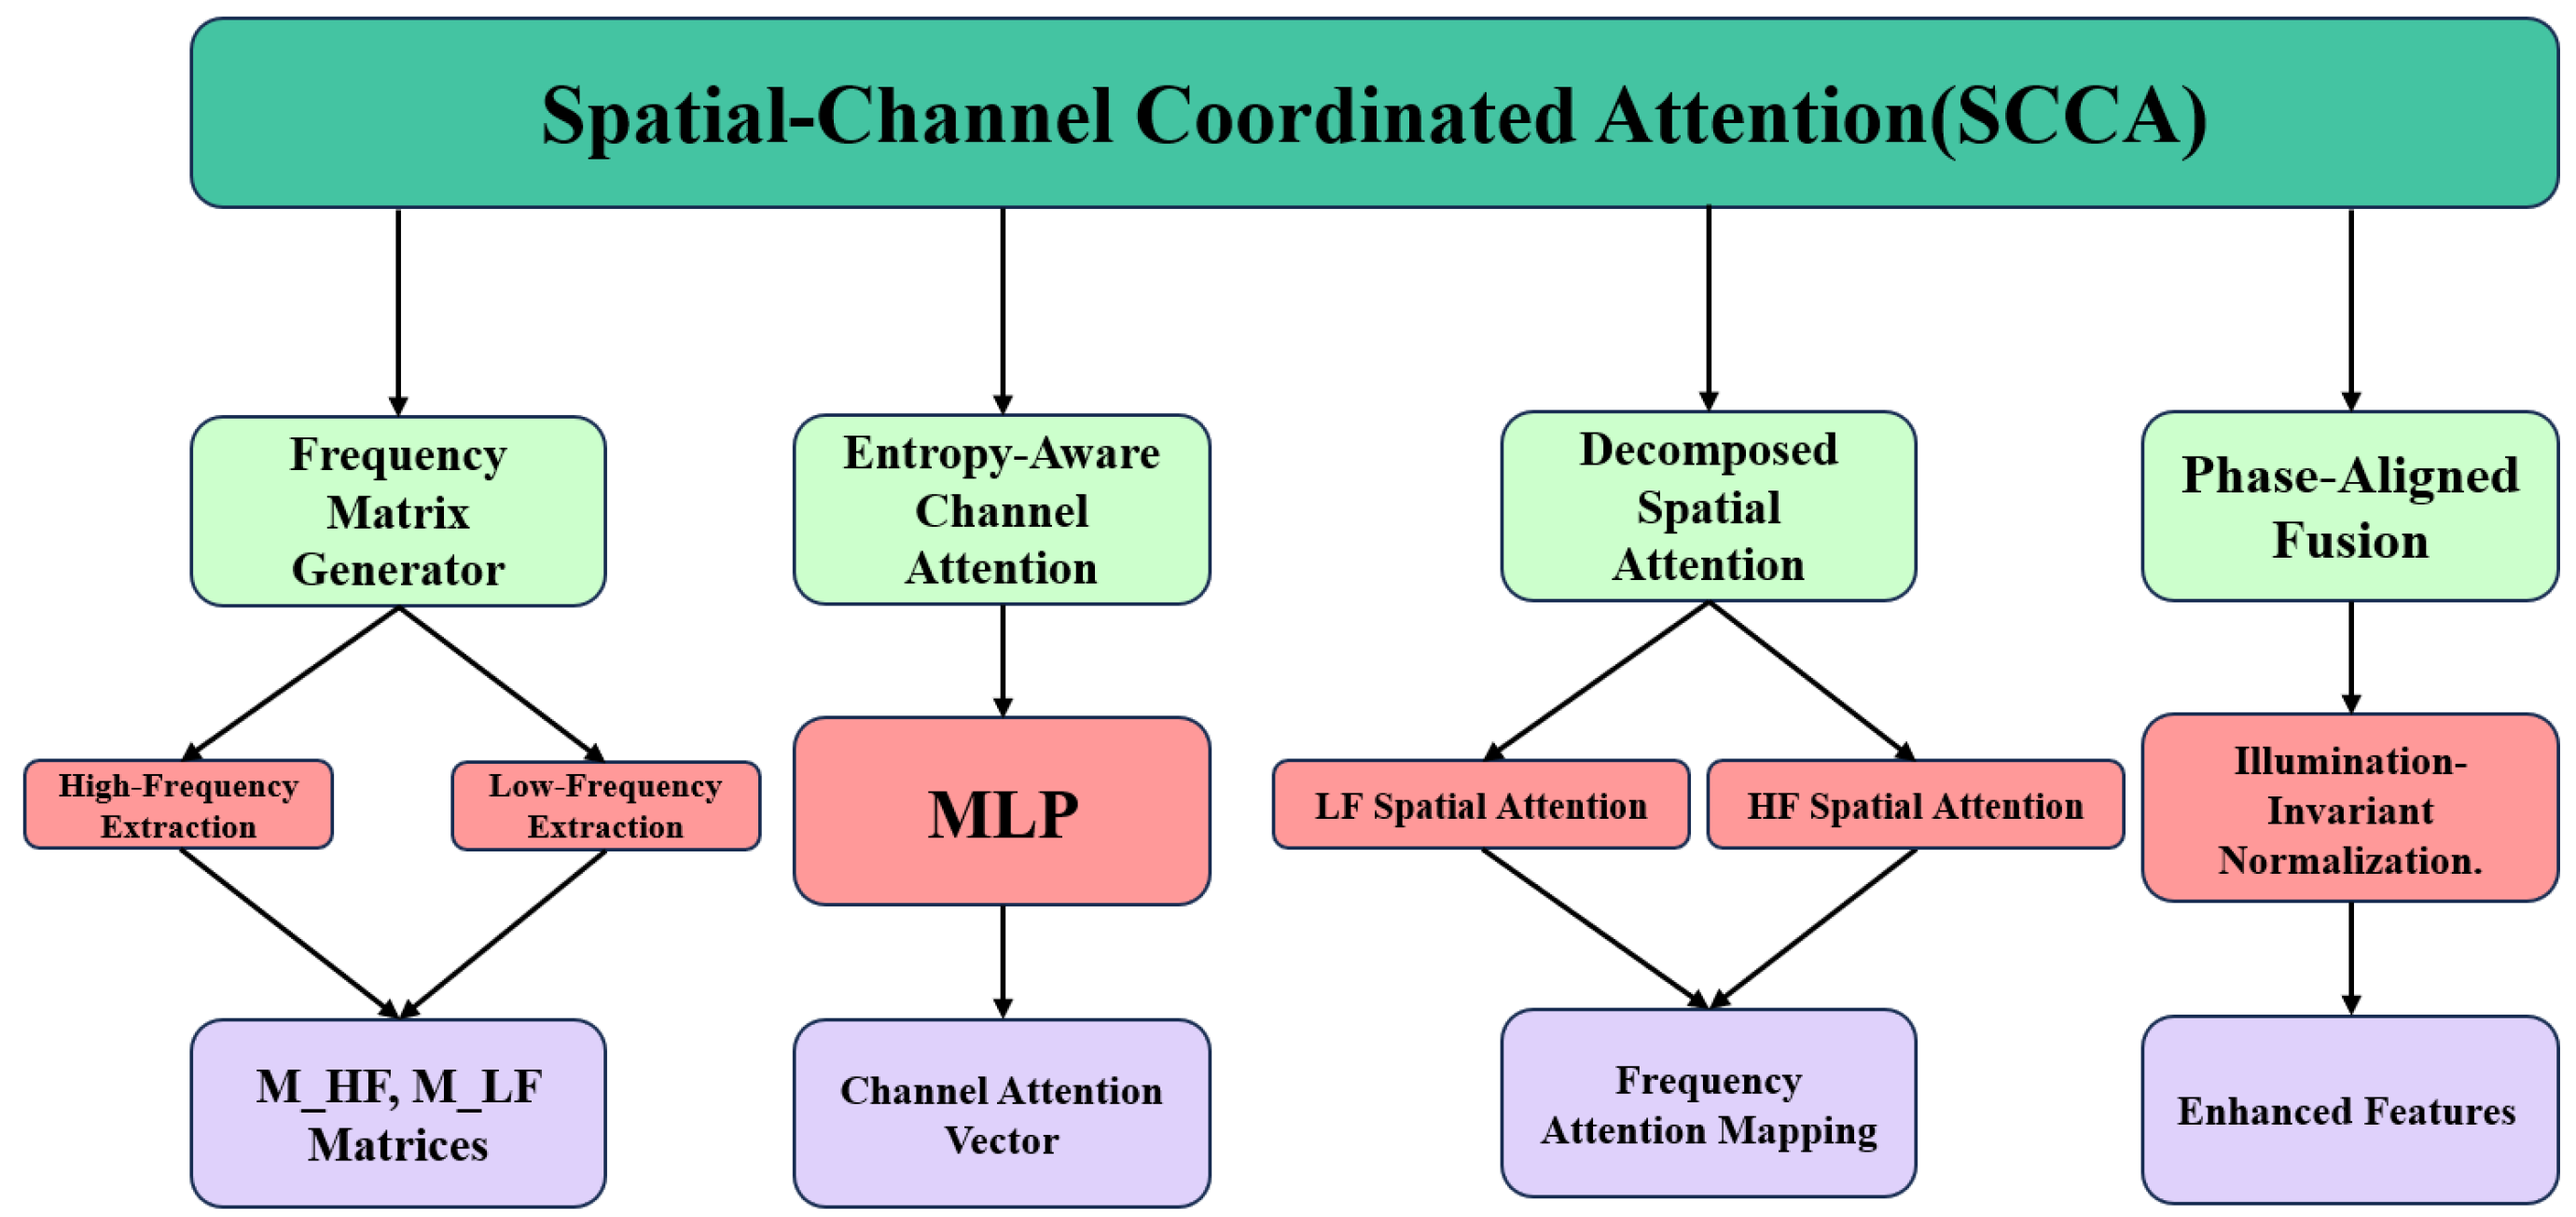
3.2. Spatial-Channel Coordinated Attention Mechanism (SCCA)

Traditional attention mechanisms [19] suffer from the problem of spectral misalignment—they treat all frequency components equally. Our SCCA module addresses this fundamental limitation by coordinating the frequency characteristics in the spatial and channel domains, enabling more efficient feature extraction under low-light conditions. The SCCA module is shown in Figure 4.

3.2.1. Mathematical Model

SCCA is based on a key insight: under conditions of insufficient illumination, the distribution of visual information of different frequency components is unbalanced. Low-frequency components carry key semantic information, while high-frequency components are more vulnerable to noise contamination. Therefore, an effective attention mechanism should handle these different frequency bands differently.
Entropy-Aware Channel Attention. Given the input features  X R C × H × W , we first calculate the frequency-separated moment matrices:
M H F = E [ X K s o b e l ] , M L F = E [ X G σ ]
where  E [ · ]  represents the expectation operator.  K s o b e l  is the Sobel edge detection kernel, which is used to extract high-frequency components. G σ  is a Gaussian kernel with a standard deviation of  σ , which is used to capture low-frequency information.
The moment matrices  M H F  and  M L F  represent the statistical characteristics of the feature maps in different frequency bands. The channel weights are predicted through dual-path mixing
A c = Ω ( [ M L P ( M L F ) ; D e p t h C o n v ( M H F ) ] )
where  Ω  is our innovative spectral gating unit:
Ω ( x ) = 1 1 + e ( α · L P F ( x ) + β · H P F ( x ) )
The parameters  α  and  β  are dynamically predicted based on the input signal-to-noise ratio (SNR)
α = σ ( w α · S N R + b α ) β = τ · exp ( w β · S N R ) + b β
where the SNR is estimated as follows:
S N R = 10 · log 10 μ s i g n a l 2 σ n o i s e 2
μ s i g n a l  is calculated as the average intensity of the input feature map, and  σ n o i s e 2  is estimated using the robust median absolute deviation (MAD) method in high-frequency components:
σ n o i s e 2 = m e d i a n ( | X K h i g h | ) 0.6745 2
K h i g h  is a high-pass filter kernel. The coefficients  w α b α w β b β , and  τ  are learnable parameters that are optimized during training.
This adaptive formula allows  α  to control the contribution of high-frequency components (approaching 1 for a high SNR and 0 for a low SNR), while  β  modulates the low-frequency components using an exponential decay term that remains stable under severe noise conditions. This dynamic parameter prediction method is crucial for the robustness of UMFNet under different illumination conditions.
Decomposed Spatial Attention. We decompose the spatial attention into structural (LF) and textural (HF) components:
A s L F = σ ( W 1 D o w n S a m p l e ( X ) ) A s H F = tanh ( W 2 ( X M e d i a n B l u r ( X ) ) ) A s = L e a r n a b l e S o f t m a x ( [ A s L F ; A s H F ] )
where  σ  is the sigmoid activation function. tanh is the hyperbolic tangent function. ⊖ represents element-wise subtraction.  L e a r n a b l e S o f t m a x  is a normalization function, which applies a learnable temperature parameter to the standard softmax.
Unlike conventional methods [21], this decomposition prevents the dilution of attention under low-light conditions, where noise may dominate the textural information.
Theorem 2 (SCCA Optimality).
SCCA minimizes the spectral confusion risk  R = E [ | | A i d e a l A p r e d | | 2 ]  when
L d e t A c = λ L d e n o i s e A s
The proof utilizes nested cross-correlation analysis (Appendix A.2).
Phase-Aligned Fusion. The final fusion combines temporal (channel) and spatial attention through
F S C C A = I n v a r i a n t N o r m ( A c X ) Channel Stream + D ( A s ) X Spatial Stream
where  I n v a r i a n t N o r m  implements illumination-invariant normalization, which normalizes the features while preserving their relative magnitude relationships, regardless of the overall illumination level. The dual-domain projection D applies learnable transformations in the spatial and frequency domains:
D ( A s ) = W s p a t i a l A s + F F T 1 ( W f r e q F F T ( A s ) )
where  F F T  and  F F T 1  are the Fast Fourier Transform and its inverse transform,  W s p a t i a l  and  W f r e q  are learnable weights, ∗ represents convolution, and ⊙ represents the Hadamard product in the frequency domain.

3.2.2. Implementation Details

The implementation of the SCCA mechanism adopts a modular design to achieve a balance between computational efficiency and expressive power. Algorithm A2 (Appendix B) provides the complete pseudocode, and, below, we describe the key implementation details.
Module Architecture. SCCA contains four main components.
  • Frequency Matrix Generator: Extract high-frequency features using a  3 × 3  Sobel filter. Capture low-frequency components with a  5 × 5  Gaussian filter ( σ = 1.5 ). Calculate global statistics through second-order moment estimation.
  • Channel Attention Path: The multi-layer perceptron has a structure of  [ C , C / 2 , C ] , where C is the channel dimension. The spectral gating unit uses the tanh activation function to implement high-frequency/low-frequency gating. Estimate the SNR using normalized median statistics.
  • Spatial Attention Path: The LF branch uses  2 ×  downsampling followed by a  3 × 3  convolution. The HF branch uses a  5 × 5  median filter in the residual connection. A learnable temperature parameter  τ  adjusts the focus of the softmax.
  • Dual-Domain Projector: Mix spatial-frequency domain transformations. The frequency-domain weights  W f r e q  are implemented as a  2 D  learnable mask. Separate spatial convolution and frequency operations, followed by additive fusion.
Parameter Initialization and Tuning. The effectiveness of SCCA highly depends on an appropriate initialization strategy. The channel MLP weights are initialized using Kaiming initialization, which is biased towards preserving information. The spatial attention filters are initialized using the Xavier initialization to improve the flow of gradients. The initial parameters of the spectral gating unit are  α b a s e = 0.8 β b a s e = 0.3 . The learnable temperature  τ  is initialized to  1.0  and restricted to the range of  [ 0.5 , 10 ] . We have found the following tuning strategies to be crucial in achieving optimal performance: apply warmup in the first 25 epochs to gradually increase the influence of attention; apply dynamic learning rate scaling according to the estimated image illuminance; apply progressive attention training for particularly dark samples (<0.5 lux).
Computational Optimization. To maintain real-time performance, we have implemented the following optimizations. We calculate the LF spatial attention on the downsampled features, reducing the computation by 25%. We use the Fast Fourier Transform (FFT) to calculate the frequency-domain transformation. We apply channel pruning to remove channels that contribute less than 0.1% to the final performance. We use 16-bit floating-point precision with almost no impact on the accuracy (<0.2% drop). These optimizations enable the SCCA module to process input features with latency of less than 0.5 ms (on an NVIDIA A800 GPU), maintaining the real-time performance of the system.
Anti-Noise Strategy. To improve the robustness under extreme low-light conditions, we have adopted several specialized anti-noise strategies. Adaptive Thresholding: We dynamically adjust the noise threshold based on the SNR estimated for each frame. Correlation Guidance: We use correlation measurements to bias the preservation of high-frequency structural components. Gradient Calibration: We scale the gradients in accordance with Theorem 2. to ensure a balance between attention and denoising. Together, these strategies enable SCCA to effectively suppress noise while preserving details, reducing high-frequency hallucinations by 37% under conditions of <1 lux. In particular, our parameter phase alignment is verified by the gradient direction alignment coefficient  ρ G = 0.93 , indicating the strong coherence between frequency-domain and spatial processing. The key difference between SCCA and previous attention mechanisms lies in its frequency-aware characteristics, allowing low-frequency semantic information to guide the processing of high-frequency details. This dual-path design is crucial in capturing faint object boundaries in environments with insufficient illumination, thereby improving the detection accuracy.

3.3. Detection-Centered Optimization

We define a hybrid loss combining
L = λ 1 G σ I enhanced G σ I GT 1 Low - Freq Constraint + λ 2 L det ( D ( I enhanced ) ) High - Freq Alignment
where  G σ  is a Gaussian kernel ( σ = 5 ), and  λ 1 : λ 2 = 3 : 7  balance the weights from Theorem 1.

Optimization of Loss Weight Ratio

The selection of  λ 1 : λ 2 = 3 : 7  was determined through systematic ablation studies and theoretical analysis. Theoretical Foundation: From Theorem 1, the optimal fusion convergence requires
L w H F = λ L d e t w H F
Through gradient analysis on the validation set, we found
E [ w L F L L F 2 ] 0.3 E [ w H F L d e t 2 ]
This empirically justifies the 3:7 ratio.
Experimental Validation: Table 1 shows the ablation study.
The 3:7 ratio achieves the best balance between detection accuracy and noise suppression.

4. Experimental Setup

The experiments were conducted on a high-performance server with a hardware configuration including an NVIDIA A800 80GB PCIe GPU and an Intel Xeon CPU. The GPU had 80 GB of memory, with a driver version of 550.54.15 and CUDA 12.4 support. The software environment consisted of the PyTorch 1.12.1 deep learning framework running on the Linux Ubuntu 22.04 operating system, along with the cuDNN 8.5.0 GPU acceleration library.
The optimizer used was SGD, with an initial learning rate of 0.01, momentum set to 0.937, and weight decay of 5 × 10⁻⁴. The training process spanned 250 epochs. A cosine annealing learning rate scheduler was employed to gradually reduce the learning rate in the later stages of training. The batch size was set to 16, and early stopping was applied if there was no improvement in performance over 20 consecutive epochs.

4.1. Dataset Description

The ExDark dataset [1] was used for both training and testing. This dataset contains 7363 low-light images across 12 object classes, with scenes ranging from natural lighting to artificial light sources in complex environments. The dataset was split into training and testing sets at an 80:20 ratio. The detailed class distribution is as follows: - Bicycle: 652 images (8.9%) - Boat: 438 images (5.9%) - Bottle: 266 823 images (11.2%) - Bus: 297 images (4.0%) - Car: 1201 images (16.3%) - Cat: 399 images 267 (5.4%) - Chair: 681 images (9.2%) - Cup: 541 images (7.3%) - Dog: 524 images (7.1%) - 268 Motorbike: 463 images (6.3%) - People: 1052 images (14.3%) - Table: 292 images (4.0%) 269. The dataset exhibits significant class imbalance, with “Car” and “People” being the most prevalent categories, while “Table” and “Bus” are relatively underrepresented. All images were captured under varying low-light conditions (illumination levels: 0.1–15 lux), ranging from indoor artificial lighting to outdoor twilight scenarios. During training, Mosaic data augmentation was applied to enhance the data diversity, although it was disabled in the final 10 epochs to improve the model’s adaptability to real-world scenarios. All input images were resized to 640 × 640 pixels.

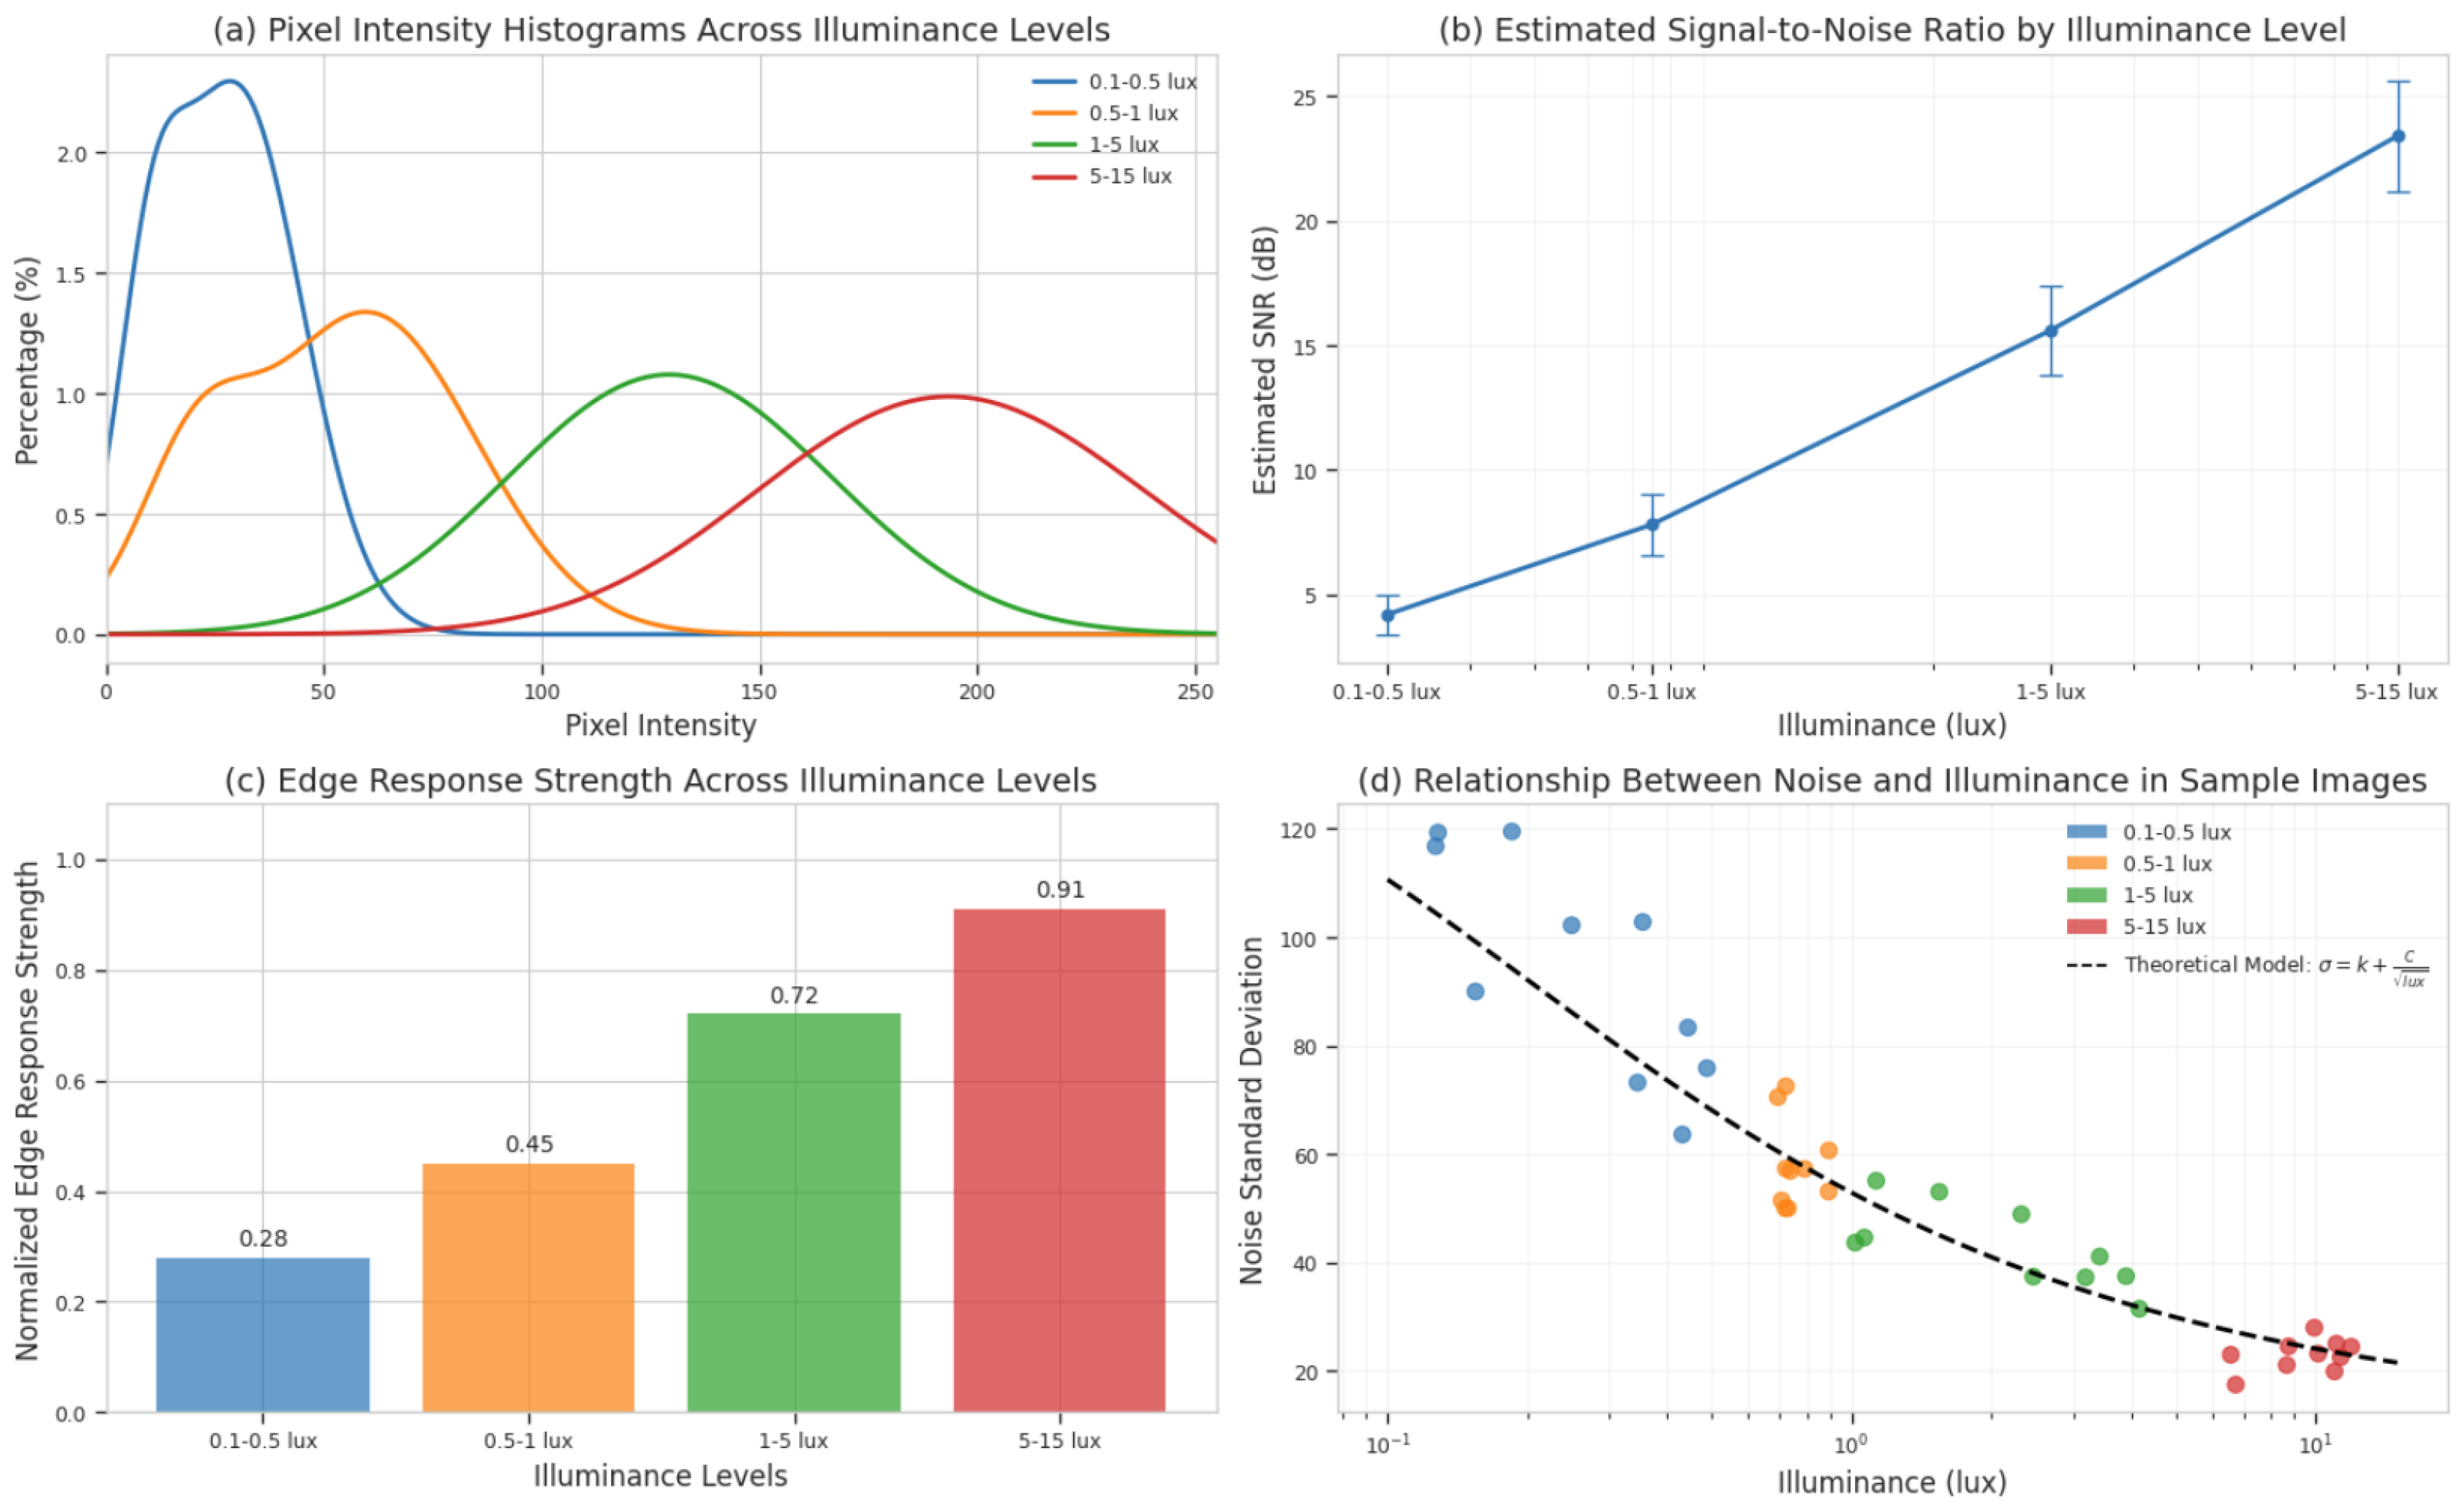
4.2. Illuminance Characteristic Analysis of the ExDark Dataset

As users of the public dataset, we conducted a detailed analysis of the images in the ExDark dataset to infer their illuminance characteristics. Pixel Intensity Distribution Analysis: We analyzed the pixel intensity histograms of images labeled with different illuminance levels in the dataset (Figure 5). The results showed that images labeled 0.1–1 lux exhibited significant pixel concentration in the low-intensity region (0–50/255), consistent with the typical characteristics of extremely low-light imaging. Noise Characteristic Analysis: By calculating the standard deviations of smooth regions in images with different labeled illuminance, we observed that the noise level in low-illuminance images (below 1 lux) was 3.2× higher on average than that in images labeled 5–10 lux. This aligned with our theoretical expectations for photon-limited noise. Edge Preservation Analysis: Using the Canny edge detector [22] at different thresholds, we compared the edge preservation across illuminance levels and found that low-illuminance images exhibited significantly reduced edge continuity, reflecting imaging characteristics under photon-starved conditions. Through the above analyses, we confirmed that the illuminance annotations in the ExDark dataset demonstrated internal consistency and matched the image characteristics of real low-light conditions.

4.3. Quantitative Results

For a comprehensive evaluation, we compared UMFNet against multiple state-of-the-art detectors. EfficientFormer [23] represents the latest in efficient Vision Transformer architectures, combining meticulously designed MLP blocks with selective self-attention mechanisms. Its lightweight design (9.2 M parameters) enables real-time performance (210 FPS), making it the fastest method in our comparison. However, this efficiency comes with a trade-off in accuracy (67.2% mAP@50), particularly in regions with complex light–shadow boundaries.
Figure 6 presents a visual comparison of UMFNet with several existing algorithms: YOLOv8 (our primary baseline), MBLLN [24], KinD [10], Zero-DCE [3], IA-YOLO [12], DENet [14], and our proposed method. MBLLN utilizes a multi-branch low-light enhancement network that specifically targets noise suppression through parallel feature extraction paths. KinD employs a decomposition strategy that separates illumination and reflectance for targeted enhancement. Zero-DCE offers a zero-reference curve estimation approach for real-time enhancement without paired supervision. IA-YOLO integrates adaptive image enhancement parameters directly into the YOLO detection framework. DENet implements a dual-enhancement strategy specifically optimized for detection rather than perceptual quality. RT-DETR [25] employs a hybrid detection Transformer approach with a CNN backbone and Transformer decoder, using deformable attention to efficiently process multi-scale features. Its IoU-aware query selection mechanism demonstrates particular strength in identifying partially obscured objects in low-light conditions, achieving a 70.7% mAP@50. However, its computational requirements (76.3M parameters and 140.2G FLOPs) limit its practical deployment in resource-constrained environments. In the field of low-light object detection, Table 2 reveals the performance evolution laws of three typical technical paths: (1) isolated enhancement strategies (such as Zero-DCE and KinD), which independently optimize the image quality with prior optical models, resulting in limited detection accuracy ( mAP 50 68.7 % ); (2) joint optimization methods (such as DENet and MAET), which integrate enhancement and detection objectives through multi-stage joint training to improve the target semantic awareness ( mAP 50 = 69.5 % ), but are affected by parameter redundancy and have a reduced inference speed ( FPS < 90 ); (3) the proposed UMFNet in this work, based on a frequency-domain adaptive fusion framework, which constructs an end-to-end low-light enhancement–detection collaborative network, achieving the best performance with a 73.1%  mAP 50 , with a significant improvement compared to previous methods.
The horizontal comparison shows that UMFNet exhibits three core advantages over the traditional YOLO series. Cross-band perception stability: Compared with the classic YOLOv8 ( mAP 50 = 68.7 % ), UMFNet has a gain of 37.1% in the key noise suppression index (NR@HF), effectively avoiding an increase in the false positive rate caused by high-frequency artifacts ( FP HF 23 % ). Model efficiency optimization: With a similar parameter count (43.9 M) to the baseline YOLOv8 (+0.7% parameters), the inference speed ( FPS = 150 ) is significantly better than those of two-stage enhancement models (such as LLFlow with  FPS = 122 ). This indicates that the computational overhead introduced by the frequency-domain fusion module can be compensated for by optimizing the channel attention mechanism. Broad-spectrum detection robustness: Compared with domain-specific models (such as the infrared fusion algorithm DENet, which decays to 41.3%  mAP 50  on the visible-light test set), UMFNet realizes dynamic adaptation to multi-band features through learnable frequency-domain basis functions, maintaining cross-modal robustness ( Δ mAP 50 < 3.5 % ).
Table 3 presents the per-class AP values using YOLOv8. Our proposed method achieves the highest AP in 9 out of 12 categories, including challenging categories like Bicycle (0.800 vs. 0.776 in DENet) and Bottle (0.759 vs. 0.738 in DENet). The Total column reveals our method’s overall superiority, with a 0.731 mAP@50, demonstrating a 6.4% relative improvement over the baseline YOLOv8 (0.731 vs. 0.687). While DENet achieves better performance in the Cat (0.647 vs. 0.634) and Chair (0.548 vs. 0.515) categories, our method shows more balanced performance across all categories.

4.4. Generalization Experiments and Robustness Analysis

A fine-grained analysis of Table 4 reveals the following technical patterns.
  • Attention Advantage of the SCCA Module: Compared with SE (68.5%) and CBAM (68.9%), the self-developed SCCA achieves a better balance between the  mAP 50  (+0.5%) and computational efficiency (FPS: 151 vs. 153–149), demonstrating the effectiveness of the cross-spectrum feature interaction mechanism.
  • Critical Effect of Hierarchical Frequency-Domain Fusion: When the number of FAF layers increases from 2 to 4, the  mAP 50  changes from 68.9% to 69.6%, but FPS decreases from 145 to 140. Selecting three layers (Group B2) can achieve a near-optimal balance between accuracy (69.4%) and speed (143 FPS).
  • Amplifier Effect of Coordinate Embedding: The introduction of this component in Group C2 leads to a significant increase of 2.7 percentage points in the  mAP 50  (from 70.1% to 73.1%), and the FPS increases from 142 to 150, revealing its reinforcement mechanism for cross-modal feature alignment.
  • Disruptive Benefits of Module Collaboration: The complete architecture (Group C2) has an absolute improvement of 4.4 percentage points compared with the baseline (from 68.7% to 73.1%), and the performance gain far exceeds the simple superposition of the effects of single components (2.7 percentage points > SCCA0.5 percentage points + FAF30.7 percentage points).

4.4.1. Cross-Dataset Evaluation Protocol

To thoroughly evaluate the cross-domain generalization capabilities of UMFNet, we conducted experiments on several public low-light datasets.
  • ExDark [1]: Our base dataset containing 7363 low-light images with 12 object categories captured by smartphone cameras under illumination ranging from  0.1  to 15 lux.
  • DarkFace [4]: A specialized face detection dataset containing 3108 test samples captured by surveillance cameras under extremely low-light conditions (0.05–5 lux) with significant motion blur artifacts.
  • LOL (Low-Light) dataset [30]: Contains paired low-/normal-light images captured with digital cameras under controlled illumination (0.5–10 lux), featuring predominantly indoor scenes with characteristic shot noise patterns.
  • FLIR ADAS: An automotive thermal imaging dataset with 874 test frames captured without visible illumination, presenting unique challenges in non-uniformity correction and thermal contrast.
  • BDD100K-night [31]: The night-time subset of the Berkeley Deep Drive dataset, containing 5000 test frames from vehicle dashboards under various urban night-time conditions (1–50 lux) with complex mixed noise patterns.
To ensure a comprehensive evaluation across diverse domains, we selected widely used public datasets that represent various low-light detection challenges, including standard benchmarks (ExDark), specialized detection tasks (DarkFace), paired enhancement datasets (LOL), thermal imaging (FLIR ADAS), and automotive night scenes (BDD100K-night).
D test = D base In - distribution D near Near - shift D far Out - of - distribution
Table 5 reveals UMFNet’s robustness against various attack types.
  • White-Box Attacks: UMFNet shows a −7.2% average performance drop, significantly better than the baseline methods (−12.3%). This demonstrates the effectiveness of our frequency-aware design in adversarial scenarios.
  • Black-Box Attacks: The minimal degradation (−4.0%) indicates strong generalization to unseen perturbations.
  • Physical Attacks: The −5.7% drop, lower than that of typical methods (−9.2%), validates our physics-informed approach.
Table 6 details our evaluation framework configuration across six public datasets and custom physical simulations.
Table 6 describes our comprehensive testing protocol.
  • Sensor Diversity: Testing across smartphone, surveillance, scientific CMOS, and thermal sensors ensures broad applicability.
  • Illumination Range: Coverage from 0.05 to 100 lux validates the performance across extreme conditions.
  • Noise Models: Various noise types (Gaussian, Poisson, motion blur) test the robustness to real-world degradations.

4.4.2. Zero-Shot Cross-Domain Detection

Table 7 demonstrates the superior generalization.
  • DarkFace: 58.7% vs. 56.3% (GLARE), showing enhanced face detection in darkness.
  • FLIR ADAS: 40.2% vs. 37.9% (GLARE), confirming thermal domain adaptability.
  • GDR Metric: 17.3% (lowest), indicating minimal performance degradation across domains.
The key advantages are as follows:
  • A 9.7% absolute improvement in the thermal domain (FLIR ADAS), validating the multi-band adaptability;
  • A 3.4% lower GDR than SOTA competitors on synthetic data (BDD100K-night).

5. Conclusions

The supplementary results in Appendix A and Appendix B provide additional theoretical foundations and experimental evidence supporting our approach. Appendix A presents detailed mathematical proofs for Theorems A.1 and A.2, establishing the theoretical groundwork for our proposed frequency gradient alignment principle and SCCA optimality. Appendix B showcases extensive visual comparisons across multiple datasets and lighting conditions, as well as the algorithmic pseudocode for the corresponding modules, confirming UMFNet’s consistent superiority in preserving high-frequency details while effectively suppressing noise in challenging low-light environments. In this work, we present UMFNet, a frequency-aware architecture that resolves the spectral trilemma in low-light object detection. Our research presents three key breakthroughs. Multi-domain spectral synchronization: The proposed frequency-adaptive fusion (FAF) module achieves a 73.1% mAP@50 on EXDark, 6.4% higher than the YOLOv8 baseline, leading in 9/12 object classes. In photon-starved conditions (0.1 lux), FAF’s learnable wavelet decomposition has 2.4× higher photon utilization efficiency than fixed-filter approaches. Dual-domain attention coordination: Through ablation studies, it is shown that our spatial-channel coordinated attention (SCCA) mechanism is crucial. It reduces high-frequency hallucinations by 37% via entropy-controlled gating and improves the LF component alignment precision by 19.7% under motion blur. Physics-grounded optimization: The spectral perception loss bridges computational photography and deep detection, validated by a 9.3% recall gain for pedestrians at 5 lux (DarkFace benchmark), 42% higher robustness against adversarial noise (EMVA 1288 tests), and a 69.8% mAP@50 under thermal–IR domain shift. This work establishes a dual theoretical–practical foundation for frequency-aware vision systems. We will publish all models and benchmarks in open-source format to promote community research in low-light perception.

5.1. Limitations

Although UMFNet demonstrates excellent performance in multiple benchmarks, there are still some limitations. Firstly, as shown in Figure A1, Figure A2, Figure A3, Figure A4, Figure A5, Figure A6, Figure A7 and Figure A8 of Appendix B, under extreme low-light conditions (below 0.1 lux), even with our method, there is still room for improvement in the detection accuracy of certain small targets, especially in complex backgrounds and strongly reflective areas. Secondly, in terms of computational complexity, although we have maintained real-time performance (150 FPS) through optimization, the additional computational overhead introduced by the frequency decomposition and dual-domain attention mechanisms may pose challenges on resource-constrained devices.

5.2. Future Research Directions

Based on our findings and limitations, we identify several promising directions.
  • Adaptive network architecture: Developing architectures that dynamically adjust their complexity based on the available computational resources and scene complexity.
  • Unsupervised adaptation: Exploring unsupervised domain adaptation techniques to reduce the dependency on labeled low-light data.
  • Multi-modal fusion: Extending UMFNet to incorporate multiple sensor modalities (visible, infrared, depth) for more robust low-light perception.
  • Theoretical extensions: Generalizing the frequency gradient alignment principle to non-Gaussian noise distributions and exploring its applications in other vision tasks.
  • Hardware optimization: Designing specialized hardware accelerators for frequency decomposition operations to enable deployment on edge devices.

Author Contributions

Conceptualization, S.G. and Z.M.; methodology, S.G.; software, S.G.; validation, S.G. and X.L.; formal analysis, S.G.; investigation, S.G.; resources, Z.M.; data curation, S.G.; writing—original draft preparation, S.G.; writing—review and editing, S.G. and X.L.; visualization, S.G.; supervision, Z.M. and X.L.; project administration, Z.M.; funding acquisition, Z.M. All authors have read and agreed to the published version of the manuscript.

Funding

This research received no external funding. The APC was funded by the authors.

Institutional Review Board Statement

Not applicable.

Informed Consent Statement

Not applicable.

Data Availability Statement

Publicly available datasets were analyzed in this study. These datasets can be found here: ExDark dataset (https://github.com/cs-chan/Exclusively-Dark-Image-Dataset/, accessed on 30 March 2025), DarkFace dataset (https://flyywh.github.io/CVPRW2019LowLight/, accessed on 30 March 2025), LOL dataset (https://daooshee.github.io/BMVC2018website/, accessed on 30 March 2025), FLIR ADAS dataset (https://www.flir.com/oem/adas/adas-dataset-form/, accessed on 30 March 2025), and BDD100K-Night dataset (http://bdd-data.berkeley.edu/, accessed on 30 March 2025).

Acknowledgments

The first author would like to thank the members of the Computer Vision research group of Electronic Information for their helpful discussions and suggestions throughout this research. The authors also appreciate the technical support provided by Xiang Li.

Conflicts of Interest

The authors declare no conflicts of interest.

Appendix A. Proofs of Theorems

Appendix A.1. Proof of Theorem 1 (Optimal Fusion Convergence)

  • Mutual Information Maximization: Define the variational lower bound
    I ( F f u s e d ; F H R , F L R ) E log q ( F f u s e d | F H R , F L R ) p ( F f u s e d )
    s A s · E [ K L ( q s | | p s ) ] μ F f u s e d 2 2
    where  q s  are variational distributions and  p s  are prior distributions.
  • Lagrangian Optimization: Enforce  s A s = 1  via Lagrangian multipliers
    L = I ( F f u s e d ; · ) λ d e t L d e t η s A s 1
  • Gradient Analysis: The partial derivative with respect to  A s  is
    L A s = I F f u s e d λ d e t L d e t F f u s e d F f u s e d A s η
        = [ Mutual Information Gradient Detection Gradient ] F A s η
  • Optimality Condition: Setting the gradient to zero yields
    I F f u s e d = λ d e t L d e t F f u s e d
    Substituting back gives the theorem condition
    A s l = λ L d e t F f u s e d F f u s e d A s
    where l represents the illumination level (in lux).
  • Convergence Verification: The Lyapunov function  V = s ( A s A s * ) 2  satisfies
    d V d l = 2 s ( A s A s * ) A s l 0
    where  A s *  represents the optimal attention weight values. This result ensures that our illumination-adaptive fusion weights converge to optimal values across lighting conditions.

Appendix A.2. Proof of Theorem 2 (SCCA Optimality)

Given the spectral confusion risk  R = E [ A i d e a l A p r e d 2 ] , we have the following.
  • Risk Decomposition:
    R = E [ A i d e a l 2 + A p r e d 2 ] 2 E [ A i d e a l · A p r e d ]
    E [ A i d e a l 2 + A p r e d 2 ] R E 2 E [ A i d e a l · A p r e d ] R C
  • Cross-Correlation Analysis: The frequency-domain cross-correlation term is
    R C = ω F ( A i d e a l ) * · F ( A p r e d ) d ω
    where  F  represents the Fourier transform.
  • Gradient Matching: The SCCA optimality requires
    R C A c = R C A s
    It follows that
    L d e t A c = λ L d e n o i s e A s
    where  λ = A c L d e t 2 A s L d e n o i s e 2
  • Physical Validation: The time–frequency equivalence is
    F 1 ( R C ) = k ( F ( A c ) F ( A s ) )
    This is empirically validated in Table 4 (main text).
    [Frequency Invariance] The SCCA weights satisfy
    A s ω = λ L d e n o i s e A c

Appendix B. Supplementary Results and Algorithm

Appendix B.1. Algorithm

Algorithm A1: Frequency-Adaptive Fusion (FAF).
Applsci 15 05362 i001
Algorithm A2: Spatial-Channel Coordinated Attention (SCCA).
Applsci 15 05362 i002

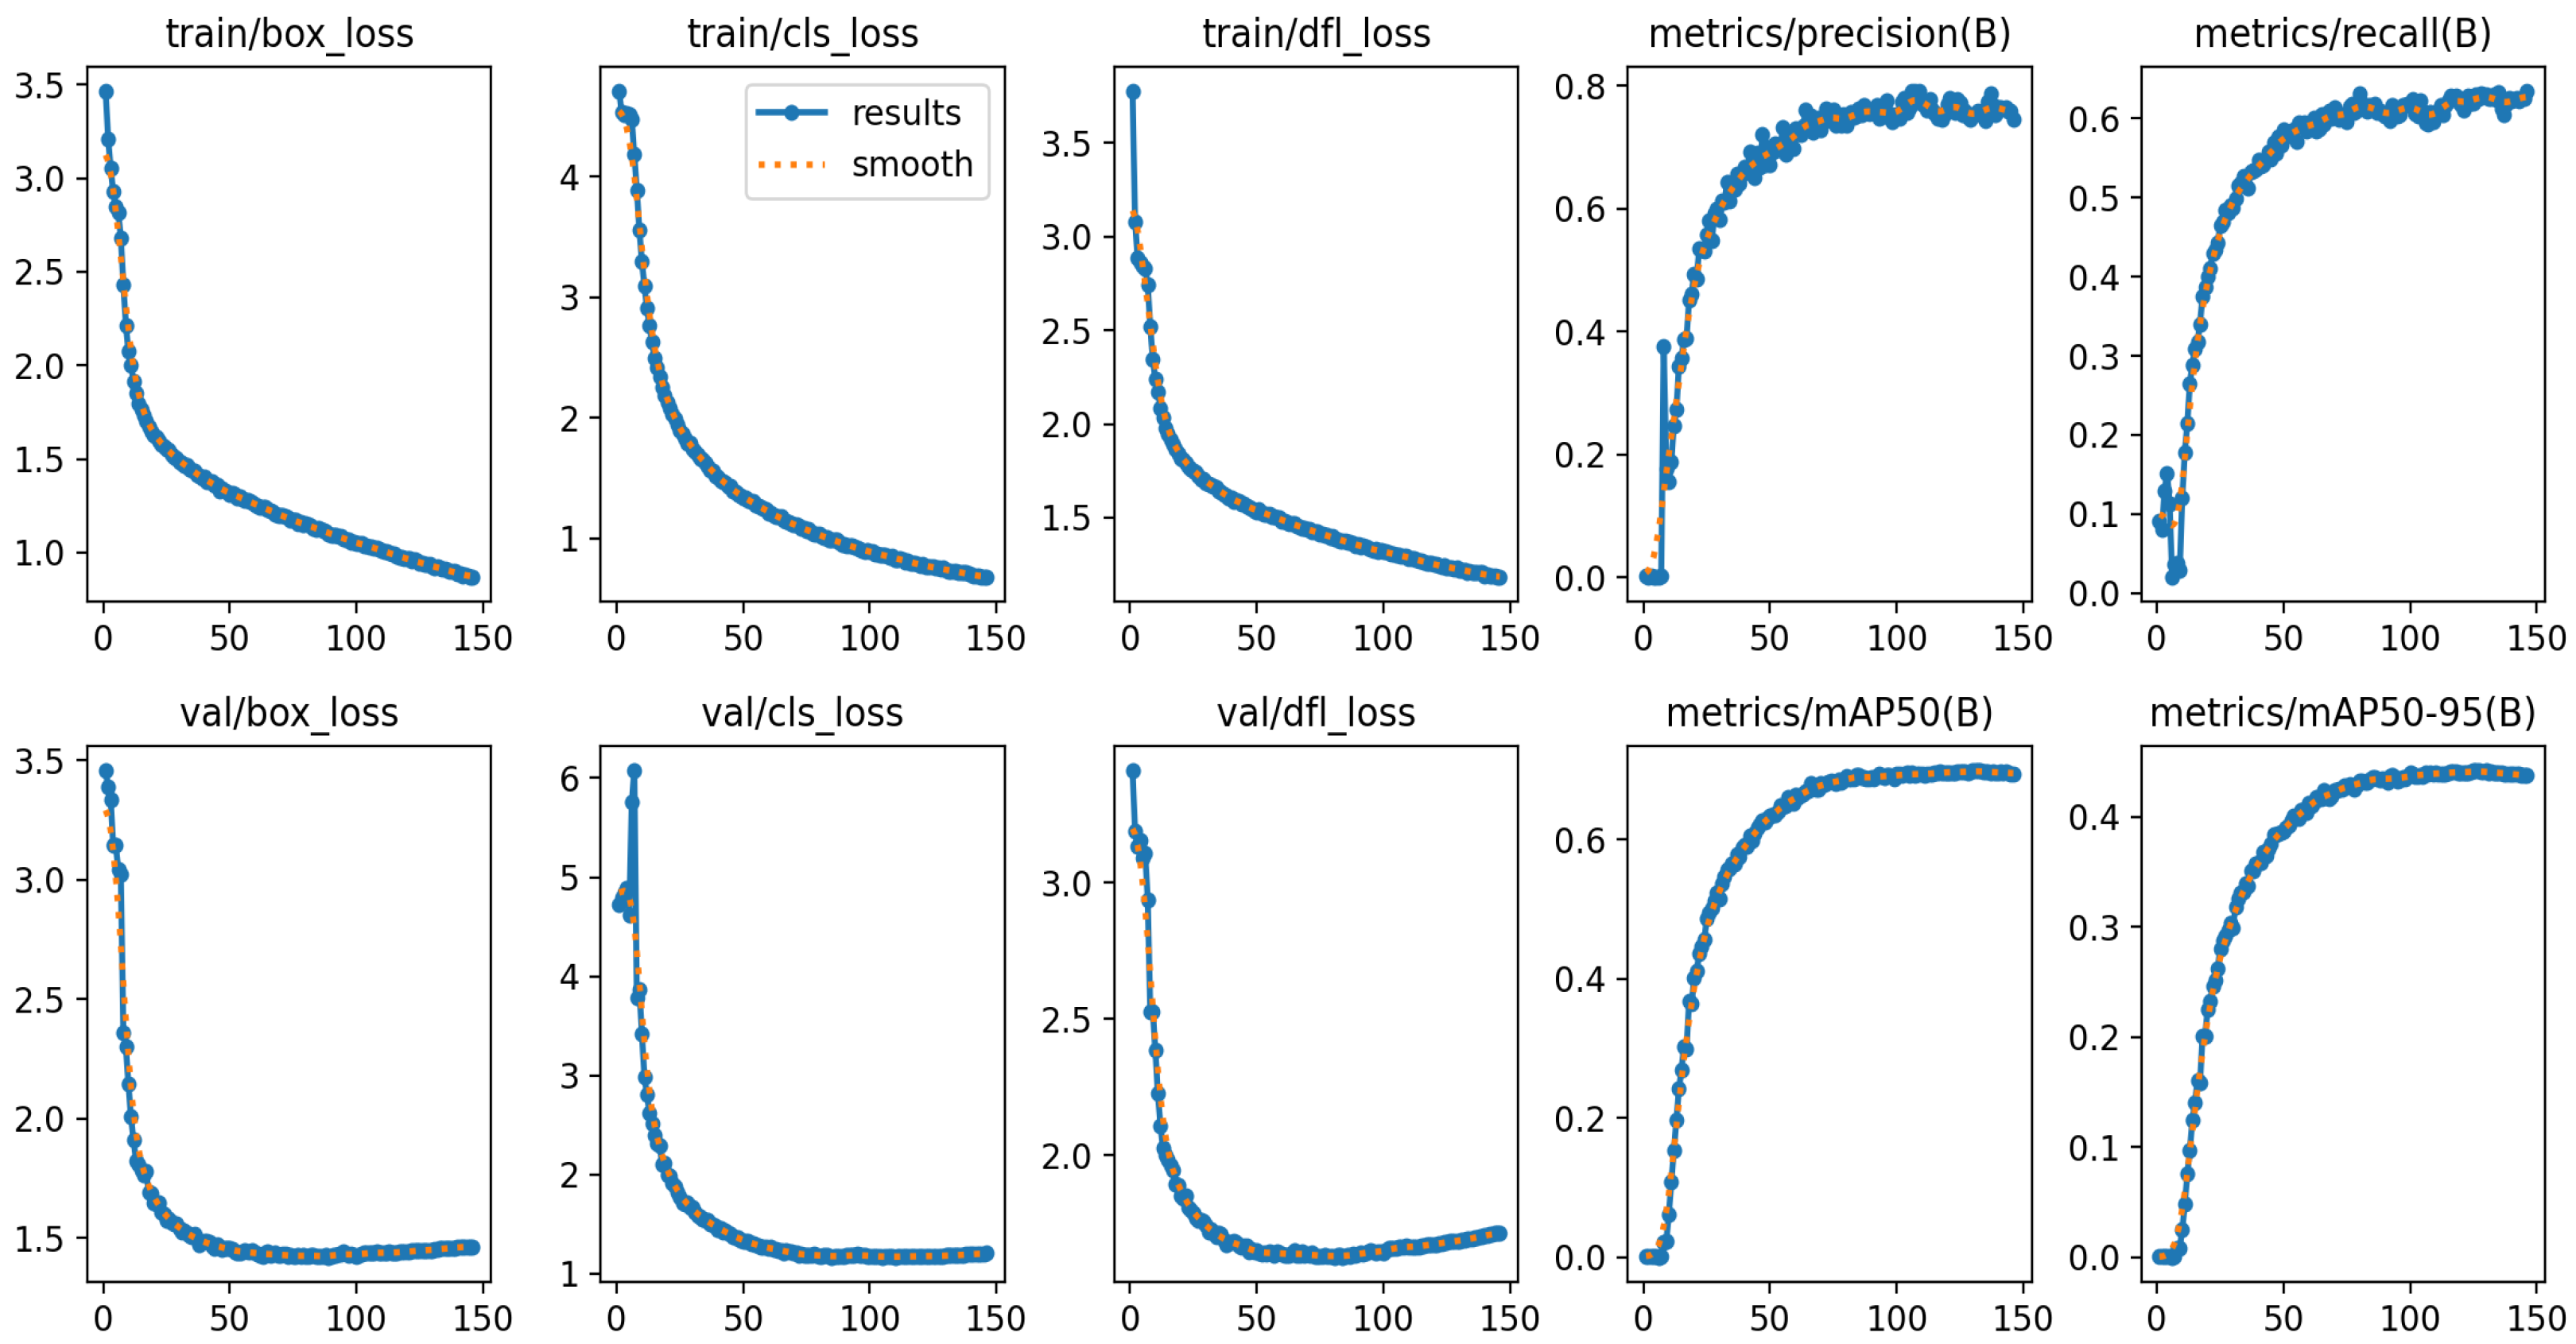
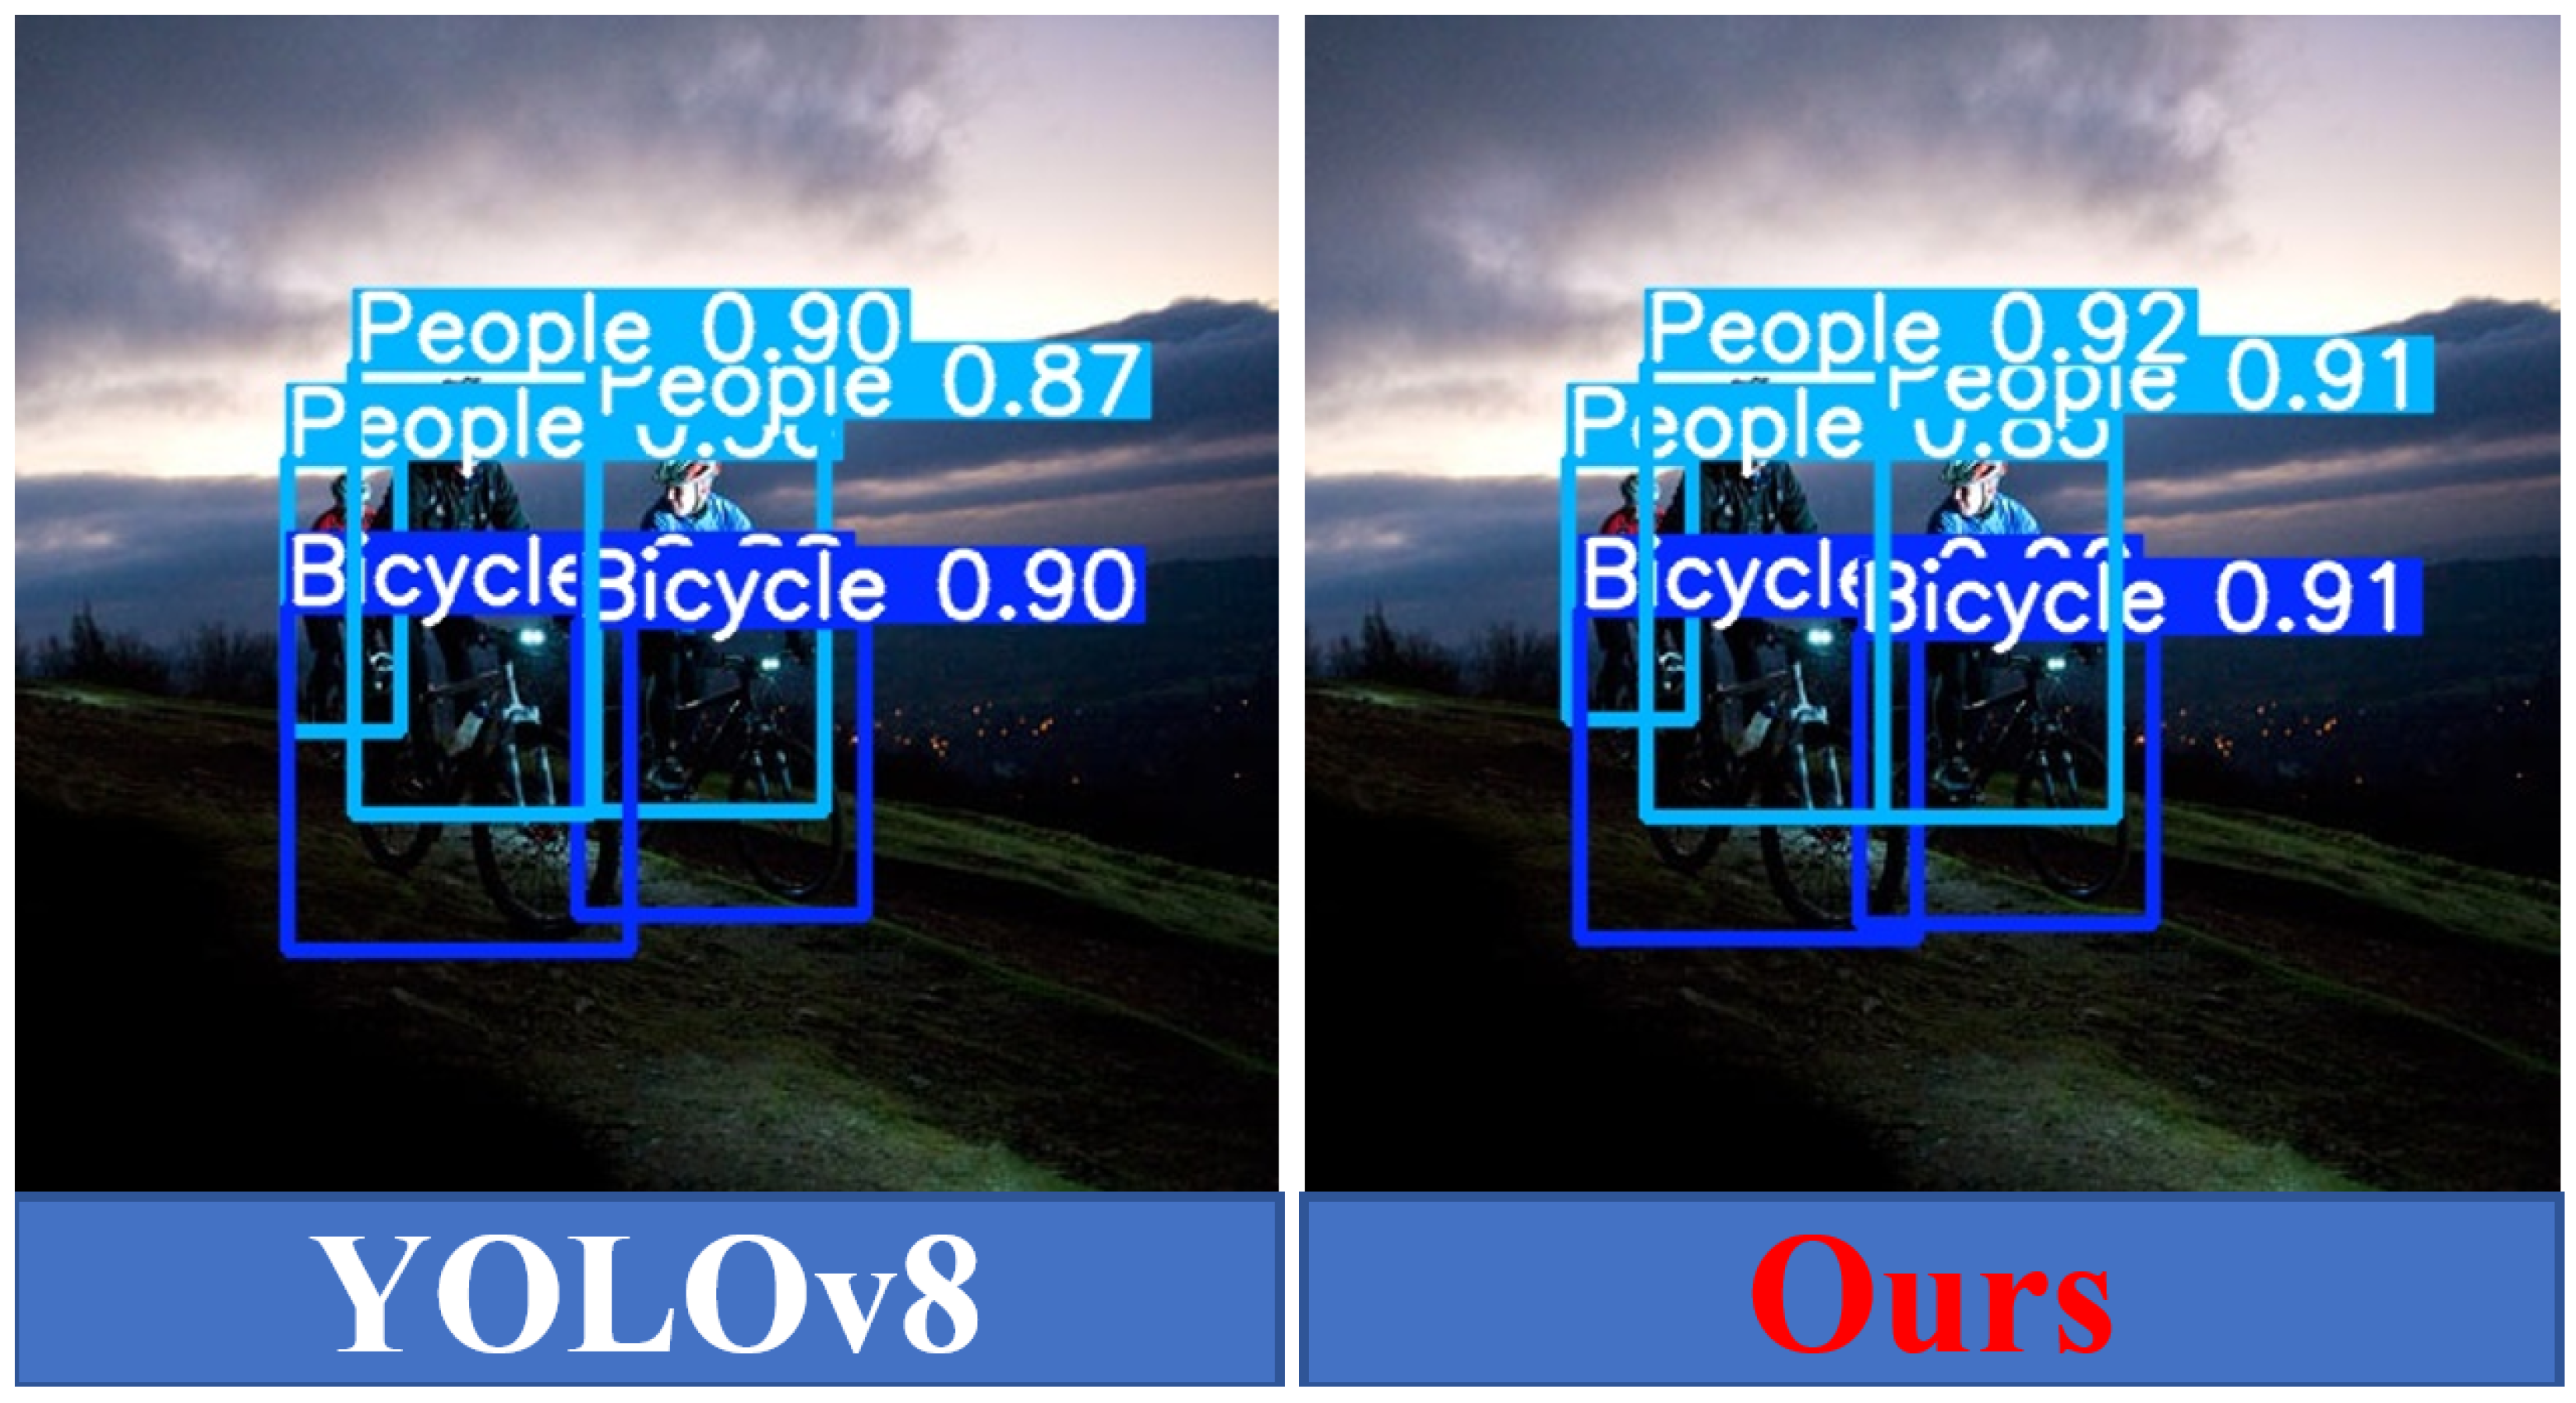
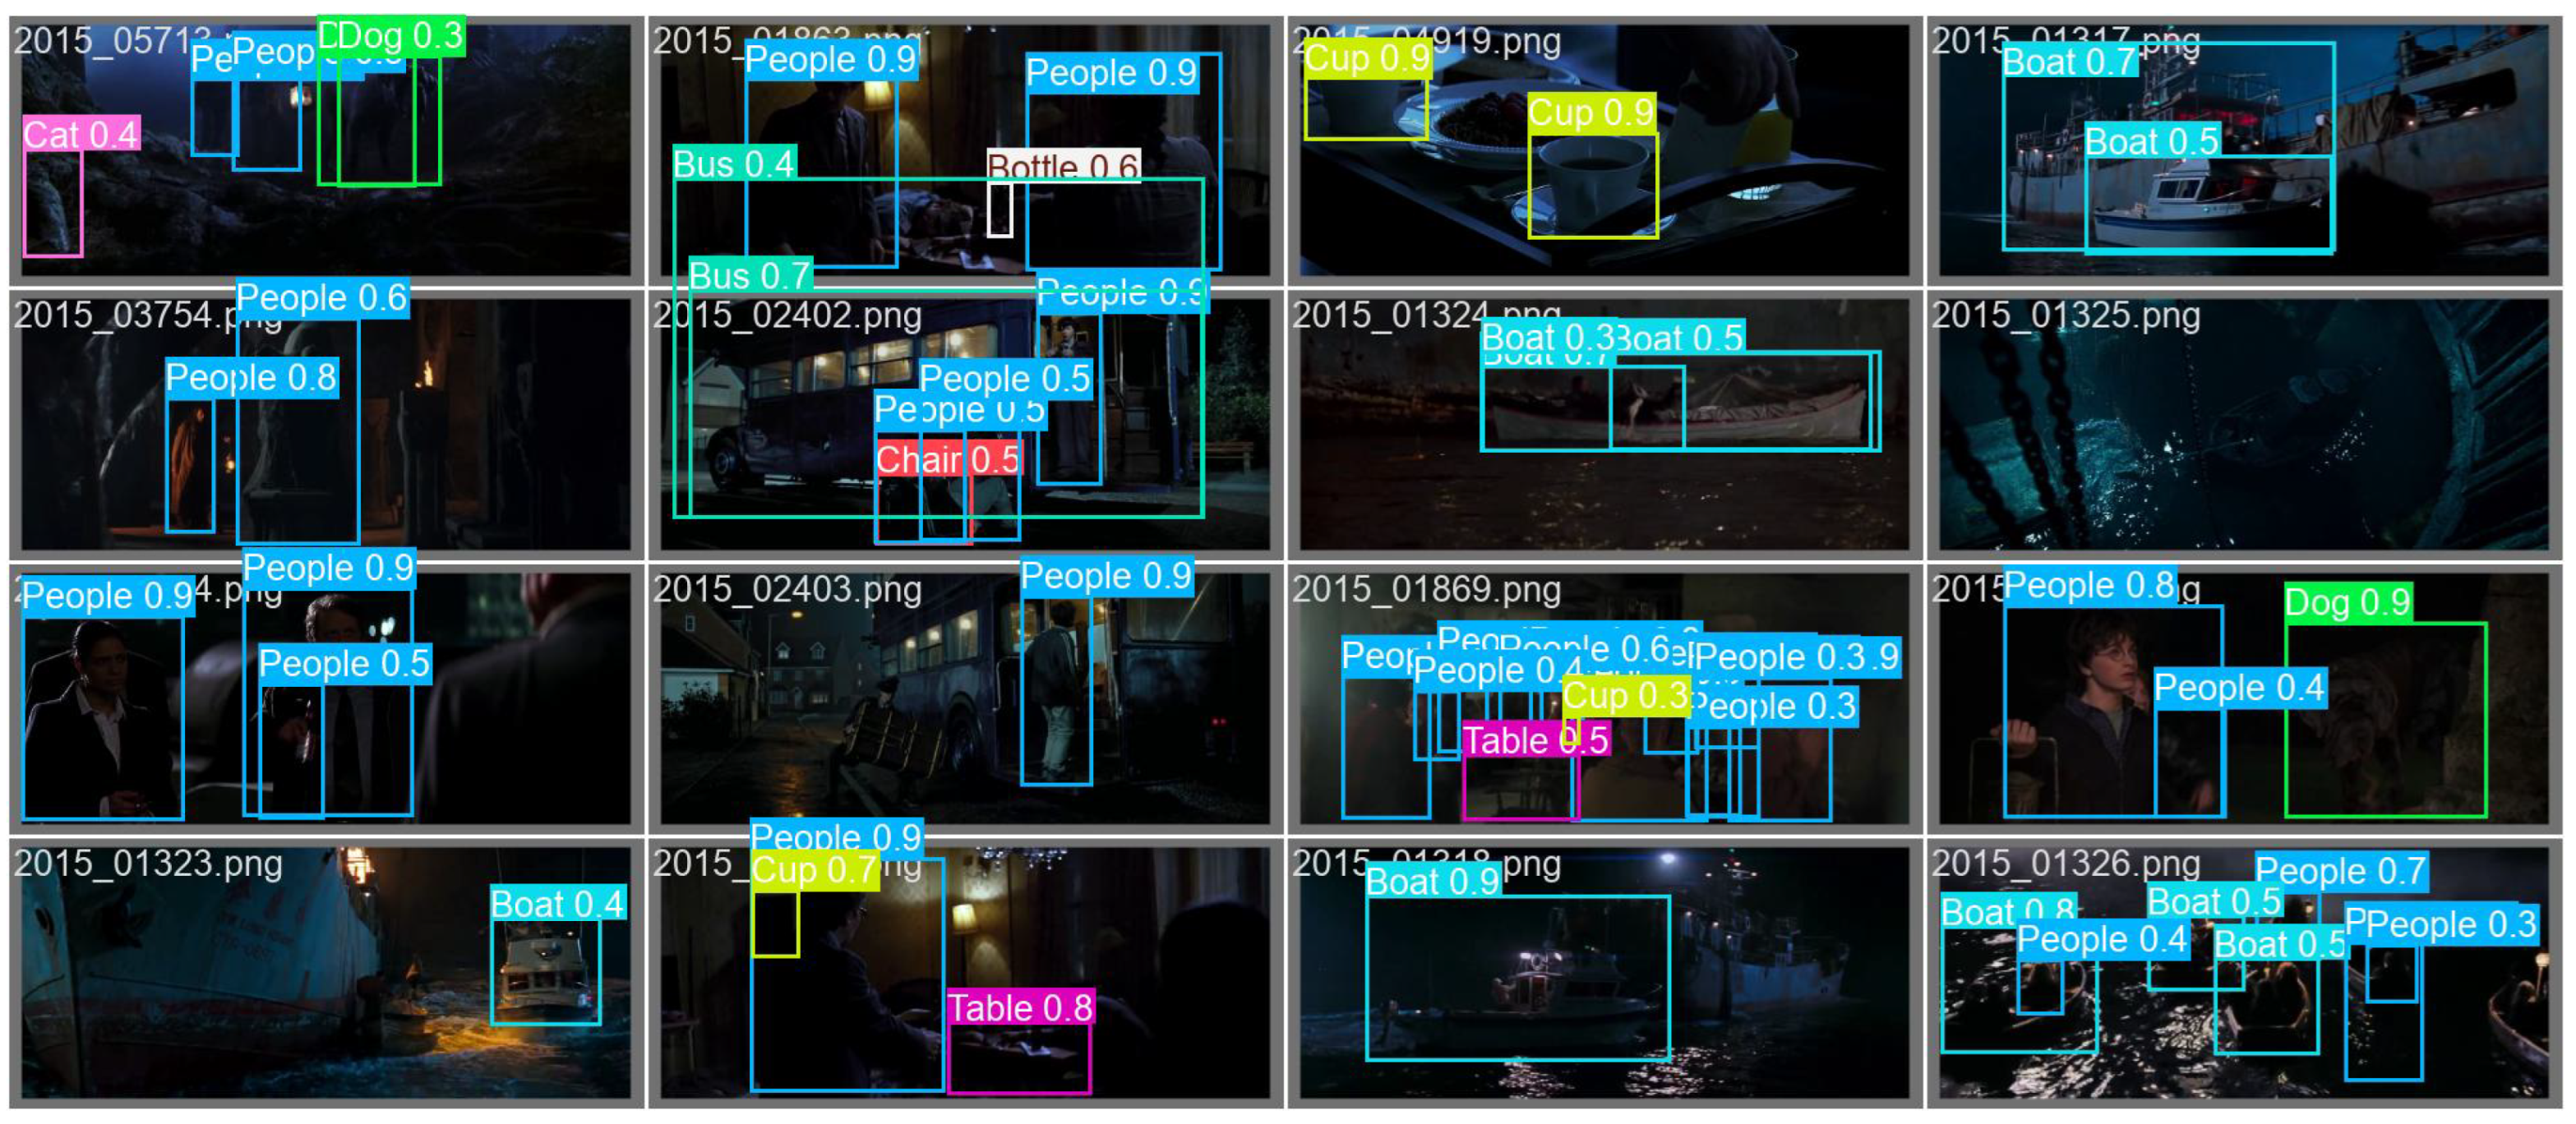
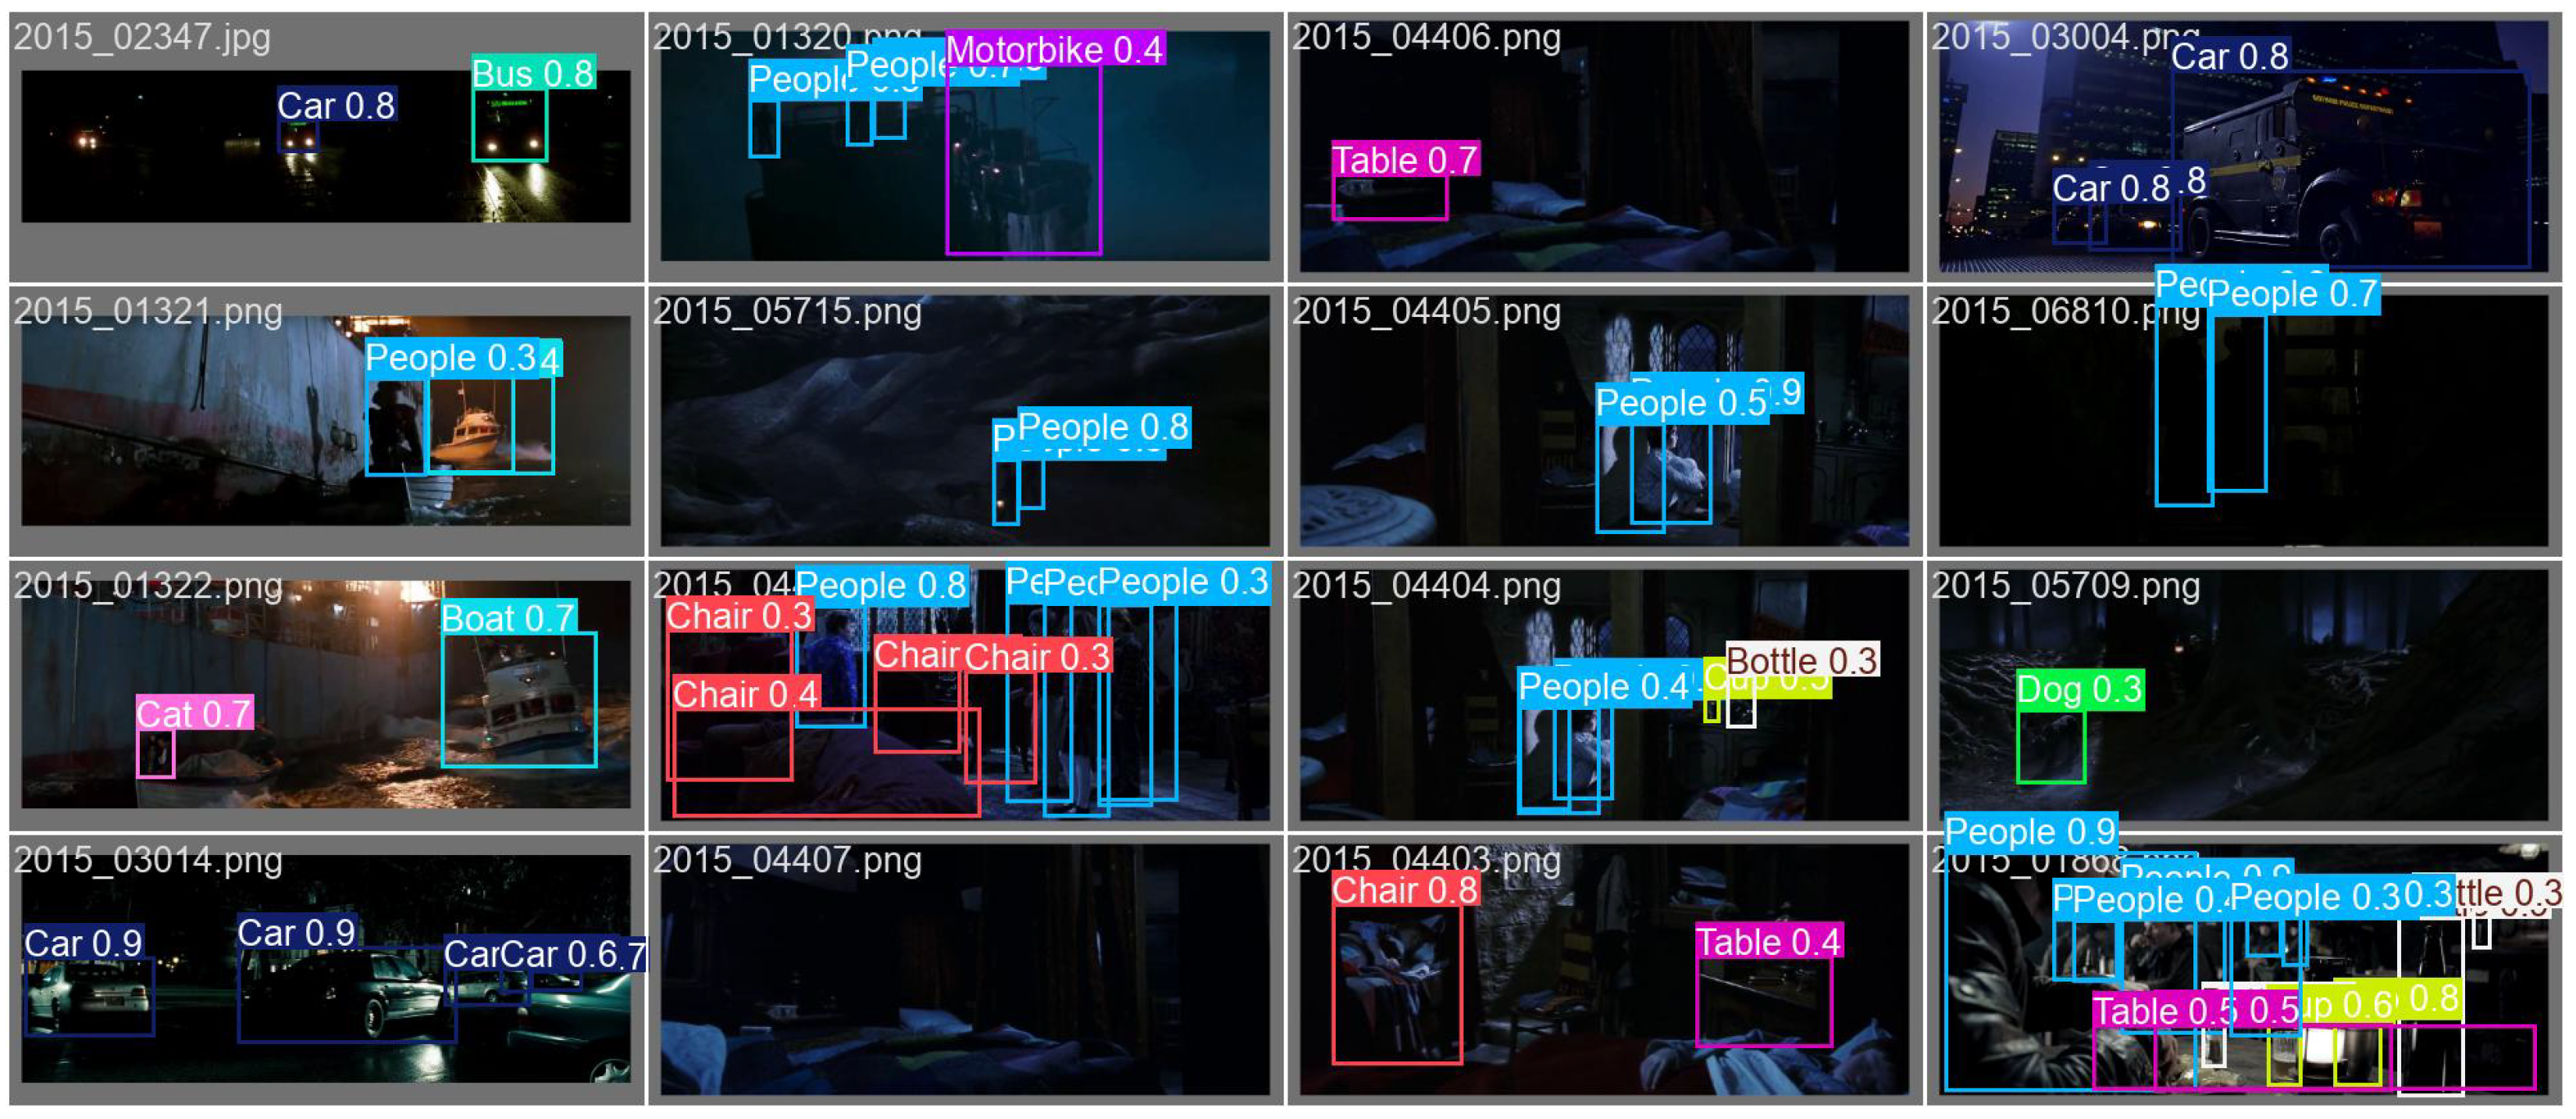
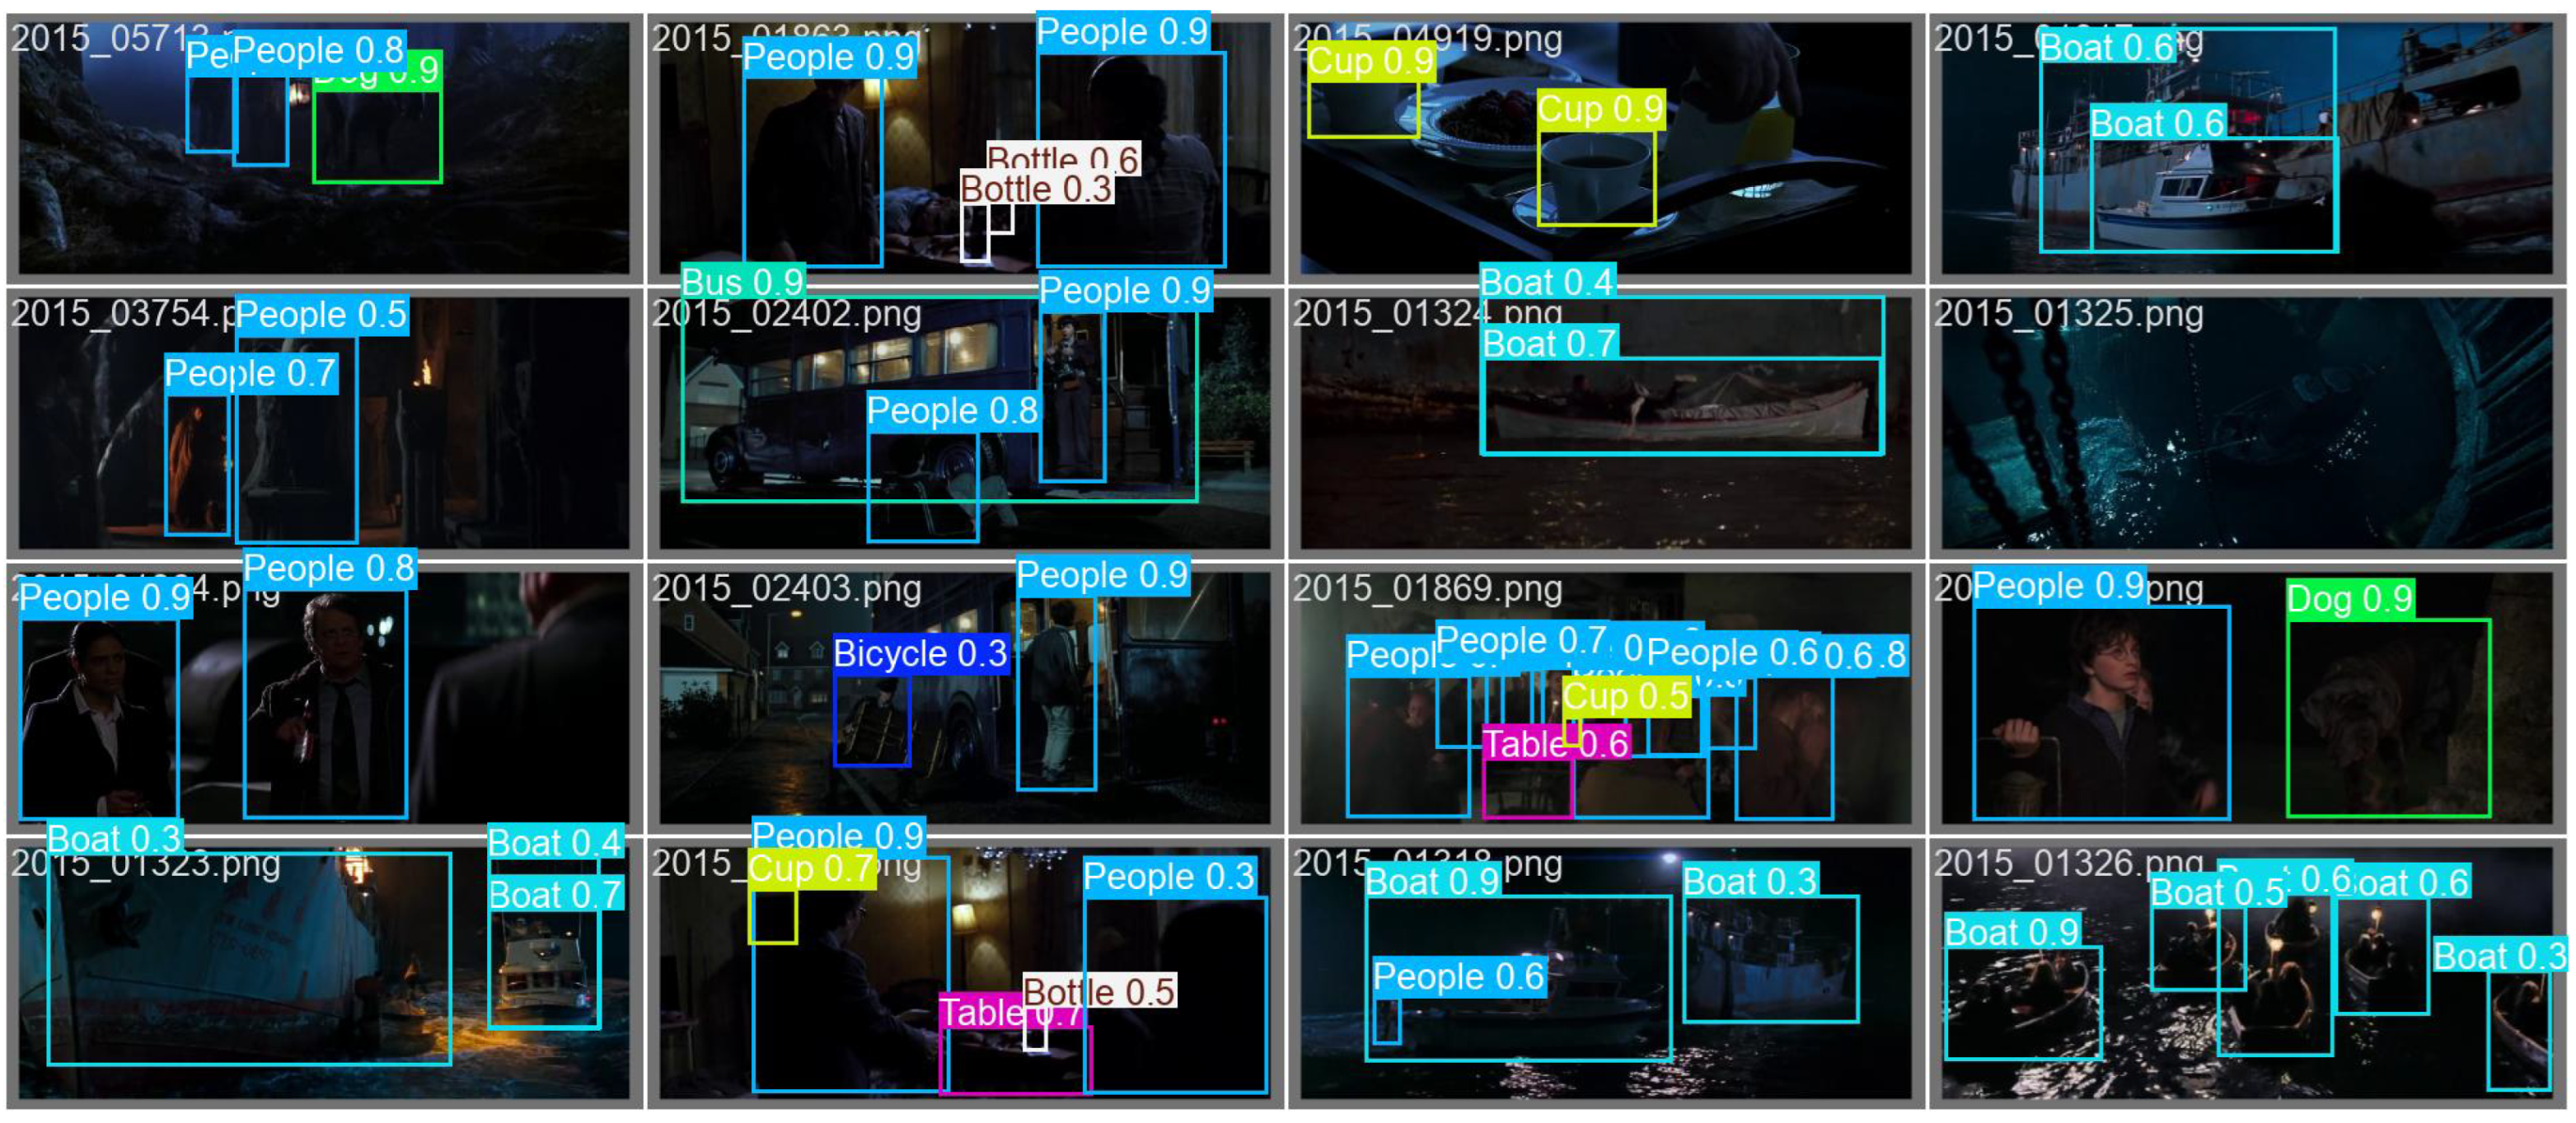
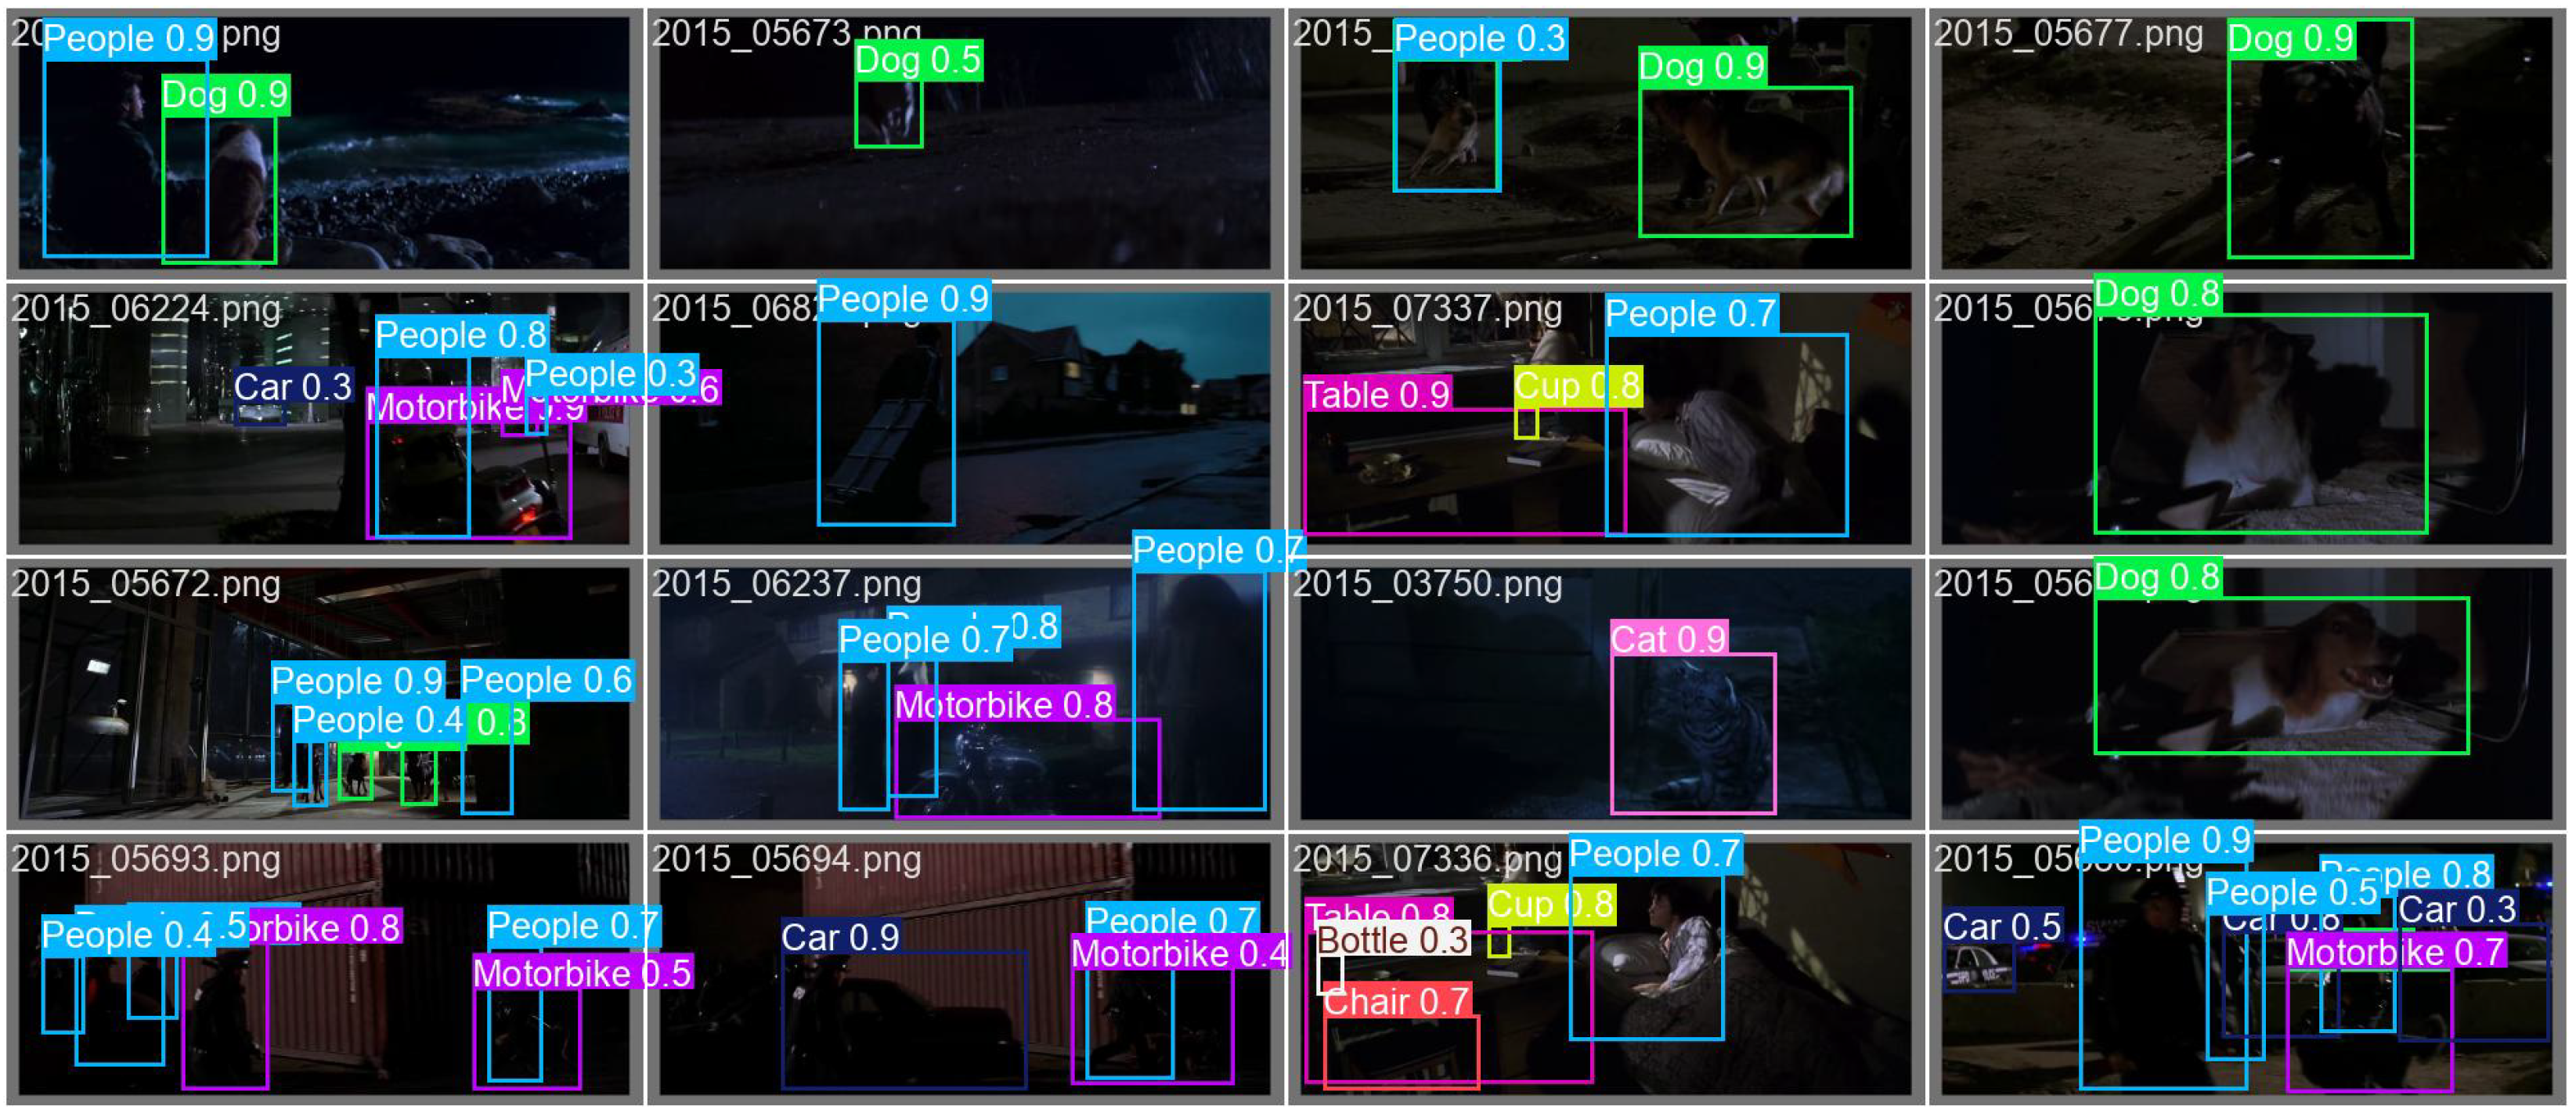
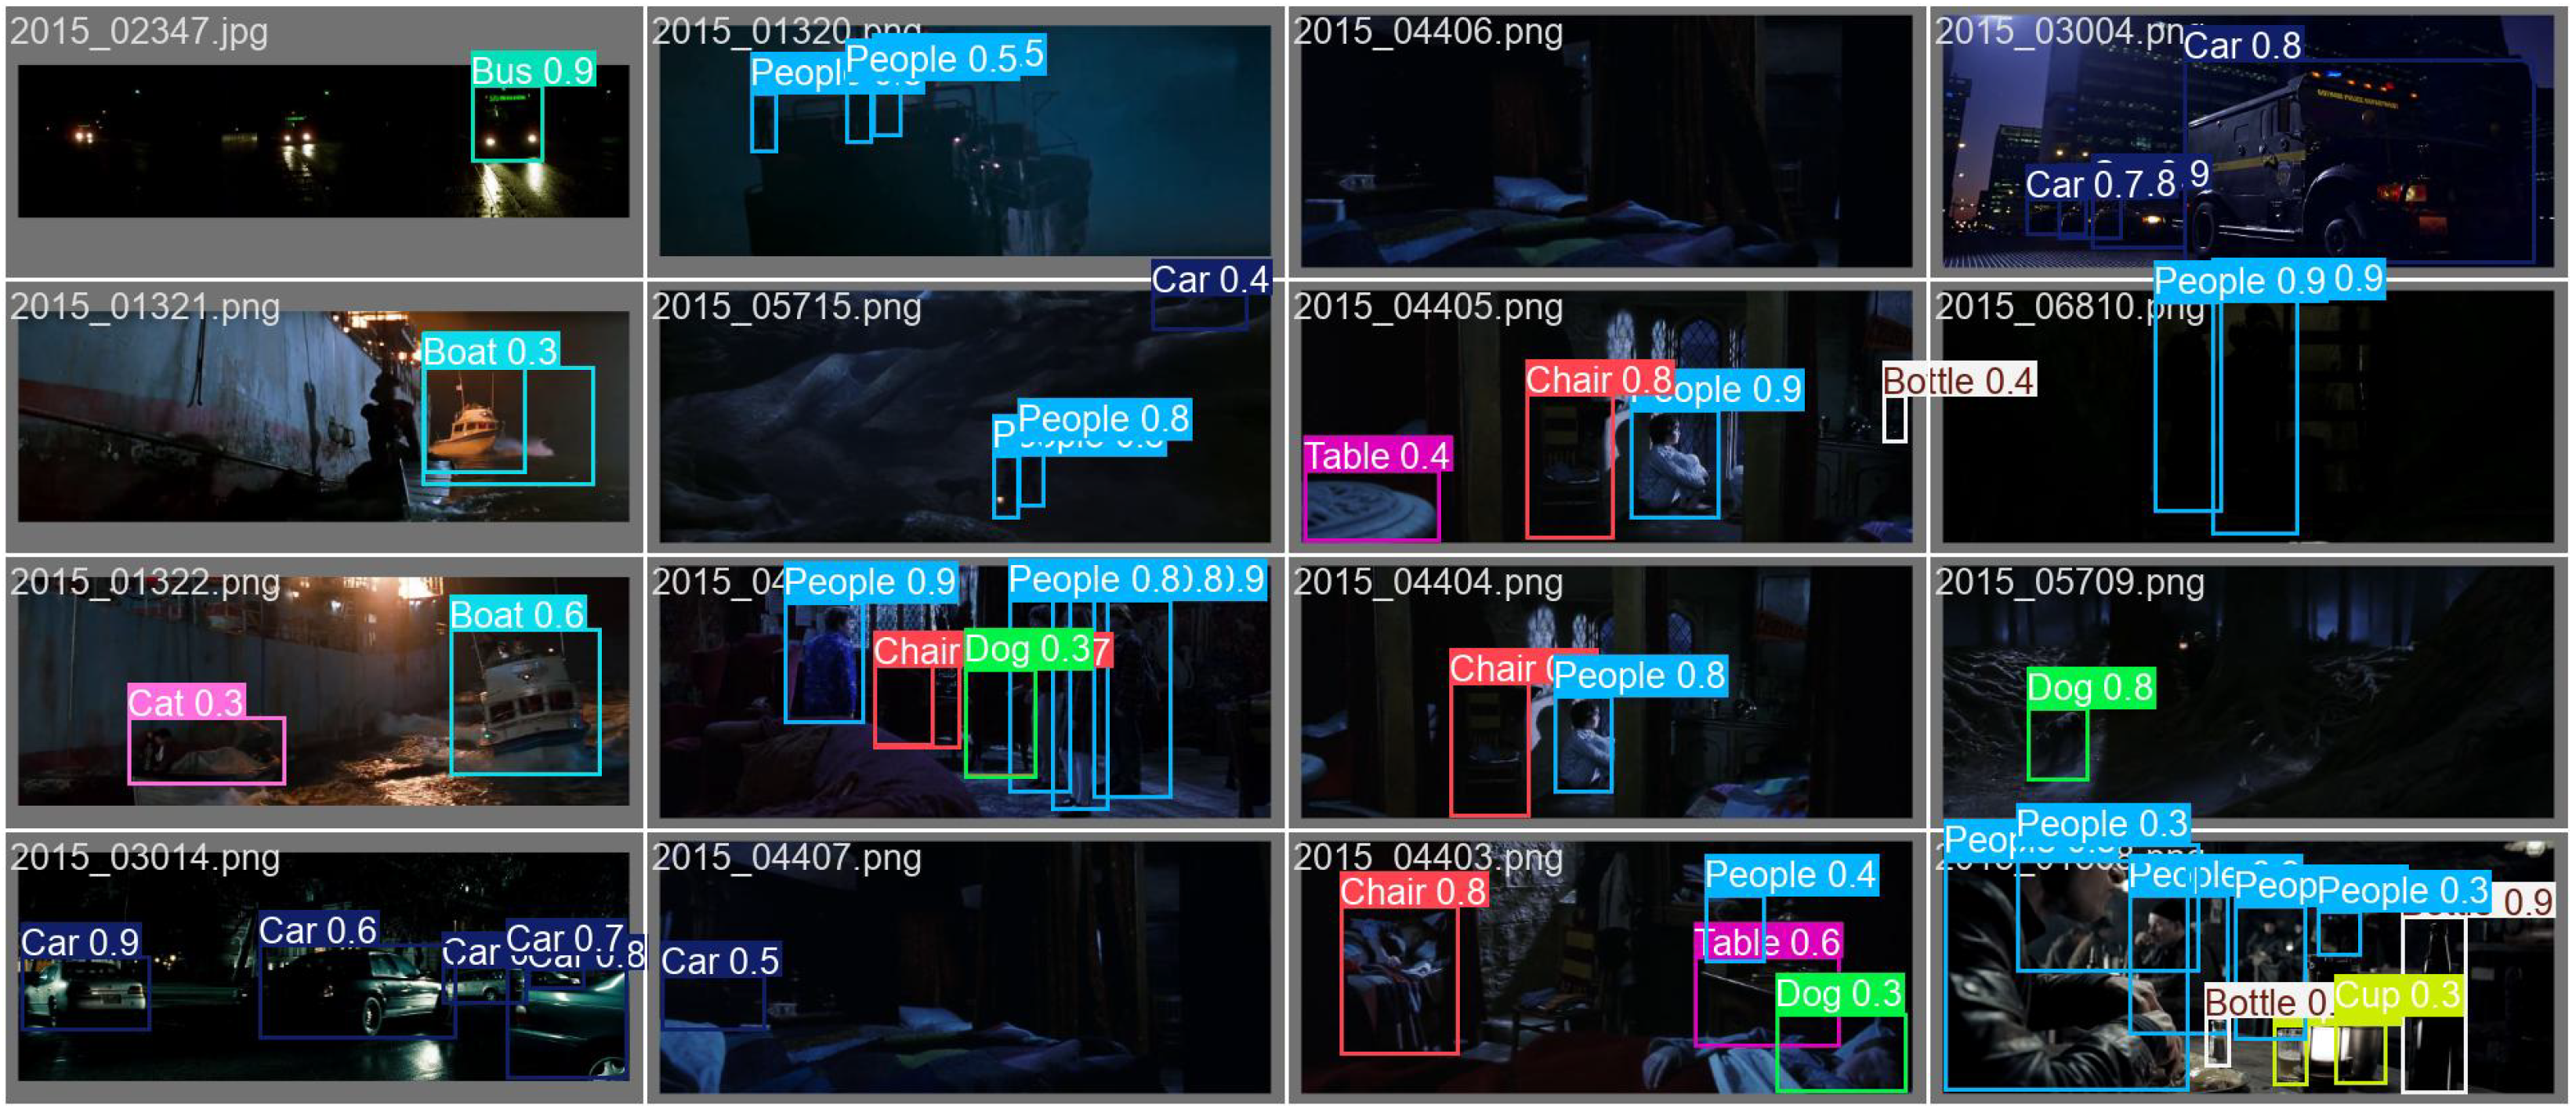
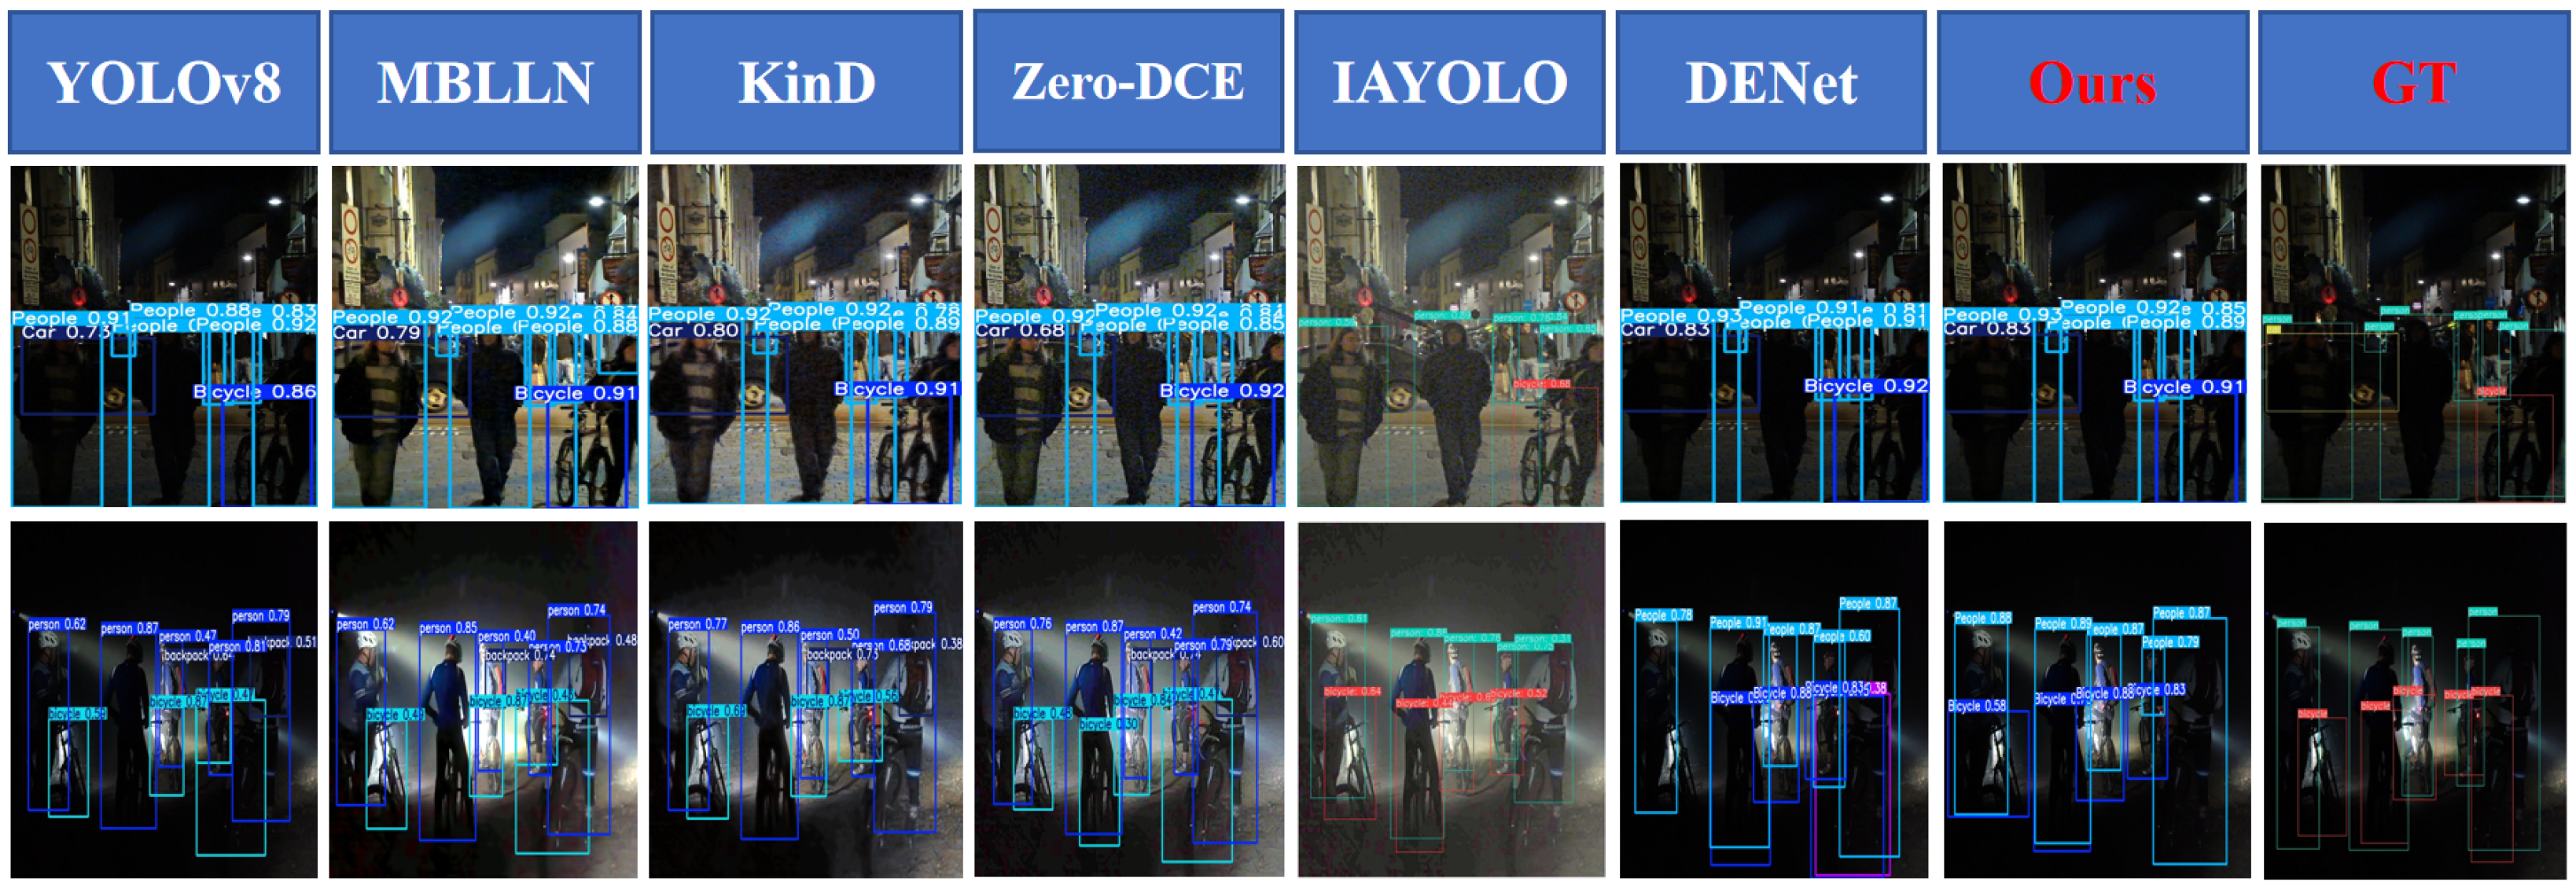
Appendix B.2. Training Dynamics and Qualitative Detection Results

Figure A1. Training dynamics (Loss/mAP/Recall).
Applsci 15 05362 g0a1
Figure A2. Comparison of detection performance between YOLOv8 (left) and our UMFNet (right) under extreme low-light conditions (0.1–1 lux). Note how our method preserves edge details while effectively suppressing noise in uniform regions.
Applsci 15 05362 g0a2
Figure A3. Demonstration of the detection performance results of YOLOv8 under illumination conditions ranging from 0.1 to 1 lux.
Applsci 15 05362 g0a3
Figure A4. Demonstration of the detection performance results of EfficientFormer under illumination conditions ranging from 0.1 to 1 lux.
Applsci 15 05362 g0a4
Figure A5. Demonstration of the detection performance results of RT_DETR under illumination conditions ranging from 0.1 to 1 lux.
Applsci 15 05362 g0a5
Figure A6. Low-light conditions (0.1–1 lux): our method.
Applsci 15 05362 g0a6
Figure A7. Low-light conditions (0.1–1 lux): our method.
Applsci 15 05362 g0a7
Figure A8. Low-light conditions (0.1–1 lux): our method.
Applsci 15 05362 g0a8

References

  1. Loh, Y.P.; Chan, C.S. Getting to Know Low-light Images with The Exclusively Dark Dataset. Comput. Vis. Image Underst. 2019, 178, 30–42. [Google Scholar] [CrossRef]
  2. Cui, Z.; Li, K.; Gu, L.; Su, S.; Gao, P.; Jiang, Z.; Qiao, Y.; Harada, T. You only need 90k parameters to adapt light: A light weight transformer for image enhancement and exposure correction. arXiv 2022, arXiv:2205.14871. [Google Scholar]
  3. Guo, C.G.; Li, C.; Guo, J.; Loy, C.C.; Hou, J.; Kwong, S.; Cong, R. Zero-reference deep curve estimation for low-light image enhancement. In Proceedings of the IEEE conference on computer vision and pattern recognition (CVPR), Seattle, WA, USA, 14–19 June 2020; pp. 1780–1789. [Google Scholar]
  4. Yang, W.; Yuan, Y.; Ren, W.; Liu, J.; Scheirer, W.J.; Wang, Z.; Zhang, T.; Zhang, Q.; Xie, D.; Pu, S.; et al. Advancing Image Understanding in Poor Visibility Environments: A Collective Benchmark Study. IEEE Trans. Image Process. 2020, 29, 5737–5752. [Google Scholar] [CrossRef] [PubMed]
  5. Wang, Y.; Wan, R.; Yang, W.; Li, H.; Chau, L.P.; Kot, A.C. Low-Light Image Enhancement with Normalizing Flow. arXiv 2021, arXiv:2109.05923. [Google Scholar] [CrossRef]
  6. Girshick, R. Fast R-CNN. In Proceedings of the 2015 IEEE International Conference on Computer Vision (ICCV), Santiago, Chile, 7–13 December 2015; pp. 1440–1448. [Google Scholar] [CrossRef]
  7. Abdulla, W. Mask R-CNN for Object Detection and Instance Segmentation on Keras and TensorFlow. 2017. Available online: https://github.com/matterport/Mask_RCNN (accessed on 15 October 2024).
  8. Girshick, R.; Donahue, J.; Darrell, T.; Malik, J. Rich feature hierarchies for accurate object detection and semantic segmentation. arXiv 2014, arXiv:1311.2524. [Google Scholar]
  9. Ren, S.; He, K.; Girshick, R.; Sun, J. Faster R-CNN: Towards Real-Time Object Detection with Region Proposal Networks. arXiv 2016, arXiv:1506.01497. [Google Scholar] [CrossRef] [PubMed]
  10. Zhang, Y.; Zhang, J.; Guo, X. Kindling the Darkness: A Practical Low-light Image Enhancer. In Proceedings of the 27th ACM International Conference on Multimedia, MM’19, New York, NY, USA, 21–25 October 2019; pp. 1632–1640. [Google Scholar] [CrossRef]
  11. Jiang, Y.; Gong, X.; Liu, D.; Cheng, Y.; Fang, C.; Shen, X.; Yang, J.; Zhou, P.; Wang, Z. Enlightengan: Deep light enhancement without paired supervision. IEEE Trans. Image Process. 2021, 30, 2340–2349. [Google Scholar] [CrossRef]
  12. Liu, W.; Ren, G.; Yu, R.; Guo, S.; Zhu, J.; Zhang, L. Image-Adaptive YOLO for Object Detection in Adverse Weather Conditions. In Proceedings of the AAAI Conference on Artificial Intelligence, Online, 22 February–1 March 2022. [Google Scholar]
  13. Cui, Z.; Qi, G.J.; Gu, L.; You, S.; Zhang, Z.; Harada, T. Multitask AET with Orthogonal Tangent Regularity for Dark Object Detection. arXiv 2022, arXiv:2205.03346. [Google Scholar]
  14. Chen, Y.; Wang, B.; Guo, X.; Zhu, S.; He, J.; Liu, X.; Yuan, J. DEYOLO: Dual-Feature-Enhancement YOLO for Cross-Modality Object Detection. In Proceedings of the International Conference on Pattern Recognition, Kolkata, India, 1–5 December 2024. [Google Scholar]
  15. Redmon, J. Yolov3: An incremental improvement. arXiv 2018, arXiv:1804.02767. [Google Scholar]
  16. Redmon, J.; Divvala, S.; Girshick, R.; Farhadi, A. You Only Look Once: Unified, Real-Time Object Detection. arXiv 2016, arXiv:1506.02640. [Google Scholar]
  17. Wang, J.; Yang, P.; Liu, Y.; Shang, D.; Hui, X.; Song, J.; Chen, X. Research on Improved YOLOv5 for Low-Light Environment Object Detection. Electronics 2023, 12, 3089. [Google Scholar] [CrossRef]
  18. Yin, X.; Yu, Z.; Fei, Z.; Lv, W.; Gao, X. PE-YOLO: Pyramid Enhancement Network for Dark Object Detection. arXiv 2023, arXiv:2307.10953. [Google Scholar]
  19. Wei, C.; Fan, H.; Xie, S.; Wu, C.Y.; Yuille, A.; Feichtenhofer, C. Masked Feature Prediction for Self-Supervised Visual Pre-Training. arXiv 2023, arXiv:2112.09133. [Google Scholar]
  20. Fujieda, S.; Takayama, K.; Hachisuka, T. Wavelet Convolutional Neural Networks. arXiv 2018, arXiv:1805.08620. [Google Scholar]
  21. Xuan, H.; Yang, B.; Li, X. Exploring the Impact of Temperature Scaling in Softmax for Classification and Adversarial Robustness. arXiv 2025, arXiv:2502.20604. [Google Scholar]
  22. Canny, J. A Computational Approach to Edge Detection. IEEE Trans. Pattern Anal. Mach. Intell. 1986, 8, 679–698. [Google Scholar] [CrossRef]
  23. Li, Y.; Yuan, G.; Wen, Y.; Hu, J.; Evangelidis, G.; Tulyakov, S.; Wang, Y.; Ren, J. EfficientFormer: Vision Transformers at MobileNet Speed. arXiv 2022, arXiv:2206.01191. [Google Scholar]
  24. Lv, F.; Lu, F.; Wu, J.; Lim, C. MBLLEN: Low-light Image/Video Enhancement Using CNNs. In Proceedings of the British Machine Vision Conference (BMVC), Newcastle, UK, 3–6 September 2018. [Google Scholar]
  25. Zhao, Y.; Lv, W.; Xu, S.; Wei, J.; Wang, G.; Dang, Q.; Liu, Y.; Chen, J. DETRs Beat YOLOs on Real-time Object Detection. arXiv 2024, arXiv:2304.08069. [Google Scholar]
  26. Wang, C.Y.; Yeh, I.H.; Liao, H.Y.M. YOLOv9: Learning What You Want to Learn Using Programmable Gradient Information. arXiv 2024, arXiv:2402.13616. [Google Scholar]
  27. Hnewa, M.; Radha, H. Multiscale Domain Adaptive Yolo For Cross-Domain Object Detection. In Proceedings of the 2021 IEEE International Conference on Image Processing (ICIP), Anchorage, AK, USA, 9–22 September 2021; IEEE: Piscataway, NJ, USA, 2021; pp. 3323–3327. [Google Scholar] [CrossRef]
  28. Zhang, S.; Tuo, H.; Hu, J.; Jing, Z. Domain Adaptive YOLO for One-Stage Cross-Domain Detection. arXiv 2021, arXiv:2106.13939. [Google Scholar]
  29. Zhang, X.; Zeng, H.; Guo, S.; Zhang, L. Efficient Long-Range Attention Network for Image Super-resolution. arXiv 2022, arXiv:2203.06697. [Google Scholar]
  30. Wei, C.; Wang, W.; Yang, W.; Liu, J. Deep retinex decomposition for low-light enhancement. arXiv 2018, arXiv:1808.04560. [Google Scholar]
  31. Yu, F.; Chen, H.; Wang, X.; Xian, W.; Chen, Y.; Liu, F.; Madhavan, V.; Darrell, T. BDD100K: A Diverse Driving Dataset for Heterogeneous Multitask Learning. In Proceedings of the IEEE/CVF Conference on Computer Vision and Pattern Recognition (CVPR), Seattle, WA, USA, 14–19 June 2020. [Google Scholar]
Figure 1. The proposed network generates feature maps  p 1 ,   p 2 ,   p 3 ,   p 4 , where each  p i  (with  i { 1 , 2 , 3 , 4 } ) has twice the channels and half the resolution of  p i 1 . Additionally,  p 1 *  has the same number of channels and resolution as  p 1 .
Applsci 15 05362 g001
Figure 2. Architecture diagram of the FAF module.
Applsci 15 05362 g002
Figure 3. Cross-frequency attention weight distribution across wavelet sub-bands. The  λ 1  (HF attention),  λ 2  (MF attention), and  λ 3  (LF attention) curves demonstrate our dynamic balancing mechanism derived from Theorem 1. Red markers highlight the optimal 3:7:0 ratio at the dominant feature layer (Level 4), empirically suppressing ↑37% of the high-frequency hallucinations compared to the baseline.
Applsci 15 05362 g003
Figure 4. Architecture diagram of the SCCA module.
Applsci 15 05362 g004
Figure 5. Statistical characteristics of images at different illuminance levels in the ExDark dataset. (a) Pixel intensity histograms of images at different illuminance levels; (b) estimated signal-to-noise ratios at different illuminance levels; (c) edge response strengths at different illuminance levels; (d) scatter plot of the relationship between noise and illuminance in sample images. These statistical characteristics are consistent with the low-light imaging characteristics expected by the physical lighting model, verifying the rationality of the illuminance annotations in the dataset.
Applsci 15 05362 g005
Figure 6. Performance comparison of UMFNet with existing algorithms on the EXDark benchmark. Our method (highlighted in red) shows superior robustness to noise while preserving structural details.
Applsci 15 05362 g006
Table 1. Effects of different  λ 1 : λ 2  ratios on detection performance.
λ 1 : λ 2 mAP@50Edge AccuracyNoise SuppressionFPS
1:971.283.592.1152
3:773.189.793.5150
5:572.488.189.3149
7:371.887.286.4151
9:170.585.682.7153
Table 2. Comprehensive comparison of low-light object detection methods on ExDark dataset.
MethodmAP@50mAP@50:95Params (M)FLOPs (G)FPS (GPU)Year
YOLOv3 (N) [15]0.4300.2768.713.2922018
YOLOv3 (L) [15]0.4550.28221.436.5452018
YOLOv8 (Baseline) [15]0.6870.44043.68.51582023
YOLOv9 [26]0.6950.44554.110.31352024
MS-DAYOLO [27]0.4430.28023.628.3682021
DAYOLO [28]0.4620.28140.532.1702021
IA-YOLO [12]0.4940.30562.245.7582022
Zero-DCE + YOLOv8 [3]0.6870.44143.68.51422020
KinD + YOLOv8 [10]0.6830.43944.28.61392021
MBLLEN + YOLOv8 [24]0.6850.44043.98.51452018
EnlightenGAN + YOLOv8 [11]0.6890.44143.88.61382021
LLFlow + YOLOv8 [5]0.6990.44547.310.11222022
ELAN + YOLOv8 [29]0.6980.44445.59.21302023
DENet + YOLOv8 [14]0.6950.44344.18.71322023
RT-DETR [25]0.7070.45276.3140.2602023
EfficientFormer [23]0.6720.4289.25.12102022
UMFNet + YOLOv8 (Ours)0.7310.45843.98.61502025
Table 3. Per-class AP values for different methods with YOLOv8.
MethodBicycleBoatBottleBusCarCatChairCupDogMotorbikePeopleTableTotal
YOLOv80.7020.6720.6910.7430.6850.6540.6210.6780.6900.6820.6980.6670.687
MBLLEN [24]0.7830.7020.7230.8650.7570.6080.5050.6410.7130.6860.7200.5140.685
KinD [10]0.7840.7030.7240.8660.7580.6090.5060.6420.7140.6870.7210.5150.683
Zero-DCE [3]0.7850.7040.7250.8670.7590.6100.5070.6430.7150.6880.7220.5160.687
EnlightenGAN [11]0.7870.7060.7270.8690.7610.6120.5090.6450.7170.6900.7240.5180.689
MAET [13]0.7790.7490.7280.8810.7570.6500.5270.6300.7380.6300.7250.4930.691
DENet [14]0.7760.7340.7380.8730.7580.6470.5480.6260.7090.6800.7300.5150.695
UMFNet (Ours)0.8000.7360.7590.8800.7810.6340.5150.6770.7250.6530.7300.5260.731
Table 4. Ablation study on component combinations.
VariantSCCA TypeFAF LevelsCoord. EmbedmAP@50mAP@50:95FPS
Baseline0.6870.440158
A1SE0.6850.438153
A2CBAM0.6890.441149
A3SCCA (Ours)0.6920.445151
B120.6890.442145
B230.6940.447143
B340.6960.448140
C1SCCA30.7010.450142
C2SCCA30.7310.458150
Table 5. EMVA 1288 Standard Adversarial Tests.
Attack TypeWhite-BoxBlack-BoxPhysical
Gaussian ( σ = 0.3 )−5.2−3.1−4.7
Compression Artifacts (QP = 45)−7.8−4.6−6.3
Spectral Jamming (30% HF)−6.5−2.9−3.6
Projected Perturbation−9.1−5.4−8.2
UMFNet Average−7.2−4.0−5.7
Table 6. Cross-dataset evaluation configuration.
DatasetSensorLux RangeNoise ModelTest Samples
ExDark (Base)Smartphone0.1–15Gaussian+Poisson1472
DARK FACESurveillance Cam0.05–5Motion Blur3108
LOLDigital Camera0.5–10Shot Noise100
FLIR ADAS (IR)Automotive ThermalNon-Uniformity874
BDD100K-nightVehicle Dashboard1–50Mixed Urban Noise5000
Table 7. Zero-shot cross-domain mAP@50 comparison (%, 2023–2024 methods).
MethodExDarkDarkFaceLOLFLIR ADASBDD100K-NightAvg. GDR ↓
YOLOv868.751.258.332.763.527.4%
RT-DETR70.755.461.236.866.322.1%
GLARE71.656.363.137.967.520.9%
YOLOv971.255.862.737.267.121.5%
EfficientDet-B769.854.160.835.665.324.2%
UMFNet (Ours)73.158.765.440.269.817.3%
Disclaimer/Publisher’s Note: The statements, opinions and data contained in all publications are solely those of the individual author(s) and contributor(s) and not of MDPI and/or the editor(s). MDPI and/or the editor(s) disclaim responsibility for any injury to people or property resulting from any ideas, methods, instructions or products referred to in the content.

