Article

SPECT and MRI Evaluation of Cerebrovascular Reactivity with CO2 Inhalation—A Preliminary Study

1
Department of Health Science, Graduate School, Gachon University, Incheon 21936, Republic of Korea
2
Department of Neuroscience, Gachon Advanced Institute for Health Sciences & Technology (GAIHST), Gachon University, Incheon 21999, Republic of Korea
3
Department of Biomedical Engineering, College of IT Convergence, Gachon University, Seongnam 13120, Republic of Korea
4
Department of Neurology, Gil Medical Center, College of Medicine, Gachon University, Incheon 21565, Republic of Korea
5
Department of Radiological Science, College of Medical Science, Gachon University, Incheon 21936, Republic of Korea
*
Authors to whom correspondence should be addressed.
These authors contributed equally to this work.
Appl. Sci. 2025, 15(10), 5352; https://doi.org/10.3390/app15105352
Submission received: 31 March 2025 / Revised: 26 April 2025 / Accepted: 8 May 2025 / Published: 10 May 2025
(This article belongs to the Special Issue Advances and Applications of Medical Imaging Physics)

Abstract

:
Assessment of cerebrovascular function is crucial for managing neurological disorders, with cerebral blood flow (CBF) measurement being key. Single photon emission computed tomography (SPECT), a traditional method, uses radiation exposure. Blood oxygenation level-dependent (BOLD) magnetic resonance imaging (MRI) with carbon dioxide (CO2) is a non-invasive cerebrovascular reactivity (CVR) alternative, but direct SPECT-MRI CO2 comparisons for MRI’s replacement potential are limited. This study directly compared CVR from SPECT and MRI CO2 in nine healthy participants. Delay-based MRI (tcMRI) with stimulus timing correction was analyzed alongside conventional MRI. Results showed no significant CVR differences between SPECT and tcMRI (p = 0.688) or SPECT and conventional MRI (p = 0.813), indicating comparable overall CVR. However, tcMRI significantly differed from conventional MRI (p = 0.016) and showed a greater similarity to SPECT. Regionally, the largest CVR differences were observed between tcMRI and conventional MRI, particularly in the cingulate cortex, frontal lobe, and basal ganglia. These discrepancies suggest that tcMRI may capture subtle CVR abnormalities not detected by conventional MRI. The findings support the clinical utility of CO2-MRI, especially with stimulus timing correction, as a safe, repeatable, and radiation-free alternative to SPECT. In particular, tcMRI may offer advantages for repeated CVR assessments in long-term clinical monitoring.

1. Introduction

Recent advances in neuroimaging techniques have revolutionized our understanding of cerebrovascular physiology, highlighting the intricate link between cerebral blood flow (CBF) and various neurological disorders. Cerebrovascular reactivity (CVR), the dynamic capacity of cerebral arterioles to dilate and constrict in response to vasoactive stimuli, is not merely a physiological parameter but a critical homeostatic mechanism. CVR ensures adequate cerebral perfusion across a range of physiological challenges, reflecting the health and resilience of the cerebrovascular system. CVR assessment is clinically relevant for evaluating preoperative prognosis and monitoring functional recovery following neurological events [1,2,3,4]. Several imaging modalities are employed for CVR measurement, including single photon emission computed tomography (SPECT), magnetic resonance imaging (MRI), and positron emission tomography (PET). These techniques typically involve administering a vasodilatory stimulus, such as acetazolamide (ACZ) or CO2, to induce changes in CBF [5,6,7,8,9]. ACZ, a carbonic anhydrase inhibitor, exerts its vasodilatory effect by dilating cerebral arterioles approximately 10–30 min post administration [10,11]. Inhaled CO2, conversely, readily diffuses across the blood–brain barrier, leading to an increased hydrogen ion concentration (lowered pH) through the formation and dissociation of carbonic acid. This pH change directly relaxes cerebral arteriolar smooth muscle, resulting in rapid vasodilation and increased CBF, with the magnitude of vasodilation exhibiting a dose response relationship with CO2 concentration [1,3]. SPECT, using radiopharmaceuticals such as 99mTc-hexamethyl propyleneamine oxime (HMPAO) and ethylcysteinate dimer (ECD), remains a valuable tool for assessing regional CBF due to its widespread availability and established clinical utility [9,12,13,14]. The high quantitative accuracy of 15O-water PET for perfusion measurement comes at the cost of requiring the administration of a radioactive tracer [5].
While MRI offers alternative techniques for assessing CBF, including perfusion MRI and arterial spin labeling (ASL), each approach presents practical considerations. Perfusion MRI, reliant on contrast agents, raises concerns about nephrogenic systemic fibrosis, especially in vulnerable renal populations. ASL, while contrast free, often grapples with inherent limitations in signal to noise ratio and extended scan times [15,16,17,18]. In contrast, blood oxygenation level-dependent (BOLD) functional MRI (fMRI) with CO2 challenge has become a prominent non-invasive approach for CVR assessment [6,19,20,21]. Driven by neurovascular coupling, the BOLD effect arises from neuronal activity induced modulations in CBF, which in turn trigger shifts in deoxyhemoglobin and oxyhemoglobin concentrations, ultimately yielding detectable T2*-weighted signal intensity variations. Building on this mechanistic understanding, the BOLD signal, while commonly interpreted as a surrogate marker for CBF, more comprehensively reflects a multifactorial composite of localized hemodynamic and metabolic variables, prominently including CBF, cerebral blood volume, and oxygen extraction fraction [1,18,22,23].
Despite the widespread clinical use of both SPECT and BOLD MRI for assessing cerebrovascular function, the vasodilatory stimuli used have typically differed; SPECT has primarily employed ACZ in clinical practice, while BOLD MRI has favored CO2 due to its rapid kinetics compatible with fast MRI sequences. As a result, direct comparisons between SPECT and BOLD MRI using the same CO2 stimulus—a method increasingly adopted in MRI studies—remain surprisingly scarce [9,22,24,25,26]. This lack of direct CO2-based comparison is critical, as different vasodilators can elicit distinct cerebrovascular responses, making it difficult to assess the true comparability of the two modalities from studies employing different stimuli. Therefore, this study aimed to directly compare the efficacy of CO2 as a non-invasive vasodilator on CVR measurements obtained using both SPECT and BOLD MRI. We developed a novel CO2-based MRI technique for CVR acquisition and, by measuring CVR in the same participants with both modalities, assessed their agreement directly.

2. Materials and Methods

2.1. Participants

This study was approved by the Institutional Review Board (IRB). In this preliminary study, we recruited 10 healthy participants (eight males and two females, age 23.70 ± 1.77 years). Inclusion criteria for healthy participants included no history of cerebrovascular diseases, no contraindications to MRI, ability to perform the breathing protocol, ensuring sufficient sleep the night before the study, and refraining from factors that could influence CBF on the day of the study, such as caffeine intake or strenuous exercise. All participants provided written informed consent after a thorough explanation of the SPECT imaging and MRI scanning procedures. Data from one participant were excluded due to being unusable for analysis, resulting in a final sample of nine participants. Two participants who inhaled room air instead of CO2 were recruited as the control group in the SPECT experiment to compare the CBF stimulation effect of CO2. We also compared the CO2 SPECT results with data from two patients with microvascular disease who underwent ACZ SPECT.

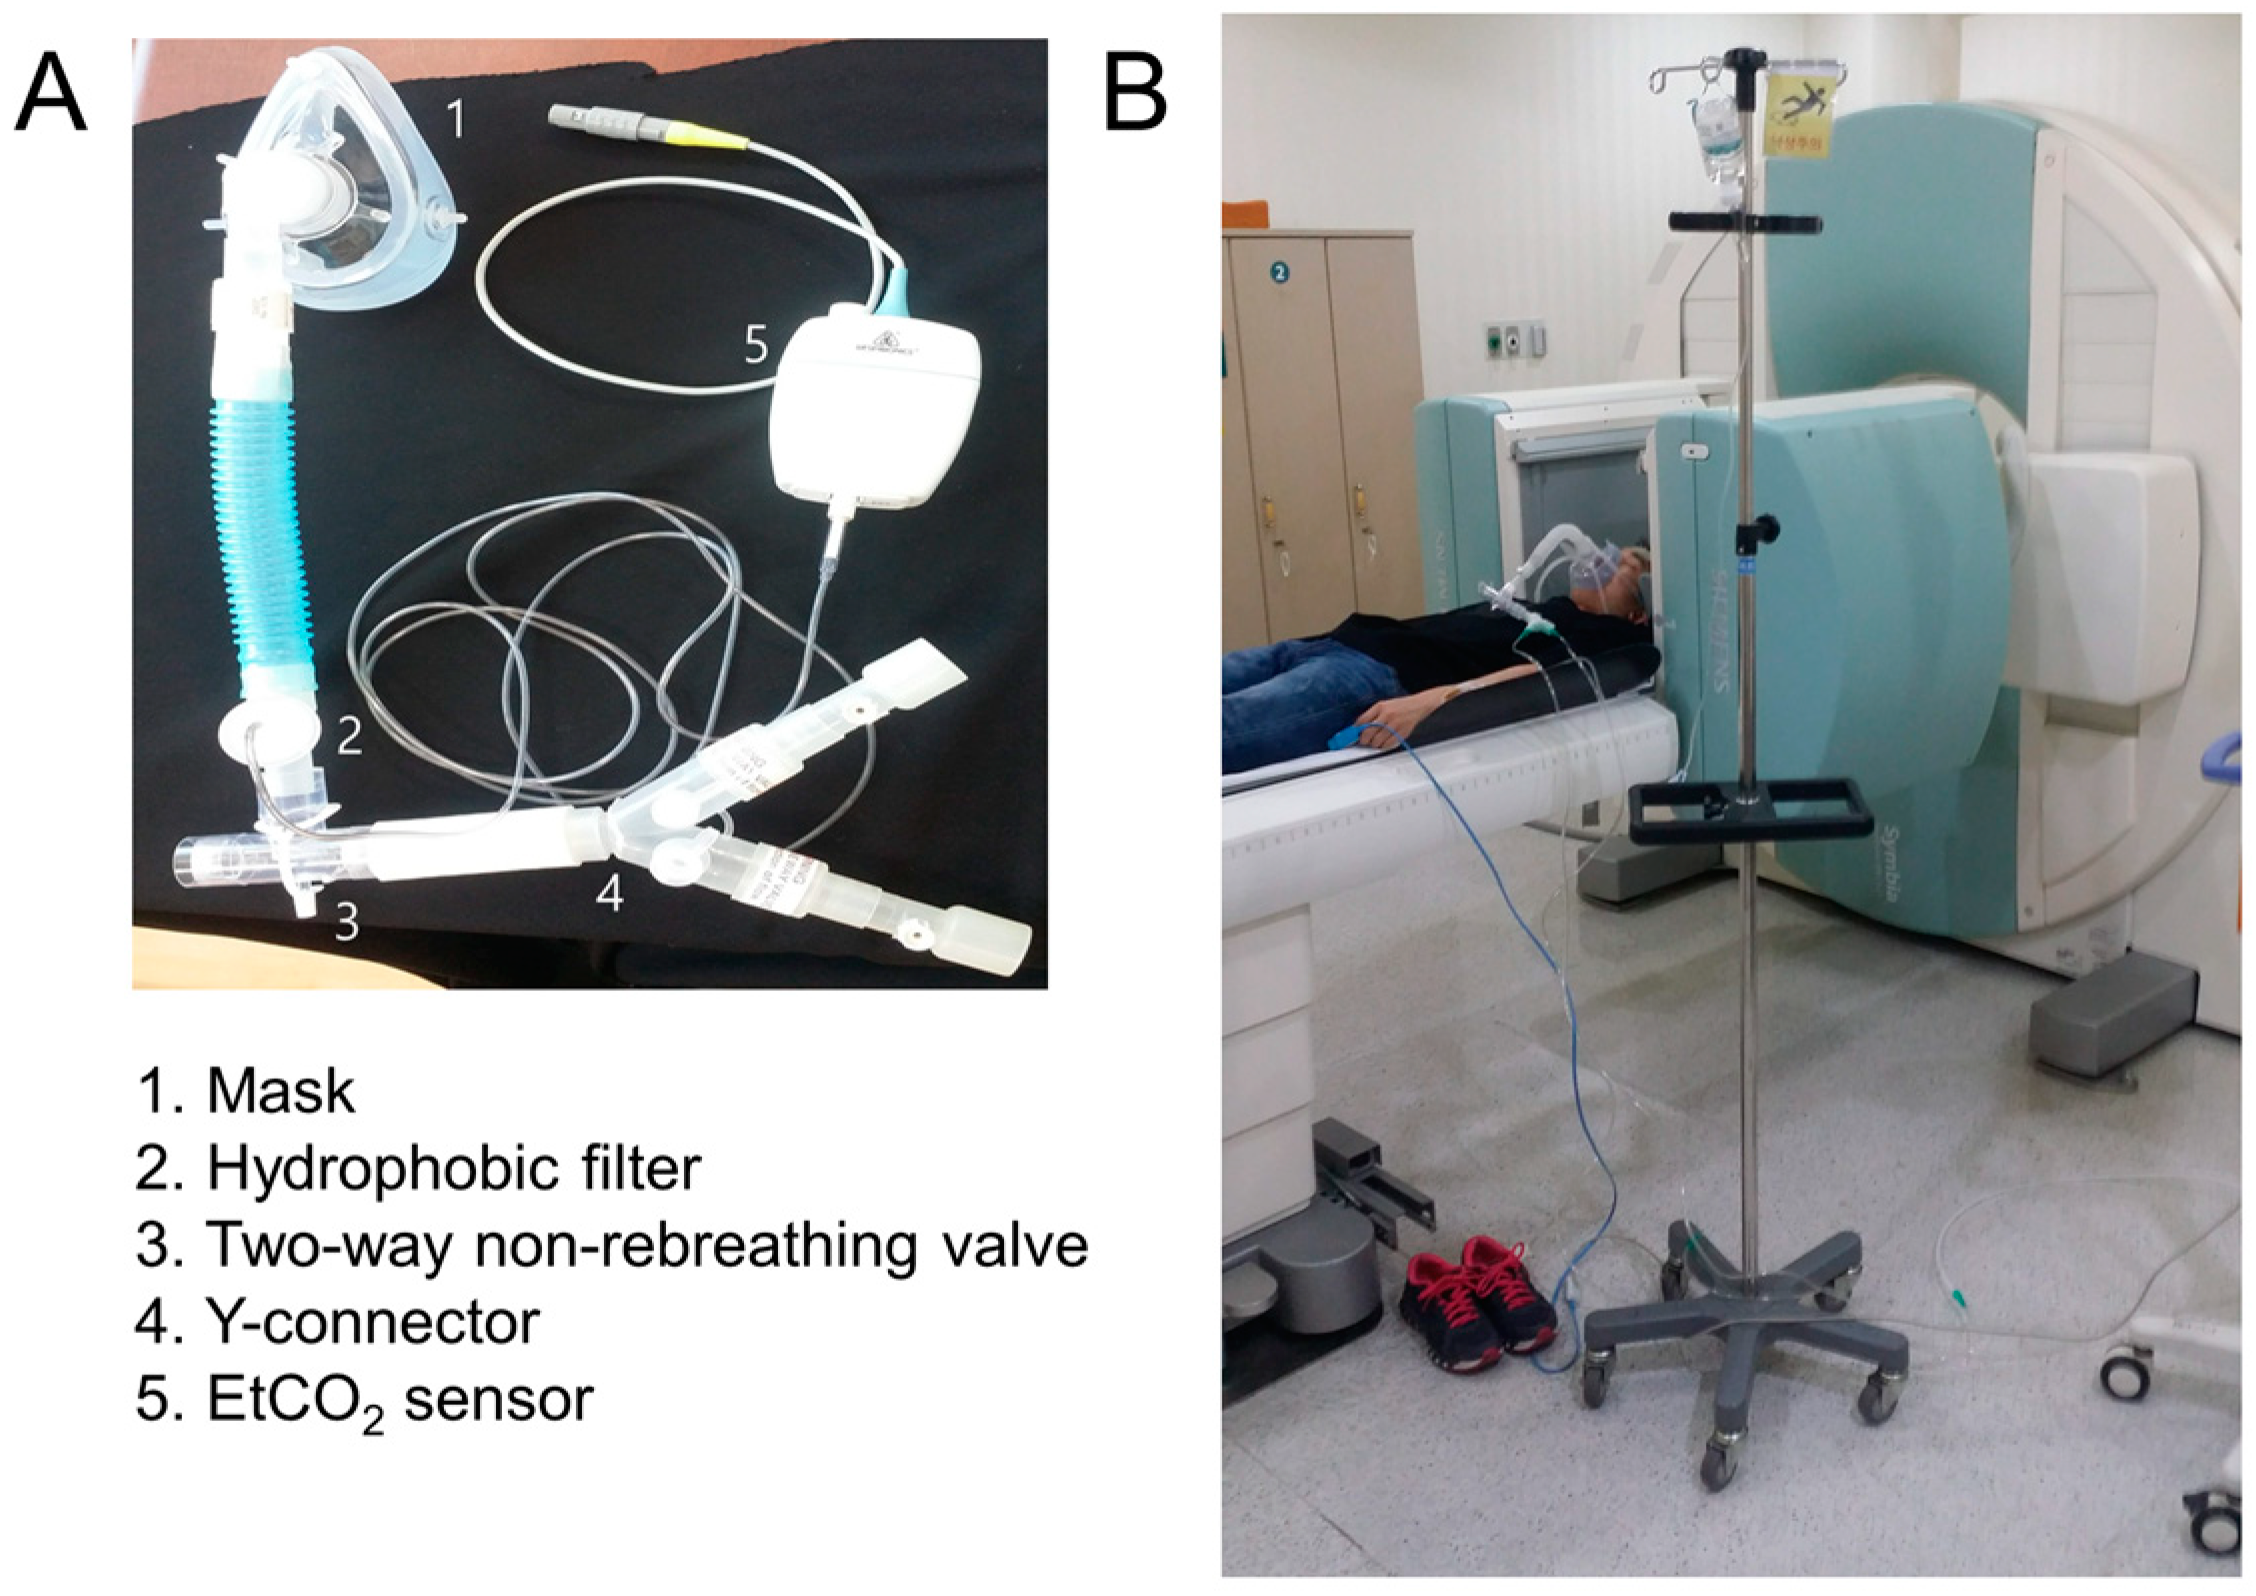
2.2. CO2 Gas Delivery System

The experimental setup included a portable 1000 L gas tank, a mask, and a breathing circuit. The breathing circuit featured a two-way non-rebreathing valve (Vacumetrics Inc., St. Ventura, CA, USA). The gas tank delivered 5% CO2 at a flow rate of 13–15 L/min. During the MRI experiments, participants wore a head radiofrequency coil and breathed through a mask connected to the breathing circuit. Participants could alternate between inhaling 5% CO2 gas and room air via a switch controlled two-way valve integrated into the breathing circuit (Figure 1). A 5 m breathing circuit connected the participants inside the MRI room to the gas tank located outside, with a valve allowing for remote control of the gas flow. In the SPECT experiments, the breathing circuit was shortened to 1 m to minimize gas delivery delays. Blood pressure, heart rate, and respiratory rate were measured using a patient monitoring system (Bionix, BPM-770, Seoul, Republic of Korea). An end-tidal CO2 (EtCO2) sensor (Philips, Loflo Sidestream EtCO2, Cambridge, MA, USA) monitored EtCO2. All measurements were videorecorded for post processing analysis.

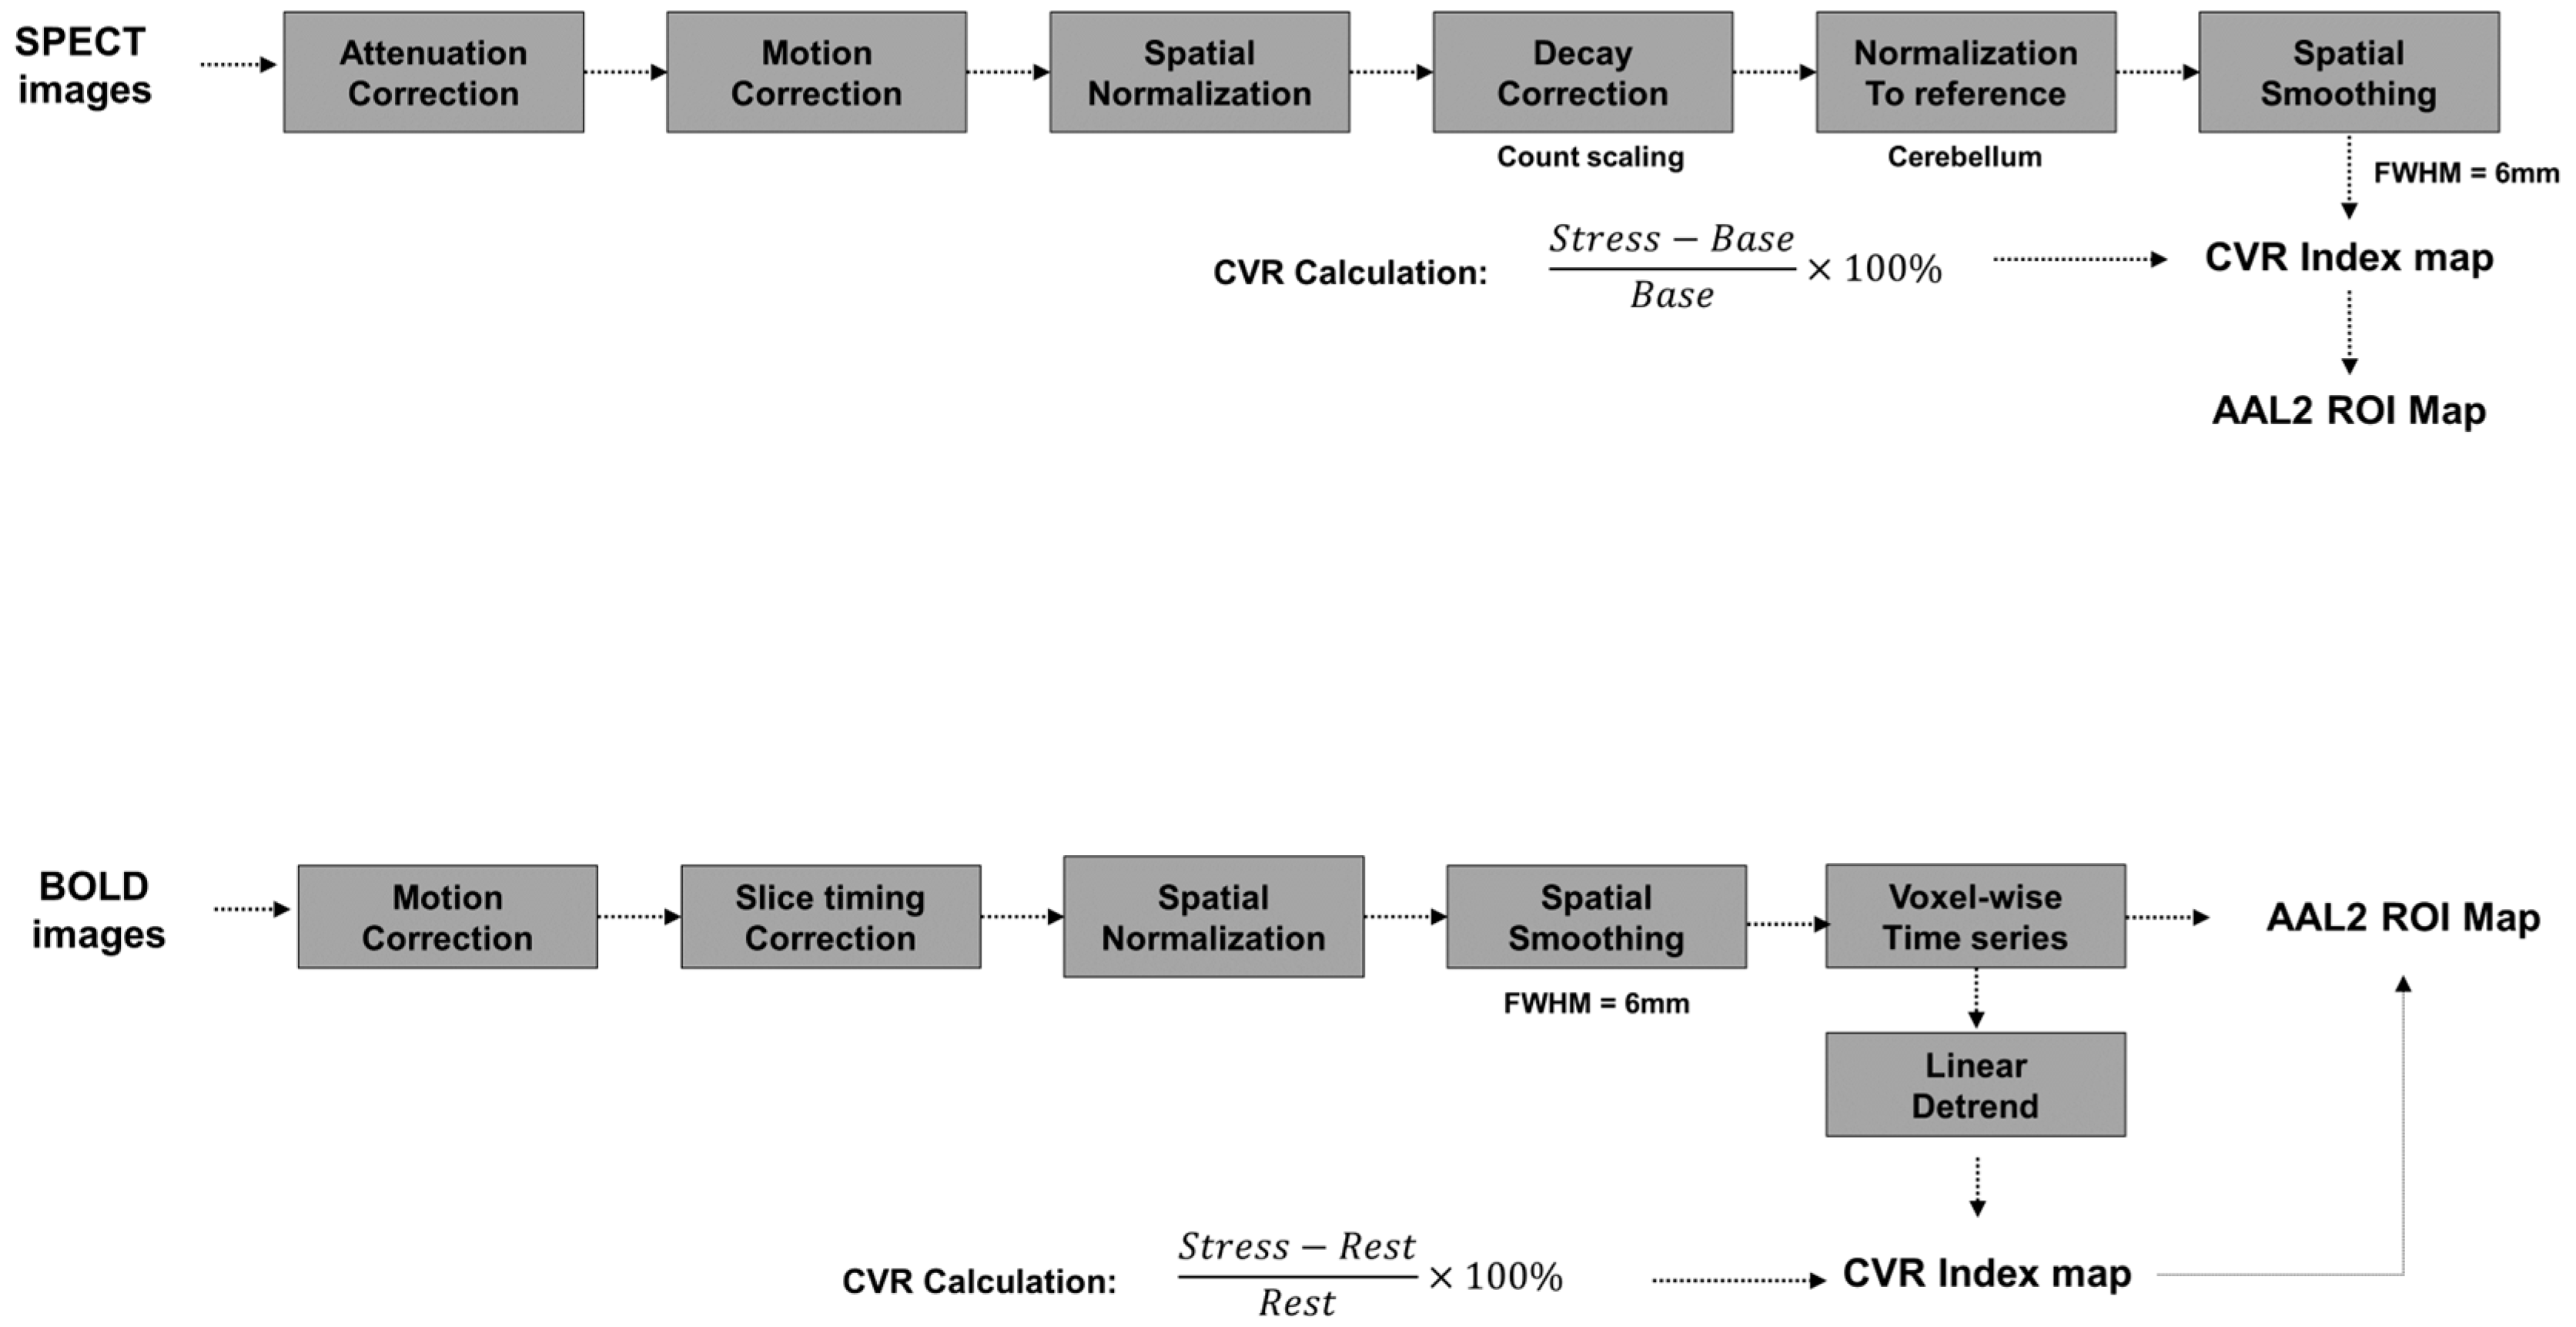
2.3. MRI Acquisition and CVR Processing

Due to limitations in the quality of the acquired EtCO2 data, dynamic analysis of the BOLD response using EtCO2 as a regressor was not feasible in this study. The MRI CO2 experiment employed a block design with a total duration of 10 min. This design alternated between 2 min blocks of room air inhalation (repeated three times) and 2 min blocks of 5% CO2 inhalation (repeated two times). Participants were instructed to lie still in the MRI scanner, focus on the experiment, and avoid active thinking or meditation. MRI data were acquired using a 3T scanner (Magnetom Verio, Siemens, Berlin, Germany) with a 12-channel head matrix coil. To minimize head movement during the MRI scan, sponges were placed between the head coil and the participant’s head.
MRI images were acquired using a two dimensional (2D) gradient echo planar imaging (2D GE-EPI) sequence with the following parameters: repetition time (TR) 2500 ms; echo time (TE) 25 ms; slice thickness 3.5 mm; number of slices 42; matrix size 64 × 64; flip angle 90°; field of view (FOV) 220 × 220 mm2; acquisition time (TA) 10 min 10 s; volumes 244 (including four discarded volumes); voxel size 3.44 × 3.44 × 3.5 mm3. High resolution T1-weighted anatomical images were acquired using the three dimensional (3D) magnetization prepared rapid acquisition of gradient echo sequence with the following parameters: TR 1900 ms; TE 2.93 ms; slice thickness 1 mm; inversion time (TI) 900 ms; number of slices 176; matrix size 256 × 224; flip angle 9°; FOV 256 × 224 mm2; TA 3 min 29 s; voxel size 1 × 1 × 1 mm3; phase partial Fourier 7/8; integrated parallel acquisition technique mode: generalized auto calibrating partially parallel acquisition (GRAPPA) [27]. GRAPPA is a parallel imaging technique that accelerates MRI acquisition by reducing the amount of data collected, utilizing data from multiple receiver coils and calibration lines (specifically, 24 reference lines acquired in the center of k-space in this study) to reconstruct the image. This process allows for faster scans while maintaining acceptable image quality. An acceleration factor of 2 was used along the phase encoding direction.
Data processing of the BOLD images was performed using statistical parametric mapping software (SPM12; Wellcome Trust Centre for Neuroimaging, London, UK) implemented in MATLAB R2022a (MathWorks, Natick, MA, USA), as illustrated in Figure 2. Realignment initiated the preprocessing pipeline for BOLD images, which consisted of several standard steps. To correct subject specific motion during fMRI acquisition, realignment was implemented, employing affine transformations to spatially register functional volumes to a mean reference image. Slice timing correction followed realignment to address temporal variations from sequential slice acquisition, improving time-series analysis fidelity. Spatial normalization to Montreal Neurological Institute (MNI) space for group analysis and inter subject comparison was then performed using non-linear warping. Spatial smoothing was subsequently applied using a 6 mm full width at half-maximum (FWHM) gaussian kernel. Following these preprocessing steps, BOLD time-series were extracted. Subsequently, temporal detrending was performed on the extracted time-series using the detrend function in MATLAB to mitigate low frequency drifts inherent in BOLD signals. The automated anatomical labeling atlas (AAL2) was then utilized to delineate regions of interest (ROIs) within the gray matter (GM) for subsequent analysis [28].
To account for the temporal lag between 5% CO2 inhalation and its subsequent cerebrovascular effects, which are known to occur within tens of seconds in the GM [2,20], we performed a stimulus timing corrected analysis using the SPM12 first-level analysis function. This involved evaluating potential timing corrections in increments of one TR (2.5 s). Given that cerebrovascular responses to hypercapnic stimuli are subject to physiological delays—primarily due to the gas delivery system and respiratory dynamics—they typically emerge within approximately 10 to 30 s after stimulus initiation [2,20]. To accurately align the modeled CO2 onset with the observed BOLD signal change, we sought to identify the optimal physiological delay.
To this end, we systematically shifted the modeled onset of the CO2 stimulus in each participant’s first-level general linear model (GLM), applying delays in 2.5 s increments (the fMRI sampling rate, TR) across a 0 to 50 s range. For each shifted onset, beta-maps were computed for all participants. Subsequently, a one-sample t-test was performed at each time point across subjects to evaluate the group-level response. The physiological delay was determined by identifying the time point at which the mean beta values across the whole brain reached their maximum. This peak was observed at 20 s, which was then applied as the optimized delay in modeling the CO2 stimulus onset (Figure 3). This timing correction was then applied to the transition from air to CO2 inhalation periods. Consequently, the mean BOLD signals for the air inhalation periods were extracted from 0 to 120 s and 261 to 380 s, while the mean BOLD signals for the CO2 inhalation periods were extracted from 141 to 260 s and 381 to 500 s, effectively incorporating the 20 s stimulus timing correction. Finally, the stimulus timing corrected MRI (tcMRI) CVR was calculated as in (1):
C V R = B O L D   C O 2 B O L D   A I R B O L D   ( A I R ) × 100 %

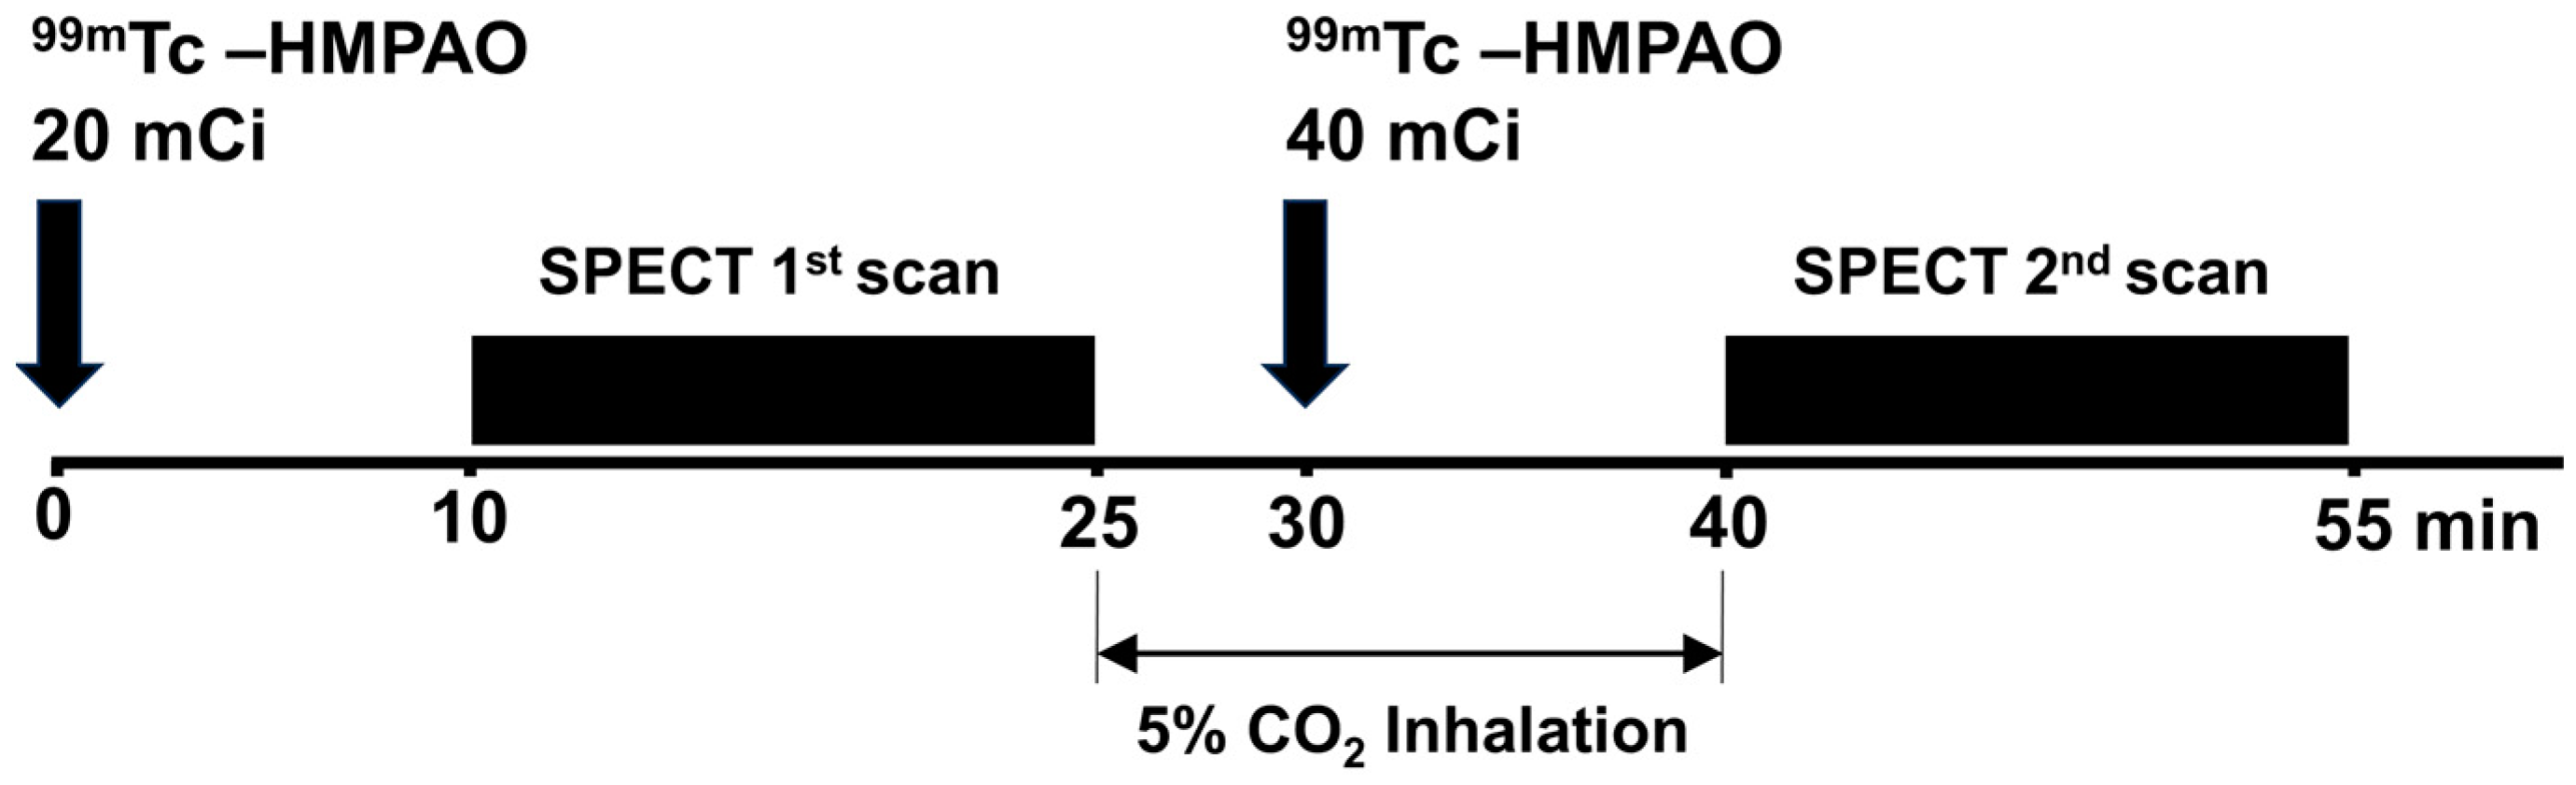
2.4. SPECT Acquisition and CVR Processing

99mTc-HMPAO and one-day protocol were used for SPECT imaging (Figure 4). The one-day protocol allows both pre- and post-vasodilation scans to be completed within a single day, offering convenience for patients by completing both air and 5% CO2 inhalation scans in one visit [10]. For the baseline SPECT scan, participants received an injection of 20 mCi of 99mTc-HMPAO ten minutes before the start of the scan. A 15 min SPECT scan was then performed while the participant inhaled room air. Following this baseline scan, a 5% CO2 gas delivery system was used to administer CO2 for 15 min to induce cerebrovascular stress. Five minutes after the start of the baseline SPECT scan and during this CO2 inhalation period, a second injection of 40 mCi of 99mTc-HMPAO was administered to acquire stress images. This second dose of the radioisotope was allowed to be absorbed by the dilated brain tissue for 10 min while CO2 inhalation continued. Subsequently, a 15 min SPECT scan was conducted to obtain the stress images reflecting the increased cerebral blood flow due to CO2.
SPECT images were obtained using a dual headed rotating gamma camera (Symbia T16; Siemens, Erlangen, Germany) equipped with a low energy, high resolution collimator (LEHR). During acquisition, a total of 32 views were collected with a 128 × 128 matrix and a zoom factor of 1, using a step and shoot mode with 25 s per rotation. The total acquisition time was 55 min. The acquired SPECT images were then reconstructed using a 3D iterative method, followed by the application of a 6.6 mm Gaussian filter. Attenuation correction was performed using Chang’s method [29]. Subsequent preprocessing was performed using SPM12 and in-house MATLAB code. This involved realignment to correct for motion, spatial normalization to the MNI space, and spatial smoothing with a 6 mm FWHM gaussian filter. During this SPM12 preprocessing pipeline, decay correction was applied to compensate for the radioisotope decay between the baseline and stress scans. Following SPM12 preprocessing, intensity normalization was performed using the cerebellum as a reference region to account for global signal differences [30,31]. The resulting preprocessed CBF images were then used to calculate the CVR as in (2). Finally, the CVR values were mapped onto 120 ROIs defined by the AAL2 template.
C V R = S P E C T   C O 2 S P E C T   A I R S P E C T   ( A I R ) × 100 %

2.5. Statistical Analysis

Statistical analyses were conducted using Jamovi software (version 2.3.11; Jamovi Project, Sydney, Australia). All parametric values are reported as mean ± standard deviation (SD). The Wilcoxon signed rank test was used to compare the CVR values across SPECT, tcMRI, and MRI. The top 30% of regions based on SPECT CVR values were selected, and corresponding CVR values were extracted from tcMRI and MRI. This approach focused the regional comparison on areas exhibiting the most robust CVR as measured by the established SPECT technique, providing a basis to assess the agreement and differences in the novel MRI-based methods specifically in regions with significant perfusion responses [16,25]. Repeated measures analysis of variance was used to assess significant differences in CVR values across techniques (SPECT, tcMRI, and MRI) in these selected regions. Where significant differences were found, post hoc comparisons were performed using Scheffé’s test. The standard criterion of statistical significance (p < 0.05) was applied to all analyses.

3. Results

3.1. Participant Characteristics and Group-Level SPECT Results

The clinical characteristics and demographic information of the nine participants are summarized in Table 1. In the SPECT experiment, the CVR value for the room air group (N = 2) was 0.881 ± 4.598. In the CO2 group (N = 7), the CVR was 2.493 ± 4.757. The CVR value for the patient group receiving the ACZ challenge (N = 2) was 1.656 ± 7.909. Following exclusion of the eight vermis ROIs, CVR values were obtained for the affected and contralateral cerebral hemispheres. Patient one (female, 45 years old) had CVR values of 2.813 ± 7.280 for the contralateral hemisphere and −0.297 ± 10.408 for the affected hemisphere. Patient two (male, 64 years old) had CVR values of 2.475 ± 7.100 for the contralateral hemisphere and −0.011 ± 6.028 for the affected hemisphere.

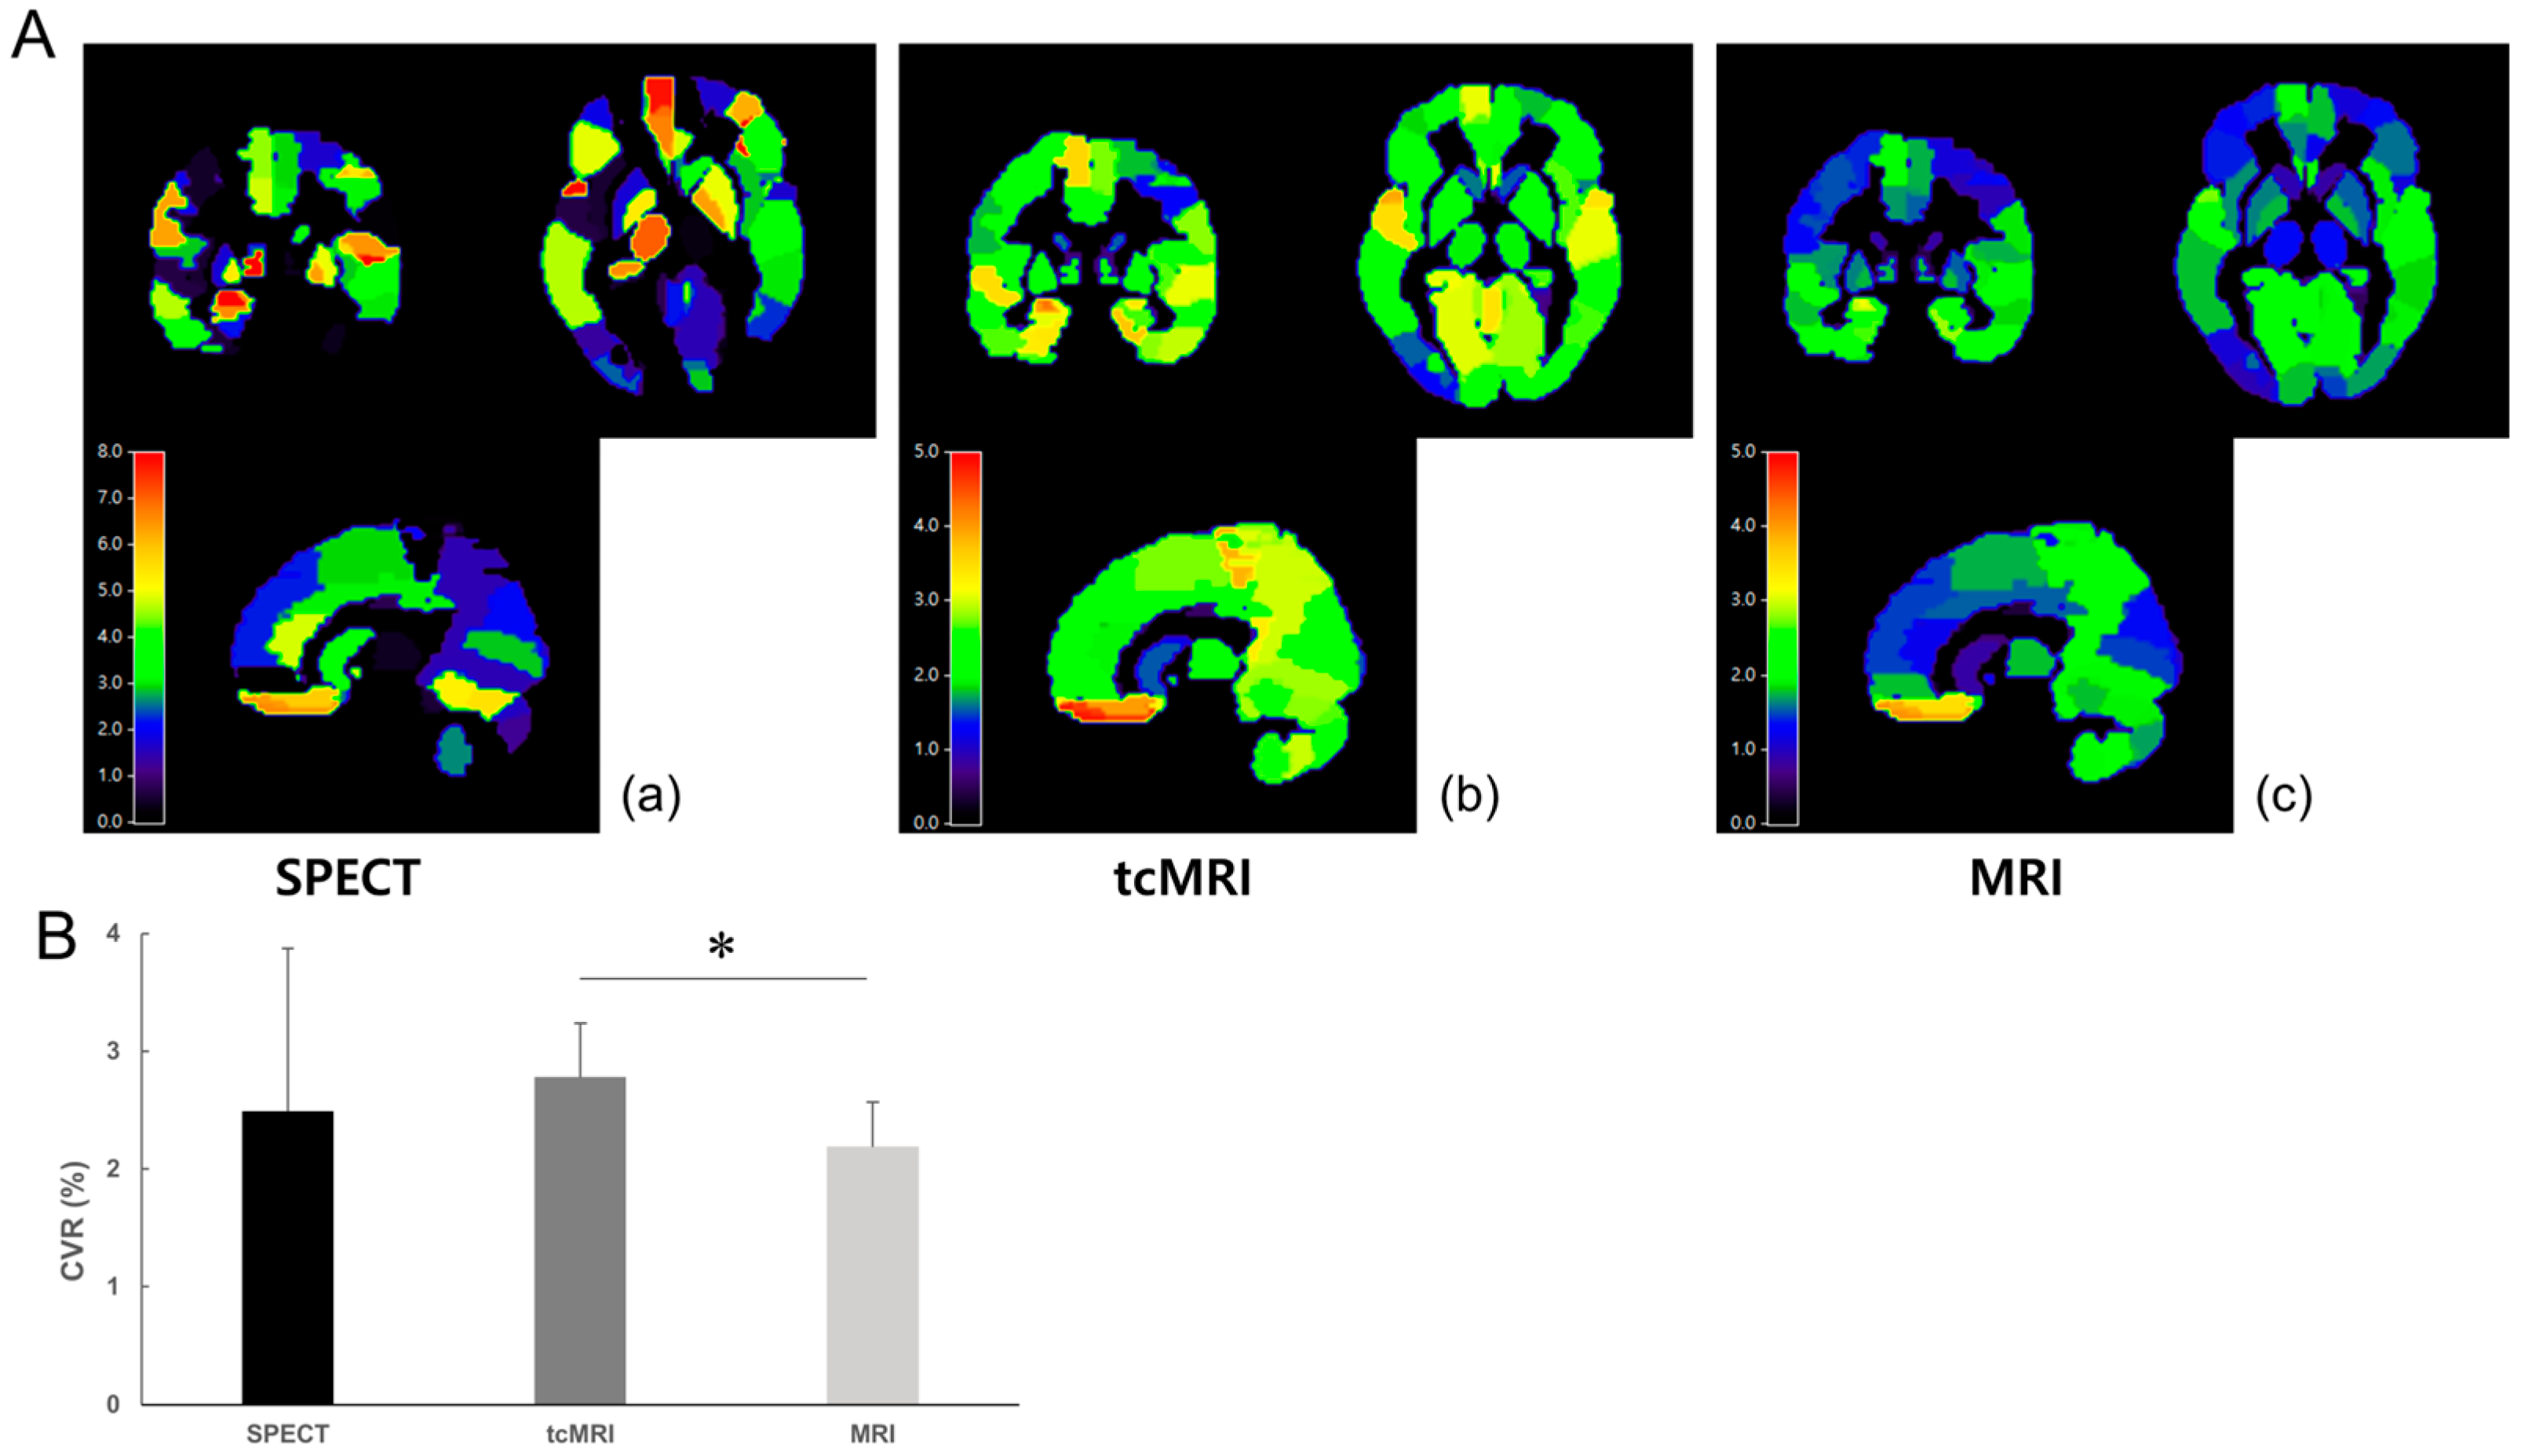
3.2. Group-Level Comparison Between SPECT, tcMRI, and MRI

The tcMRI CVR value estimated using delay correction in the CO2 group was 2.784 ± 0.996, whereas the MRI CVR value was 2.191 ± 0.809. The AAL2 MAP images and CVR values for the entire group are displayed in Figure 5. No significant differences were observed between the SPECT and tcMRI CVR values (p = 0.688) or between the SPECT and MRI CVR values (p = 0.813). However, the tcMRI CVR differed significantly from the MRI CVR when comparing the average CVR values across all 120 ROIs (p = 0.016).

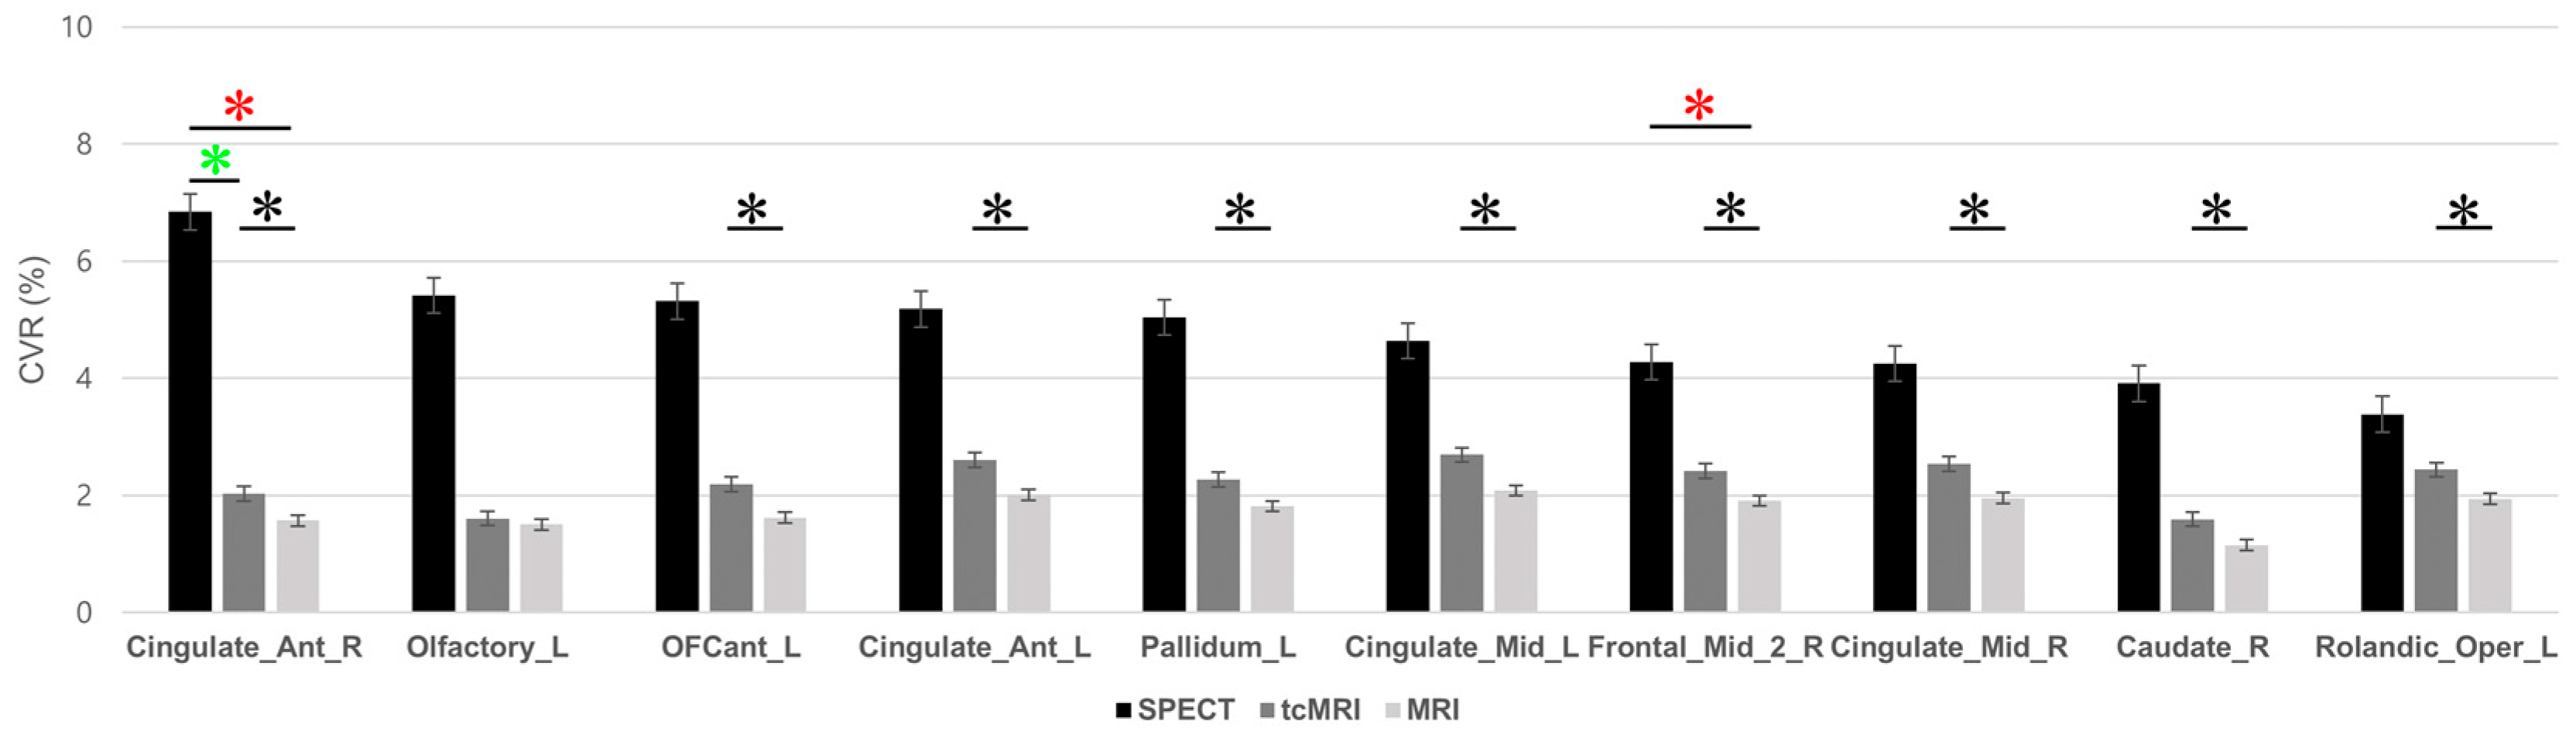
3.3. Regional-Level Comparison and ROI-Specific Differences

Comparison of these regions revealed statistically significant differences between image techniques (Figure 6). (See Appendix A Table A1 for comparisons across all regions). The right anterior cingulate cortex (Cingulate_Ant_R) was the only region that displayed significant variation across all image techniques (p = 0.043, SPECT vs. tcMRI; p = 0.029, SPECT vs. MRI; p = 0.009, tcMRI vs. MRI). The right frontal lobe (Frontal_Mid_2_R) exhibited significant CVR differences between SPECT and MRI (p = 0.045) and between tcMRI and MRI (p = 0.003). Although a significant difference was observed in the left olfactory cortex (Olfactory_L) across image techniques (p = 0.028), post hoc analysis did not reveal significant pairwise comparisons. The greatest number of regions with significant differences in CVR were observed between tcMRI and MRI. Significant differences be-tween tcMRI and MRI were observed in eight regions: left anterior orbital gyrus (OFCant_L) (p = 0.006), left anterior cingulate cortex (Cingulate_Ant_L) (p = 0.004), left pallidum (Pallidum_L) (p = 0.004), left midcingulate cortex (Cingulate_Mid_L) (p < 0.001), right frontal lobe (Frontal_Mid_2_R) (p = 0.003), right midcingulate cortex (Cingu-late_Mid_R) (p < 0.001), right caudate (Caudate_R) (p = 0.003), and left Rolandic operculum (Rolandic_Oper_L) (p < 0.001).

4. Discussion

This study aimed to compare CVR values measured using SPECT and MRI, and to explore the potential of tcMRI as a non-invasive alternative to SPECT. tcMRI, a technique involving timing correction for the stimulus between CO2 administration and its effect on CBF, calculated CVR values using a method with stimulus timing correction to account for the timing of maximum cerebral vessel dilation. Spatial normalization using the AAL2 template facilitated direct regional comparisons. Our findings demonstrate a strong spa-tial agreement between tcMRI and SPECT in CVR assessment, particularly within the top 30% of CVR regions identified by SPECT, where only a single region showed a discrepancy. In a healthy population, some degree of physiological variability is expected; therefore, this high concordance supports the use of tcMRI as a comparable, yet less invasive, alternative to SPECT for CVR assessment avoiding the use of radioisotopes.
Oku et al. established SPECT CO2 image acquisition timing based on 99mTc-HMPAO injection protocols, demonstrating the validity of this approach in patients with cerebrovascular disease [7]. Our study employed a modified protocol with a doubled 99mTc-HMPAO dose at the same acquisition time. The observed difference in mean CVR between the O2 and CO2 inhalation groups in our SPECT experiments further validates the vasodilatory effect of CO2 and demonstrates the reproducibility of SPECT CVR measurements.
While ACZ typically elicits a more potent vasodilatory response than CO2, we observed lower CVR values in patients with cerebrovascular disease compared to healthy individuals, with near zero CVR in the affected hemisphere and values comparable to the CO2 group in the contralateral hemisphere, resulting in a lower overall average [2,10]. Although ACZ has been widely used as a vasodilatory challenge in SPECT, its use has been associated with safety concerns due to reported side effects and limitations for re-peated evaluations due to its sustained effect. In contrast, CO2 offers a safer profile with minimal side effects and immediate, readily reversible vasodilation, making it particularly well suited for repeated CVR assessments [1,19]. Building upon this, tcMRI, as a non-invasive technique utilizing the CO2 stimulus, presents a distinct advantage for repeated evaluations in clinical practice, especially for follow-up assessments. While SPECT can be valuable for the initial evaluation of CBF changes in neurological disorders, long-term follow-up often relies on MRI to assess anatomical recovery. Integrating tcMRI during these MRI follow-up visits allows for the quantitative assessment of CVR recovery without additional radiation exposure [16]. This is particularly valuable for identifying brain regions where CVR remains impaired despite apparent anatomical recovery on structural MRI, providing crucial information for predicting functional outcomes and guiding personalized treatment strategies [8]. Furthermore, for patients requiring frequent monitoring due to chronic conditions like Moyamoya disease, where cumulative radiation dose from repeated SPECT scans is a significant concern, tcMRI offers a safe and effective alternative for serial CVR evaluation [22].
In clinical practice, tcMRI could be integrated into routine brain MRI protocols during follow-up visits for patients with cerebrovascular risk, allowing for non-invasive functional monitoring without altering existing workflows. Its potential utility extends beyond rare conditions such as Moyamoya disease to broader populations, including patients with small vessel disease or vascular cognitive impairment. As the method relies on CO2 inhalation without contrast agents or radiation, it may be particularly beneficial for elderly or vulnerable patients requiring repeated evaluation. With further validation and standardization, tcMRI could be implemented as a supplementary module in clinical MRI platforms, enabling the assessment of both structural and functional recovery in a single session.
Other techniques have been traditionally employed for CVR assessment. The development of BOLD fMRI has positioned CO2 as a valuable and increasingly popular stimulus, leveraging the inherent advantages of MRI [3,4,20,21,22]. The intended dynamic analysis of BOLD CVR using EtCO2 data was not feasible in this study due to the poor signal quality of the acquired EtCO2 measurements, which hindered reliable processing and interpretation. Despite this limitation, we adopted a static analysis approach to directly compare the overall magnitude and spatial patterns of CVR obtained from fMRI with the static measures from SPECT, which was the primary focus of our investigation.
Typically, BOLD CVR studies employ a General Linear Model (GLM) with EtCO2 as a regressor to model the dynamic relationship between EtCO2 fluctuations and BOLD signal changes, allowing for the estimation of parameters such as time to peak [1,6,32]. However, given that our primary research question focused on comparing the spatial patterns of overall CVR as measured by SPECT and fMRI, and that SPECT provides a static measure of CBF change [21], a static analysis of our CO2 BOLD CVR data allowed for a more direct comparison between the two modalities. This method, similar to approaches used in ACZ MRI studies when dynamic EtCO2 data are unavailable, involved averaging the BOLD signal change within a predefined time window following CO2 administration [2,20].
While this static approach does not allow for a detailed assessment of the temporal dynamics of the BOLD response, it provided a comparable CVR metric to our SPECT data, enabling us to address our research question regarding the spatial concordance of CVR between these two imaging modalities. Moreover, by incorporating stimulus timing correction, tcMRI improves the temporal alignment between the CO2 challenge and the resulting BOLD signal. This enhances model fit and the accuracy of CVR estimation, which likely explains the significantly stronger spatial agreement with SPECT observed in this study. In contrast, conventional BOLD analysis without timing correction may underestimate or mislocalize CVR effects, particularly in regions with variable hemodynamic latency. The validity of static BOLD CVR measures has been supported by comparisons with other techniques like ASL [25], and our study aimed to directly compare CO2 induced CVR using a static BOLD approach with SPECT CVR also induced by CO2. Future studies should prioritize incorporating EtCO2 monitoring to enable more comprehensive dynamic BOLD CVR analysis and further validation of the current findings. Specifically, methodological improvements in EtCO2 measurement are crucial, including the use of advanced gas control systems that ensure stable CO2 delivery and accurate response, and the implementation of robust digital recording systems for accurate temporal synchronization of EtCO2 data with BOLD signal acquisition. With high-quality EtCO2 data, future work can employ dynamic analysis approaches. These include using GLM with EtCO2 and its temporal derivatives as regressors to model the temporal characteristics of the BOLD response and estimate parameters such as time to peak [1,4], or applying transfer function analysis between EtCO2 and BOLD signals to estimate detailed hemodynamic parameters and phase delays [20]. In addition, the application of simultaneous imaging techniques such as PET-MR or SPECT-MR to address the possibility of changes in the physiological state of the sample resulting from non-simultaneous acquisition of images would provide an interesting avenue for future research in this field [33].
In summary, this study demonstrated a strong spatial agreement in CVR between the novel tcMRI technique and SPECT, particularly in high CVR regions. Furthermore, SPECT revealed CVR abnormalities in a patient group with cerebrovascular disease, suggesting its continued clinical utility [34]. While overall CVR measures showed agreement, regional analysis revealed significant differences between tcMRI and conventional MRI in eight specific regions (OFCant_L, Cingulate_Ant_L, Pallidum_L, Cingulate_Mid_L, Frontal_Mid_2_R, Cingulate_Mid_R, Caudate_R, and Rolandic_Oper_L). The significant differences observed in these regions suggest distinct CVR estimation by tcMRI compared to conventional MRI. While these regional differences were found in healthy participants, their occurrence in these specific brain regions supports the potential future clinical utility of tcMRI for assessing CVR in these areas in patient populations. Further research is needed to validate these regional findings and explore their clinical significance in patient cohorts. These preliminary findings are promising and support the potential of tcMRI, but several limitations highlight the critical need for rigorous validation and further clinical investigation to pave the way for its broader clinical adoption.
While these preliminary findings are promising, several limitations warrant consideration. The small sample size necessitates further research with larger patient cohorts to confirm these results and explore the broad clinical implications of CO2 MRI across various cerebrovascular conditions. In addition, further studies should prioritize direct, within subject comparisons between CO2 SPECT and CO2 MRI, with a specific focus on regions exhibiting lower CVR.
Furthermore, further investigation into the observed discrepancy in the Cingulate_Ant_R, potentially using more detailed regional analyses or incorporating additional physiological measures, is also warranted. Methodologically, future research could benefit from exploring the application of cerebellar normalization in MRI patient populations.

5. Conclusions

In conclusion, this study demonstrates the comparable spatial information on CVR provided by the novel tcMRI technique and SPECT, particularly in high CVR regions. The findings also highlight the clinical utility of SPECT in identifying CVR abnormalities in patients with cerebrovascular disease. These results support the continued investigation of tcMRI as a non-invasive alternative for CVR assessment.

Author Contributions

Conceptualization, Y.-D.S., Y.-B.L. and C.-K.K.; methodology, Y.-D.S., Y.-B.L. and C.-K.K.; software, M.-G.S., J.-M.S. and C.-K.K.; validation, Y.-D.S., Y.-B.L. and C.-K.K.; formal analysis, M.-G.S., J.-M.S. and C.-K.K.; investigation, M.-G.S., J.-M.S. and C.-K.K.; resources, Y.-B.L. and C.-K.K.; data curation, Y.-D.S., Y.-B.L. and C.-K.K.; writing—original draft preparation, M.-G.S., J.-M.S. and C.-K.K.; writing—review and editing, Y.-B.L. and C.-K.K.; visualization, M.-G.S., J.-M.S. and C.-K.K.; supervision, Y.-D.S., Y.-B.L. and C.-K.K.; project administration, Y.-B.L. and C.-K.K.; funding acquisition, Y.-B.L. and C.-K.K. All authors have read and agreed to the published version of the manuscript.

Funding

This research was funded by a National Research Foundation of Korea (NRF) grant funded by the Korean government (MSIT) (2020R1A2C1004355 and 2022R1F1A1062766) ©.

Institutional Review Board Statement

This study was conducted in accordance with the Declaration of Helsinki and approved by the Institutional Review Board of Gachon University (IRB No. GDIRB2018-308).

Informed Consent Statement

Informed consent was obtained from all the participants involved in the study.

Data Availability Statement

The data presented in this study are available upon request from the corresponding author.

Acknowledgments

This experiment was conducted at the Gachon University Medical Campus.

Conflicts of Interest

The authors declare no competing financial interests or personal relationships that may have influenced the work reported in this study.

Appendix A

Table A1. The stimulus timing corrected functional magnetic resonance imaging (tcMRI) and MRI cerebrovascular reactivity (CVR) values were calculated based on the regions of interest (ROI) sorted by the top 30% of single photon emission computed tomography (SPECT) CVR values. Bold p-values indicate statistical significance.
ROI NameSPECTtcMRIMRIFp
Cingulate_Ant_R6.842 ± 3.5802.028 ± 0.3901.571 ± 0.24012.350.001
Vermis_1_26.357 ± 10.6703.131 ± 0.4802.546 ± 0.6000.6750.527
Vermis_36.229 ± 10.2903.242 ± 0.5602.514 ± 0.4900.6660.532
Cerebelum_3_R5.941 ± 6.5602.904 ± 0.5402.324 ± 0.4701.5140.259
Olfactory_L5.412 ± 3.9901.605 ± 1.0801.504 ± 0.9004.8970.028
OFCant_L5.314 ± 3.7402.191 ± 1.1501.617 ± 1.0807.8280.007
Cingulate_Ant_L5.183 ± 2.8402.604 ± 0.4402.012 ± 0.2806.3030.013
Pallidum_L5.041 ± 3.5502.270 ± 0.2601.815 ± 0.2804.5200.034
Supp_Motor_Area_L4.939 ± 3.4103.126 ± 0.5102.433 ± 0.4002.6740.110
Vermis_104.879 ± 5.4102.633 ± 0.8102.287 ± 0.8601.2000.335
Frontal_Inf_Oper_R4.743 ± 3.8402.412 ± 0.4601.950 ± 0.4002.9960.088
Vermis_74.723 ± 6.3903.676 ± 1.1102.971 ± 1.0600.3160.735
Pallidum_R4.715 ± 6.4502.389 ± 0.3301.927 ± 0.3800.9280.422
Cingulate_Mid_L4.638 ± 2.3902.694 ± 0.3902.083 ± 0.2806.1510.014
Vermis_4_54.462 ± 7.7903.440 ± 0.6302.667 ± 0.6200.2490.784
Rectus_R4.287 ± 3.6301.649 ± 1.4201.560 ± 1.1402.7120.107
Frontal_Mid_2_R4.278 ± 1.8102.418 ± 0.4101.907 ± 0.4709.7700.003
Cingulate_Mid_R4.251 ± 2.1402.536 ± 0.4601.955 ± 0.3404.6680.032
Putamen_R4.212 ± 5.0102.079 ± 0.2901.673 ± 0.2501.3230.303
OFCmed_R4.209 ± 4.0602.013 ± 1.7501.874 ± 1.5401.3840.288
Heschl_R4.150 ± 4.3403.302 ± 0.8302.577 ± 0.6700.4990.619
OFCmed_L4.075 ± 3.4201.135 ± 1.1801.161 ± 1.2803.7570.054
Insula_R4.026 ± 3.8102.539 ± 0.4102.033 ± 0.2801.5280.256
Vermis_83.980 ± 7.0603.196 ± 0.7602.618 ± 0.6900.1550.858
Frontal_Inf_Oper_L3.954 ± 3.4701.951 ± 0.5601.581 ± 0.4102.7450.104
Caudate_R3.912 ± 2.9001.594 ± 0.4001.149 ± 0.2805.3360.022
OFCant_R3.876 ± 3.3902.500 ± 1.1901.883 ± 1.1001.4570.271
Rectus_L3.847 ± 4.9301.284 ± 0.9801.158 ± 0.7901.5530.251
Angular_R3.763 ± 4.2802.283 ± 0.7501.843 ± 0.6900.9410.417
Caudate_L3.632 ± 3.2101.644 ± 0.3001.200 ± 0.2103.1360.08
Parietal_Inf_L3.618 ± 2.7702.232 ± 0.5401.761 ± 0.4102.0750.168
Precentral_R3.537 ± 3.3402.113 ± 0.6301.680 ± 0.4701.4590.271
Paracentral_Lobule_R3.425 ± 3.6003.300 ± 0.6102.392 ± 0.4900.4510.647
Rolandic_Oper_L3.384 ± 1.7202.439 ± 0.4201.939 ± 0.3203.9570.048
Vermis_63.367 ± 4.9603.969 ± 0.9303.153 ± 0.8700.1540.859
Supp_Motor_Area_R3.344 ± 2.2002.821 ± 0.5402.156 ± 0.4201.2330.326
Abbreviations: Angular_R, Right angular gyrus; Caudate_L, Left caudate nucleus; Caudate_R, Right caudate; Cerebellum_3_R, Right lobule III of the cerebellum; Cingulate_Ant_L, Left anterior cingulate cortex; Cingulate_Ant_R, Right anterior cingulate cortex; Cingulate_Mid_L, Left midcingulate cortex; Cingulate_Mid_R, Right midcingulate cortex; Frontal_Inf_Oper_L, Left inferior frontal operculum; Frontal_Inf_Oper_R, Right inferior frontal operculum; Frontal_Mid_2_R, Right frontal lobe; Heschl_R, Right Heschl’s gyrus; Insula_R, Right insula; Olfactory_L, Left olfactory cortex; OFCant_L, Left anterior orbital frontal cortex; OFCant_R, Right anterior orbital frontal cortex; OFCmed_L, Left medial orbital frontal cortex; OFCmed_R, Right medial orbital frontal cortex; Pallidum_L, Left globus pallidus; Pallidum_R, Right globus pallidus; Paracentral_Lobule_R, Right paracentral lobule; Parietal_Inf_L, Left inferior parietal lobe; Precentral_R, Right precentral gyrus; Putamen_R, Right putamen; Rectus_L, Left rectus gyrus; Rectus_R, Right rectus gyrus; Rolandic_Oper_L, Left Rolandic operculum; Supp_Motor_Area_L, Left supplementary motor area; Supp_Motor_Area_R, Right supplementary motor area; Vermis_1_2, Superior vermis (lobule I-II); Vermis_3, Superior vermis (lobule III); Vermis_4_5, Superior vermis (lobules IV-V); Vermis_6, Superior vermis (lobule VI); Vermis_7, Superior vermis (lobule VII); Vermis_8, Superior vermis (lobule VIII); Vermis_10, Superior vermis (lobule X).

References

  1. Liu, P.; De Vis, J.B.; Lu, H. Cerebrovascular Reactivity (CVR) MRI with CO2 Challenge: A Technical Review. NeuroImage 2019, 187, 104–115. [Google Scholar] [CrossRef] [PubMed]
  2. Dogra, S.; Wang, X.; Gupta, A.; Veraart, J.; Ishida, K.; Qiu, D.; Dehkharghani, S. Acetazolamide-Augmented BOLD MRI to Assess Whole-Brain Cerebrovascular Reactivity in Chronic Steno-Occlusive Disease Using Principal Component Analysis. Radiology 2023, 307, e221473. [Google Scholar] [CrossRef] [PubMed]
  3. Juttukonda, M.R.; Donahue, M.J. Neuroimaging of Vascular Reserve in Patients with Cerebrovascular Diseases. NeuroImage 2019, 187, 192–208. [Google Scholar] [CrossRef]
  4. Fisher, J.A.; Venkatraghavan, L.; Mikulis, D.J. Magnetic Resonance Imaging–Based Cerebrovascular Reactivity and Hemodynamic Reserve. Stroke 2018, 49, 2011–2018. [Google Scholar] [CrossRef]
  5. Ito, H.; Kanno, I.; Kato, C.; Sasaki, T.; Ishii, K.; Ouchi, Y.; Iida, A.; Okazawa, H.; Hayashida, K.; Tsuyuguchi, N.; et al. Database of Normal Human Cerebral Blood Flow, Cerebral Blood Volume, Cerebral Oxygen Extraction Fraction and Cerebral Metabolic Rate of Oxygen Measured by Positron Emission Tomography with 15O-Labelled Carbon Dioxide or Water, Carbon Monoxide and Oxygen: A Multicentre Study in Japan. Eur. J. Nucl. Med. Mol. Imaging 2004, 31, 635–643. [Google Scholar] [CrossRef] [PubMed]
  6. Yezhuvath, U.S.; Lewis-Amezcua, K.; Varghese, R.; Xiao, G.; Lu, H. On the Assessment of Cerebrovascular Reactivity Using Hypercapnia BOLD MRI. NMR Biomed. 2009, 22, 779–786. [Google Scholar] [CrossRef]
  7. Oku, N.; Matsumoto, M.; Hashikawa, K.; Moriwaki, H.; Okazaki, Y.; Seike, Y.; Handa, N.; Uehara, T.; Kamada, T.; Nishimura, T. Carbon Dioxide Reactivity by Consecutive Technetium-99m-HMPAO SPECT in Patients with a Chronically Obstructed Major Cerebral Artery. J. Nucl. Med. 1994, 35, 32–40. [Google Scholar]
  8. Chen, D.-W.; Zheng, J.; Shi, J.; Yin, Y.; Song, C.; Yang, F.; Zhang, Y.-Q.; Ma, L.-N. Assessment of the Cerebral Hemodynamic Benefits of Carotid Artery Stenting for Patients with Preoperative Hemodynamic Impairment Using Cerebral Single Photon Emission Computed Tomography (SPECT) and Carbon Dioxide Inhalation. Med. Sci. Monit. 2018, 24, 5398–5404. [Google Scholar] [CrossRef]
  9. Ma, J.; Mehrkens, J.H.; Holtmannspoetter, M.; Linke, R.; Schmid-Elsaesser, R.; Steiger, H.-J.; Brueckmann, H.; Bruening, R. Perfusion MRI before and after Acetazolamide Administration for Assessment of Cerebrovascular Reserve Capacity in Patients with Symptomatic Internal Carotid Artery (ICA) Occlusion: Comparison with 99mTc-ECD SPECT. Neuroradiology 2007, 49, 317–326. [Google Scholar] [CrossRef]
  10. Wong, T.H.; Shagera, Q.A.; Ryoo, H.G.; Ha, S.; Lee, D.S. Basal and Acetazolamide Brain Perfusion SPECT in Internal Carotid Artery Stenosis. Nucl. Med. Mol. Imaging 2020, 54, 9–27. [Google Scholar] [CrossRef]
  11. Swenson, E.R. New Insights into Carbonic Anhydrase Inhibition, Vasodilation, and Treatment of Hypertensive-Related Diseases. Curr. Hypertens. Rep. 2014, 16, 467. [Google Scholar] [CrossRef]
  12. Koyama, M.; Kawashima, R.; Ito, H.; Ono, S.; Sato, K.; Goto, R.; Kinomura, S.; Yoshioka, S.; Sato, T.; Fukuda, H. SPECT Imaging of Normal Subjects with Technetium-99m-HMPAO and Technetium-99m-ECD. J. Nucl. Med. 1997, 38, 587–592. [Google Scholar]
  13. Catafau, A.M. Brain SPECT in Clinical Practice. Part I: Perfusion*. J. Nucl. Med. 2001, 42, 259–271. [Google Scholar] [PubMed]
  14. Choi, H.; Yoo, M.Y.; Cheon, G.J.; Kang, K.W.; Chung, J.-K.; Lee, D.S. Parametric Cerebrovascular Reserve Images Using Acetazolamide 99mTc-HMPAO SPECT: A Feasibility Study of Quantitative Assessment. Nucl. Med. Mol. Imaging 2013, 47, 188–195. [Google Scholar] [CrossRef] [PubMed]
  15. Blockley, N.P.; Harkin, J.W.; Bulte, D.P. Rapid Cerebrovascular Reactivity Mapping: Enabling Vascular Reactivity Information to Be Routinely Acquired. NeuroImage 2017, 159, 214–223. [Google Scholar] [CrossRef]
  16. Leoni, R.F.; Mazzetto-Betti, K.C.; Silva, A.C.; Dos Santos, A.C.; de Araujo, D.B.; Leite, J.P.; Pontes-Neto, O.M. Assessing Cerebrovascular Reactivity in Carotid Steno-Occlusive Disease Using MRI BOLD and ASL Techniques. Radiol. Res. Pract. 2012, 2012, 268483. [Google Scholar] [CrossRef] [PubMed]
  17. Iutaka, T.; de Freitas, M.B.; Omar, S.S.; Scortegagna, F.A.; Nael, K.; Nunes, R.H.; Pacheco, F.T.; Maia Júnior, A.C.M.; do Amaral, L.L.F.; da Rocha, A.J. Arterial Spin Labeling: Techniques, Clinical Applications, and Interpretation. RadioGraphics 2023, 43, e220088. [Google Scholar] [CrossRef]
  18. Bulte, D.P.; Kelly, M.; Germuska, M.; Xie, J.; Chappell, M.A.; Okell, T.W.; Bright, M.G.; Jezzard, P. Quantitative Measurement of Cerebral Physiology Using Respiratory-Calibrated MRI. NeuroImage 2012, 60, 582–591. [Google Scholar] [CrossRef]
  19. Spano, V.R.; Mandell, D.M.; Poublanc, J.; Sam, K.; Battisti-Charbonney, A.; Pucci, O.; Han, J.S.; Crawley, A.P.; Fisher, J.A.; Mikulis, D.J. CO2 Blood Oxygen Level–Dependent MR Mapping of Cerebrovascular Reserve in a Clinical Population: Safety, Tolerability, and Technical Feasibility. Radiology 2013, 266, 592–598. [Google Scholar] [CrossRef]
  20. Blockley, N.P.; Driver, I.D.; Francis, S.T.; Fisher, J.A.; Gowland, P.A. An Improved Method for Acquiring Cerebrovascular Reactivity Maps. Magn. Reson. Med. 2011, 65, 1278–1286. [Google Scholar] [CrossRef]
  21. Forté, S.; Sobczyk, O.; Poublanc, J.; Duffin, J.; Hare, G.M.T.; Fisher, J.A.; Mikulis, D.; Kuo, K.H.M. Sickle Cell Cerebrovascular Reactivity to a CO2 Stimulus: Too Little, Too Slow. Front. Physiol. 2022, 13, 886807. [Google Scholar] [CrossRef] [PubMed]
  22. Hauser, T.-K.; Seeger, A.; Bender, B.; Klose, U.; Thurow, J.; Ernemann, U.; Tatagiba, M.; Meyer, P.T.; Khan, N.; Roder, C. Hypercapnic BOLD MRI Compared to H215O PET/CT for the Hemodynamic Evaluation of Patients with Moyamoya Disease. NeuroImage Clin. 2019, 22, 101713. [Google Scholar] [CrossRef] [PubMed]
  23. Blair, G.W.; Doubal, F.N.; Thrippleton, M.J.; Marshall, I.; Wardlaw, J.M. Magnetic Resonance Imaging for Assessment of Cerebrovascular Reactivity in Cerebral Small Vessel Disease: A Systematic Review. J. Cereb. Blood Flow Metab. 2016, 36, 833–841. [Google Scholar] [CrossRef]
  24. Pellaton, A.; Bijlenga, P.; Bouchez, L.; Cuvinciuc, V.; Barnaure, I.; Garibotto, V.; Lövblad, K.-O.; Haller, S. CO2BOLD Assessment of Moyamoya Syndrome: Validation with Single Photon Emission Computed Tomography and Positron Emission Tomography Imaging. World J. Radiol. 2016, 8, 887–894. [Google Scholar] [CrossRef] [PubMed]
  25. Mandell, D.M.; Han, J.S.; Poublanc, J.; Crawley, A.P.; Stainsby, J.A.; Fisher, J.A.; Mikulis, D.J. Mapping Cerebrovascular Reactivity Using Blood Oxygen Level-Dependent MRI in Patients With Arterial Steno-Occlusive Disease. Stroke 2008, 39, 2021–2028. [Google Scholar] [CrossRef]
  26. Fierstra, J.; van Niftrik, C.; Warnock, G.; Wegener, S.; Piccirelli, M.; Pangalu, A.; Esposito, G.; Valavanis, A.; Buck, A.; Luft, A.; et al. Staging Hemodynamic Failure With Blood Oxygen-Level-Dependent Functional Magnetic Resonance Imaging Cerebrovascular Reactivity: A Comparison Versus Gold Standard (15O-)H2O-Positron Emission Tomography. Stroke 2018, 49, 621–629. [Google Scholar] [CrossRef] [PubMed]
  27. Griswold, M.A.; Jakob, P.M.; Heidemann, R.M.; Nittka, M.; Jellus, V.; Wang, J.; Kiefer, B.; Haase, A. Generalized Autocalibrating Partially Parallel Acquisitions (GRAPPA). Magn. Reson. Med. 2002, 47, 1202–1210. [Google Scholar] [CrossRef]
  28. Rolls, E.T.; Joliot, M.; Tzourio-Mazoyer, N. Implementation of a New Parcellation of the Orbitofrontal Cortex in the Automated Anatomical Labeling Atlas. NeuroImage 2015, 122, 1–5. [Google Scholar] [CrossRef]
  29. Chang, L.-T. A Method for Attenuation Correction in Radionuclide Computed Tomography. IEEE Trans. Nucl. Sci. 1978, 25, 638–643. [Google Scholar] [CrossRef]
  30. Inugami, A.; Kanno, I.; Uemura, K.; Shishido, F.; Murakami, M.; Tomura, N.; Fujita, H.; Higano, S. Linearization Correction of 99mTc-Labeled Hexamethyl-Propylene Amine Oxime (HM-PAO) Image in Terms of Regional CBF Distribution: Comparison to C15O2 Inhalation Steady-State Method Measured by Positron Emission Tomography. J. Cereb. Blood Flow Metab. 1988, 8, S52–S60. [Google Scholar] [CrossRef]
  31. Soonawala, D.; Amin, T.; Ebmeier, K.P.; Steele, J.D.; Dougall, N.J.; Best, J.; Migneco, O.; Nobili, F.; Scheidhauer, K. Statistical Parametric Mapping of 99mTc-HMPAO-SPECT Images for the Diagnosis of Alzheimer’s Disease: Normalizing to Cerebellar Tracer Uptake. NeuroImage 2002, 17, 1193–1202. [Google Scholar] [CrossRef] [PubMed]
  32. Van Niftrik, C.H.B.; Piccirelli, M.; Bozinov, O.; Maldaner, N.; Strittmatter, C.; Pangalu, A.; Valavanis, A.; Regli, L.; Fierstra, J. Impact of Baseline CO2 on Blood-Oxygenation-Level-Dependent MRI Measurements of Cerebrovascular Reactivity and Task-Evoked Signal Activation. Magn. Reson. Imaging 2018, 49, 123–130. [Google Scholar] [CrossRef] [PubMed]
  33. Yang, C.-T.; Ghosh, K.K.; Padmanabhan, P.; Langer, O.; Liu, J.; Eng, D.N.C.; Halldin, C.; Gulyás, B. PET-MR and SPECT-MR Multimodality Probes: Development and Challenges. Theranostics 2018, 8, 6210–6232. [Google Scholar] [CrossRef] [PubMed]
  34. Vorstrup, S.; Brun, B.; Lassen, N.A. Evaluation of the Cerebral Vasodilatory Capacity by the Acetazolamide Test before EC-IC Bypass Surgery in Patients with Occlusion of the Internal Carotid Artery. Stroke 1986, 17, 1291–1298. [Google Scholar] [CrossRef]
Figure 1. Diagram of the gas delivery system. (A) Components of the gas delivery system, including various tubes for breathing used in the study. (B) A representative participant comfortably positioned supine in the SPECT scanner gantry with the gas delivery system connected. SPECT, single photon emission computed tomography; EtCO2, end-tidal CO2.
Applsci 15 05352 g001
Figure 2. A pipeline of data processing steps for the cerebrovascular reactivity (CVR) mapping method. AAL2, automated anatomical labeling atlas; BOLD, blood oxygen level-dependent; FWHM, full width at half maximum; ROI, region of interest; SPECT, single photon emission computed tomography.
Applsci 15 05352 g002
Figure 3. Representative brain sagittal images with the levels of activation during inhalation of 5% CO2, which was identified by statistical parametric mapping (SPM) first level analysis.
Applsci 15 05352 g003
Figure 4. Illustration of the single photon emission computed tomography (SPECT) one-day protocol for brain imaging.
Applsci 15 05352 g004
Figure 5. Mean cerebrovascular reactivity (CVR) maps and values. (A) Representative mean CVR maps. (a) Single photon emission computed tomography (SPECT) carbon dioxide (CO2) CVR maps. (b) The stimulus timing corrected functional magnetic resonance imaging (tcMRI) CO2 CVR maps. (c) Magnetic resonance imaging CO2 CVR maps. The color bar represents CVR values. (B) Mean CVR values of all seven participants. Error bars show standard deviation (SD). Asterisks (*) denote statistically significant differences.
Applsci 15 05352 g005
Figure 6. Comparison of cerebrovascular reactivity (CVR) in the top 30% regions for tcMRI, MRI, and SPECT. This graph displays the CVR values for the top 30% of regions showing the highest CVR as determined by SPECT CVR in the healthy participants cohort. Corresponding CVR values from tcMRI and conventional MRI are shown for these selected regions. Error bars represent standard deviation. Regions with statistically significant changes in the post hoc analysis between the modalities within these top 30% regions are marked with asterisks (*): red asterisks for significant differences between SPECT and MRI, green asterisks for differences between SPECT and tcMRI, and black asterisks for differences between tcMRI and MRI. The abbreviations for the brain regions are as follows: Caudate_R, Right caudate; Cingulate_Ant_L, Left anterior cingulate cortex; Cingulate_Ant_R, Right anterior cingulate cortex; Cingulate_Mid_L, Left midcingulate cortex; Cingulate_Mid_R, Right midcingulate cortex; Frontal_Mid_2_R, Right frontal lobe; OFCant_L, Left anterior orbital gyrus; Olfactory_L, Left Olfactory cortex; Pallidum_L, Left pallidum; Rolandic_Oper_L, Left Rolandic operculum.
Applsci 15 05352 g006
Table 1. Demographic information.
ParticipantsAgeGenderHandSPECTfMRI
Pre BPPost BPGasCount1stCount2ndPre BPPost BP
0125MRt116/59125/95CO2359310,599117/77112/80
0222FRt99/56114/66CO2522315,440107/60102/58
0325MRt134/82136/90CO2354310,453134/97134/84
0421FRt91/5298/60CO2348612,876105/67100/67
0527MRt123/73122/75CO2422212,963111/68110/74
0625MRt123/67130/76CO2433513,327125/81126/74
0723MRt119/60122/67CO2355512,272108/65111/66
0823MRt118/71123/80AIR407212,220125/86135/91
0923MRt124/55137/70AIR420812,649121/75137/76
Abbreviations: BP, blood pressure; fMRI, functional magnetic resonance imaging; SPECT, single photon emission computed tomography; Count1st, Total counts acquired during the baseline SPECT scan, used for decay correction; Count2nd Total counts acquired during the stress SPECT scan, used for decay correction.
Disclaimer/Publisher’s Note: The statements, opinions and data contained in all publications are solely those of the individual author(s) and contributor(s) and not of MDPI and/or the editor(s). MDPI and/or the editor(s) disclaim responsibility for any injury to people or property resulting from any ideas, methods, instructions or products referred to in the content.

