Article

Evaluating Age-Friendliness of Outdoor Service Facilities in Tourist Attractions: Evidence from Visual Computing Models

1
School of Internet of things, Nanjing University of Posts and Telecommunications, Nanjing 210023, China
2
Smart Health Big Data Analysis and Location Services Engineering Research Center of Jiangsu Province, Nanjing University of Posts and Telecommunications, Nanjing 210023, China
*
Author to whom correspondence should be addressed.
Appl. Sci. 2025, 15(10), 5343; https://doi.org/10.3390/app15105343
Submission received: 6 April 2025 / Revised: 8 May 2025 / Accepted: 8 May 2025 / Published: 10 May 2025
(This article belongs to the Section Earth Sciences)

Abstract

:
Rapid population aging worldwide has created pressing demands for transformative changes in tourism management and service provision, necessitating urgent age-friendly modifications to destination infrastructure and facilities. However, the existing research on age-friendly facility assessments has often relied on methods such as surveys and field observations, which are inefficient and highly subjective, significantly limiting their applicability. This paper proposes a novel age-friendly assessment method that integrates multiple computer-vision-based object detection and recognition models. By calculating the spatiotemporal occupancy rates of resting facilities and the proportion of elderly usage, this method enables an efficient quantification of the age-friendly adequacy of rest areas. Using field data collected from the Xuanwu Lake Scenic Area, we designed accuracy analysis and validation experiments, demonstrating that this method surpasses traditional approaches in both evaluation efficiency and accuracy. The results indicate that the service facility adequacy in the FangQiao and LingQiao rest areas is insufficient, with resting facility density below four per 100 m, making it difficult to meet the resting needs of elderly visitors. This method can effectively supplement current age-friendly facility assessment practices in tourist destinations, offering a scientific and efficient basis for infrastructure upgrades tailored to elderly needs.

1. Introduction

The global trend of population aging is becoming increasingly pronounced, with accelerated growth in the elderly population, presenting unprecedented challenges and opportunities for tourism studies. Taking China as an example, the country is projected to enter a stage of severe aging by 2035, with the population aged 60 and above expected to reach 487 million by 2050. This demographic will account for 34.8% of China’s total population and one-fourth of the global elderly population [1]. Such demographic shifts not only influence the rational allocation of tourism resources and the optimization of services but also necessitate urgent age-friendly transformations at tourist attractions. Developing age-friendly tourist sites is not only a critical strategy to address aging-related challenges but also a significant opportunity to foster innovation in tourism theory and practice. These initiatives are vital for ensuring the sustainable development of the tourism industry [2].
At present, the configuration of service facilities and management capacity of tourist attractions cannot meet the needs of the aging population [3], and there have been fewer studies on the age-friendly assessment methods and assessment standards of tourist attractions [3,4]. Based on the results of questionnaire surveys, some scholars have analyzed that the satisfaction of the elderly is related to factors such as the service facilities, accessibility, tourism resources, and environmental quality of tourist attractions [5,6,7,8,9]. Among them, the degree of improvement of service facilities, such as the adequacy of resting seats and barrier-free facilities, is generally recognized as one of the main factors affecting the satisfaction of elderly tourists, which is directly related to the safety, comfort, and convenience of elderly tourists in the process of tourism.
Based on the aforementioned evaluation criteria for aging-friendly conditions, the age-friendliness of tourist attractions has been assessed by scholars through data collected via questionnaire surveys, field observations, and random interviews, utilizing IPA analysis and ArcGIS software [6,10,11,12]. However, these assessment methods are often cumbersome, resource-intensive, and time-consuming, resulting in inefficiency. Furthermore, the reliance on surveyed populations introduces subjectivity and variability, which compromises the accuracy and reliability of the assessments.
In light of the limitations of the aforementioned existing research methods, this paper aims to establish an automatic visual analysis-based evaluation model for the age-friendliness of service facilities by analyzing tourist behavior. This approach addresses the reliance on manual surveys in traditional methods, enhances evaluation efficiency and accuracy, and provides data-driven decision-making support for scenic area renovations.
In this study, computer vision technology was employed to assess the age-friendliness of tourist attractions, and the adequacy of rest facilities was analyzed across three areas of the Xuanwu Lake Scenic Area in Nanjing, China. The You Only Look Once version 8 (YOLOv8) target detection model and the Multi-Input VOLO version 2 (MiVOLOv2) model [13] were utilized to automatically identify the location and age data of tourists, calculate the facility usage status across different age groups, and evaluate the aging-friendly adequacy rate of rest facilities in these three areas. By incorporating computer vision technology, this paper introduces a more accurate and efficient method for assessing the aging of scenic spots. This approach provides a scientific basis for decision-making regarding the age-friendly renovation of tourist attractions and supports the sustainable development of the tourism industry.

2. Literature Review

2.1. Evaluation Methods for Age-Friendliness in Tourist Attractions

Currently, research on the evaluation of age-friendly adaptations in tourist attractions primarily concentrates on the analysis of the key factors influencing these adaptations and the assessment of the construction status and effects of age-friendly service facilities based on these factors.
Based on survey data, some scholars have studied the evaluation criteria for age-friendly adaptations in tourist attractions. Lee’s research found that elderly satisfaction with a destination is associated not only with the diversity of natural and cultural resources but also with the availability of accessible service facilities and the quality of elderly tourism operations and management [5]. Liew et al. examined the factors influencing elderly-friendly tourist destinations, including safety and cleanliness, leisure facilities, and accessible public transportation [6]. Lee et al. identified that elderly-friendly tourist destinations must provide accessible public transport facilities, barrier-free accommodation, and accommodations specifically designed for the elderly [7]. Xie et al. proposed that accessibility represents an important indicator of the age-friendliness of urban park green spaces [8]. Heo et al. examined the correlation between the frequency of use of elderly leisure service facilities and leisure satisfaction [9]. From the results of the above study, it can be seen that there is a strong relationship between the aging situation of tourist attractions and whether the adequacy of service facilities can meet the needs of the elderly.
In the evaluation of age-friendliness in tourist attractions, scholars have utilized methods including surveys and field observations for data collection and applied techniques such as Importance–Performance Analysis (IPA) and ArcGIS software for evaluation. Kim et al. employed IPA to assess the satisfaction of elderly visitors in parks [10]. Liew et al. employed IPA and paired sample t-tests to assess elderly satisfaction with tourist destinations [6]. Yu et al., based on data from statistical yearbooks and empirical surveys, employed Python 3.7 scripting for ArcGIS to evaluate the suitability of 75 parks in downtown Shanghai for the elderly [11] and quantitatively assessed the suitability of visual landscapes for the elderly in various leisure spaces of these parks [12].
Moreover, existing research on automated or sensor-based evaluation in tourist attractions has primarily focused on areas such as air quality monitoring, water quality monitoring, visitor flow monitoring, and safety surveillance, with no identified studies specifically addressing age-friendly facility assessment. For instance, Ding et al. utilized temperature, humidity, infrared, ultrasonic sensors, and cameras to monitor air quality, water quality, and meteorological conditions in rural tourism areas [14]. Yang et al. developed an online water quality monitoring and management system integrating chemical oxygen demand (COD) sensors with artificial neural networks and virtual instrumentation technology, providing an effective water quality control method for scenic areas [15]. Another study by Yang et al. proposed a pedestrian flow monitoring approach based on the received signal strength (RSS) in wireless sensor networks, enabling real-time, high-precision crowd monitoring in public spaces such as tourist attractions [16]. Additionally, Provost et al. employed sensors for geotechnical slope stability monitoring in parks [17].
In summary, existing research on evaluating age-friendly adaptations in tourist attractions primarily focuses on developing assessment indicators and frameworks. Current data collection methods predominantly rely on surveys, field observations, and unstructured interviews, all of which are labor-intensive and time-consuming, resulting in low efficiency. Moreover, these approaches are susceptible to subjective biases and sampling inconsistencies, making it difficult to rapidly and accurately evaluate the age-friendliness of tourist attractions.

2.2. Current Research Status of Computer Vision

Computer vision is a technology that enables computers to acquire information, understand content, and make decisions from images or videos. By simulating the human visual system through algorithms, it processes, analyzes, and interprets visual data to perform tasks such as object recognition, motion detection, and 3D scene reconstruction. This technology is widely applied in autonomous driving, medical imaging, security surveillance, industrial inspection, and human–computer interaction, making it a crucial branch of artificial intelligence [18,19,20].
Currently, computer vision applications in tourist attractions primarily focus on safety early warning systems, smart tourism, and crowd density monitoring [21,22,23,24]. For example, Lin proposed an automated image analysis algorithm based on computer vision and artificial intelligence to detect anomalies in tourist scenes, providing a novel approach to ensuring the safety of visitors and facilities [25]. Liu et al. employed a VGGT-Count network model to predict high-density crowd gatherings in real time, facilitating crowd control and flow management to mitigate safety risks [23]. Song et al. utilized Convolutional Neural Networks (CNNs) to analyze tourist flow patterns and preferences, achieving high accuracy in identifying abnormal situations within scenic areas [24].
In summary, computer vision technology has proven highly effective in improving safety management, visitor flow control, and intelligent services at tourist attractions. Through efficient image analysis and intelligent algorithms, it provides data-driven decision support for scenic area management. However, current research primarily focuses on optimizing general scenarios, with no existing studies applying computer vision to evaluate the age-friendliness of tourist facilities. As global population aging accelerates, the need for age-friendly modifications in tourist attractions becomes increasingly urgent. Present evaluation methods remain predominantly dependent on manual surveys, failing to incorporate the quantitative analysis of elderly visitors’ actual behaviors and needs. Computer vision technology offers an effective solution to this gap by automatically capturing elderly tourists’ behavioral data, enabling more efficient and objective assessments of facility age-friendliness. This innovative approach overcomes the limitations of traditional methods, such as cumbersome processes, low efficiency, and subjectivity, thereby providing scientifically grounded, data-driven insights for age-friendly renovations.
This study required the identification and analysis of tourists, necessitating the use of object detection technology. Object detection is a core computer vision task that involves identifying and localizing specific objects within images or videos. Unlike simple image classification, object detection not only determines the presence of objects (e.g., people, vehicles, animals) but also precisely marks their locations with bounding boxes, along with their categories and confidence scores. This capability makes it suitable for multi-object recognition in complex scenes [26].
Traditional object detection methods, based on machine learning, involve feature extraction, feature selection, and classification [26]. These methods typically consist of three stages: (1) region selection using multi-scale sliding windows, which is computationally expensive and generates redundant regions; (2) feature extraction using handcrafted descriptors like Histogram of Oriented Gradients (HOG), Haar-like, or Scale-Invariant Feature Transform (SIFT), which struggle with object diversity due to background noise, lighting variations, and viewpoint changes; and (3) classification using algorithms like Adaboost. However, these methods suffer from inefficiency, complex manual feature design, limited adaptability, and cumulative errors from each stage [27].
Since 2014, deep learning has revolutionized object detection, gradually replacing traditional methods as the mainstream paradigm in computer vision. Compared to handcrafted feature-based approaches—which are sensitive to lighting, occlusion, and complex scenes—deep learning models such as Convolutional Neural Networks (CNNs), Regions with CNN features (R-CNNs), Single Shot MultiBox Detector (SSD), and You Only Look Once (YOLO) offer significant advantages: (1) end-to-end training enables the automatic learning of hierarchical features, overcoming the subjectivity of manual design; (2) transfer learning on large-scale datasets (e.g., Common Objects in Context (COCO)) ensures robustness even with limited annotated data; and (3) modern architectures (e.g., Faster R-CNN, YOLO) unify object localization and classification, eliminating the computational overhead of sliding windows while enabling real-time detection. These models extract semantic features through convolutional layers and optimize parameters via loss functions, achieving superior accuracy and efficiency in complex environments [26,28]. Deep learning applications span robotics, medical diagnosis, street-view recognition, remote sensing, web services, and autonomous driving [29,30,31,32,33,34,35,36]. For instance, Ikchul et al. employed the YOLOv10 model based on the Transformer architecture for heavy equipment detection on construction sites [37]. Sungman et al. evaluated the effectiveness of image enhancement techniques in detecting non-protective personal equipment using the YOLOv8 model [38]. Li et al. applied a method based on transfer learning and deep learning for hyperspectral data processing [39] while Zhang et al. utilized YOLOv5-FF to detect floating objects on the surface of freshwater environments [40]. These studies fully demonstrated the outstanding generalization capability, autonomous feature learning advantages, and precise complex pattern recognition potential of deep learning in cross-domain applications, paving a broad path for the innovative development of computer vision technologies.
In terms of hardware, many studies have focused on acceleration through optimized computational architectures and algorithm–hardware co-design to enhance real-time performance and energy efficiency. For instance, Ren et al. achieved efficient YOLOv3-Tiny acceleration on Field Programmable Gate Arrays (FPGA), reaching 96.6 GOPS and 17.3 FPS with only 4.12 W power consumption [41]. Xie et al. optimized the SSD with cyclic tiling and Advanced eXtensible Interface (AXI) data reordering, achieving 534.72 GOPS throughput on FPGAs [42]. Li et al. proposed a two-stage detection scheme combining lightweight CNNs and quantization, enabling on-chip computation with 98.01% accuracy on the Modified National Institute of Standards and Technology (MNIST) database [43]. Choi et al. developed dedicated post-processing hardware to improve system efficiency and reduce resource pressure on the main accelerator [44]. These innovations further highlight the performance advantages of deep learning in object detection, enabling low-power, high-efficiency, and high-precision real-time inference on edge devices for diverse applications.
Given deep learning’s robustness in complex environments and efficient detection capabilities, this study adopted deep learning for the automatic detection of seated tourists in scenic areas. Tourist scenes often feature variable lighting, dense crowds, and frequent occlusions, which challenge traditional methods. Deep learning models, trained on large datasets and leveraging transfer learning, effectively address these challenges. Moreover, modern lightweight architectures can run efficiently on edge devices, with end-to-end training allowing the direct prediction of object categories and locations from input images—eliminating the need for manual feature engineering. Overall, deep learning’s automatic feature extraction, high accuracy, and real-time processing make it an ideal technology for tourist identification in scenic areas, offering significant advantages for this research.

3. Methods

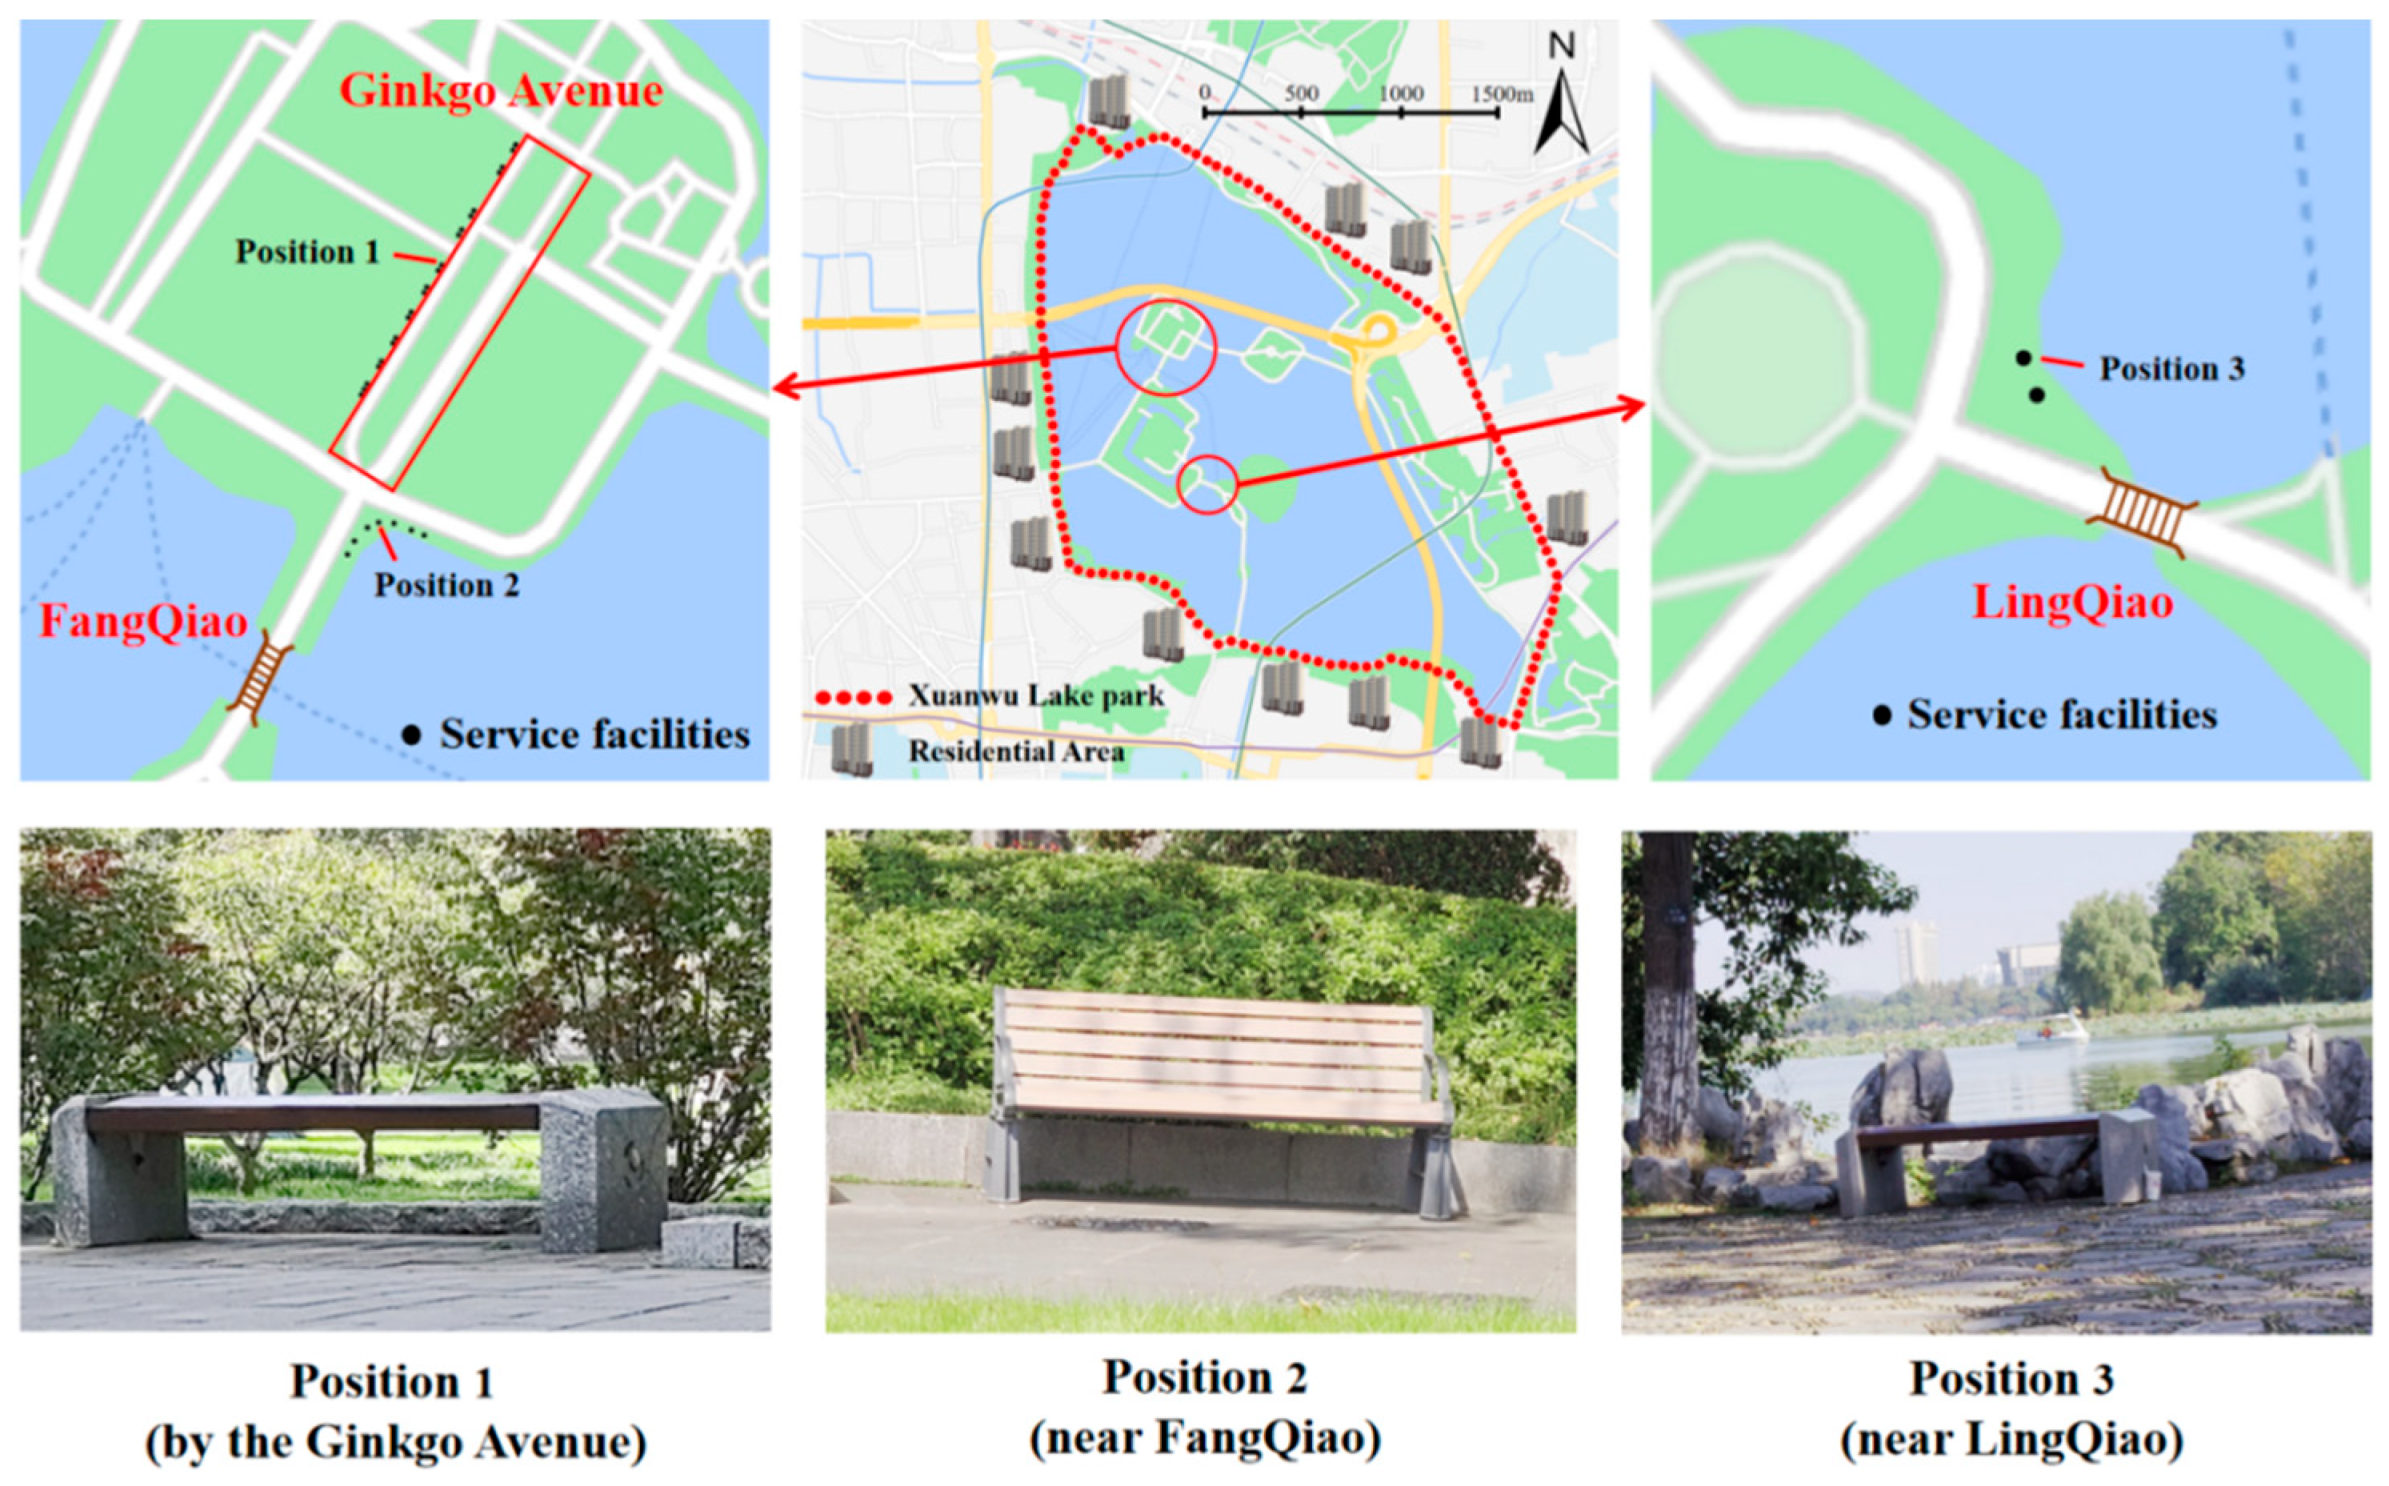
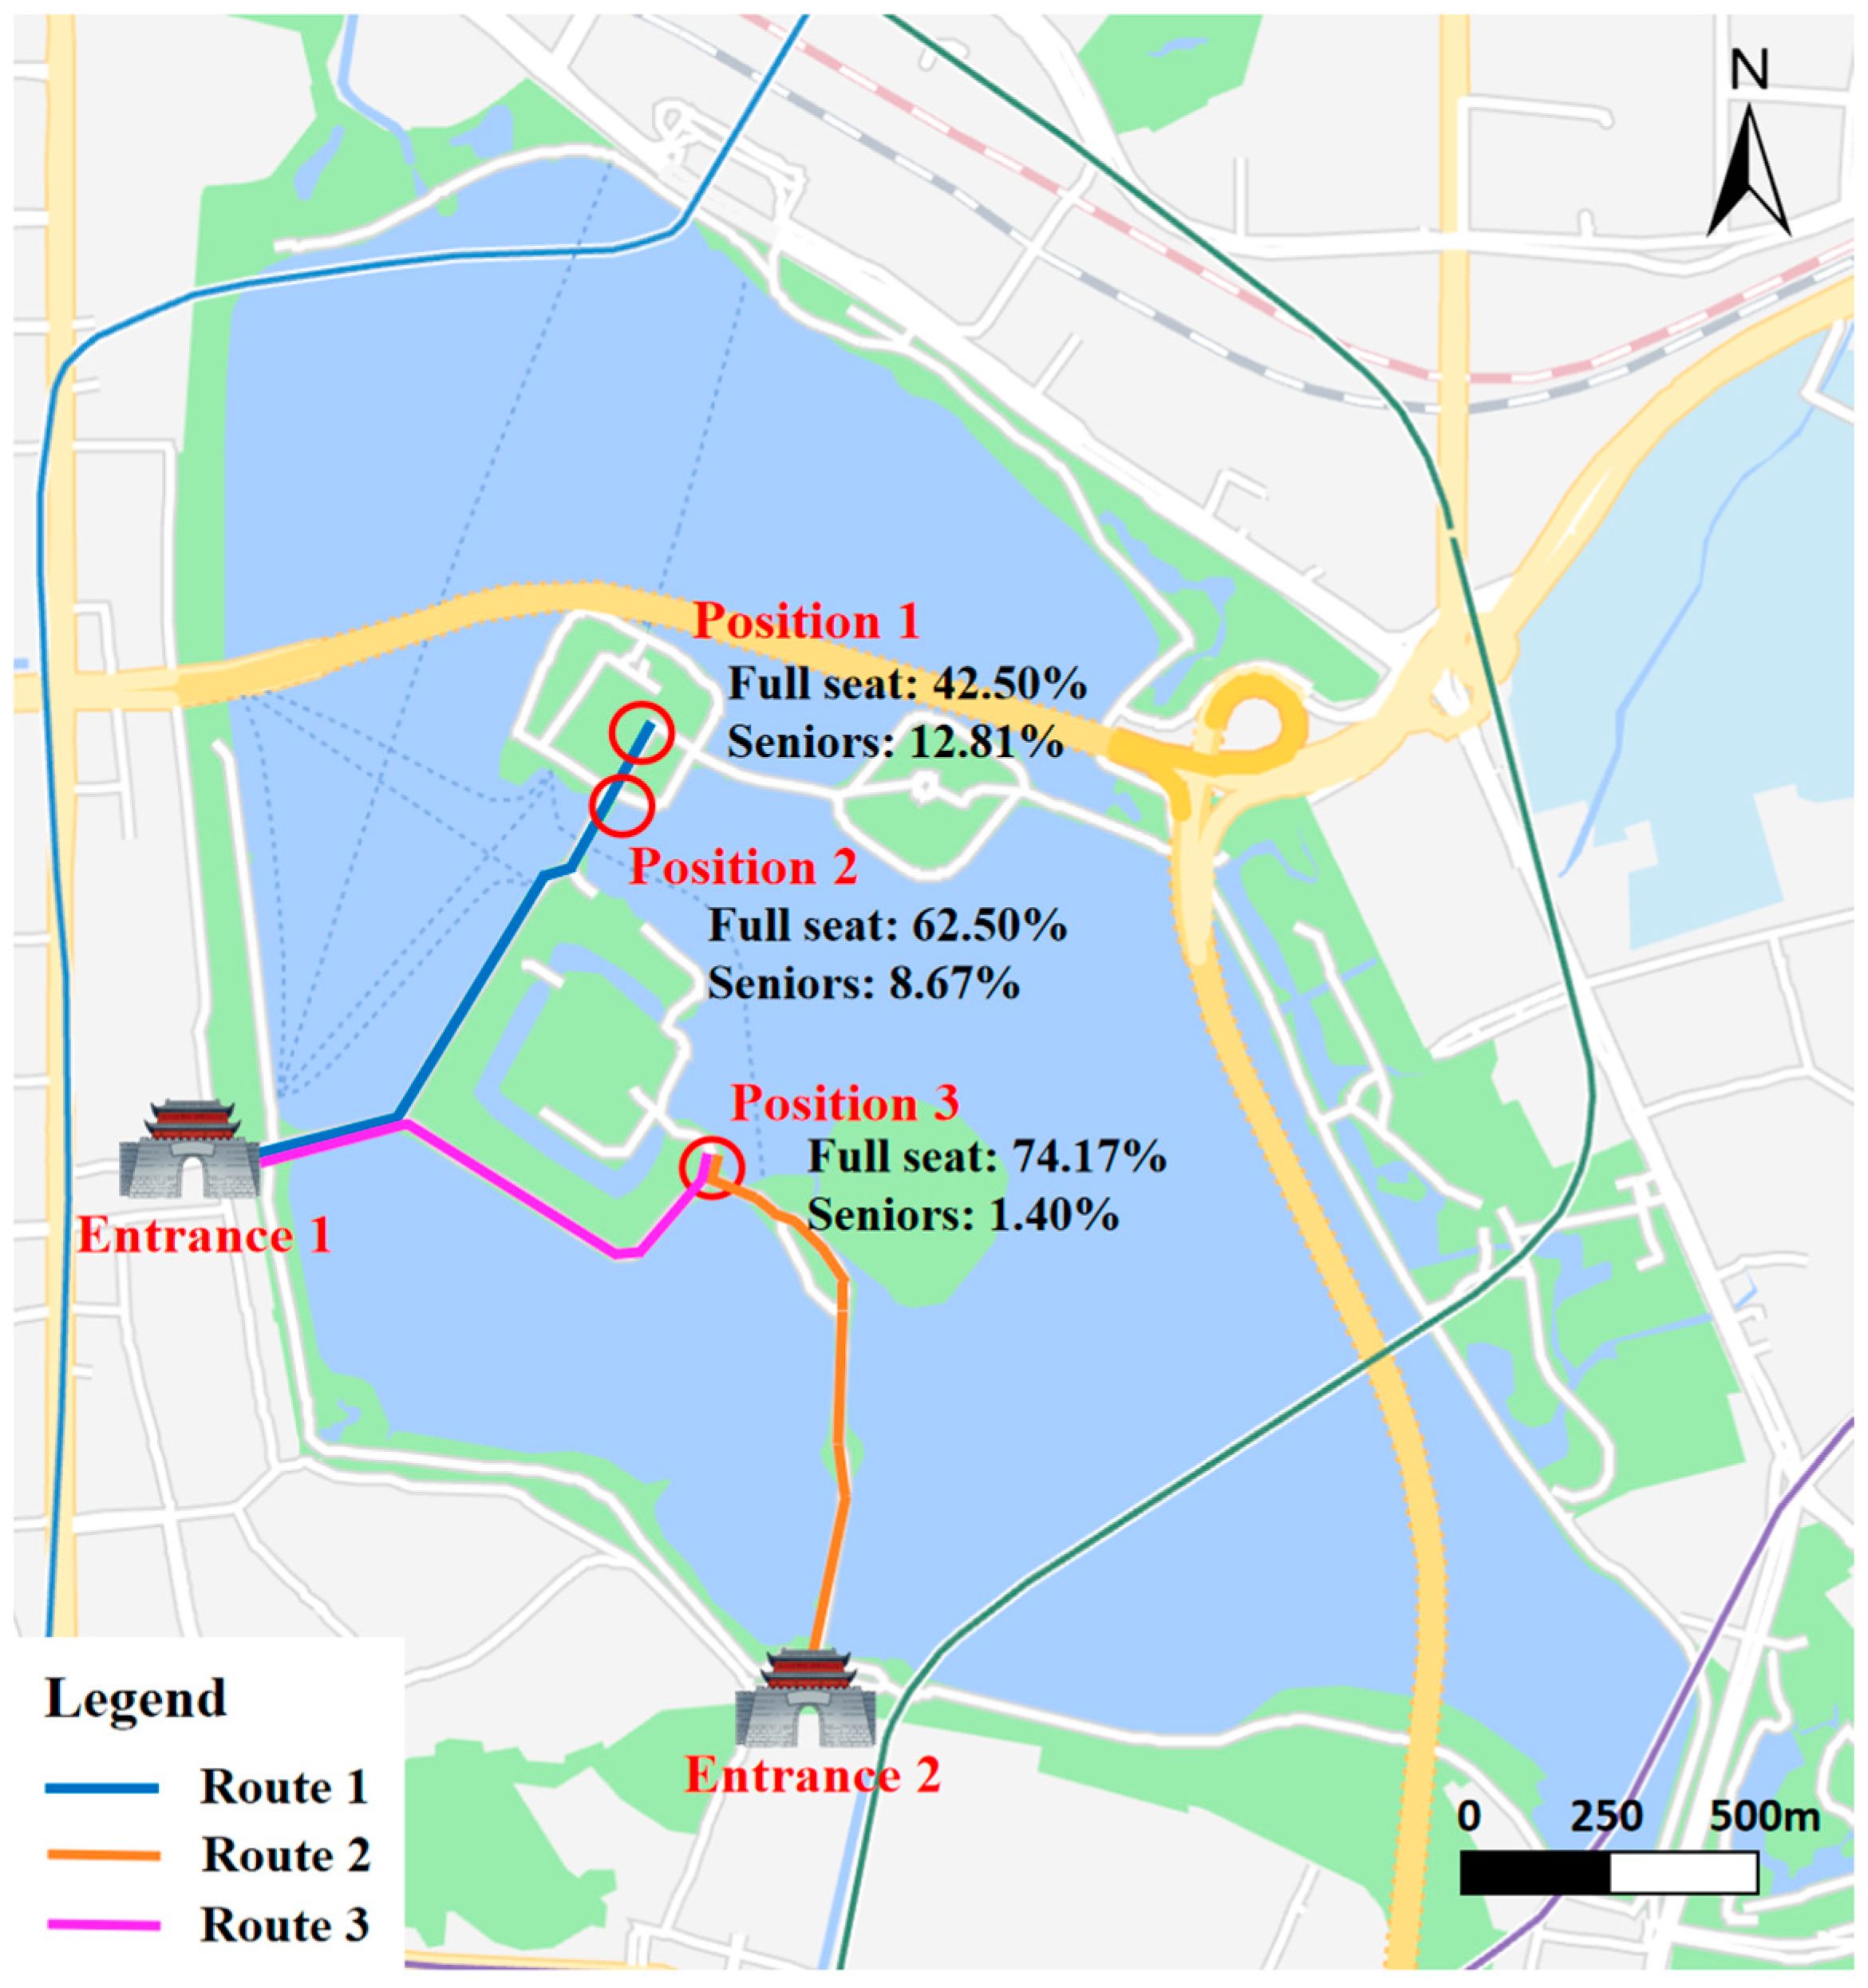
3.1. Study Area and Research Framework

This study employed the Xuanwu Lake Scenic Area in Nanjing, China, as the experimental region. The area is rich in tourism resources and is especially popular among elderly tourists. Furthermore, the surrounding residential areas contain a large elderly population, making it an ideal location to accurately reflect the actual needs of elderly tourists during their visits. Moreover, the area contains a variety of rest areas, which are highly representative and applicable. Thus, the results of this study will provide valuable references for other tourist attractions in analyzing the adequacy rate of aging-friendly facilities in rest areas. The location of the study area and the distribution of relevant data are presented in Figure 1.
This study presented an aging-friendly adequacy analysis framework for rest area facilities in tourist attractions, as illustrated in Figure 2. The framework primarily consisted of three components: (1) inputting the collected scenic area data into the object detection model YOLOv8 to detect visitor locations, automatically delineate service facility boundaries, and identify visitors occupying these facilities; (2) employing the MiVOLOv2 model to conduct age analysis of these visitors; and (3) applying the age-friendly sufficiency evaluation method for scenic area rest facilities proposed in Section 3.3 to determine the occupancy rate of each scenario and the proportion of elderly versus non-elderly visitors at full capacity, thereby analyzing the age-friendly adequacy of the rest area facilities. A detailed explanation follows.
First, three rest areas near Ginkgo Avenue, FangQiao, and LingQiao in the Xuanwu Lake Scenic Area were selected for the study. Videos were collected during peak afternoon hours on weekends, with a 2 h video recorded for each location. Every minute, three photos were taken at 0, 5, and 10 s. We adopted a nearly frontal shooting angle towards visitors, with the camera positioned approximately 15–20 m away and adjusted to align with visitors’ seated body center points (at approximately 0.5 m height) to simulate a natural sitting observation perspective. Each video recording was conducted in 1920 × 1080 full-HD resolution to ensure image clarity and detail representation. The field data were collected under favorable weather conditions (clear skies and moderate temperatures), which represent optimal meteorological parameters for outdoor recreational activities. These conditions ensure that the selected sampling days exhibit strong typicality and representativeness, effectively capturing the crowd dynamics and facility usage patterns during weekends under suitable weather. Furthermore, the data collection was conducted during non-holiday periods. Given that scenic areas typically experience significantly higher visitor volumes during holidays, if our findings indicated insufficient age-friendly adequacy in certain rest areas, such deficiencies would likely have been exacerbated during peak travel seasons. This sampling strategy explicitly accounted for temporal variations in visitor flow, ensuring that the research conclusions accurately reflected the routine utilization patterns of rest facilities. Consequently, the methodology enhanced the generalizability and external validity of the study outcomes.
The YOLOv8 object detection model was employed to detect the positions of tourists and map out the boundaries of service facilities, identifying tourists occupying these facilities. Subsequently, the MiVOLOv2 model [13] was employed to analyze the ages of tourists, distinguishing between elderly and non-elderly groups. This enabled the calculation of facility usage across different age groups. To minimize the impact of pedestrians obstructing the camera or other interference on data analysis, the photo with the highest number of seated people among the three taken each minute was selected for the aging-friendly adequacy calculation for that minute. Finally, the proposed method for evaluating the adequacy rate of aging-friendly service facilities was applied for assessment. Due to privacy concerns, facial images were mosaic-blurred.

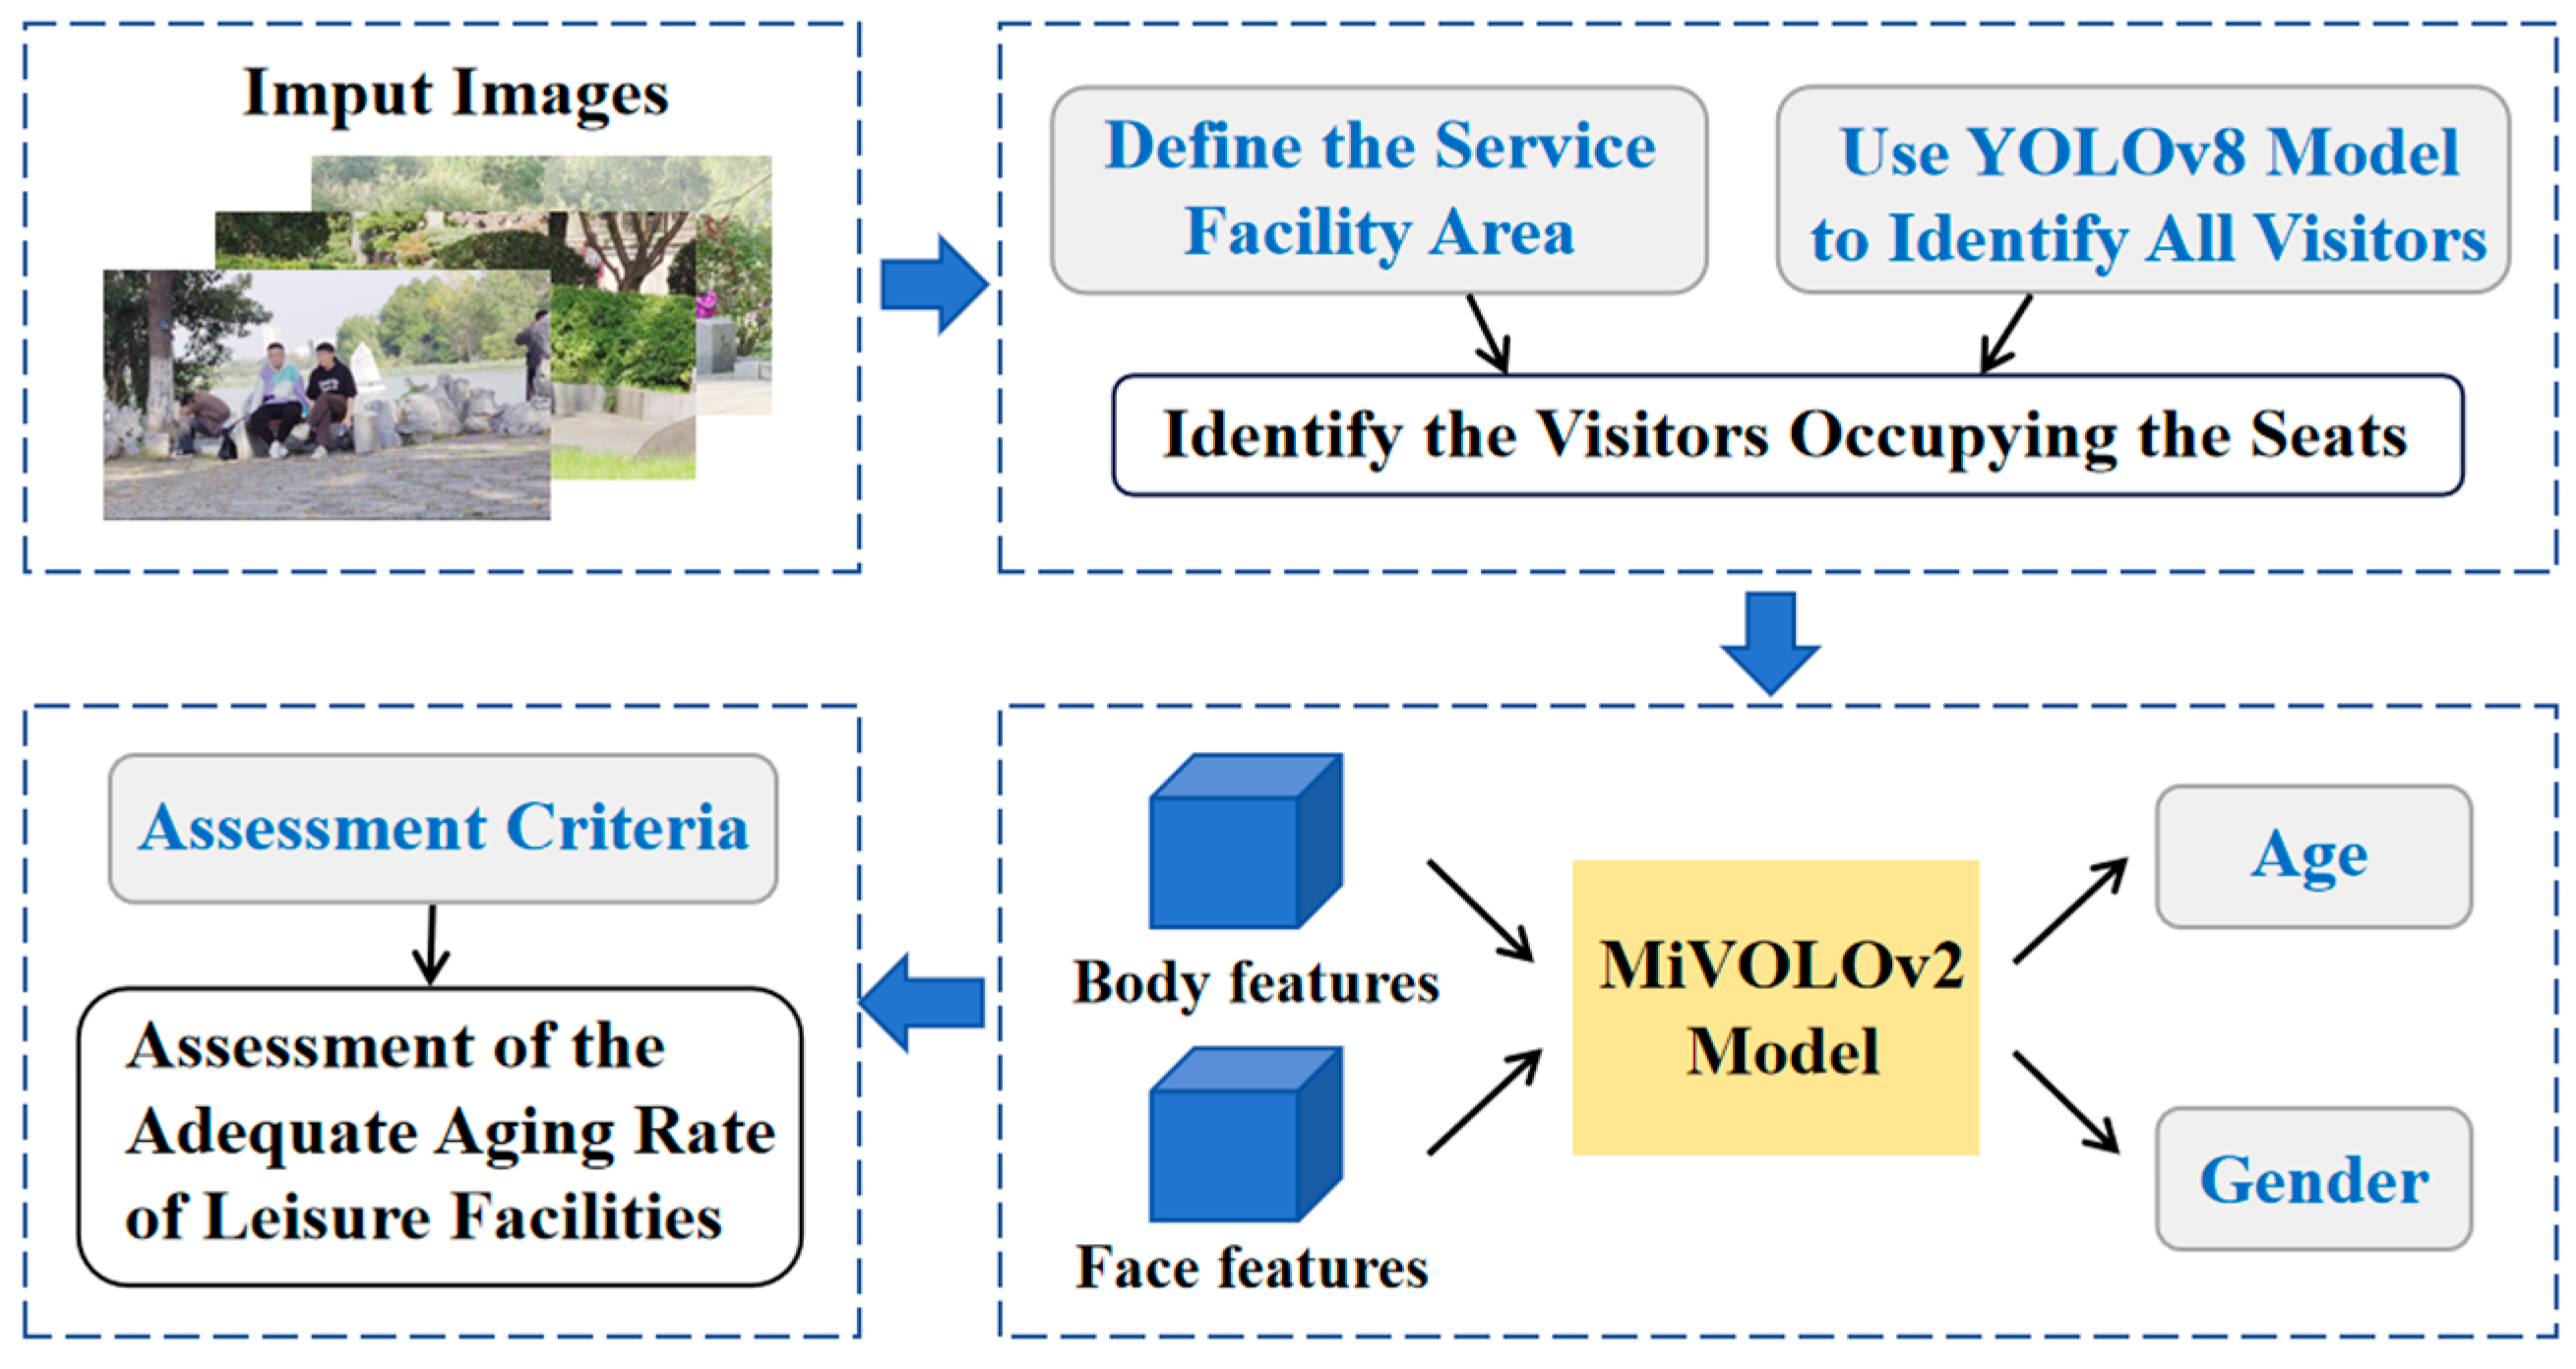
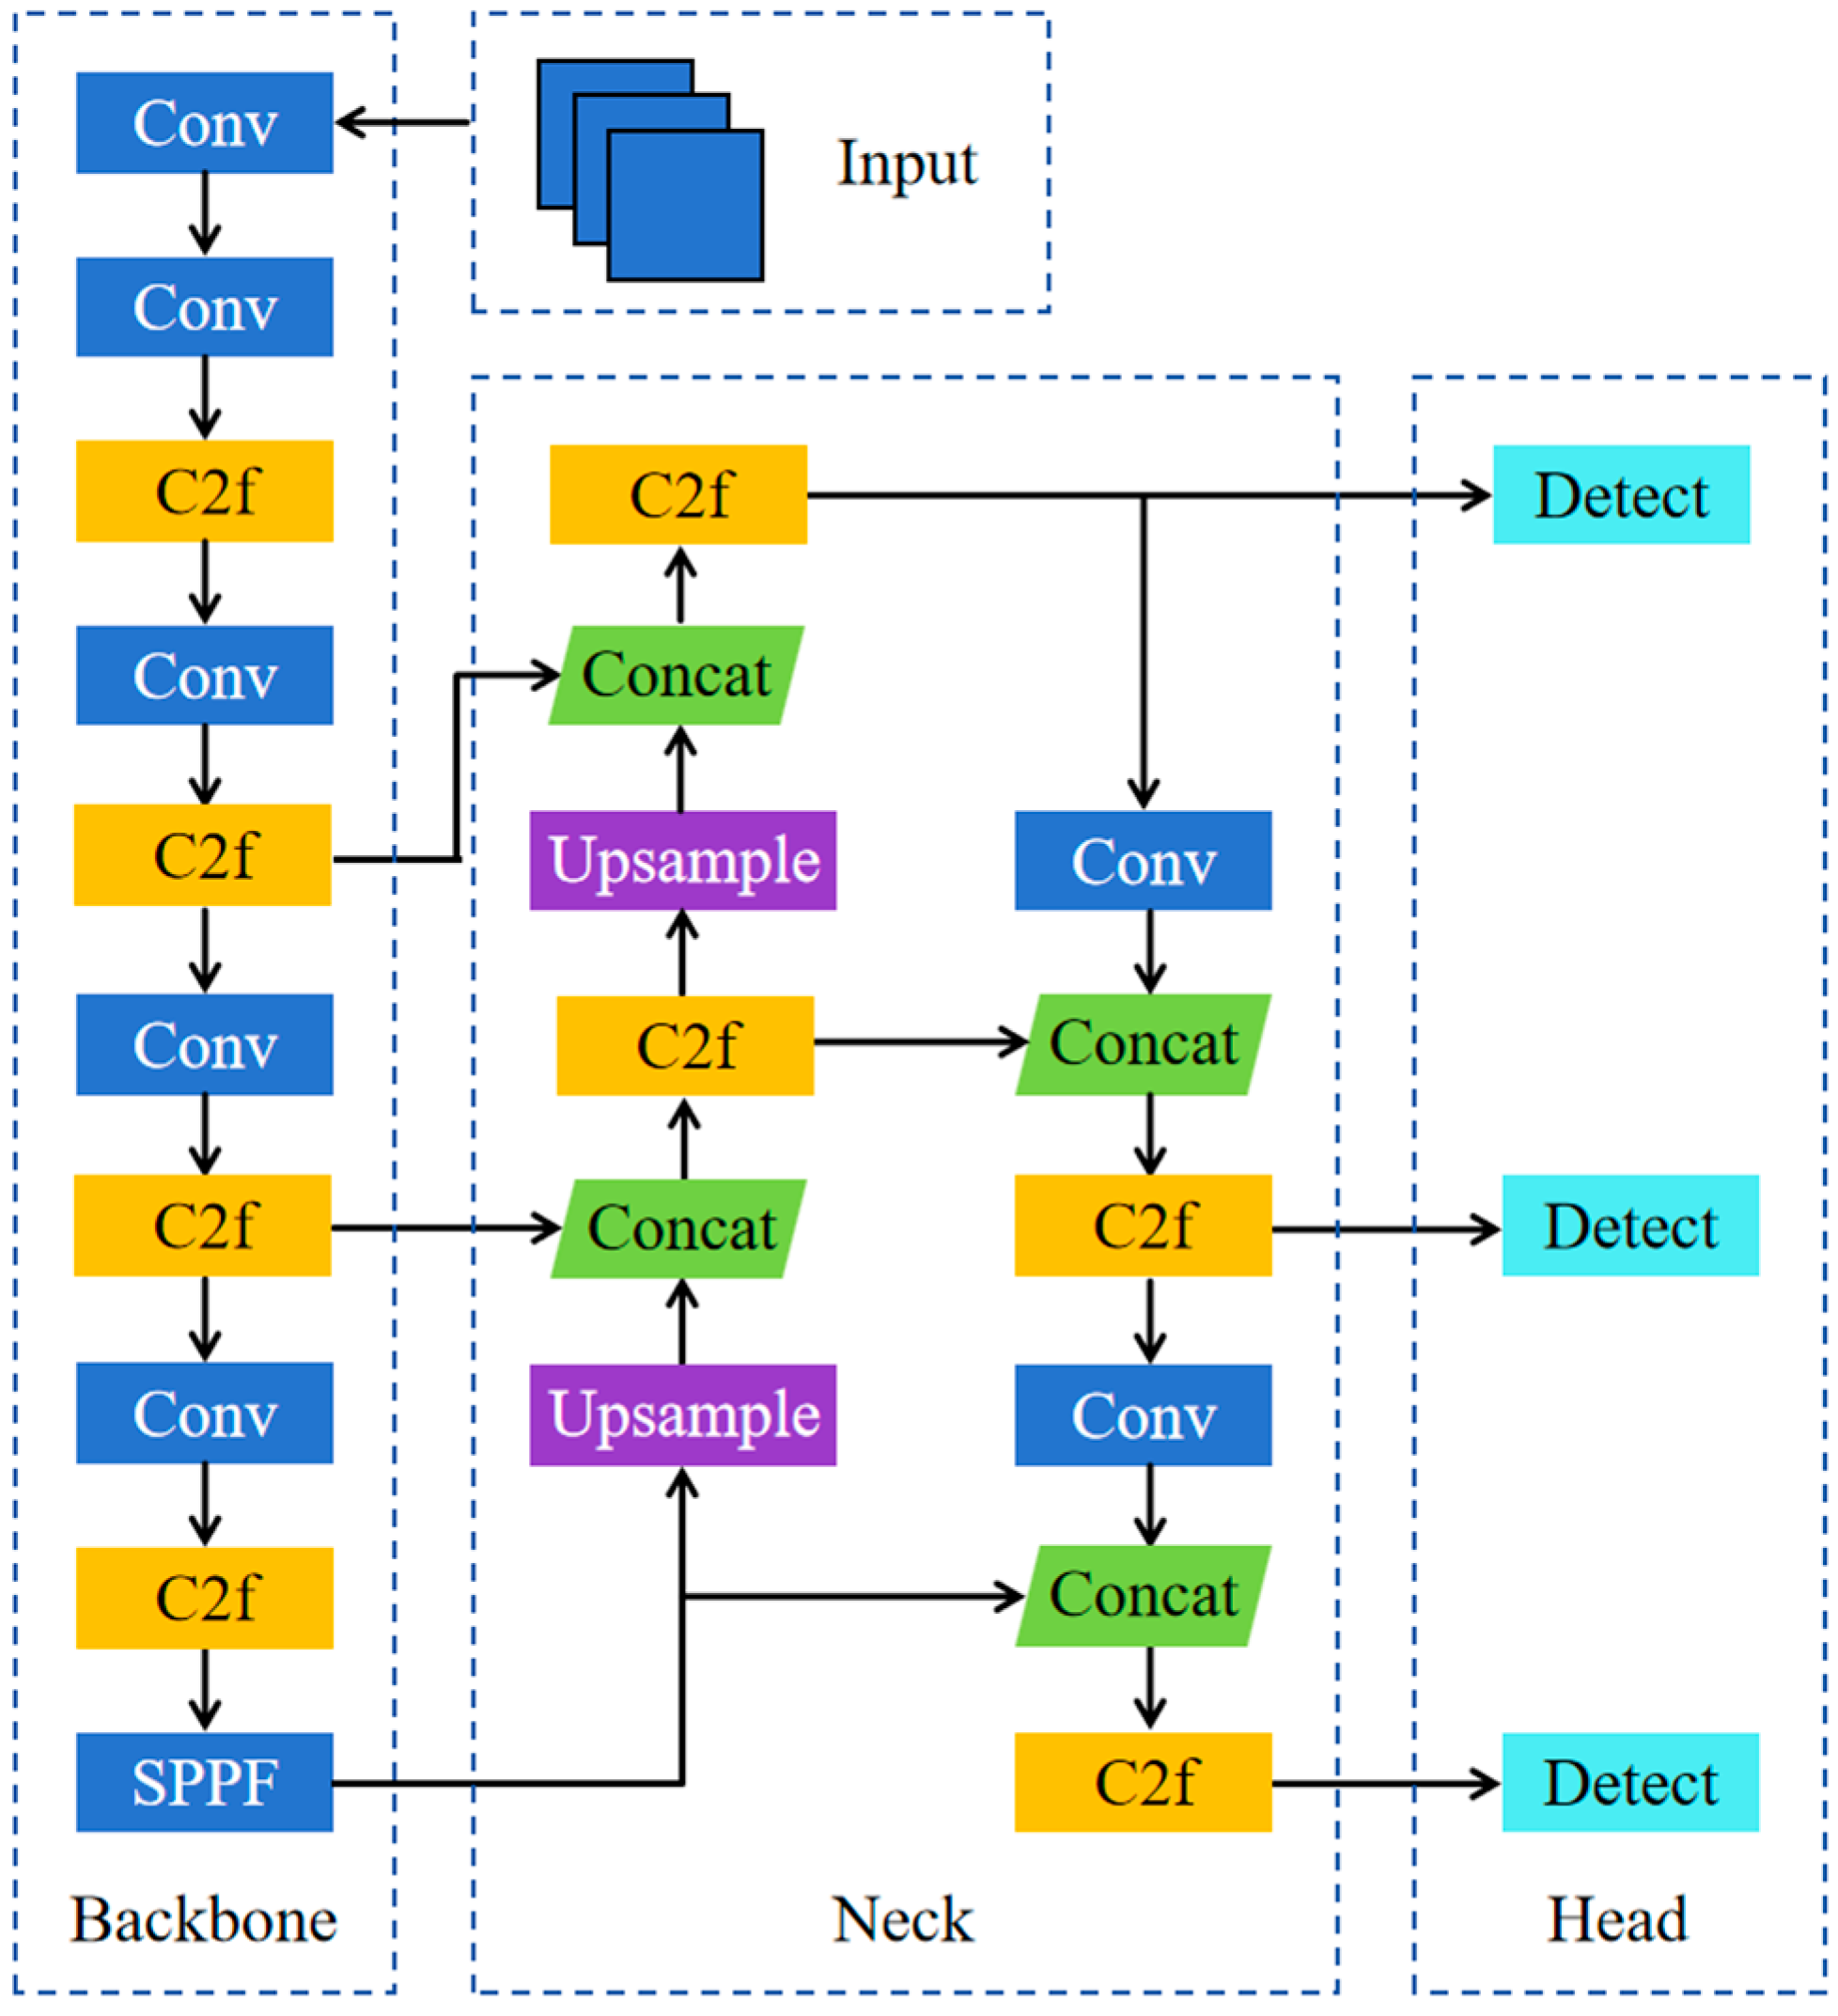
3.2. Analysis of the Utilization of Rest Area Service Facilities and Visitor Age in Tourist Attractions
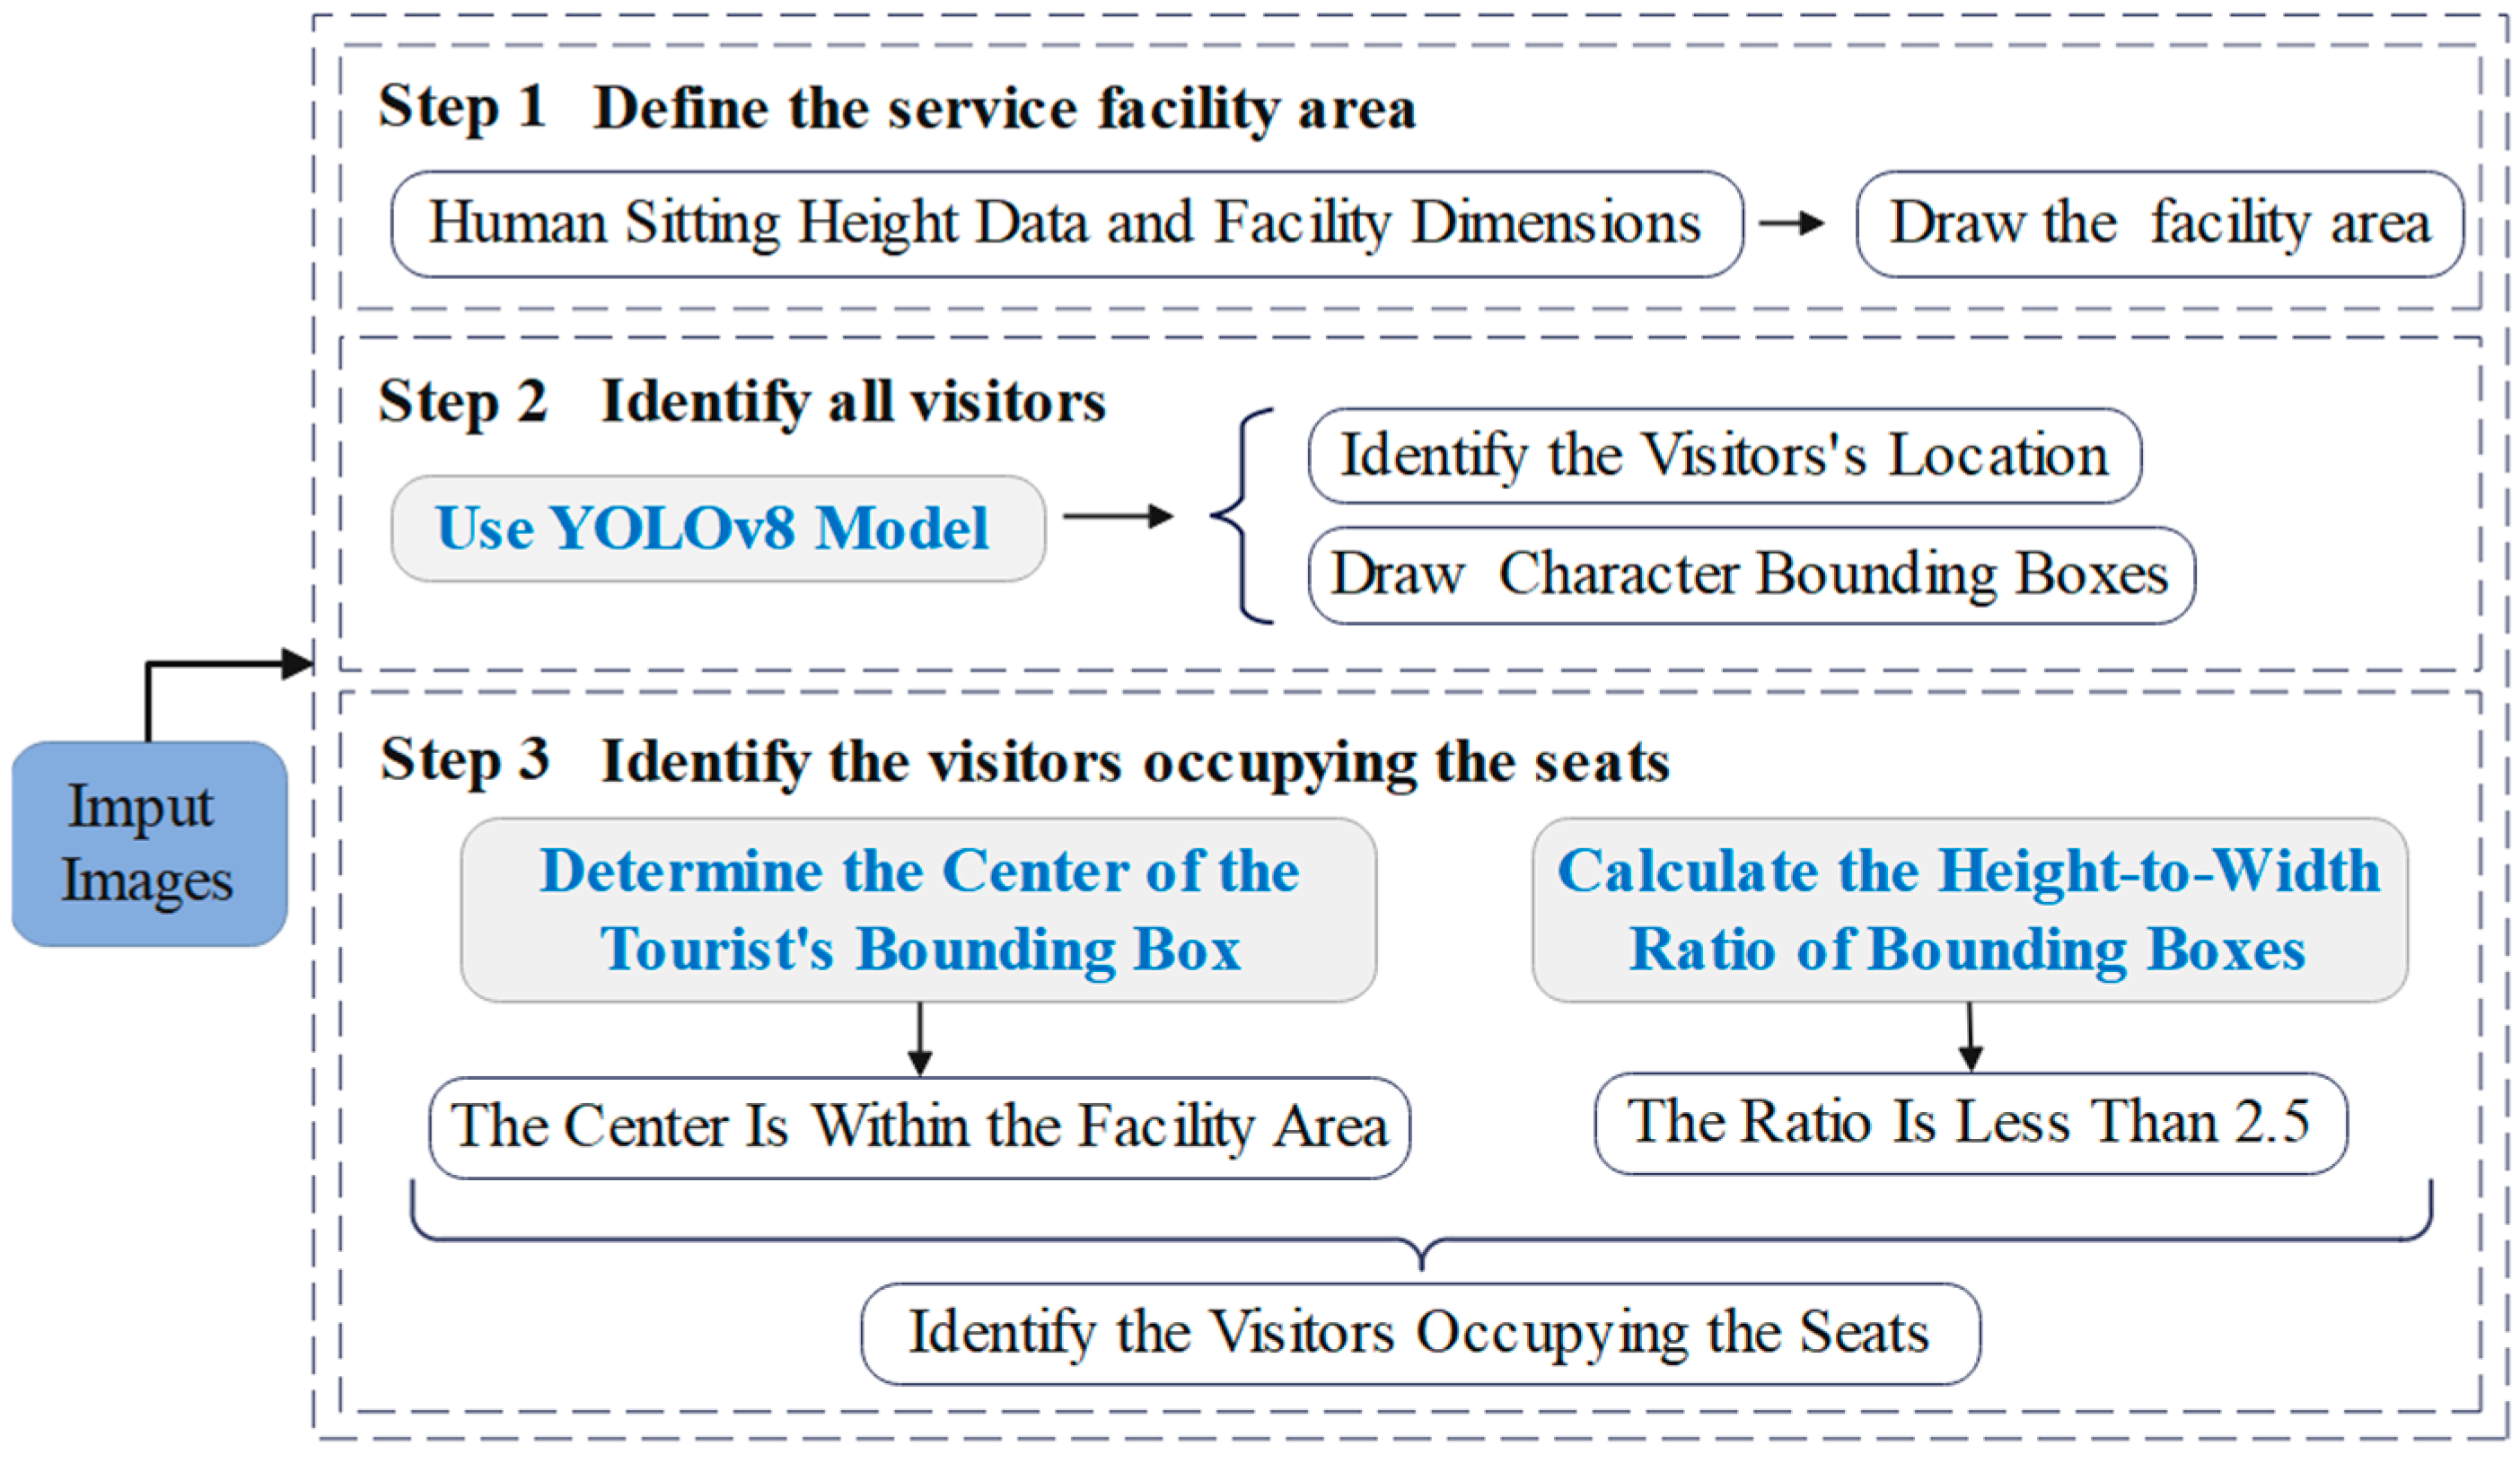
In the analysis of facility usage in scenic area rest areas, the YOLOv8 model is employed for tourist location identification. YOLOv8 is a deep learning-based object detection algorithm that frames object detection as a regression problem. It predicts the position and category of objects in a single forward propagation step, making it suitable for various visual AI tasks, including detection, segmentation, pose estimation, tracking, and classification. The model is highly efficient and widely applicable.
The YOLOv8 network model primarily consists of three components: the backbone feature extraction module (Backbone), the feature enhancement module (Neck), and the detection module (Detect), as illustrated in Figure 3. The backbone network structure employs the C2f module, which enhances gradient flow and reduces computational complexity, thereby improving the model’s computational efficiency and performance. The detection head adopts a decoupled-head structure (Decoupled-Head), separating the classification and detection heads to enhance detection flexibility and accuracy. For loss calculation, the model utilizes the TaskAlignedAssigner positive sample assignment strategy and incorporates Distribution Focal Loss (DFL Loss) and CIOU Loss as regression losses. This optimizes the loss function computation, further enhancing the model’s training effectiveness and detection accuracy [26,45].
The YOLOv8 pre-trained model used in this study was trained on the COCO training set (including 80 classes) with the following hyperparameter settings: a learning rate of 0.01, 100 epochs, and a batch size of 16. The model achieved a mean Average Precision (mAP) of 37.3.
In this study, the range of service facilities was first outlined on the input images collected. Based on the fact that the seat height of a bench is usually about 40 cm above the ground, combined with the fact that the height of a person’s upper body when seated is usually between 40 and 90 cm, the position of the center point of the figure frame is usually between 40 and 65 cm. When children sit down, their legs cannot fully touch the ground, so the center of the frame will be higher than the height of the chair. In addition, considering the influence of some people’s height and sitting posture, we set the range of the service facility as a rectangular area with the length of the bottom edge of the chair surface and a height of 40 cm. Next, the YOLOv8 model was used to detect tourists in the image and generate a character bounding box for each tourist.
After that, it was determined whether these visitors were using the facility or not. Adults sit at a height of about 0.8 m to 1.0 m, a width of about 0.4 m to 0.5 m, and a height-to-width ratio of about 1.6 to 2.5; children sit at a height of about 0.5 m to 0.7 m, a width of about 0.3 m to 0.4 m, and a height-to-width ratio of about 1.2 to 2.3; and when an adult is standing up, the height-to-width ratio is about 3.2 to 4.5. Combining the above data on human body structure and the analysis of experimental data, we set that the visitors using the facilities need to meet two conditions:
(1)
The center point of the visitor’s character frame needed to be located within the range of the set service facilities.
(2)
The height-to-width ratio of the visitor’s frame had to be less than 2.5 times. A character frame with a height-to-width ratio greater than 2.5 was considered to be a person passing by the service facility and was excluded. The method of judging the utilization of service facilities in scenic open spaces is shown in Figure 4.
Passing tourists who obstructed seated tourists or interfered with the camera view, as well as pedestrians obstructing the lens, may have resulted in the detection of fewer tourists using the facilities than the actual number. To minimize the impact of these issues on the experiment, it was observed that pedestrians typically pass service facilities within 5 s. Therefore, the photo with the highest number of tourists occupying the facility, among those taken at the 0th, 5th, and 10th second of each minute, was selected for facility usage detection and aging-friendly calculation for that minute.
After identifying the tourists using the facilities, the MiVOLOv2 model was employed to analyze their ages and determine the usage status of the facilities across different age groups. The MiVOLOv2 model, proposed by Maksim Kuprashevich et al. in 2023 [13] and further improved in 2024 [46], is a deep learning model that utilizes multimodal input and Transformer architecture for age and gender estimation. This model overcomes the limitations of traditional methods, which rely on a single information source (e.g., only facial images), by integrating various input data (e.g., facial and full-body images) to enhance prediction accuracy. Moreover, the Transformer architecture efficiently handles complex feature interactions and excels at capturing long-range dependencies.
The MiVOLOv2 model was trained on the IMDB-Clean dataset, which consists of 183,886 training images, 45,971 validation images, and 56,086 test images. The training process was divided into two stages: first, the facial data were trained for 220 epochs with a learning rate of 1.5 × 10⁻⁵ and a batch size of 192; then, the body data were trained for 400 epochs with a learning rate of 1 × 10⁻⁵ and a batch size of 192. The model achieved a Mean Absolute Error (MAE) of 4.24 for age estimation [13]. The accuracy, dataset sizes, and hyperparameters of both the YOLOv8 and MiVOLOv2 models are summarized in Table 1.
This study employed a serial processing pipeline to merge the outputs of YOLOv8 and MiVOLOv2. Specifically, YOLOv8 was first utilized to detect seat-occupying tourists, and the bounding box of each confirmed seat-occupying tourist was individually cropped into a single-person image, which served as the input for MiVOLOv2 to perform age recognition. Additionally, to ensure more accurate detection of tourists and their ages, all collected video data were captured facing the tourists directly. As a result, the cropped images of seat-occupying tourists were predominantly single-person images without multiple individuals. Even if minor local information such as clothing from adjacent individuals was included, these details would not be misidentified as a complete human body for age recognition.
Finally, accuracy evaluations were performed on the facility usage detection results and tourist age recognition outcomes. One hour of video data was selected, with one photo extracted every minute for testing, yielding 60 photos. The accuracy evaluation for facility usage was based on the recognition results for each photo, categorized as correct or incorrect, and the average accuracy rate across all 60 photos was calculated. The accuracy evaluation for tourist age recognition involved determining whether the recognized age for each individual in the photo fell within the correct range. The accuracy rate for age recognition in each photo was calculated, and the average accuracy rate for all 60 photos was subsequently computed.

3.3. Assessment of Aging-Friendly Adequacy Rate of Rest Facilities

In tourist attractions, the aging-friendly adequacy rate of rest area service facilities refers to the extent to which the number and layout of rest facilities provided for elderly tourists adequately meet their actual needs. This paper defines the aging-friendly adequacy rate as the extent to which rest facilities meet the rest and convenience needs of elderly tourists and other tourist groups at different times of the day while ensuring the reasonable allocation and effective utilization of resources, i.e., the compatibility of facility usage between elderly and non-elderly groups.
Based on the Chinese Adult Body Dimensions (GB/T 10000-2023) [47] and Chinese Juvenile Body Dimensions (GB/T 26158-2010) [48], the body width of each visitor in each image was determined. The sum of all visitors’ body widths in the photo was then calculated and compared with the actual length of the resting facility. Since there is typically some spacing between seated individuals and the actual width occupied by a person (including clothing) is greater than their body width, this paper defines a facility as fully occupied if the total sum of visitors’ body widths exceeds 60% of the facility’s length. The reference data for age and body width measurements of Chinese individuals are presented in Table 2.
Based on the stipulation in Classification and Evaluation of Quality Grade for Tourist Attractions (GB/T 17775-2024) [49] that ‘public tourist rest facilities should be provided in sufficient quantity’, we introduced the occupancy rate into the evaluation criteria for the adequacy of age-friendly rest facilities in tourist areas. By quantifying facility usage intensity, we assessed whether rest facilities were sufficient—a higher occupancy rate indicated greater insufficiency. Furthermore, this study found that when the occupancy rate was high, there is a phenomenon of non-elderly individuals implicitly occupying rest facilities, leading to insufficient fulfillment of the elderly’s needs. For example, in a rest area of a scenic spot during the peak afternoon hours, almost all seats were occupied continuously for an hour. Image recognition revealed that during these peak periods, approximately 95% of the seats were taken by younger or middle-aged tourists. This means that despite the availability of seats, elderly visitors had very little opportunity to use them, potentially forcing them to stand or leave the area altogether. In alignment with the World Health Organization’s ‘Global Age-friendly Cities: A Guide’, which states that ‘seating should be placed at regular intervals in outdoor areas, especially parks and public spaces, to ensure the needs of older people are met’, this paper incorporates the proportion of non-elderly individuals when facilities are fully occupied into the evaluation criteria. This paper establishes measurement methods for occupancy rate and non-elderly occupancy rate when facilities are fully occupied, as expressed in the following formulas:
F = t T
Y =   n N
In the equation, F denotes the occupancy rate, t represents the duration of full occupancy within the time period, T represents the total duration, Y refers to the rate of seats occupied by non-elderly individuals when the seat is fully occupied, n represents the number of non-elderly individuals occupying the seat at full occupancy, and N denotes the total number of people occupying the seat when fully occupied. Let Y′ denote the average rate of non-elderly occupancy during full occupancy across all images within the given time period.
Based on field observations and data analysis of Xuanwu Lake Scenic Area, this paper defines the evaluation criteria for the adequacy of age-friendly rest facilities in tourist areas as shown in Table 3:

4. Results

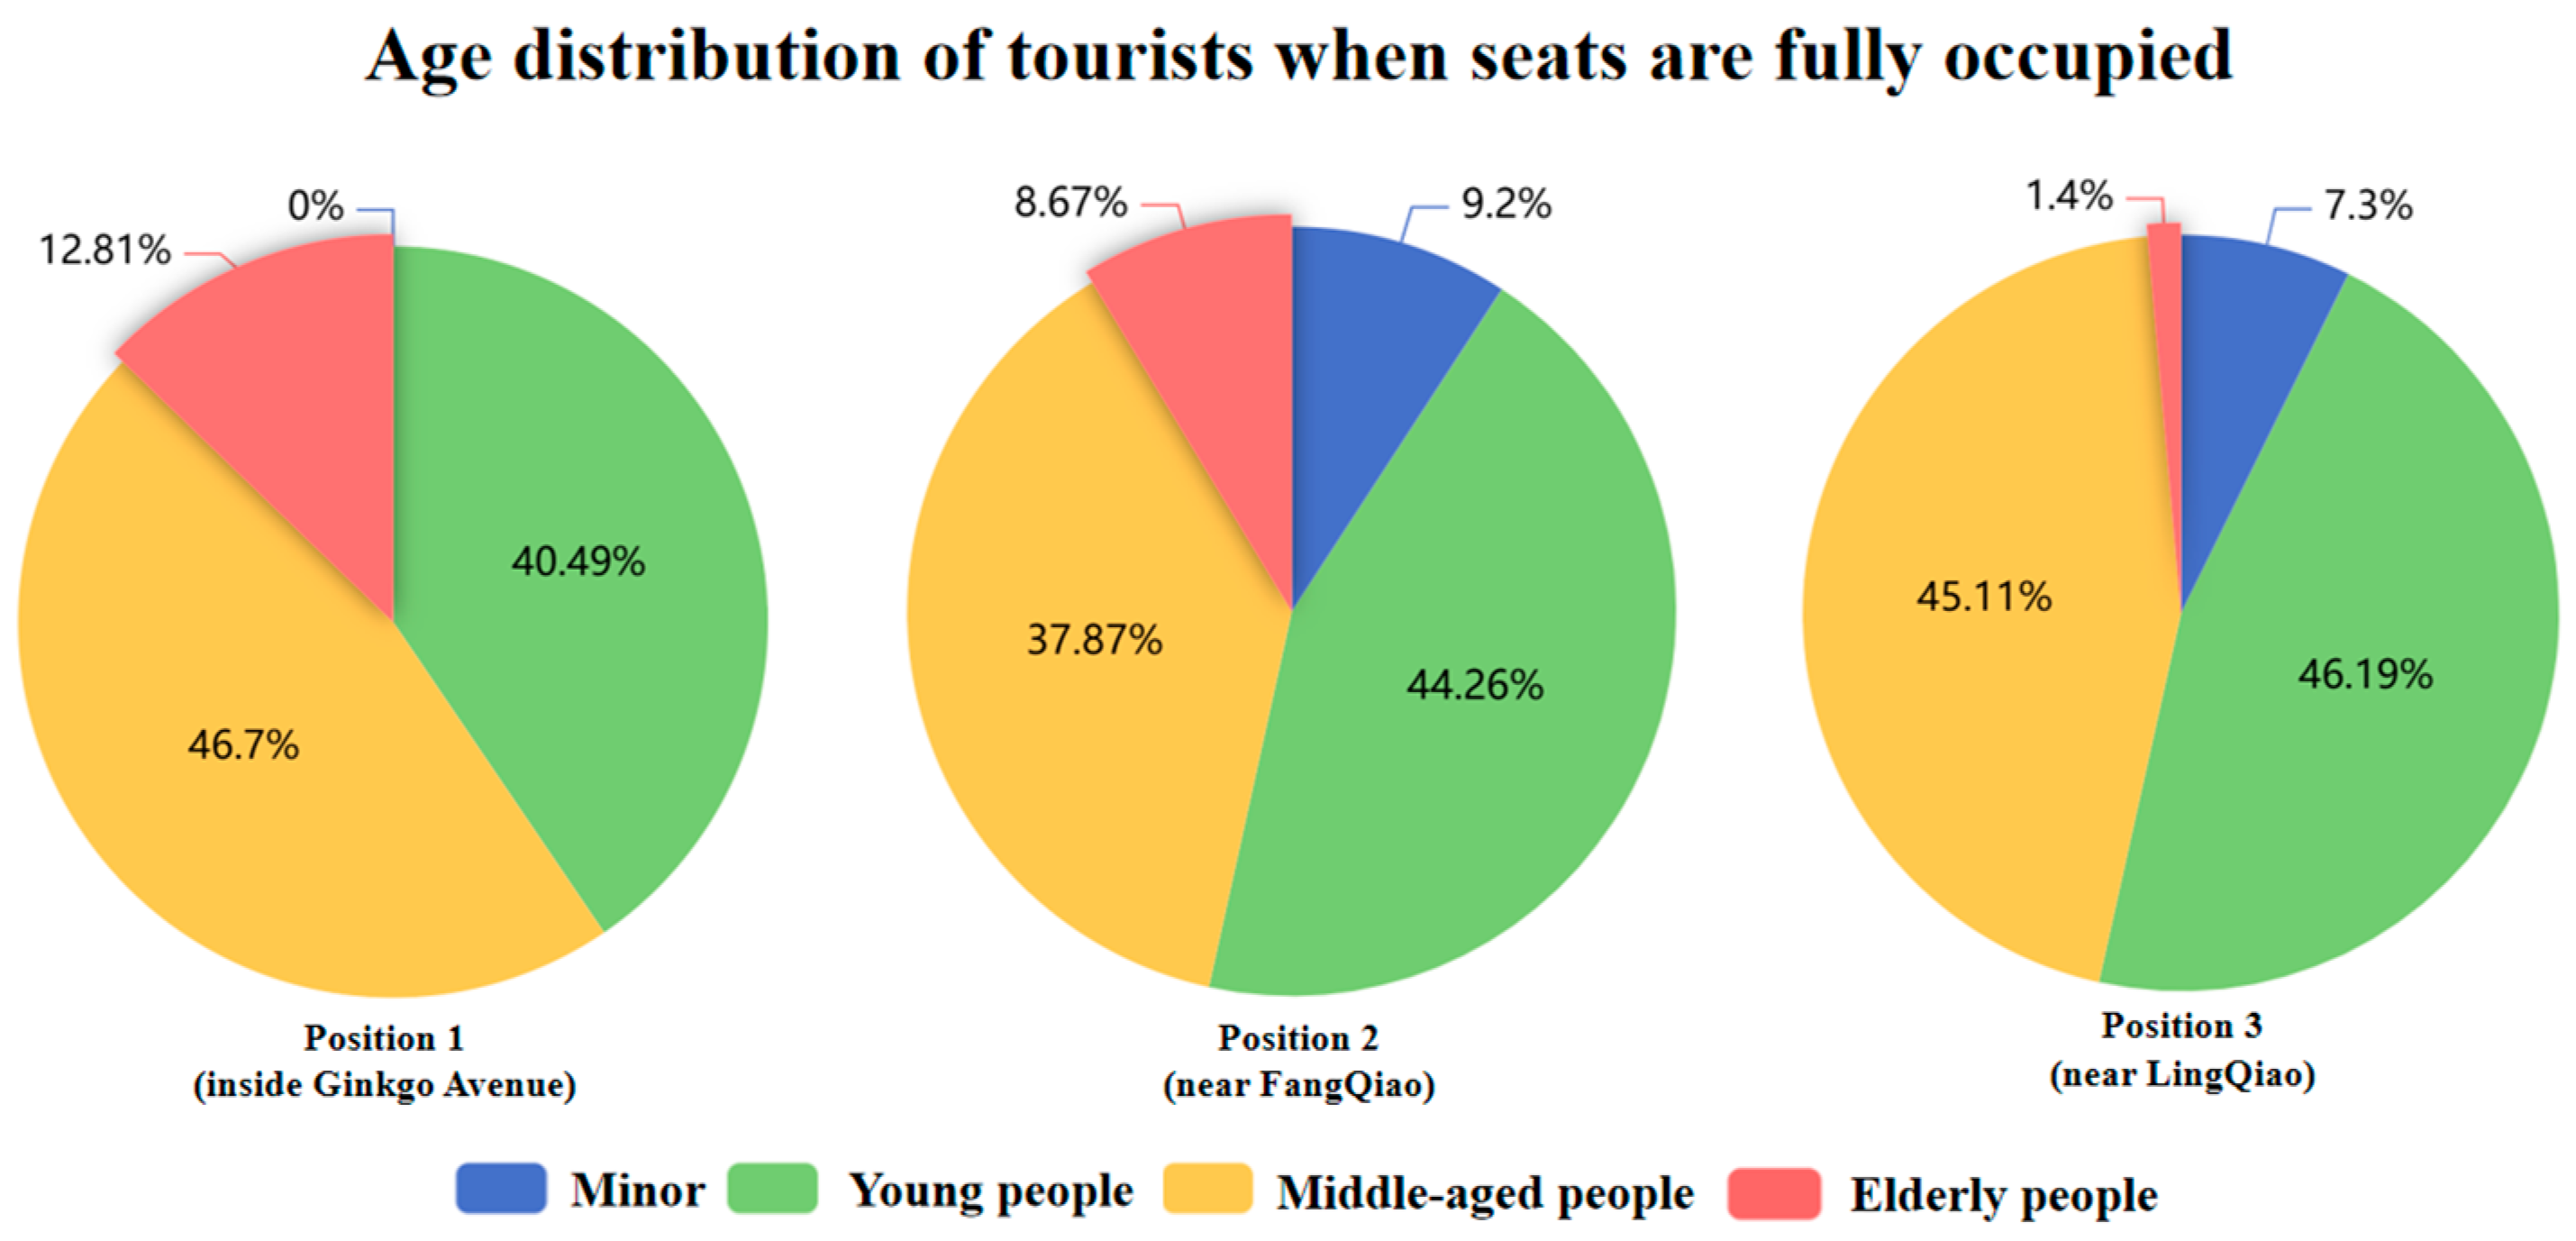
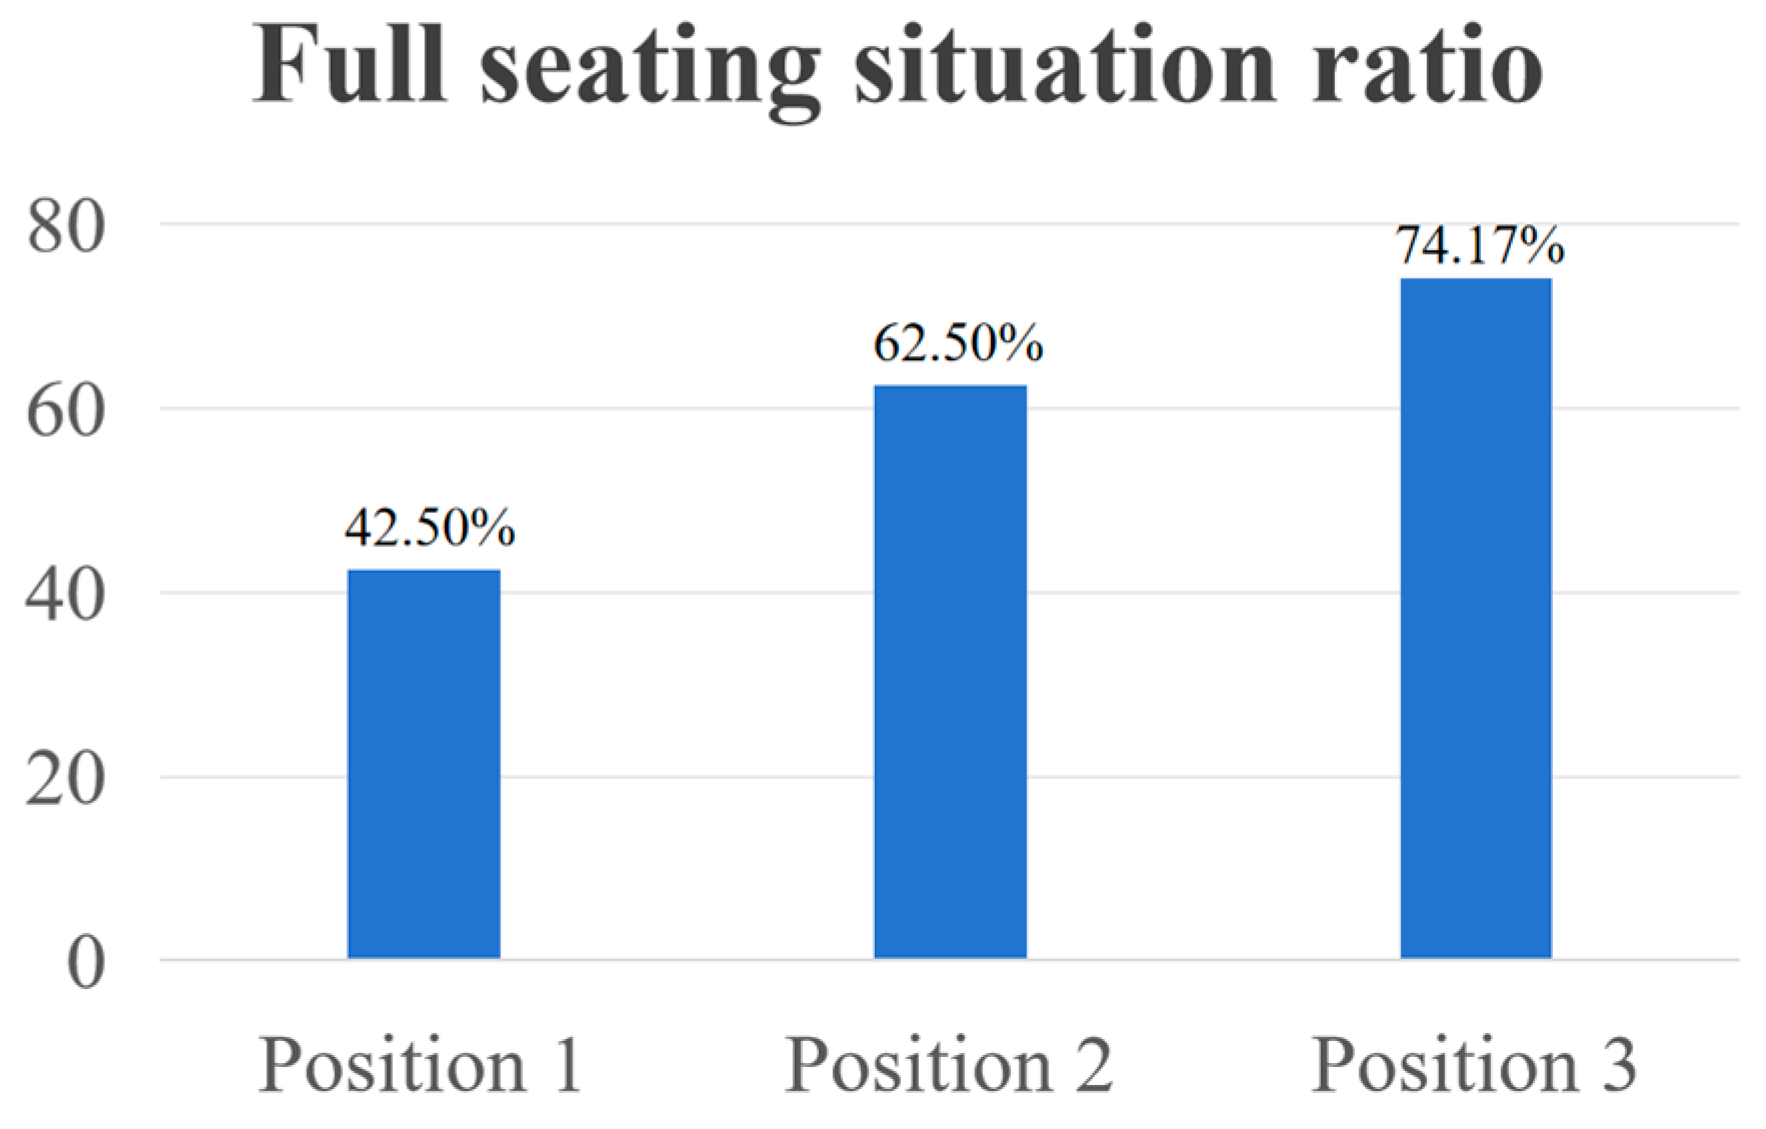
4.1. Usage of Service Facilities and Visitor Age Recognition Results

Figure 5 illustrates the usage of service facilities in the rest areas near Ginkgo Avenue, FangQiao, and LingQiao, along with the age identification results of the visitors.
The age recognition accuracy test was conducted using a video captured on a different day, taken from Position 2 on a weekend afternoon. The video had a duration of one hour, with one photo taken every minute. The test results indicate that the recognition accuracy for service facility usage was 88.3% while the accuracy of age range identification was 89.2%, demonstrating a high level of precision.
The reasons for incorrect judgments of service facility usage include passersby obstructing individuals using the facilities; children, due to their short stature and body frame with a height-to-width ratio of less than 2.5, being mistakenly counted as occupying seats when passing by; individuals sitting in wheelchairs directly in front of the facilities being incorrectly identified as occupying seats; and mutual occlusion between individuals sitting on the chairs. The reasons for incorrect age recognition include visitors sitting with their backs or sides to the camera, resulting in incomplete facial information; faces being obscured by hats, clothing, etc.; and varying lighting conditions affecting age recognition. The error recognition situation is shown in Figure 6.

4.2. Analysis of Aging-Friendly Adequacy Rate of Rest Facilities

The age group distribution under full occupancy conditions is shown in Figure 7. When fully occupied, the proportions of minors in Ginkgo Avenue, FangQiao, and LingQiao rest areas were 0%, 9.2%, and 7.3%, respectively; young adults accounted for 40.49%, 44.26%, and 46.19%; middle-aged adults constituted 46.7%, 37.87%, and 45.11%; and seniors represented 12.81%, 8.67%, and 1.4%. These results indicate that young and middle-aged adults are the primary users of the scenic area’s service facilities. Under high occupancy rates, the implicit occupation of rest facilities by non-elderly groups occurs, making it difficult for seniors to find available seating and compromising their rest needs.
The results, obtained using the evaluation method for the age-friendliness sufficiency of service facilities in scenic rest areas developed in this study, are presented in Figure 8. Position 1 (by Ginkgo Avenue) had a facility occupancy rate of 42.50%, with non-elderly individuals occupying an average of 87.19% of the seats when fully occupied, indicating a high level of age-friendliness sufficiency. Position 2 (near FangQiao) had a facility occupancy rate of 62.50%, with non-elderly individuals occupying an average of 91.33% of the seats when fully occupied, indicating a low level of age-friendliness sufficiency. Position 3 (near LingQiao) had a facility occupancy rate of 74.17%, with non-elderly individuals occupying an average of 98.60% of the seats when fully occupied, indicating a very low level of age-friendliness sufficiency.
The main routes to these three locations, based on the layout of the Xuanwu Lake Scenic Area, are illustrated in Figure 9.
For the Ginkgo Avenue rest area, the majority of visitors arrive at this zone by entering through Entrance 1 and following Route 1. Ginkgo Avenue is situated at a considerable distance from the scenic area’s entrance and, as it was not currently the peak viewing season, the number of visitors was relatively low. Moreover, the area is well-equipped with a substantial number of service facilities (with an average facility density of 10.5 per hundred meters), resulting in a lower occupancy rate. This adequately caters to the needs of elderly tourists, ensuring a comfortable experience for them.
For the FangQiao rest area, the majority of visitors also enter from Entrance 1 via Route 1. Due to the long walking distance, visitors often experience fatigue upon arrival, which increases the demand for facilities. Additionally, the area faces Xuanwu Lake, offering picturesque views, which attract visitors who prefer to rest there. However, with a limited number of available facilities (with an average facility density of 3.5 per hundred meters), the occupancy rate is high, failing to fully meet the needs of elderly tourists.
For the LingQiao rest area, visitors primarily access the area via two routes: Entrance 1 through Route 3 and Entrance 2 through Route 2. Situated near the lake and a rose garden, the area is popular due to its scenic surroundings. Both routes involve long walks, resulting in a high demand for facilities. However, the number of facilities in this area is very limited (with an average facility density of 1 per hundred meters), resulting in a very high occupancy rate. Facilities are frequently occupied by non-elderly visitors, leaving the needs of elderly visitors unmet.
In conclusion, the rest areas adjacent to FangQiao and LingQiao are situated at a considerable distance from the entrance of the scenic area, exceeding one kilometer. With a rest facility density of fewer than four per hundred meters, the provision of amenities is insufficient to properly accommodate the repose requirements of senior visitors. Consequently, this inadequacy contributes to a suboptimal adequacy rate for facilities designed to be aging-friendly.

4.3. Verification of Results

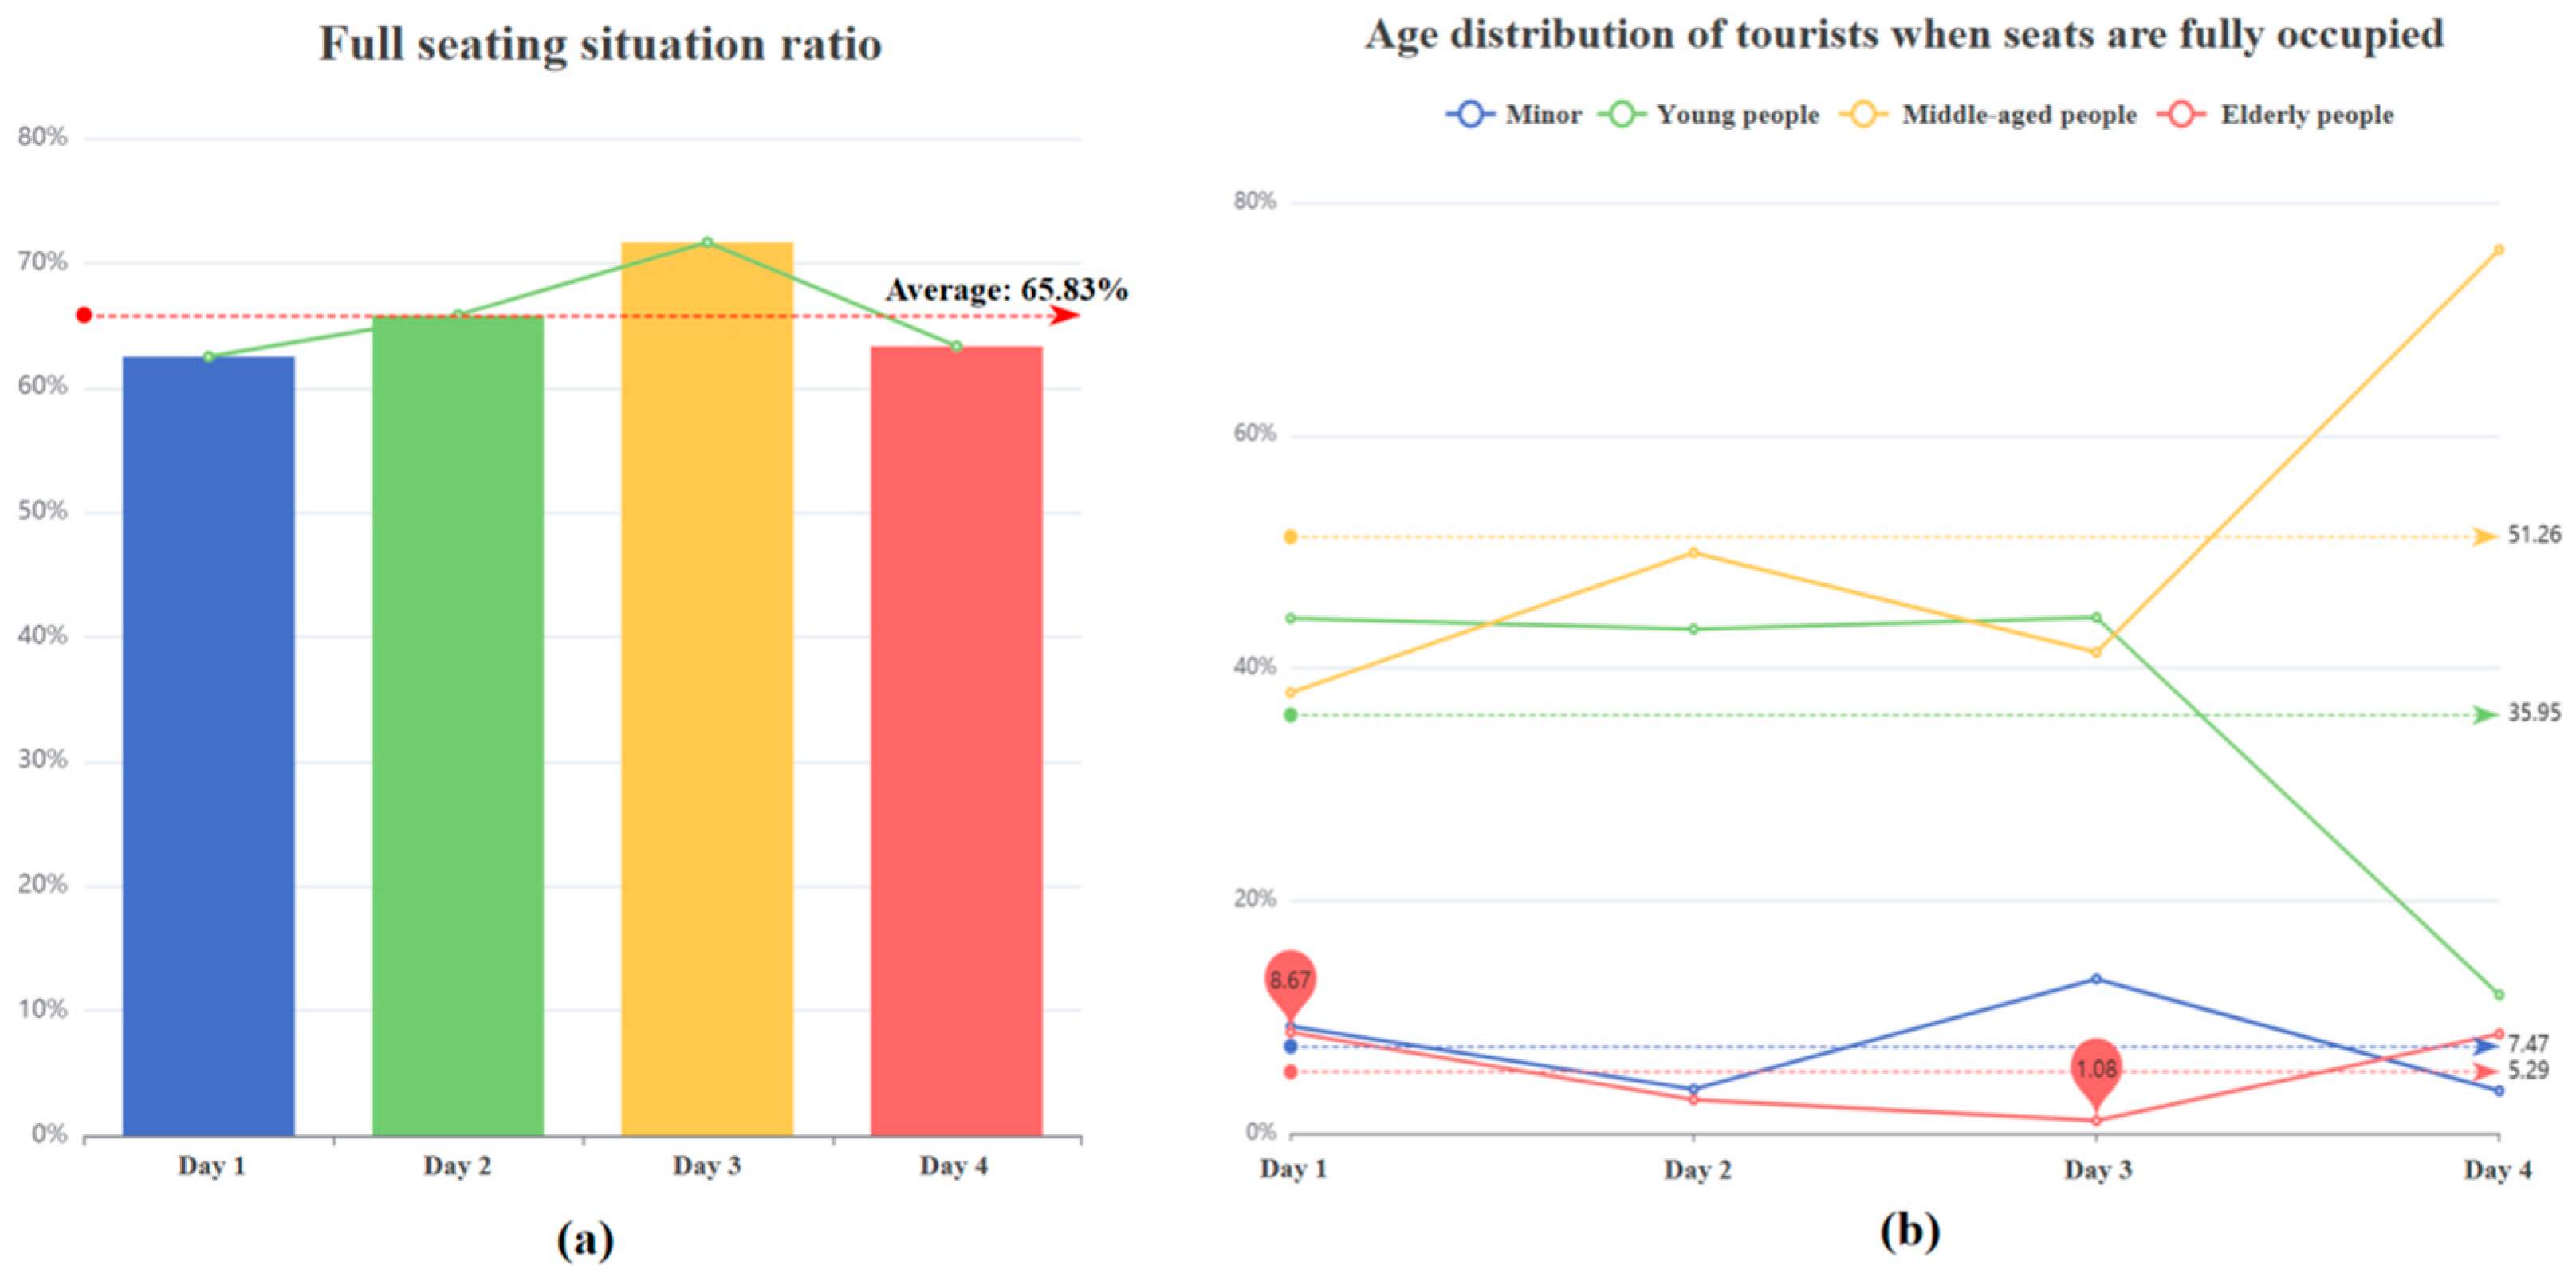
4.3.1. Multi-Period Monitoring and Verification

To verify the reliability and accuracy of the conclusions obtained by the research method and to analyze whether the selected experimental days can represent the typical situation of the scenic area on weekends, this study conducted four monitoring sessions at FangQiao rest area over a span of 43 days (from 2 November to 14 December 2024). The four selected days had similar meteorological conditions (moderate temperature and clear weather), and all data were collected during peak visitor hours (afternoon), with each day’s monitoring lasting for 2 h to ensure spatiotemporal comparability of the observations.
As shown in Figure 10, the seat occupancy rates of service facilities obtained from the four independent monitoring sessions exhibited a stable distribution, with values of 62.50% (Day 1), 65.83% (Day 2), 71.67% (Day 3), and 63.33% (Day 4). The corresponding proportions of elderly visitors during these periods were 8.67%, 2.89%, 1.08%, and 8.53%, respectively. Statistical analysis revealed that the average seat occupancy rate over the four days was 65.83% ± 3.82% (95% confidence interval), with a coefficient of variation (CV) of only 5.7%. The average proportion of elderly visitors was 5.29% ± 3.72%, and no significant differences were observed among the data from the experimental days, indicating stable observation results.
According to the evaluation model for the adequacy of aging-friendly service facilities established in this study, FangQiao rest area, under average conditions, exhibited a seat occupancy rate within the 30–70% range (65.83%), with non-elderly visitors accounting for over 90% (94.71%) of the occupancy. This categorized the rest area as having a low adequacy level in terms of aging-friendly service facilities, which aligned with the results from the selected experimental day (seat occupancy rate: 62.50%; non-elderly proportion at full occupancy: 91.33%). This demonstrates that the selected experimental days effectively represented the general operational state of the scenic area on weekends, exhibiting typicality and universality, and the research findings are reliable.

4.3.2. Validation Analysis Based on Online Reviews

This study incorporated publicly available tourist review data to conduct a multi-source validation of the distribution of rest facilities in the scenic area. An analysis of the review texts revealed significant spatial variations in visitor satisfaction regarding rest facilities, which aligned with the findings from on-site surveys.
In lakeside scenic areas (e.g., FangQiao and LingQiao regions), negative reviews primarily focused on insufficient rest facilities. Typical comments included “Too few benches by the lake”, “No available seats during peak hours”, and “Some visitors occupy seats for hours, making it difficult for others to use them”. These observations were consistent with this study’s conclusion that these areas exhibit low aging-friendly service facility adequacy, confirming that lakeside zones indeed suffer from inadequate rest facility allocation.
Conversely, in non-lakeside scenic areas (e.g., Ginkgo Boulevard), visitor reviews showed opposite trends. Multiple comments highlighted “densely arranged seating” and “rest areas available every few steps”. This aligned with the study’s findings of high aging-friendly service facility adequacy and a high facility density (10.5 per 100 m) in Ginkgo Boulevard, indicating sufficient rest facility provision in this region.
Online review data effectively captured tourists’ genuine feedback on rest facility usage, offering advantages such as large sample sizes, real-time insights, and spontaneous responses. Meanwhile, the on-site survey data quantitatively assessed service facility adequacy. The mutual validation between online reviews and field survey data further strengthened the credibility of this study’s conclusions and provided more comprehensive decision-making support for scenic area service facility planning.

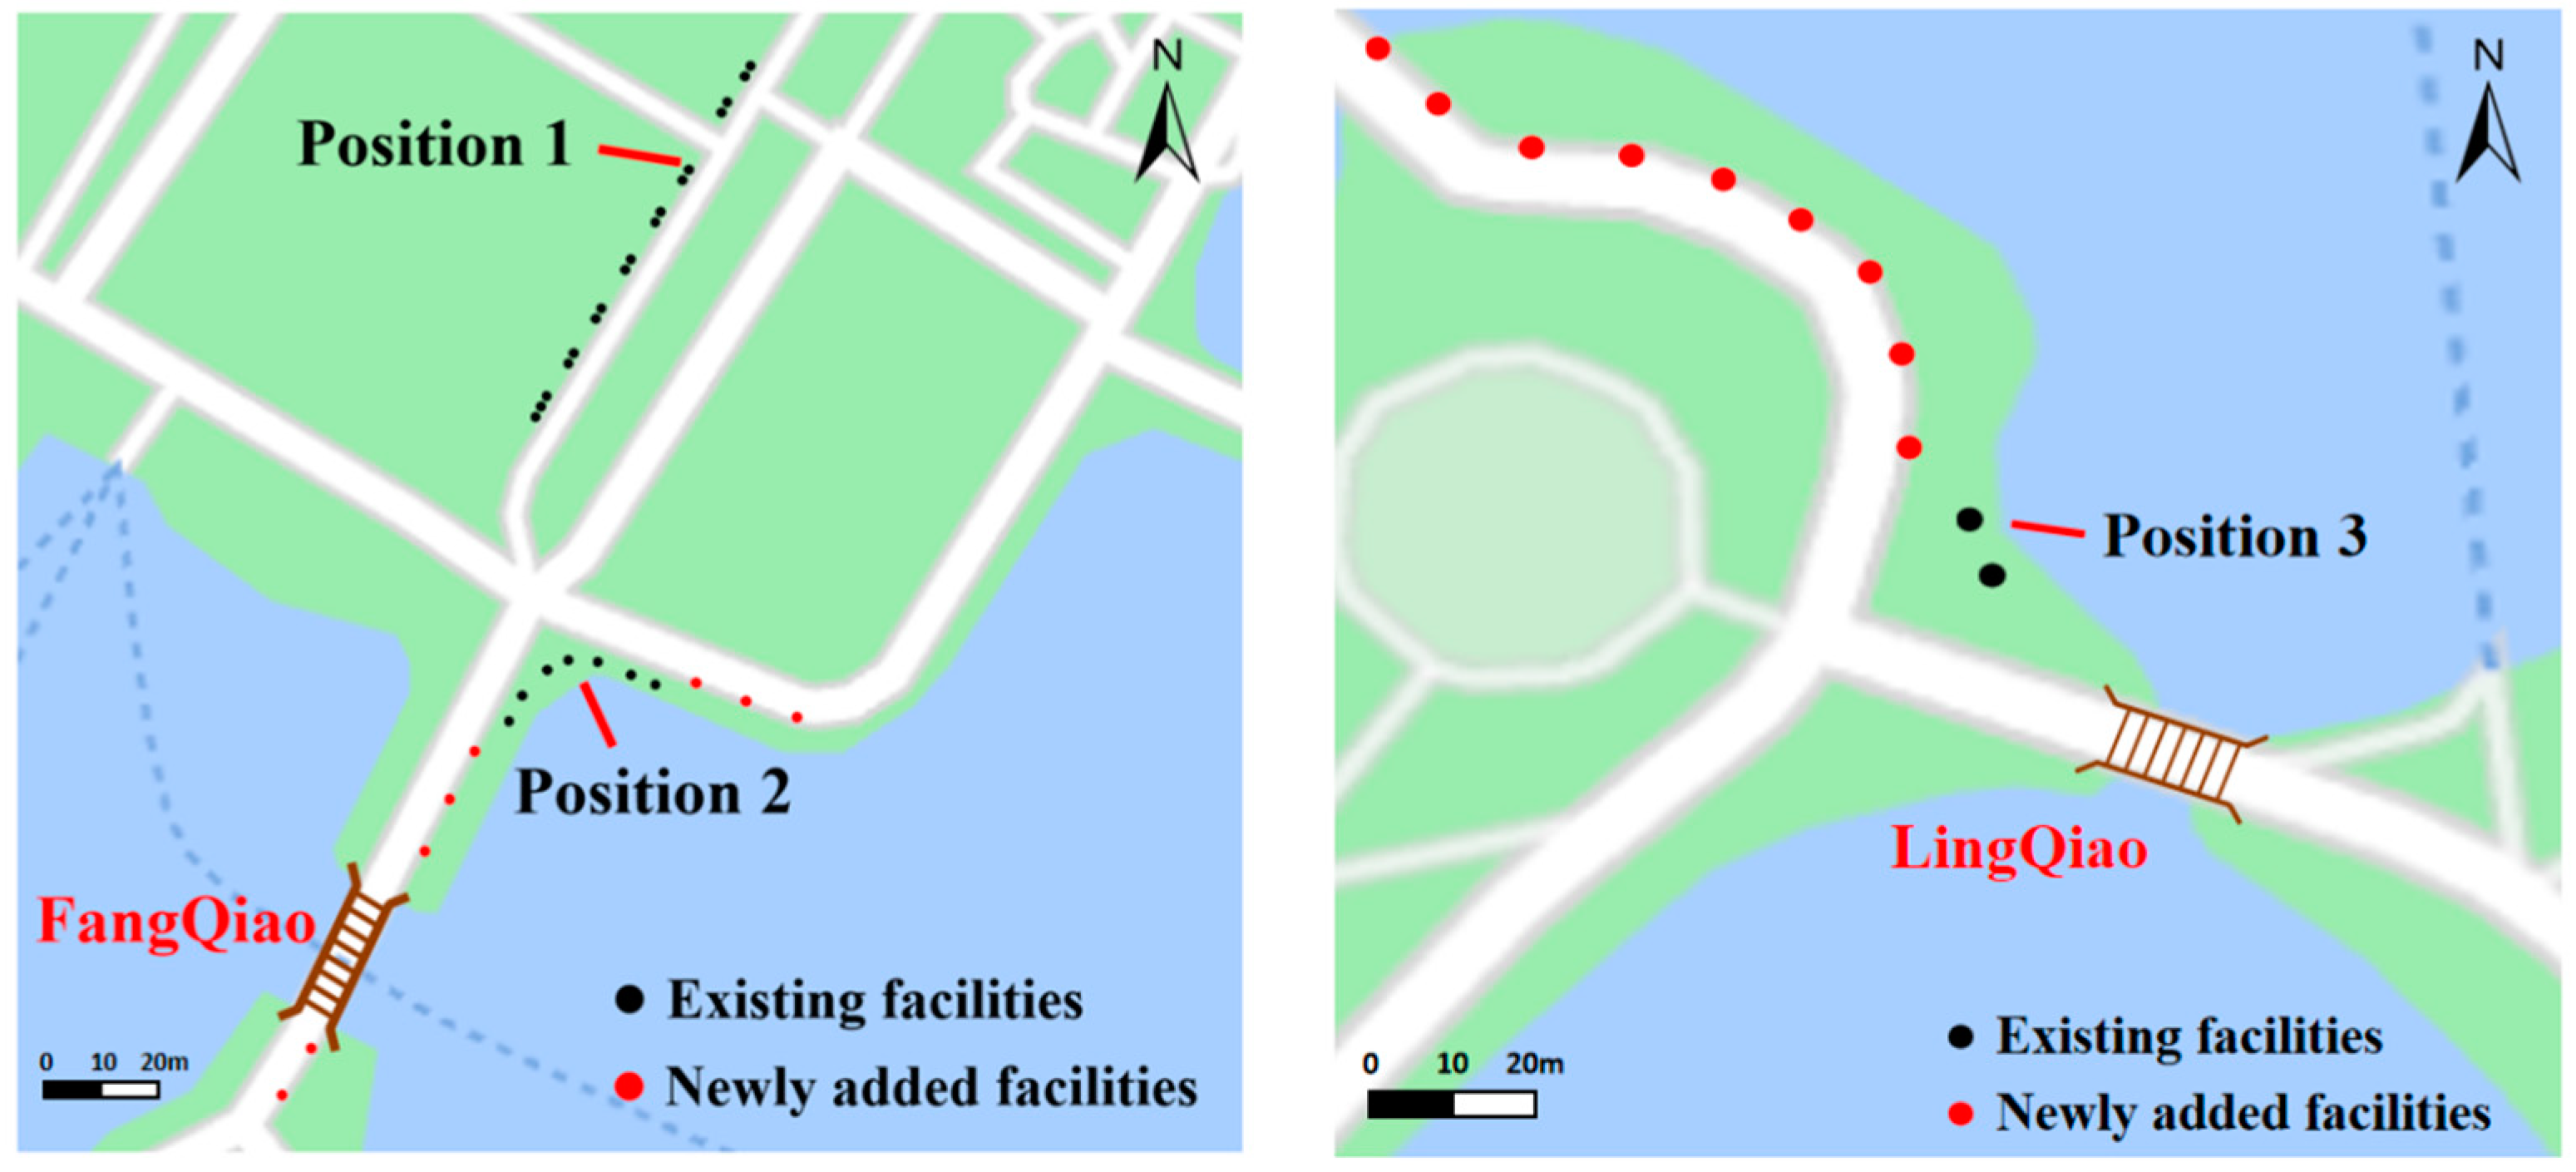
4.4. Optimization Analysis of Rest Facility Layout

Based on the above experimental results, for the FangQiao and LingQiao rest areas where the rest facilities cannot meet the needs of the elderly, we used the GIS spatial analysis method and referred to the resource layout of the scenic area with sufficient rest facilities (Ginkgo Avenue rest area), and carried out the optimization analysis of the layout of the rest facilities in these two areas.
Through the buffer zone analysis, we generated a service coverage with a radius of 10 m centered on the existing rest facilities and identified the areas within the rest area that were not covered by service facilities, i.e., the service blind zones. On the roads in the service blind zones, one new rest facility point was added every 10 m according to an even distribution. The optimized service facility layout is shown in Figure 11.
Through the optimized layout, the new leisure facilities effectively covered the original service blind zones and significantly enhanced the service capacity of the rest area. The density of service facilities in FangQiao rest area had increased from 3.5 to 7.5 per 100 m, and the density of service facilities in LingQiao rest area had increased from 1 to 5.5 per 100 m, which could effectively improve the aging-friendly adequacy rate of service facilities and better meet the resting needs of the elderly.
We employed a quantitative predictive model to assess the improvement in age-friendliness after increasing facility density. Based on current data and assuming constant visitor flow, we used an inverse relationship model to estimate the projected occupancy rate after adjusting facility density. The calculation formula is as follows:
F = F × ( D / D )
In the formula, F represents the original occupancy rate, F′ represents the new occupancy rate after the change in facility density, D represents the original facility density, and D’ represents the new facility density.
According to this prediction method, the current service facility density at FangQiao rest area was 3.5 units per hundred meters, with an occupancy rate of 62.50%. At full capacity, the average non-elderly occupancy rate was 91.33%. Based on the aging-friendly adequacy rate evaluation criteria established in this study, its aging-friendly adequacy level was classified as “relatively low”. If the service facility density was increased to 7.5 units per hundred meters while keeping visitor numbers constant, the occupancy rate was projected to decline to approximately 29.17%. At this point, according to the evaluation criteria (where F < 30% corresponded to a “high” aging-friendly adequacy rate), the rest area’s sufficiency level would improve from “relatively low” to “high”. Similarly, LingQiao rest area currently had a service facility density of 1 unit per hundred meters and an occupancy rate of 74.17%, which, according to the evaluation criteria (F > 70% = “low” sufficiency rate), placed it in the “low” category. However, if the facility density was significantly increased to 5.5 units per hundred meters (with no change in visitor numbers), the occupancy rate was expected to drop sharply to approximately 13.49%, well below the 30% threshold. Consequently, the rest area’s aging-friendly adequacy rate would jump directly from “low” to “high”. These adjustments indicate a substantial increase in seating availability, significantly improving accessibility and convenience for elderly users of rest facilities.

5. Discussion

5.1. Comparison with Prior Work

Traditional research on aging-friendly evaluations in tourist attractions primarily relies on data collection methods such as questionnaires, on-site observations, and random interviews. While these approaches can directly capture visitors’ subjective feedback, they have inherent limitations. The data collection process demands significant human resources and time, resulting in low efficiency and difficulties in achieving large-scale, continuous monitoring. Additionally, survey outcomes are susceptible to sampling bias and respondents’ subjective perceptions, potentially compromising data objectivity and representativeness. Furthermore, traditional methods struggle to capture dynamic changes in real time, such as fluctuations in facility usage or sudden issues, thereby limiting assessment accuracy and timeliness.
This paper proposes a novel aging-friendly evaluation method that integrates multiple computer-vision-based object detection and recognition models. By calculating the spatiotemporal occupancy rates of rest facilities and the proportion of elderly users, it enables the efficient quantitative analysis of aging-friendly facility adequacy. As an intelligent monitoring tool, computer vision technology offers a new research paradigm for aging-friendly assessments in scenic areas. Leveraging algorithms such as image recognition and object detection, it automates data processing and facilitates the quantitative analysis of facility usage, characterized by high efficiency, objectivity, and dynamic monitoring capabilities. The proposed method significantly improves data processing and analysis efficiency while reducing labor costs. Moreover, objective monitoring minimizes subjective biases inherent in human evaluations. The real-time analytical capacity of computer vision also supports dynamic assessments of facility usage, enabling the better analysis of temporal variations in tourist areas. Thus, this approach addresses some shortcomings of traditional methods and provides scientific support for optimizing service facility allocation and aging-friendly renovations in tourist attractions.
However, applying computer vision technology to aging-friendly evaluations still faces challenges. Algorithm accuracy depends on high-quality image data, and complex environmental factors (e.g., lighting variations) may impair recognition performance. Additionally, privacy concerns arise regarding visitor data, and the method has limitations in capturing subjective experiences and needs compared to traditional approaches. Therefore, it cannot entirely replace conventional methods.
Future research should explore the integration and synergistic innovation of computer vision and traditional methods. This approach should retain traditional surveys on tourists’ subjective satisfaction while incorporating objective quantitative analysis through computer vision, with a strong emphasis on privacy protection technologies, to establish a more comprehensive, accurate, and ethically compliant age-friendly assessment system for scenic areas. On one hand, traditional methods such as questionnaires and on-site interviews should be preserved to maintain their multidimensional measurement advantages in assessing elderly tourists’ subjective experiences (e.g., psychological comfort, service satisfaction, and emotional needs). On the other hand, computer vision techniques—including object detection and recognition algorithms—should be introduced to enable the objective quantitative analysis of service facility usage. Throughout this process, privacy protection measures such as data anonymization and de-identification must be applied to ensure the security of sensitive information (e.g., facial images). Additionally, multimodal data fusion analysis can be employed to cross-validate subjective perception data obtained from traditional surveys with objective behavioral data extracted via computer vision. This integration will help build a more holistic and precise age-friendly assessment framework for scenic areas, providing robust decision-making support for the age-friendly renovation of tourist destinations.

5.2. Limitation

While this study achieved certain results in evaluating the aging-friendliness of rest facilities in scenic areas, several limitations warrant further discussion.
Due to research conditions and time limitations, the field observation data were primarily collected during weekends in November and December 2024. Although multi-period monitoring and multi-source data validation ensured representativeness and generalizability, the study did not achieve the long-term continuous monitoring of the scenic area. The acquired data were limited in both temporal and spatial dimensions, lacking coverage of different periods such as peak/off-peak tourist seasons and holidays. Additionally, all observations were conducted under clear weather conditions, without considering the impact of rain, snow, strong winds, extreme heat, or cold on visitors’ rest facility usage behaviors. Consequently, the identified aging-friendly facility adequacy rates only reflected conditions during specific timeframes and weather scenarios, potentially failing to fully capture dynamic variations in facility usage across different seasons and climatic conditions.
Although computer vision algorithms demonstrated high accuracy in facility usage recognition and age classification, several practical challenges remained. Occlusion in complex crowd interactions, specific recognition requirements for special populations (e.g., individuals with disabilities), and variable lighting conditions in outdoor environments all influence recognition accuracy to varying degrees. These technical limitations may introduce biases in actual usage assessments, particularly during peak hours or under adverse weather conditions.
Due to research constraints, only three rest areas within the scenic site were selected for analysis. While these locations were typical and representative, they did not cover all critical nodes, such as transportation hubs and rest areas near restrooms, where usage patterns may differ. This sampling limitation may affect the generalizability of the findings. Furthermore, the study focused solely on seating facilities, excluding other aging-friendly amenities such as shade structures, accessible pathways, and drinking fountains, thereby limiting the comprehensiveness and systematicity of the conclusions. Additionally, the research primarily examined static facility configurations, with an insufficient analysis of dynamic behavioral patterns such as temporal fluctuations in visitor flow and durations of stays.
Future research will address these limitations by establishing enhanced long-term monitoring systems, incorporating more precise recognition algorithms, and introducing multidimensional evaluation metrics. These improvements aim to develop a more comprehensive and accurate assessment framework for aging-friendly facilities in scenic areas, thereby providing stronger scientific support for optimizing public spaces in an aging society.

5.3. Future Works

Future research should systematically optimize and expand this methodology across multiple dimensions to enhance its theoretical depth and practical value.
In terms of data collection, the results of this study will further address the current research limitations in temporal–spatial dimensions and climatic conditions. By adopting a longitudinal tracking research method, extended observations will be conducted to capture the differential impacts of seasonal variations (spring, summer, autumn, winter), tourism cycles (off-peak/peak seasons), and special time nodes (public holidays, weekends/weekdays) on the usage behavior of elderly-oriented rest facilities. Furthermore, future research could develop a “time-space-climate” three-dimensional dynamic analysis model. By quantifying the interaction mechanisms between environmental parameters and elderly outdoor activity behaviors, this model would systematically reveal the spatiotemporal heterogeneity of rest facility utilization rates and their climate response patterns. The establishment of such a model will contribute to the development of a data-driven, aging-adapted outdoor space optimization design method, providing scientific planning and decision-making support to address the outdoor activity needs of the elderly in the context of climate change.
In terms of expanding application scenarios, this paper can transcend current limitations by systematically broadening its scope along spatial and facility-type dimensions. Spatially, the model’s applicability could be extended to diverse tourist destinations, including mountainous scenic areas, coastal resorts, and historic districts, each presenting unique environmental characteristics. Regarding facility types, the research scope could be broadened to incorporate comprehensive amenities such as information centers, barrier-free pathways, and sanitation facilities, thereby establishing a robust evaluation index system for aging-friendly service adequacy. By developing a multidimensional, hierarchical assessment framework, this approach both facilitates comprehensive evaluations within individual scenic spots and provides differentiated, evidence-based theoretical foundations for aging-friendly renovations across various tourism destinations.
At the technical optimization and functional enhancement level, priority should be given to addressing computer vision accuracy challenges in complex environments. Advanced deep learning techniques, such as multi-scale feature fusion, could mitigate interference from object occlusion and extreme lighting conditions (e.g., backlighting, low illumination). Additionally, transfer learning frameworks could be explored to adapt to regional variations in data distribution. The integration of IoT sensor networks and edge computing technologies could facilitate real-time monitoring systems for aging-friendly facilities, enabling the automated collection and analysis of big data on visitor flow and facility utilization frequency. Time-series prediction models (e.g., LSTM, Transformer) combined with spatial statistical analysis could establish dynamic forecasting mechanisms for anticipating facility demand trends. Furthermore, multi-source data fusion methodologies could incorporate GIS, urban transportation data, and community demographic statistics to develop comprehensive evaluation models that account for multiple factors, including local age demographics, public transport accessibility, and pedestrian environment safety. Analytical Hierarchy Process (AHP)- or machine-learning-based feature importance assessment could quantify the relative weights of these influencing factors.
For practical applications, an intelligent decision-support system could be developed to generate customized renovation recommendations such as optimized spatial layouts of service facilities, accessible route network planning, and emergency service point allocation. By establishing a dynamic evaluation index system for scenic area aging-friendliness and integrating it with smart city management platforms, a closed-loop “monitoring-evaluation-optimization-feedback” mechanism could be implemented. This would provide ongoing technical and theoretical support for building an age-friendly society. Subsequent research could also investigate cross-cultural comparative studies to examine regional variations in elderly tourists’ behavioral characteristics and their implications for facility requirements, thereby enhancing the model’s cross-scenario adaptability.
Through interdisciplinary integration and technological innovation, future research will deepen both the theoretical framework and practical applications of aging-friendly services in tourist areas. From scenario expansion and technical refinement to decision support, subsequent work will focus on developing more intelligent, precise, and dynamic assessment systems and optimization frameworks. These advancements will promote the evolution of inclusive and human-centered public services in tourism destinations. Against the backdrop of synergistic development between smart cities and an aging society, breakthroughs in this field could not only create safer and more comfortable travel experiences for elderly populations but also provide novel methodological references for scenic area renovations, ultimately contributing practical solutions for building an age-friendly society.

6. Conclusions

The accelerating global aging phenomenon, particularly evident in populous nations like China, has profoundly transformed multiple societal domains. Tourist attractions, serving as vital leisure spaces for older adults, now face pressing demands for age-adapted facility upgrades. Current assessment methodologies for age-friendliness remain constrained by conventional questionnaire surveys and observational techniques, approaches that suffer from inefficiency and substantial subjectivity, consequently yielding imprecise evaluations. To overcome these limitations, this investigation has introduced an innovative computer-vision-based assessment framework. The proposed system integrates YOLOv8 and MiVOLO deep learning models to automatically analyze visitor demographics (with specific age-group identification) and facility utilization patterns, thereby enabling the objective and efficient evaluation of age-friendly rest facility adequacy in tourism settings.
The results of this study demonstrate the substantial advantages of computer-vision-based evaluation methods in enhancing assessment efficiency and accuracy. Through experimental research conducted at the Xuanwu Lake Scenic Area in Nanjing, this study verified that the method can accurately and in real-time detect the usage of rest areas by elderly visitors while also quantifying the age-friendly adequacy of rest facilities. This study concluded that the rest areas located more than 1 km from the entrance of the scenic spot had a facility density of fewer than 4 per 100 m, which was insufficient to fully accommodate the resting needs of elderly visitors, resulting in a low aging adequacy rate. Furthermore, there was significant potential for improvement in the quantity, distribution, and utilization of the scenic spot’s open space service facilities.
This study systematically validated the research findings through multi-period experiments and online review data analysis. The four-day repeated monitoring at FangQiao rest area demonstrated that the average facility occupancy rate (65.83%) and non-elderly user proportion at peak times (94.71%) closely aligned with single-day experimental data, confirming this area’s low aging-friendly facility adequacy while verifying both methodological stability and sampling day representativeness. The cross-validation with online reviews revealed significant spatial differentiation in visitor satisfaction regarding rest facilities. Negative reviews about lakeside areas (FangQiao and LingQiao) corresponded with observed insufficient facility adequacy whereas positive feedback from non-lakeside areas (e.g., Ginkgo Boulevard with 10.5 facilities per 100 m) matched its higher adequacy rating. This multi-temporal monitoring and multi-source data verification approach significantly enhanced conclusion reliability, providing comprehensive evidence for scenic area facility planning.
This paper proposes a resource allocation optimization scheme for open space areas with low aging adequacy. We use GIS spatial analysis methods to increase the number of open space facilities through buffer zone analysis. Through the above optimization measures, the scenic spot can effectively increase the aging-friendly adequacy rate of service facilities and improve the experience of the elderly tourists.
This study introduced computer vision technology to quantify the spatiotemporal occupancy rate of rest facilities in scenic areas and the proportion of elderly users, proposing an efficient and objective aging-friendly evaluation method. Compared with traditional methods such as questionnaires and manual observations, the new approach addresses certain shortcomings, including high labor and time costs, cumbersome procedures, low efficiency, and strong subjectivity and randomness. It achieves the automated analysis of facility usage in scenic areas, providing quantifiable and objective indicators for aging-friendly evaluations, thereby filling the gap in technology-driven assessment tools in existing research.
However, this study also had some limitations. In terms of data, the observations were limited to specific seasons and weather conditions, lacking coverage of peak and off-peak tourist periods, diverse climates, and long-term continuous monitoring, which may have affected the generalizability of the conclusions. Technically, the accuracy of computer vision algorithms in complex scenarios (e.g., occlusions, lighting variations, and identification of individuals with disabilities) still requires improvement. In terms of research scope, the study focused only on seating facilities in three typical rest areas, excluding other critical zones and facility types such as transportation hubs and accessible pathways. In future research, we will further optimize the method to address these issues and expand its applicability.
The computer-vision-based evaluation method provides scenic areas with a scientific aging-friendly assessment tool and decision-making basis for renovations. Future research should focus on optimizing and upgrading computer vision algorithms by incorporating techniques such as multi-scale feature fusion and transfer learning to enhance recognition robustness in complex scenarios. Additionally, deeper integration with traditional evaluation methods should be explored to establish an intelligent assessment system incorporating GIS spatial analysis, IoT real-time monitoring, and multi-source data fusion. Furthermore, research dimensions should be expanded to include facility design parameters, environmental characteristics, and other factors into the evaluation framework, enabling the development of dynamic analytical models. These future efforts will effectively guide scenic areas in optimizing service facilities, strengthening safety risk management, and improving personalized service levels, thereby providing more scientific and precise decision-making support for aging-friendly renovations and advancing the development and sustainable growth of elderly-friendly tourism environments.

Author Contributions

Conceptualization, W.D. and S.L.; methodology, W.D. and S.L.; software, W.D.; validation, W.D.; formal analysis, W.D.; investigation, W.D. and S.L.; data curation, W.D.; writing—original draft preparation, W.D. and S.L.; writing—review and editing, W.D. and S.L.; visualization, W.D.; supervision, S.L.; project administration, S.L.; funding acquisition, S.L. All authors have read and agreed to the published version of the manuscript.

Funding

This research was funded by the Natural Science Research Start-up Foundation of Recruiting Talents of Nanjing University of Posts and Telecommunications under Grant number NY222028 and the Foundation of Anhui Province Key Laboratory of Physical Geographic Environment under Grant number 2023PGE009.

Institutional Review Board Statement

Not applicable.

Informed Consent Statement

Not applicable.

Data Availability Statement

The data presented in this study are available on request from the corresponding author; the data are not publicly available due to privacy restrictions.

Conflicts of Interest

The authors declare no conflicts of interest.

References

  1. The Report on the Progress of Strengthening and Advancing Aging Work by the State Council. National People’s Congress of China. Available online: http://www.npc.gov.cn/npc/c2/c30834/202208/t20220831_319086.html (accessed on 6 April 2025).
  2. Alley, D.; Liebig, P.; Pynoos, J.; Banerjee, T.; Choi, I.H. Creating Elder-Friendly Communities. J. Gerontol. Soc. Work 2007, 49, 1–18. [Google Scholar] [CrossRef] [PubMed]
  3. Lim, H.-J.; Nam, S.-W.; Lee, P.S.-H. A Study on the Development of Elderly-Friendly Parks in Accordance with Demographic Change: Parks in Seoul. J. Humanit. Soc. Sci. Res. 2023, 31, 344–363. [Google Scholar] [CrossRef]
  4. Chen, X.; Liu, W.; Yang, C. Research on the influence of urban park built environment elements on the activities of the elderly. South Archit. 2022, 12, 93–103. [Google Scholar]
  5. Lee, C.-F. An Investigation of Factors Determining Destination Satisfaction and Travel Frequency of Senior Travelers. J. Qual. Assur. Hosp. Tour. 2016, 17, 471–495. [Google Scholar] [CrossRef]
  6. Liew, S.L.; Hussin, S.R.; Abdullah, N.H. Attributes of Senior-Friendly Tourism Destinations for Current and Future Senior Tourists: An Importance-Performance Analysis Approach. Sage Open 2021, 11, 215824402199865. [Google Scholar] [CrossRef]
  7. Lee, C.-F.; King, B. Determinants of attractiveness for a seniors-friendly destination: A hierarchical approach. Curr. Issues Tour. 2016, 22, 71–90. [Google Scholar] [CrossRef]
  8. Xie, B.; An, Z.; Zheng, Y.; Li, Z. Healthy aging with parks: Association between park accessibility and the health status of older adults in urban China. Sustain. Cities Soc. 2018, 43, 476–486. [Google Scholar] [CrossRef]
  9. Heo, C.U.; Kim, J.-D. Relationship between the frequency of leisure facility utilization and leisure satisfaction in the senior age group. Int. J. Tour. Hosp. Res. 2019, 33, 137–156. [Google Scholar] [CrossRef]
  10. Kim, J.-Y.; Jeong, S. An Empirical Study on Improvement of Age-friendly Park through IPA Analysis—Focusing on the Osolgil Neighborhood Park, Yangcheon-gu, Seoul. J. Urban Des. Inst. Korea Urban Des. 2021, 22, 47–65. [Google Scholar] [CrossRef]
  11. Yu, W.; Sun, B.; Hu, H. Sustainable Development Research on the Spatial Differences in the Elderly Suitability of Shanghai Urban Parks. Sustainability 2019, 11, 6521. [Google Scholar] [CrossRef]
  12. Yu, W.; Hu, H.; Sun, B. Elderly Suitability of Park Recreational Space Layout Based on Visual Landscape Evaluation. Sustainability 2021, 13, 6443. [Google Scholar] [CrossRef]
  13. Kuprashevich, M.; Tolstykh, I. MiVOLO: Multi-Input Transformer for Age and Gender Estimation; Lecture Notes in Computer Science; Springer: Berlin/Heidelberg, Germany, 2024; pp. 212–226. [Google Scholar] [CrossRef]
  14. Ding, L.; Liang, Y.Z. Cloud computing and Internet of Things in the evaluation of ecological environment quality in rural tourist areas in smart cities. Mobile Inf. Syst. 2021, 2021, 6295568. [Google Scholar] [CrossRef]
  15. Yang, W.; Nan, J.; Sun, D.Z. An online water quality monitoring and management system developed for the Liming River basin in Daqing, China. J. Environ. Manag. 2008, 88, 318–325. [Google Scholar] [CrossRef] [PubMed]
  16. Yang, Z.Y.; Wen, J.; Huang, K.D. A method of pedestrian flow monitoring based on received signal strength. Eurasip J. Wirel. Commun. Netw. 2022, 2022, 2. [Google Scholar] [CrossRef]
  17. Provost, D.A.; Swenson, J.N.; Grosser, A.T. Design of a performance monitoring system for an innovative geotechnical slope stabilization design-build project. Eng. Monit. Manag. Geotech. Infrastruct. 2020, 316, 50–59. [Google Scholar] [CrossRef]
  18. Mu, R.; Zeng, X. A Review of Deep Learning Research. KSII Trans. Internet Inf. Syst. 2019, 13, 1738–1764. [Google Scholar] [CrossRef]
  19. Liu, Y.; Cheng, Y.; Wang, W. A Survey of the Application of Deep Learning in Computer Vision. In Proceedings of the Global Intelligent Industry Conference 2018, Guimarães, Portugal, 21–23 November 2018. [Google Scholar]
  20. Matsuzaka, Y.; Yashiro, R. AI-Based Computer Vision Techniques and Expert Systems. AI 2023, 4, 289–302. [Google Scholar] [CrossRef]
  21. Li, B.; Huang, Y.; Lan, G.; Li, T.; Lu, T.; Yao, M.; Luo, Y.; Li, B.; Qian, Y.; Gao, Y. Research on intelligent scenic security early warning platform based on high resolution image: Real scene linkage and real-time LBS. Proc. SPIE Int. Soc. Opt. Eng. 2015, 9808, 98083M. [Google Scholar] [CrossRef]
  22. Cheng, J.; Li, Q. Integrated Architecture Model of Tourism Information Service in Smart Scenic Spots Based on Hybrid Cloud. Sci. Program. 2021, 2021, 1–15. [Google Scholar] [CrossRef]
  23. Liu, J.; Wu, G.; Liu, Y. Early warning on safety risk of highly aggregated tourist crowds based on VGGT-Count network model. PLoS ONE 2024, 19, e0299950. [Google Scholar] [CrossRef]
  24. Song, Z.; Lu, J. Early Warning and Management Method of Abnormal Performance of Tourist Scenic Spots Assisted by Image Recognition Technology. Discrete Dyn. Nat. Soc. 2022, 2022, 6217530. [Google Scholar] [CrossRef]
  25. Lin, Y. Automatic recognition of image of abnormal situation in scenic spots based on Internet of things. Image Vis. Comput. 2020, 96, 103908. [Google Scholar] [CrossRef]
  26. Sirisha, U.; Praveen, S.; Srinivasu, P.N.; Barsocchi, P.; Bhoi, A.K. Statistical Analysis of Design Aspects of Various YOLO-Based Deep Learning Models for Object Detection. Int. J. Comput. Intell. Syst. 2023, 16, 126. [Google Scholar] [CrossRef]
  27. Kaur, R.; Singh, S. A comprehensive review of object detection with deep learning. Digit. Signal Process. 2022, 132, 103812. [Google Scholar] [CrossRef]
  28. Dogra, A.K.; Sharma, V.; Sohal, H. A survey of deep learning techniques for detecting and recognizing objects in complex environments. Comput. Sci. Rev. 2024, 54, 100686. [Google Scholar] [CrossRef]
  29. Wang, S.; Han, J. Automated detection of exterior cladding material in urban area from street view images using deep learning. J. Build. Eng. 2024, 96, 110466. [Google Scholar] [CrossRef]
  30. Elakkiya, R.; Subramaniyaswamy, V.; Vijayakumar, V.; Mahanti, A. Cervical Cancer Diagnostics Healthcare System Using Hybrid Object Detection Adversarial Networks. IEEE J. Biomed. Health Inform. 2022, 26, 1464–1471. [Google Scholar] [CrossRef]
  31. Elakkiya, R.; Chandra, H.; Pears, N.; Vairavasundaram, S.; Kotecha, K. Lung image quality assessment and diagnosis using generative autoencoders in unsupervised ensemble learning. Biomed. Signal Process. Control 2024, 102, 107268. [Google Scholar] [CrossRef]
  32. Ren, S.; Li, X. HResFormer: Hybrid Residual Transformer for Volumetric Medical Image Segmentation. IEEE Trans. Neural Netw. Learn. Syst. 2025, 1–9. [Google Scholar] [CrossRef]
  33. Costa, J.; Bottega, J.A.; Antonio, M.; Fernando, D. Deep Deterministic Policy Gradient for Navigation of Mobile Robots. J. Intell. Fuzzy Syst. 2020, 40, 349–361. [Google Scholar] [CrossRef]
  34. Alem, A.; Kumar, S. Deep Learning Models Performance Evaluations for Remote Sensed Image Classification. IEEE Access 2022, 10, 111784–111793. [Google Scholar] [CrossRef]
  35. Mecheri, K.; Klai, S.; Souici-Meslati, L. Deep learning based web service recommendation methods: A survey. J. Intell. Fuzzy Syst. 2023, 44, 1–21. [Google Scholar] [CrossRef]
  36. Grigorescu, S.; Trasnea, B.; Cocias, T.; Macesanu, G. A survey of deep learning techniques for autonomous driving. J. Field Robot. 2019, 37, 362–386. [Google Scholar] [CrossRef]
  37. Eum, I.; Kim, J.; Wang, S.; Kim, J. Heavy Equipment Detection on Construction Sites Using You Only Look Once (YOLO-Version 10) with Transformer Architectures. Appl. Sci. 2025, 15, 2320. [Google Scholar] [CrossRef]
  38. Park, S.; Kim, J.; Wang, S.; Kim, J. Effectiveness of Image Augmentation Techniques on Non-Protective Personal Equipment Detection Using YOLOv8. Appl. Sci. 2025, 15, 2631. [Google Scholar] [CrossRef]
  39. Li, K.; Wang, M.; Liu, Y.; Yu, N.; Lan, W. A Novel Method of Hyperspectral Data Classification Based on Transfer Learning and Deep Belief Network. Appl. Sci. 2019, 9, 1379. [Google Scholar] [CrossRef]
  40. Zhang, X.; Min, C.; Luo, J.; Li, Z. YOLOv5-FF: Detecting Floating Objects on the Surface of Fresh Water Environments. Appl. Sci. 2023, 13, 7367. [Google Scholar] [CrossRef]
  41. Ren, S.W.; Liu, C.J.; Li, J.Z.; Jiang, R.K.; Wang, X.H.; Xue, C.B. Efficient Hardware Acceleration System Design for End-to-End Object Detection Neural Network. Trans. Beijing Inst. Technol. 2022, 42, 1312–1320. [Google Scholar]
  42. Xie, H.; Cao, J.; Li, P.; Zhao, X.B.; Zhang, X. A Hardware Accelerator for SSD Object Detection Algorithm Based on FPGA. Acta Sci. Nat. Univ. Pekin. 2022, 58, 1015–1022. [Google Scholar]
  43. Choi, S.B.; Lee, S.S.; Park, J.; Jang, S.J. Implementation of post processing hardware for real-time object detection in CNN acceleration system. In Proceedings of the 2021 36th International Technical Conference on Circuits/Systems, Computers and Communications, Jeju, Republic of Korea, 27–30 June 2021; p. 9501433. [Google Scholar] [CrossRef]
  44. Li, J.Q.; Long, X.L.; Hu, S.H.; Hu, Y.M.; Gu, Q.Y.; Xu, D. A novel hardware-oriented ultra-high-speed object detection algorithm based on convolutional neural network. J. Real-Time Image Process. 2020, 17, 1703–1714. [Google Scholar] [CrossRef]
  45. Hussain, M. YOLO-v1 to YOLO-v8, the Rise of YOLO and Its Complementary Nature toward Digital Manufacturing and Industrial Defect Detection. Machines 2023, 11, 677. [Google Scholar] [CrossRef]
  46. Kuprashevich, M.; Alekseenko, G.; Tolstykh, I. Beyond Specialization: Assessing the Capabilities of MLLMs in Age and Gender Estimation. SSRN Electron. J. 2025. [Google Scholar] [CrossRef]
  47. GB/T 10000-2023; Chinese Adult Body Dimensions. State Bureau of Technical Supervision: Beijing, China, 2023.
  48. GB/T 26158-2010; Chinese Juvenile Body Dimensions. General Administration of Quality Supervision, Inspection and Quarantine of the People’s Republic of China (AQSIQ), Standardization Administration of China (SAC): Beijing, China, 2010.
  49. GB/T 17775-2024; Classification and Evaluation of Quality Grade for Tourist Attractions. State Administration for Market Regulation (SAMR), Standardization Administration of China (SAC): Beijing, China, 2024.
Figure 1. Location of the study area and data distribution.
Applsci 15 05343 g001
Figure 2. Framework for analyzing the aging-friendly adequacy rate of rest area facilities in tourist attractions.
Applsci 15 05343 g002
Figure 3. YOLOv8 model structure.
Applsci 15 05343 g003
Figure 4. Method for determining tourist usage of service facilities.
Applsci 15 05343 g004
Figure 5. Service facility usage and visitor age recognition results.
Applsci 15 05343 g005
Figure 6. Error recognition scenarios. (a) Passersby blocking visitors using the service facilities. (b) Children passing by the service facilities being mistakenly identified as occupying the seats. (c) A person sitting in a wheelchair directly in front of the service facility being mistakenly identified as occupying the seat. (d) People sitting on chairs blocking each other.
Applsci 15 05343 g006
Figure 7. Proportions of age groups when three rest points are full.
Applsci 15 05343 g007
Figure 8. Results of full occupancy at the three locations.
Applsci 15 05343 g008
Figure 9. Main routes to the three locations.
Applsci 15 05343 g009
Figure 10. Results of four experiments in the FangQiao region. (a) Full seating situation ratio. (b) Age distribution of tourists when seats are fully occupied.
Applsci 15 05343 g010
Figure 11. Optimized layout of scenic service facilities.
Applsci 15 05343 g011
Table 1. The parameters and accuracy of YOLOv8 and MiVOLOv2 models.
ModelYOLOv8MiVOLOv2
Metric
Dataset SizeCOCO dataset
(covering 80 classes)
IMDB-Clean dataset
(183,886 training images, 45,971 validation images, and 56,086 test images)
Batch Size16192
Epoch100220 (face) + 400 (body)
Learning rate0.011.5 × 10−5 (face), 1 × 10⁻⁵ (body)
mAP37.3-
MAE-4.24
Table 2. Comparison of age and body width in Chinese individuals.
GenderAge RangeAverage Body WidthAge RangeAverage Body Width
Male4–630418–25448
7–1034026–35454
11–1238036–60449
13–15417≥61440
16–17439
Female4–629618–25400
7–1033026–35406
11–1237236–60413
13–15404≥61409
Table 3. Evaluation standards for the aging-friendly adequacy rate of rest area facilities in scenic areas.
Evaluation StandardAging-Friendly Adequacy Rate
F < 30%High
30% ≤ F ≤ 70%, Y ≤ 90%Relatively high
30% ≤ F ≤ 70%, Y > 90%Relatively low
F > 70%Low
Disclaimer/Publisher’s Note: The statements, opinions and data contained in all publications are solely those of the individual author(s) and contributor(s) and not of MDPI and/or the editor(s). MDPI and/or the editor(s) disclaim responsibility for any injury to people or property resulting from any ideas, methods, instructions or products referred to in the content.

