Article

Coordinated Multimodal Transportation Infrastructure Planning in Megacities: An Agent-AI-Discrete Network Design Problem Approach Based on Chat-GPT

School of Mechanics and Civil Engineering, China University of Mining and Technology, Xuzhou 221116, China
*
Author to whom correspondence should be addressed.
These authors contributed equally to this work.
Appl. Sci. 2025, 15(10), 5319; https://doi.org/10.3390/app15105319
Submission received: 5 April 2025 / Revised: 1 May 2025 / Accepted: 7 May 2025 / Published: 9 May 2025
(This article belongs to the Section Civil Engineering)

Abstract

:
The Discrete Network Design Problem (DNDP) has mainly been used in unimodal infrastructure planning in small cities. This is because it does not consider differences in traveler mode choice. To address the challenges of multimodal transportation infrastructure planning in megacities, this study proposes a new Agent-AI DNDP (AA-DNDP) framework. AA-DNDP extends the traditional DNDP by incorporating mode-choice functionality. In each simulation iteration, the Agent-AI calls Chat-GPT via API, using the attributes of the origin and destination as prompts to generate a mode choice. Based on the selected transportation mode, the Agent-AI records the associated travel time and path. By aggregating the travel times and paths across a large number of Agent-AI simulations, two key indicators are derived: average using time (AUT) and path usage frequency (PUF). These metrics are then used to evaluate the suitability of different infrastructure planning strategies. Using the DNDP framework, a large number of multimodal transportation infrastructure planning schemes for the megacity are generated. By analyzing variations in AUT and PUF across these schemes, the most suitable planning configuration is identified. Chongqing was selected as the empirical case with which to evaluate the effectiveness of the proposed AA-DNDP framework. The results demonstrate that AA-DNDP can effectively assess the rationality of existing transportation infrastructure planning and identify theoretically optimal configurations based on AUT and PUF. The case study further confirms that AA-DNDP enhances the evaluation of network efficiency and facilitates coordinated multimodal infrastructure planning, offering a more practical and data-informed approach to improving transportation systems in megacities.

1. Introduction

Cities represent the most efficient form of land use, often exhibiting high economic vitality, well-developed infrastructure, abundant public service resources, and a strong radiation effect. Therefore, cities in various countries continuously attract the inflow of migrant populations, leading to an expansion of the jurisdiction. Megacities with a population of 10 million or more and an area of over 10,000 square kilometers are increasingly emerging [1]. The continuous expansion of cities has been a historical characteristic over the past century, resulting in a distribution pattern of human civilization with megacities as hubs of politics, economy, and culture. The expansion of cities is also a trend in future development, which will induce the ongoing growth of existing megacities and the emergence of new ones [2]. Consequently, urban transportation infrastructure faces a severe challenge. Transportation infrastructure serves as a circulatory system, facilitating the internal flow of people and goods, as well as the internal and external exchange of materials among cities. Due to the influence of the geometric properties of the city, the marginal effect of newly built urban transportation infrastructure will be dramatically weakened as the area and population of the city expand to a certain extent [3]. This implies that to serve the same area and population, the mileage of transportation infrastructure in the newly extended fringe area of the city is much greater than that in the existing area of the city center. This phenomenon can be attributed to three primary causes. Firstly, the urban expansion area is far away from the urban geometric incenter, and longer transportation infrastructure is required to effectively connect with other areas [4]; secondly, the existing transportation infrastructure in the urban expansion area is relatively weak, and extensive supplementary construction is required to connect the existing transportation networks in megacities [5]; thirdly, the population in the expansion area is relatively dispersed, and a large amount of transportation infrastructure should be constructed to meet the transportation needs of the local population [6]. Due to diminishing marginal returns, the increase in transportation service capacity becomes smaller with each additional mile of similar infrastructure added in megacities. To maintain the function of megacities, the constructed mileage of transportation infrastructure worldwide has exhibited an almost geometric growth trend in recent decades. The transportation infrastructure requires significant costs for construction, operation, and maintenance. The construction, operation, and maintenance costs of transportation infrastructure remain high in megacities, which triggers the encroachment of expenditures on public services such as security, environment, education, and healthcare [7]. Currently, issues such as disordered public security, accumulated garbage, and high levels of homelessness are becoming common challenges for megacities worldwide. If the service capacity of transportation infrastructure can be effectively improved, and the construction, operation, and maintenance costs can be reduced, related expenses will be saved in megacities. If the expenses can be allocated properly, the security, environment, education, and public health of the city will be improved.
The diminishing marginal effect of transportation infrastructure with the development of megacities can be effectively addressed through the coordinated planning of diverse transportation infrastructure [8]. Megacities can maximize the effectiveness of their transportation network by reasonably planning and integrating various types of infrastructure, such as municipal roads, subways, highways, expressways, railways, and high-speed railways. Passengers can take the subway to the train station, then board a train or high-speed train to their final destination. From there, they can transfer to a bus at a transit point to reach their final destination. This intermodal transport can save remarkable time and costs, as well as improving comfort and safety. Moreover, intermodal transport can eliminate the need for constructing lengthy subways or municipal roads. Fast and efficient intercity railways and high-speed trains are used for long-distance travel, improving transportation efficiency while reducing dependence on expensive subways and urban elevated expressways. As a result, the overall cost-effectiveness of transportation infrastructure is significantly enhanced. However, transportation infrastructure in megacities is constructed and managed by different departments. Different transportation infrastructure is often planned, constructed, operated, and maintained independently, without considering interdependence and the overall impact on the integrated transportation network in megacities. This independent approach has caused significant duplicate constructions, resulting in the waste of resources and funds [9]. Additionally, the independent planning, construction, operation, and maintenance of megacity transportation infrastructure are almost incapable of optimizing the overall transportation system for intermodal transport, reducing the overall effectiveness of the transportation network [10].
Compared to the construction, operation, and maintenance phases of transportation infrastructures in megacities, the planning phase is the most important and simple part for achieving intermodal coordination in transportation infrastructure. In terms of importance, the planning phase serves as the foundation for subsequent phases. Implementing coordinated planning for multiple transportation infrastructures can create a feasible basis for coordinated construction, operation, and maintenance [11]. In terms of simplicity, there are significant differences in the construction, operation, and maintenance of different transportation infrastructures. Different transportation infrastructures, as well as the phases of construction, operation, and maintenance, are often implemented by different departments. In the planning phase, there are many commonalities in the planning tasks involved in different transportation infrastructures, indicating that the same planning department can often handle the planning work for different types of transportation infrastructure [12]. The key to the coordinated construction of transportation infrastructure in megacities lies in the coordinated planning of such infrastructures. There is an urgent need for a coordinated planning approach for the multiple transportation infrastructures in megacities worldwide. The current situation and unique characteristics of various transportation modes should be considered in the planning phase to avoid functional duplication and overlapping routes. The advantages of different transportation infrastructures should be maximized to improve the operational efficiency of existing infrastructures and significantly reduce construction and maintenance costs. Therefore, the financial challenges posed by the planning and construction of transportation infrastructures can be managed, and the service capacity of transportation networks can be improved. Meanwhile, service gaps and voids in the transportation infrastructure have been avoided, enhancing efficiency and ensuring fairness in public services. Although the importance of coordinated planning for transportation infrastructure has become very evident in megacities, a widely accepted method for coordinated transportation planning has not yet been established. This study aims to analyze this complex issue and propose a novel method for the coordinated planning of transportation infrastructure in megacities based on Agent-AI dynamic simulation. This approach aims to promote the development of multimodal transportation infrastructure planning and attempts to address the marginal effect of transportation infrastructures in megacities.
The rest of this paper is organized as follows. In the Section 2, existing relevant studies will be reviewed. In the Section 3, detailed research steps will be presented. In the Section 4, Chongqing’s transportation infrastructures will be used as a case study, and the coordinated planning method proposed in this research will be applied to test the differences between coordinated planning and general planning. In the Section 5, this paper will attempt to provide possible explanations for the research results. In the Section 6, this paper will summarize the research conclusions. Finally, in the Section 7, this paper will summarize the research limitations and provide a future outlook.

2. Literature Review

The transportation infrastructure exhibits network characteristics, and the complex network is a well-established approach for transportation infrastructure planning in current studies [13]. The continuous network design problem method (CNDP) is first applied to the planning and construction of transportation infrastructure. This approach considers transportation infrastructure as an integral system composed of node elements and edge elements. The service capacity and rationality of transportation infrastructure networks can be evaluated by calculating indicators such as the degree, betweenness centrality, edge betweenness, and average path length [14]. This method facilitates the quantification of various performance metrics for transportation infrastructure in megacities, providing a basis for the coordinated planning of transportation infrastructure.
The CNDP is widely employed in research on the planning and construction of transportation infrastructure. However, some limitations have gradually emerged during its application. The CNDP assumes that if the evaluated network is fixed and invariant, the addition or removal of existing nodes and edge elements within the network cannot be operated [15]. Transportation infrastructure is constantly changing, and the suspension or disruption of existing routes, as well as the construction and optimization of new routes, are common phenomena of network structure changes. A fixed network struggles to adjust the network structure in response to different environmental changes, and the optimization of transportation networks cannot be realized [16]. The discrete network analysis problem method (DNDP), optimized from the CNDP, is gradually being applied, which inherits the advantage of the CNDP, such as ease of calculation and quantification [17]. A new fixed network derives from the variation in the transportation network structure through the enumeration algorithm, thus the issue that the traditional fixed network analysis could only evaluate issues that fail to be optimized has been resolved.
The DNDP is widely utilized in the planning and optimization of transportation infrastructure, playing a significant role in the planning of a single transportation network [18]. However, when the research object is a comprehensive transportation network, including municipal roads, subways, highways, expressways, railways, and high-speed railways, the discrete network optimization cannot consider behavior differences and transfer issues [19]. The selection of transportation infrastructure and possible transfer are ignored by the DNDP. However, the congestion, difficulties in ticketing, and excessive loss of highways in the real transportation system of megacities are primarily caused by the selection of transportation modes. The transfer behavior implies the integration of multiple transportation infrastructures, effectively enhancing the transportation efficiency in megacities [20]. The high costs and low efficiency of transportation infrastructure can be partly attributed to the limitations of research methods.
Recent advancements in AI/ML have significantly enhanced transportation planning, particularly in traffic flow prediction [21], public transit demand modeling [22], and travel behavior analysis [23]. Emerging methods like generative AI-based spatiotemporal networks [21] and optimized CNNs [23] outperform traditional models in both accuracy and efficiency. Systematic reviews further underscore the integration of AI, IoT, and blockchain in smart transportation systems [24,25], while reinforcement learning has shown promise in improving public transport regularity [26]. Furthermore, the transformative potential of artificial intelligence and machine learning (AI/ML) has been clarified in urban transportation planning, providing a barrier-free, green, and livable transportation future for all [27]. These innovations offer strong technical support for large-scale, data-driven planning in megacities.
The development of Agent-AI simulation technology overcomes the limitations of the DNDP [28,29]. The challenge of the DNDP is in simulating user behavior, because the DNDP method relies on computer programs for analysis. From a technical perspective, the DNDP computer program relies on an architecture of “data + algorithm”, making it challenging to adjust the “data” and “algorithm” based on the obtained results [16]. Thus, the critical factor of user behavior cannot be introduced into the analysis process. The emergence of Agent-AI has made breakthroughs in traffic simulation technology. The Agent-AI is embedded into the DNDP analysis process for simulating user behavior, and then the network structure is evaluated and optimized through the DNDP method. Therefore, this combined method can effectively address the current challenge [30,31].
The Agent-AI is incorporated to offer a new perspective for transportation planning in megacities. Based on the surrounding scenarios of nodes, user roles can be set by using Agent-AI during the program setup process; thereby, the limitation of user roles is compensated for coordinated planning in megacity transportation [32]. Furthermore, the Agent-AI can automatically adjust parameters in subsequent program stages, thus compensating for transfer issues by changing user roles [33]. The transfer issue can be viewed as a change in the mode of transportation used by a single user, or it can be considered as involving two users. Prior to the transfer, the user may be identified as a highway or subway passenger, and after the transfer, the user might be an airplane or high-speed railway passenger. Waiting time and security check time are treated as separate components of time [34].
Consequently, the DNDP method has been widely applied in urban transportation infrastructure planning, providing a solid foundation for this study. But for the coordinated planning of megacity transportation infrastructure, the selection of transportation modes and transfer issues has not been considered. Introducing Agent-AI into the DNDP method can theoretically address the limitations of existing methods. Therefore, the coordinated planning issues of transportation infrastructure can be resolved and the conclusions are more in line with the real condition of transportation infrastructure in megacities.

3. Method

The existing research regards the transportation infrastructure in megacities as a network structure, and the complex network analysis is used to theoretically improve the transportation efficiency. This study is similar to the development of complex network analysis. Firstly, a CNDP model is designed to quantitatively evaluate the rationality of network structures. Then, a program for automatically controlling the network structure is introduced to build a DNDP model that can enumerate and evaluate all possible network structures. Finally, Agent-AI is introduced to develop an AA-DNDP model, and network node weights and user preferences based on the DNDP framework are added to address AI-assisted design for transportation infrastructure planning in urban agglomerations. The methodology system is shown in Figure 1.

3.1. Part One: CNDP

As with previous studies, the CNDP initially belongs to the complex network analysis, and subsequent research methodologies have been extended based on the initial method. This study also adopts the same methodology; a foundational CNDP model is initially constructed to calculate the necessary evaluation indicators. The steps are as follows.
Step 1: Constructing a topological network model based on urban agglomeration transportation networks.
Users consider differences in cost, time, and safety with regard to transportation modes. To reflect these differences, multiple networks should be constructed to represent the characteristic differences in various transportation modes [35,36]. This paper suggests obtaining a set of geographic points V for from OpenStreetMap using OSMNX in megacities. The set of geographic points V is decomposed into the following geographic point sets: Vhighway, which includes all nodes in the study; Vexpressway, which includes the entrances and exits of expressways; Vsubway, which includes subway stations for urban rail transit; Vrailway, which includes train stations; and Vhigh-speed railway, which includes high-speed rail stations. The transportation infrastructure network E within the area can be obtained through OSMNX, including the expressway segment set Eexpressway, the regular-speed highway segment set Eregular-speed highway, the high-speed railway segment set Ehigh-speed railway, the regular-speed railway segment set Eregular-speed railway, and the urban rail transit segment set Esubway. As long as the data sources are from the same time period, the transportation network array G can be constructed as follows.
G = { G h i g h w a y , G r o a d , G h i g h r a i l w a y , G r a i l w a y , G s u b w a y } Taking   G highway   as   an   example , G h i g h w a y = ( V h i g h w a y , E h i g h w a y )
Step 2: Select a random user, along with a starting point, an endpoint, and a mode of transportation. Record the time they spend on their journey.
The CNDP is the earliest complex network analysis and also the foundation of all complex network analyses. Currently, a large number of network evaluation indicators are designed for on-demand use in subsequent research [37,38]. This study focuses on the logistics efficiency of urban transportation infrastructure, and the average transportation time is selected as the metric for measurement based on the suggestions from Yang and Brown [39,40]. The more efficient the transportation infrastructure system in a megacity, the lower the average transportation time. To calculate the average path time and retain the extension possibility of the model, Guo suggests that randomly selected paths should be applied to calculate the average path time, resulting in a travel information group (TI) as shown in (2) [41].
Based on the proportion of freight and passenger transport by highways, expressways, railways, and high-speed railways in that year, a mode of transportation is randomly selected to determine a network from Ghighway, Gexpressway, Grailway, Ghigh-speed railway, and Gsubway. Then, the starting point s and ending point e are randomly chosen among the nodes. Dijkstra’s algorithm is used to obtain the shortest path. The average travel time of a randomly selected path t and the route group p of the shortest path are obtained by selecting the average speed of the selected transportation and the shortest path, thereby obtaining the travel information group. Owing to the combination of the Dijkstra and A* algorithms, the shortest algorithm is a traditional method used for obtaining the shortest path between two points in a complex network. For detailed calculation processes, the papers by Johnson (1973) and Climaco and Martins (1982) can be used as references [42,43]. If there is no need to understand the internal algorithm, the corresponding function in the Network X 3.3 library can be employed to make the calculation.
T I n = { t y p e , s n V t y p e , e n V t y p e , t n = S h o r t e s t ( G t y p e , s n , e n ) , p n = S h o r t e s t ( G t y p e , s n , e n ) E t y p e } where t y p e { h i g h w a y , r o a d , h i g h r a i l w a y , r a i l w a y , s u b w a y }
Step 3: Repeat the process and record the time each time.
Repeating Step 2 allows one to superimpose a large number of users in the transportation network, thereby simply reflecting the rationality of the transportation infrastructure. Two indicators need to be recorded for subsequent evaluation. One is the time tn used for each simulation, and the set T is obtained by recording tn to store all simulated travel times as shown in (3).
T = { t 1 , t 2 , t 3 , , t n }
The other is the path record pi for each simulation, containing the starting point si, the ending point ei, and m intermediate points, namely m1i to mmi, as shown in (4).
P = { p 1 , p 2 , p 3 , , p n } where p n = { s n , m 1 n , , m m n , e n }
Step 4: Calculating the average time.
The average use time and the path usage frequency are calculated to evaluate the efficiency of the urban cluster transportation network. The calculation of average user travel time (AUT) is as follows:
A U T = i = 1 n t i n
The calculation of puf is as follows:
p u f = p u f + 1 if   the   road   is   used p u f if   the   road   is   not   used
This paper obtains a simple model for evaluating network performance. The network performance is reflected through AUT and puf. The AUT reflects the overall efficiency of the transportation infrastructure network. For urban agglomeration traffic networks, the better the performance, the lower the AUT; the shorter the transportation time, the lower the transportation cost [44]. The puf reflects the efficiency of the constituent element within the network. The better the performance of the transportation network, the more balanced the puf should be, avoiding paths with excessively high or low usage frequencies [45]. This indicates that the newly built transportation infrastructure needs a certain usage frequency, and an excessively low usage frequency means a lack of construction value.
This model is simple and reliable, providing a reference for network design. However, this model is not well suited for the design of transportation infrastructure in megacities. The model is designed to evaluate the fixed model, but the optimal model cannot be obtained. If the transportation infrastructure in urban agglomerations can be implemented successfully, the theoretically optimal solution must be obtained. Therefore, an extension is required on this basis to optimize the CNDP model to resemble the DNDP model.

3.2. Part One: DNDP

As with previous studies, this study also incorporates an enumeration algorithm to the CNDP model, and then a DNDP model is constructed to optimize the network structure of the transportation infrastructure.
Step 1: Designing a topological network generator capable of enumerating all route optimizations.
Megacity transportation infrastructure planning generally refers to the new construction, renovation, and expansion of transportation infrastructure in urban agglomerations over the next 5–10 years [46]. Different implementation plans correspond to the construction sequences of these roads, and the same transportation infrastructure planning corresponds to various implementation plans. Assuming the implementation plan includes n transportation infrastructure (TI) lines, the construction of TI1 to TIn theoretically has n! implementation plans. The matrix for the implementation scheme of the transportation infrastructure group (TIG) is an n! × n matrix, with elements represented by TI. The row of an element represents an implementation scheme, and the column indicates the priority as shown in (7). The smaller the column number, the higher the priority of the element within the implementation scheme.
T I G = T I 1 T I 2 T I n T I 2 T I 3 T I n T I 2 T I 3 T I 1 T I n ! T I n ! 1 T I 1
A double-loop program is compiled to traverse the TIG matrix, the outer loop constructs each row of elements as an independent matrix, and the inner loop extracts elements from each row. Row number i ranges from 1 to n! and column number j ranges from 1 to n, placing them into G to construct G′. Then, the constructed CNDP model is employed to calculate the AUTij of G′, as shown in (8).
A U T i j = C N D P ( G ) where G = G { T I G i j }
To execute the loop, subsequent elements are placed into network G′ to calculate the AUTij+1.
A U T i j + 1 = C N D P ( G ) where G = G { T I G i j + 1 }
An AUT matrix will be formed after the loop is completed. The elements are the evaluation indicators calculated by the DNDP model for each implementation step.
A U T = a u t 11 a u t 12 a u t 1 n a u t 21 a u t 22 a u t 2 n a u t i 1 a u t i 2 a u t i n a u t n ! 1 a u t n ! 2 a u t n ! n

3.3. Part Three: AA-DNDP

The AUT matrix has been widely applied in research on networks such as circuit networks, power transmission networks, and neural networks, exhibiting excellent performance. It has become an effective approach for network planning [47,48,49]. However, the AUT cannot be effectively applied in megacity transportation network planning. The limitations are as follows: It fails to consider the impact of individual preferences on the results. It fails to consider the effect of combined transportation by multiple infrastructures on the efficiency of transportation infrastructure. As a result, the AUT matrix obtained through the DNDP method cannot be directly employed to the traffic network planning in urban agglomerations.
The Agent-AI (AA) model is integrated into the DNDP method, and the starting and ending points are provided for a single simulation of DNDP based on the residential attribute differences in megacities during the execution of the DNDP program. Based on the differences in safety, speed, comfort, price, and convenience among various transportation modes, the preference information is provided for a single simulation, and different sub-networks in G are selected to solve the existing problems in the DNDP, making the research results suitable for transportation infrastructure planning in urban agglomerations.
Step 1: Collecting data on population distribution, disposable income, occupational distribution, and so on for each residential area in the megacity.
The data from OpenStreetMap are filtered through OSMN to remove the point data in the map that are not regarded as traffic starting or ending points, such as intersections, traffic lights, traffic signs, statues, etc. Data cleaning is performed on the remaining data, and the attribute information of point elements is unified: nodes represent the node information; building stands for the building information, floors, single-floor area, and structural information; source means the data origin; waterway represents the information about water surrounding the buildings; geometry represents the aggregate shape information; layer is the building layer; amenity is the public service information; brand stands for the brand identification of the building, store names, community names; name is the registered name of the building; type represents the building type; and income is the average income per capita in the area. The point element data are saved as a csv file. An 11 × n matrix is used to demonstrate the structure, where 11 is the number of retained features, and n is the number of point elements, as shown in (11).
P o F = n o d e 1 b u i l d i n g 1 s o u r c e 1 t y p e 1 i n c o m e 1 n o d e 2 b u i l d i n g 2 s o u r c e 2 t y p e 1 i n c o m e 2 n o d e n b u i l d i n g n s o u r c e n t y p e n i n c o m e n
The average travel speed, waiting time, short-distance comfort, medium-distance comfort, long-distance comfort, short-distance safety, medium-distance safety, long-distance safety, and cost per unit distance of various transportation infrastructures are used to construct a ToF matrix, as shown in (12).
P o F = k m s p e e d r o a d w a i t t i m e r o a d l o n g s a f t y r o a d k m p r i c e r o a d k m s p e e d h i h w a y w a i t t i m e h i g h w a y l o n g s a f t y h i g h w a y k m p r i c e h i g h w a y k m s p e e d h s r w a i t t i m e h s r l o n g s a f t y h s r k m p r i c e h s r
Feed PoF and ToF to LLM and perform data learning so that the data will be generated based on the actual characteristics of the area.
Step 2: Design an Agent-AI program to generate automation decision-making agents.
Call the API of Chatgpt-4o in the program, feed PoF and ToF into Chatgpt, and input instructions for the large model, whereby a set of data is generated based on the feeding data to validate the effectiveness. The generated data forms the set GD, which includes the starting point ID, ending point ID, set of path points, role occupation, safety preference, price preference, comfort preference, time preference, transfer mode, transportation mode, and transfer transportation mode as shown in (13).
P o F = s t a r t i d 1 e n d i d 1 p o i n t g r o u p 1 t r a n s p o r t a t i o n 1 t r a n s f e r 1 s t a r t i d 2 e n d i d 2 p o i n t g r o u p 2 t r a n s p o r t a t i o n 2 t r a n s f e r 2 s t a r t i d n e n d i d n p o i n t g r o u p n t r a n s p o r t a t i o n n t r a n s f e r n
Step 3: Generating each agent’s starting point, destination, and transportation preference using the Agent-AI program.
The API of ChatGPT in the AA-DNDP process is utilized to call the large model during the simulation, thus the transportation infrastructure network generates data on different starting points, ending points, careers, and preferences within urban agglomerations. A randomly selected data point in DNDP is replaced by the generated data point for the calculation process, thereby enhancing the reliability and rationality of the results.

4. Empirical Research

This study selects Chongqing’s transportation infrastructure as a case with which to empirically test the effectiveness of the AA-DNDP model proposed in the Section 2. Unlike traditional approaches that treat different types of transportation infrastructure as isolated systems, the AA-DNDP model—by integrating Agent-AI into the DNDP framework—supports coordinated planning across diverse infrastructure types in megacities. A novel scheme based on the AA-DNDP will be proposed, which is completely different from traditional transportation infrastructure planning. Given the difficulty of quantifying differences in construction and operational costs during the planning stage, this study focuses on evaluating the model’s effectiveness in optimizing priority phases of infrastructure development. The specific steps are listed as follows.
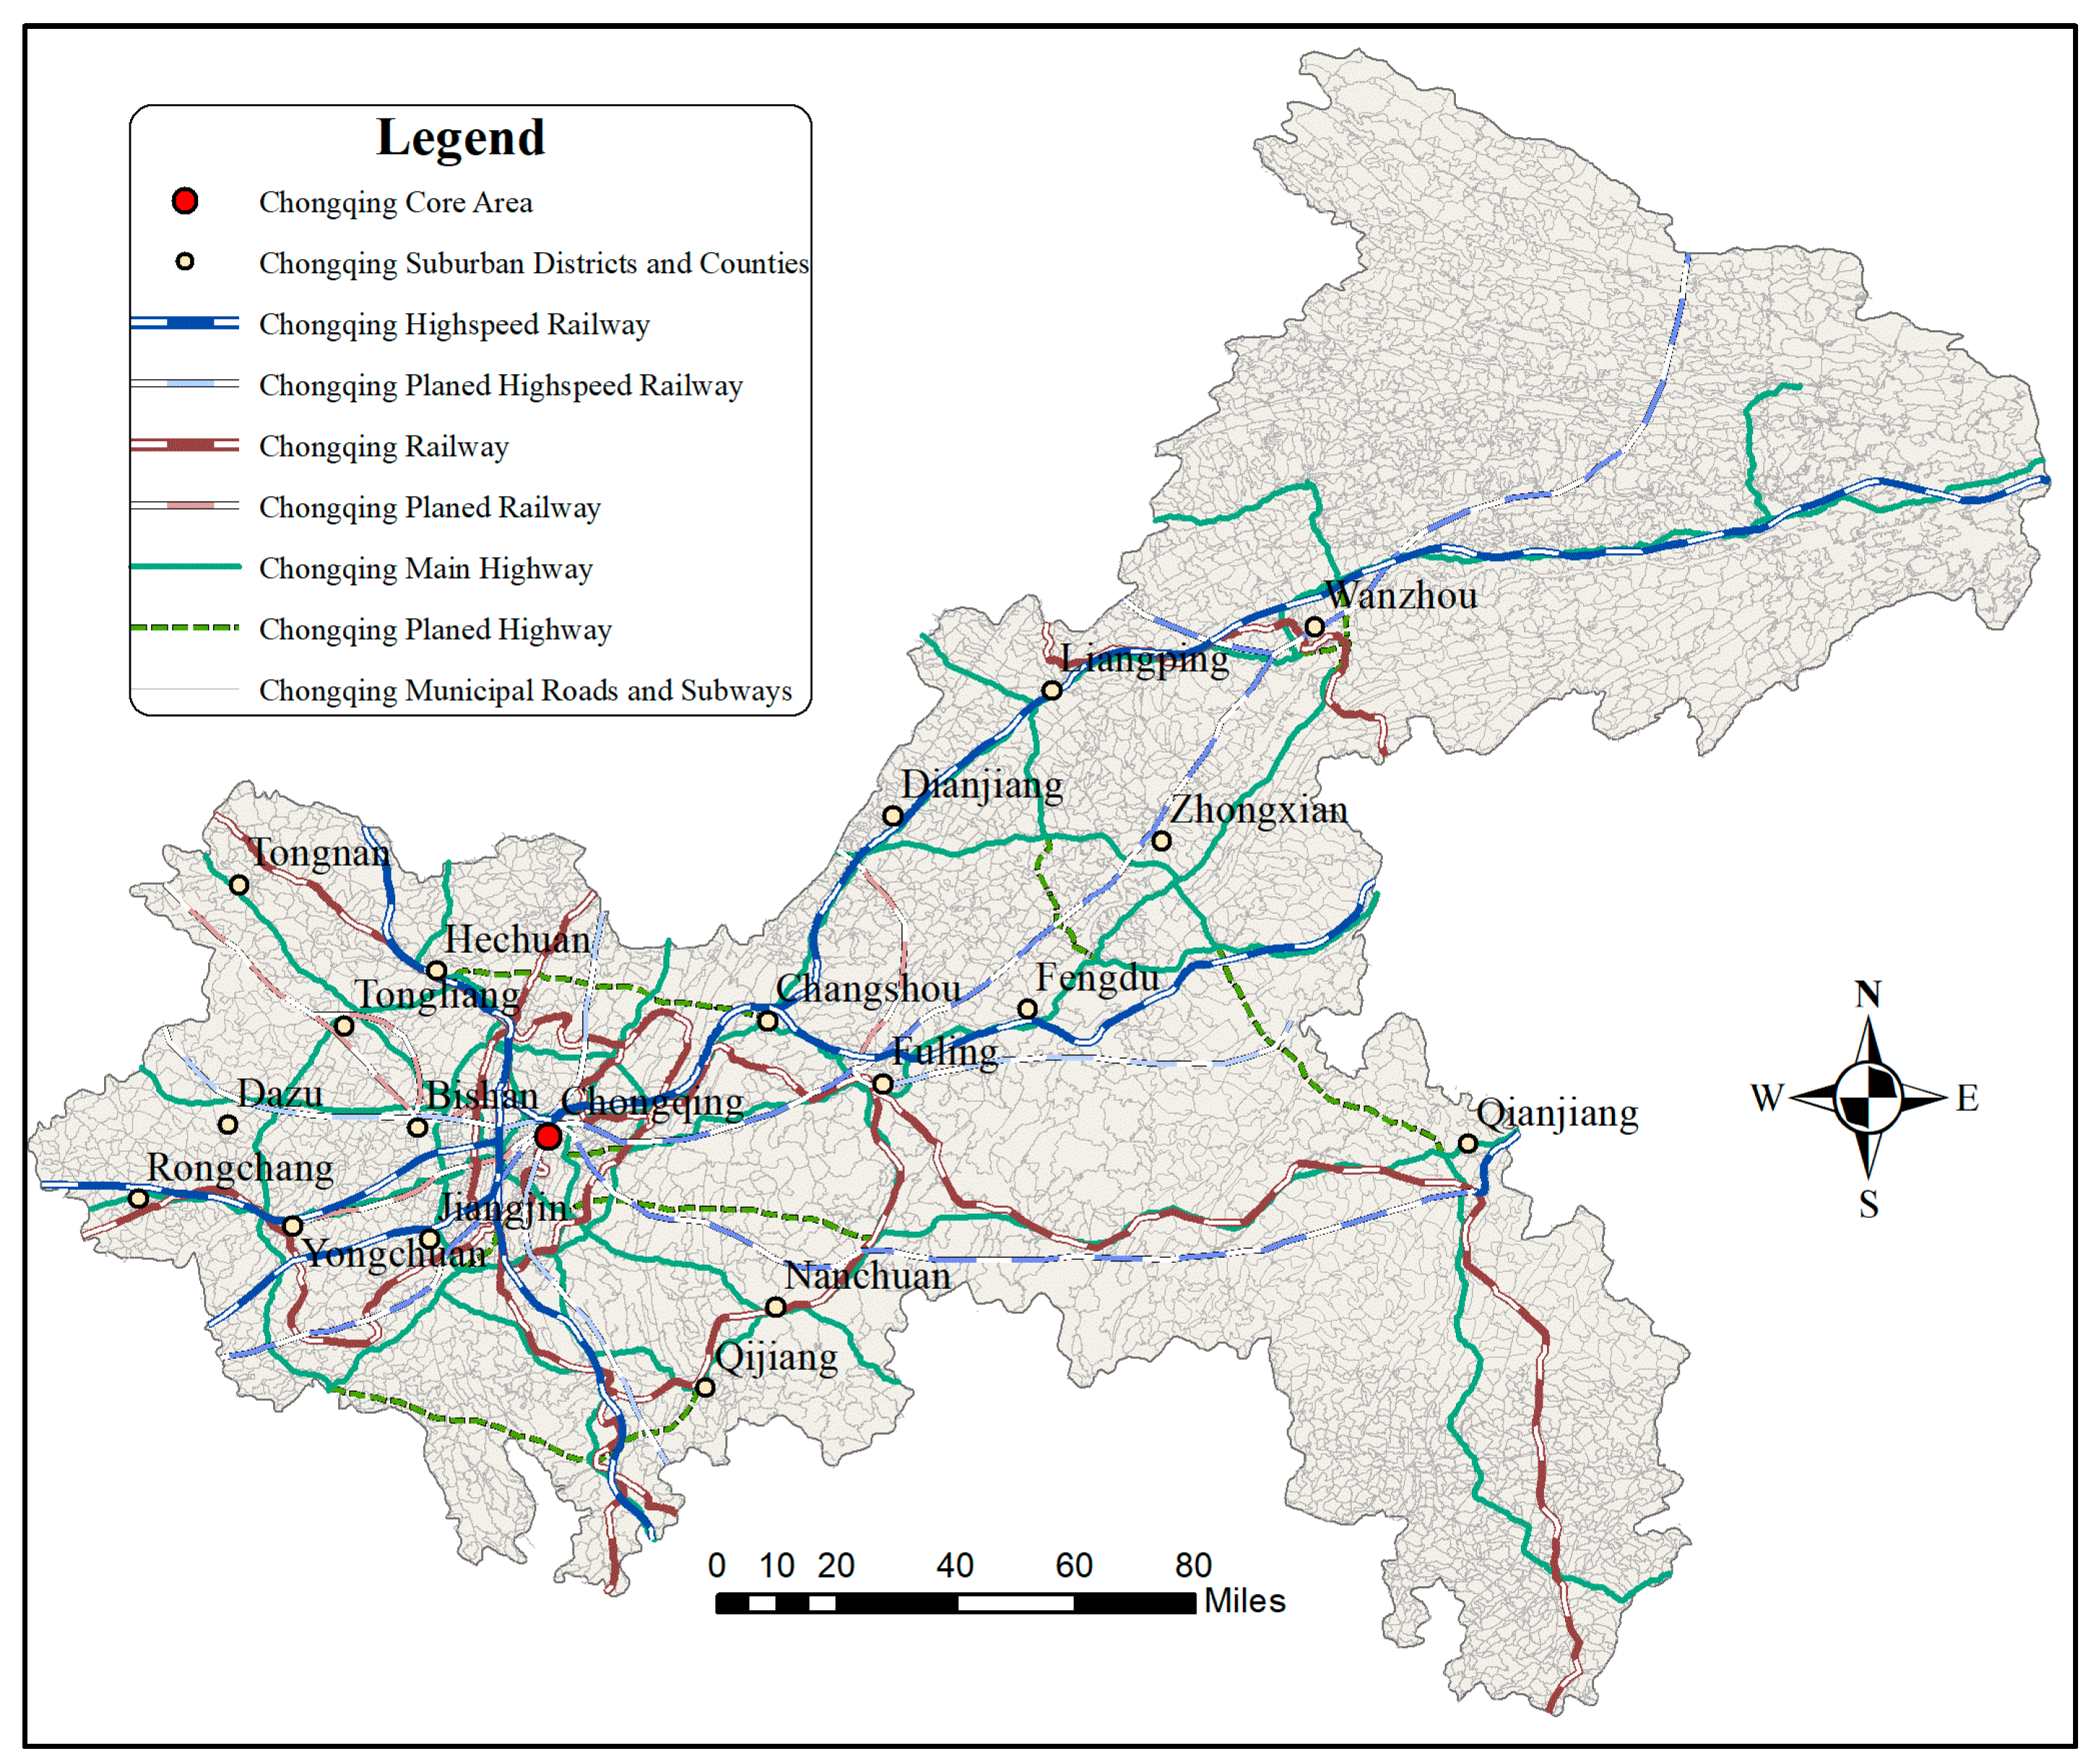
  • Present the current situation regarding transportation infrastructure in Chongqing, and draw a map of the current situation regarding transportation infrastructure.
  • Combined with the relevant planning contents of the Chongqing Municipality, the construction sequence of transportation infrastructure under traditional planning is obtained, including the planned transportation infrastructure and construction priorities, laying the foundation for subsequent research.
  • According to the results obtained in the third step, different construction priorities are proposed for the planned transportation infrastructure in the traditional transportation infrastructure planning using the AA-DNDP method.
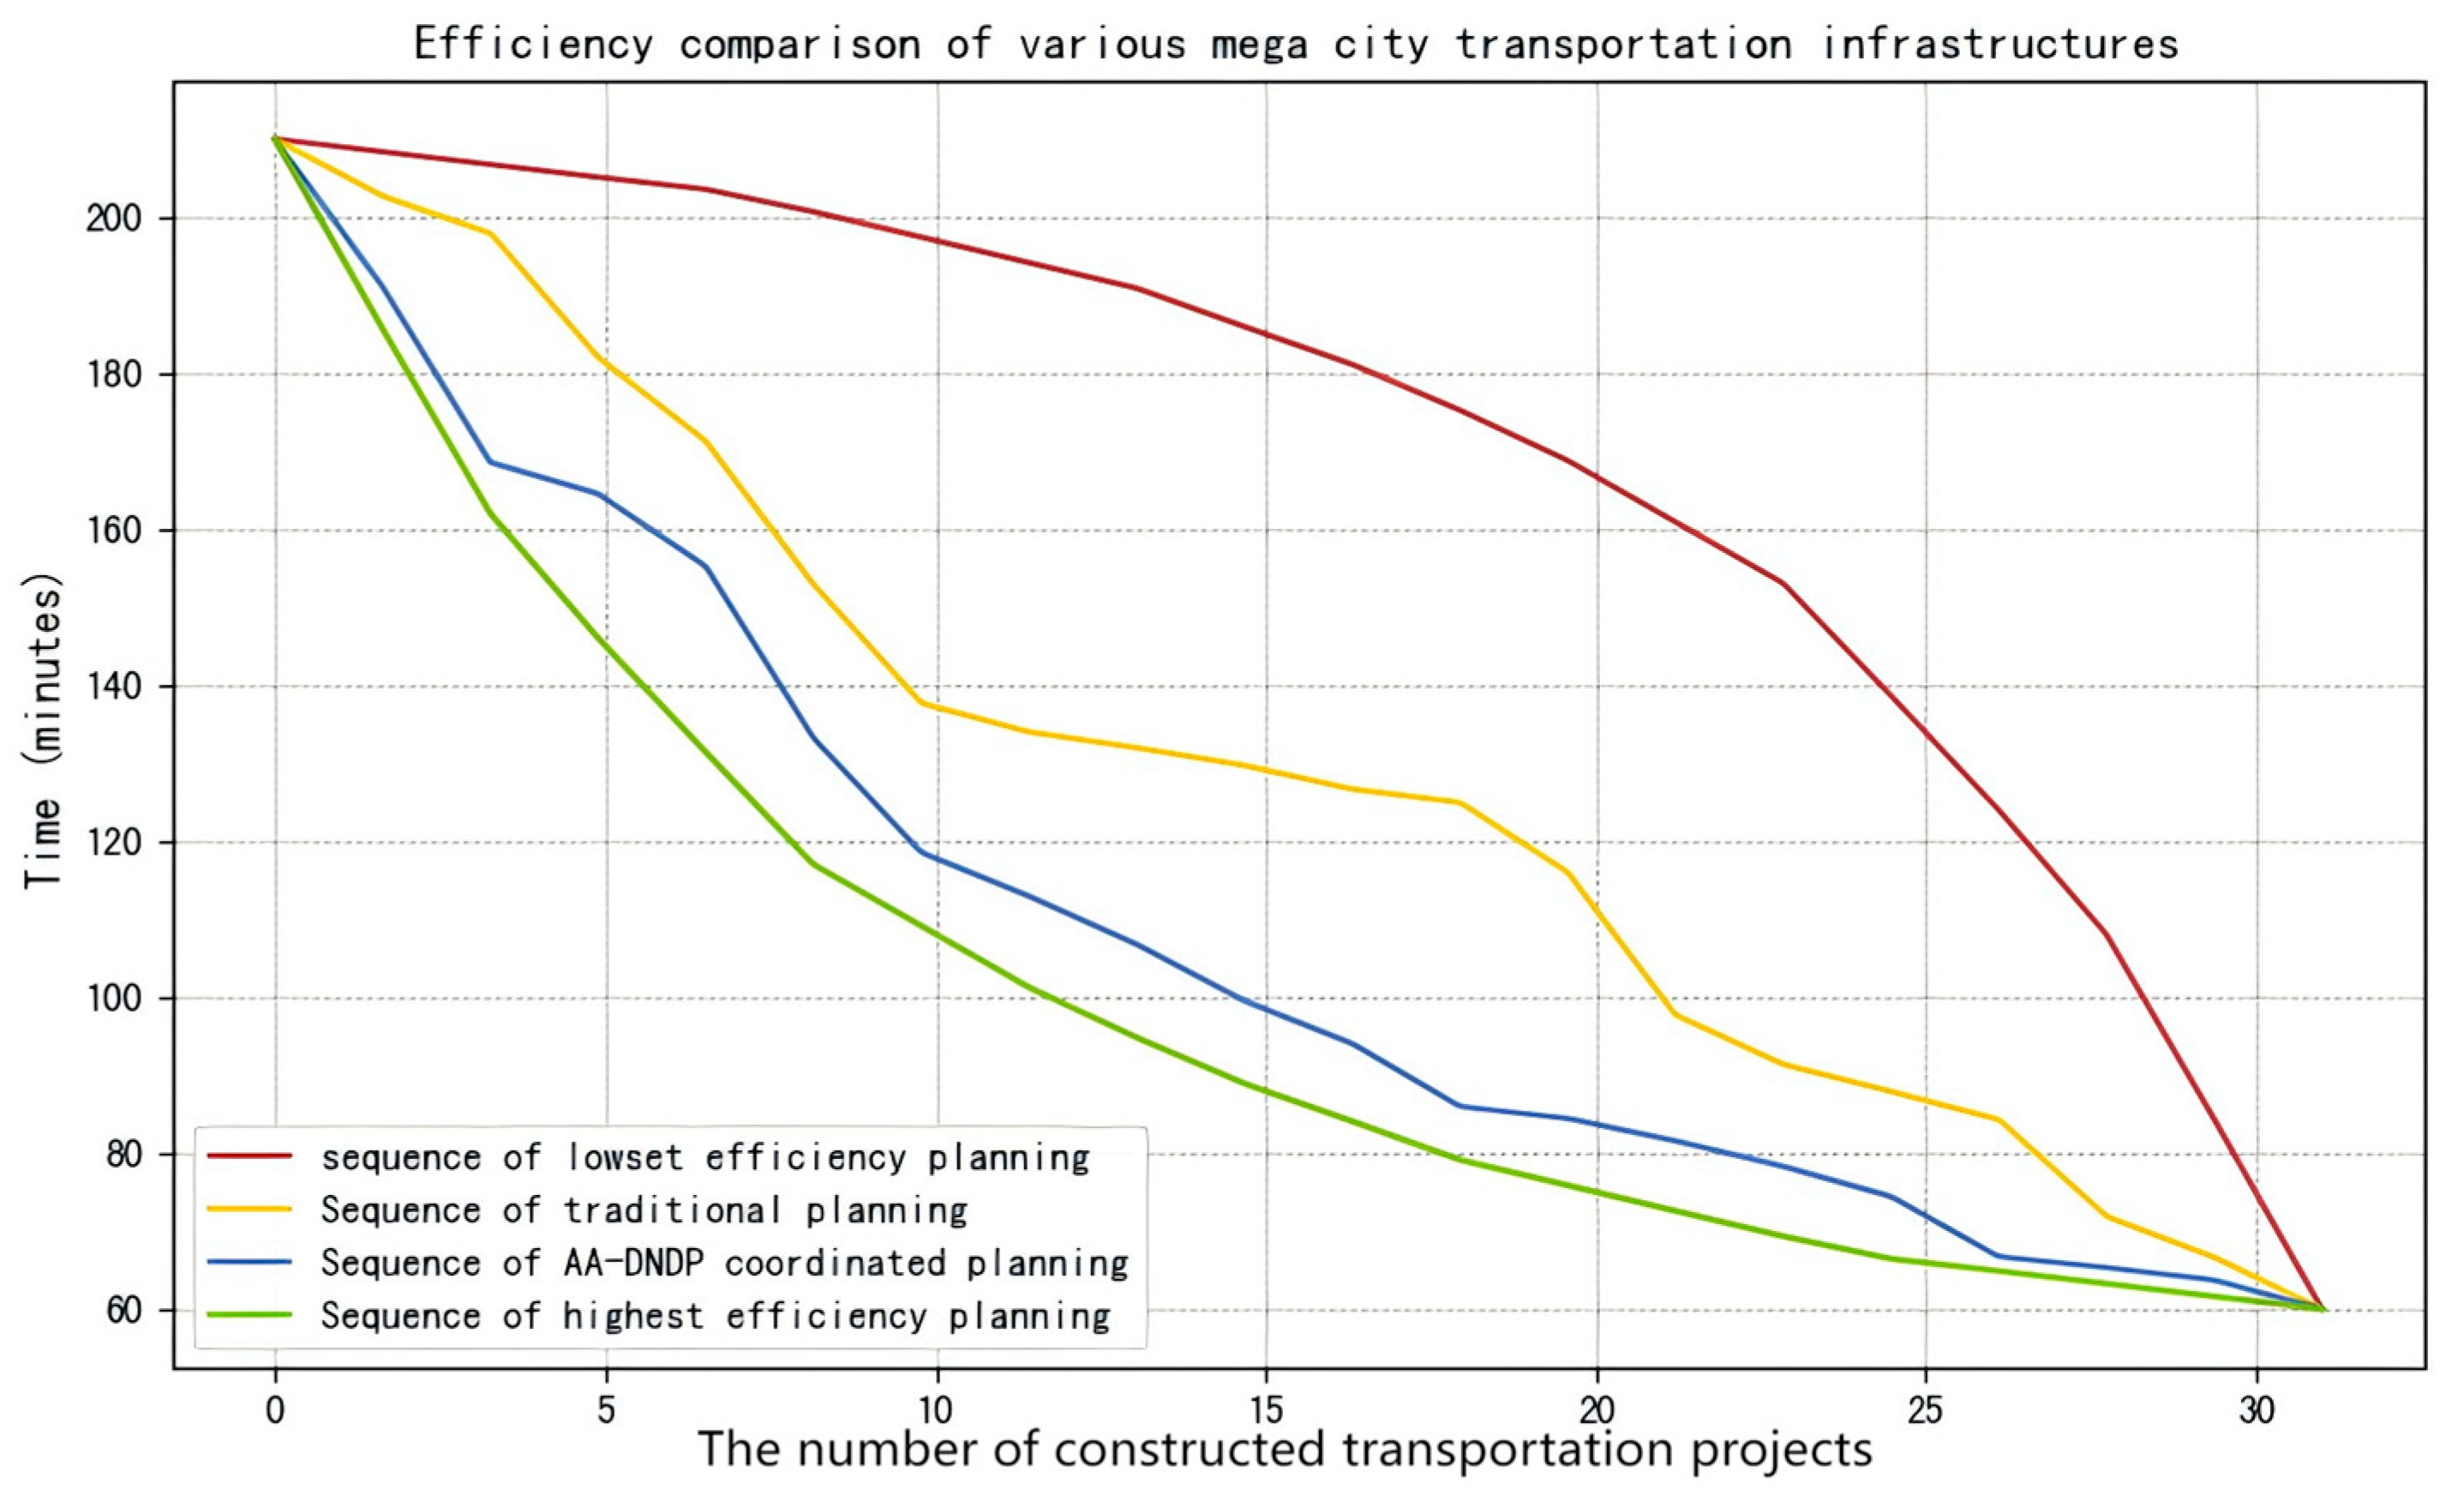
  • Compare the influence of the efficiency of the transportation infrastructure network of the two implementation sequences on the efficiency of transportation infrastructure in Chongqing, and obtain the optimal construction sequence of the efficiency of transportation infrastructure in Chongqing.
It is important to emphasize that the coordinated planning method through the AA-DNDP for transportation infrastructure in megacities proposed in this paper is not only intended to determine the construction priority. However, to demonstrate the effectiveness of the AA-DNDP under the same variables in megacities, the transportation infrastructure to be constructed is determined as the research object based on traditional planning. This approach ensures that Chongqing’s transportation infrastructure planning proposed by the traditional planning method, or proposed by the coordinate planning method through the AA-DNDP, remains consistent in terms of construction investment, construction duration, and subsequent operation and maintenance costs. Therefore, the transportation infrastructure planning proposed by the traditional planning method in Chongqing, or proposed by the coordinate planning method in megacities based on the AA-DNDP, can be consistent in construction investment, construction period, and later operation and maintenance costs, determining more effective construction priorities for the established transportation infrastructure planning scheme through the AA-DNDP. Furthermore, the AA-DNDP can propose entirely different planning schemes compared to the traditional method. However, in this paper, to meet the requirements of control variables, a method of determining the implementation priority of transportation infrastructure will only be verified.

4.1. Basic Condition of Transportation Infrastructure in Chongqing

Chongqing, situated in southwestern China, holds the unique status of being one of the country’s four direct-controlled municipalities and serves as a pivotal inland economic hub. Renowned for its mountainous terrain and urban density, the city spans approximately 82,400 square kilometers, making it the largest municipality by area globally, and hosts a population exceeding 32 million, ranking 11th worldwide in population size. This combination of vast geographic coverage and substantial demographic scale solidifies Chongqing’s position as a quintessential megacity. The city boasts a robust transportation infrastructure, anchored by an extensive network of highways and railways that integrate it into national and regional connectivity frameworks. A detailed overview of Chongqing’s transportation infrastructure configuration is presented in Figure 2.

4.2. Chongqing’s Transportation Infrastructure Planning Based on the Traditional Planning Method

Based on the 14th Five-Year Plan for Railway Construction in Chongqing (2021–2025) and the Medium–Long-Term Plan (2021–2035), the Chongqing Expressway Network Plan (2023–2035), the Chongqing Main Urban Area Rail Transit Network Plan (2019–2035), and the Outline of Chongqing’s Comprehensive Three-Dimensional Transportation Network Plan (2021–2035), different planning types used for transportation infrastructure will be summarized. The primary transportation infrastructures to be constructed in Chongqing are listed in Table 1.
According to the different transportation infrastructure development plans for Chongqing released by various departments, by 2035, Chongqing will have built nine high-speed railways, five ordinary railways, 11 expressways and municipal roads, and six urban rail transit lines. According to the completion time provided by each transportation implementation plan in each plan, The sequence of transportation infrastructure construction in Table 1 is as follows: 26, 5, 25, 17, 27, 20, 6, 31, 28, 21, 10, 22, 23, 24, 11, 12, 13, 14, 4, 9, 1, 2, 3, 15, 16, 7, 8, 31, 18, 19, 30. Therefore, the sequence of transportation infrastructure construction under traditional planning has been obtained. On this basis, the AA-DNDP model will be introduced into the model item by item in accordance with the obtained traditional planning and construction sequence for the calculation and statistics of AUT and puf as the criteria for evaluating the efficiency of the transportation infrastructure network in Chongqing, and the implementation priority will be adjusted.

4.3. Chongqing’s Transportation Infrastructure Planning Based on the Coordinate Planning Method

AA-DNDP inherits the comminated enumeration path of the DNDP, and can select the optimal solution for the complex network, exhibiting the function that is not listed in Table 1. However, to control variables and reflect the advantage of coordinate planning in transportation infrastructure over traditional isolated planning in megacities, the comparison of planning differences must be carried out under the same constraints of investment, construction period, and environmental impact. Therefore, this study still selects the transportation infrastructure in Table 1 as the planning object of the coordinate planning method. The implementation priority of transportation infrastructure in Table 1 will be optimized through the coordinate planning method. For the same transportation infrastructure, the advantage of the coordinate planning method in the design phase of transportation planning is demonstrated compared to the traditional planning method.

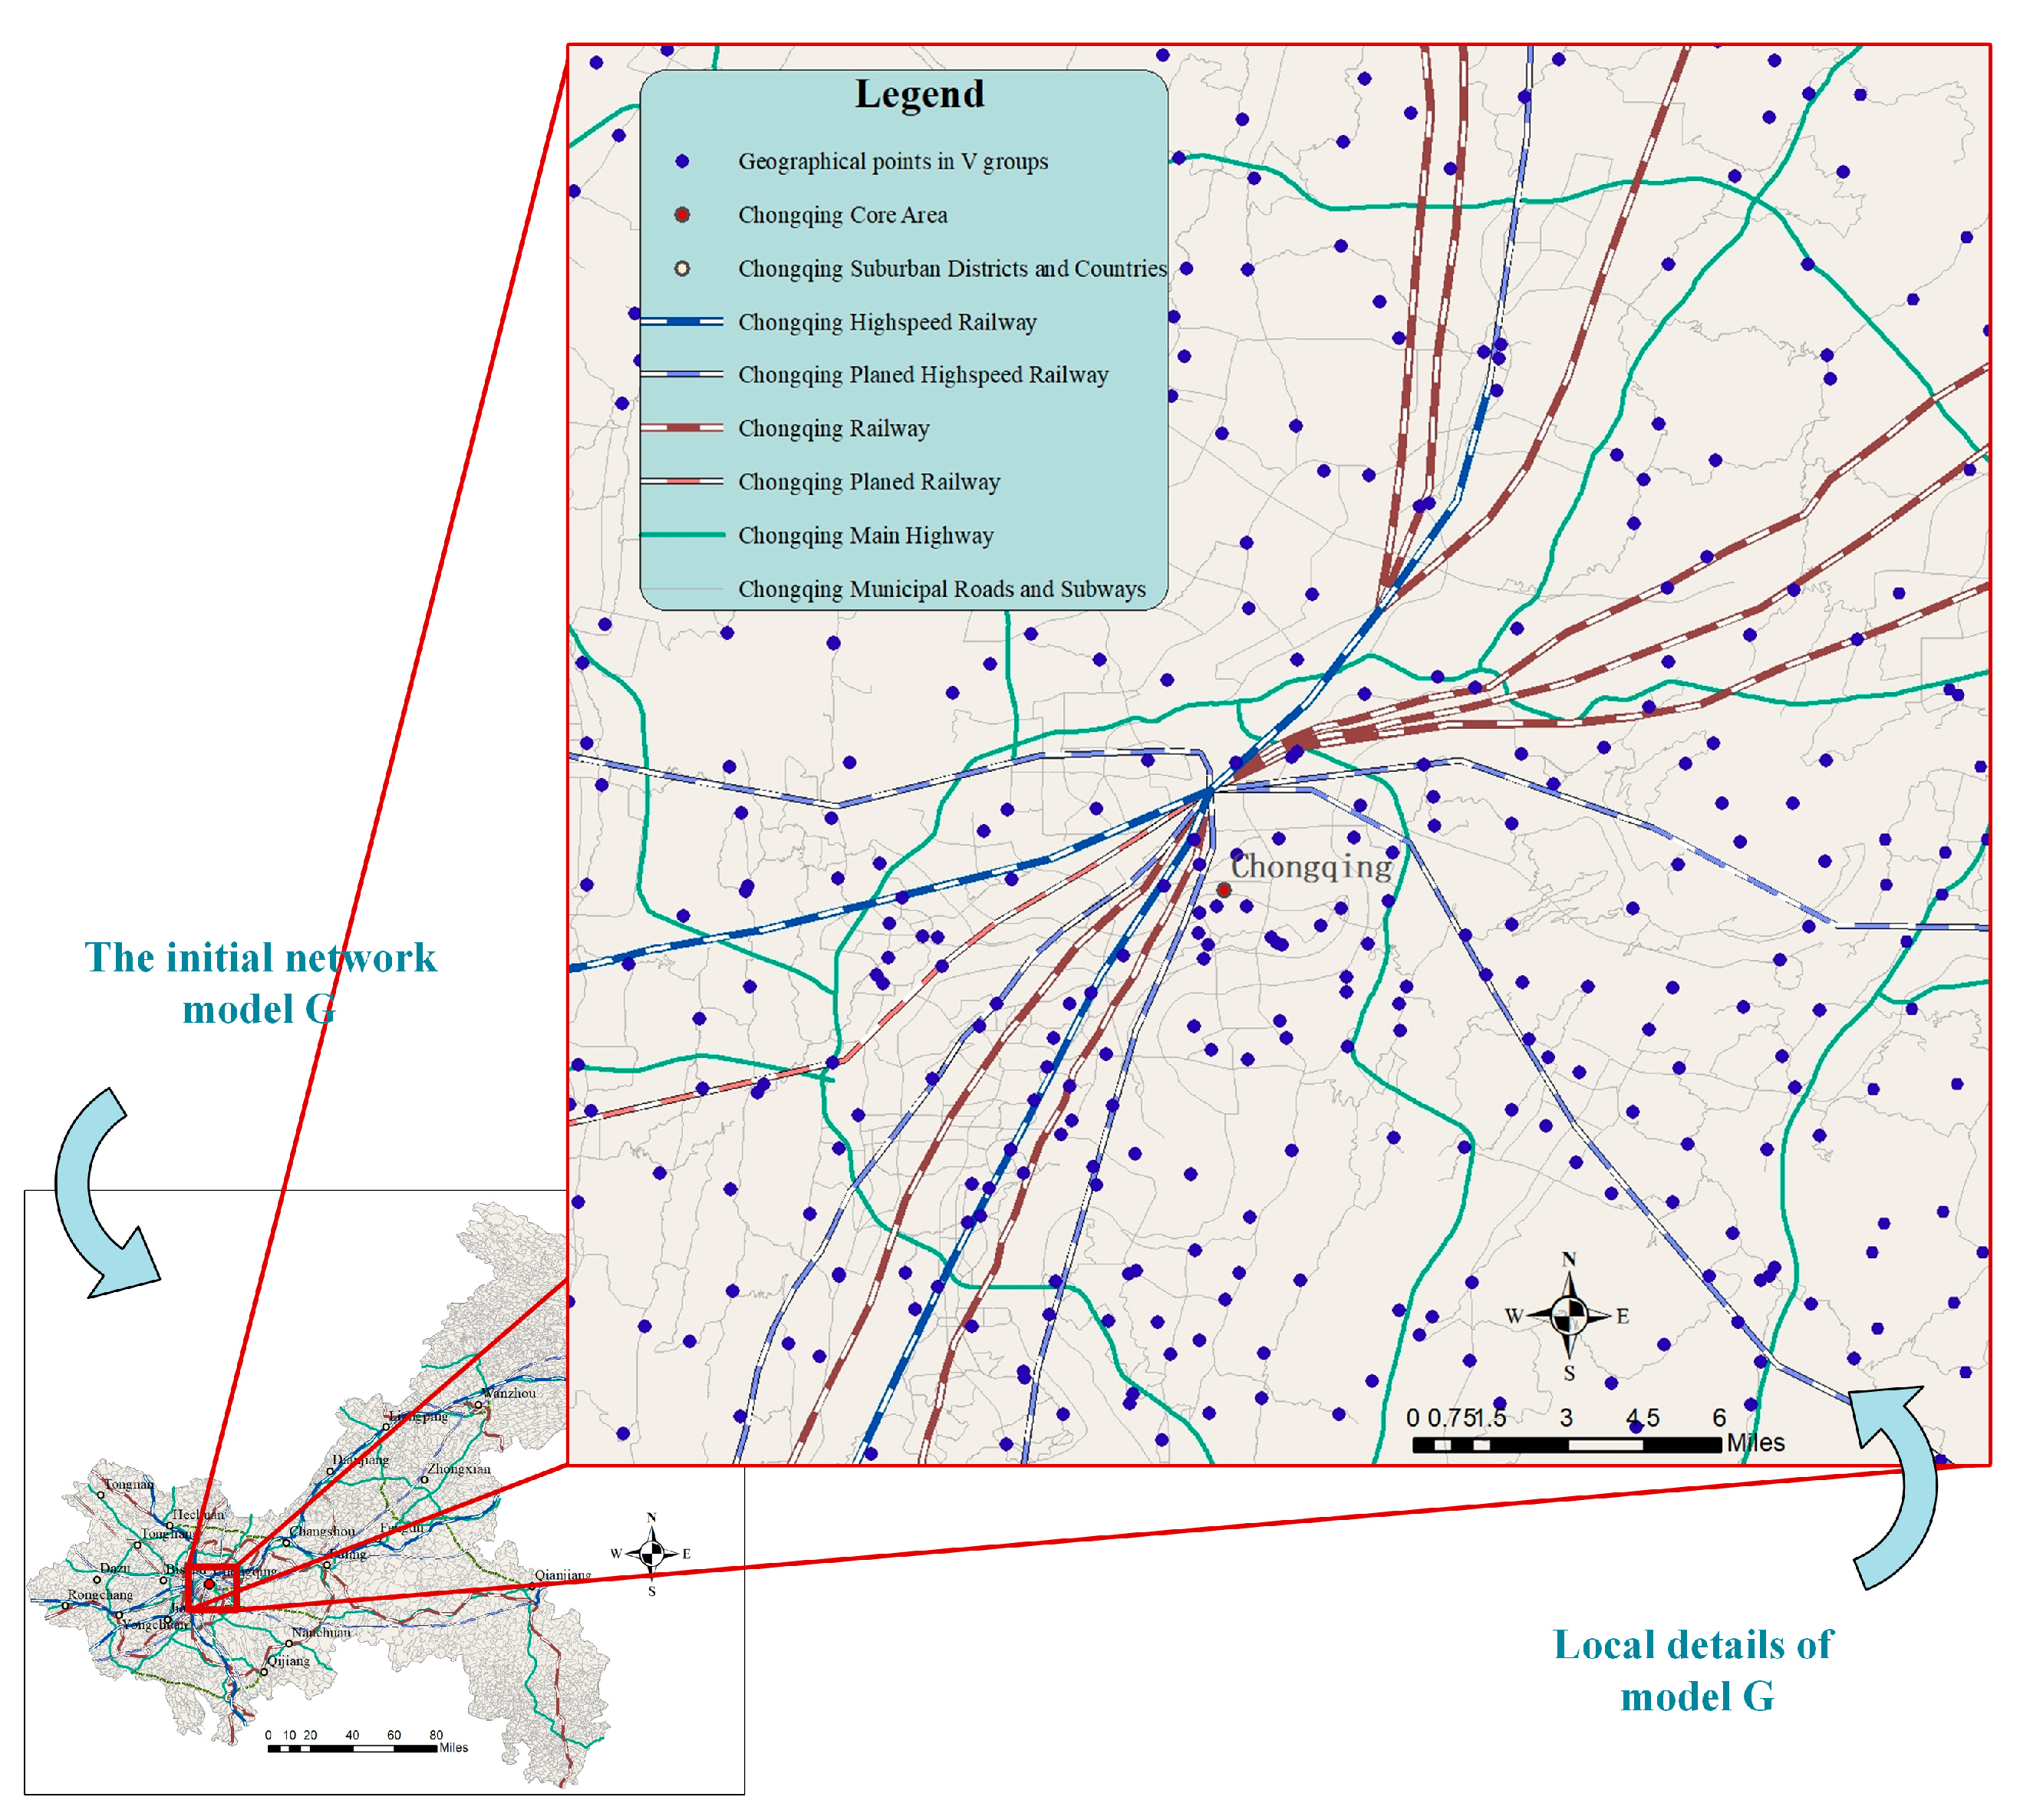
4.3.1. Construction of the Network Model

The basic data required for assessment are extracted from OpenStreetMap through the OSMN library. A set of highway connection points Vhighway with 30,794 point elements, a set of expressway connection points Vexpressway with 718 elements, a set of subway connection points Vsubway with 294 elements, a set of railway connection points Vrailway with 158 elements, and a set of high-speed railway connection points Vhigh-speed railway with 23 elements are constructed as a selection pool for the starting and ending points during the analysis process. The attribute list of each point element is downloaded to form the PoF matrix during the extraction process.
A set of expressway line elements Eexpressway with 3448 elements, a set of regular-speed highway line elements Eregular-speed highway with 106,845 elements, a set of high-speed railway line elements Ehigh-spped railway with 25 elements, a set of regular-speed railway line elements Eregular-speed railway with 34 elements, and a set of subway line elements Esubway with 398 elements are constructed. The initial network model G composed of set V and set E is shown in Figure 3.
According to the construction planning and implementation scheme for the transportation infrastructure of Chongqing in Section 4.2, a TIG matrix consisting of two rows and 31 columns is constructed. Each row of TIG represents a TI set, indicating the implementation sequence of 31 transportation infrastructure construction projects.
Based on Meixell’s paper, the ToF matrix is organized according to Table 2 [50].

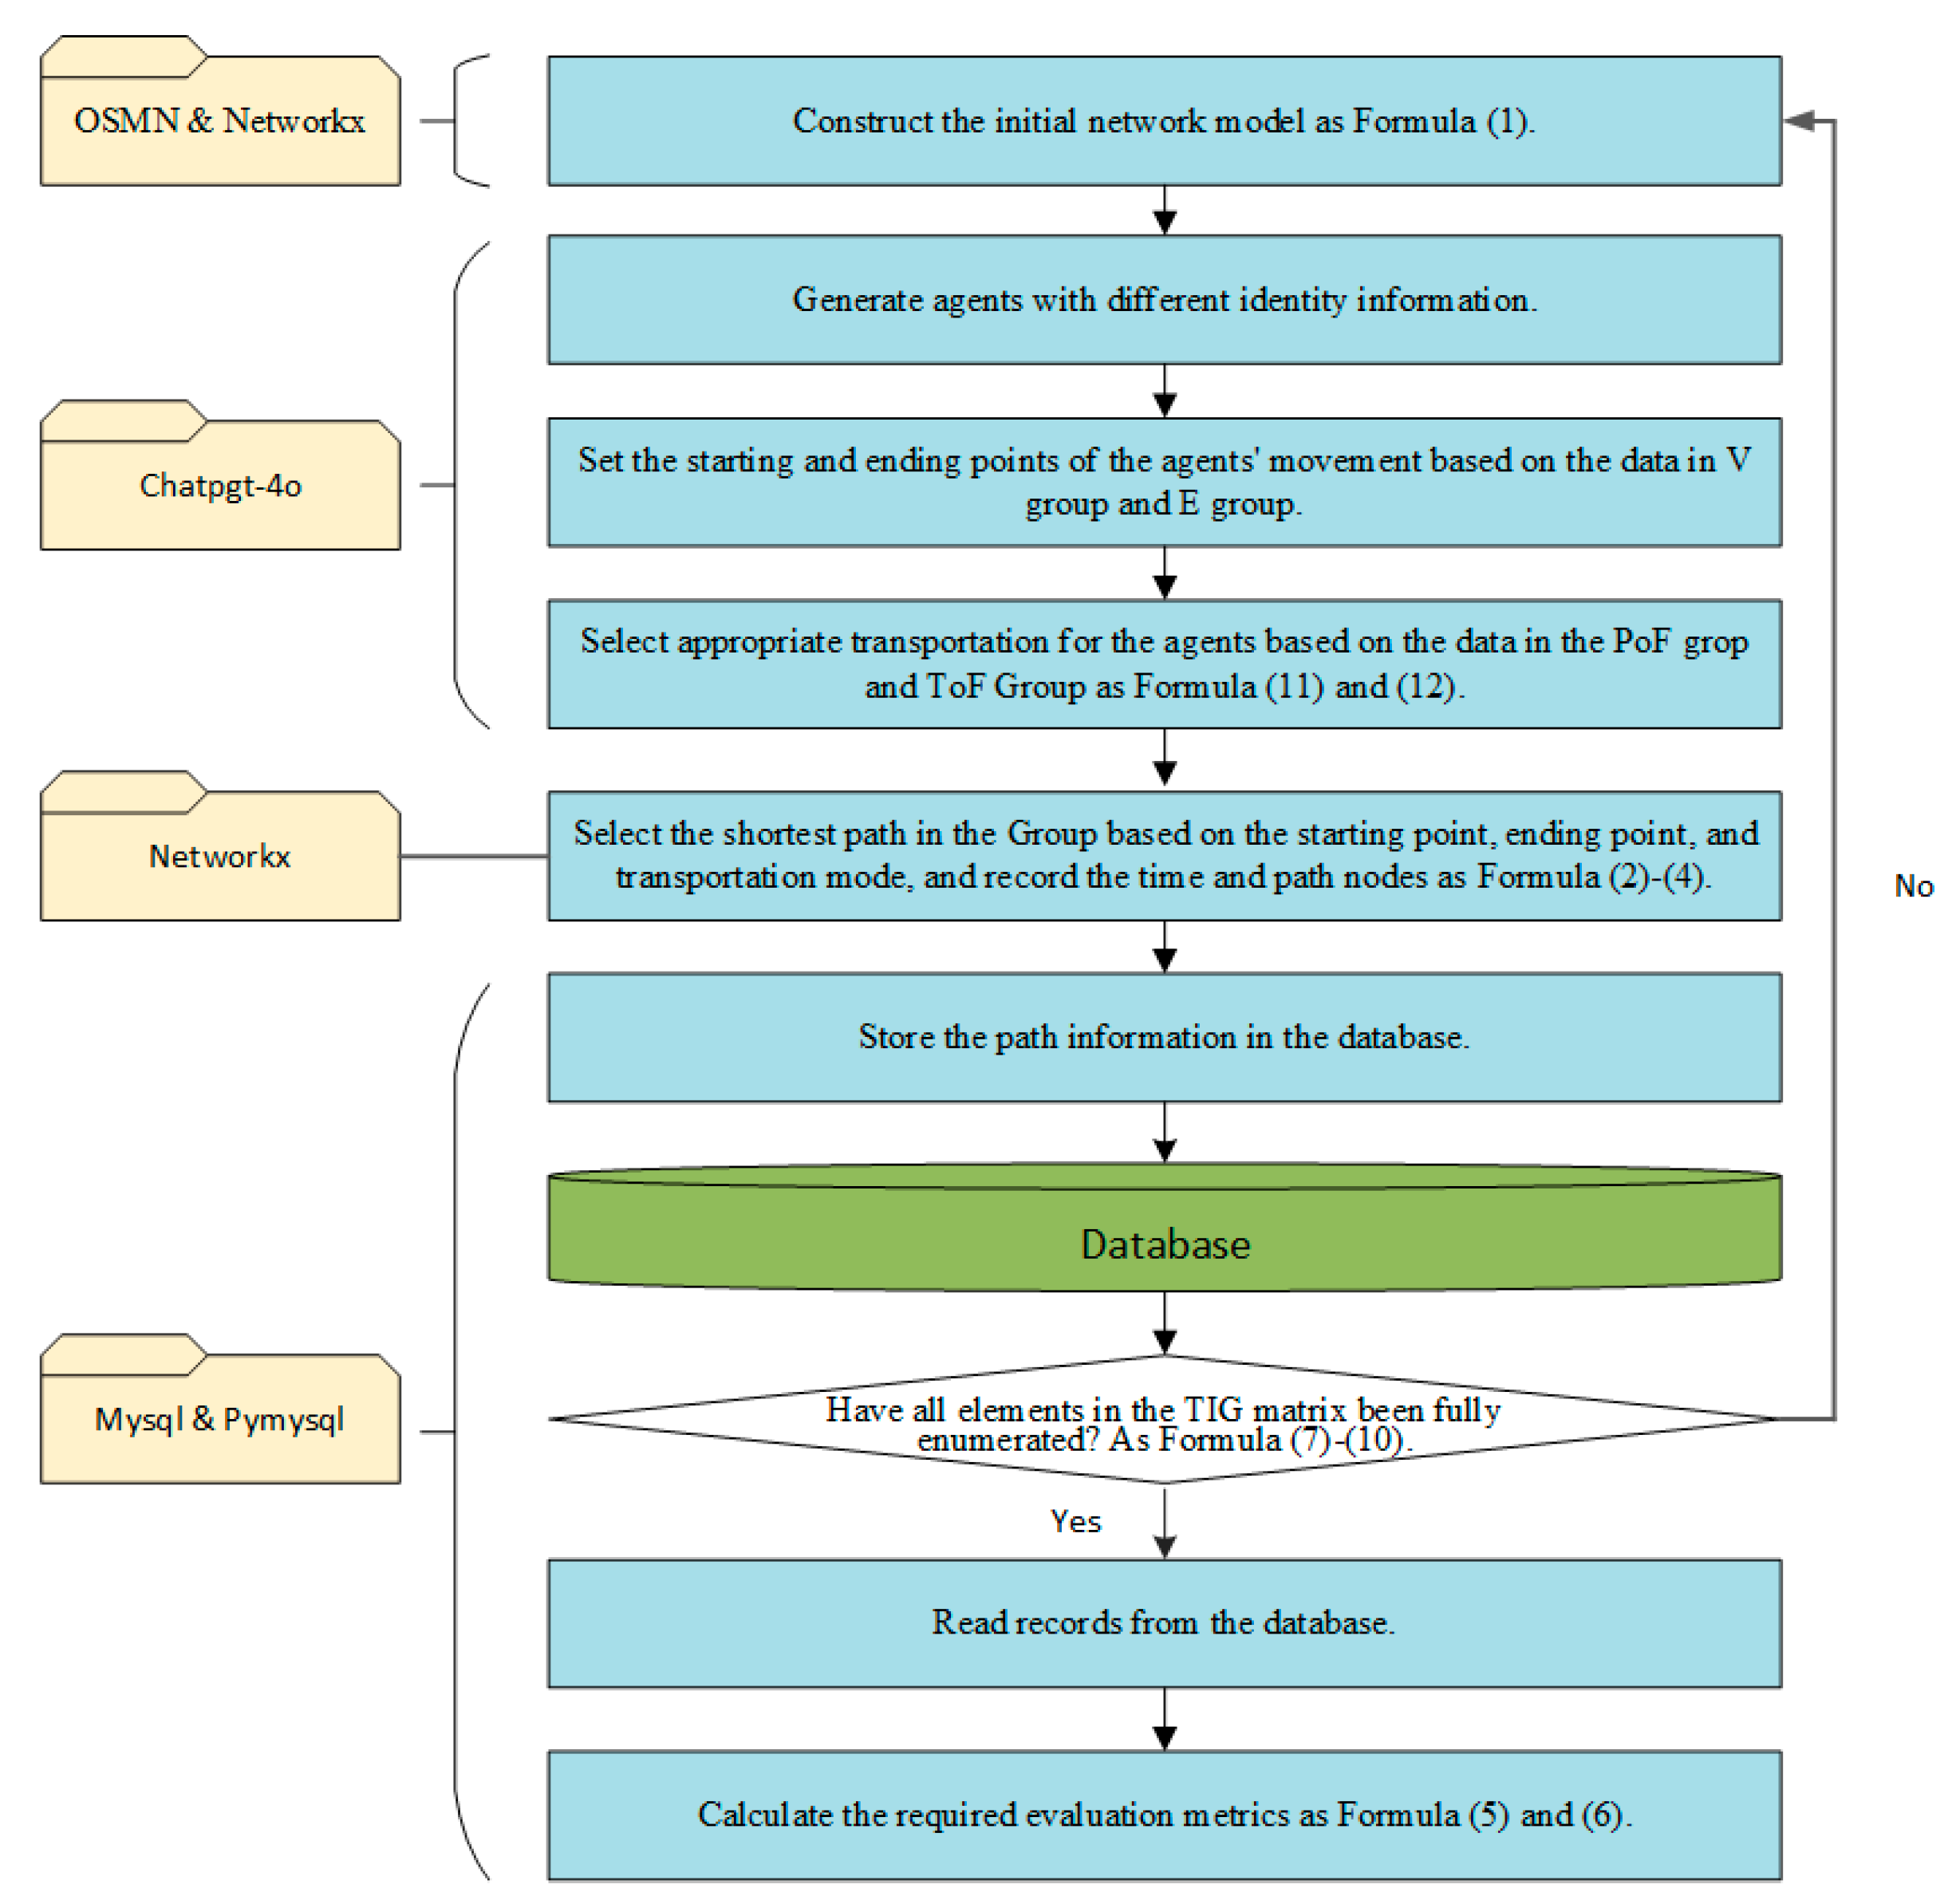
4.3.2. Compilation of the Computation Program

The program is written in Python 3.11 and Mysql 8.0, and the libraries include OSMN, Network X, Chap-gpt4o API, and Mysql. The program implements the computational process introduced in Section 3 of this paper. Firstly, the basic transportation network model is constructed using Formula (1), and the travel agents with different identity attributes are generated using Chat-GPT. Secondly, the starting and ending points of the agent are set with the help of Chat-GPT based on the data for Group V and Group E. And based on the data of the PoF group and the ToF group, combined with Formulas (11) and (12), the means of transportation is selected for the agent. Then, the shortest path is calculated through Formulas (2)–(4), the travel time and the information about the path nodes are recorded, and the results are stored in the database. Finally, whether the TIG matrix has been completely enumerated is checked (Formulas (7)–(10)). If completed, the path record is read from the database. The key evaluation indicators, such as network efficiency and time stability, are calculated by using Formulas (5) and (6). The detailed design concept is shown in Figure 4.
The greater the number of simulations, the higher the confidence of the results. Meanwhile, the greater the number of simulations, the longer the time to obtain the results of the operation. Determining a number of simulations that can reflect the reality and minimize the computation time will improve the efficiency of the study.
In this study, 15 candidate values ranging from 1 × 10⁷–9 × 10⁹ were selected to represent the number of simulation rounds. Utilizing the transportation infrastructure network model of Chongqing, the big data simulation program generated 40 sets of average travel time data for each candidate value. For these datasets, the 99.5% confidence intervals (CIs) were calculated, along with the range (difference between upper and lower limits) of each CI. The results are summarized in Table 3. When the number of simulations exceeded 7 × 10⁸, the 99.5% CI narrowed to less than 1, indicating a 99.5% probability that the true average travel time falls within the range of 159.9–169.9 min under these conditions.
In transportation, an error of less than 1 min is acceptable. The new routes will be added to the existing network model for subsequent optimization to improve the model complexity, and 1 × 10⁹ is selected as the number of simulations to ensure sufficient computational redundancy in this study.

4.3.3. The Results of Coordinate Planning

After putting each path in Table 1 into the calculation model, the average travel time AUT and puf of users in the transportation infrastructure network is calculated as the basis for evaluating the importance of a single path project. The calculation results are shown in Table 4.
A single transportation infrastructure construction project is separated in the network model to calculate the AUT and puf, which can provide a preliminary understanding of the construction value of the transportation infrastructure and provide reference for determining the sequence for priority of construction. Based on the impact of each path on the efficiency of the network, the implementation priority can be determined as 10, 2, 4, 19, 8, 12, 7, 9, 5, 6, 22, 25, 28, 21, 20, 14, 3, 27, 29, 30, 1, 23, 24, 26, 31, 11, 15, 16, 17, 18, 13.

4.4. Comparative Analysis of Isolated Planning and Coordinate Planning for Transportation Infrastructure in Megacities

Based on the research results in Section 4.2, the implementation sequence of Chongqing’s transportation infrastructure is as follows: 26, 5, 25, 17, 27, 20, 6, 31, 28, 21, 10, 22, 23, 24, 11, 12, 13, 14, 4, 9, 1, 2, 3, 15, 16, 7, 8, 31, 18, 19, 30. According to this sequence, the corresponding lines of ID are input into the network model to execute a set of simulation calculations (1 × 10⁹ times), recording all simulated data. In total, 31 lines are input into the model one by one to execute 31 sets of simulation calculations, obtaining 32 × 109 simulated data points. The time distribution of these simulated data is shown in Figure 5. With the continuous input of lines, the average, median, and lower quartile recorded from each set of 1 × 10⁹ simulation times continue to decrease, while the maximum, minimum, and upper quartile remain basically unchanged.
Similarly, the optimized implementation sequence of Chongqing’s transportation infrastructure planning based on the AA-DNDP method is as follows: 26, 5, 25, 17, 27, 20, 6, 31, 28, 21, 10, 22, 23, 24, 11, 12, 13, 14, 4, 9, 1, 2, 3, 15, 16, 7, 8, 31, 18, 19, 30. The corresponding transportation infrastructure routes are sequentially input into the network structure to execute simulation calculations. The data distribution is presented in Figure 6.
The AA-DNDP method can adjust the implementation sequence of megacity transportation infrastructure planning, and can also obtain the theoretical variation range of network efficiency for different implementation sequences by calculating the TIG matrix. The upper limit of the efficiency changes in implementing the transportation infrastructure planning for Chongqing through the enumeration algorithm is shown in Figure 7. The corresponding optimal sequence is as follows: 2, 4, 9, 3, 10, 5, 6, 7, 11, 12, 21, 8, 28, 31, 13, 20, 22, 25, 1, 14, 19, 23, 24, 26, 15, 16, 17, 18, 27, 29, 30.
Meanwhile, the lower limit of network efficiency changes can be obtained in the TIG matrix as shown in Figure 8, and the worst corresponding sequence is 15, 16, 17, 18, 27, 29, 30, 1, 14, 19, 23, 24, 26,13, 20, 22, 25, 8, 28, 31, 11, 12, 21, 5, 6, 7, 3, 10, 2, 4, 9.
To visually illustrate the impact of different implementation sequences on the network efficiency variation in transportation infrastructure, the median changes in four different sequences are plotted in Figure 9. In Figure 9, the median variations in four different sequences are plotted to demonstrate the changes in the efficiency of the transportation infrastructure among the four implementation schemes.

5. Discussion

5.1. Coordinated Planning Enhances the Operational Efficiency of Megacity Transport Systems

Figure 9 demonstrates that applying the AA-DNDP model to Chongqing’s transport network significantly improves planning efficiency by optimizing the interplay among diverse infrastructure types, even within the constraints of existing planning schemes. The reason for this phenomenon is that by constructing the same amount of transportation infrastructure, different implementation sequences will affect the improvement of network efficiency. Newly established facilities not only boost service capacity but also increase interconnectivity, which is particularly critical for multimodal passenger transfers. By leveraging existing infrastructure during both design and execution, coordinated planning ensures higher alignment with real-world constraints. In addition, the service capabilities of transportation infrastructure in megacities can be effectively enhanced through the coordinate planning method.

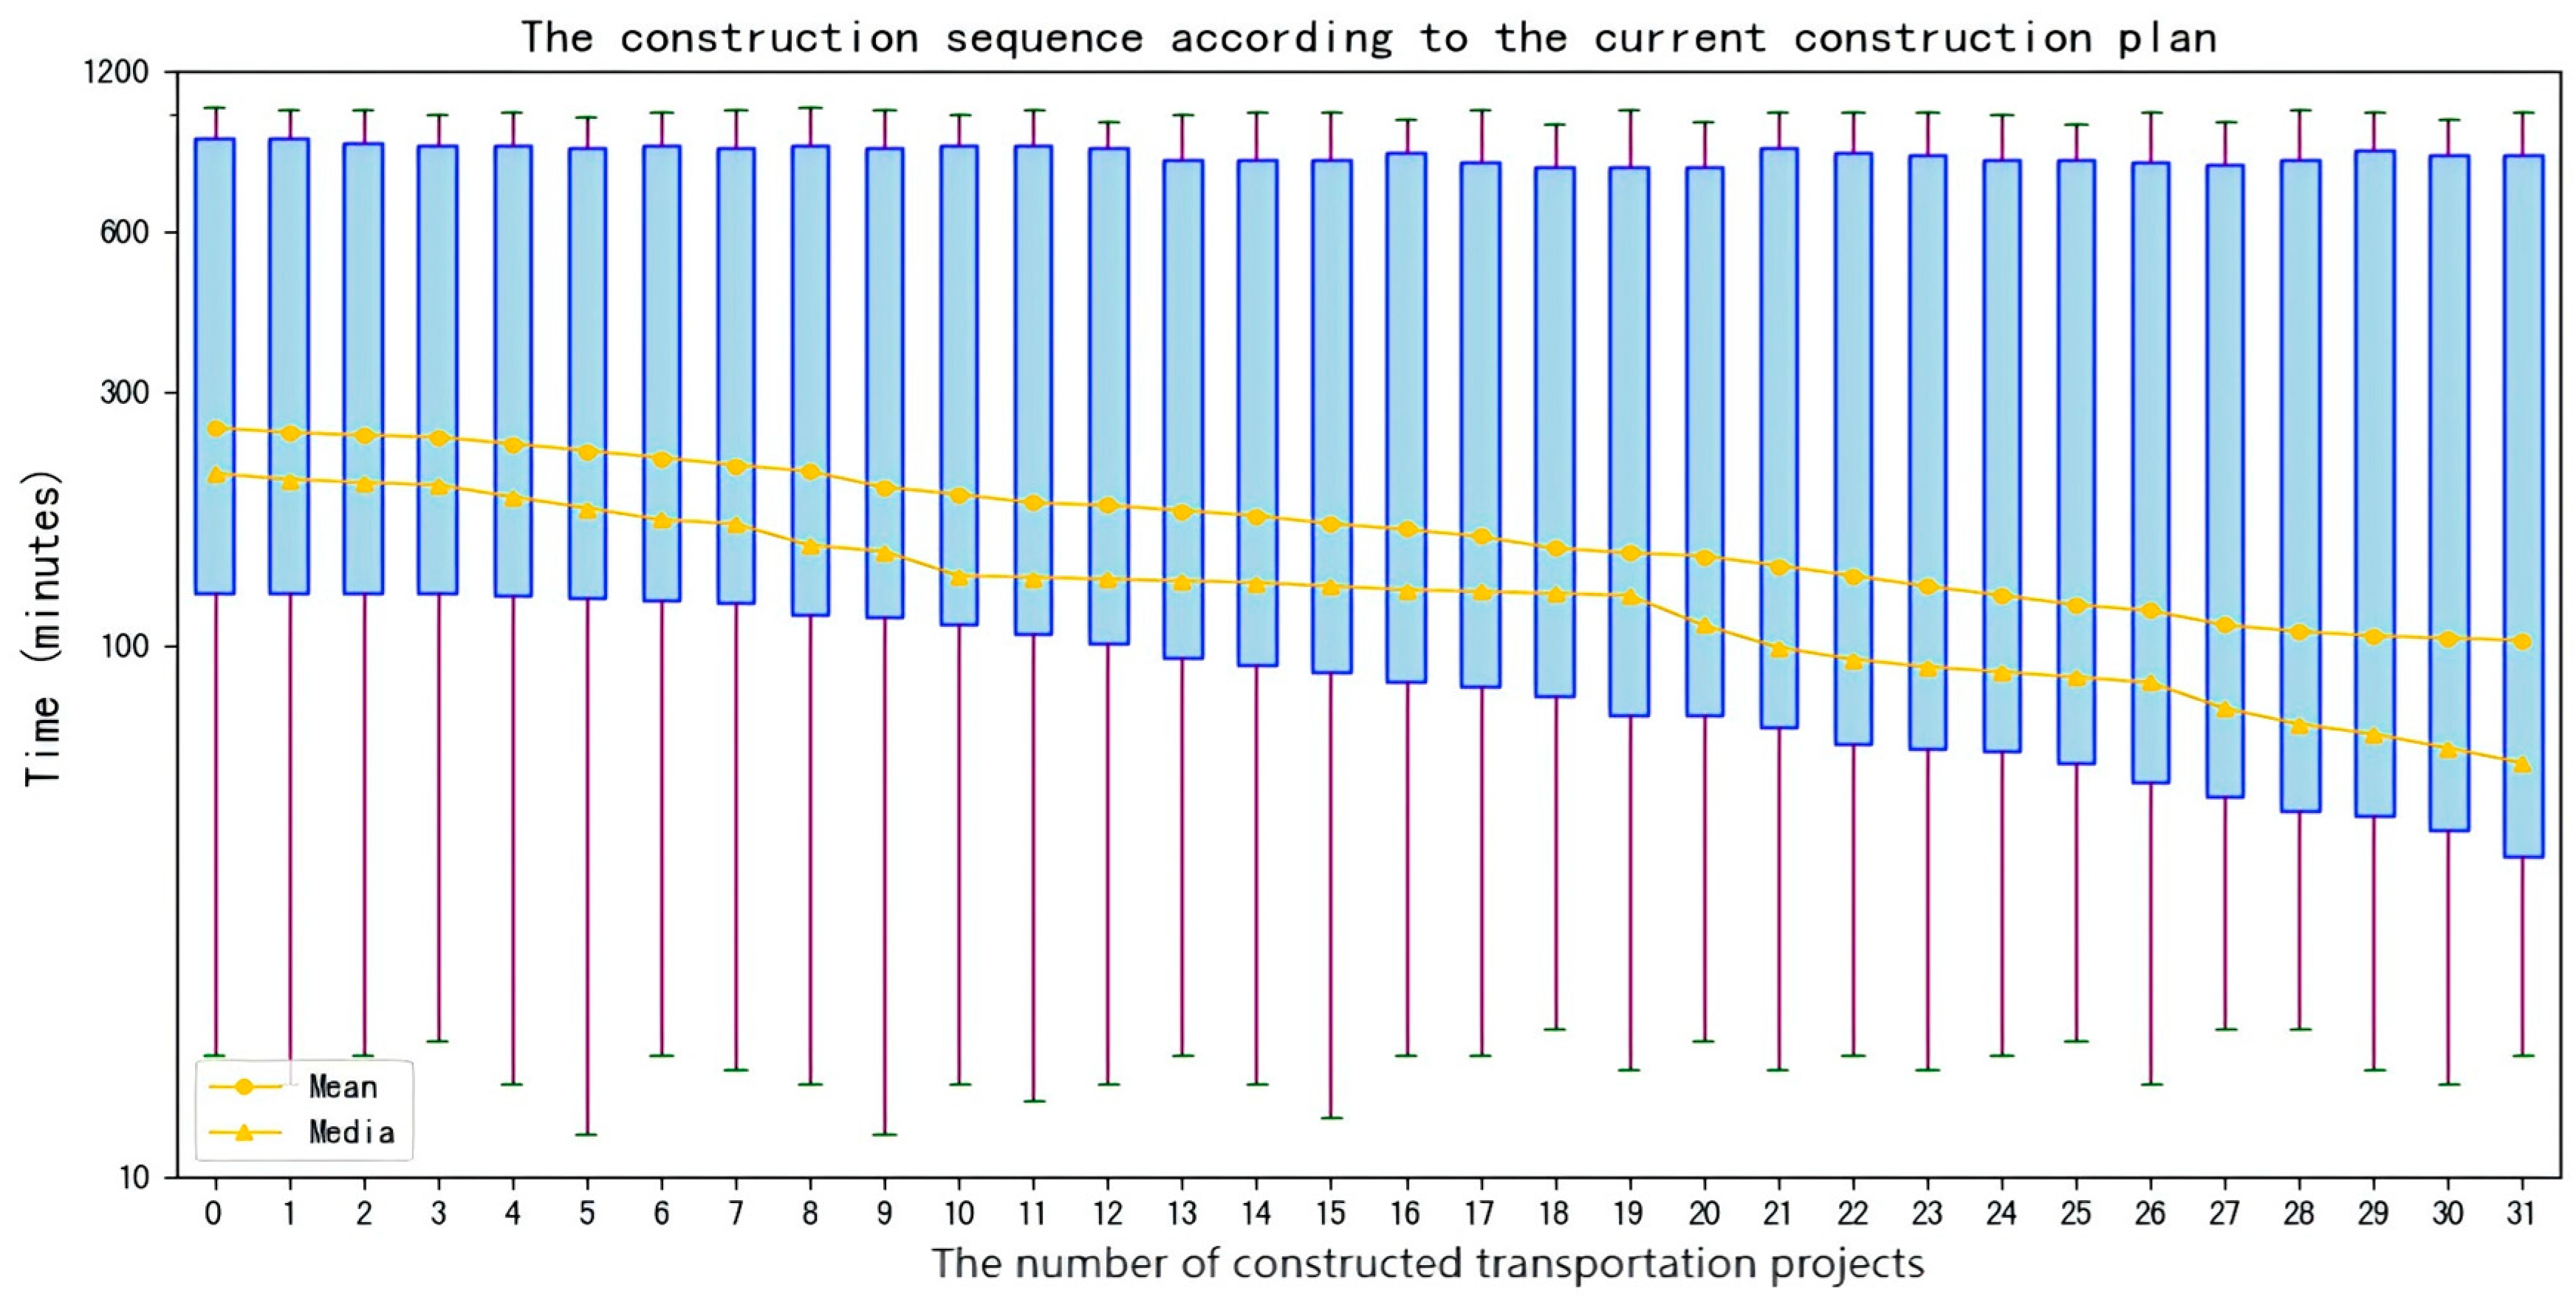
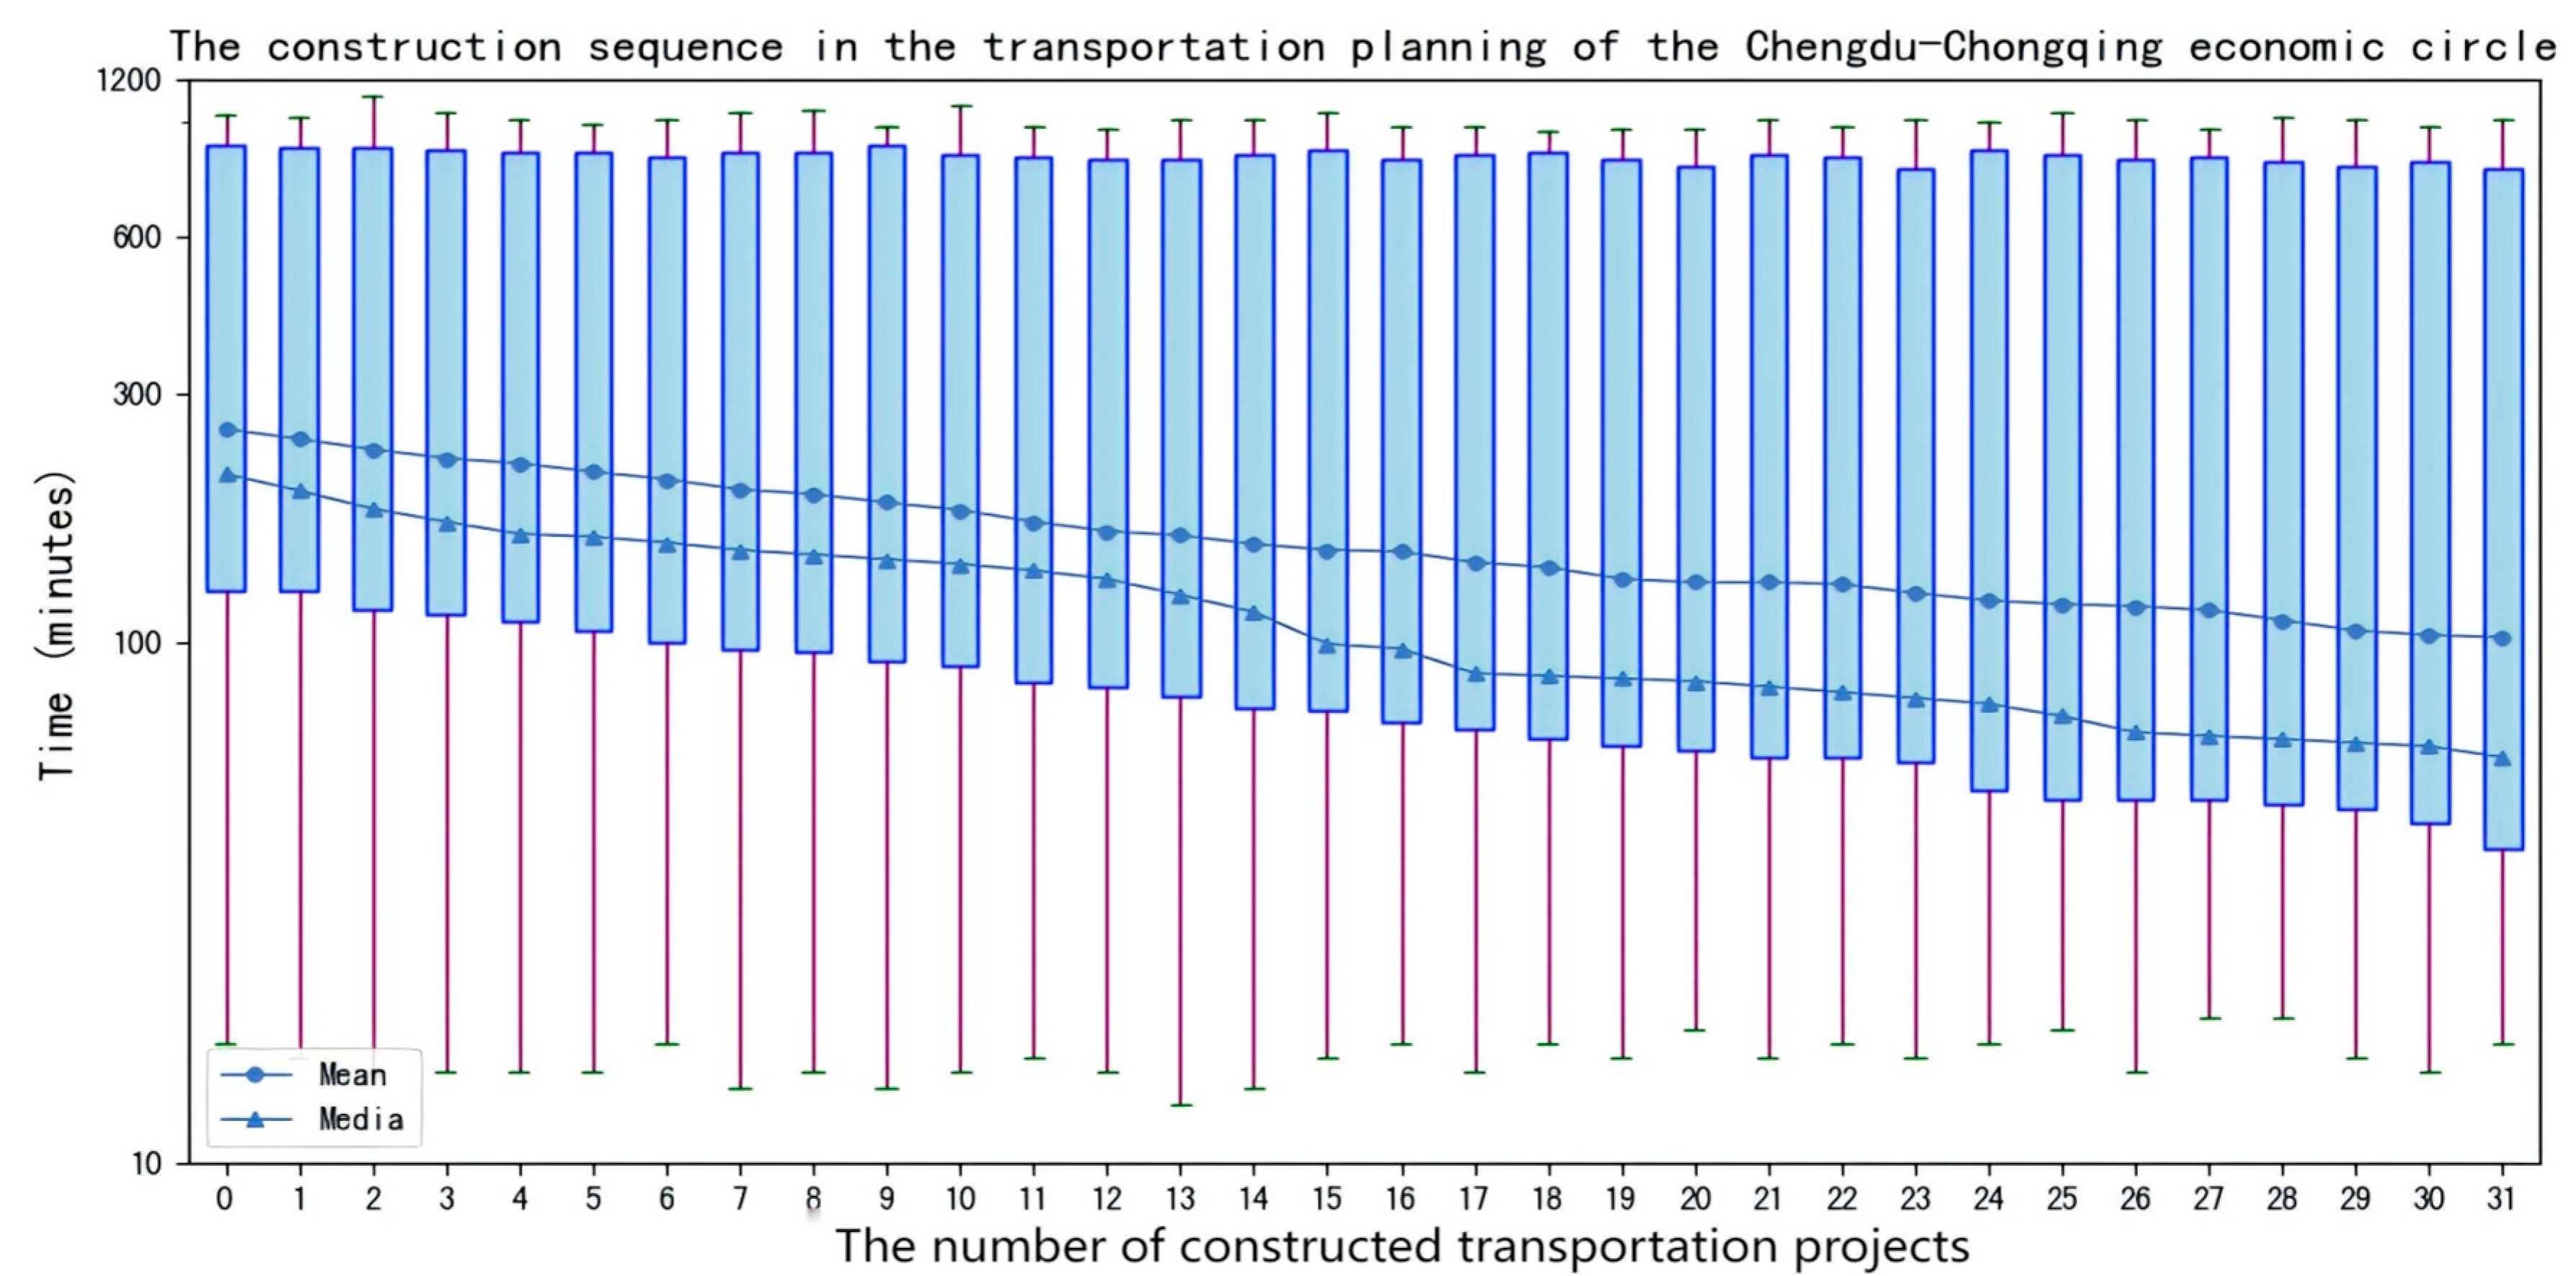
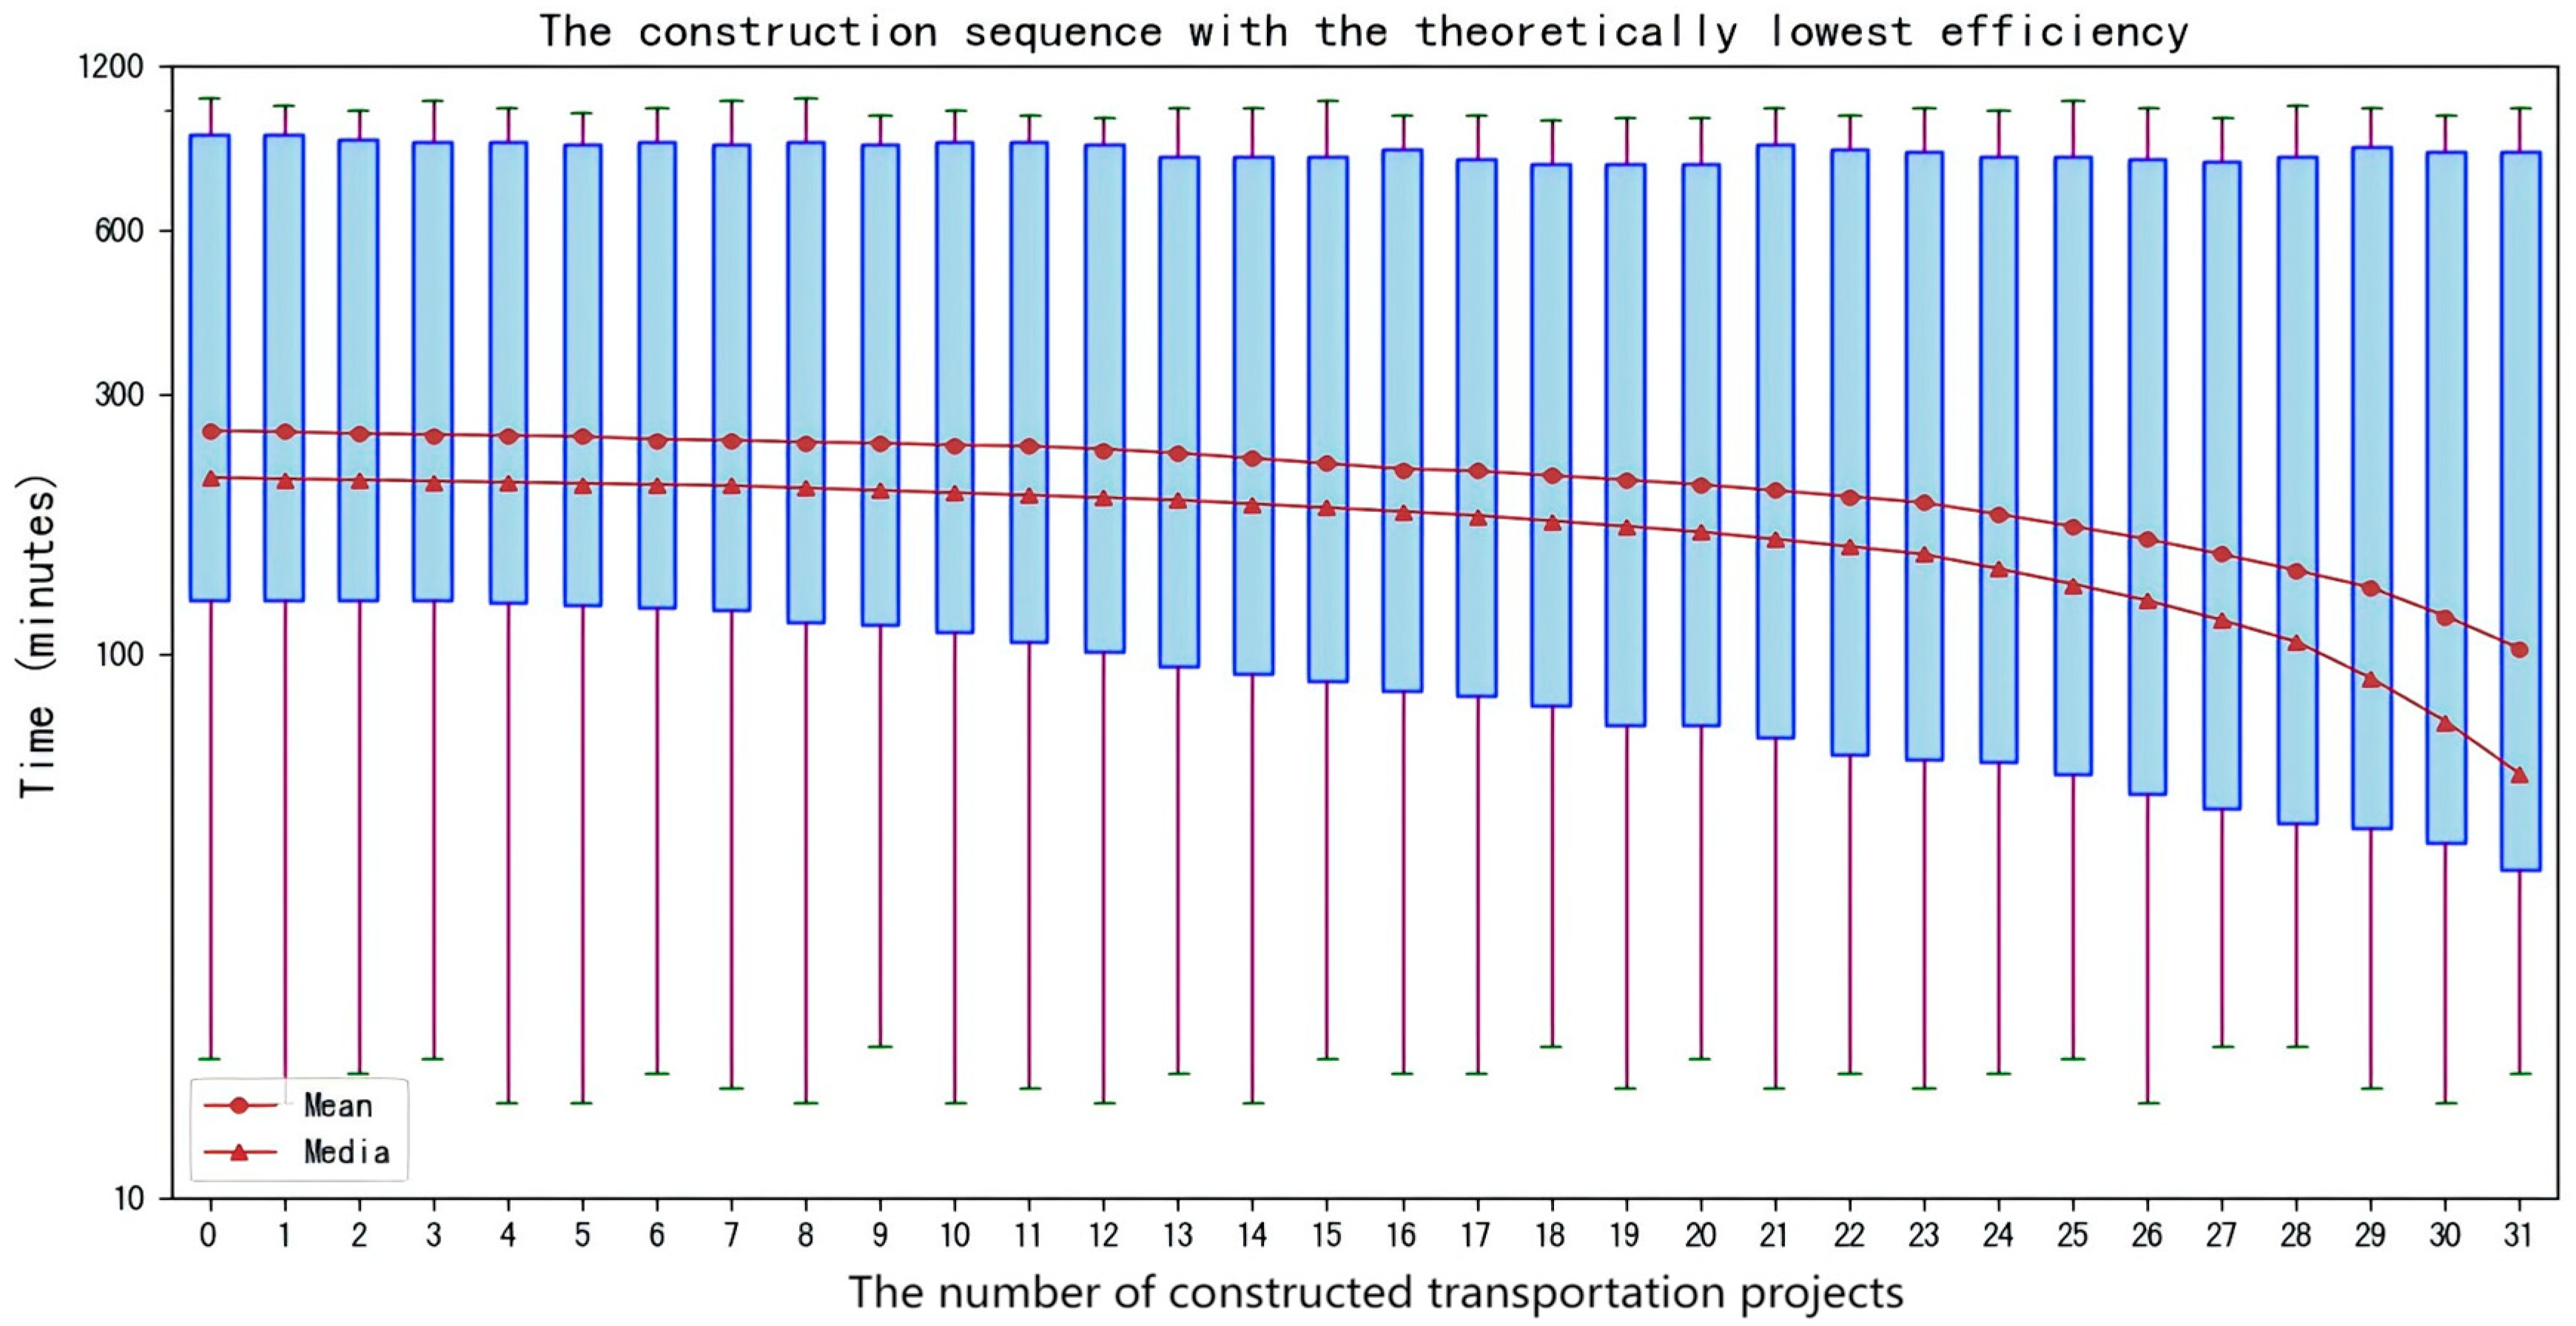
5.2. The Impact of Implementation Sequence on Transportation Network Efficiency

While transportation infrastructure planning often focuses on formulation, insufficient attention is given to its implementation. The default view in numerous studies is that the formulated plan will definitely be implemented. However, numerous practical examples demonstrate that the sequencing of construction plays a crucial role in determining network performance. Prioritizing certain infrastructure components can significantly affect their operational function and efficiency. The above viewpoints can be verified by Figure 5, Figure 6 and Figure 7. In the context of megacity transportation infrastructure planning, although network efficiency remains consistent at the start and end points of different implementation sequences, significant variations emerge at intermediate nodes. Partial execution of planned sequences may lead to substantial deviations in overall network efficiency. Therefore, it is essential to consider rational construction sequences during planning processes to optimize system performance.

5.3. Balancing Theoretical Optimality and Practical Constraints in Network Optimization

The existence of an optimal solution for traffic network optimization has long been debated. While some studies suggest that complex networks can be iteratively refined to approach a theoretical optimal state, others argue that engineering practice must prioritize user needs, with solutions varying accordingly. This paper supports the view that an optimal solution does exist, but also emphasizes that engineering practice must take into account real-world constraints. From Figure 9, it can be seen that the theoretical optimal construction sequence can be found through the enumeration algorithm, and the practical engineering should also conform to the optimal sequence as much as possible. However, even when an optimal construction sequence is determined through enumeration algorithms, factors such as investment scale, workforce distribution, and institutional inertia may prevent strict adherence to the optimal path. For example, although constructing high-speed railways offers the highest efficiency gain in theory, limitations in funding, a shortage of skilled labor, and the need to maintain balanced regional employment render a mono-prioritized construction strategy unrealistic. Therefore, rather than aiming to fully replicate the theoretical optimum, planners should use it as a guiding benchmark, adjusting implementation plans to suit engineering feasibility while still striving toward performance improvement.

5.4. Theoretical Optimal Solutions as a Reference for Evaluating Implementation Plans

The AA-DNDP-based method introduced in this study provides a rigorous way to evaluate the rationality of construction priorities across regions. The results show that the method can provide the theoretical optimal sequence based on the different characteristics of megacity transportation. Although the sequence may need to be slightly adjusted based on the actual situation during the execution, it can serve as a standard to judge the rationality of different implementation schemes. While slight adjustments may be necessary during implementation, the theoretical optimal solution serves as a valuable benchmark for evaluating the effectiveness of various implementation strategies. Figure 9 further demonstrates that coordinated planning, aimed at improving network efficiency, provides a more rational approach than independent provincial efforts, underscoring the role of theoretical optimal solutions in facilitating consensus and guiding successful implementation. However, the reliance of this method on high-resolution spatiotemporal data constitutes a limitation. Moreover, the computational complexity of AA-DNDP grows significantly with the scale of the network, potentially limiting its applicability in real-time decision-making processes. Despite these limitations, the theoretical optimal sequence can serve as a valuable reference for negotiation and consensus-building among stakeholders.

6. Conclusions

6.1. User Preference and Transfer Issues in Transportation Network Planning Can Be Solved Through Agent-AI

Our conclusion demonstrates that Agent-AI can accurately and effectively generate intelligent agents with different preferences based on huge amounts of property data on nodes and feature data on transportation. Agent-AI is applied in transportation network planning to make the results more in line with objective reality, which provides an interesting perspective for future research. To make the planning results more realistic, the specificity of the large language model should be enhanced and the representativeness of the generated data should be improved.

6.2. Weight Difference in Nodes in Transportation Network Planning Can Be Solved Through Agent-AI

Agent AI can scientifically provide different starting and ending points for each simulation based on the property of nodes and transportation. Network nodes of starting and ending points assigned by the large language model are given higher weights during the network simulation. The urban gravity model is an important model for the transportation network planning, and the manually obtained values are generally used to determine node weights in current studies. However, Agent-AI can solve the problem of determining and updating network node weights in mathematical calculations, thereby avoiding the interference of human factors and improving the applicability of network models.

6.3. The Construction of Transportation Networks in Megacities Requires Active Cooperation Among All Parties Involved Rather than Individual Efforts

Cross-regional transportation infrastructure is important during the construction of transportation networks in urban agglomerations and requires cooperation between transportation construction departments in both provinces. However, the current institutional and organizational designs are still carried out in many provinces, but no longer meets the needs of transportation infrastructure construction in urban agglomerations. Excessive self-governance and insufficient cooperation are the root causes of difficulties in completing transportation infrastructure planning in urban agglomerations.

7. Shortcoming and Future Scope

This paper calls the API of Chatgpt-4o during the simulation of Agent-AI. Although Chatgpt-4o is a powerful generative AI model, the usage scenarios of transportation infrastructure planning have not been fine-tuned. The response speed is insufficient when solving the problem of node generation, whereby the order of magnitude of users in real transportation networks cannot be simulated. This suggests that the accuracy of the conclusion should be improved. The deployment and fine-tuning of local large-scale models will be focused on in the future to develop a large language model that is more suitable for transportation network planning. Furthermore, future research requires an in-depth exploration of whether the traffic choice preferences generated by Agent-AI are in line with reality.

Author Contributions

Conceptualization, J.G. and C.W.; methodology, J.G. and L.W.; software, J.G. and C.W.; validation, J.G., C.W. and L.W.; formal analysis, J.G.; investigation, J.G. and C.W.; resources, J.G. and L.W.; data curation, J.G., L.W. and C.W.; writing—original draft preparation, J.G. and C.W.; writing—review and editing, J.G., L.W. and C.W.; visualization, J.G.; supervision, L.W.; funding acquisition, J.G. and L.W. All authors have read and agreed to the published version of the manuscript.

Funding

This study received funding from the Fundamental Research Funds for Central Universities of China University of Mining and Technology (Grant No. 2024QN11014), the National Postdoctoral Fellowship Program (Grant No. GZB20230841), and the General Program of the China Postdoctoral Science Foundation (Grant No. 2024M753534).

Institutional Review Board Statement

Not applicable.

Informed Consent Statement

Not applicable.

Data Availability Statement

Some or all data, models, or codes that support the findings of this study are available from the corresponding author upon reasonable request via e-mail: wanglinxiu@cumt.edu.cn.

Conflicts of Interest

The authors declare no conflicts of interest.

References

  1. Fang, C.; Yu, D. Urban agglomeration: An evolving concept of an emerging phenomenon. Landsc. Urban Plan. 2017, 162, 126–136. [Google Scholar] [CrossRef]
  2. He, Q.; Zeng, C.; Xie, P.; Tan, S.; Wu, J. Comparison of urban growth patterns and changes between three urban agglomerations in China and three metropolises in the USA from 1995 to 2015. Sustain. Cities Soc. 2019, 50, 101649. [Google Scholar] [CrossRef]
  3. Huang, H.; Xia, T.; Tian, Q.; Liu, T.; Wang, C.; Li, D. Transportation issues in developing China’s urban agglomerations. Transp. Policy 2020, 85, A1–A22. [Google Scholar] [CrossRef]
  4. Chen, Z.; Liu, L.; Li, L.; Li, H. A two-stage model for project optimization in transportation infrastructure management system. Math. Probl. Eng. 2014, 2014, 914515. [Google Scholar] [CrossRef]
  5. Yigitcanlar, T.; Rashid, K.; Dur, F. Sustainable urban and transport development for transportation disadvantaged: A review. Open Transp. J. 2010, 4, 1–8. [Google Scholar] [CrossRef]
  6. Bookbinder, J.H.; Désilets, A. Transfer optimization in a transit network. Transp. Sci. 1992, 26, 106–118. [Google Scholar] [CrossRef]
  7. Amiril, A.; Nawawi, A.H.; Takim, R.; Latif, S.N.F.A. Transportation infrastructure project sustainability factors and performance. Procedia-Soc. Behav. Sci. 2014, 153, 90–98. [Google Scholar] [CrossRef]
  8. Ren, Y.; Tian, Y.; Xiao, X. Spatial effects of transportation infrastructure on the development of urban agglomeration integration: Evidence from the Yangtze River Economic Belt. J. Transp. Geogr. 2022, 104, 103431. [Google Scholar] [CrossRef]
  9. Siemiatycki, M. Delivering transportation infrastructure through public-private partnerships: Planning concerns. J. Am. Plan. Assoc. 2009, 76, 43–58. [Google Scholar] [CrossRef]
  10. Zhao, T.; Zhang, Y. Transportation infrastructure restoration optimization considering mobility and accessibility in resilience measures. Transp. Res. Part C Emerg. Technol. 2020, 117, 102700. [Google Scholar] [CrossRef]
  11. Min, J.H.; Jang, W.; Han, S.H.; Kim, D.; Kwak, Y.H. How conflict occurs and what causes conflict: Conflict analysis framework for public infrastructure projects. J. Manag. Eng. 2018, 34, 4018019. [Google Scholar] [CrossRef]
  12. Erkul, M.; Yitmen, I.; Çelik, T. Stakeholder engagement in mega transport infrastructure projects. Procedia Eng. 2016, 161, 704–710. [Google Scholar] [CrossRef]
  13. Wang, S.; Meng, Q.; Yang, H. Global optimization methods for the discrete network design problem. Transp. Res. Part B Methodol. 2013, 50, 42–60. [Google Scholar] [CrossRef]
  14. Xu, T.; Wei, H.; Wang, Z. Study on continuous network design problem using simulated annealing and genetic algorithm. Expert Syst. Appl. 2009, 36, 2735–2741. [Google Scholar] [CrossRef]
  15. Chiou, S.W. Bilevel programming for the continuous transport network design problem. Transp. Res. Part B Methodol. 2005, 39, 361–383. [Google Scholar] [CrossRef]
  16. Adetola, A.; Goulding, J. Coordinate framework for road infrastructure management. Infrastruct. Asset Manag. 2016, 3, 71–80. [Google Scholar] [CrossRef]
  17. Wang, D.Z.W.; Liu, H.; Szeto, W.Y. A novel discrete network design problem formulation and its global optimization solution algorithm. Transp. Res. Part E Logist. Transp. Rev. 2015, 79, 213–230. [Google Scholar] [CrossRef]
  18. Gharehbaghi, K.; Georgy, M. Utilization of Infrastructure Gateway System (IGS) as a transportation infrastructure optimization tool. Int. J. Traffic Transp. Eng. 2014, 4, 8–15. [Google Scholar]
  19. Liang, Q.; Weng, J.; Zhou, W.; Santamaria, S.B.; Ma, J.; Rong, J. Individual travel behavior modeling of public transport passenger based on graph construction. J. Adv. Transp. 2018, 2018, 3859830. [Google Scholar] [CrossRef]
  20. O’Brien, L.O.; Yuen, S.W. The discrete network design problem over time. HKIE Trans. 2007, 14, 47–55. [Google Scholar] [CrossRef]
  21. Byeon, H.; Khalaf, M.I.; Quraishi, A.; Ramesh, J.V.N.; Ahanger, T.A.; Nimma, D.; Victor, G.J.; Turayevich, J.I.; Soni, M. Spatiotemporal Network for Accurate Traffic Flow Prediction in Intelligent Transportation Systems Using Generative AI. IEEE Trans. Intell. Transp. Syst. 2025, 1–10. [Google Scholar] [CrossRef]
  22. Di Torrepadula, F.R.; Napolitano, E.V.; Di Martino, S.; Mazzocca, N. Machine Learning for Public Transportation Demand Prediction: A Systematic Literature Review. Eng. Appl. Artif. Intell. 2024, 137, 109166. [Google Scholar] [CrossRef]
  23. Wen, X.; Chen, X. A New Breakthrough in Travel Behavior Modeling Using Deep Learning: A High-Accuracy Prediction Method Based on a CNN. Sustainability 2025, 17, 738. [Google Scholar] [CrossRef]
  24. Son, H.; Jang, J.; Park, J.; Balog, A.; Ballantyne, P.; Kwon, H.R.; Singleton, A.; Hwang, J. Leveraging Advanced Technologies for (Smart) Transportation Planning: A Systematic Review. Sustainability 2025, 17, 2245. [Google Scholar] [CrossRef]
  25. Idrissi, Z.K.; Lachgar, M.; Hrimech, H. Blockchain, IoT and AI in Logistics and Transportation: A Systematic Review. Transp. Econ. Manag. 2024, 2, 275–285. [Google Scholar] [CrossRef]
  26. Lukic Vujadinovic, V.; Damnjanovic, A.; Cakic, A.; Petkovic, D.R.; Prelevic, M.; Pantovic, V.; Stojanovic, M.; Vidojevic, D.; Vranjes, D.; Bodolo, I. AI-Driven Approach for Enhancing Sustainability in Urban Public Transportation. Sustainability 2024, 16, 7763. [Google Scholar] [CrossRef]
  27. Makanadar, A.; Shahane, S. Smart Mobility and Cities 2.0: Advancing Urban Transportation Planning Through Artificial Intelligence and Machine Learning. In Urban Mobility Research in India, Proceedings of the 16th UMI Conference and Expo 2023, New Delhi, India, 27–29 October 2023; Manoj, M., Roy, D., Eds.; Springer Nature: Singapore, 2024; pp. 23–38. [Google Scholar]
  28. Li, C.; Yang, H.; Zhu, D.; Meng, Q. A global optimization method for continuous network design problems. Transp. Res. Part B Methodol. 2012, 46, 1144–1158. [Google Scholar] [CrossRef]
  29. Davis, G.A. Exact local solution of the continuous network design problem via stochastic user equilibrium assignment. Transp. Res. Part B Methodol. 1994, 28, 61–75. [Google Scholar] [CrossRef]
  30. Chen, M.; Tworek, J.; Jun, H.; Yuan, Q.; Pinto, H.P.D.O.; Kaplan, J.; Edwards, H.; Burda, Y.; Joseph, N.; Brockman, G.; et al. Evaluating large language models trained on code. arXiv 2021, arXiv:2107.03374. [Google Scholar]
  31. Jin, T.; Bercea, G.T.; Le, T.D.; Chen, T.; Su, G.; Imai, H.; Negishi, Y.; Leu, A.; O’Brien, K.; Kawachiya, K.; et al. Compiling ONNX neural network models using MLIR. arXiv 2020, arXiv:2008.08272. [Google Scholar]
  32. Beer, D. Envisioning the power of data analytics. Inf. Commun. Soc. 2018, 21, 465–479. [Google Scholar] [CrossRef]
  33. Ge, Y.; Hua, W.; Mei, K.; Tan, J.; Xu, S.; Li, Z.; Zhang, Y. OpenAGI: When LLM meets domain experts. Adv. Neural Inf. Process. Syst. 2024, 36, 5539–5568. [Google Scholar]
  34. Zhao, F.; Zeng, X. Optimization of transit route network, vehicle headways and timetables for large-scale transit networks. Eur. J. Oper. Res. 2008, 186, 841–855. [Google Scholar] [CrossRef]
  35. Yao, Z.; Ye, K.; Xiao, L.; Wang, X. Radiation effect of urban agglomeration’s transportation network: Evidence from Chengdu–Chongqing Urban Agglomeration, China. Land 2021, 10, 520. [Google Scholar] [CrossRef]
  36. Mouter, N.; Van Cranenburgh, S.; Van Wee, B. Do individuals have different preferences as consumer and citizen? The trade-off between travel time and safety. Transp. Res. Part A Policy Pract. 2017, 106, 333–349. [Google Scholar] [CrossRef]
  37. Sun, H.; Gao, Z.; Long, J. The robust model of continuous transportation network design problem with demand uncertainty. J. Transp. Syst. Eng. Inf. Technol. 2011, 11, 70–76. [Google Scholar] [CrossRef]
  38. Farahani, R.Z.; Miandoabchi, E.; Szeto, W.Y.; Rashidi, H. A review of urban transportation network design problems. Eur. J. Oper. Res. 2013, 229, 281–302. [Google Scholar] [CrossRef]
  39. Yang, L.; Zhou, X. Optimizing on-time arrival probability and percentile travel time for elementary path finding in time-dependent transportation networks: Linear mixed integer programming reformulations. Transp. Res. Part B Methodol. 2017, 96, 68–91. [Google Scholar] [CrossRef]
  40. Brown, S.A.; Kudjo, P.; Amavi, F. A systematic review on complex networks and its performance evaluation metrics. Int. J. Comput. Appl. 2020, 13, 27–37. [Google Scholar] [CrossRef]
  41. Guo, J.; Xiang, P.; Liu, Q.; Luo, Y. Transportation infrastructure network optimisation based on computer simulation using Sichuan Province, China as an example. Eng. Constr. Archit. Manag. 2024, 31, 2740–2769. [Google Scholar] [CrossRef]
  42. Johnson, D.B. A note on Dijkstra’s shortest path algorithm. J. ACM 1973, 20, 385–388. [Google Scholar] [CrossRef]
  43. Climaco, J.C.N.; Martins, E.Q.V. A bicriterion shortest path algorithm. Eur. J. Oper. Res. 1982, 11, 399–404. [Google Scholar] [CrossRef]
  44. Feng, X.; Zhu, X.; Qian, Y.; Jie, Y.; Ma, F.; Niu, X. A new transit network design study in consideration of transfer time composition. Transp. Res. Part D Transp. Environ. 2019, 66, 85–94. [Google Scholar] [CrossRef]
  45. Ip, W.H.; Wang, D. Resilience and friability of transportation networks: Evaluation, analysis and optimization. IEEE Syst. J. 2011, 5, 189–198. [Google Scholar] [CrossRef]
  46. McLeod, S.; Scheurer, J.; Curtis, C. Urban public transport: Planning principles and emerging practice. J. Plan. Lit. 2017, 32, 223–239. [Google Scholar] [CrossRef]
  47. D’Ambrosio, C.; Lodi, A.; Wiese, S.; Bragalli, C. Mathematical programming techniques in water network optimization. Eur. J. Oper. Res. 2015, 243, 774–788. [Google Scholar] [CrossRef]
  48. Hilber, P.; Miranda, V.; Matos, M.A.; Bertling, L. Multiobjective optimization applied to maintenance policy for electrical networks. IEEE Trans. Power Syst. 2007, 22, 1675–1682. [Google Scholar] [CrossRef]
  49. Villarrubia, G.; De Paz, J.F.; Chamoso, P.; De la Prieta, F. Artificial neural networks used in optimization problems. Neurocomputing 2018, 272, 10–16. [Google Scholar] [CrossRef]
  50. Meixell, M.J.; Norbis, M. A review of the transportation mode choice and carrier selection literature. Int. J. Logist. Manag. 2008, 19, 183–211. [Google Scholar] [CrossRef]
Figure 1. The methodology system.
Applsci 15 05319 g001
Figure 2. Status of transportation infrastructure in Chongqing.
Applsci 15 05319 g002
Figure 3. The initial network model.
Applsci 15 05319 g003
Figure 4. Program design ideas.
Applsci 15 05319 g004
Figure 5. Temporal distribution of transportation efficiency in Chongqing’s infrastructure implementation planning based on the traditional method.
Applsci 15 05319 g005
Figure 6. Temporal distribution of transportation efficiency in Chongqing’s infrastructure implementation planning based on the AA-DNDP coordination method.
Applsci 15 05319 g006
Figure 7. Upper limit of network efficiency variation for transportation infrastructure in the Chengdu–Chongqing economic circle.
Applsci 15 05319 g007
Figure 8. Lower limit of network efficiency variation for Chongqing’s transportation infrastructure.
Applsci 15 05319 g008
Figure 9. Median comparison of transportation infrastructure efficiency across four implementation sequences.
Applsci 15 05319 g009
Table 1. Implementation differences in the planning routes of transportation infrastructure in Chongqing.
NumberTypeIntervalLength (km)Scheduled Opening Time
1High-speed railwayChongqing←→Dazu102.71January 2027
2High-speed railwayChongqing←→Yongchuan69.5June 2025
3High-speed railwayChongqing←→Fuling69.3May 2028
4High-speed railwayFuling←→Fengdu57.2May 2028
5High-speed railwayFengdu←→Zhongxian67.5May 2028
6High-speed railwayZhongxian←→Wanzhou103.1May 2028
7High-speed railwayWanzhou←→Boundary85.4June 2025
8High-speed railwayChongqing←→Nanchuan84.3January 2030
9High-speed railwayNanchuan←→Qianijiang192.3January 2030
10Regular-speed railwayTongnan←→Bishan84.3June 2030
11Regular-speed railwayBoundary←→Tongnan97.4January 2026
12Regular-speed railwayTongnan←→Bishan96.2January 2031
13Regular -speed railwayBoundary←→Fuling94.8June 2031
14Regular-speed railwayChongqing←→Yongchuan74.3June 2031
15Expressway (loop line)Yongchuan←→Qijiang103.5January 2026
16Expressway (loop line)Hechuan←→Changshou104.5June 2026
17Expressway (loop line)Chongqing←→Chongqing34.2June 2026
18Expressway (loop line)Chongqing←→Chongqing33.1June 2026
19ExpresswayBoundary←→Wanzhou32.5March 2025
20ExpresswayNanchuan←→Chongqing94.2January 2026
21ExpresswayLiangping←→Fengdu51.2December 2024
22ExpresswayHechuan←→Jiangjin62.3December 2024
23ExpresswayJiangjin←→Chongqing45.2January 2025
24ExpresswayWanzhou←→Liangping63.2January 2027
25ExpresswayZhong County←→Qijiang114.2March 2027
26Subway line 7Science Park←→Jinfeng25September 2025
27Subway line 17University Park←→Shijia Courtyard13November 2025
28Yongchuan light railway lineChongqing West Railway Station←→Yongchuan68January 2033
29Nanchuan light railway lineBanan District Huimin←→Nanchuan Jinfoshan75January 2029
30Dazu light railway lineDaishan Avenue←→Dazu Carvings75June 2029
31Qiwan light railway LineXuetangwan, Banan District←→Qijiang District56January 2035
Table 2. The TOF matrix data.
HighwayExpresswayRailwayHigh-Speed RailwaySubway
Speed (km/h)6012015040040
Wait time (min)00606015
Comfort (Time < 1 h)ComfortableComfortableVery ComfortableVery ComfortableNeutral
Comfort (1 h < Time < 5 h)NeutralNeutralComfortableComfortableUnbearable
Comfort (Time > 5 h)UnbearableUncomfortableNeutralNeutralN/A
Safety (Time < 1 h)SafeSafeVery SafeVery SafeVery Safe
Safety (1 h < Time < 5 h)DangerousRiskyVery SafeVery SafeVery Safe
Safety (Time > 5 h)Very DangerousDangerousVery SafeVery SafeN/A
Price (Yuan/km)0.771.150.1580.5550.3
All the above data are required for evaluation.
Table 3. Calculation results of alternative data.
NumberTime(s)99.5% Lower Limit
(min)
99.5% Upper Limit
(min)
Difference Between Upper and Lower Limits
1 × 1079.7167.62172.885.26
3 × 10718.89168.86172.944.08
5 × 10728.06169.31172.593.28
7 × 10737.12169.73171.822.09
9 × 10746.37168.99171.162.17
1 × 10894.39169.46171.241.78
3 × 108195.02169.33171.071.74
5 × 108281.61169.84170.711.65
7 × 108382.73169.9170.91
9 × 108477.27170.14170.960.82
1 × 109932.1169.82170.530.71
3 × 1092818.16169.99170.510.52
5 × 1094710.18169.91170.240.33
7 × 1096108.25169169.10.1
9 × 1097842.88169169.10.1
Table 4. The AUT and puf values after the completion of a single transportation infrastructure project.
NumberIntervalAUT (min)Puf (Frequency)
0Initial network2560
1Chongqing←→Dazu2545811
2Chongqing←→Yongchuan24119,849
3Chongqing←→Fuling24612,150
4Fuling←→Fengdu24116,679
5Fengdu←→Zhongxian24710,901
6Zhongxian←→Wanzhou24722,870
7Wanzhou←→Boundary24712,596
8Chongqing←→Nanchuan2526820
9Nanchuan←→Qianijiang2417883
10Tongnan←→Bishan2467675
11Boundary←→Tongnan2516745
12Tongnan←→Bishan2516766
13Boundary←→Fuling2531542
14Chongqing←→Yongchuan254529
15Yongchuan←→Qijiang2551426
16Hechuan←→Changshou2555314
17Chongqing←→Chongqing2551385
18Chongqing←→Chongqing2557940
19Boundary←→Wanzhou2546537
20Nanchuan←→Chongqing2531483
21Liangping←→Fengdu251131
22Hechuan←→Jiangjin2537228
23Jiangjin←→Chongqing2548989
24Wanzhou←→Liangping2545413
25Zhong County←→Qijiang2537803
26Science Park←→Jinfeng2544615
27University Park←→Shijia Courtyard2557618
28Chongqing West Railway Station←→Yongchuan2527191
29Banan District Huimin←→Nanchuan Jinfoshan2552174
30Bishan Daishan Avenue←→Dazu Rock Carvings255759
31Xuetangwan, Banan District←→Qijiang District2521654
Disclaimer/Publisher’s Note: The statements, opinions and data contained in all publications are solely those of the individual author(s) and contributor(s) and not of MDPI and/or the editor(s). MDPI and/or the editor(s) disclaim responsibility for any injury to people or property resulting from any ideas, methods, instructions or products referred to in the content.

