Article

Research of Physical and Mechanical Properties of Self-Compacting Concrete Based on Polyfractional Binder

by
Meiram M. Begentayev
1,
Daniyar A. Akhmetov
1,
Rauan E. Lukpanov
2,*,
Erzhan I. Kuldeyev
1,
Zhanar O. Zhumadilova
1,
Tolebi Myrzaliyev
3,
Duman S. Dyussembinov
2 and
Aigerim K. Tolegenova
1,*
1
Institute of Architecture and Civil Engineering, Construction and Building Materials Department, Satbayev University, Satpayev Str. 22a, 050013 Almaty, Kazakhstan
2
Faculty of Architecture and Civil Engineering, L.N. Gumilyov Eurasian National University, Satbayev Str. 2, 01000 Astana, Kazakhstan
3
Department of Building Materials and Expertise in Construction, Auezov University, Tauke Khan Ave.-5, 160012 Shymkent, Kazakhstan
*
Authors to whom correspondence should be addressed.
Appl. Sci. 2025, 15(10), 5283; https://doi.org/10.3390/app15105283
Submission received: 13 March 2025 / Revised: 24 April 2025 / Accepted: 3 May 2025 / Published: 9 May 2025
(This article belongs to the Section Materials Science and Engineering)

Abstract

:
This article presents the results of a study on the influence of a three-level dispersed composition of the clinker component of a binder, which includes coarse, medium, and fine fractions, on the physical and mechanical properties of self-compacting concrete (SCC). One of the current challenges in SCC technology is enhancing its durability and resistance to aggressive environments while maintaining self-consolidating properties. Addressing this challenge holds significant engineering importance, especially for infrastructure under freeze–thaw cycles and chemical exposure. The work aimed to determine the optimal polyfractional composition that ensures the maximum packing density of cement binder particles and to assess the changes in the operational characteristics of SCC. A software and calculation complex featuring a three-dimensional modeling algorithm, Drop and Roll, was used to select the optimal composition. Experimental studies were conducted for mixtures with varying fraction contents, differing in average particle sizes of 12 μm, 6.6 μm, and 4.9 μm. It was found that the optimum composition, consisting of 15% of the 1500 cm2/g fraction, 75% of the 3000 cm2/g fraction, and 10% of the 4500 cm2/g fraction, contributes to an increase in compressive strength of 26%, bending strength of 10%, a times two increase in freeze-thaw resistance, a decrease in water absorption, and an improvement in chemical resistance to aggressive environments. The results confirm the effectiveness of optimizing the grain composition of the binder to enhance the durability and performance characteristics of SCC used in aggressive conditions.

1. Introduction

An urgent task in modern construction in the Republic of Kazakhstan is to increase the durability and operational reliability of hydraulic structures and irrigation systems, on which the degree of wear reaches about 70%. Such structures operate under complex impacts from aggressive factors, including water with high mineralization, the cavitation effect of flows, and sharp daily and seasonal temperature fluctuations that involve multiple transitions through 0 °C during the autumn–winter period. These factors provoke the intensive development of destructive processes in the concrete matrix, contributing to leaching, carbonation, frost destruction, and the effects of salt solutions, which inevitably lead to a decrease in the strength and durability of structures [1,2]. In light of the need to extend the service life of hydraulic structures, special attention is given to materials with improved operating characteristics, among which the use of SCC is considered a promising direction. This material is characterized by high homogeneity, structural density, and resistance to external influences. However, despite the significant potential for the use of SCC, its implementation in Kazakhstan remains limited due to insufficient scientific development, the absence of mass production of modern modified additives, a weak technological base of enterprises, and a lack of practical experience in calculating and designing structures using such materials, resulting in non-compliance with the requirements of current regulatory documents, such as SP RK EN 1992-1-1:2004 and ST RK EN 206-2017 [3].
Increasing the durability and operational reliability of structures made of SCC is possible through the use of protective coatings and polymer compositions, but these have several limitations. In particular, thin protective layers (about 0.2 mm) are susceptible to mechanical damage, which reduces their effectiveness in aggressive conditions [4]. Furthermore, while polymer compositions exhibit high resistance to external influences, their use is economically impractical in mass construction due to the high cost of components [5]. Thus, the most rational solution for enhancing the operational reliability of SCC is to modify the structure of the cement stone itself by utilizing multicomponent chemical–mineral additives that promote the formation of a dense and durable structure resistant to aggressive environments [6]. Additionally, Lang et al. demonstrated that ternary binder systems combining industrial by-products (slag and manganese residue) with cement can significantly reduce environmental impact while maintaining or enhancing concrete durability [7].
Previous studies have shown that using mineral additives in heavy concretes can reduce shrinkage deformations by 20% and increase frost and water resistance by up to 25% [8]. This highlights the potential for further research into improving the performance characteristics of concrete by optimizing its microstructure and permeability. An analysis of scientific and technical literature allowed us to formulate a hypothesis that increasing the resistance of concrete to aggressive impacts can be achieved through mathematical optimization of the grain composition of the cement binder. This approach is based on forming a polydisperse structure of the cement matrix with efficient particle packing, which helps enhance the characteristics of concrete throughout its entire service life [9]. Optimization of the binder structure involves a detailed study of structure formation processes using topological analysis methods, which treat the binder as a spatial system of dispersed particles and phase formations interacting during the hydration process [10]. The most common method for studying the packing of dispersed systems is mathematical modeling using a complex sphere model, which enables the analysis of the packing density and interaction of particles of different sizes [11]. For monodisperse systems, the maximum packing density reaches F = π/√18 ≈ 0.74 with simple cubic or hexagonal packing (Figure 1). However, with a rational selection of the ratios of diameters and volume fractions of the components, it is possible to form a polydisperse structure with an even higher packing density, which ensures an increase in the strength and durability characteristics of the material [12].
The present study proposes a sequential volume-filling model with spherical particles to form a thermodynamically stable, polydisperse cement–stone structure. This model enables denser packing than traditional approaches based on similar structures. An analysis of the scientific publications on the structural topology of cement binders, the corrosion resistance of concrete, and the mechanisms of destruction of the cement matrix under the influence of aggressive environments shows there has been insufficient study of the issues related to the creation and practical application of polydisperse cement systems in modern building materials [13].
At the same time, existing studies mainly focus on monodisperse mixtures or limited polydisperse systems, and the possibilities of using software and computational complexes based on three-dimensional modeling to optimize the binder composition remain insufficiently explored. The lack of a systematic approach to the experimental substantiation of the optimal parameters of polydisperse cement matrices underscores the relevance of this study, which aims to improve the operational reliability of SCCs used in aggressive environments by integrating mathematical modeling, theoretical analysis, and experimental data.

2. Materials and Methods

The research involved both theoretical and applied methods. The theoretical aspect was grounded in mathematical principles, considering mathematics, construction materials science, and colloid chemistry, along with analysis and modeling. This facilitated a deeper exploration of the topology of dispersed systems and a comparison of results with those from previous research groups, concentrating on the durability and operational reliability of SCC. The applied research aimed to validate the theoretical hypothesis regarding the feasibility of using polydisperse binders in SCC. Experiments were carried out to evaluate the theoretical conclusions about the durability and operational reliability of the resulting SCC, as well as to process and document the results obtained in accordance with standards. All materials used in the study were sourced and produced in Kazakhstan. All studies and tests adhered to the regulatory documentation in effect in Kazakhstan.
The study aimed to determine the optimal polyfractional composition, based on the cement clinker component, which achieves maximum or near-maximum spatial packing of polyfractional binder particles, thereby contributing to the transformation of the physical and mechanical properties of SCC. To verify the scientific hypothesis and achieve the aim of improving the structure and performance properties of SCC through the use of technology to optimize its most vulnerable component—cement stone—based on the principle of polydisperse structure formation and utilizing modern three-dimensional modeling algorithms, a set of research tasks was established as follows [14]:
  • A computational validation of the potential to obtain a hardened cement matrix with an ordered fine crystalline structure by controlling the binder (cement) composition with varying dispersity and high packing density;
  • Laboratory studies of concrete samples of SCC with variable compositions of polyfractional cement focused on identifying the optimal composition regarding the bifurcation processes of the physical and mechanical properties of concrete.
The research included two consecutive stages: a preliminary stage of the study and the main stage.
During the preliminary studies, the following works were carried out:
  • Mathematical modeling of the packing density of polyfractional compositions to identify the most efficient dispersed cement powders;
  • Preliminary assessment of the strength of SCC based on the most efficient dispersed powders to select the most prospective compositions for the subsequent main research.
During the main studies, laboratory tests were carried out, including an assessment of the following physical and mechanical properties of concrete:
  • X-ray phase analysis;
  • Evaluation of compressive and bending strength;
  • Evaluation of water saturation (absorption);
  • Evaluation of water permeability;
  • Evaluation of frost resistance;
  • Evaluation of chemical resistance.
The composition of self-compacting concrete C35/45, developed at the Temirbeton-1 plant, is based on quick-hardening Portland cement with an additive content of no more than 5%, and was used as a reference sample. According to the basic characteristics required for SCC, the material has the following rheological indicators: workability class of the mixture SF2 (670 mm) and viscosity class VF2 (14 s), according to [15]. Since the proposed composition includes only polyfractional cement (instead of standard cement), the rheological properties were not considered as evaluation criteria. The composition of the reference sample is presented in Table 1.
Portland cement clinker supplied by Standard Cement LLP (Shymkent, Kazakhstan) was used in the studies. The chemical parameters of the Portland cement clinker are presented in Table 2. The content of tricalcium and dicalcium silicates in the clinker was calculated using the following formulas:
C3S = 4.07CaO − (7.6SiO2 + 6,7AI2O3 + 1,42Fe2O3),
C2S = 8.6SiO2 + 5.07Al2O3 + 1.07Fe2O3 − 3.07CaO,
Note: Equations (1) and (2) are based on Bogue’s formulas, which are widely used to estimate the content of the main clinker phases—alite (C3S) and belite (C2S)—in Portland cement. These formulas rely on the chemical oxide composition of the cement (typically obtained via XRF analysis) and provide an approximate phase analysis based on the proportions of CaO, SiO2, Al2O3, and Fe2O3 [16].
Sand from Arna LLP (Almaty region, Kazakhstan) was used for testing; its characteristics are presented in Table 3.
Granite crushed stone produced by Tas Kum LLP (Almaty region, Kazakhstan) was used as a coarse aggregate; its characteristics are presented in Table 4.
A chemical admixture based on polycarboxylate esters AR 122, produced by Arirang Group LLP (Astana, Kazakhstan), was used as a superplasticizer; its characteristics are shown in Table 5.
Microsilica produced by Tau-Ken Temir LLP (Karaganda, Kazakhstan) was used as a finely dispersed filler for SCC. Microsilica is formed during the reduction of quartz during the production of silicon and ferrosilicon and consists of very small spherical particles containing amorphous or glassy silicon dioxide (SiO2) in an amount of at least 95% of the additive mass. The chemical composition is given in Table 6.
In the study we made calculations of packing density for the system of polydisperse cement binder powders of different grinding fineness (dispersity). The same Portland cement clinker of “Standard Cement” LLP (Shymkent, Kazakhstan) was used for preparation of polyfractional cement, which was used for preparation of the reference sample. Polyfractional cement is represented by three fractions of different diameters, the characteristics of which are presented in Table 7. To create the finely dispersed fractions of the clinker component, a Fritsch Pulverisette disc vibration impact mill was used with the following characteristics: productivity—up to 250 mL, maximum size of loaded material—12 mm, final size of material—less than 10 µm, engine speed—600–1500 rpm.
For simplicity, further in the article, the mass proportion of each fraction in the composition of polyfractional cement, will be represented by the following expression: example—15/75/10, i.e., the mass proportion of the fraction F1 is 15%, F2—75% and F3—10%. Researchers argue that to reduce the influence of packing, the ratio of particle diameter to packing size should be >20 [17]. But since the calculation of packing in 20 diameters of the largest sphere is labor-intensive and will take a very long time, the research will consider a single cell, with the ratio of the larger sphere diameter in the size 1:12. The largest diameter is 12 µm; hence, the mesh size will be 144 × 144 × 144. We take the grid spacing equal to 5% of the diameter of the smallest sphere equal to 4.9 µm; hence D = 0.245. The parameter d = 144, then we look for the tightest packing. To select the optimal composition of the fractionated binder, a software and calculation complex with a 3D modeling algorithm, based on the modified Drop and Roll method developed based on TvSTU, was used. This method consists of gradual filling of the unit volume of the package with spheres, in which they fall one by one in a random place and in a random order [18]. The input of the program is given the initial values: parameters of the box, the number and parameters of spheres of different fractions. At the output, an array of centers of the placed spheres, their radii and indices of the spheres with which they come into contact is formed. The calculation of the density of particle packing in the compositions is based on a well-known method using the following equation:
ϱ ¯ ϵ = n V i V c e l l ,
where Vi is the particle volume, n is the number of particles, Vcell is the cell volume [19].
The calculations consider that if two spheres of radius r1 and r2 are located next to each other, then their contact can be expressed as:
d = r 1 + r 2 ,
where d is the distance between the centers of two spheres.
Two spheres can be arbitrarily close (d is slightly larger than r1 + r2) without contacting each other. It is known that the problem of contact assessment inevitably arises in experimental studies, which is due to technical approximations (d cannot be measured accurately), whereas in numerical modeling such a problem does not arise, since in this case the position and size of the spheres are precisely known. But it should be noted that the results, as in the case of measuring the packing density, are affected by the wall effect [18]. For this reason, a distinction is always made between experiments and modeling.
The initial data and boundary conditions for calculating topological characteristics are presented by the following concept:
F 1 = 5 % ;   v a r i a t i o n   F 2 = 0 ,   5,10 ,   15 95 % ; F 3 = 95 ,   90 ,   85 0 %   r e s p e c t i v e l y   v a r i a t i o n s   o f   F 2   a n d   F 3   a t   f i x e d   v a l u e s   o f   F 1 ,   m u l t i p l e s   o f   5 %   i n c r e m e n t s F 1 = 95 % ;   v a r i a t i o n   F 2 = 0   a n d   5 % ; F 3 = 5   a n d   0 %   r e s p e c t i v e l y ,
where F1, F2 and F3 are fractions of large, medium and small sizes.
The concentration increase factor of each fraction was 5%. First, all variations in the F2 to F3 ratios were considered, with a minimum fixed value of F1 = 5%. Then, all variations in the F2 to F3 ratios were considered, with the next fixed value of F1 = 10%, and so on, up to the maximum fixed value of F1 = 95%. The center of the corresponding cumulative distribution was adopted as the characteristic size of each composition (for each fraction).
X-ray diffraction (XRD) analysis was performed using a Proto AXRD Benchtop powder X-ray diffractometer with a variable radius goniometer that can be set to 143 mm for higher line intensity or 191 mm for higher resolution of diffraction peaks, allowing the grazing incidence of diffraction (GID) technique to be implemented. The Proto AXRD Benchtop has all the functions of a sophisticated powder diffractometer due to the achievable peak resolution of FWHM < 0.04° 2θ and angular accuracy of <±0.02° 2θ over the entire angular range. A fine powder from a cement stone sample was prepared for analysis. After obtaining the X-ray diffraction pattern, it was decoded and identified [20].
To test the SCC samples for strength according to [21], a setup with one control (Italy) test frame was used, the maximum load of which is up to 200 MPa. To determine the compressive strength after normal hardening at the age of 28 days, cube samples with a working cross-section size of 150 × 150 × 150 mm were made, based on the fact that the largest grain size of the SCC filler is 20 mm. The experimental compositions were prepared according to the standard laboratory testing method by dosing the components by weight, followed by mixing all components in a concrete mixer [21]. The sample was loaded until failure at a constant load increase rate of (0.6 ± 0.2) MPa/s. For bending tests, prism samples measuring 100 × 100 × 400 mm were prepared.
The freeze–thaw resistance tests were conducted using the basic method of repeated freezing and thawing in a water-saturated state. The test procedure and processing of the results were carried out in accordance with [22]. Freezing was carried out for water-saturated samples at a temperature of minus 18 ± 2 °C, and thawing at a temperature of 20 ± 2 °C. The freezing time of the samples was at least 2.5 h, and the thawing time was at least 2 ± 0.5 h. After reaching a certain number of cycles (200, 300, 400, 500 and 600 cycles), control measurements of the weight loss and residual strength of the samples were performed. The tests were carried out on cube-shaped samples with dimensions similar to those for compressive strength tests. The tests were performed for 6 samples of each composition (type).
The “wet spot” method was used to determine water permeability. In accordance with the requirements of [23], the tests were carried out on cylindrical samples, 150 mm in diameter and 150 mm in height, with the same conditions of the grain size of the SCC filler. For each composition, 6 samples were prepared, which, before testing, were kept in a curing chamber at a temperature of 20 ± 2 °C and a relative air humidity of 95 ± 5%. The testing process involved a stepwise increase in water pressure from one side of the sample until signs of water filtration from the opposite side of the sample appeared. The pressure increment was 0.2 MPa, and the holding time for each step was 12 h.
The water absorption study was conducted in accordance with the requirements of [24]. The tests were also conducted for 6 cube samples of each series, with dimensions similar to those used for strength tests. The samples were kept in water until completely saturated at a temperature of 20 ± 2 °C. Every 24 h, the samples were weighed until constant weight, when two successive weighings did not differ by more than 0.1%. After complete water saturation, water absorption was determined, expressed as the ratio of the weight of absorbed water to the weight of the dry sample.
Chemical resistance tests were performed in accordance with [25,26] and consist of determining the chemical resistance coefficients of samples placed in an aggressive environment. For each composition, 18 samples were prepared (3 samples for each strength control). The studies were conducted for cube samples in three aggressive environments, represented by the following aqueous solutions: 5% sodium sulfate (Na2SO4), 3% sodium chloride (NaCl), and 0.01 M hydrochloric acid (HCl). The evaluation criteria were weight loss, residual compressive and bending strength, after maintaining the samples in an aggressive environment. Control measurements were carried out every 30 days for 180 days. Based on the results of the calculation of chemical resistance coefficients, the life cycle prediction of concrete structures was performed during their long-term exploitation under conditions of aggressive environments. The life cycle prediction was based on the determination of the reduction in the chemical resistance coefficient as follows:
l g k G R = a + b × l g τ a = l g τ k G R ¯ b × l g τ b = ( l g k G R i ¯ l g k G R i ) × ( l g τ i ¯ l g τ i ) ( l g τ i ¯ l g τ i ) 2 ,
where k G R —chemical resistance coefficient calculated by potentization; l g k G R ¯ = k R G i ¯ n —average values of the logarithm of the chemical resistance coefficient; l g τ ¯ = τ i ¯ n —average values of the logarithm of test times; l g k G R i and l g τ i —logarithms of chemical resistance coefficients and test times in the i-th series of samples corresponding to intermediate (control) test periods; n —number of control tests.

3. Results and Discussion

3.1. Preliminary Research

3.1.1. Modeling of Spatial Packing

The results of the calculation for modeling the packaging of the considered systems of dispersed powders are shown in Figure 2. In the figure, point A corresponds to the position of the composition at which the distribution of particles of a certain proportion reaches the maximum value of compaction. Point B corresponds to the position of the optimal composition, from the point of view of labor costs for its production. The X axis shows the percentage of particles F1, and the Y and Z axes show F2 and F3, respectively. Due to the very large variation in compositions, it is not possible to provide the simulation results for all compositions; therefore, Table 8 shows selected results of composition packing, namely: boundary compositions 100/0/0, 0/100/0, 0/0/100, as well as intermediate compositions (increments of 20%) to demonstrate the dynamics of change in the spatial packing of particles.
According to the simulation results, the packing density of the variable compositions lies in the range from 0.555398 to 0.620393. The smallest packing density corresponds to the composition 100/0/0 (F1/F2/F3), and the largest to the composition 60/20/20. Since producing highly dispersed F3 particles is an energy-intensive procedure, the criterion for selecting the optimal composition was to determine the one with the lowest content of F3 fractions, while ensuring its spatial density does not differ much from the maximum. Looking ahead, the optimal solution, which shows positive dynamics in improving the physical and mechanical properties of SCC, was a composition with the following ratio: 15%—with an average diameter dcp = 12 µm, fraction 1500 cm2/g; 75% with an average diameter dcp = 6.6 µm, fraction 3000 cm2/g; 10% with an average diameter dcp = 4.9 µm, fraction 4500 cm2/g. The density of the optimal composition (hereinafter referred to as the proposed composition) 15/75/10 is 0.591131. Thus, the reduction in the packing density of the proposed composition from the maximum packing density, which corresponds to the composition 60/20/20, is only 5%.

3.1.2. Determination of Compressive Strength

Based on the above, a selection of compositions with the best packing indices at a low content of fractions F3 < 15% was made, for which compressive strength studies were conducted: 15/80/5, 15/75/10, and 15/70/15. Additionally, to assess the effect of changes in the polyfractional composition of the cement on the strength of the SCC, the boundary compositions were selected: 100/0/0, 0/100/0, and 0/0/100. Furthermore, for comparison and to understand the dynamics of strength changes, two-component compositions with variable contents of F1 and F2 or F2 and F3 were selected. The results of the strength measurements are presented in Table 9.
According to the results, the best compressive strength indicators were found in samples with a three-component composition and variable content of F1, F2, and F3, where the strength increases by 25–29% relative to the reference sample. In two-component composition samples with variable contents of F1 and F2, the strengths ranged from 17% to 25%, compared to the reference sample. It should also be noted that the rate of strength gain increases with the content of fine fraction particles. Strength gains at 7 days of age, relative to 28 days, range from 67% for the 100/0/0 composition to 77% for the 0/0/100 composition. For the reference sample, this figure is 72%, and for fractions with a 15% content of F3, it varies from 74% to 75%. Based on the dynamics of strength change, one can observe the influence of particle packing on strength, as the strength of the 0/0/100 composition (51.0 MPa), which should demonstrate the best cement activity due to the larger surface area of the particles, is less than the strength of the 15/70/15 composition (53.3 MPa). For further studies on the effect of polyfractional cement on the physical and mechanical characteristics of concrete, boundary samples (No. 2–4) were excluded, along with samples of two-component composition that had a negative or minimal effect on strength (No. 5–7).
Thus, the sample compositions presented in Table 10 were selected for the main research.
Samples of type 2–4 are made based on a two-component binder (hereinafter referred to as a two-component composition), and samples of type 5–7 are made based on a three-component binder (hereinafter referred to as a three-component composition).

3.2. Main Research

3.2.1. X-Ray Phase Analysis

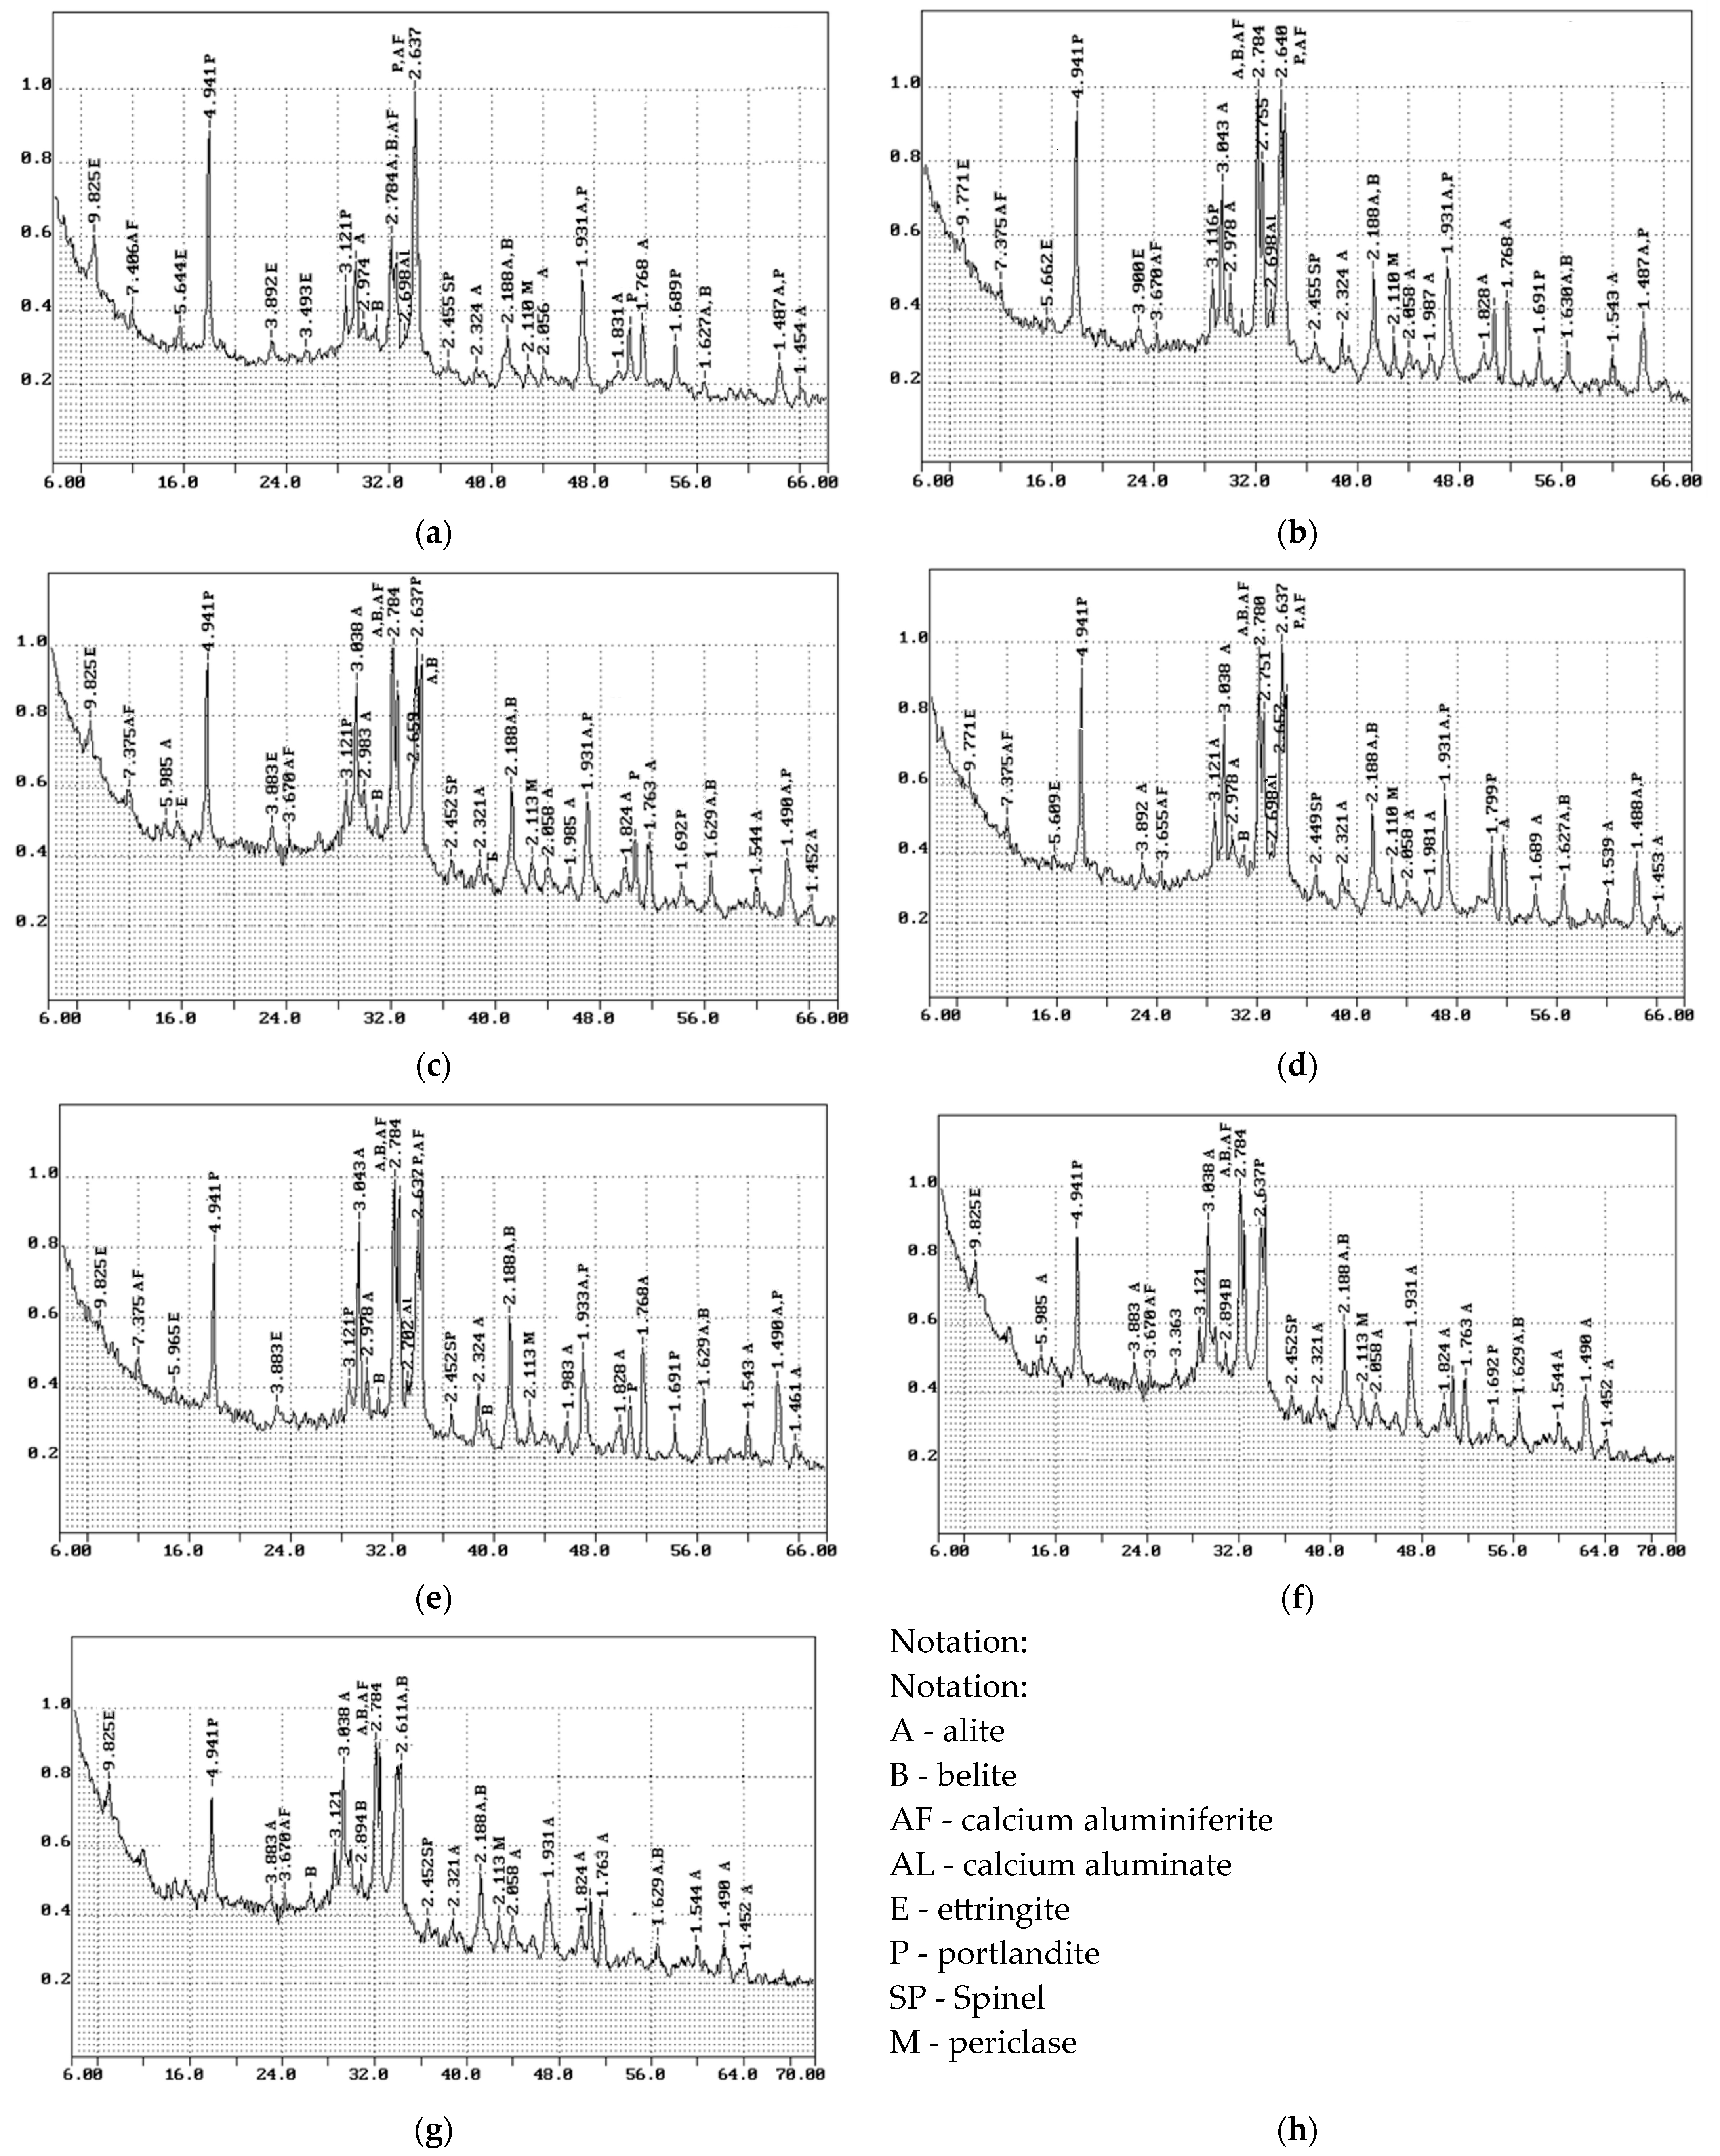
The X-ray phase analysis (XPA) method was used to study the phase composition of the polyfractional binder and to determine the degree of its hydration. Figure 3 presents the X-ray phase analysis of hydrated samples of cement stone and polydisperse binder after 28 days of normal hardening. Figure 3a–g display the results of the X-ray phase analysis of samples from types 1–7, while Figure 3h illustrates the diagram notation.
Table 11 shows the phase composition of the investigated cement stone and polydisperse binder samples at the age of 28 days of normal curing, calculated based on the obtained data.
The results of X-ray phase analysis showed that in the compositions of samples of type 5, 6, and 7 of polydisperse binder, the degree of hydration decreased from 71 to 61%, respectively. The decrease in the degree of hydration is explained by the presence of large binder grains that are not fully hydrated (fraction 1500 cm2/g), which form a reserve of clinker stock. The significant amount of unreacted alite and belite minerals (i.e., the clinker stock) is explained by the low reactivity of large (up to 100 µm) cement particles, which are covered with a shell of new formations that slow down further hydration. The clinker stock in a polydisperse binder (the stock of coarsely dispersed particles is a fraction of 1500 cm2/g) should theoretically increase the durability of concrete made on its basis in the future [27].
In the absence of a large fraction of 1500 cm2/g in the polydisperse binder (compositions of samples of types 2, 3 and 4), a decrease in the amount of clinker mineral C2S to 20% and an increase of up to 10% in the degree of hydration were observed in comparison with the reference sample. This effect is explained by the absence of a large fraction of 1500 cm2/g and the higher reactivity of the fine fraction of 4500 cm2/g, which accelerates the hydration of the binder; this leads to a higher degree of hydration in the early stages and, consequently, higher compressive strength [27]. The latter was confirmed by the results of the preliminary stage of the strength study (Table 9). This is due to the formation of a denser phase C–S–H, containing a smaller amount of water, and as a consequence, a decrease in the amount of portlandite Ca(OH)2, as well as the formation of a smaller amount of ettringite. In the composition of the polydisperse binder, an increase in the content of the amorphous phase is recorded compared to the control sample of hydrated cement. This effect causes the presence in the composition of the polydisperse binder of an increased amount of non-crystallized new formations, represented by ortho- and diorthohydrosilicates. These compounds, in turn, at later stages of hydration are transformed into crystalline hydrosilicates of the tobermorite series, such as (tobermorite, xonotlite, foshagite, etc.). The data obtained are consistent with reference data and the results of previous scientific works [27,28].

3.2.2. Compressive and Bending Strength Tests

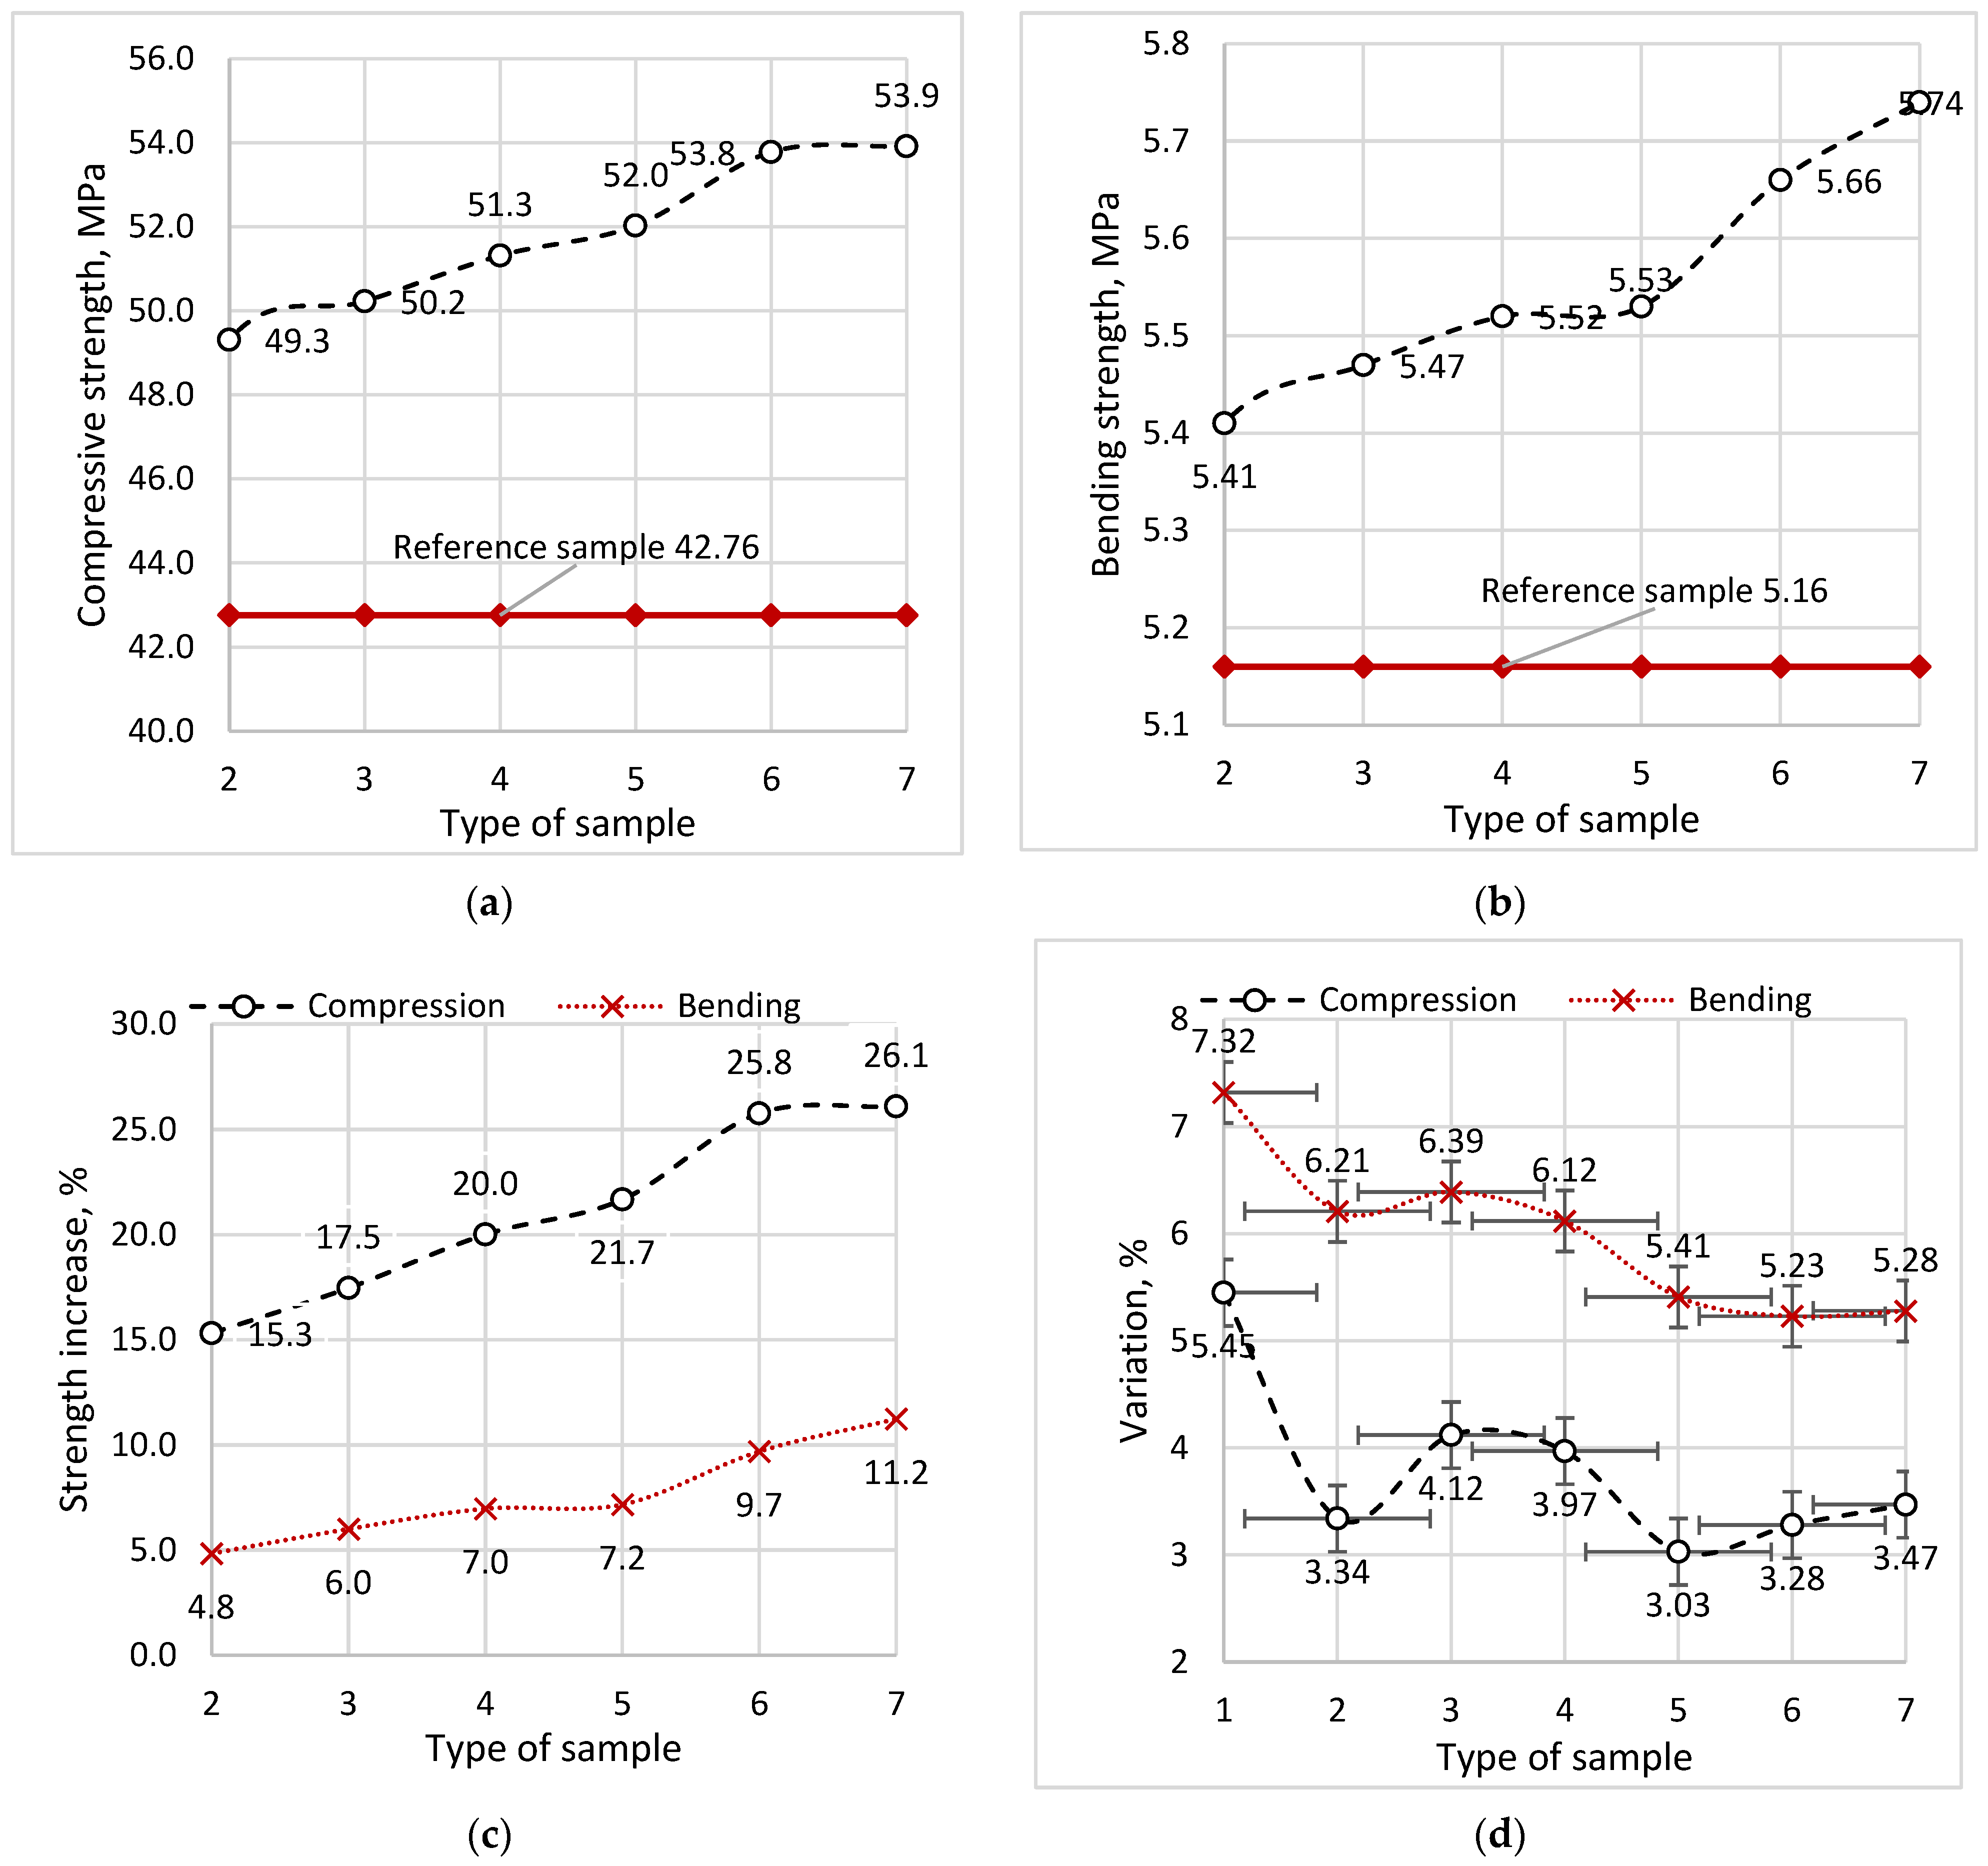
Unlike the preliminary study, which conducted strength tests on three specimens, the main study performed tests on eight specimens to achieve a statistical indicator. Figure 4a presents the results of the compressive strength tests, while Figure 4b displays the results of the bending strength tests. Figure 4c illustrates the percentage increase in strength of samples with polyfractional cements compared to the reference sample. Figure 4d presents the coefficients of variation in the data points, characterizing the reliability of the results obtained.
According to the test results, an increase in compressive and bending strength is observed in all SCC compositions (Types 2–7) using a polydisperse binder. Depending on the composition, the compressive strength varies from 49.31 to 53.92 MPa, while the strength of the reference sample is 42.76 MPa. In percentage terms, the strength increases by 15.3 to 21.7%. The bending strength varies from 5.41 to 5.74 MPa, and the strength of the reference sample is 5.16 MPa. In percentage terms, the increase ranges from 4.8 to 11.2%. The increase in strength characteristics can be explained primarily by a rise in the packing density of binder particles from 0.564399 (type 1) to 0.593257 (Type 7) and a decrease in the content of ettringite Ca3Al2O6·3CaSO4·31H2O and portlandite Ca(OH)2 in the composition of the polydisperse binder, which is consistent with the results of [27]. The use of a polydisperse binder promotes more intensive hydrolysis and hydration processes of cement particles in additionally formed crystallization zones. This fact is confirmed by data obtained during a study using the X-ray phase analysis method of cement stone [29].
When using three-component compositions (Types 5–7), a slight increase in compressive strength by 5–6% and in bending by 3–4% is observed in relation to two-component compositions (Types 2–4), which, apparently, is in direct dependence on the packing density of the polydisperse binder and, accordingly, a decrease in the micropores of the cement stone. The results obtained are also consistent with the results of [30].
If we consider the dynamics of the change in the strength of samples with three levels of dispersion (Types 5–7), we can observe a decrease in the intensity of the increase in strength from an increase in the content of particles of the smallest fraction F3. If the strength of Type 6 samples in relation to Type 5 samples increase by 3.48% (under compression) and by 2.35% (under bending), then the strength of Type 7 samples in relation to Type 6 samples increase by 0.26% (under compression) and by 1.41% (under bending).
The coefficients of variation in the datapoints in compression tests vary from 3.03 to 5.45%, and in bending from 5.23 to 7.32%. In both cases, the maximum scatter of datapoints is observed in the reference sample tests. The latter is understandable, since samples of types 2–7 have a more ordered structure of fractions, in contrast to samples of type 1, in which sintering of particles or statistical error in the size of fractions in a batch may occur. In any case, the obtained variation coefficients are within the acceptable value sand do not exceed 13.5% [31], which indicates a high degree of reliability of the obtained strength results suitable for analysis. Returning to the comparison of the dynamics of changes in the strength of samples with three levels of dispersion (Types 5–7), it can be noted that changes in the compressive strength of type 6 samples in relation to type 5 can be attributed to the influence of the composition, and changes in the strength of type 7 samples to type 6 to statistical error, since the coefficient of variation in the type 7 samples exceeds this increase 3.47 > 0.28% (in compression) and 5.28 > 1.41% (in bending). The latter may indicate the optimal efficiency of the composition of Type 6, the density of which is close to the density of the sample of Type 7, which corresponds to the maximum packing density.

3.2.3. Freeze–Thaw Resistance Tests

The test results are summarized in Table 12, which shows the weight and strength losses of the specimens depending on the number of freezing and thawing cycles. In Figure 5, the ordinate scale displays the freeze–thaw-resistance levels (according to the classification [22]) corresponding to each type of specimen on the abscissa scale. The auxiliary ordinate scale presents the coefficients of variation in the datapoints relating to the freeze–thaw resistance levels. Figure 5a illustrates the freeze–thaw resistance levels for weight loss, while Figure 5b presents those for strength loss.
According to the results of the tests, the data on the serviceability of SCC under conditions of cyclic freezing and thawing were obtained. According to the requirements [22], the maximum permissible weight loss is not more than 2%, and the strength loss is not more than 15%. The reference samples were the most susceptible to frost damage; the maximum life cycle, with respect to weight loss, did not exceed 300 cycles; when the weight loss was 2.12%. The life cycle with respect to strength loss did not exceed 350 cycles, at which point, the strength reduction was 18%. The maximum values of weight loss of those samples of two-component composition (Type 2–4) were achieved at 400 cycles, and were from 2.0 to 2.02%, and the maximum values of strength loss at 600 cycles reached a critical value of 15%. The best results were shown by samples with a three-component composition (Type 5–7), where the maximum weight loss observed at 500 cycles ranged from 2.63 to 2.66%. The loss of strength of samples of Type 5–7 did not reach the limit value even after 600 cycles of freezing and thawing (only 9–10%), which confirms the sufficient reserve of strength and freeze–thaw resistance of the SCC compositions with three-fraction binder, and also shows the positive role of additional clinker stock in cement stone (stock of coarse particles—fraction 1500 cm2/g) contributing to the durability of concrete, by self-healing the defects in the structure [32].
According to the diagram in Figure 5a, the freeze–thaw resistance levels by weight loss are shown for the reference sample F200, for two-component compositions F350, for three-component F400. Freeze–thaw resistance levels by strength loss (Figure 5b) are for the reference sample F350, for two-component compositions F500, for three-component F600. Thus, a two-fold superiority of the three-component composition over the reference sample is observed. According to the statistical evaluation of the datapoints, it can be concluded that the obtained results have a high degree of reliability, the coefficients of variation do not exceed 7.12% for weight loss and 8.16% for strength loss. As in the case of strength evaluation, the maximum variation in datapoints is observed for the reference sample, which once again confirms the better structuring of polyfractional compositions.

3.2.4. Water Absorption Tests

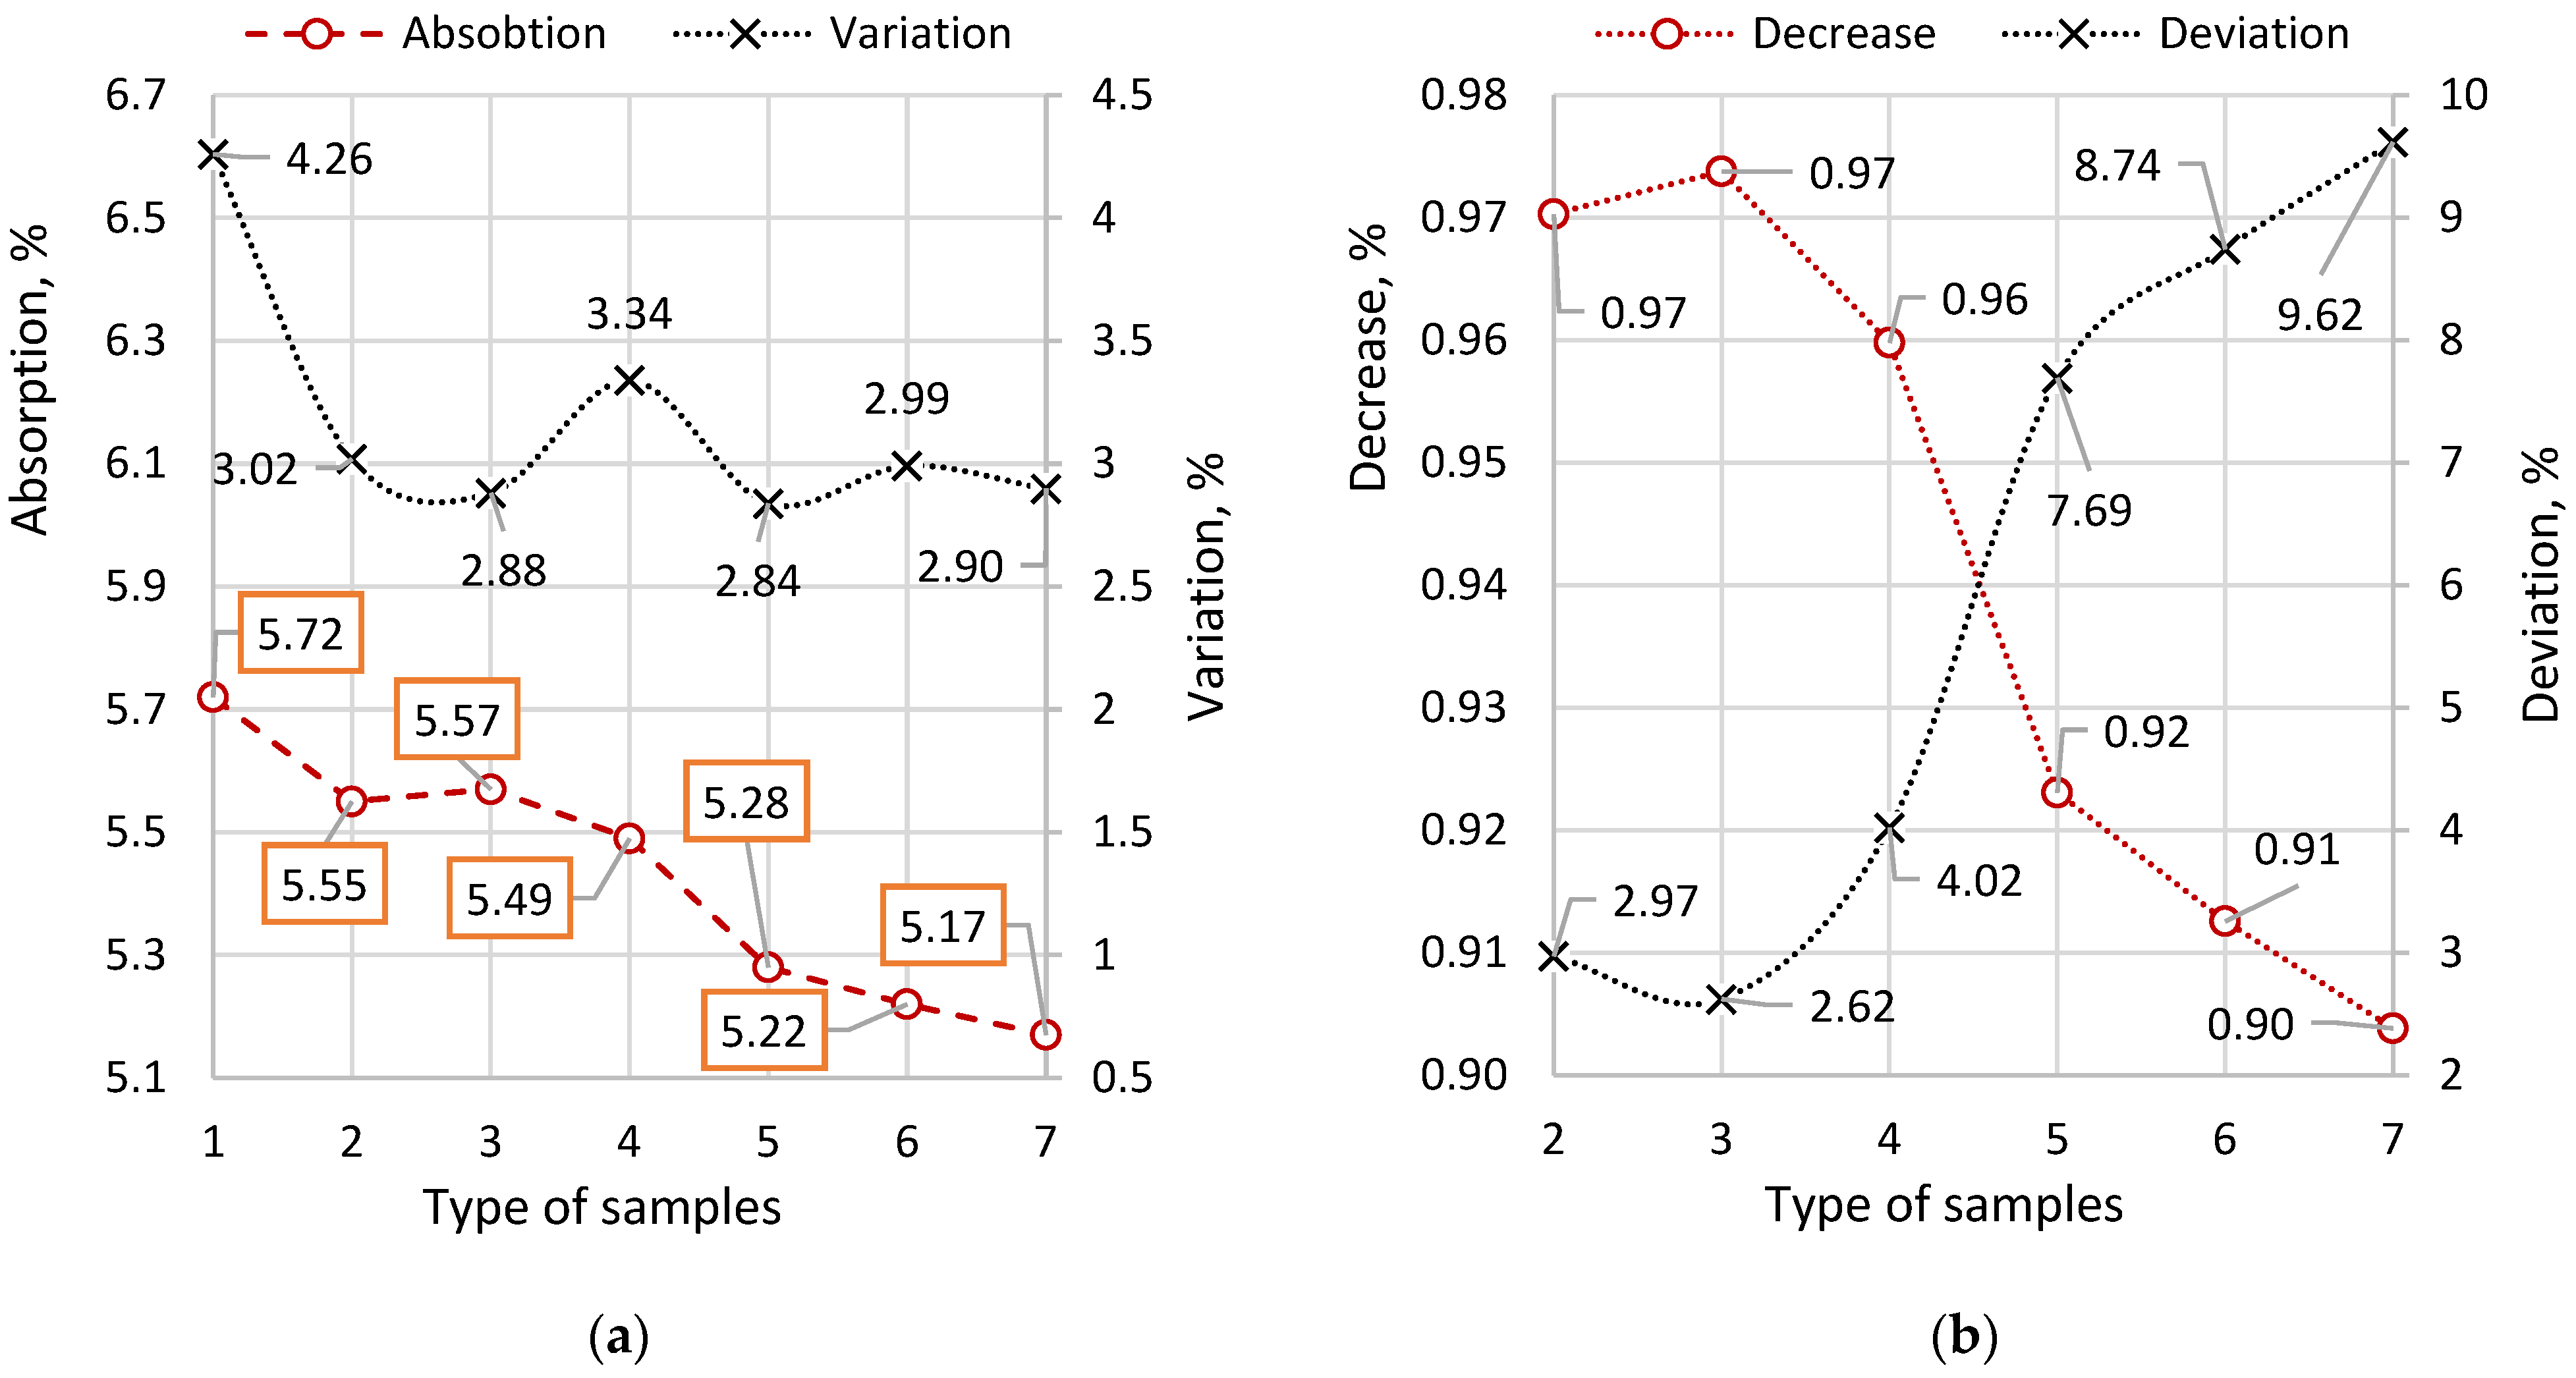
The test results are presented in Figure 6. Figure 6a shows the average water absorption values of the compared sample types and their corresponding coefficients of variation. Figure 6b shows the decreases in water absorption values relative to the reference sample, as well as percentage deviations.
According to the test results, the highest water absorption value was found in the reference samples, averaging 5.72%. Further, as the packing density increases, there is a decrease in the water absorption index. The decrease in water absorption, depending on the type of polyfractional binder, varies from 2.97 to 9.62%. In reference samples, the coefficient of variation (4.26%) covers the range of obtained average values of Type 2 and 3 samples. Therefore, the appreciable effect of the polyfractional binder regarding statistical error is observed in sample Types 4–7, whose values of average water absorption reductions exceed the probable statistical error datapoints of reference samples. However, it should be noted that the decrease is partly sensitive to the mean statistical error, since the coefficient of variation in the spread of the mean values of all sample types is 3.80%, which correlates well with the coefficients of variation in the context of each specific sample type (Figure 7a, auxiliary ordinate axis). In any case, there is a tendency for water absorption capacity to decrease with packing density, although it is not significant. We would also like to note the decrease in the coefficients of variation in Type 2–7 samples, which once again confirms the stability of the structure of SCC on fractional binder in relation to reference samples.

3.2.5. Water Permeability Tests

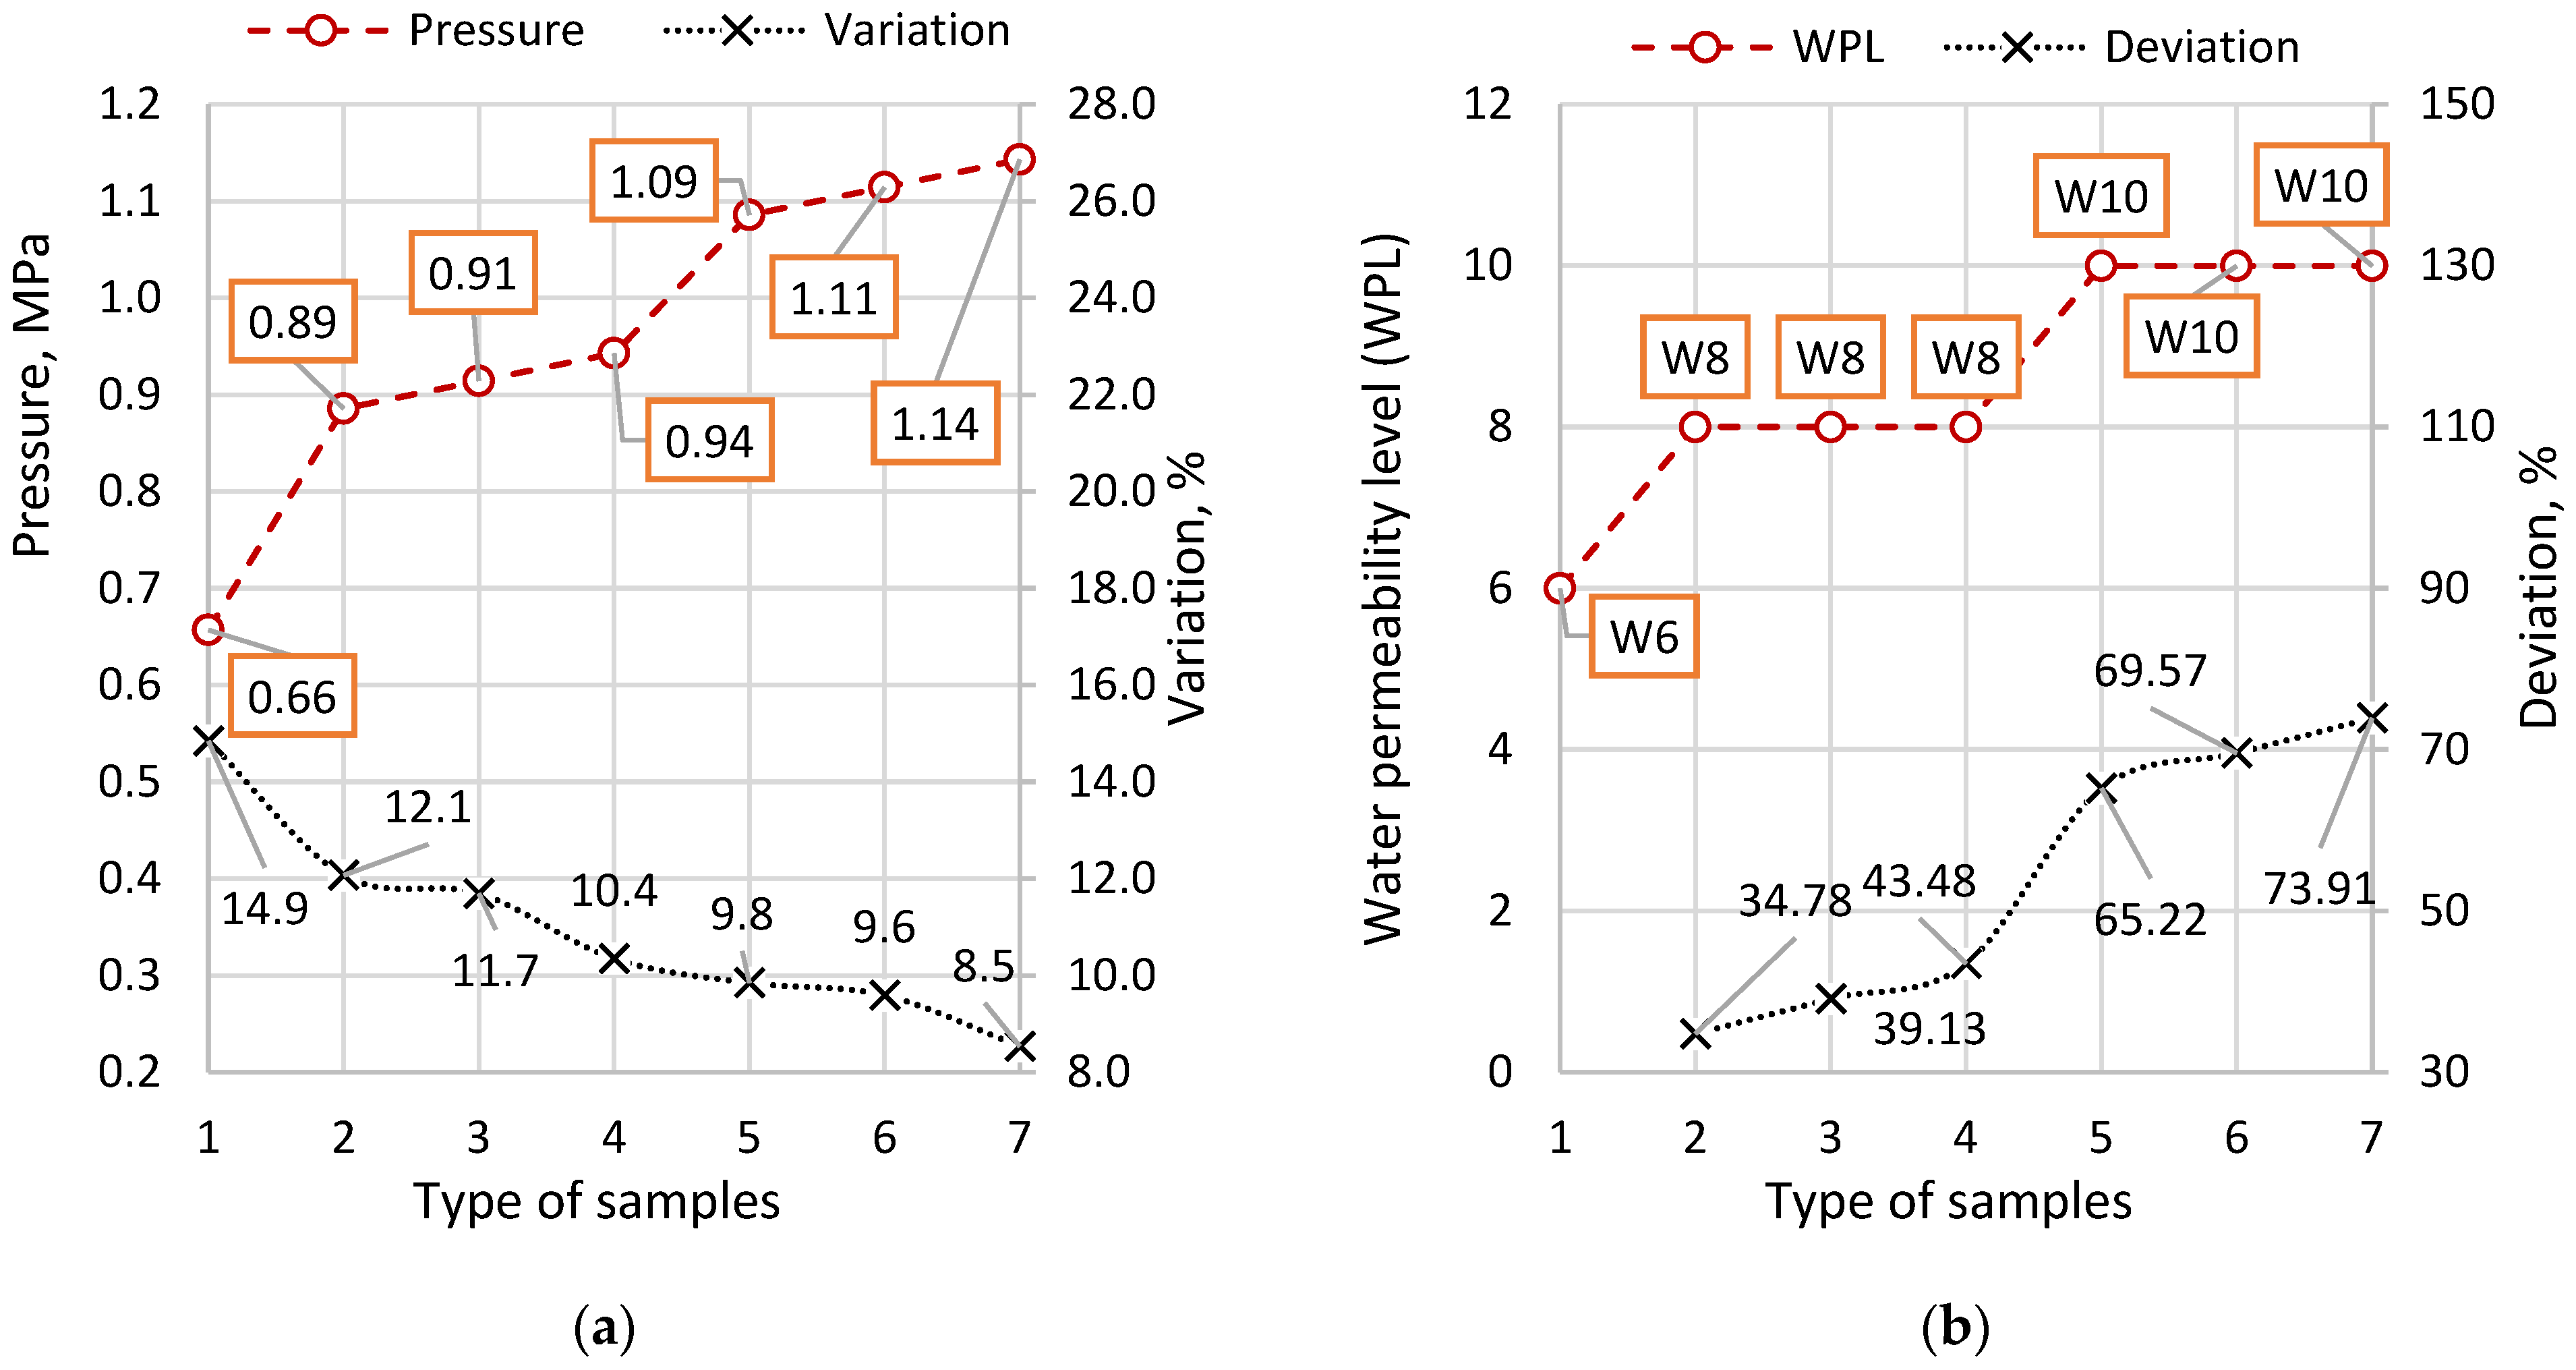
The results of the tests are presented in Figure 8. Figure 8a shows the results of the water pressures at which the signs of wet spotting on the opposite side of the test samples were detected, as well as the coefficients of variation corresponding to each sample type. Figure 8b shows the normalized water permeability levels corresponding to the maximum pressure at which complete water penetration occurred, as well as the deviations in the pressure values from the reference sample [23].
According to the test results, the average maximum water pressure for the reference sample varied from 0.6 to 0.8 MPa, for which the variation coefficient was 14.9%. When including the two-component binder, Types 2–4), the pressure increased from 35 to 44% of the reference sample. The average values of the maximum pressure were 0.89, 0.91 and 0.94 MPa, and the corresponding variation coefficients were 12.1, 11.7 and 10.4%. A significant increase in pressures, compared to the reference sample, was observed in samples with a three-component binder (Types 5–7), amounting to 65 to 74%. The values of the average maximum pressures were 1.09, 1.11 and 1.14, and the corresponding variation coefficients were 9.8, 9.6 and 8.5%. Unlike water absorption, packing density plays a significant role in improving water permeability: if, for the reference sample water permeability level was W6, then for samples with a two-component binder it was W8, which corresponds to a filtration coefficient in the range from 6 × 10⁻¹⁰ to 1 × 10⁻¹⁰ cm/s; for samples with a three-component binder, the water permeability level reached W10, which corresponds to a filtration coefficient in the range from 1 ×10⁻¹⁰ to 5 × 10⁻¹¹ cm/s. The variation coefficients also showed a tendency to reduce the statistical deviations of more stable polyfractional compositions.

3.2.6. Chemical Resistance Tests

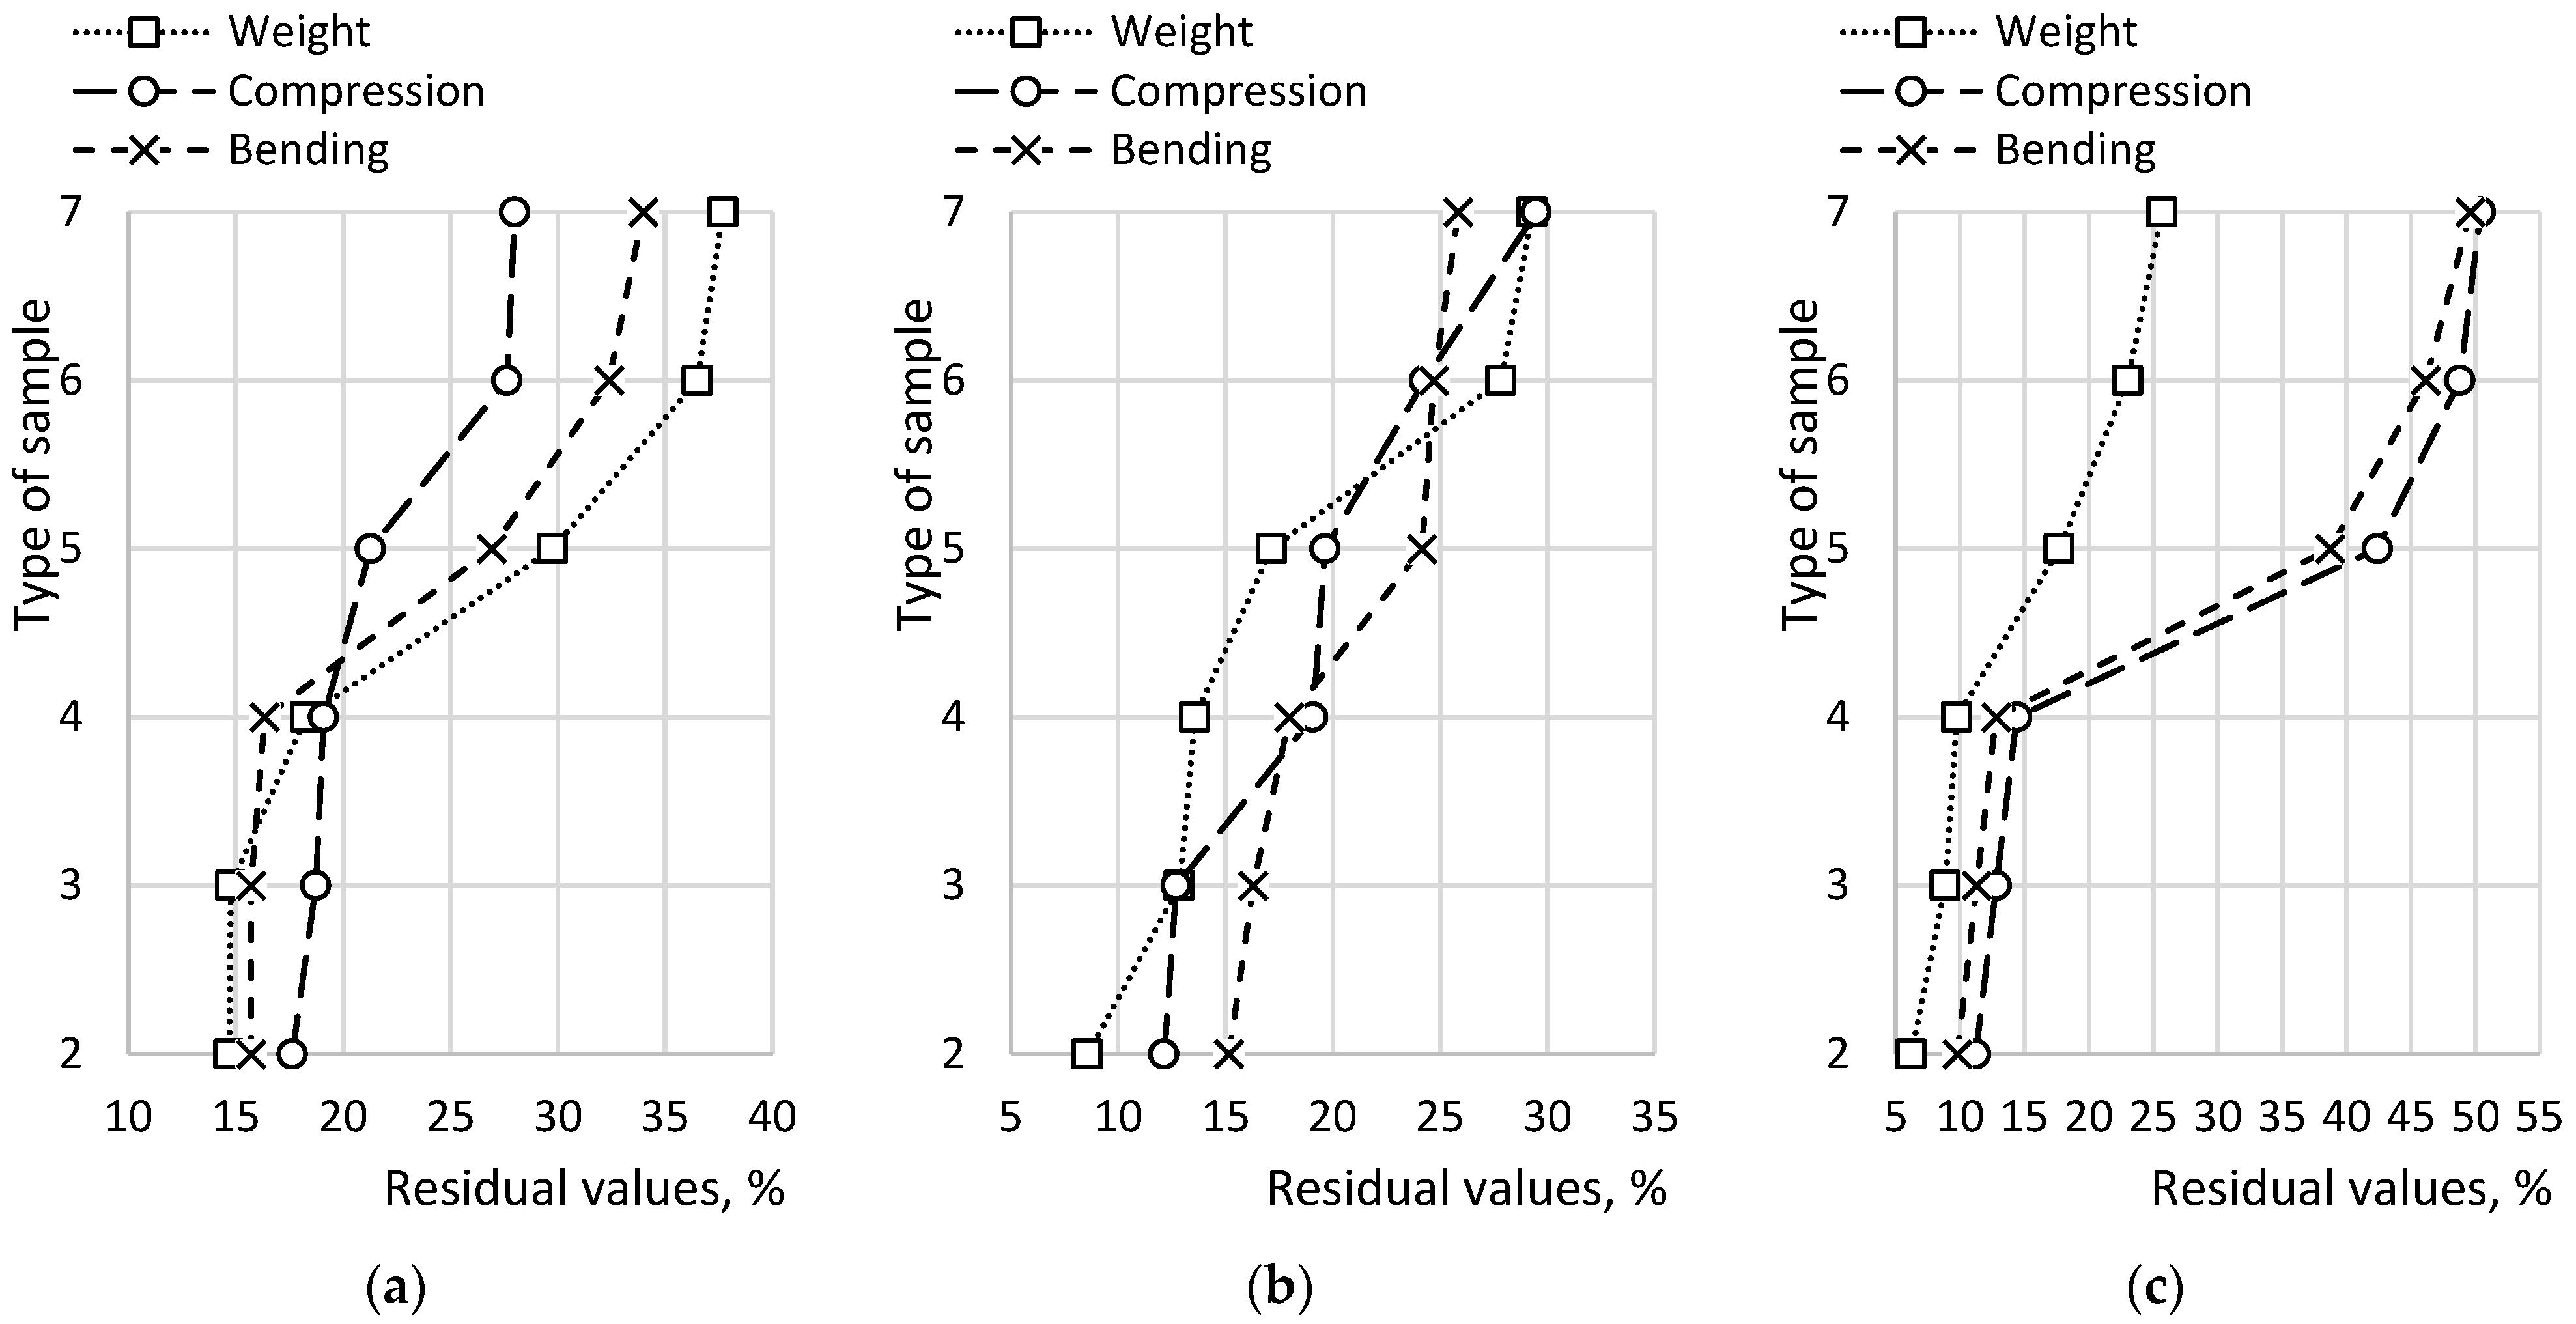
The test results are presented in Table 13. The table shows the values of average maximum weight loss, the loss of compressive and bending strength, after maintaining the samples in aggressive environments (NaCl, HCl, and Na2SO4) for 180 days, along with their corresponding coefficients of variation.
The basic evaluation criterion, from the point of view of designing building structures, is strength. To visualize the effect of a polyfractional binder on the strength of concrete, Figure 6 shows the percentage ratio of the residual strengths of each type of sample (Types 2–7) in relation to the reference sample. Figure 9a shows the results when holding samples in a NaCl environment, Figure 9b in an HCl environment, and Figure 9c in Na2SO4.
The results of the study on the resistance of concrete samples to aggressive environments, in terms of changes in average weight, bending strength, and compressive strength, indicate that Type 2–4 samples, based on a two-component binder, demonstrated higher chemical resistance compared to the reference samples. When maintained in a 3% NaCl solution, the residual weight and strength of these samples were significantly higher than those of the reference samples: the weight varied from 14.7 to 18.3%; compressive strength ranged from 17.6 to 19.1%; and bending strength fluctuated from 15.7 to 16.3%. However, these parameters are worse (i.e., higher) than those of the three-component compositions of Types 5–7, relative to the reference samples: the mass varied from 29.8 to 37.7%; compressive strength ranged from 21.3 to 28.0%; and flexural strength varied from 26.9 to 34.0%. The lower values of chemical resistance observed in Type 2–7 compositions can likely be explained by the fact that the finely dispersed fraction of 4500 cm2/g, while promoting the hydration of the binder and leading to higher compressive strength at early stages of hardening, does not reduce the amount of free portlandite Ca(OH)2—a mineral in cement stone that facilitates corrosion processes.
When the samples were maintained in a solution of hydrochloric acid (HCl), the following changes in weight and strength parameters were observed in the two-component composition samples relative to the reference sample: the weight varied from 8.6 to 13.6%; compressive strength ranged from 12.1 to 19.1%; bending strength fluctuated from 15.2 to 18.0%. For the three-component samples, these same parameters comprised a weight range from 17.1 to 29.3%; compressive strength from 19.7 to 29.5%; flexural strength from 24.2 to 25.8%.
When the samples were maintained in Na2SO4 a sodium sulfate environment, the following changes in weight and strength parameters were observed for the samples of two-component composition relative to the reference samples: mass varied from 6.2 to 9.7%; compressive strength varied from 11.2 to 14.4%; flexural strength varied from 9.8 to 12.8%. For the three-component samples, the same parameters showed a variance in mass from 17.7 to 25.7%; compressive strength from 42.4 to 50.4%; flexural strength from 38.7 to 49.6%.
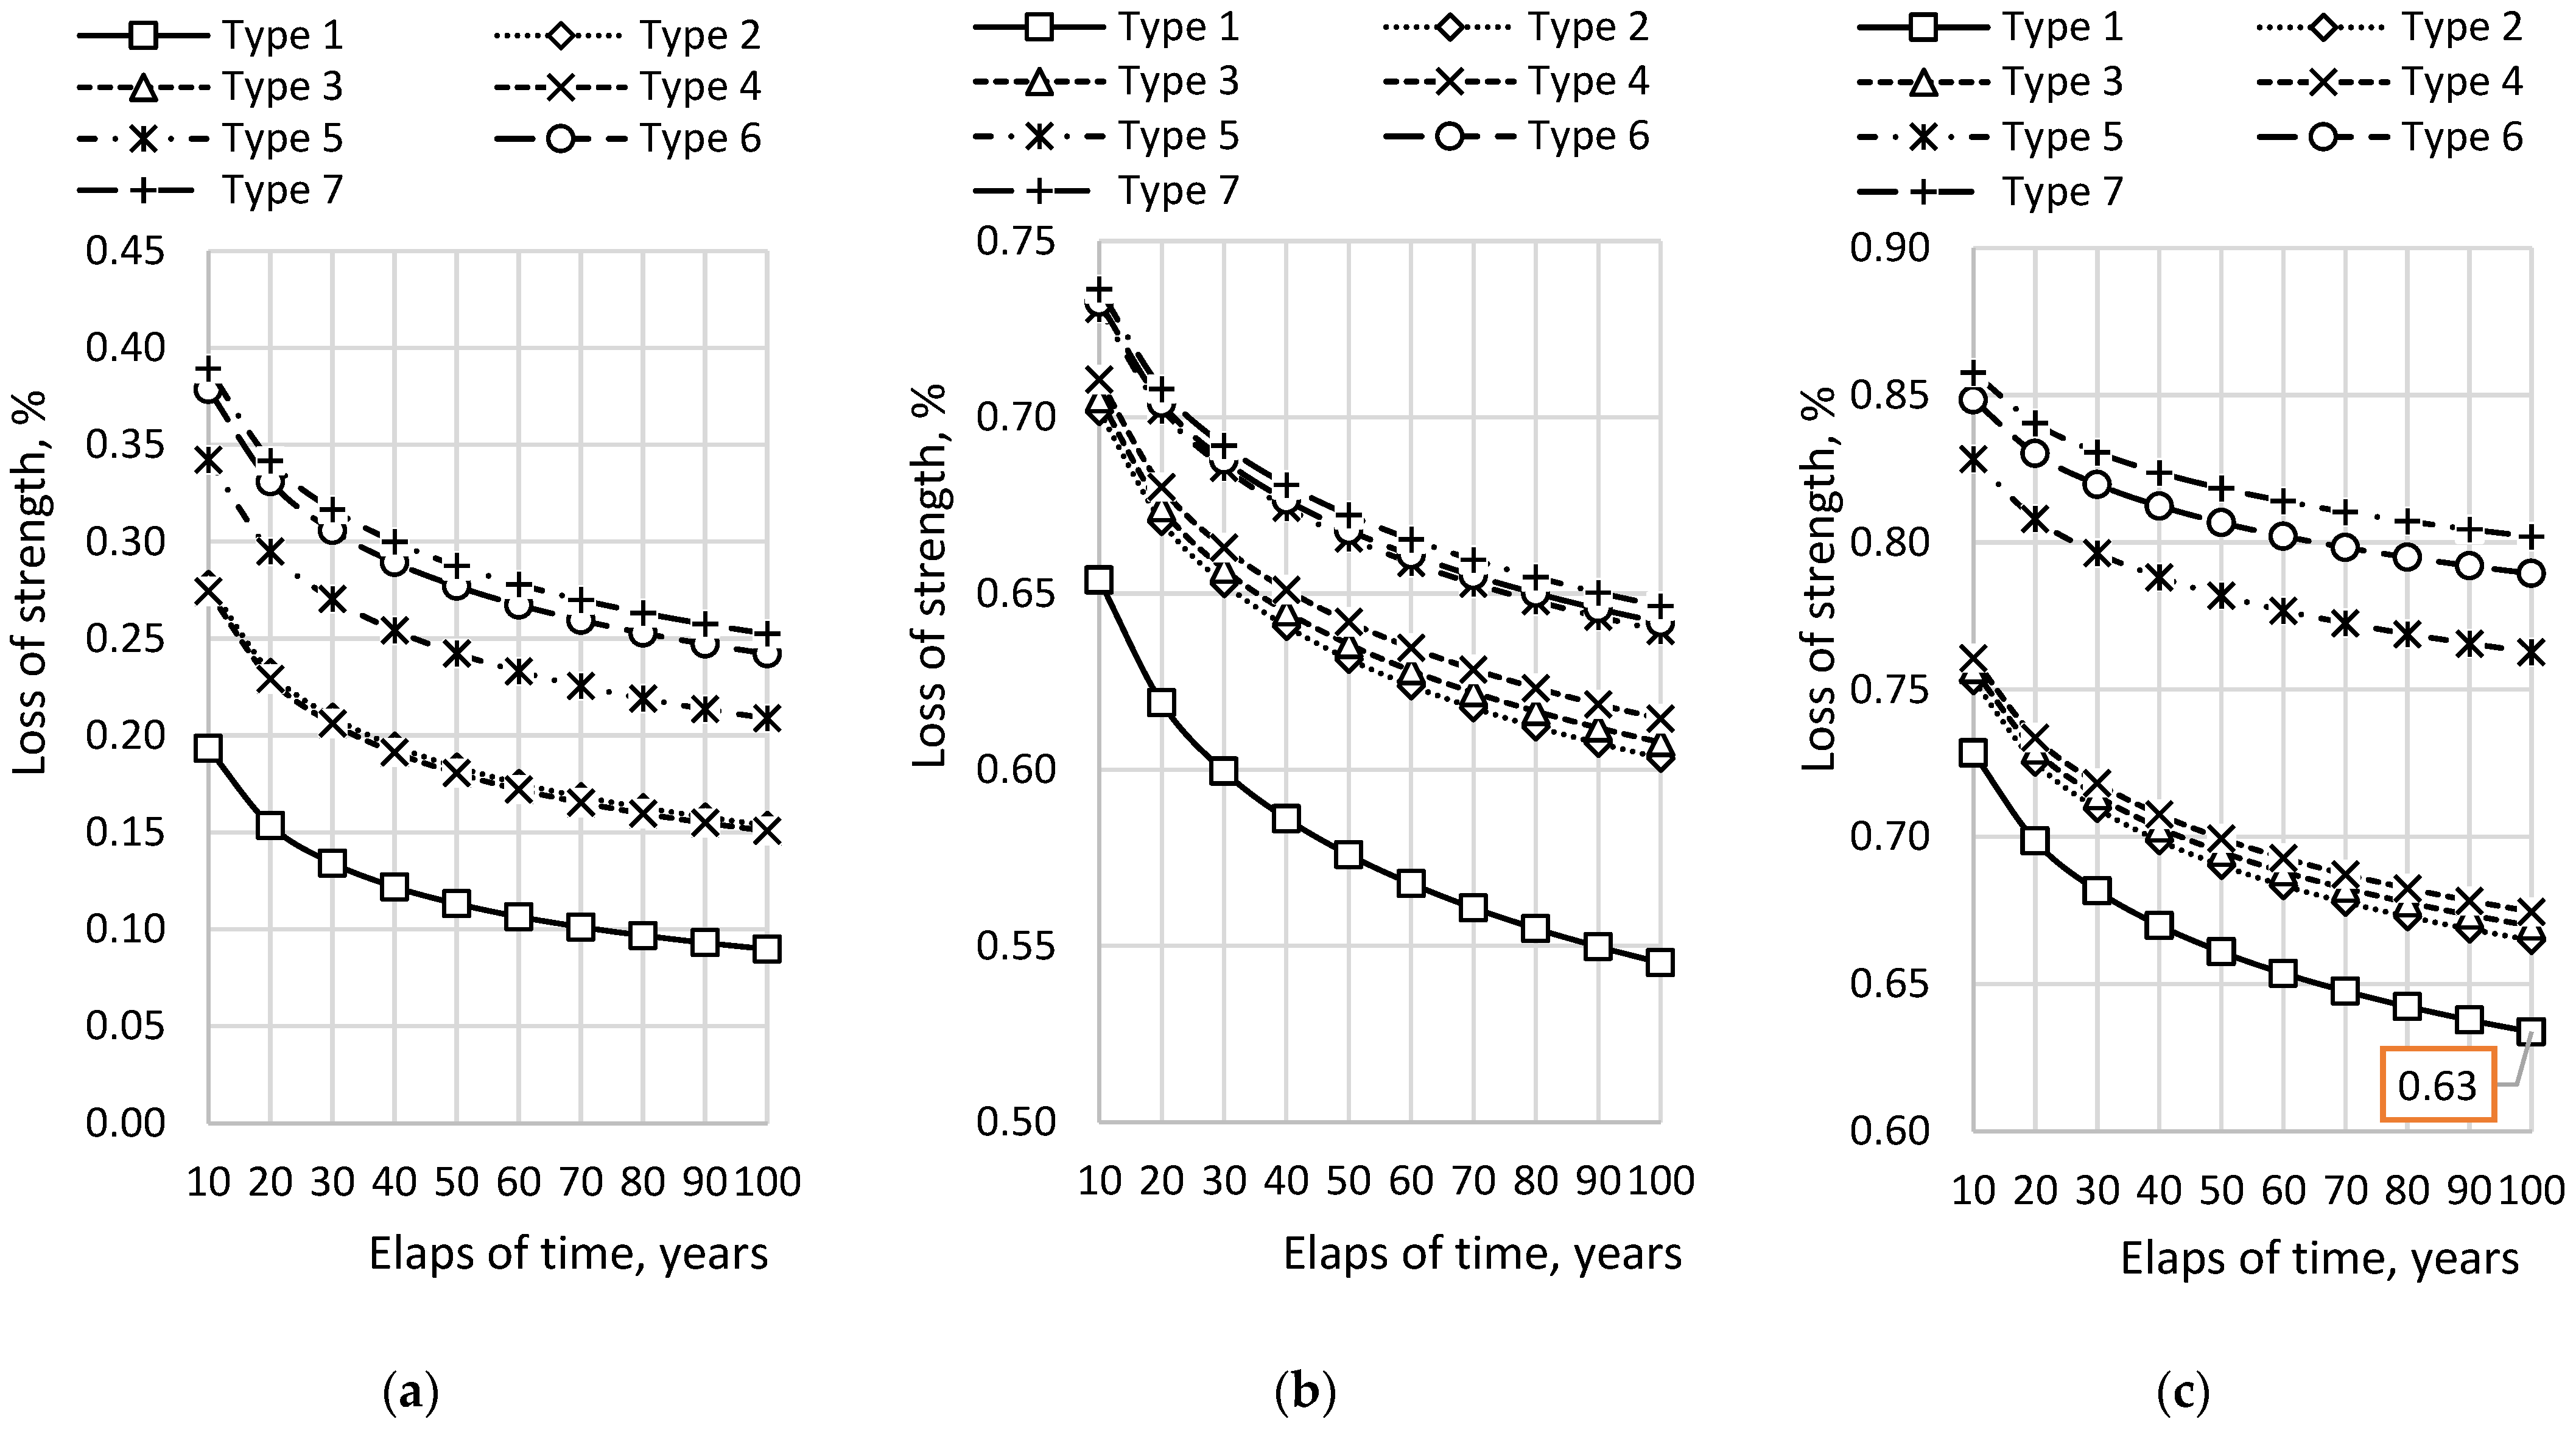
Figure 8 shows the results of strength loss prediction during long-term exploitation of concrete structures in aggressive environments. Prediction calculations were performed according to GOST 58896, based on potentiation of chemical resistance coefficients changing as the samples are maintained in aggressive environments [24]. Figure 9a shows the results when the samples are maintained in NaCl, Figure 9b in HCl, and Figure 9c in Na2SO4.
Example of calculating loss of strength on Type 1 specimens: l g τ i = 11.72 , l g k G R i = 0.244 ;   l g τ i ¯ = 1.95 ;   l g k G R i ¯ = 0.041 ;   ( l g k G R i ¯ l g k G R i ) × ( l g τ i ¯ l g τ i ) = 0.025 ;   ( l g τ i ¯ l g τ i ) 2 = 0.41 ;   ( l g k G R i ¯ l g k G R i ) × ( l g τ i ¯ l g τ i ) = 0.025 ;   ( l g τ i ¯ l g τ i ) 2 = 0.41 ;   b = ( l g k G R i ¯ l g k G R i ) × ( l g τ i ¯ l g τ i ) ( l g τ i ¯ l g τ i ) 2 = 0.060 ; a = l g k G R i ¯ b · l g τ i ¯ = 0.078 ; Then the equation has the form l g k C R = 0.0775 0.06 l g τ ; For a duration of 100 years τ i = 36000 d a y s : l g k C R = 0.0775 0.06 l g 3600 = 0.0775 0.06 × 4.56 = 0.198 ; Then k C R = 0.63 (Loss of strength = 63%), See datapoint on Figure 8c.
According to the prediction results, during a 100-year period of concrete exploitation, the strength of concrete based on general construction concrete cement (reference sample) decreases depending on the type of aggressive environment: by 91% in a NaCl environment, by 45% in an HCl environment, and by 37% in a Na2SO4 environment. For two-component compositions, the residual strength at the end of 100 years, as a percentage of the reference sample, averages 69% in a NaCl environment, 12% in an HCl environment, and 6% in a Na2SO4 environment. For three-component compositions, the same values average 161% in NaCl environment conditions, 18% in HCl environment conditions, and 24% in Na2SO4 environment conditions.
According to the results of tests, it is evident that the compositions of SCC based on polydisperse binder have increased chemical resistance compared to reference samples. At the same time, three-component compositions have superiority in chemical resistance over two-component compositions. The obtained test results confirm the fact of increasing pozzolanic activity of three-component compositions on polydisperse binder to free Ca(OH)2 is due to the presence of non-hydrated clinker stock grains of a large fraction (1500 cm2/g) and a reduced content of portlandite, which aligns with the results of [33,34].

3.2.7. Summary of Research Data

Table 14 presents the summary results of the studies, on the basis of which it is possible to compare and determine the optimal technological solution for the polyfractional composition of the binder in the SCC.
According to the summary table, all evaluation criteria demonstrate a similar tendency to improve evaluation parameters, depending on the packing density of the polyfractional binder. Meanwhile, samples using a three-component binder composition exhibited more effective transformation processes of the physical and mechanical characteristics of concrete, achieving more stable results (according to the assessment of variation coefficients) compared to samples using a two-component composition.
Effects of two-component compositions relative to the reference sample are as follows:
  • An increase in compressive strength of 15–20%;
  • An increase in bending strength of 5–7%;
  • An increase in freeze–thaw resistance of 43–75%;
  • A decrease in water absorption of 3–4%;
  • An increase in water permeability of 33%;
  • An increase in chemical resistance of 1.6–16.8% (depending on the environment).
Effects of three-component compositions relative to the reference sample are as follows:
  • An increase in compressive strength of 22–26%;
  • An increase in bending strength of 7–11%;
  • An increase in freeze–thaw resistance of 71–100%;
  • A decrease in water absorption of 8–10%;
  • An increase in water permeability of 67%;
  • An increase in chemical resistance of 5–30% (depending on the environment).
Regarding the optimal solution for polyfractional composition, the choice leans towards Type 6, with a fraction ratio of 15% of 1500 cm2/g, 75% of 3000 cm2/g, and 10% of 4500 cm2/g. This decision is justified by the fact that changes in the physical and mechanical parameters of Type 6 samples compared to Type 7 samples are insignificant, while the production cost of Type 7 composition relative to Type 6 is considerable. The changes in the physical and mechanical characteristics of Type 7 concrete compositions in comparison to Type 6 are as follows: an increase in compressive strength by 1.8%; an increase in bending strength by 1.4%; unchanged freeze–thaw resistance; a decrease in water absorption of less than 1%; unchanged water permeability; and an increase in chemical resistance of less than 1%. The validity of the influence of the Type 6 composition is confirmed by significant transformations in the physical and mechanical characteristics of the concrete compared to the reference sample, which are a 26% increase in compressive strength; a 10% increase in bending strength; a 100% increase in freeze–thaw resistance; a 100% decrease in water absorption; a 67% increase in water permeability; and a 29% increase in chemical resistance (NaCl), 5% (HCl), and 7% (Na2SO4).

4. Conclusions

Based on the modeling, experimental tests, and microstructural analysis, the following conclusions were drawn regarding the influence of the polyfractional binder composition on SCC properties:
  • The optimized three-component binder composition (15% F1, 75% F2, 10% F3) achieved the highest particle packing density (0.593) and improved compressive strength by up to 26% and bending strength by 10% when compared to the reference mix.
  • X-ray diffraction revealed that the presence of coarser particles (1500 cm2/g) slows hydration due to encapsulation, forming a clinker stock. This unhydrated reserve, combined with fine reactive fractions, reduces portlandite content by 18.8% and promotes long-term strength through continuous pozzolanic activity and denser C–S–H formation.
  • Three-component compositions showed superior chemical resistance in environments containing NaCl, HCl, and Na2SO4, achieving resistance levels that were 25–38% higher than the reference mix. This improvement was due to a denser matrix and reduced free Ca(OH)2, which helps limit ion ingress and leaching.
  • Resistance to cyclic freezing improved from F200 (reference) to F600 (Type 6). The clinker reserve contributed to microstructure recovery during freeze–thaw cycles. The improved freeze–thaw performance demonstrates the material’s suitability for infrastructure exposed to severe climatic conditions.
  • Water absorption decreased by 8.7% and permeability fell by as much as 94% compared to the reference, indicating significantly lower porosity and capillary continuity. This reduction in water transport properties directly contributes to enhanced resistance against chemical attack and long-term durability.
  • The Type 6 composition provides a well-rounded enhancement in mechanical performance, durability, and production feasibility. Its application is particularly promising for precast elements and monolithic structures in chemically aggressive or variable environments.
These findings highlight the potential of polyfractional binder optimization as a practical and effective strategy for enhancing the performance and durability of SCC. The proposed approach can be implemented in the development of high-performance concretes for aggressive environmental conditions, ensuring long-term structural reliability.

Author Contributions

Conceptualization, D.A.A. and R.E.L.; methodology, and R.E.L.; software, D.S.D.; validation, T.M., D.A.A. and A.K.T.; formal analysis, D.A.A.; investigation, T.M. and R.E.L.; resources, E.I.K. and Z.O.Z.; data curation, T.M.; writing—original draft preparation, R.E.L. and D.A.A.; writing—review and editing, D.A.A. and A.K.T.; visualization, D.S.D.; supervision, M.M.B.; project administration, Z.O.Z. and M.M.B.; funding acquisition, E.I.K. and Z.O.Z. All authors have read and agreed to the published version of the manuscript.

Funding

This research is funded by the Committee of Science of the Ministry of Science and Higher Education of the Republic of Kazakhstan (Grant No. BR21882292—“Integrated development of sustainable construction industries: innovative technologies, optimization of production, effective use of resources and creation of technological park”).

Data Availability Statement

The original contributions presented in the study are included in the article, further inquiries can be directed to the corresponding author.

Acknowledgments

The authors are grateful to the leaderships of the Satbayev University and the Science Committee of the Ministry of Science and Higher Education of the Republic of Kazakhstan for creating the conditions for carrying out this work.

Conflicts of Interest

The authors declare no conflicts of interest.

Abbreviations

The following abbreviations are used in this manuscript:
SCCself-compacting concrete
LLPlimited liability partnership
XPAX-ray phase analysis

References

  1. Bandurin, M.A.; Volosukhin, V.A. Operational Monitoring of Irrigation Systems Flume Canals, 2nd ed.; Kuban State Agrarian University named after I. T. Trubilin: Krasnodar, Russia, 2022; p. 171. [Google Scholar]
  2. Rodrigues, R.; Gaboreau, S.; Gance, J.; Ignatiadis, I.; Betelu, S. Reinforced Concrete Structures: A Review of Corrosion Mechanisms and Advances in Electrical Methods for Corrosion Monitoring. Constr. Build. Mater. 2021, 269, 121240. [Google Scholar] [CrossRef]
  3. SP RK EN 1992-1-1:2004 and СТ РК EN 206-2017. Available online: https://new-shop.ksm.kz/egfntd/ntdgo/kds/14.php (accessed on 1 July 2015).
  4. Coffetti, D.; Crotti, E.; Gazzaniga, G.; Gottardo, R.; Pastore, T.; Coppola, L. Protection of Concrete Structures: Performance Analysis of Different Commercial Products and Systems. Materials 2021, 14, 3719. [Google Scholar] [CrossRef] [PubMed]
  5. Mohammed, H.; Giuntini, F.; Sadique, M.; Shaw, A.; Bras, A. Polymer Modified Concrete Impact on the Durability of Infrastructure Exposed to Chloride Environments. Constr. Build. Mater. 2022, 317, 125771. [Google Scholar] [CrossRef]
  6. Zhu, L.; Zheng, M.; Zhang, W.; Jing, H.; Ou, Z. Multicomponent Cementitious Materials Optimization, Characteristics Investigation and Reinforcement Mechanism Analysis of High-Performance Concrete with Full Aeolian Sand. J. Build. Eng. 2024, 84, 108562. [Google Scholar] [CrossRef]
  7. Lang, L.; Zhu, M.; Pu, S. Recycling Engineering Sediment Waste as Sustainable Subgrade Material Using Ground Granulated Blast-Furnace Slag, Electrolytic Manganese Residue and Cement. Environ. Technol. Innov. J. 2025, 37, 103969. [Google Scholar] [CrossRef]
  8. Akhmetov, D.A.; Pukharenko, Y.V.; Vatin, N.I.; Akhazhanov, S.B.; Akhmetov, A.R.; Jetpisbayeva, A.Z.; Utepov, Y.B. The Effect of Low-Modulus Plastic Fiber on the Physical and Technical Characteristics of Modified Heavy Concretes Based on Polycarboxylates and Microsilica. Materials 2022, 15, 2648. [Google Scholar] [CrossRef]
  9. Dovgan, I.V.; Kolesnikov, A.V.; Semenova, S.V.; Kirilenko, G.A. Topological aspects of structure formation in disperse systems and binding materials. Constr. Mater. 2011, 3. Available online: https://cyberleninka.ru/article/n/topologicheskie-aspekty-strukturoobrazovaniya-v-dispersnyh-sistemah-i-vyazhuschih-materialah (accessed on 17 March 2011).
  10. Petropavlovskaya, V.B.; Novichenkova, Т.B.; Buryanov, А.F.; Poleonova, Y.Y. Application of Mathematical and Computer Modeling Methods to Manufacture High-Strength Unfired Gypsum Materials. Procedia Eng. 2013, 57, 906–913. [Google Scholar] [CrossRef]
  11. Korolev, L.V.; Lupanov, A.P.; Pridatko, Y.M. Dense packing of polydisperse particles in composite building materials. Mod. Probl. Sci. Educ. 2007, 6, 109–114. Available online: https://science-education.ru/ru/article/view?id=741 (accessed on 12 March 2025).
  12. Kharkhardin, A.N. Structural topology of interacting micro- and nanoparticles disperse systems. News High. Educ. Inst. Constr. 2007, 1, 130–138. Available online: https://vufind.lib.tsu.ru/Record/tsuab.91297 (accessed on 20 January 2007).
  13. Belov, V.V.; Obraztsov, I.V. Computer Optimisation of Construction Composites Grain Compositions Based on Cement-Mineral Mixtures; Mathematical Modelling in Construction; TvGTU: 2014; TvGTU (Tver State Technical University): Tver, Russia, 2014; p. 124. [Google Scholar]
  14. Gnanaraj, S.C.; Chokkalingam, R.B.; Thankam, G.L.; Pothinathan, S.K.M. Durability Properties of Self-Compacting Concrete Developed with Fly Ash and Ultra Fine Natural Steatite Powder. J. Mater. Res. Technol. 2021, 13, 431–439. [Google Scholar] [CrossRef]
  15. EN 206:2013+A1:2016; Concrete—Specification, Performance, Production and Conformity. European Committee for Standardization (CEN): Brussels, Belgium, 2016.
  16. Neville, A.M. Properties of Concrete, 5th ed.; Pearson Education Limited: Harlow, UK, 2011. [Google Scholar]
  17. Von Seckendorff, J.; Hinrichsen, O. Review on the Structure of Random Packed-beds. Can. J. Chem. Eng. 2021, 99, S703–S733. [Google Scholar] [CrossRef]
  18. Belov, V.V.; Obraztsov, I.V. Computer optimisation of construction composites grain compositions based on cement-mineral mixtures. Izv. KazGASU. 2014, 3, 172–178. Available online: https://cyberleninka.ru/article/n/kompyuternoe-optimizirovanie-zernovyh-sostavov-stroitelnyh-kompozitov-na-osnove-tsementno-mineralnyh-smesey/viewer (accessed on 15 August 2014).
  19. Aste, T. Volume Fluctuations and Geometrical Constraints in Granular Packs. Phys. Rev. Lett. 2006, 96, 018002. [Google Scholar] [CrossRef]
  20. Stutzman, P.E.; Feng, P.; Bullard, J.W. Phase Analysis of Portland Cement by Combined Quantitative X-Ray Powder Diffraction and Scanning Electron Microscopy. J. Res. Natl. Inst. Stand. Technol. 2016, 121, 47–107. [Google Scholar] [CrossRef]
  21. BS EN 196-1:2016; Methods of Testing Cement-Part 1: Determination of Strength. European Committee for Standardization (CEN): Brussels, Belgium, 2016. Available online: https://cdn.standards.iteh.ai/samples/40863/3a04b6abe8b44166af3d87e3c7cf1371/SIST-EN-196-1-2016.pdf (accessed on 1 April 2016).
  22. EN 12390-9:2006/GOST 10060-2012; Concretes. Frost Resistance Determination Methods. European Committee for Standardization (CEN)/Federal Agency on Technical Regulating and Metrology (Rosstandart): Brussels, Belgium, 2012. Available online: https://files.stroyinf.ru/Data2/1/4293782/4293782220.pdf (accessed on 30 July 2018).
  23. GOST 12730.5-2018; Concretes. Waterproofness Determination Methods. Federal Agency on Technical Regulating and Metrology (Rosstandart): Moscow, Russia, 2018. Available online: https://files.stroyinf.ru/Data2/1/4293730/4293730435.pdf (accessed on 24 September 2019).
  24. GOST 12730.3-2020; Concretes. Water Absorption Determination Methods. Federal Agency on Technical Regulating and Metrology (Rosstandart): Moscow, Russia, 2020. Available online: https://files.stroyinf.ru/Data/744/74489.pdf (accessed on 13 January 2021).
  25. GOST 27677-88; Corrosion Protection in Construction. Concretes. General Requirements Towards Testing. Federal Agency on Technical Regulating and Metrology (Rosstandart): Moscow, Russia, 1988. Available online: https://files.stroyinf.ru/Data/388/38804.pdf (accessed on 13 January 2021).
  26. GOST 58896-2020; Chemically Resistant Concrete. Test Methods. Federal Agency on Technical Regulating and Metrology (Rosstandart): Moscow, Russia, 2020. Available online: https://rosgosts.ru/file/gost/91/100/gost_r_58896-2020.pdf (accessed on 13 July 2020).
  27. Zuo, W.; Liu, J.; Tian, Q.; Xu, W.; She, W.; Feng, P.; Miao, C. Optimum Design of Low-Binder Self-Compacting Concrete Based on Particle Packing Theories. Constr. Build. Mater. 2018, 163, 938–948. [Google Scholar] [CrossRef]
  28. Cerny, V.; Fleischhacker, J.; Kocianova, M.; Drochytka, R. Synthesis of Tobermorite Structure with Non-Traditional Silica Components. Int. J. Adv. Sci. Eng. Inf. Technol. 2018, 8, 904. [Google Scholar] [CrossRef]
  29. Thomas, J.J.; Biernacki, J.J.; Bullard, J.W.; Bishnoi, S.; Dolado, J.S.; Scherer, G.W.; Luttge, A. Modeling and Simulation of Cement Hydration Kinetics and Microstructure Development. Cem. Concr. Res. 2011, 41, 1257–1278. [Google Scholar] [CrossRef]
  30. Londero, C.; Klein, N.S.; Mazer, W. Study of Low-Cement Concrete Mix-Design through Particle Packing Techniques. J. Build. Eng. 2021, 42, 103071. [Google Scholar] [CrossRef]
  31. SNiP 52-01-2003; Concrete and Reinforced Concrete Structures. Basic Provisions. Gosstroy of Russia (State Committee for Construction, Housing and Utilities): Moscow, Russia, 2003. Available online: https://files.stroyinf.ru/Data2/1/4294817/4294817381.pdf (accessed on 2 September 2004).
  32. Szwabowski, J.; Łaźniewska-Piekarczyk, B. Frost resistance of self-compacting concrete. In Proceedings of the CESB 07, Prague, Czech Republic, 7 January 2007; Volume 1. Available online: https://www.researchgate.net/publication/259931112 (accessed on 10 January 2007).
  33. Zhagifarov, A.M.; Akhmetov, D.A.; Suleyev, D.K.; Zhumadilova, Z.O.; Begentayev, M.M.; Pukharenko, Y.V. Investigation of Hydrophysical Properties and Corrosion Resistance of Modified Self-Compacting Concretes. Materials 2024, 17, 2605. [Google Scholar] [CrossRef]
  34. Maia Pederneiras, C.; Brazão Farinha, C.; Veiga, R. Carbonation Potential of Cementitious Structures in Service and Post-Demolition: A Review. CivilEng 2022, 3, 211–223. [Google Scholar] [CrossRef]
Figure 1. Covering with circles in two-dimensional space: polygons and elementary cells in cubic or hexagonal packing [12].
Applsci 15 05283 g001
Figure 2. Dependence of packing density on the percentage composition of the compound.
Applsci 15 05283 g002
Figure 3. The results of the X-ray phase analysis: (a) Sample 1; (b) Sample 2; (c) Sample 3; (d) Sample 4; (e) Sample 5; (f) Sample 6; (g) Sample 7; (h) Notation.
Applsci 15 05283 g003
Figure 4. Strength test results: (a) Compressive strength of modified and reference samples; (b) Bending strength of modified and reference samples; (c) Relative strength increase (%) in compression and bending compared to the reference sample; (d) Coefficient of variation (%) for compressive and bending strength. Note: values are presented as mean ± standard deviation based on 8 samples.
Applsci 15 05283 g004
Figure 5. Freeze–thaw resistance levels of concrete series: (a) Based on weight loss; (b) Based on strength loss.
Applsci 15 05283 g005
Figure 6. Water absorption results: (a) Water pressure resistance and variation (%) for different sample types; (b) Water permeability level (WPL) and deviation (%) compared to the reference sample.
Applsci 15 05283 g006
Figure 7. Freeze–thaw resistance levels of concrete series: (a) Average water absorption values of the compared sample types and their coefficients of variation; (b) Reduction in water absorption values relative to the reference sample and the corresponding percentage deviations.
Applsci 15 05283 g007
Figure 8. Residual weight and strength values after durability tests: (a) Residual weight, compressive strength, and bending strength after freeze–thaw cycling in NaCl solution; (b) Residual values after freeze–thaw cycling in HCl solution; (c) Residual values after freeze–thaw cycling in Na2SO4 solution.
Applsci 15 05283 g008
Figure 9. Results of predicting the change in strength over time in different chemical environments: (a) Strength loss prediction curves for samples exposed to NaCl environment; (b) Strength loss prediction curves for samples exposed to HCl environment; (c) Strength loss prediction curves for samples exposed to Na2SO4 environment.
Applsci 15 05283 g009
Table 1. Composition of the reference sample SCC.
W/C RatioCement, kg/m3Sand, kg/m3Crushed Stone, 5–10 mm, kg/m3Crushed Stone, 10–20 mm, kg/m3Chemical Additive, kg/m3Micro Silica, kg/m3Density,
kg/m3
0.355009006001505.0502380
Table 2. Characteristics of Portland cement clinker.
CharacteristicRequirements of the Code GOST 34850-2022Value
Magnesium oxide (MgO), %no more than 5.03.0
Free calcium oxide (CaO)freeno more than 2.01.5
Mass ratio of calcium oxide to silicon oxide (CaO/SiO2), %no more than 2.02.5
Total content of three-calcium and two-calcium silicates (3CaO-SiO2 + 2CaO-SiO2), %at least 6770
Table 3. Characteristics of sand.
Coarseness ModulusTrue Density, kg/m3Bulk Density, kg/m3Clay and Dust Particle Content, %Specific Effective Activity of Natural Radionuclides, Bq/kg
2.5261216601.175.1
Table 4. Characteristics of crushed stone.
CharacteristicValue
Plate and needle-shaped grains, %11.0
Dusty, silty and clayey particles, %0.81
Crushed stone grade by crushability1400
Crushed stone grade by frost resistance400
Bulk density, kg/m31405
Specific effective activity of radionuclides, Bq/kg89
Crushed stone grade by abrasionI-1
Table 5. Characteristics of superplasticizer AR 122.
AppearanceDensity at 25 °C, kg/m3Hydrogen Index, pHCl- Ions Content, Not More Than
Homogeneous yellow colored liquid10403.60.1
Table 6. Chemical composition of microsilica.
Mass Ratio, %
SiO2Fe2O3Al2O3CaOpHq, g/cm3Other Additives
95.890.060.250.447.770.453.36
Table 7. Characteristics of dispersion of cement binder (fractions).
Fraction DesignationSpecific Surface Area, cm2/gAverage Particle Diameter, µm
F1150012
F230006.6
F345004.9
Table 8. Spatial packing modeling results.
F 1, %F 2, %F 3, %Packing Density
1001000.568976
2020800.589987
3040600.581839
4060400.572967
5080200.570107
6010000.565223
7200800.587216
82020600.596141
92040400.599112
102060200.599704
11208000.576993
12400600.590324
134020400.611577
144040200.611634
15406000.595637
16600400.617781
176020200.620393
18604000.596144
19800200.615436
20802000.599853
21100000.555398
Table 9. Preliminary assessment of sample strength.
Composition (Components Content), %Compression Strength, MPa
F1F2F37 Days28 Days
1Reference sample29.7841.18
21000020.1729.81
30100030.5842.02
40010039.1451.00
52080030.0341.97
62575028.7340.75
73070027.3138.78
80802036.0648.16
90752537.4150.03
100703038.0951.60
111580538.3251.94
1215751039.1452.61
1315701539.9053.26
Table 10. Compositions for the main research.
TypesComposition (Component Content), %
F1F2F3
Type 1Reference sample
Type 280200
Type 375250
Type 470300
Type 515805
Type 6157510
Type 7157015
Table 11. Phase composition at the age of 28 days of normal hardening.
TypesPhase Composition, %
C3SC2SEttringitePortlandite Ca(OH)2Hydration Degree
Type 1: Reference sample 25.019.02.520.771.0
Type 2: 0/80/2026.017.52.019.873.0
Type 3: 0/75/2526.017.02.019.776.0
Type 4: 0/70/3027.016.0up to 2.019.679.0
Type 5: 15/80/526.021.01.019.161.0
Type 6: 15/75/1025.020.01.018.864.0
Type 7: 15/70/1526.020.01.018.962.0
Table 12. Freeze–thaw resistance: weight and strength loss over cycles.
TypesWeight Loss, %Strength Loss *, %
200300350400500600200300350400500600
Type 1:
Reference sample
1.272.123.084.07--0.970.900.820.71--
Type 2: 0/80/200.661.421.692.023.425.030.990.970.960.940.870.84
Type 3: 0/75/250.621.411.672.013.114.790.990.980.970.950.870.85
Type 4: 0/70/300.631.401.682.003.074.891.001.000.980.960.930.87
Type 5: 15/80/50.410.961.321.862.633.171.001.001.000.950.930.90
Type 6: 15/75/100.420.971.341.892.663.221.001.001.000.970.950.91
Type 7: 15/70/150.420.981.351.912.673.251.001.001.000.980.960.91
* The ratio of the strength of a sample after testing to its strength before testing.
Table 13. Results of chemical resistance tests.
ParameterTypesValuesVariation Coefficients
NaClHClNa2SO4NaClHClNa2SO4
Loss of weight, %121.014.011.37.896.115.37
217.912.810.65.124.773.21
317.912.210.35.634.883.55
417.212.110.25.224.483.27
514.811.69.35.294.543.76
613.310.18.75.084.123.52
713.19.98.45.194.283.21
Loss of compressive strength, %145.817.312.512.568.789.21
237.815.211.110.986.097.54
337.315.110.911.346.126.31
437.114.010.710.295.677.02
536.113.97.210.075.936.32
633.213.16.49.325.525.78
733.012.26.29.345.185.83
Loss of banding strength, %152.017.813.318.9310.149.23
243.815.112.016.328.768.02
343.814.911.817.898.327.31
443.514.611.616.238.487.29
538.013.58.213.278.246.85
635.213.47.214.878.317.02
734.313.26.713.048.186.47
Table 14. Freeze–thaw resistance: physical characteristics and durability indicators.
TypeMixturedpd σ c σ bFRLSwWPLkcr
(NaCl/HCl/Na2SO4)
Type 1:
Reference sample
RS0.5642.38042.85.16200–3505.72W60.511/0.825/0.871
Type 2: 0/80/200/80/200.5702.39849.35.41350–5005.55W80.592/0.849/0.885
Type 3: 0/75/250/75/250.5712.40350.25.47350–5005.57W80.595/0.850/0.887
Type 4: 0/70/300/70/300.5732.40851.35.52350–5005.49W80.597/0.857/0.889
Type 5: 15/80/515/80/50.5842.41152.05.53400–6005.28W100.630/0.863/0.923
Type 6: 15/75/1015/75/100.5912.41453.85.66400–6005.22W100.658/0.868/0.932
Type 7: 15/70/1515/70/150.5932.41953.95.74400–6005.17W100.663/0.873/0.936
d p —packaging density, %; d —density, g/cm3; σ c compression strength, MPa; σ b bending strength, MPa; F R L freeze–thaw resistance level; S w water saturation (absorption), %; W P L water permeability level; k c r coefficient of chemical resistance by strength.
Disclaimer/Publisher’s Note: The statements, opinions and data contained in all publications are solely those of the individual author(s) and contributor(s) and not of MDPI and/or the editor(s). MDPI and/or the editor(s) disclaim responsibility for any injury to people or property resulting from any ideas, methods, instructions or products referred to in the content.