Article

Implementation of a Breast Phantom with Acoustic Properties for Ultrasonic Thermometry

by
Ruth Valeria Acero Mendoza
,
Ivonne Bazán
* and
Alfredo Ramírez-García
Department of Biomedical Engineering, Autonomous University of Aguascalientes, Aguascalientes 20392, Mexico
*
Author to whom correspondence should be addressed.
Appl. Sci. 2025, 15(10), 5275; https://doi.org/10.3390/app15105275
Submission received: 28 February 2025 / Revised: 29 April 2025 / Accepted: 2 May 2025 / Published: 9 May 2025
(This article belongs to the Section Biomedical Engineering)

Abstract

:
Breast cancer remains one of the leading causes of death among women globally. Early detection is critical for improving patient outcomes, making the development of accurate and efficient detection methods essential for facilitating timely treatment and enhancing patients’ quality of life. Lesion sites are often associated with localized temperature increases, which can be identified by characterizing thermal gradients using thermometry tools. Ultrasound-based techniques are preferred for obtaining thermal patterns due to their noninvasive, non-ionizing nature and cost-effectiveness compared to methods like magnetic resonance imaging. This study focuses on developing breast tissue models with varying acoustic properties, specifically the speed of sound across temperatures ranging from 32 °C to 36 °C in increments of 0.5 °C for ultrasonic inspection and diagnostic applications. These models simulate healthy and tumorous breast tissue, including the fat, gland, and tumor layers. Signal variations were analyzed using cross-correlation methods to assess the changes in the speed of sound as a function of temperature. The proposed methodology offers a cost-effective, rapid, and precise approach to phantom production, facilitating the detection of temperature changes in 0.5 °C intervals through cross-correlation analysis of the acquired signals.

1. Introduction

Breast cancer is the most significant female mammary disease due to its high mortality and morbidity rates among women, as well as the projected increase in cases of this pathology. Each year, 2.3 million new cases and 458,000 deaths occur globally due to breast cancer, attributed to late diagnosis.
Breast lesions can be characterized by abnormal tissue changes, including thermal elevation in the growth zone and surrounding areas [1]. Many researchers have explored noninvasive methods for measuring temperature [2,3,4,5,6,7,8,9,10,11,12,13,14,15,16]. Although MRI is the most advanced clinical technology for this purpose, its high cost and complexity limit its use. In contrast, ultrasound is a non-ionizing, convenient, and cost-effective modality with relatively simple signal processing requirements [17,18,19,20,21,22]. This makes it a promising method for temperature estimation, under the condition that temperature-sensitive ultrasonic parameters can be identified, accurately measured, and properly calibrated [23,24].
Scientific efforts have focused on estimating temperature using changes in speed of sound (SOS), i.e., changes in time of flight (ToF), variations in the ultrasonic attenuation coefficient, or changes in backscattered energy due to thermal effects [25,26]. However, quantifying the thermal dependence of ToF has been crucial, as echo shift computation forms the basis of many recent studies in temperature estimation. Attempts to implement this approach in clinical applications have faced significant challenges due to differences in temperature dependence across tissue types, e.g., SOS change due to temperature rise in fatty breast tissue presents a behavior that is opposite to that given in the rest of the tissues [27]. The acoustic properties of biological tissues exhibit significant variation between individuals and can fluctuate within the same body, resulting in substantial inconsistencies in the literature [28]. This highlights the need for more precise and adaptable experimental models for temperature measurement in inhomogeneous tissues, as encountered in vivo.
Tissue-mimicking materials (TMMs) or phantoms are models designed to replicate the physical properties of human tissues. These materials offer numerous benefits, particularly in quality assurance for medical imaging, study validation, and pre-training, providing an ethical and valuable alternative to human tissue testing [29]. Although several studies have reviewed the fabrication of phantoms, available phantoms still present limitations, such as reliance on single-modality approaches and simple single-layer structures.
The components of the TMMs are selected depending on the application, e.g., diagnostic or therapy, and on the scanning technology, e.g., ultrasound, microwave, etc. In [30], a prostate phantom based on polyacrylamide gel was developed to simulate optical features. Given that the application was oriented to thermal therapy using a laser, the material used was selected due to its high melting point. In this sense, for ablative temperatures greater than 60 °C, the authors of [31] present a thermochromic phantom based on polyacrylamide gel. The phantom changes color from white to magenta when the temperature increases from 60 to 65 °C. The results show a thermal pattern of ablation for microwave- and laser-based therapies. Jawli et al. [32] report a validation study of a tissue-mimicking phantom used in the detection of prostate cancer. This phantom was constructed with polyvinyl alcohol (PVA), and materials like glycerol, silicon carbide, and aluminum oxide were added to ensure variation in the molecular weight. They showed that, with high molecular weight, properties such as the SOS, acoustic attenuation, and Young’s modulus were similar to those of the prostate tissue. A breast phantom that mimics properties for B-mode ultrasound and microwave imaging was described in [33]. It comprised skin, fat, tumor and fibroglandular tissues, and was created with a mixture of agar and glass beads. Coconut and canola oil were used for skin and fat, respectively. Meanwhile, polyvinylpyrrolidone (PVP) was added to fibroglandular and tumor tissue phantoms. These phantoms can be used in the simulation of the following properties: relative permittivity and conductivity, the SOS, and attenuation. For microwave thermometry, phantoms oriented to mimic dielectric and thermal properties have been developed [34,35,36]. In [35], a phantom based on materials such as distilled water, gelatine, sunflower oil, sugar, sodium chloride (NaCl), xanthan, and propylene glycol (pure, 98%) was created. Relative permittivity and conductivity were characterized in a frequency range of 200 MHz to 20 GHz for different temperatures. A functional breast phantom was constructed in [34], attached to the real anatomy, and including a mechanism that allowed the researchers to simulate the blood flow and to control a thermal element, simulating a tumor. Density, thermal conductivity, specific heat capacity, electrical conductivity, and dielectric constant were modelled. Temperature measurements were acquired with the antenna applicator of the RTM-01-RES radiometer (RES Ltd., Moscow, Russia). Slanina et al. [36] developed a breast tissue phantom to mimic dielectric properties and its dependence on temperature for a frequency bandwidth from 50 MHz to 20 GHz. The phantom was created with distilled water, glycerine, agar, rapeseed oil, and dishwashing liquid. It comprised four tissue types: tumor, gland, skin, and fat. The complex permittivity was characterized in the temperature range from 25 °C to 46 °C. Another common category of phantoms comprises those that are developed to track focused ultrasound therapies by means of magnetic resonance imaging (MRI). An example is given in [37], where a specific tumoral tissue phantom was developed based on pure agar gel. It consists of a tumor tissue phantom surrounded by a normal tissue phantom. Silicone dioxide was used to differentiate the tumor. Ultrasonic, thermal, and MR relaxation properties were measured. MR thermometry was used to monitor ablation therapy. Fillippuo et al. [38] developed a homogenous breast phantom based on agar (2% w/v), wood powder (4% w/v), and degassed water. It was based on a previously reported phantom that simulated acoustic, magnetic, and thermal properties. In that study, the phantom curvature effect on temperature was analysed. Regarding phantoms developed for ultrasonic thermometry, Daniels et al. [39] used a 2D speckle tracking approach, achieving temperature estimation errors below ±0.5 °C in a phantom constructed with a talc-in-agar mixture. Lai et al. [40] employed thermal strain imaging with 2D speckle tracking on RF ultrasound data to estimate temperature-induced tissue deformation, extracting the thermal parameter 1 / k ( z )   from echo shifts. By correlating these measurements with CT-derived Hounsfield Units, they enhanced calibration accuracy in heterogeneous media. However, the developed phantom based on agarose mimics a generic tissue and consists of just one general body without layers that simulates a multi-composed organ like the breast. The phantom was characterized in the range of temperatures of 26.1 to 41.1 °C in average steps of 4.8 °C. To modify the content of mimetic fat tissue, different concentrations (0–50%) of glyceryl trioleate were added. The results showed a negative correlation between temperature and the SOS for concentrations of trioleate greater than 30%.
Although commercial phantoms are available, they are expensive and difficult to customize, making them impractical for certain purposes. This study focuses on constructing and validating a phantom that mimics the SOS of breast tissue with and without tumor lesions within a known temperature range that could be used as a test material in ultrasonic thermometry research (32 °C to 36 °C). As a result, changes in velocity associated with temperature changes of 0.5 °C were successfully estimated through signal processing.

2. Theoretical Framework

2.1. Thermometry as a Method of Diagnosis and Detection of Breast Anomalies

Ultrasound-based thermometry methods can be classified as either passive or active. The first ones involve the transducer transmitting acoustic waves focused on the region of interest; the echo signals are received and processed to extract the desired parameters, which depend on the temperature. Passive thermometry methods are based on the detection of acoustic radiation emitted from tissues experiencing thermal changes and generated by the thermal agitation of atoms and molecules within the tissue [41,42].
Within the presently active methods, there are several approaches: some are based on speckle tracking techniques, which focus on estimating time delays of echo signals due to local changes in the SOS and to the thermal expansion of the medium, produced by temperature increase [20,21,39,43,44,45,46,47,48,49,50]. Another well-known methodology is the measurement of the change in backscattered energy (CBE) [23,24,51], which utilizes the temperature-dependent nature of backscattered energy as an acoustic parameter to be related to tissue temperature. Others are based on characterizing the changes in the statistical properties of ultrasonic signals acquired from the medium [52,53]. Other methods exist, such as methods using changes in the nonlinear parameters of the medium and methods using changes in the attenuation parameter, but these are not discussed in this study. All of them offer advantages such as real-time capabilities or non-ionizing radiation. However, there are limitations to them, such as tissue motion or diffraction effects that must be considered before advancing to pre-clinical trials. To validate thermometry methods in rigorous controlled conditions, they must be tested on trial media called phantoms, which replicate required tissue properties, avoiding interference from non-desirable effects. Phantom-based experimentation is essential for evaluating the effectiveness of thermometry approaches in the first evaluation stage. In this work, we aim to develop and validate low-cost, lab-made ultrasonic breast phantoms for ultrasonic thermometry-based diagnosis applications assessment.

2.2. Breast Thermal and Ultrasonic Properties of Interest

The human mammary tissue is a complex anatomical structure that comprises adipose, glandular, connective, and muscular tissues. It undergoes morphological and physiological changes throughout the female lifecycle, which affect the acoustic properties of the tissue, particularly its ultrasonic response. I. Katz-Hanani et al. [54] suggest a correlation between a woman’s age and the mean sound velocity and attenuation coefficient in the breast.
The SOS and attenuation values in cancerous tissues are higher than those in surrounding normal tissues, such as glandular and fatty tissues. According to [55], the SOS of fatty breast tissue is 1422 ± 9 m/s, while the SOS of mammary parenchyma is 1487 ± 21 m/s. In relation to malignant and benign breast lesions, they are reported to have SOSs of 1548 ± 17 m/s and 1513 ± 27 m/s, respectively. In addition, this study documents an SOS of 1515 m/s for a glandular tissue phantom, 1549 m/s for a small tumor phantom, and 1470 m/s for a subcutaneous fat phantom. It is important to note that no ultrasonic SOS values have been found in the literature for each of the tissues that compose the breast at temperature ranges that are characteristic of the early stages of cancer diagnosis (32–36 °C). Although we have knowledge of the correlation between the ultrasonic velocity and temperature, depending on tissue composition (for fatty tissues, SOS is inversely proportional to temperature increase, while for tissues with higher water content, it is the opposite), there are no concrete estimates for each tissue [17,27]. The attenuation value ranges from 1.01 to 1.18 (DB/cm/MHz) with a standard deviation of 0.17 to 0.29, depending on the stage. The highest value is observed in premenopausal women [54]. The thermal conductivity value typically ranges between 0.42 and 0.5 (W/m/K) [56].
Phantoms that accurately replicate the physical properties of breast tissue are crucial for testing and evaluating these parameters across various protocols. In ultrasound thermometry for diagnostic purposes, it is necessary to characterize the temperature sensitivity of the phantom ultrasonic parameters to accurately quantify the temperature changes associated with breast lesions. In this context, the SOS is particularly important, while the expansion coefficient is often considered to be negligible. In this work, a phantom to mimic the SOS behavior when temperature increase for fatty, glandular and tumoral layers was developed. Attenuation and thermal conductivity were approximated to those values of real tissue.

2.3. Review of Ultrasonic Phantoms: Properties of the Materials and Protocols Used for the Construction of Phantoms, Oriented Towards Thermal Applications

Several researchers have developed breast phantoms for thermal applications; however, many of these phantoms are evaluated at ambient temperature, with a few tested over a limited range of 43–48 °C [57] in the tumor for HIFU treatment applications. Most of these phantoms are constructed using a single homogeneous medium that approximates certain properties of the tissue; few developments consider a composed phantom. This section reviews some of these studies, discussing the properties of the phantoms and the materials used in their construction.
Madsen et al. and Burlew et al. [58,59] developed a tissue-mimicking phantom for ultrasound applications based on agar to simulate the SOS in soft tissues, achieving values ranging from 1498 m/s to over 1600 m/s at 22 °C, with 1540 m/s representing the average speed built into most ultrasound scanners. The study found that the concentration of graphite powder determined the attenuation, while the concentration of n-propanol influenced the SOS. Jinlan Huang et al. [60] developed an agar-based phantom adapted from the Burlew procedure, incorporating water, agar, graphite powder, methylparaben, and 1-propanol. The authors also introduced a non-uniform flow-through tissue phantom to simulate blood flow, effectively replicating the acoustic and thermal properties of the real tissues. The properties of this phantom align with typical literature values for human tissue, demonstrating that these materials can accurately simulate both thermal and acoustic characteristics. Jun Dang et al. [61] developed a breast phantom by mixing agar in deionized water, as has been performed in previous studies, and adding gelatin to combine acoustic and mechanical properties for use in Positron Emission Tomography (PET), B-mode ultrasound, and elastography imaging. The study found that the phantom’s acoustic and mechanical properties closely resembled those of real tissues, including fat, gland, fibrous tissue, and carcinoma. The phantom design consisted of a single volume of gel simulating fat tissue with inserts of varying dimensions (1 to 3 cm) representing cancer lesions. P. T. Nguyen et al. [62] proposed a thermo-dielectric breast phantom designed for application in microwave hyperthermia, simulating the density, specific heat capacity, and thermal conductivity of breast tissue. Additionally, the phantom incorporates permittivity and conductivity as dielectric properties. The authors used a mixture of gelatin, oil, and salt in water at varying concentrations to emulate different tissue types, including glandular, adipose, skin, and tumor tissues, resulting in a heterogeneous, anatomically realistic breast phantom. Notably, the results demonstrated thermal properties closely matching those of real breast tissues. Although the tests were not conducted at varying temperatures, the study achieved good approximations of the thermal properties. These results align with previously validated findings from other authors [63,64,65,66,67,68,69], but this phantom is suitable for electromagnetic applications.

2.4. Method for Determining Temperature in Phantoms

Most of the temperature estimation ultrasonic methods are based on the thermal dependence of the ToF of ultrasound echoes, which considers two different physical phenomena: the local change in the SOS due to temperature variations and the thermal expansion of the propagation medium. Along an A-line (which, in ultrasound, refers to a one-dimensional representation of the echo along the beam’s propagation direction), both effects produce echo time shifts. These can be estimated and have been shown to be related to local temperature changes in the propagation medium. Since these effects are generally small, a linear approach is used for their analysis.
This approach enables temperature estimation along the ultrasound propagation axis. The temperature change Δ T ( z ) can be determined by measuring the axial displacements of the echo as a function of depth ( z ) , and it is influenced by the initial SOS, c 0 , in the medium before heating, as well as by the thermal properties of the tissue, represented by the thermal expansion coefficient, α , and the coefficient β = 1 / c 0   ·   c / T , which describes how the SOS varies with temperature. This relationship allows for temperature estimation using Equation (1):
Δ T z = c 0 2 ( α β ) × t ( z ) z
This method assumes a linear variation in the SOS with temperature, facilitating its application across different tissue types, although the values of α and β may vary depending on fat content and other tissue characteristics [17,24,27,43,50,70].
To calculate the time delays associated with SOS variations, the classical cross-correlation method was used, where the signal acquired at a reference temperature was correlated with the signal corresponding to a higher temperature. In this way, the number of samples shifted relative to the reference signal was obtained, which was then converted into a relative time shift.
The cross-correlation method employed in this study was calibrated under controlled experimental conditions using sunflower oil. The ultrasonic signals were acquired with a 1 MHz transducer at a sampling frequency of 1 GHz. Prior to processing, the signals were windowed to isolate the region of interest, and then the bandpass filtered between 0.5 and 1.5 MHz to retain the relevant frequency components. Cross-correlation was applied directly to the filtered signals to estimate the time delays induced by temperature variations. Calibration was performed over a temperature range from 19.2 °C to 30.2 °C to evaluate the method’s sensitivity to thermal changes. Sunflower oil provides a thermally stable medium, making it suitable for initial calibration.
A linear regression of ultrasound velocity as a function of temperature yielded a negative slope of –3.10 m/s·°C−1 and an intercept of approximately 1423.79 m/s at 19.2 °C, indicating a moderate decrease in SOS with increasing temperature. These results are consistent with previous reports, where the temperature coefficient of sound speed (dC/dT) for sunflower oil has been found to be –3.2 m/s·°C−1 over temperature ranges of 26.85–69.85 °C (with an intercept of 1387.6 m/s at 44.85 °C) and 20–40 °C to –3.4 m/s·°C−1 with an intercept of 1470.4 m/s at 20 °C, respectively [71,72,73].

3. Methodology

3.1. Protocol for the Elaboration of the Thermometry Phantom

The phantom consists of a heterogeneous structure layer: gland and fat layers for the healthy model; in the tumoral model, the additional layer of tumor was included. These are illustrated in Figure 1.
To simulate the thermal and acoustic properties of these cases, agar (suitable for plant cell culture, powder, A7921-Sigma-Aldrich, St. Louis, MO, USA) was used as a gelling agent. Its properties facilitate the formation of a solid mixture and enable the simulation of the acoustic velocity characteristic of female breast tissue. According to Huang et al. [60], the thermal conductivity of agar-based phantoms is measured at 0.59 ± 0.02 W/m°C, closely approximating the thermal properties of human tissue, which ranges between 0.45 and 0.56 W/m°C. Agar was chosen as the base material for phantom fabrication due to its common use by other authors and its physical properties, which closely resemble those of biological tissues, particularly its thermal conductivity coefficient, which is comparable to that of soft tissue [74,75]. This characteristic is essential in studies involving thermal and acoustic analyses.
Agar also offers practical advantages: it is non-corrosive, safe to handle in low-risk laboratory environments, and does not require specialized equipment. Basic precautions, such as gloves and avoiding inhalation of dry powder, are sufficient. These factors make it suitable for use in laboratories with moderate infrastructure.
In technical terms, agar exhibits excellent thermal stability. It maintains structural consistency across the temperature ranges used in the experiments, with a melting point of approximately 78 °C, ensuring that it does not degrade or deform during controlled heating.
Porcine gelatin was also considered; however, it began to melt at temperatures as low as 30 °C, compromising its structural integrity [75]. Although agar is somewhat more fragile under mechanical impact, its thermal performance and ease of handling make it the most appropriate choice for the objectives of this study.
Edible vegetable oil (Kirkland Signature) was used to simulate specific heat capacity and thermal conductivity, while sodium chloride was employed to mimic dielectric conductivity. It is important to clarify that, although the use of salt introduces changes in dielectric properties rather than ultrasonic ones, it has been employed by researchers such as Roland Chen [63], Nguyen et al. [62], and Giuseppe Ruvio et al. [67] in the development of phantoms that incorporate both thermal and ultrasonic properties. Therefore, the addition of salt was intended to minimize alterations to the materials utilized by other authors, ensuring consistency in the experimental conditions. Distilled water served as the solvent for the mixture and, in conjunction with the oil, helped to simulate specific heat capacity. Additionally, commercial dishwashing liquid detergent was added to achieve a homogeneous mixture. The concentrations used for the gland and tumor phantoms are detailed in Table 1.
Lard was used to simulate adipose tissue, which, according to Koch et al. [76], exhibits an average ultrasonic velocity ranging from 1436 ± 9 m/s to 1470 ± 37 m/s, characterized at 38   ° C using a scanning acoustic microscope at a frequency of 10 MHz. Additionally, the thermal conductivity of lard was measured at 0.1258 W/m°C, based on the average of five independent measurements [77].
To prepare the fat for acquisition, a magnetic stirrer hotplate (Thermo Scientific, SP131325, Waltham, MA, USA), along with a beaker to heat the sample, was used. The fat was heated for 25 min at 60 °C. Once it cooled down to 45 °C, the liquefied lard was poured into the corresponding mold and refrigerated for at least 24 h at approximately 2 °C.
The protocol described below was employed in the preparation of both the gland phantom and the tumor phantom. Reagents were initially weighed using an Explorer Pro precision balance (OHAUS), and the water was contained in a beaker. Temperature was monitored with a digital thermometer (OBI, −50/300 °C), while a magnetic stirrer hotplate (Thermo Scientific, SP131325) was used to heat the water. To prevent evaporation, the beaker was covered with plastic wrap during stirring. The water was heated to 60 °C with low agitation. Once at this temperature, detergent was added, and the mixture was maintained at 75 °C with medium agitation. At this stage, agar and salt were incorporated according to the tissue being simulated, with the agitation speed increased to prevent lump formation. The mixture was kept between 75 °C and 80 °C until the agar and salt (only for the tumor) were fully dissolved. Afterward, vegetable oil was added in small quantities to avoid lumps and air bubbles. This crucial step involved stirring the mixture for at least 25 min to ensure homogeneity. Finally, the hotplate was turned off while stirring continued at medium–high speed. Once the mixture reached 45 °C, stirring stopped, and the mixture was poured into the corresponding mold.
To construct the layers for the healthy tissue phantom, the gland phantom was first prepared and poured into a mold; then, it was allowed to set at room temperature for at least 1 h. Subsequently, it was refrigerated for a minimum of 2 h at approximately 2 °C. Next, the lard was heated until it reached a liquid consistency; then, it was allowed to cool to 45 °C before being poured over the previously set gland phantom. The assembled layers were then refrigerated for 24 h at around 2 °C.
In constructing the layers for the tumoral case, the same principles as those used for the healthy case were applied, but with the tumor phantom as the first layer. Each layer was allowed to set for 1 h at room temperature, followed by 2 h of refrigeration to ensure proper bonding between layers. Maintaining the correct temperature when pouring the mixture is crucial; high temperatures can cause deformation of the layers, while low temperatures can result in bubbles or lumps. This careful temperature management is essential for the successful development of layered phantoms.
To evaluate the consistency and batch-to-batch variability of the phantoms, several repetitions of each case were considered: three single-layer phantoms, three healthy phantoms (two layers), and three tumoral case phantoms (three layers). A total of nine fat phantoms, nine glandular phantoms, and six tumor phantoms were prepared. Each batch was fabricated following a strictly standardized and rigorous protocol to ensure repeatability. The quantities of the components were measured with high precision using calibrated laboratory instruments, and consistent target temperatures were achieved and maintained throughout the fabrication process using constant thermal control.

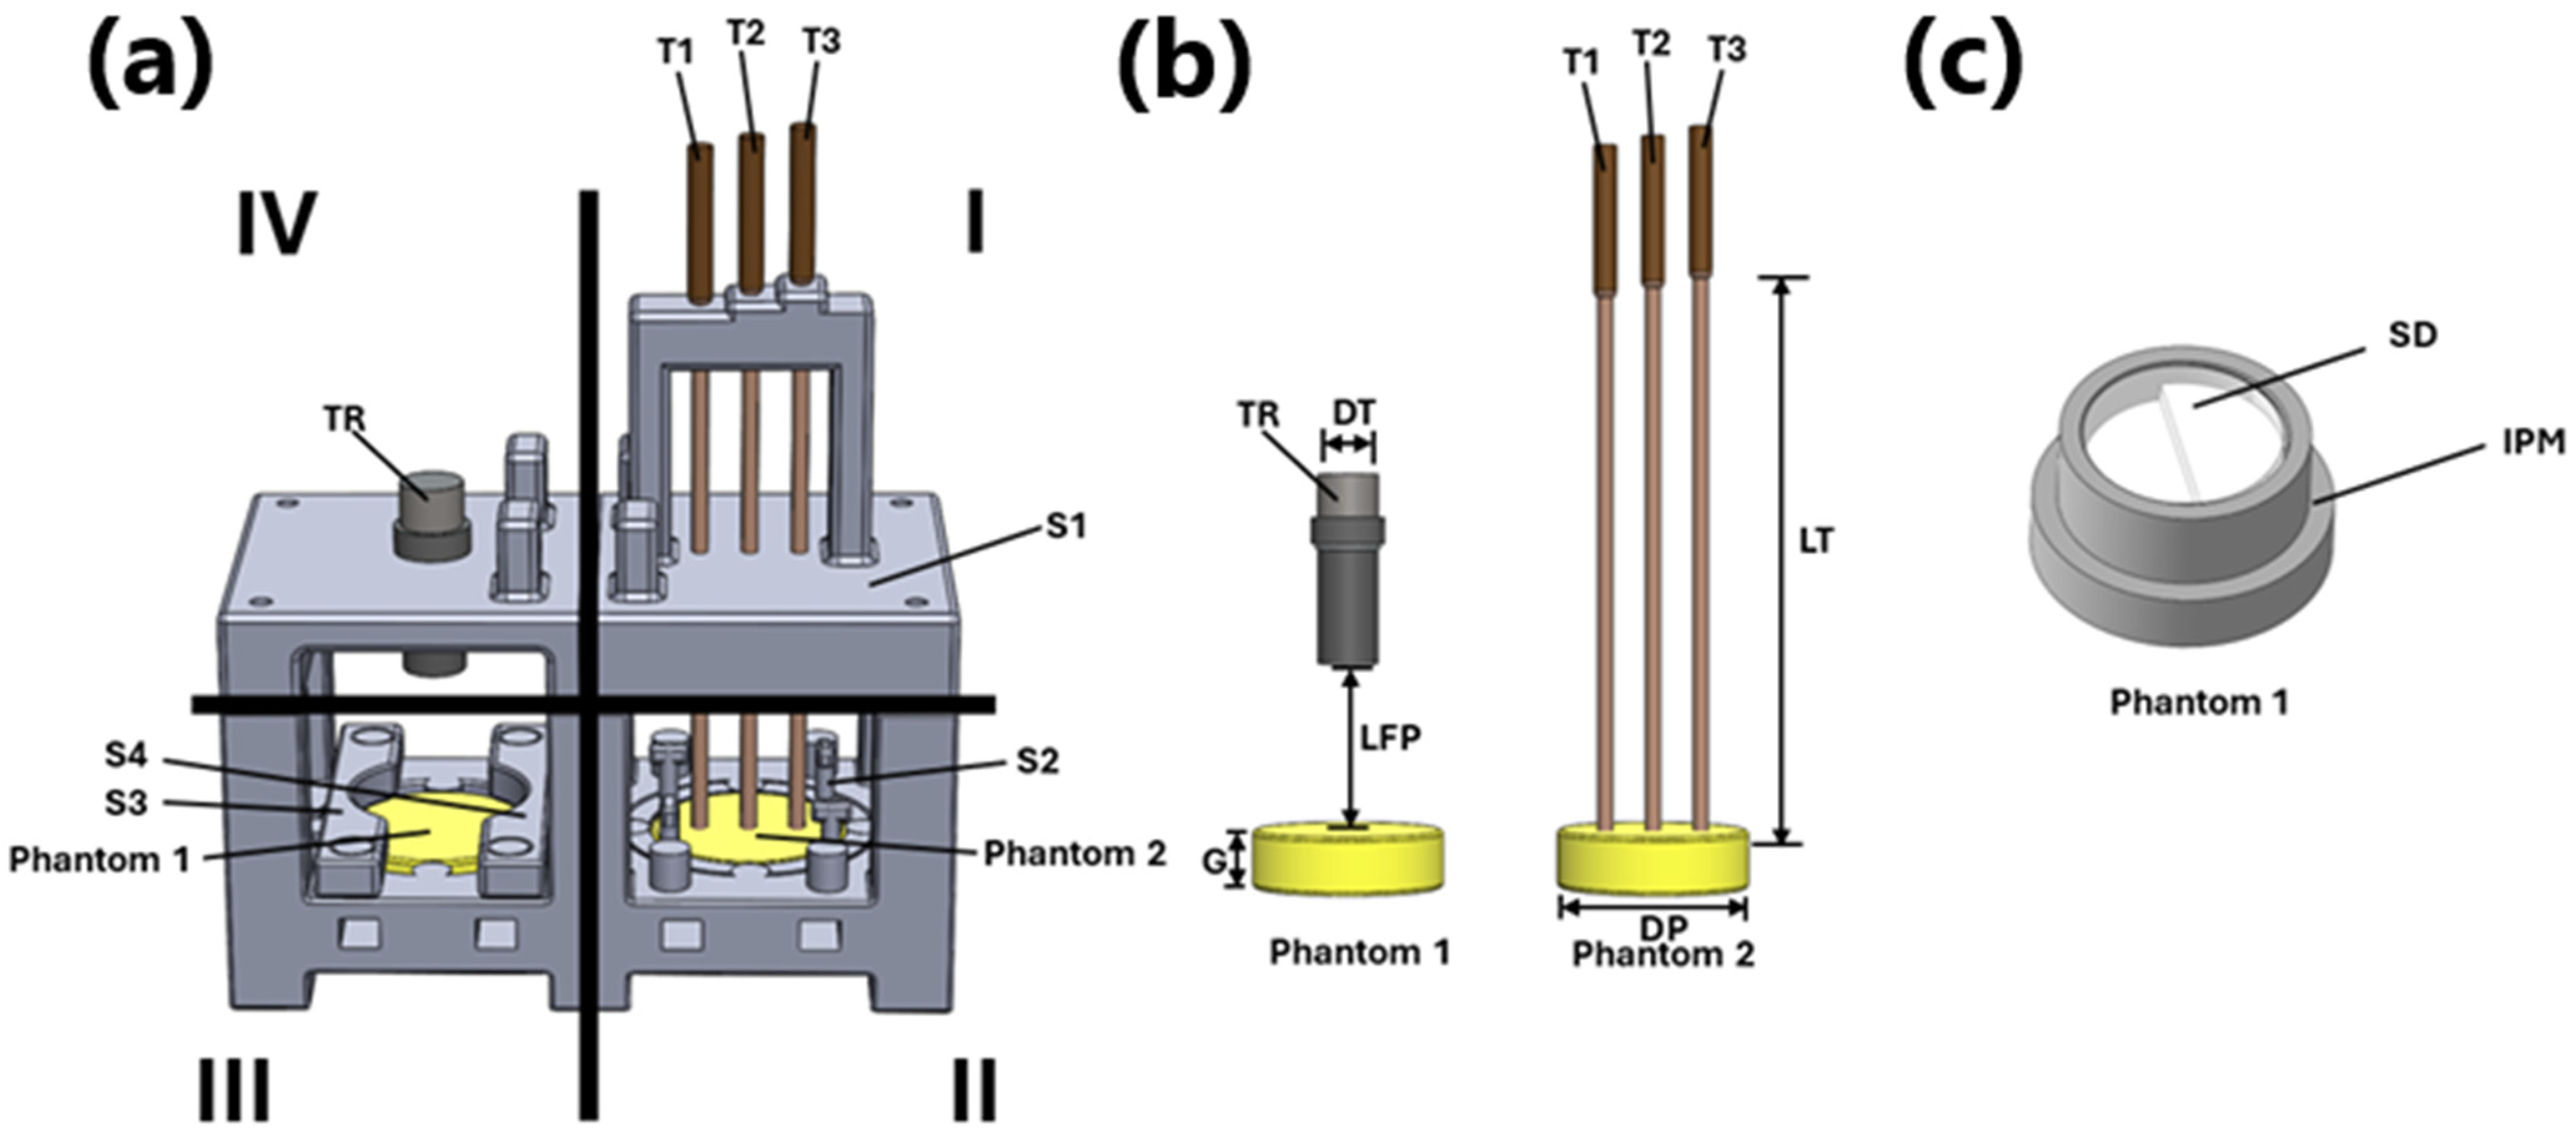
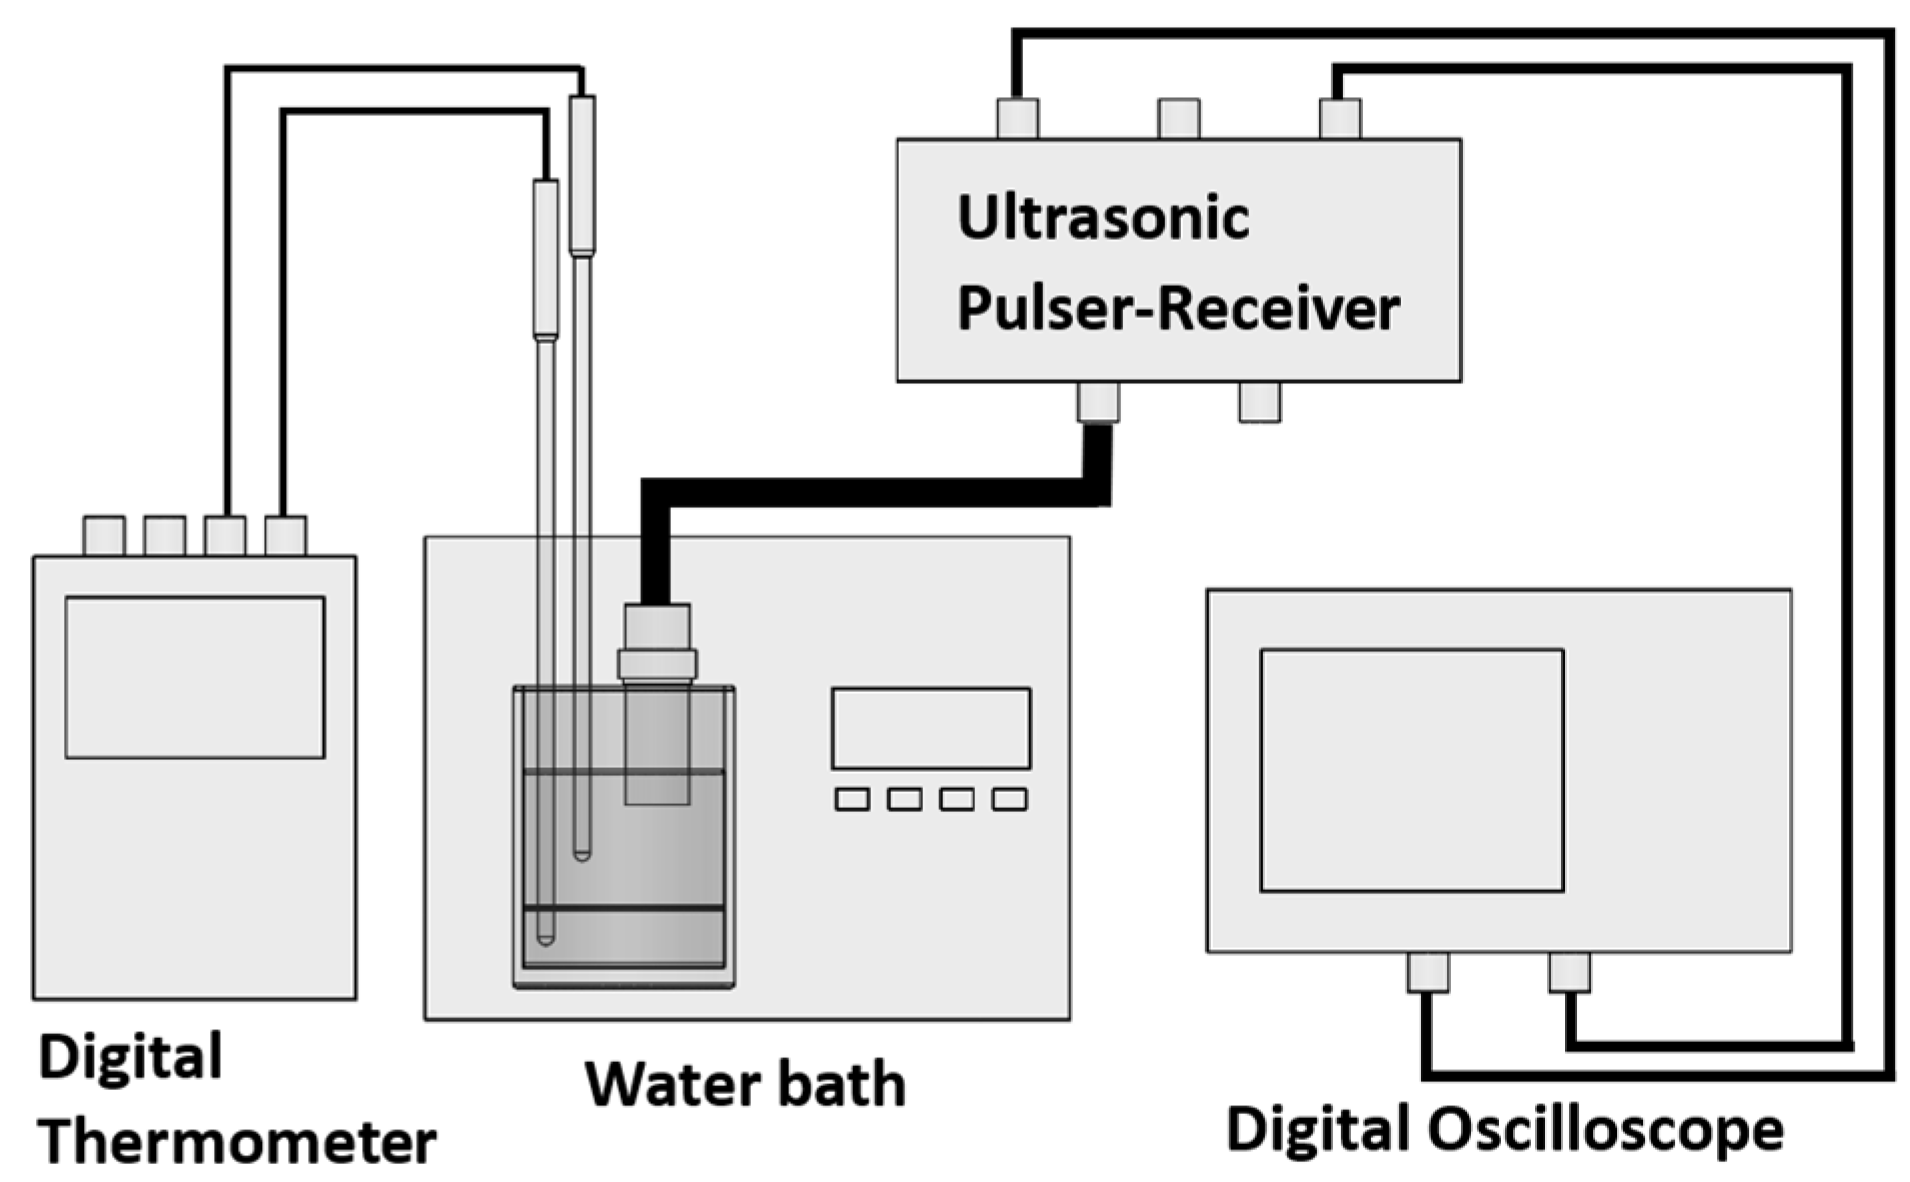
3.2. System Setup and Ultrasonic Signal Acquisition

The experimental setup for acquiring ultrasonic signals was divided into two stages. The first stage involved the individual characterization of each tissue simulator (single layer phantoms). In the second stage, the behavior of the phantoms was characterized for both the healthy breast model and the tumor model, using double and triple layers, respectively. Three experimental repetitions of each of these configurations were performed under the same conditions.

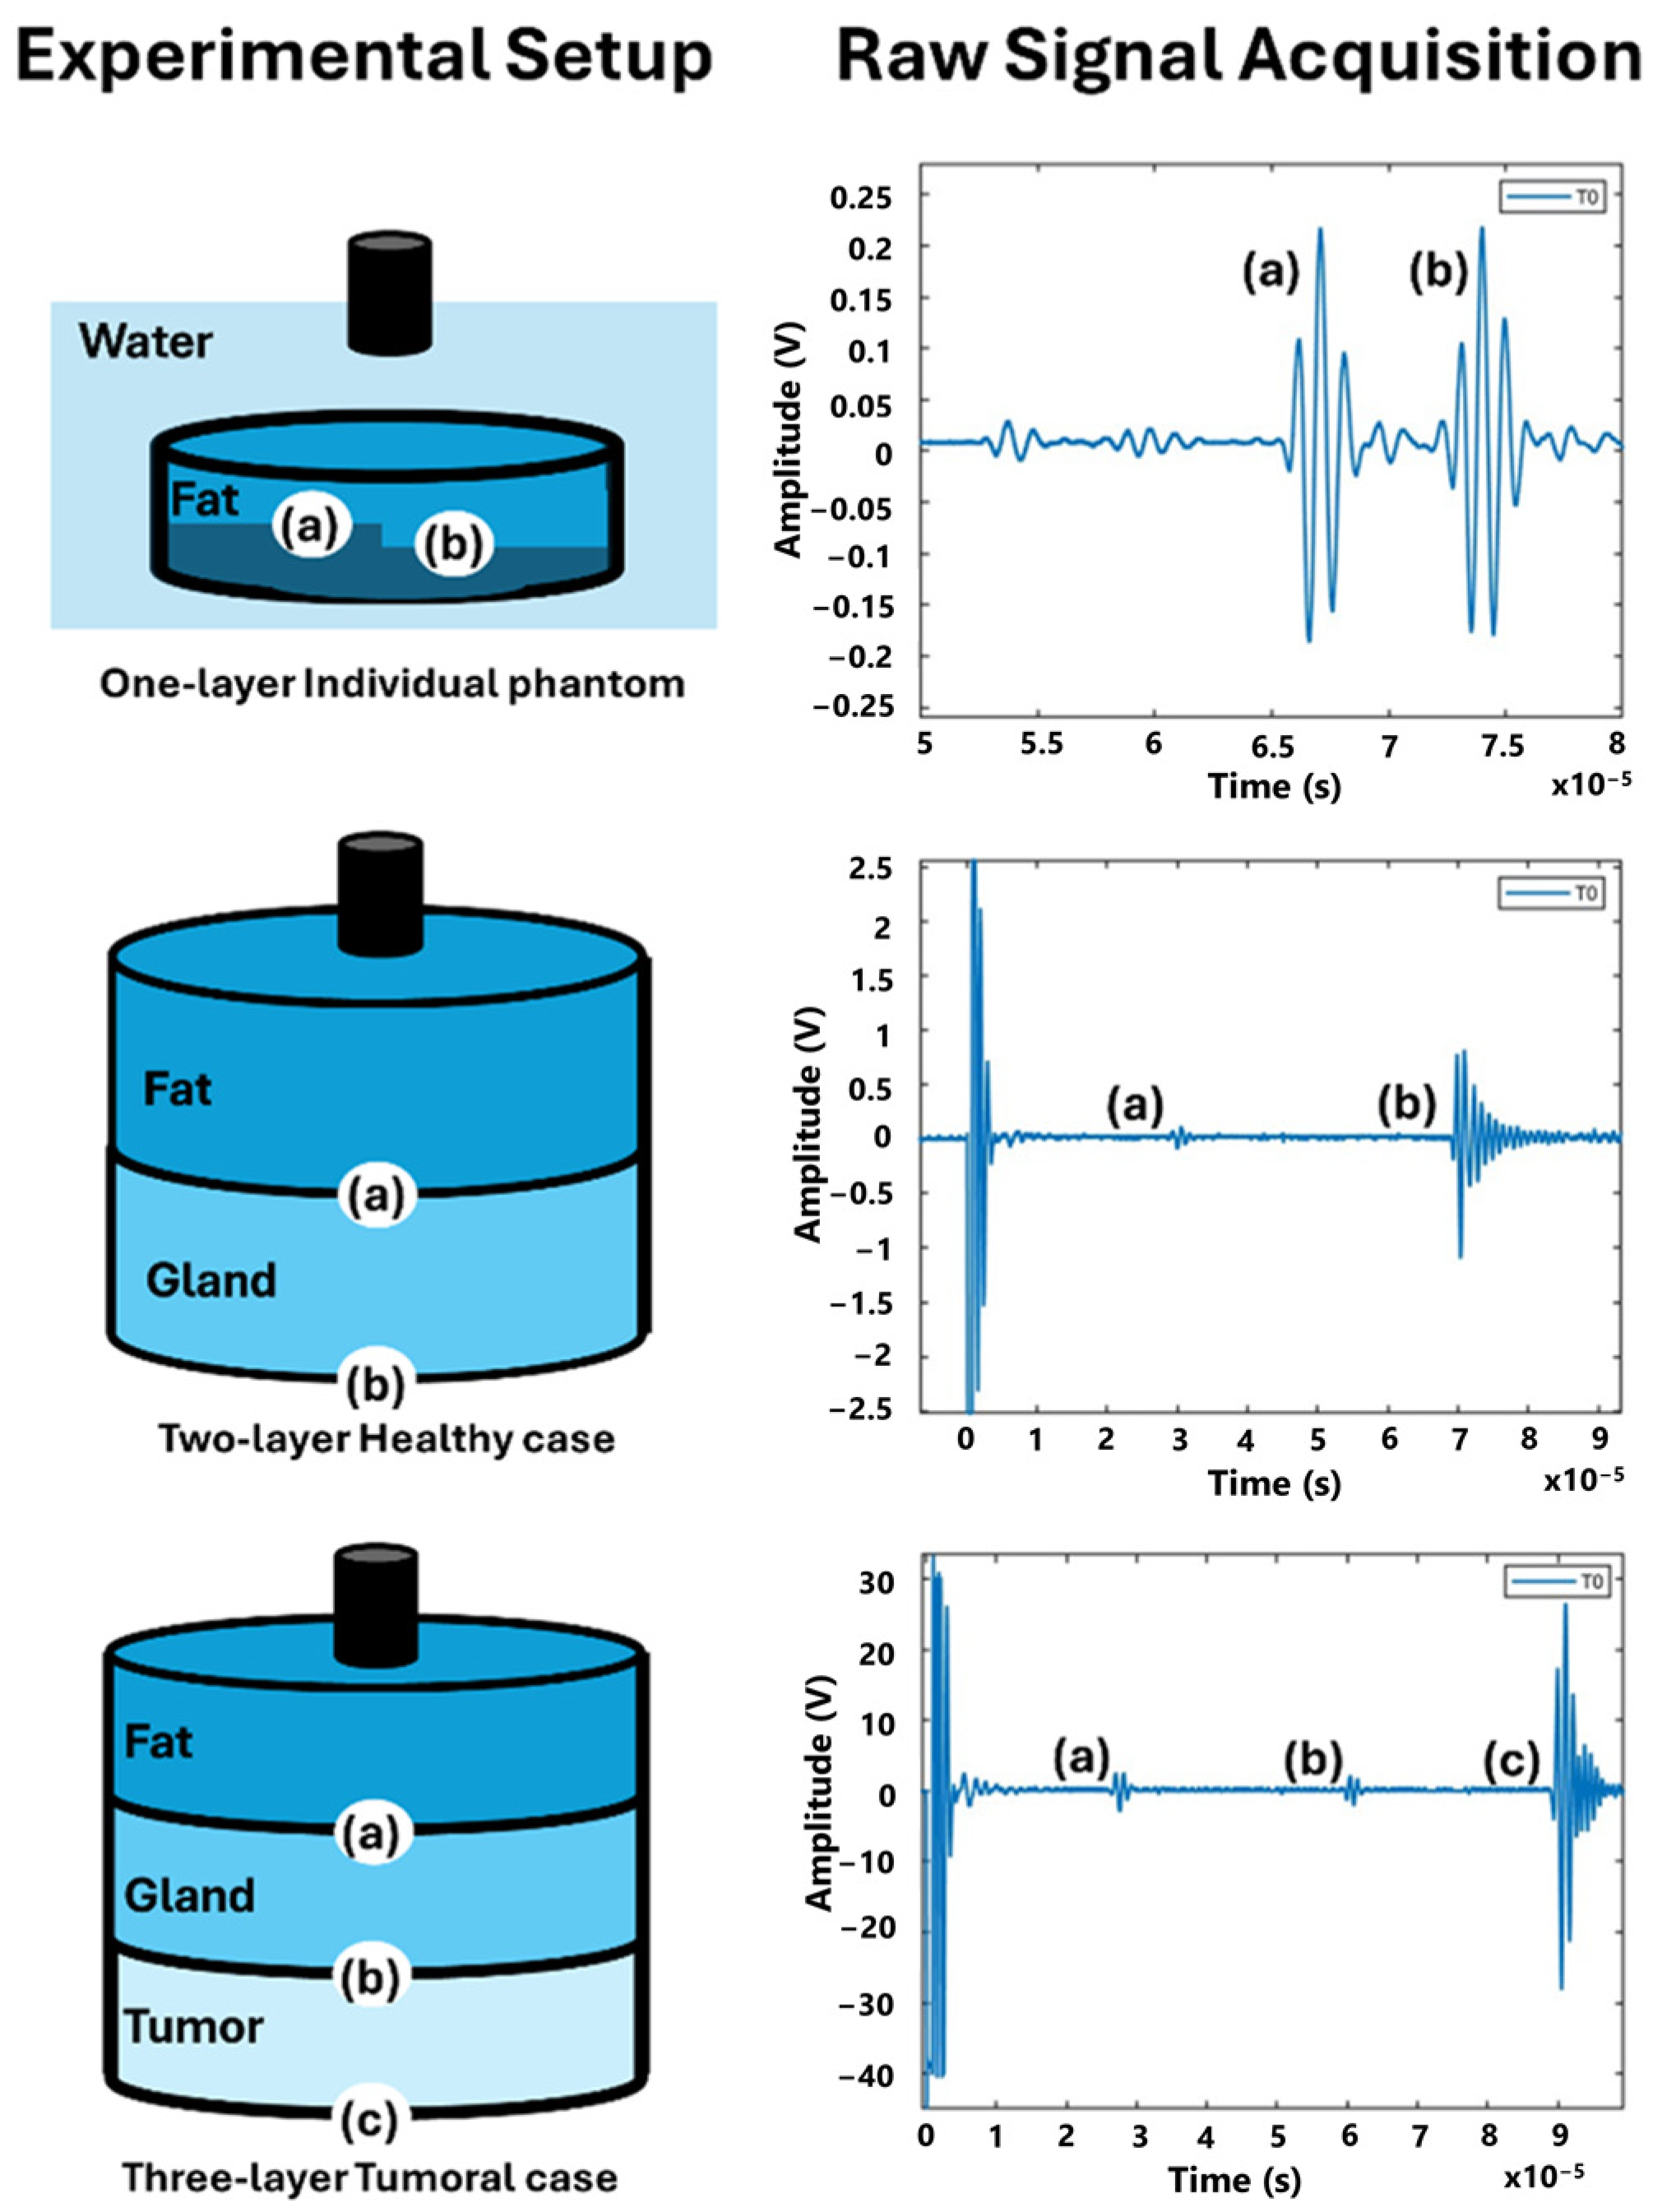
3.2.1. Design of Experiment: Single-Layer Phantom

For the setup configuration of the ultrasonic inspection system for the single-layer phantom case, the mounting device was designed using SolidWorks, 2024 (Dassault Systèmes—SolidWorks Corporation). The mounting device consists of two sections: one for monitoring temperature using K-type thermocouples within the single phantom, and the other for acquiring ultrasonic signals with a transducer probe. Figure 2a illustrates the design, which is divided into four quadrants, while Figure 2b provides a view of the model without the bases, highlighting the position of the phantoms, temperature sensors, and acquisition devices; Figure 2c indicates the individual phantom mold. In Figure 2a, Quadrant I includes support S1 for K-type thermocouples T1, T2, and T3, connected to a digital thermometer (Lutron) used to monitor the temperature at different depths within Phantom 2; each of them has a length of 150 mm, labeled as LT. The thermocouples are positioned at depths of 5 mm (T1), 7.5 mm (T2), and 10 mm (T3), considering that the total thickness of the phantom, G, is 15 mm. The thermocouples are spaced 12.5 mm apart and are distributed across the 50 mm diameter, labeled as DP, in Phantom 2. This ensures that ultrasonic acquisition is performed once the temperature has stabilized at the three central points. In Figure 2a, Quadrant II contains the thermocouples immersed in a solid mass, Phantom 2, encased by walls with a T-shaped flange, S2. This design prevents the phantom from leaking through any openings and ensures the thermocouples remain properly immersed, avoiding potential leaks of water or air that could lead to undesired temperature gradients. In Figure 2a, Quadrants III and IV are dedicated to fixing the area where ultrasound is transmitted through the phantom to obtain the signal. In Quadrant III, Phantom 1 is secured to the base by two rectangular structures labeled as S3 and S4; this facilitates ultrasound passage without interference and prevents the phantom from floating when submerged in distilled water. It is important to note that Phantom 1 is not directly poured into the device; instead, it is cast in a separate, circular mold, IPM. This mold shapes the phantom into a cylinder and allows for the incorporation of a circular aluminum disk, SD, which is 48 mm in diameter and 10 mm thick, with a 5 mm central elevation to maintain a controlled distance within the phantom. This setup facilitates the collection of echoes inside the phantom, enhancing the efficiency of SOS characterization, as depicted in Figure 2c.
The near field, focal spot, and far field for the 1 MHz transducer were calculated using a transducer diameter, DT, of 0.0158 m and a sound velocity of water at 1500 m/s. These calculations served as a reference for determining the optimal distance between the transducer face and the phantom, which is 0.0416 m, labeled as LPF. The focal point was positioned at the water–phantom interface. Quadrant IV displays the fixed geometry of the transducer TR, including the defined radiation area used for the experiment.

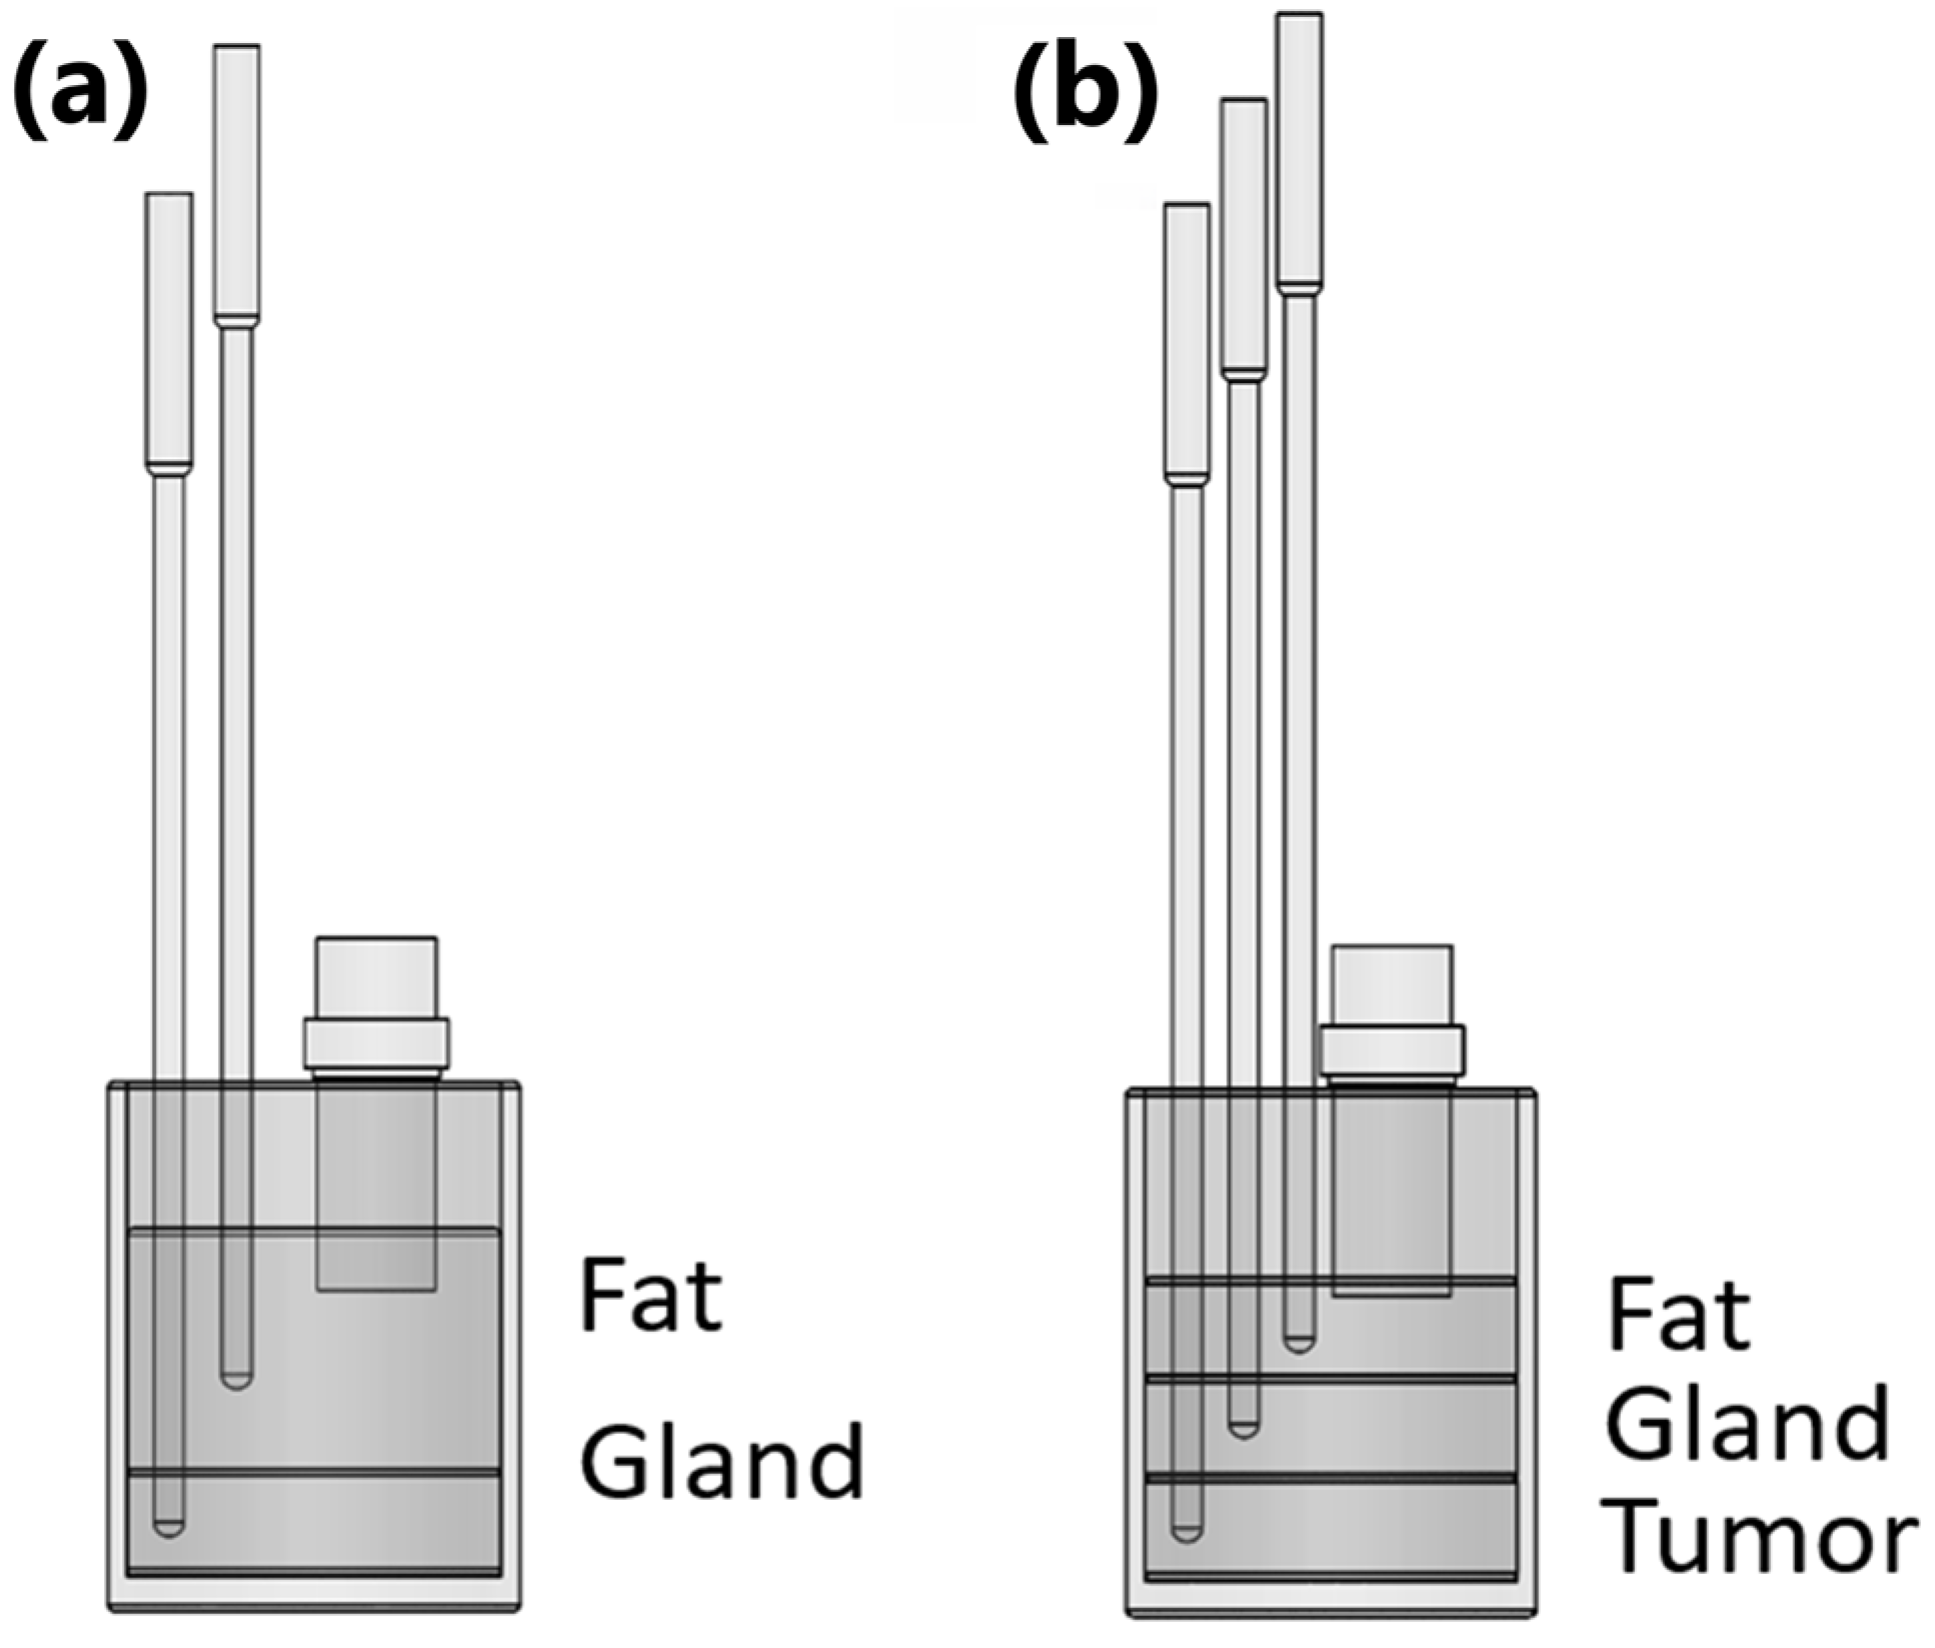
3.2.2. Design of Experiment: Bilayer and Tri-Layer Phantoms

For the healthy breast phantom, the configuration depicted in Figure 3a was used. This configuration includes the first layer of fat with a thickness of 23.5 mm, followed by a gland layer with a thickness of 32.4 mm. In the case of the composite phantom with an abnormality, as depicted in Figure 3b, an additional tumor layer was incorporated beneath the gland layer. For this configuration, the fat layer has a thickness of 21 mm, the gland layer is 24 mm thick, and the tumor layer is 24.5 mm thick. Both configurations employed a 1 MHz transducer, and K-type thermocouples placed in the middle of each layer to monitor the temperature within each layer.

3.2.3. Signal Acquisition Protocol

For the ultrasonic inspection, the connection diagram illustrated in Figure 4 was utilized. Initially, the phantom to be inspected was immersed in a water bath (Thermo Scientific, GP05) with a resolution of 0.1 °C and stability of 0.2 °C, using distilled water as the coupling medium for the individual phantom configuration. In contrast, for the configurations involving healthy and tumoral cases, the fatty layer serves directly as the coupling medium, facilitating the transmission of ultrasonic waves in both scenarios. The phantom was kept submerged for 24 h at room temperature to stabilize its temperature. The temperature of the phantom was monitored with a resolution of 0.1 °C.
Afterward, the water bath’s heating system was activated and set to a temperature 1 °C higher than the initial measurement, gradually raising the temperature until it reached 32 °C. The ultrasonic transducer, operating at 1 MHz (Olympus, V303, Houston, TX, USA), has a central frequency of 0.92 MHz, a bandwidth at −6 dB of 58.27%, and a peak frequency of 0.91 MHz. The transducer was placed perpendicularly to the sample and was connected to an ultrasonic pulser (Olympus, 507PR), operating in pulse–echo mode, with a pulsed input of 100 V and a pulse-repetition frequency of 500 Hz.
The echo signals were captured using an oscilloscope (Tektronix, DPO2012B, Beaverton, OR, USA) with a sampling rate of 1 GS/s. This procedure was repeated for each temperature of interest between 32 °C and 36 °C in 0.5 °C increments. Temperature stabilization requires an average time of 25 min for every 0.5 °C increase.
Figure 5 presents examples of raw signals acquired from different phantoms: a single-layer phantom, a bilayer phantom, and a three-layer phantom. The figure highlights the interfaces for each case study along with the corresponding echoes observed during raw signal acquisition. In the one-layer individual phantom, there are two interfaces: (a) Phantom/First Step and (b) Phantom/Second Step. Similarly, the Two-layer Healthy Case also features two interfaces: (a) Fat/Gland and (b) Gland/Hard Wall. In the Three-Layer Tumoral Case, three interfaces are present: (a) Fat/Gland, (b) Gland/Tumor, and (c) Tumor/Hard Wall.

3.2.4. Signal Conditioning

The conditioning process for both single-layer signals and layered phantom signals followed the same procedure. The signals acquired consisted of 100,000 data points. The data were analyzed using MATLAB 2023a (MathWorks) software. Each signal was segmented to analyze the echoes of interest individually. The window size was selected based on the dimensions of each echo associated with a specific interface, ensuring that each window included the corresponding echo at all temperatures of interest.
A bandpass filter with a −3 dB roll-off and cutoff frequencies of 0.1 MHz and 2.8 MHz was applied to each window.

3.3. Methods for Determining the Speed of Sound in Phantoms

3.3.1. Single-Layer SOS Characterization

For the SOS characterization of individual phantoms, two echoes were obtained: (a) Phantom/First Step and (b) Phantom/Second Step. The index of maximum correlation value between two signals of interest, divided by the sampling frequency, indicates the time delay, represented as Δt, due to temperature difference between signals. These values were calculated by correlating the window associated with interface (a) Phantom/First Step at 32 °C with the windows corresponding to other temperatures at the same interface, ranging from 32.5 °C to 36 °C in steps of 0.5 °C. Using the same approach, the procedure was applied to (b) Phantom/Second Step interface to determine the Δt associated with the temperature change.
Figure 6a shows the echo of fatty tissue at a reference temperature, T0, and a displaced echo due to an increase in temperature T1. Figure 6b shows the result of the cross-correlation of these echoes, where the maximum correlation occurs at negative lags relative to the reference. In contrast, Figure 6c displays the echoes corresponding to the behavior of glandular tissue, predominantly composed of water, where T0 represents the reference echo and T1 is the displaced echo caused by the temperature increase. Unlike the fat case, Figure 6d illustrates that, when correlating the glandular echoes, the maximum correlation occurs at positive lags relative to the reference.
The sign-corrected or rectified Δt ( Δ t r e c t ), associated with interface (b) Phantom/Second Step, was then subtracted from Δ t r e c t ,   associated with interface (a) Phantom/First Step, at the same temperature.

3.3.2. Bilayer SOS Characterization

For the characterization of the phantom composed of two layers simulating healthy breast tissue, the procedure was adjusted to account for the delay of each layer. Two echoes were obtained: one from the (a) Fat/Gland interface and another from the (b) Gland/Hard Wall interface. In a phantom made up of different types of tissues, each echo ToF represents the time taken for sound to traverse all the layers until the interface (accumulated ToF). Since the echoes from deeper layers accumulate delays from the previous ones, it is essential to eliminate these accumulated delays subtracting delays from previous layers.
The time delays, Δt, were calculated for the first layer by correlating the window associated with the (a) Fat/Gland interface at 32 °C with the windows corresponding to other temperatures at the same interface (a) Fat/Gland, ranging from 32.5 °C to 36 °C in 0.5 °C increments. The correlations provided the lag in samples relative to the reference temperature (32 °C), which was then converted to time delays (Δt) by dividing the shifted samples by the sampling frequency. Using the same approach, the procedure was applied to the (b) Gland/Hard Wall interface.
The ToF to the first echo (a) Fat/Gland interface at an initial reference temperature is represented as t 01   in Figure 7, while the ToF to the second echo at the same reference temperature is represented as t 02 .
In this context, when internal temperature increases uniformly inside the phantom body, t 11   and t 12 correspond to the new ToF’s to the echoes of the (a) Fat/Gland interface and (b) Gland/Hard Wall interface, respectively, measured at the new temperature. These time measurements, which are typically on the order of microseconds, allow us to calculate the differences (Δt) in ToF due to temperature changes for each echo using Equations (2) and (3).
These differences can represent time delays (+) if the echo moves away from the origin (zero seconds) or time advances (−) if the echo moves closer to it.
For the second echo associated with the (b) Gland/Hard Wall interface, the cumulative effect of the delay (or advance) of echo for the (a) Fat/Gland interface must be subtracted from the delay of the echo of the (b) Gland/Hard Wall interface (Equation (4)) to isolate the effect of gland medium from the fat medium. This approach allows us to relate the observed delay or advance directly to changes in ultrasonic velocity in the gland medium.
Δ t 11 = t 01 t 11
Δ t 12 = t 02 t 12
Δ t 12 = Δ t 12 Δ t 11

3.3.3. Tri-Layer SOS Characterization

For the case of the breast phantom with a tumor, a similar process to the bilayer scenario was followed, with the distinction that a third medium was introduced. Three echoes were observed: one from the (a) Fat/Gland interface, another from the (b) Gland/Tumor interface, and a third from the (c) Tumor/Hard Wall interface. These are shown in Figure 5 for the Three-Layer Tumoral Case. The procedure for obtaining the time shifts due to temperature increase and the ToF for each temperature was the same as that used in the Two-layer Healthy Case. Therefore, only the description of the process used to calculate the time shifts and ToF in the tumor medium will be included.
The time delays, Δt, were calculated by correlating the window associated with the (c) Tumor/Hard Wall interface at 32 °C with the windows corresponding to other temperatures at the same interface, ranging from 32.5 °C to 36 °C in 0.5 °C increments. These correlations provided the lag in samples relative to the reference temperature (32 °C), which was then converted into time delays (Δt) by dividing the shifted samples by the sampling frequency. A sign correction was applied following the same approach.
The ToF to the third echo from the (c) Tumor/Hard Wall interface at the initial reference temperature of 32 °C is denoted as t 03 in Figure 7, while the ToF for the same echo at an increased temperature is denoted as t 13 . The difference ( Δ t 13 ) in ToF due to temperature change for the third echo were calculated using Equation (5). For the third echo from the (c) Tumor/Hard Wall interface, the cumulative effect of the delay (or advance) of echoes from the (a) Fat/Gland interface and the (b) Gland/Tumor interface must be subtracted from that of the echo of the (c) Tumor/Hard Wall interface (Equation (6)) to isolate the effect of the tumor medium from the other two media. This approach allows us to directly correlate the observed delay or advance with changes in ultrasonic velocity in the third medium.
Δ t 13 = t 03 t 13
Δ t 13 = Δ t 13 Δ t 12 Δ t 11

4. Results

4.1. Results of Phantom Elaboration

The density of each individual phantom was calculated. For the gland phantom, the density was calculated to be 862.97 kg/m3, while for the tumor phantom, it was 866.27 kg/m3; both measurements were taken at a sample temperature of 34 °C.
Figure 8a presents the constructed healthy breast phantom, consisting of fat and gland layers, with thermocouples embedded in each layer for temperature monitoring. Figure 8b illustrates the phantom model with a tumor, which is similar to the healthy model but includes an additional layer at the bottom representing the tumor. An additional thermocouple was also embedded in the tumor layer for temperature monitoring.

4.2. Results of Signal Acquisition

As an example, Figure 9a displays the complete signal from the phantom with tumor case, along with three windows containing the echoes associated with the Fat/Gland, Gland/Tumor, and Tumor/Hard Wall interfaces.

4.3. Results of Signal Processing

To calculate the SOSs for the individual phantoms of each medium, the mean delay (Δt) was first determined across three experimental repetitions using Equation (7).
Δ t m e a n = Δ t P h a n t o m   1 + Δ t P h a n t o m   2 + Δ t P h a n t o m   3 3  
A propagation distance of 5 mm was considered. The reference ToF at 32 °C was determined for each phantom, and by adding the average Δt value for each temperature, the corresponding ToF was obtained at each temperature for each medium. In the two- and three-layer phantoms, the same procedure was followed for each layer taking the corresponding average Δt values. SOS computations were conducted within a controlled temperature range of 32 to 36 °C, in increments of 0.5 °C.
Once the velocities for single-, two- and three-layer phantoms were obtained, these were averaged for each kind of mimicked tissue. The corresponding mean and standard deviation values for each mimicked tissue are reported in Table 2. Additionally, the mean coefficients of variation equal to 0.83, 1.48, and 1.10 were obtained for the fat, gland, and tumor phantoms, respectively.
Finally, a linear regression was performed both for the SOS as a function of temperature and for the temperature as a function of the SOS, using the thermocouple temperatures as a reference. The linear regressions are shown in Figure 10, where the 95% confidence intervals are also included.
Figure 10a presents the results of the linear regression of temperature as a function of velocity for fat within the range of 32 °C to 36 °C. The corresponding mathematical expressions are provided in Equation (8) for sound velocity as a function of temperature and in Equation (9) for temperature as a function of velocity, both specifically for fat and within the same temperature range.
C T = 3.8061 T + 1583.2                 m / s
T C = 0.2616 C + 414.2752       ° C
Figure 10b presents the results of the linear regression of temperature as a function of velocity for the glandular phantom within the range of 32 °C to 36 °C. The mathematical expressions for sound velocity as a function of temperature are provided in Equation (10), while those for temperature as a function of sound velocity are given in Equation (11). Both of these are specifically for the glandular phantom.
C T = 0.6204 T + 1515.0               m / s
T C = 1.5870 C 2403.8               ° C
Figure 10c presents the results of the linear regression of temperature as a function of velocity for the tumor phantom within the range of 32 °C to 36 °C. The mathematical expressions for sound velocity as a function of temperature are provided in Equation (12), while those for temperature as a function of sound velocity are given in Equation (13). Both of these correspond specifically to the tumor phantom.
C T = 1.5743 T + 1522.3               m / s
T C = 0.6251 C 951.0423     ° C

5. Discussion

The aim of this research was to develop a breast phantom composed of multiple layers that simulate acoustic properties and to validate it for thermoacoustic measurements.
Concisely, the contribution of this work was to develop a fully characterized breast phantom that simulates the SOS of fat, mammary gland, and breast tumor in the temperature range of 32 °C to 36 °C, which is the range for thermometric diagnosis. In this sense, the authors did not find previous reports about multilayer phantoms that mimic the human breast for diagnoses based on ultrasonic thermometry; most of them are present focused ultrasound therapies, where temperature ranges are greater (40–90 °C). This is because the objective of thermal therapies is to kill cancer cells or directly to burn the affected tissue. The materials and procedures used to fabricate the proposed phantom do not require sophisticated protection, nor do they represent high-risk maneuverability; so, the presented method is a viable and economic option for elaboration in a generic laboratory.
Our phantom comprises three layers, simulating the acoustic behavior of (i) a mammary gland, (ii) breast fat, and (iii) the tumoral tissue both individually and as a whole system. This means that the phantom can be used to recreate the thermal behavior of acoustic velocity in each layer and the cumulative effects of ultrasonic signals due to the multilayer composition. The phantom has been considered and validated. Most of the phantoms found in other works consist of a based mixture containing masses with different compositions.
Finally, we obtain the mathematical models based on linear regressions that characterize the thermal behavior of each layer contained in our breast phantom. These enable internal temperature measurements to be conducted using our phantom based on ultrasonic inspection for calibration; additionally, it is possible to test new algorithms, developed for thermometric purposes.
However, not all acoustic and thermal parameters that could influence exposure, such as attenuation, reflection coefficients, or specific heat capacity, were considered. Our primary focus was on analyzing the SOS at different temperatures and validating its behavior in individual cases, ensuring that it remained consistent when layered for each tissue type. This behavior was validated using the cross-correlation method, with a proposal for eliminating accumulated delays. The obtained results are discussed in this section.
According to the values reported by Nguyen [62], the density of mammary gland tissue is 1050 kg/m3, while the average density obtained for his gland phantom is 1037 kg/m3. Comparing these values with the density of the gland phantom developed in this study, a percentage error of 17.81% is obtained with respect to the value measured in vivo, and a percentage error of 16.78% is obtained when compared to Nguyen’s gland phantom. Similarly, the tumor phantom shows a percentage error of 17.50% compared to the value measured in vivo and 15.98% compared to the value reported by Nguyen.
On the other hand, Menikou [64] reports an agar density in the range of 1004 kg/m3 to 1037 kg/m3, resulting in a minimum error of 14.4% for the gland phantom and 13.72% for the tumor phantom.
These considerable errors may be due to factors such as the sample’s temperature at the time of measurement and potential inaccuracies during the measurement process. Although density was not specifically intended to be simulated, it is a relevant parameter, as improving it is crucial for developing more accurate phantoms.
In Figure 8a,b, we can observe the structure of phantom proposed here; in contrast to the model proposed by Menikou [64], this phantom is spatially heterogeneous, allowing for the observation and analysis of reflections from the different layered structures within the breast phantom, both in the case of healthy tissue and tumor tissue. Although anatomical structure was not implemented, as in Nguyen’s model [62], its design allows the identification of different tissue types, such as fat and predominantly water-based tissues like the gland and tumor. As mentioned earlier, these tissues exhibit different acoustic behaviors when subjected to temperature changes. In contrast, although Nguyen’s anatomical model [62] presents a more realistic structure, it is not suitable for inspections at different temperatures due to the melting point of gelatin, which ranges between 27 and 30 °C according to Chen [63]. This author also points out that the use of agar provides stability at temperatures below 90 °C and is thermoreversible, making it an ideal material for such applications.
According to Pernot [17], the speckle tracking technique for temperature estimation establishes a linear relationship between ultrasound time of flight and temperature for increases of less than 10 °C, which has been validated in biological soft tissues. However, for higher temperature increases, though still below the necrosis threshold, it has been reported that this relationship becomes nonlinear. In this context, the technique remains viable for the temperature estimations proposed here for diagnostic purposes, as its application is confined to the 32 °C to 36 °C range, where the behavior remains linear. This interval ensures stable acoustic properties and enables the detection of small thermal changes, as shown graphically in Figure 9 for the tumor phantom case. Furthermore, Acero [78] on computational modeling of breast tissue revealed temperature gradients in both healthy breast tissue and tumors with diameters of 5, 6, and 8 mm, emphasizing that 5 mm tumors exhibit temperature gradients within the range of 33 °C to 35 °C, which adds greater relevance to the analysis conducted in this study.
The mathematical model proposed to calculate the SOS in fat (Equation (8)), derived from the combination of experiments for the individual case, healthy case, and tumoral case, within the limited range of 32 °C to 36 °C, showed a variation of −3.8061 m/s per °C. This behavior remained consistent across all experiments and demonstrated strong agreement with the results reported by Li et al. [55], who indicated values of 1422 m/s ± 9 m/s for fatty breast tissue and 1470 m/s for a subcutaneous fat phantom. In the present study, the values obtained fall between these, with 1461.40 m/s at 32 °C and 1446.18 m/s at 36 °C for the fat phantom. Figure 10a illustrates the relationship between temperature and SOS, showing a change of −0.2616 °C per m/s, as specified in Equation (9). This serves as a predictive model for estimating temperature based on the SOS in fat phantoms. However, it is challenging to compare these results with other studies due to the specific range and the complexity of analyzing layered tissue structures.
In contrast, the behavior of the SOS as a function of temperature (Equation (10)) and the temperature estimated from the SOS in the gland phantom (Equation (11)) exhibits a positive slope, as illustrated in Figure 10b. These results are derived from the combination of experiments conducted in each case. Specifically, variations of 0.6204 m/s per °C are observed, with boundary values of 1534.85 m/s at 32 °C and 1537.33 m/s at 36 °C. When comparing these data with those reported by Li et al. [55] for breast gland phantoms, an error of 1.31% is recorded concerning the lower limit obtained in this study; this error is 1.47% regarding the upper limit.
Based on these results, it is confirmed that the change in SOS due to temperature in fat is opposite in direction to the behavior of the SOS in aqueous tissue, as mentioned by other authors [17,27].
At this stage, Equation (12) outlines the linear mathematical model describing the behavior of the SOS as a function of temperature change for the tumor phantom, derived from the experiments conducted on both individual and tumor cases. As observed, the SOS increases at a rate of 1.5743 m/s per °C, starting from a value higher than that recorded for the gland phantom, with 1572.68 m/s at 32 °C and reaching 1578.97 m/s at 36 °C. These results are aligned with those reported by Li et al. [55], who indicated a speed of 1548 ± 17 m/s for malignant breast lesions, as well as a SOS of 1513 ± 27 m/s for benign lesions. Additionally, Figure 10c and Equation (13) describe the behavior of temperature as a function of the variation in the SOS, with a rate of 0.6251 °C per m/s. Based on these results, it can be inferred that the relationship between the SOS in tumor tissue and temperature allows for the identification of malignant or benign lesions in the breast. Moreover, the calculation of these variations or thermal gradients can provide relevant information about the size and location of a lesion, as mentioned in Acero [78].

Comparative Analysis with Commercial Brands

There are several brands of commercial phantoms for ultrasound imaging, and all of them have been developed for training purposes [79,80,81,82,83,84,85,86]. Few can be used for equipment calibration too. They are constructed with patented materials that mimic parameters as SOS, attenuation coefficient, anatomical shape, and density. The SOS and attenuation coefficient can vary depending on the material, e.g., the SOS value is approximately 1540 m/s for phantoms based on a material called Zerdine, and 1450 m/s ± 1.0% at 23° for phantoms based on urethane; the attenuation coefficient of Zerdine is within the range of 0.7 to 0.95 dB/cm/MHz and that of urethane is 0.5 dB/cm/MHz ± 10% [79,80].
There is a wide variety of phantoms, from multipurpose to very specific ones; e.g., Sun Nuclear Inc. (FL, USA) provides ultrasound phantoms for many applications (Doppler, elastography, biopsy, etc.) and Elevate Health Care Inc. (FL, USA) provides phantoms for many specialties (abdominal, cardiology, musculoskeletal, small parts, among others). No information was found about commercial phantoms developed for thermometric purposes. Specifically, breast models [81,84,85,86] are designed to help practitioners develop skills for invasive procedures such as needle biopsies, or on detecting breast masses. Important advantages are that they provide long duration (1 year or more), and they are reusable. Most of them are composed of background material with embedded masses simulating different kinds of lesions: cysts, microcalcifications, tumors, etc. Just one phantom called BREASTFAN (Kyoto Kagaku Co., Ltd., Kyoto, Japan) simulates different structures of the breast: the subcutaneous adipose, the mammary gland, the galactophore, Cooper’s ligament, the retromammary adipose, the costae, the clavicle, the pectoralis major, the lung, and the lymph nodes at axilla. However, this case is for training on imaging purposes too [84]. Not all providers give open information about the costs of the phantom, but based on the available information, we can establish that breast phantoms cost USD 350–650 [85,86].
In comparison with our breast phantom, developed and described in this work, we conclude with the following facts:
Until now, there have been no reported commercial phantoms for thermometric applications; therefore, our phantom is a viable option, fulfilling the need for this specific application.
The advantages of commercial phantoms are their durability and the fact that they are reusable; nevertheless, most of them do not consider the different tissue layers that compose the breast, which is relevant because different tissues present distinct thermal behaviors. One of the main challenges that arose during the development of our phantom was the need to preserve the distinct thermal behaviors of the layers (simulated tissues) despite the fact that they make up a single composed medium. Our breast phantom represents a low-cost option, where material costs per phantom are under USD 25. The initial investment in the equipment required is about USD 2500, but this is a one-off expense. This fact, in conjunction with the fact that agar is a non-dangerous and manageable component, makes our phantom an accessible and secure option.

6. Conclusions

A multilayer breast phantom was developed to mimic the ultrasonic behavior of tissues that compound human breast tissue in a temperature range of 32 °C to 36 °C. The objective was to provide a viable phantom to assess thermometric applications oriented toward cancer diagnosis. The phantom was composed of adipose, glandular, and tumoral layers; the glandular and tumoral phantoms consist of a mixture based on agar, distilled water, vegetable oil, sodium chloride, and detergent. Different concentrations of these materials were used depending on the type of tissue. The breast fat was simulated with a liquefied layer of lard. A variant of this phantom without the tumoral layer was reproduced to mimic a healthy breast.
In the first stage, individual samples of each layer were created and inspected in the specified temperature range using an ultrasonic pulse–echo method. As a second step, phantoms consisting of two (fat and gland) or three (fat, gland and tumor) superposed layers were constructed and inspected in the same temperature range. To evaluate the SOS changes with temperature variation in each layer, the cross-correlation technique was applied to the acquired ultrasonic signals and delays between interlayer echoes were obtained using the signal at the lower temperature of 32 °C (taken as the basal temperature of the breast surface) as a reference. Afterwards, linear regression was used to obtain the relation between the SOS and the temperature for each type of phantom. The obtained equations were C T = 3.8061 T + 1583.2 m / s ;   C T = 0.6204 T + 1515.0 m / s and C T = 1.5743 T + 1522.3 m / s for adipose, glandular, and tumoral phantoms, respectively. In all cases, all average measurements fall into a confidence interval of 95%.
The results confirmed that the SOS in the different tissues followed a linear relationship with temperature; this finding is consistent with previously reported data.
While the phantom models in this study effectively replicated the acoustic properties of breast tissue, limitations such as the need for greater precision in simulating individual tissue variations were identified. Not all acoustic and thermal parameters were measured to validate the phantom’s behavior in response to temperature variation; this is because the main objective of the developed phantom is thermal estimation based on the SOS measurement. However, the composition of the mixture was formed by components that have been previously proven to have similar thermal properties as breast tissue. In a future study, the development of a more realistic phantom that approximates multiple thermal properties of tissue could be addressed, improving the phantom models and their clinical validation. Another important characteristic in this kind of application is the characterization of expansion coefficients; ultrasonic thermometric methods currently consider this issue to be negligible, but it could introduce undesirable deviations in the measurements.
Finally, additional measurement repetitions could be performed to enable us to obtain more representative statistics. However, our measurements fall into the classical sample set reported in other works.

Author Contributions

Conceptualization, R.V.A.M. and I.B.; Data curation, R.V.A.M.; Formal analysis, R.V.A.M., I.B. and A.R.-G.; Funding acquisition, I.B.; Investigation, R.V.A.M., I.B. and A.R.-G.; Methodology, R.V.A.M., I.B. and A.R.-G.; Project administration, I.B. and A.R.-G.; Resources, I.B.; Software, R.V.A.M.; Supervision, I.B. and A.R.-G.; Validation, I.B. and A.R.-G.; Visualization, R.V.A.M.; Writing—original draft, R.V.A.M.; Writing—review and editing, I.B. and A.R.-G. All authors have read and agreed to the published version of the manuscript.

Funding

This research was funded by the Secretariat of Science, Humanities, Technology and Innovation (SECIHTI) by means of the grant 792702 awarded to R. Valeria Acero M. to carry out her doctoral studies and by the Autonomous University of Aguascalientes for the financing granted for the development of project PII20-4 and PII22-1. The APC was funded by Autonomous University of Aguascalientes.

Institutional Review Board Statement

Not applicable.

Informed Consent Statement

Not applicable.

Data Availability Statement

The original contributions presented in the study are included in the article; further inquiries can be directed to the corresponding author/s.

Conflicts of Interest

The authors declare no conflicts of interest.

References

  1. Sung, H.; Ferlay, J.; Siegel, R.L.; Laversanne, M.; Soerjomataram, I.; Jemal, A.; Bray, F. Global Cancer Statistics 2020: GLOBOCAN Estimates of Incidence and Mortality Worldwide for 36 Cancers in 185 Countries. CA Cancer J. Clin. 2021, 71, 209–249. [Google Scholar] [CrossRef]
  2. Yuan, Y.; Wang, Q.; Tan, Y.; Rong, L.; Tai, S.S.; Ye, L.J.; Liu, Z. Analysis of Breast Diseases Examination with Thermal Texture Mapping, Mammography and Ultrasound. In Proceedings of the 26th Annual International Conference of the IEEE Engineering in Medicine and Biology Society, San Francisco, CA, USA, 1–5 September 2004; Volume 3, pp. 1166–1169. [Google Scholar]
  3. Mambou, S.J.; Maresova, P.; Krejcar, O.; Selamat, A.; Kuca, K. Breast Cancer Detection Using Infrared Thermal Imaging and a Deep Learning Model. Sensors 2018, 18, 2799. [Google Scholar] [CrossRef] [PubMed]
  4. Kontos, M.; Wilson, R.; Fentiman, I. Digital Infrared Thermal Imaging (DITI) of Breast Lesions: Sensitivity and Specificity of Detection of Primary Breast Cancers. Clin. Radiol. 2011, 66, 536–539. [Google Scholar] [CrossRef] [PubMed]
  5. Head, J.F.; Wang, F.; Lipari, C.A.; Elliott, R.L. The Important Role of Infrared Imaging in Breast Cancer. IEEE Eng. Med. Biol. Mag. 2000, 19, 52–57. [Google Scholar] [CrossRef] [PubMed]
  6. Han, F.; Shi, G.; Liang, C.; Wang, L.; Li, K. A Simple and Efficient Method for Breast Cancer Diagnosis Based on Infrared Thermal Imaging. Cell Biochem. Biophys. 2015, 71, 491–498. [Google Scholar] [CrossRef]
  7. Qi, H.; Diakides, N.A. Thermal Infrared Imaging in Early Breast Cancer Detection-a Survey of Recent Research. In Proceedings of the 25th Annual International Conference of the IEEE Engineering in Medicine and Biology Society (IEEE Cat. No.03CH37439), Cancun, Mexico, 17–21 September 2003; Volume 2, pp. 1109–1112. [Google Scholar]
  8. Paulsen, K.D.; Moskowitz, M.J.; Ryan, T.P.; Mitchell, S.E.; Hoopes, P.J. Initial in Vivo Experience with EIT as a Thermal Estimator during Hyperthermia. Int. J. Hyperth. 1996, 12, 573–591. [Google Scholar] [CrossRef]
  9. Meaney, P.M.; Paulsen, K.D.; Hartov, A.; Crane, R.K. Microwave Imaging for Tissue Assessment: Initial Evaluation in Multitarget Tissue-Equivalent Phantoms. IEEE Trans. Biomed. Eng. 1996, 43, 878–890. [Google Scholar] [CrossRef]
  10. Jolesz, F.A. MRI-Guided Focused Ultrasound Surgery. Annu. Rev. Med. 2009, 60, 417–430. [Google Scholar] [CrossRef]
  11. Burfeindt, M.J.; Colgan, T.J.; Mays, R.O.; Shea, J.D.; Behdad, N.; Van Veen, B.D.; Hagness, S.C. MRI-Derived 3-D-Printed Breast Phantom for Microwave Breast Imaging Validation. IEEE Antennas Wirel. Propag. Lett. 2012, 11, 1610–1613. [Google Scholar] [CrossRef]
  12. Merckel, L.G.; Knuttel, F.M.; Deckers, R.; van Dalen, T.; Schubert, G.; Peters, N.H.G.M.; Weits, T.; van Diest, P.J.; Mali, W.P.T.M.; Vaessen, P.H.H.B.; et al. First Clinical Experience with a Dedicated MRI-Guided High-Intensity Focused Ultrasound System for Breast Cancer Ablation. Eur. Radiol. 2016, 26, 4037–4046. [Google Scholar] [CrossRef]
  13. Keenan, K.E.; Wilmes, L.J.; Aliu, S.O.; Newitt, D.C.; Jones, E.F.; Boss, M.A.; Stupic, K.F.; Russek, S.E.; Hylton, N.M. Design of a Breast Phantom for Quantitative MRI. J. Magn. Reson. Imaging 2016, 44, 610–619. [Google Scholar] [CrossRef] [PubMed]
  14. Liney, G.P.; Tozer, D.J.; Turnbull, L.W. A Simple and Realistic Tissue-Equivalent Breast Phantom for MRI. J. Magn. Reson. Imaging 1999, 10, 968–971. [Google Scholar] [CrossRef]
  15. Lutz, N.W.; Bernard, M. Contactless Thermometry by MRI and MRS: Advanced Methods for Thermotherapy and Biomaterials. iScience 2020, 23, 101561. [Google Scholar] [CrossRef]
  16. Ruschin, M.; Davidson, S.R.H.; Phounsy, W.; Yoo, T.S.; Chin, L.; Pignol, J.-P.; Ravi, A.; McCann, C. Technical Note: Multipurpose CT, Ultrasound, and MRI Breast Phantom for Use in Radiotherapy and Minimally Invasive Interventions. Med. Phys. 2016, 43, 2508–2514. [Google Scholar] [CrossRef]
  17. Pernot, M.; Tanter, M.; Bercoff, J.; Waters, K.R.; Fink, M. Temperature Estimation Using Ultrasonic Spatial Compound Imaging. IEEE Trans. Ultrason. Ferroelectr. Freq. Control 2004, 51, 606–615. [Google Scholar] [CrossRef] [PubMed]
  18. Daschner, R.; Hewener, H.; Bost, W.; Weber, S.; Tretbar, S.; Fournelle, M. Ultrasound Thermometry for HIFU-Therapy. Curr. Dir. Biomed. Eng. 2021, 7, 554–557. [Google Scholar] [CrossRef]
  19. Van Dongen, K.W.A.; Verweij, M.D. A Feasibility Study for Non-Invasive Thermometry Using Non-Linear Ultrasound. Int. J. Hyperth. 2011, 27, 612–624. [Google Scholar] [CrossRef]
  20. Lai, C.-Y.; Kruse, D.E.; Caskey, C.F.; Stephens, D.N.; Sutcliffe, P.L.; Ferrara, K.W. Noninvasive Thermometry Assisted by a Dual-Function Ultrasound Transducer for Mild Hyperthermia. IEEE Trans. Ultrason. Ferroelectr. Freq. Control 2010, 57, 2671–2684. [Google Scholar] [CrossRef]
  21. Wolf, M.; Rath, K.; Ruiz, A.E.R.; Kühnicke, E. Ultrasound Thermometry for Optimizing Heat Supply During a Hyperthermia Therapy of Cancer Tissue. Phys. Procedia 2015, 70, 888–891. [Google Scholar] [CrossRef]
  22. Sethuraman, S.; Anand, A.; Li, J. Integrated Ultrasound Thermometry and Multiphysics Modeling for Liver RF Ablation Monitoring: Ex Vivo Studies. In Proceedings of the 2014 IEEE International Ultrasonics Symposium, Chicago, IL, USA, 3–6 September 2014; pp. 1650–1653. [Google Scholar]
  23. Arthur, R.M.; Straube, W.L.; Starman, J.D.; Moros, E.G. Noninvasive Temperature Estimation Based on the Energy of Backscattered Ultrasound. Med. Phys. 2003, 30, 1021–1029. [Google Scholar] [CrossRef]
  24. Arthur, R.M.; Trobaugh, J.W.; Straube, W.L.; Moros, E.G. Temperature Dependence of Ultrasonic Backscattered Energy in Motion-Compensated Images. IEEE Trans. Ultrason. Ferroelectr. Freq. Control 2005, 52, 1644–1652. [Google Scholar] [CrossRef]
  25. Georg, O.; Wilkens, V. Non-Invasive Estimation of Temperature Using Diagnostic Ultrasound during HIFU Therapy. In Proceedings of the 13th International Symposium on Therapeutic Ultrasound, Shanghai, China, 12–15 May 2013; American Institute of Physics: Melville, NY, USA, 2017; Volume 1816, pp. 040002-1–040002-5. [Google Scholar]
  26. Li, S.; Zhou, Z.; Wu, S.; Wu, W. A Review of Quantitative Ultrasound-Based Approaches to Thermometry and Ablation Zone Identification Over the Past Decade. Ultrason. Imaging 2022, 44, 213–228. [Google Scholar] [CrossRef] [PubMed]
  27. Arthur, R.M.; Straube, W.L.; Trobaugh, J.W.; Moros, E.G. Non-Invasive Estimation of Hyperthermia Temperatures with Ultrasound. Int. J. Hyperth. 2005, 21, 589–600. [Google Scholar] [CrossRef] [PubMed]
  28. Ng, S.Y.; Kuo, Y.-L.; Lin, C.-L. Low-Cost and Easily Fabricated Ultrasound-Guided Breast Phantom for Breast Biopsy Training. Appl. Sci. 2021, 11, 7728. [Google Scholar] [CrossRef]
  29. Jawli, A.; Aldehani, W.; Nabi, G.; Huang, Z. Tissue-Mimicking Material Fabrication and Properties for Multiparametric Ultrasound Phantoms: A Systematic Review. Bioengineering 2024, 11, 620. [Google Scholar] [CrossRef]
  30. Geoghegan, R.; Santamaria, A.; Priester, A.; Zhang, L.; Wu, H.; Grundfest, W.; Marks, L.; Natarajan, S. A Tissue-Mimicking Prostate Phantom for 980 Nm Laser Interstitial Thermal Therapy. Int. J. Hyperth. 2019, 36, 992–1001. [Google Scholar] [CrossRef]
  31. Negussie, A.H.; Partanen, A.; Mikhail, A.S.; Xu, S.; Abi-Jaoudeh, N.; Maruvada, S.; Wood, B.J. Thermochromic Tissue-Mimicking Phantom for Optimisation of Thermal Tumour Ablation. Int. J. Hyperth. 2016, 32, 239–243. [Google Scholar] [CrossRef]
  32. Jawli, A.; Nabi, G.; Huang, Z. A Polyvinyl Alcohol (PVA)-Based Phantom for Prostate Cancer Detection Using Multiparametric Ultrasound: A Validation Study. Bioengineering 2024, 11, 1052. [Google Scholar] [CrossRef]
  33. Li, S.; Fear, E.; Curiel, L. Breast Tissue Mimicking Phantoms for Combined Ultrasound and Microwave Imaging. Phys. Med. Biol. 2021, 66, 245011. [Google Scholar] [CrossRef]
  34. Polyakov, M.V.; Sirotin, D.S. A Realistic Breast Phantom for Investigating the Features of the Microwave Radiometry Method Using Mathematical and Physical Modelling. Technologies 2025, 13, 106. [Google Scholar] [CrossRef]
  35. Särestöniemi, M.; Singh, D.; Dessai, R.; Heredia, C.; Myllymäki, S.; Myllylä, T. Realistic 3D Phantoms for Validation of Microwave Sensing in Health Monitoring Applications. Sensors 2024, 24, 1975. [Google Scholar] [CrossRef]
  36. Slanina, T.; Nguyen, D.H.; Moll, J.; Krozer, V. Temperature Dependence Studies of Tissue-Mimicking Phantoms for Ultra-Wideband Microwave Breast Tumor Detection. Biomed. Phys. Eng. Express 2022, 8, 055017. [Google Scholar] [CrossRef]
  37. Antoniou, A.; Evripidou, N.; Georgiou, L.; Chrysanthou, A.; Ioannides, C.; Damianou, C. Tumor Phantom Model for MRI-Guided Focused Ultrasound Ablation Studies. Med. Phys. 2023, 50, 5956–5968. [Google Scholar] [CrossRef] [PubMed]
  38. Filippou, A.; Damianou, C. Agar-Based Phantom for Evaluating Targeting of High-Intensity Focused Ultrasound Systems for Breast Ablation. J. Med. Phys. 2024, 49, 343–355. [Google Scholar] [CrossRef] [PubMed]
  39. Daniels, M.J.; Varghese, T.; Madsen, E.L.; Zagzebski, J.A. Non-Invasive Ultrasound-Based Temperature Imaging for Monitoring Radiofrequency Heating—Phantom Results. Phys. Med. Biol. 2007, 52, 4827–4843. [Google Scholar] [CrossRef] [PubMed]
  40. Lai, C.-Y.; Kruse, D.E.; Ferrara, K.W.; Caskey, C.F. Creation and Characterization of an Ultrasound and CT Phantom for Noninvasive Ultrasound Thermometry Calibration. IEEE Trans. Biomed. Eng. 2014, 61, 502–512. [Google Scholar] [CrossRef]
  41. Mansfel’d, A.D. Acoustothermometry: Current Status and Prospects. Acoust. Phys. 2009, 55, 556–566. [Google Scholar] [CrossRef]
  42. Amiri, H.; Makkiabadi, B. A Review of Ultrasound Thermometry Techniques. Front. Biomed. Technol. 2020, 7, 82–91. [Google Scholar] [CrossRef]
  43. Maass-Moreno, R.; Damianou, C.A.; Sanghvi, N.T. Noninvasive Temperature Estimation in Tissue via Ultrasound Echo-Shifts. Part II. In Vitro Study. J. Acoust. Soc. Am. 1996, 100, 2522–2530. [Google Scholar] [CrossRef]
  44. Abolhassani, M.D.; Norouzy, A.; Takavar, A.; Ghanaati, H. Noninvasive Temperature Estimation Using Sonographic Digital Images. J. Ultrasound Med. 2007, 26, 215–222. [Google Scholar] [CrossRef]
  45. Liu, H.-L.; Li, M.-L.; Shih, T.-C.; Huang, S.-M.; Lu, I.-Y.; Lin, D.-Y.; Lin, S.-M.; Ju, K.-C. Instantaneous Frequency-Based Ultrasonic Temperature Estimation During Focused Ultrasound Thermal Therapy. Ultrasound Med. Biol. 2009, 35, 1647–1661. [Google Scholar] [CrossRef] [PubMed]
  46. Pouch, A.M.; Cary, T.W.; Schultz, S.M.; Sehgal, C.M. In Vivo Noninvasive Temperature Measurement by B-Mode Ultrasound Imaging. J. Ultrasound Med. 2010, 29, 1595–1606. [Google Scholar] [CrossRef]
  47. Huang, C.-W.; Lien, D.-H.; Chen, B.-T.; Shieh, J.; Tsui, P.-H.; Chen, C.-S.; Chen, W.-S. Ultrasound Thermal Mapping Based on a Hybrid Method Combining Cross-Correlation and Zero-Crossing Tracking. J. Acoust. Soc. Am. 2013, 134, 1530–1540. [Google Scholar] [CrossRef]
  48. Geng, X.; Zhou, Z.; Li, Q.; Wu, S.; Wang, C.-Y.; Liu, H.-L.; Chuang, C.-C.; Tsui, P.-H. Comparison of Ultrasound Temperature Imaging with Infrared Thermometry during Radio Frequency Ablation. Jpn. J. Appl. Phys. 2014, 53, 047001. [Google Scholar] [CrossRef]
  49. Bayat, M.; Ballard, J.R.; Ebbini, E.S. Ultrasound Thermography: A New Temperature Reconstruction Model and in Vivo Results. In Proceedings of the 14th International Symposium on Therapeutic Ultrasound, Las Vegas, NV, USA, 2–5 April 2014; American Institute of Physics Inc.: Melville, NY, USA, 2017; Volume 1821, pp. 060004-1–060004-5. [Google Scholar]
  50. Simon, C.; VanBaren, P.; Ebbini, E.S. Two-Dimensional Temperature Estimation Using Diagnostic Ultrasound. IEEE Trans. Ultrason. Ferroelectr. Freq. Control 1998, 45, 1088–1099. [Google Scholar] [CrossRef]
  51. Arthur, R.M.; Basu, D.; Guo, Y.; Trobaugh, J.W.; Moros, E.G. 3-D in Vitro Estimation of Temperature Using the Change in Backscattered Ultrasonic Energy. IEEE Trans. Ultrason. Ferroelectr. Freq. Control 2010, 57, 1724–1733. [Google Scholar] [CrossRef] [PubMed]
  52. Gambin, B.; Kruglenko, E. Temperature Measurement by Statistical Parameters of Ultrasound Signal Backscattered from Tissue Samples. Acta Phys. Pol. A 2015, 128, A-72–A-78. [Google Scholar] [CrossRef]
  53. Byra, M.; Gambin, B. Temperature Detection Based on Nonparametric Statistics of Ultrasound Echoes. Hydroacoustics 2015, 18, 17–23. [Google Scholar]
  54. Katz-Hanani, I.; Rothstein, T.; Gaitini, D.; Gallimidi, Z.; Azhari, H. Age-Related Ultrasonic Properties of Breast Tissue In Vivo. Ultrasound Med. Biol. 2014, 40, 2265–2271. [Google Scholar] [CrossRef]
  55. Li, C.; Duric, N.; Littrup, P.; Huang, L. In Vivo Breast Sound-Speed Imaging with Ultrasound Tomography. Ultrasound Med. Biol. 2009, 35, 1615–1628. [Google Scholar] [CrossRef]
  56. Said Camilleri, J.; Farrugia, L.; Curto, S.; Rodrigues, D.B.; Farina, L.; Caruana Dingli, G.; Bonello, J.; Farhat, I.; Sammut, C.V. Review of Thermal and Physiological Properties of Human Breast Tissue. Sensors 2022, 22, 3894. [Google Scholar] [CrossRef] [PubMed]
  57. Miaskowski, A.; Sawicki, B. Magnetic Fluid Hyperthermia Modeling Based on Phantom Measurements and Realistic Breast Model. IEEE Trans. Biomed. Eng. 2013, 60, 1806–1813. [Google Scholar] [CrossRef] [PubMed]
  58. Madsen, E.L.; Zagzebski, J.A.; Banjavie, R.A.; Jutila, R.E. Tissue Mimicking Materials for Ultrasound Phantoms. Med. Phys. 1978, 5, 391–394. [Google Scholar] [CrossRef]
  59. Burlew, M.M.; Madsen, E.L.; Zagzebski, J.A.; Banjavic, R.A.; Sum, S.W. A New Ultrasound Tissue-Equivalent Material. Radiology 1980, 134, 517–520. [Google Scholar] [CrossRef]
  60. Huang, J.; Holt, R.G.; Cleveland, R.O.; Roy, R.A. Experimental Validation of a Tractable Numerical Model for Focused Ultrasound Heating in Flow-through Tissue Phantoms. J. Acoust. Soc. Am. 2004, 116, 2451–2458. [Google Scholar] [CrossRef] [PubMed]
  61. Dang, J.; Frisch, B.; Lasaygues, P.; Zhang, D.; Tavernier, S.; Felix, N.; Lecoq, P.; Auffray, E.; Varela, J.; Mensah, S.; et al. Development of an Anthropomorphic Breast Phantom for Combined PET, B-Mode Ultrasound and Elastographic Imaging. IEEE Trans. Nucl. Sci. 2011, 58, 660–667. [Google Scholar] [CrossRef]
  62. Nguyen, P.T.; Abbosh, A.M.; Crozier, S. Thermo-Dielectric Breast Phantom for Experimental Studies of Microwave Hyperthermia. IEEE Antennas Wirel. Propag. Lett. 2016, 15, 476–479. [Google Scholar] [CrossRef]
  63. Chen, R.K.; Shih, A.J. Multi-Modality Gellan Gum-Based Tissue-Mimicking Phantom with Targeted Mechanical, Electrical, and Thermal Properties. Phys. Med. Biol. 2013, 58, 5511–5525. [Google Scholar] [CrossRef]
  64. Menikou, G.; Yiannakou, M.; Yiallouras, C.; Ioannides, C.; Damianou, C. MRI-compatible Breast/Rib Phantom for Evaluating Ultrasonic Thermal Exposures. Int. J. Med. Robot. Comput. Assist. Surg. 2018, 14, e1849. [Google Scholar] [CrossRef]
  65. He, Y.; Liu, Y.; Dyer, B.A.; Boone, J.M.; Liu, S.; Chen, T.; Zheng, F.; Zhu, Y.; Sun, Y.; Rong, Y.; et al. 3D-Printed Breast Phantom for Multi-Purpose and Multi-Modality Imaging. Quant. Imaging Med. Surg. 2019, 9, 63–74. [Google Scholar] [CrossRef]
  66. Suzuki, A.; Tsubota, Y.; Wu, W.; Yamanaka, K.; Terada, T.; Otake, Y.; Kawabata, K. Oil Gel-Based Phantom for Evaluating Quantitative Accuracy of Speed of Sound Measured in Ultrasound Computed Tomography. Ultrasound Med. Biol. 2019, 45, 2554–2567. [Google Scholar] [CrossRef]
  67. Ruvio, G.; Solimene, R.; Cuccaro, A.; Fiaschetti, G.; Fagan, A.J.; Cournane, S.; Cooke, J.; Ammann, M.J.; Tobon, J.; Browne, J.E. Multimodal Breast Phantoms for Microwave, Ultrasound, Mammography, Magnetic Resonance and Computed Tomography Imaging. Sensors 2020, 20, 2400. [Google Scholar] [CrossRef] [PubMed]
  68. Li, S.; Fear, E.; Curiel, L. Breast Tissue Mimicking Phantoms for Combined Microwave and Ultrasound Imaging. In Proceedings of the 2020 IEEE International Ultrasonics Symposium (IUS), Las Vegas, NV, USA, 7–11 September 2020; pp. 1–4. [Google Scholar]
  69. Hariyanto, A.P.; Budiarti, N.T.; Suprijanto; Ng, K.H.; Haryanto, F.; Endarko. Evaluation of Physical Properties and Image of Polyvinyl Chloride as Breast Tissue Equivalence for Dual-Modality (Mammography and Ultrasound). Phys. Eng. Sci. Med. 2023, 46, 1175–1185. [Google Scholar] [CrossRef] [PubMed]
  70. Maass-Moreno, R.; Damianou, C.A. Noninvasive Temperature Estimation in Tissue via Ultrasound Echo-Shifts. Part I. Analytical Model. J. Acoust. Soc. Am. 1996, 100, 2514–2521. [Google Scholar] [CrossRef] [PubMed]
  71. Corach, J.; Sorichetti, P.A.; Romano, S.D. Electrical and Ultrasonic Properties of Vegetable Oils and Biodiesel. Fuel 2015, 139, 466–471. [Google Scholar] [CrossRef]
  72. Corach, J.; Sorichetti, P.A.; Romano, S.D. Electrical Properties of Vegetable Oils between 20 Hz and 2 MHz. Int. J. Hydrog. Energy 2014, 39, 8754–8758. [Google Scholar] [CrossRef]
  73. Javanaud, C.; Rahalkar, R.R. Velocity of Sound in Vegetable Oils. Lipid/Fett 1988, 90, 73–75. [Google Scholar] [CrossRef]
  74. Menikou, G.; Damianou, C. Acoustic and Thermal Characterization of Agar Based Phantoms Used for Evaluating Focused Ultrasound Exposures. J. Ther. Ultrasound 2017, 5, 14. [Google Scholar] [CrossRef]
  75. Sofokleous, P.; Damianou, C. High-Quality Agar and Polyacrylamide Tumor-Mimicking Phantom Models for Magnetic Resonance-Guided Focused Ultrasound Applications. J. Med. Ultrasound 2024, 32, 121–133. [Google Scholar] [CrossRef]
  76. Koch, T.; Lakshmanan, S.; Brand, S.; Wicke, M.; Raum, K.; Mörlein, D. Ultrasound Velocity and Attenuation of Porcine Soft Tissues with Respect to Structure and Composition: II. Skin and Backfat. Meat Sci. 2011, 88, 67–74. [Google Scholar] [CrossRef]
  77. Zhang, S.; Gao, J. Studying on the Thermal Conductivity Measurement of Biological Tissues. In Emerging Computation and Information Technologies for Education; Mao, E., Xu, L., Tian, W., Eds.; Springer: Berlin/Heidelberg, Germany, 2012; pp. 743–749. [Google Scholar]
  78. Acero Mendoza, R.V.; Bazán, I.; Ramírez-García, A. Analyzing Temperature Distributions and Gradient Behaviors for Early-Stage Tumor Lesions in 3D Computational Model of Breast. Appl. Sci. 2024, 14, 4538. [Google Scholar] [CrossRef]
  79. Sun Nuclear Zerdine Ultrasound Phantoms. Available online: https://www.sunnuclear.com/products/zerdine-ultrasound-phantom (accessed on 24 April 2025).
  80. Sun Nuclear Urethane Ultrasound Phantoms. Available online: https://www.sunnuclear.com/products/urethane-ultrasound-phantom (accessed on 24 April 2025).
  81. Sun Nuclear Sun Nuclear Breast Biopsy Phantoms. Available online: https://www.sunnuclear.com/products/breast-biopsy-phantoms (accessed on 24 April 2025).
  82. Techforhealth The AdvantageTM Phantom. Available online: https://techforhealth.com/product/the-advantage-phantom/ (accessed on 24 April 2025).
  83. Elevate Healthcare Blue Phantom. Available online: https://elevatehealth.net/solutions/brands/blue-phantom (accessed on 24 April 2025).
  84. Kyoto Kagaku Breast Ultrasound Examination Phantom “BREAST FAN”. Available online: https://www.kyotokagaku.com/en/products_data/us-6/ (accessed on 24 April 2025).
  85. GTSimulators Breast Biopsy Ultrasound Training Model. Available online: https://www.gtsimulators.com/collections/cae-blue-phantom-cae-healthcare/products/breast-biopsy-ultrasound-training-model-bpb170 (accessed on 24 April 2025).
  86. GTSimulators Breast Biopsy Training Model. Available online: https://www.gtsimulators.com/collections/kyoto-kagaku-ultrasound-phantoms/products/breast-biopsy-training-model-duo-set-kkus-9 (accessed on 24 April 2025).
Figure 1. Phantom case study diagrams.
Applsci 15 05275 g001
Figure 2. Phantom attachment device. (a) View of the mounting device; (b) view of the model without the bases; (c) individual phantom mold.
Applsci 15 05275 g002
Figure 3. Experimental setup diagram for both cases: (a) fat–gland propagation medium (healthy case); (b) fat–gland–tumor propagation medium (tumoral case).
Applsci 15 05275 g003
Figure 4. Connection diagram of the US inspection setup.
Applsci 15 05275 g004
Figure 5. Diagram of layer structure, experimental setup, and example of raw signal acquisition. (a)–(c) are the interfaces of the tissue mimicking materials and the echo signals associated with each interface.
Applsci 15 05275 g005
Figure 6. Graph illustrating the behavior of cross-correlation: (a) representation of echoes acquired in a fatty medium at two different temperatures; (b) result of the correlation of echoes associated with the fatty medium; (c) representation of echoes acquired in a glandular medium at two different temperatures; (d) result of the correlation of echoes associated with the glandular medium.
Applsci 15 05275 g006
Figure 7. Cumulative delay diagram for healthy case and tumoral case.
Applsci 15 05275 g007
Figure 8. Breast phantoms: (a) healthy case; (b) tumoral case.
Applsci 15 05275 g008
Figure 9. Graph showing the signals acquired from the tumor case phantom (fat, gland, and tumor) within the range of interest, along with the filtered echo windows. (a) Raw signal acquisition of tri-layer phantom in the tumoral case, (b) filtered signal of echo 1, (c) filtered signal of echo 2, and (d) filtered signal of echo 3.
Applsci 15 05275 g009
Figure 10. Graph showing the linear regression plots of temperature as a function of velocity T(C) for each tissue phantom: (a) fat phantom, (b) gland phantom, and (c) tumoral phantom.
Applsci 15 05275 g010
Table 1. Reagents for gland and tumor phantoms.
ReagentsGlandTumor
Water (gr)100150
Agar (gr)23
Oil (gr)1526.78
Salt (gr)05
Detergent (drops)3–45–6
Table 2. Mean and Standard deviation of experimental batches at different temperatures.
Temperature (°C)FatGlandTumor
MeanSTDMeanSTDMeanSTD
32.01461.5514.781534.7423.221572.5821.48
32.51460.0214.221535.2422.781573.2720.63
33.01457.3414.071535.6822.751574.1719.61
33.51455.3513.641535.9122.861575.2118.21
34.01453.6112.231536.0722.931576.0817.02
34.51451.7411.401536.4722.681577.0116.02
35.01450.3210.331536.6022.801577.7414.86
35.51448.639.751537.0722.541577.8414.77
36.01445.957.841537.4222.321578.7213.47
Disclaimer/Publisher’s Note: The statements, opinions and data contained in all publications are solely those of the individual author(s) and contributor(s) and not of MDPI and/or the editor(s). MDPI and/or the editor(s) disclaim responsibility for any injury to people or property resulting from any ideas, methods, instructions or products referred to in the content.

