1. Introduction
Slurry wall technology is widely used in underground engineering construction, such as in the case of drilled cast-in-place piles [
1,
2], slurry shield tunneling [
3,
4,
5], and underground diaphragm walls [
6,
7], to ensure the stability of the excavation hole. Slurry also serves functions such as debris removal, cooling, and the lubrication of the borehole and drilling tools [
8]. However, when the foundation soil has poor gradation or a high permeability coefficient, slurry leakage is likely to occur, making it difficult to form a mud cake, which fails to provide effective support for the excavation hole, leading to hole instability and other accidents. Poor slurry wall formation in practical engineering can result in significant geotechnical hazards, such as excavation collapse, instability, groundwater infiltration, and extensive construction delays, leading to substantial economic losses and safety risks.
Studies have demonstrated that incorporating an optimal amount of foam into the slurry can significantly mitigate slurry leakage [
9,
10]. Therefore, understanding the influence of various factors on the formation mechanism of foam slurry is crucial for optimizing slurry proportioning, maintaining hole stability, and ensuring the safety of underground engineering. Previous studies indicate that the main factors affecting slurry wall formation are soil properties, slurry composition, and slurry characteristics [
3,
11,
12,
13,
14]. For example, adding a certain amount of coarse particles to the slurry can effectively shorten membrane formation time and improve membrane formation efficiency [
15]. The relative density of the slurry also significantly affects the morphology and thickness of the mud cake, while increasing slurry viscosity does not lead to obvious changes in thickness [
16].
In addition to physical properties, geochemical factors such as pH, ionic strength, and mineral composition may also influence the behavior of slurry systems. These factors can affect the stability and rheological properties of bentonite-based slurries, potentially altering the formation and structural integrity of the slurry wall. However, in this study, the focus is placed on the physical characteristics of the soil, including particle size distribution, porosity, and gradation parameters, which are considered the dominant factors influencing foam slurry wall formation under the examined conditions.
However, most existing research focuses on traditional slurries, and the formulation and behavior of foam slurry systems still largely rely on empirical methods [
17,
18]. The infiltration and membrane formation processes, mechanisms, influencing factors, and behavioral patterns of foam slurry under varying conditions remain unclear.
Therefore, this study uses numerical simulation methods to investigate the influence of soil properties, slurry composition, and pressure gradient on foam slurry wall formation, with laboratory experiments for validation.
2. Design of the Numerical Simulation Scheme
In foam slurry, bentonite particles and bubbles are dispersed, making the Discrete Element Method (DEM), which is based on Newton’s second law, highly suitable for simulating the migration and accumulation process of soil particles and bubbles in the slurry. Furthermore, compared to traditional experimental methods [
19,
20], the DEM can better represent the complex interactions between soil particles in the slurry and the dynamic characteristics of bubble expansion and contraction. Therefore, this study treats bentonite particles and bubbles as discrete entities and uses the CFD-DEM, employing PFC3D to establish a one-dimensional fluid–solid coupling model for foam slurry infiltration in soil, with the CFD module calculating the fluid forces.
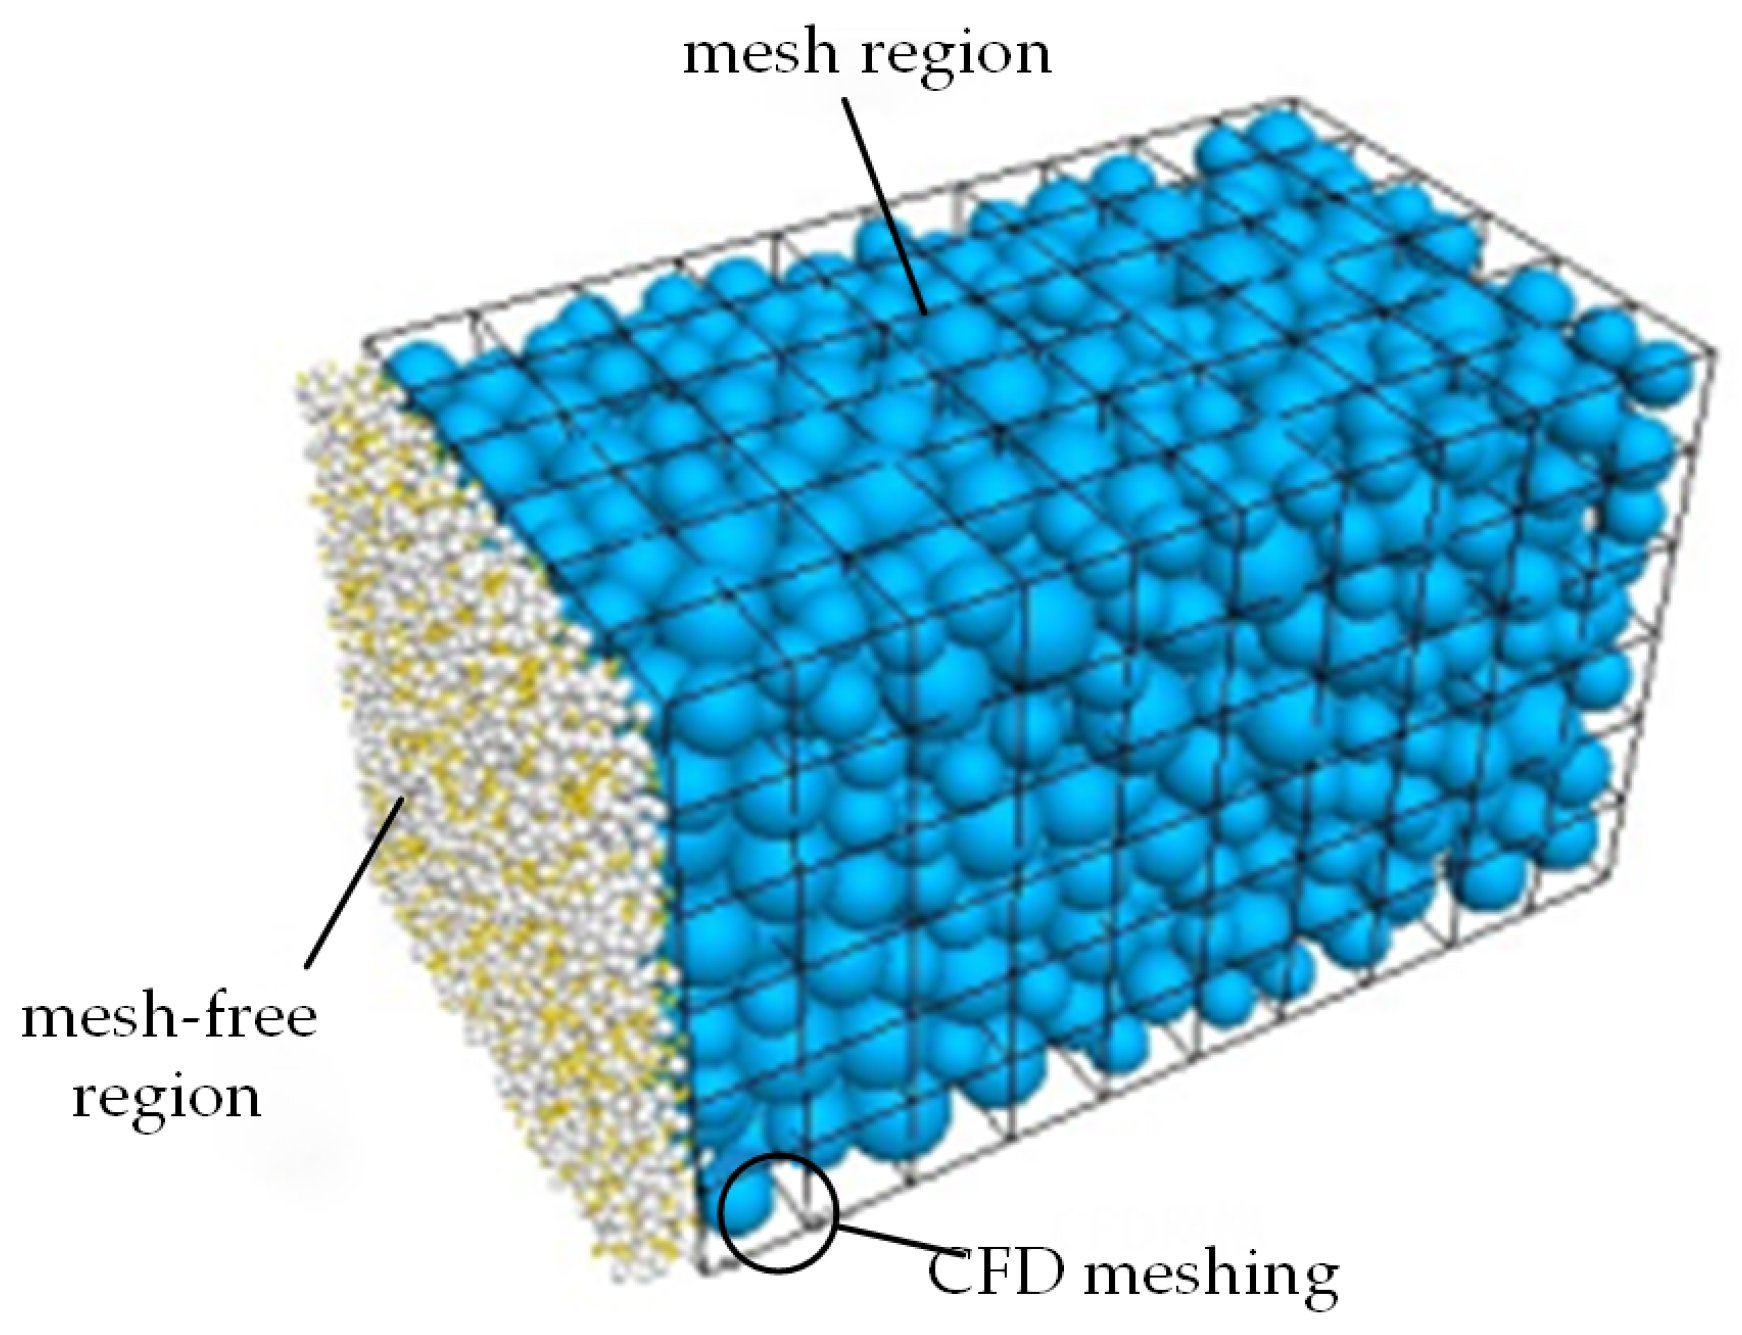
The solid phase in the computational model includes the soil, bentonite particles, and bubbles in the slurry. The region containing the soil is represented as a grid region, while the generation area of the soil particles and bubbles in the slurry is represented as a non-grid region, as shown in
Figure 1.
The fluid phase in the model consists of the liquid phase in the slurry, with fluid grids generated only in the soil region. To accurately capture the expansion and contraction of bubbles during migration due to pressure changes, as shown in
Figure 2, a bubble expansion–deformation calculation function was written using FISH language, as presented in Equations (1) and (2) [
21].
In this study, both soil particles and foam bubbles are represented as spherical particles (balls) within the PFC3D framework. Soil particles are modeled as rigid, non-deformable entities, while foam bubbles are assigned lower stiffness values to allow for deformation. The interactions between particles are governed by the built-in linear contact model provided by PFC3D. As a foam bubble encounters a constriction between soil particles, it deforms to navigate through the pore space and subsequently regains its original shape upon exiting the constriction. This modeling approach effectively captures the dynamic processes involved in mud cake formation.
2.1. Soil Properties
To investigate the impact of soil properties on the formation of foam slurry wall, infiltration calculations for foam slurry under different soil particle sizes, gradations, and porosities were conducted, as shown in
Table 1 and
Table 2. Under the uniform particle size condition, simulations were performed for three maximum particle sizes (dmax) of 0.5 mm, 1 mm, and 2 mm. For continuous gradation, the continuous gradation equation proposed by Zhu Junhao et al. [
22] was referenced, and 19 different gradations were calculated with b values ranging from 0.6 to 0.99 and m values ranging from 2 to 10. For different porosities, calculations were performed with porosity values of 0.34, 0.36, 0.38, 0.40, 0.42, and 0.44, respectively.
2.2. Selection of Foam Slurry Proportions
To investigate the impact of foam slurry proportioning on the formation of foam slurry wall, computational analyses were performed under different swelling ratios and foam concentrations (
Table 3). Given that a high bentonite content increases the slurry’s density and viscosity, reducing its flowability and potentially causing slurry pump overload [
23,
24], the swelling ratio was controlled to be within 10%, with values of 2.5%, 5%, and 10%. Based on preliminary tests, when the foam concentration is between 10% and 30%, the foam structure is compact and has a longer half-life (i.e., better stability). Therefore, in the computational analysis, foam concentrations of 0% (pure bentonite slurry without foam), 10%, 20%, and 30% were selected. It should be noted that to focus on studying the effects of bentonite and foam content on slurry wall formation, the influence of different types and concentrations of foam agents on slurry performance was ignored, and the slurry viscosity was set as a constant.
2.3. Selection of Pressure Gradient
Changes in the pressure gradient can affect the movement behavior of bubbles in the slurry, the deformation of bubbles as they pass through the soil pores, and the interactions between the bubbles and soil particles. To investigate the effect of infiltration pressure on foam slurry wall formation, computational analyses were conducted for different pressure gradient values of 1000, 2000, 3000, and 4000, as listed in
Table 4. For models of different sizes, the hydraulic similarity principle was followed, and the corresponding infiltration pressures were determined based on the model’s flow path length, i.e., for model sizes of 3 × 5 × 3 mm, 6 × 10 × 6 mm, and 9 × 15 × 9 mm, the infiltration pressures were set to 100 kPa, 200 kPa, and 300 kPa, respectively.
In summary, the classification of influencing factors and the corresponding parameter settings for foam slurry numerical simulations are presented in
Table 4, covering key variables such as soil properties, slurry composition, and pressure gradient. The detailed numerical simulation schemes and case combinations are further compiled in
Appendix A Table A1, providing a comprehensive basis for the subsequent analysis of membrane formation behavior.
3. Numerical Simulation Results Analysis
For each scheme in
Table 4, the number of bentonite (and foam) particles infiltrating the soil was plotted over time. The results indicate that under different conditions, the infiltration time curves exhibit two types.
Type One: The number of infiltrating particles increases rapidly at first, then quickly decreases due to the resistance of the soil, and finally, the number of infiltrating particles fluctuates slightly and stabilizes at a relatively constant rate. For example, in Scheme 22 (infiltration of pure bentonite slurry in L6 soil,
Table A1), the calculation results of the scheme show that the number of bentonite particles fluctuates around 70 at the end of the calculation. Specifically, the maximum number of particles is 76 and the minimum is 60. At this time, the bentonite has almost filled the entire soil layer, and only particles aggregate in local areas, but there is still a large gap from forming a complete mud film, as shown in
Figure 3.
Type Two: Bentonite and foam particles infiltrate in large quantities initially, with the number of infiltrating particles quickly reaching a peak. Subsequently, bentonite and foam particles begin to block large pore channels, causing the number of infiltrating particles to decrease rapidly and form an initial mud cake. Finally, bentonite and foam particles form agglomerates on the soil surface, blocking most of the pores, and the number of infiltrating particles gradually approaches zero, forming a stable mud cake. This type of infiltration is illustrated in Scheme 6 (swelling ratio: 5%; foam concentration: 20%,
Table A1), as shown in
Figure 4.
The physical implications of these two infiltration types are significant for practical engineering. Type One represents ineffective membrane formation, where particle accumulation is insufficient to fully block the pores, leading to continued slurry infiltration and potential instability in excavation projects. In contrast, Type Two demonstrates effective clogging and stable mud cake formation, which is crucial in applications such as tunneling and pile excavation. In these cases, rapid and complete membrane formation can minimize slurry loss, enhance wall support, and improve construction efficiency.
4. Influence of Various Factors on Mud Cake Membrane Formation
4.1. Influence of Soil Properties on Membrane Formation
When the soil particle size is uniform, the computational results from Schemes 1, 2, and 6 (
Table A1) show that soil particle size has a significant impact on membrane formation. Smaller pore sizes result in longer accumulation times for bubbles at the end of the soil layer, leading to effective clogging, while larger pore sizes allow bubbles to pass through more quickly, reducing the clogging effect, as shown in
Figure 5. The computational results from Schemes 3 to 8 (
Table A1) indicate that the time required for foam slurry membrane formation increases linearly with increasing soil porosity, as shown in
Figure 6.
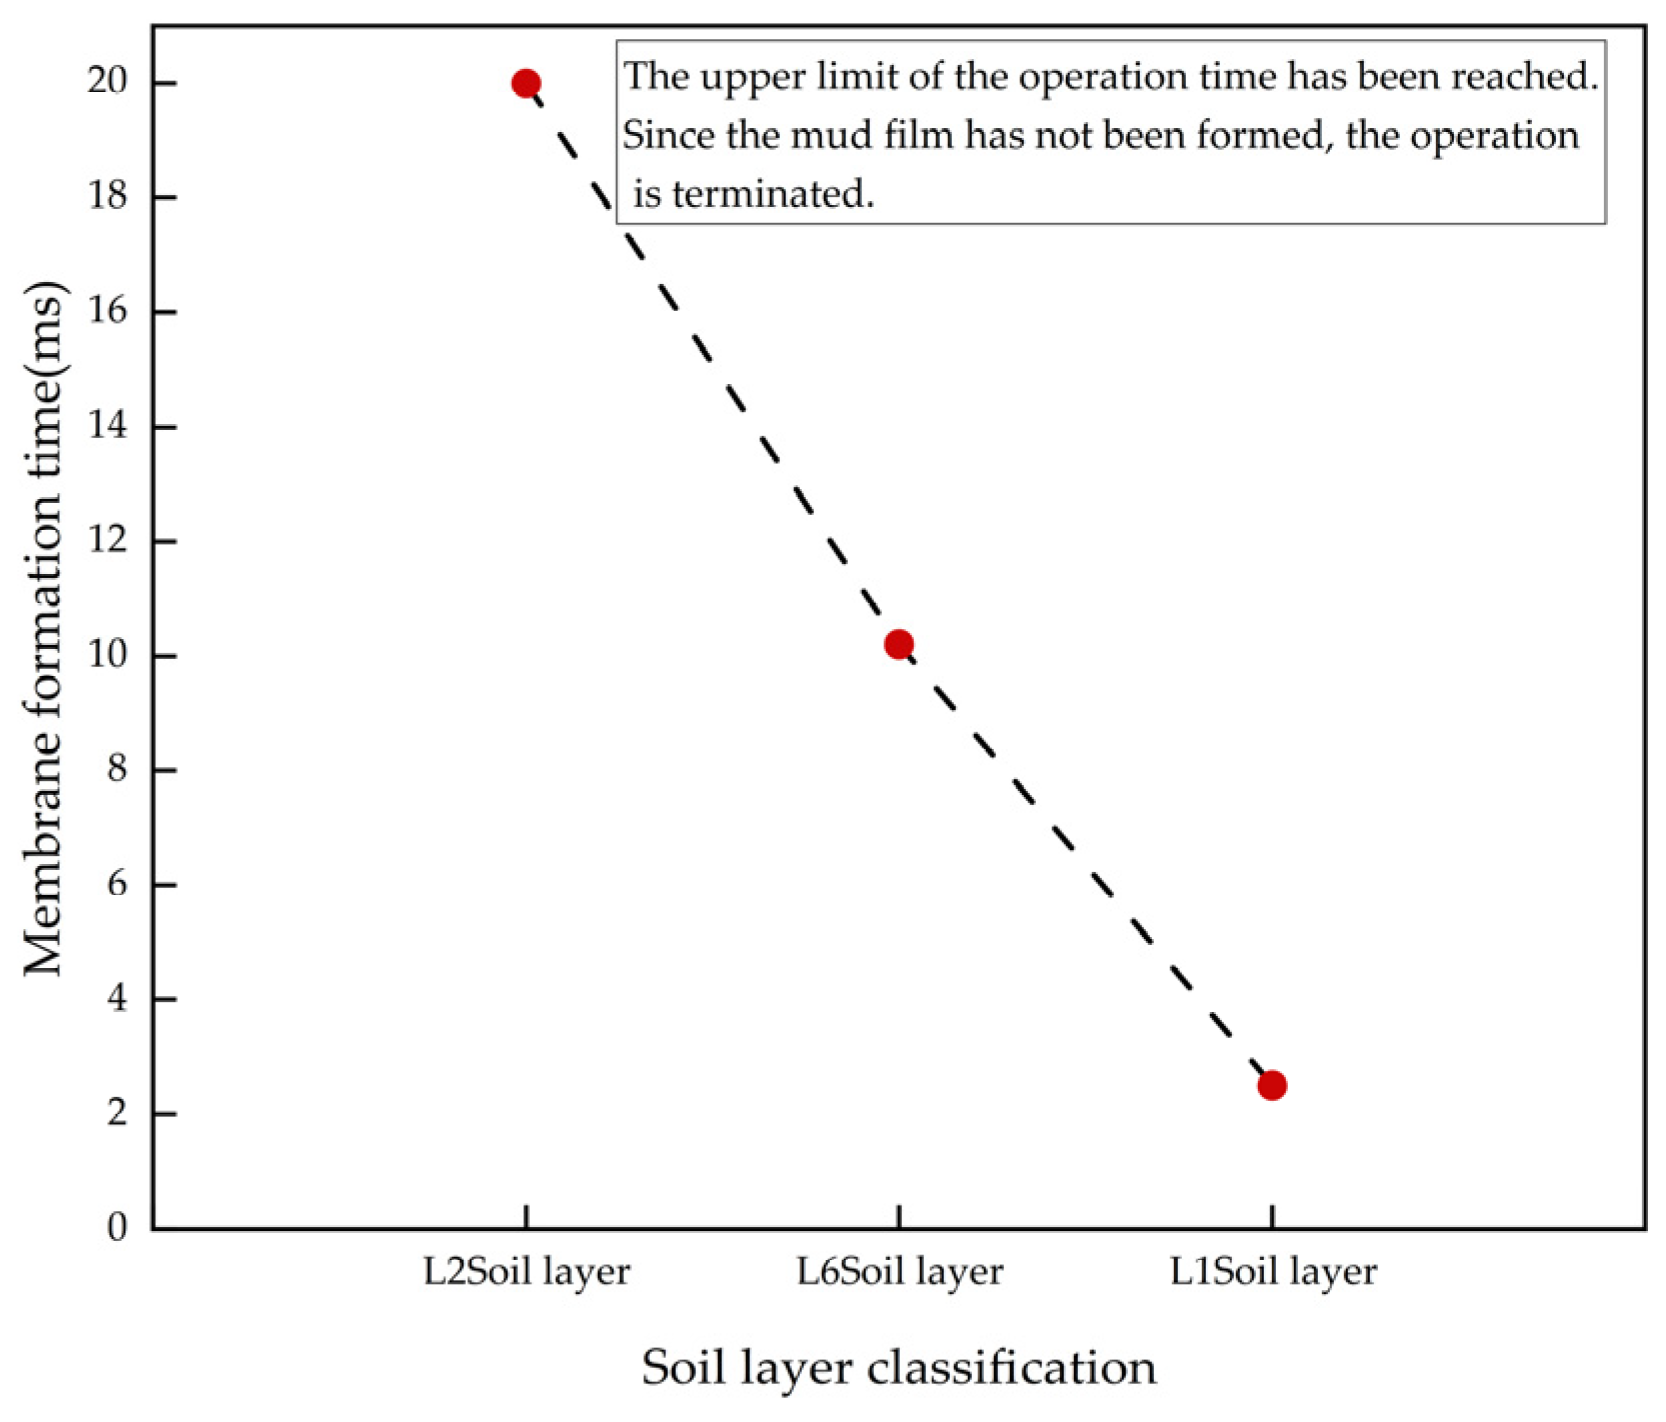
When the soil has a continuous gradation, the computational results from Schemes 9, 10, and 13 (
Table A1) show that as the maximum particle size (dmax) of the soil decreases, the time required for foam slurry membrane formation decreases rapidly, as shown in
Figure 7. The computational results from Schemes 11 to 15 (
Table A1) indicate that as the gradation parameter b increases, the soil becomes progressively denser, pore size decreases, and membrane formation time also decreases, as shown in
Figure 8a. The computational results from Schemes 16 to 19 (
Table A1) show that as the gradation parameter m increases, the soil becomes increasingly loose, and membrane formation time exhibits a positive correlation with m, as shown in
Figure 8b.
From the computational results, among the soil parameters, particle size, especially the maximum particle size (dmax), has the most significant effect on membrane formation, whereby as the soil particle size or maximum particle size (dmax) increases, the permeability of the soil increases significantly, making membrane formation more difficult. Changes in particle size not only affect the time required for foam slurry membrane formation but also determine whether membrane formation can occur. The impact of other soil parameters (such as porosity, gradation parameters b and m, etc.) on membrane formation is relatively minor, generally not affecting whether membrane formation can occur but mainly influencing the time required for formation. Therefore, soil particle size significantly influences the movement behavior of bubbles and the formation process of the mud cake.
4.2. Impact of Foamed Slurry Mix Design on Filter Cake Formation
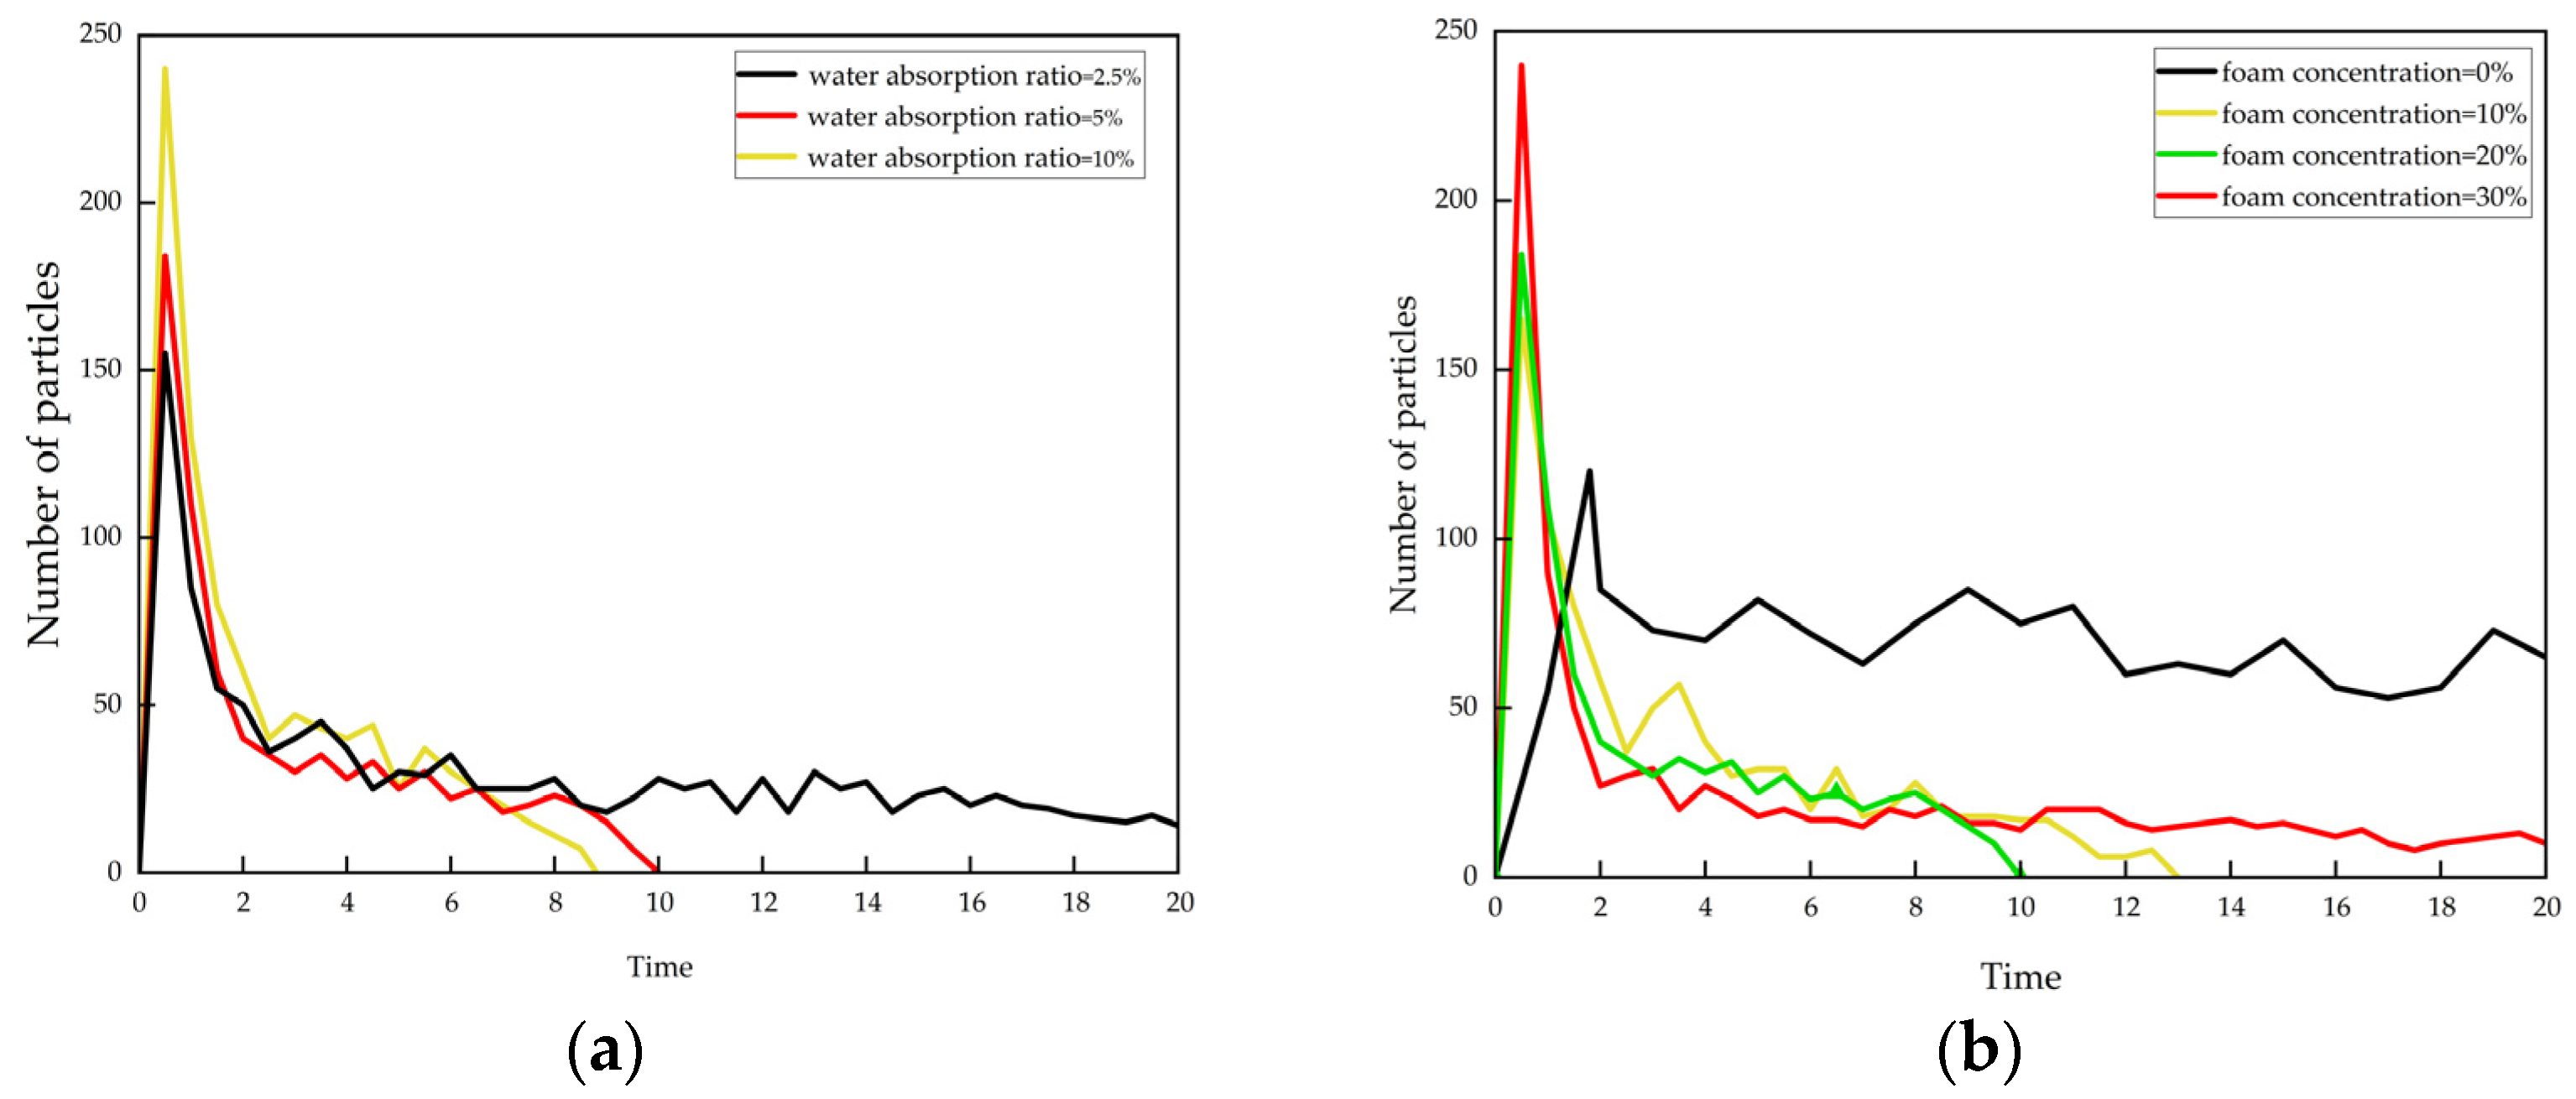
The computational results from Schemes 6, 20, and 21 (
Table A1) show that appropriately increasing the swelling ratio can accelerate the membrane formation process, as shown in
Figure 9a. However, when the swelling ratio is too low (e.g., 2.5%), it becomes difficult to form an effective mud cake. This means that the higher the bentonite particle concentration in the slurry, the more easily aggregates form on the soil surface, thus more effectively clogging the pores.
The computational results from Schemes 6 and 22 to 24 (
Table A1) show that a stable mud cake can form at foam concentrations of 10% and 20%. When the foam concentration is 10%, the final membrane formation time increases by about 33% compared to a foam concentration of 20%. However, when the foam concentration increases to 30%, a stable mud cake has still not formed before the calculation ends, as shown in
Figure 9b. This suggests that the foam concentration for foam slurry clogging effectiveness has an optimal value, whereby when the foam concentration is below the optimal value, the more foam there is, the better the clogging effect. However, when the foam concentration exceeds this optimal value, the clogging effect decreases. This may be because, at a high foam concentration, the number of foam particles accumulated at the pore channel entrance is relatively large. The shrinkage and deformation of these foam particles under the influence of infiltration pressure become more significant and the flow gradient at the pore channel increases, making it difficult to form stable foam particle agglomerates, thus failing to achieve effective clogging.
4.3. Influence of Pressure Gradient on Membrane Formation
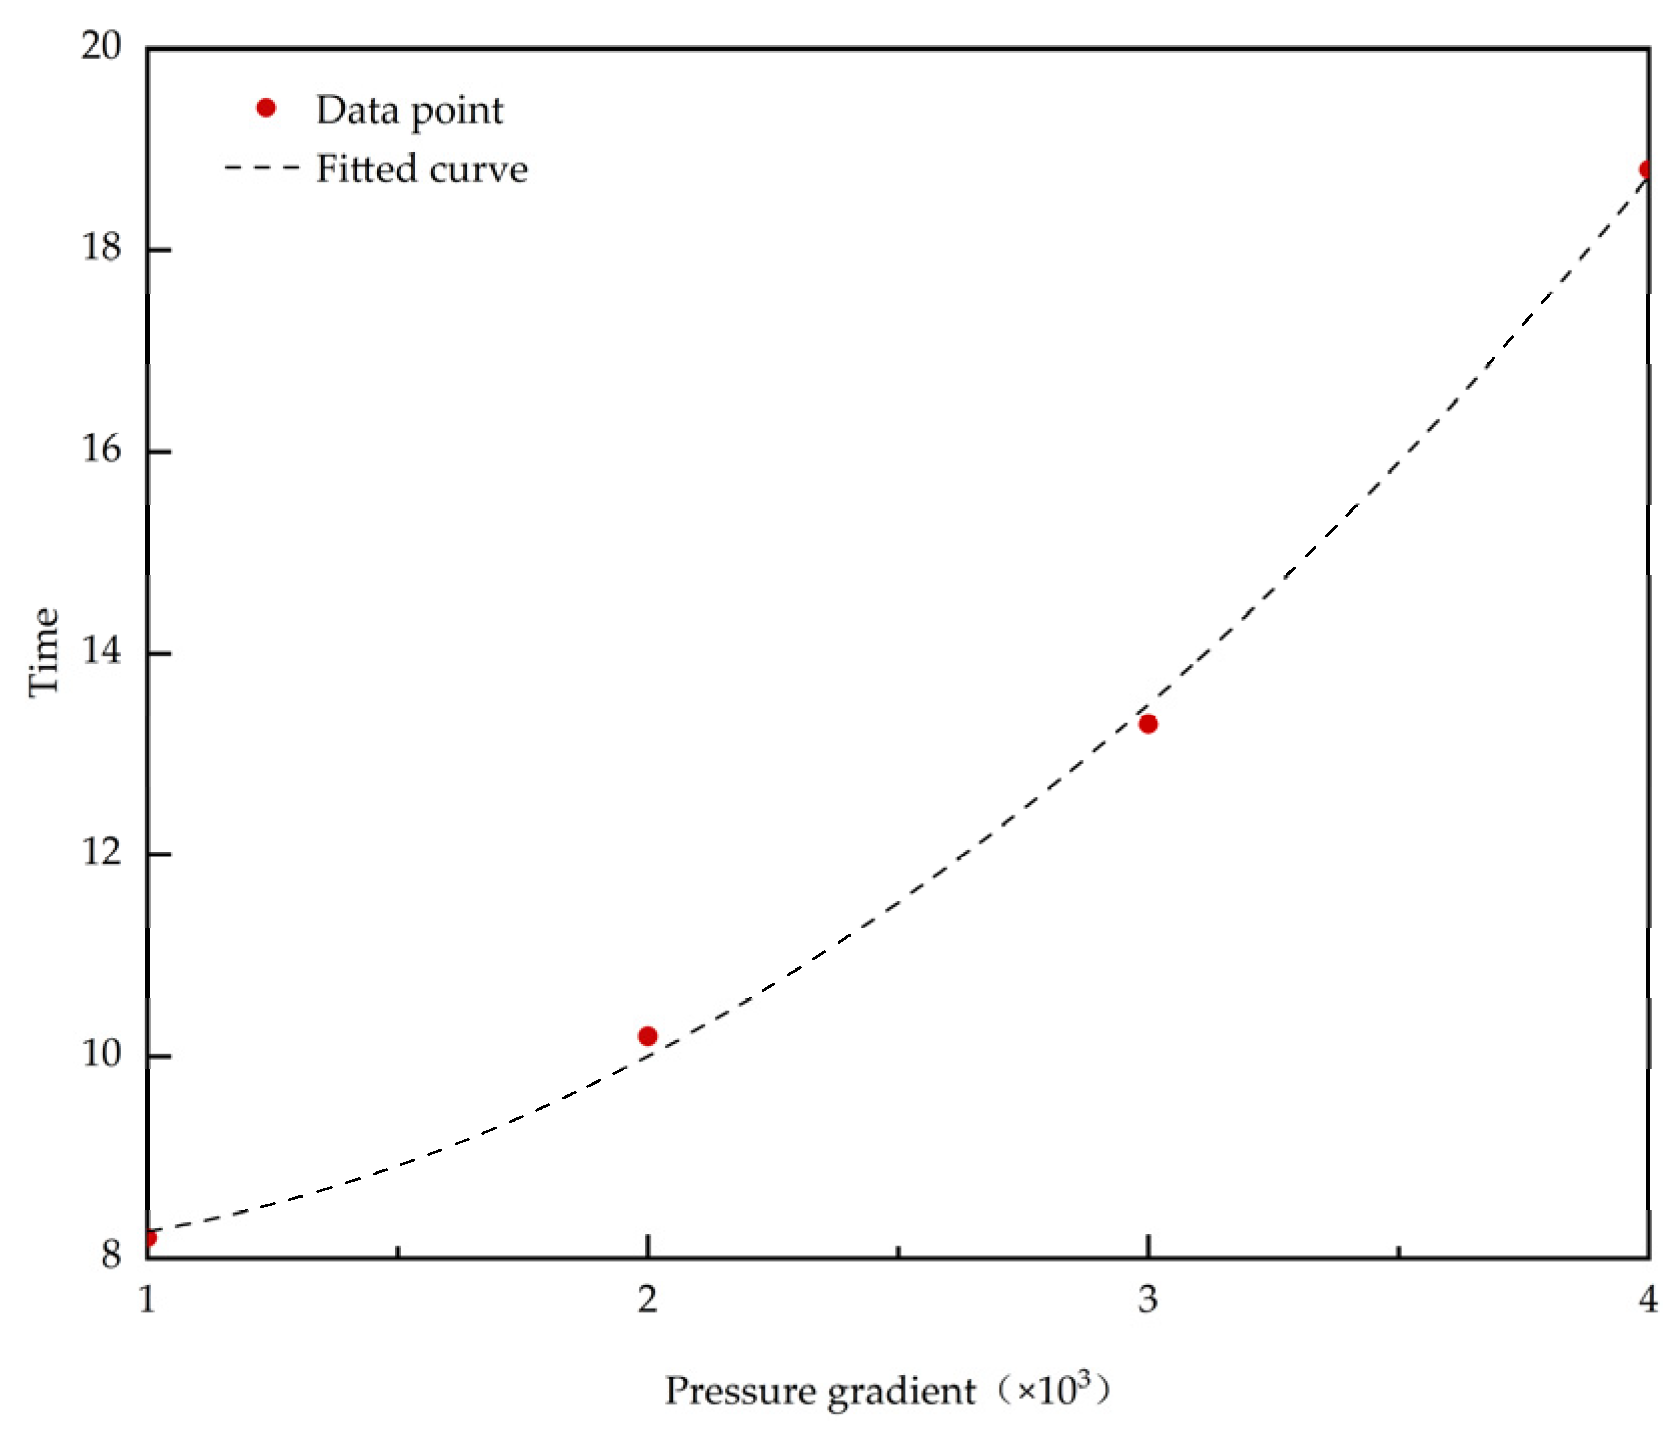
The computational results from Schemes 6 and 25 to 27 (
Table A1) show that as the pressure gradient increases, the time required for membrane formation increases significantly, and a quadratic relationship is observed between the two, as shown in
Figure 10. The reason for this is as follows: the higher the pressure gradient, the faster the bubble particles shrink in size, and the shorter the time they remain in the soil layer. As a result, it becomes more difficult to form a stable mud cake.
4.4. Comprehensive Analysis of the Influence of Various Factors on Foam Slurry Membrane Formation
In summary, soil particle size, especially the maximum particle size (dmax), has a decisive impact on membrane formation. Smaller particle sizes facilitate the formation of the mud cake, while larger particle sizes increase permeability, making membrane formation more difficult or even impossible. Porosity and gradation parameters b and m mainly affect the membrane formation time. As porosity increases, the membrane formation time increases linearly. In terms of slurry composition, an appropriate swelling ratio (5%) and foam concentration (20%) are key to ensuring membrane formation effectiveness. However, excessively high foam concentrations are detrimental to clogging. The higher the pressure gradient, the more difficult it is to form a stable membrane. Overall, soil properties and slurry composition have a significant impact on the formation result, while the pressure gradient has a relatively limited effect on the final membrane formation.
5. Verification of Numerical Simulation Validity
To verify the validity of the numerical simulation results, laboratory permeability tests on foam slurry were conducted under different conditions [
19]. The base slurry materials mainly included bentonite, carboxymethyl cellulose (CMC), anhydrous Na
2CO
3, NaOH, and cationic gel, with a plant-based foam agent. Using a self-designed experimental device, the slurry permeability under various mixing ratios (pure slurry; with 20%, 50%, and 90% foam; and 1.5% sand, among other combinations) was observed under different infiltration pressures (50 kPa, 100 kPa, 150 kPa, and 200 kPa), as shown in
Figure 11.
Due to limitations in experimental conditions and workload, it was not feasible to experimentally verify all the working conditions covered in the numerical simulations. Therefore, several representative cases were selected for preliminary experimental validation, focusing on key parameters such as foam concentration, swelling ratio, and infiltration pressure. The experimental results were then compared with the corresponding numerical simulation results for analysis.
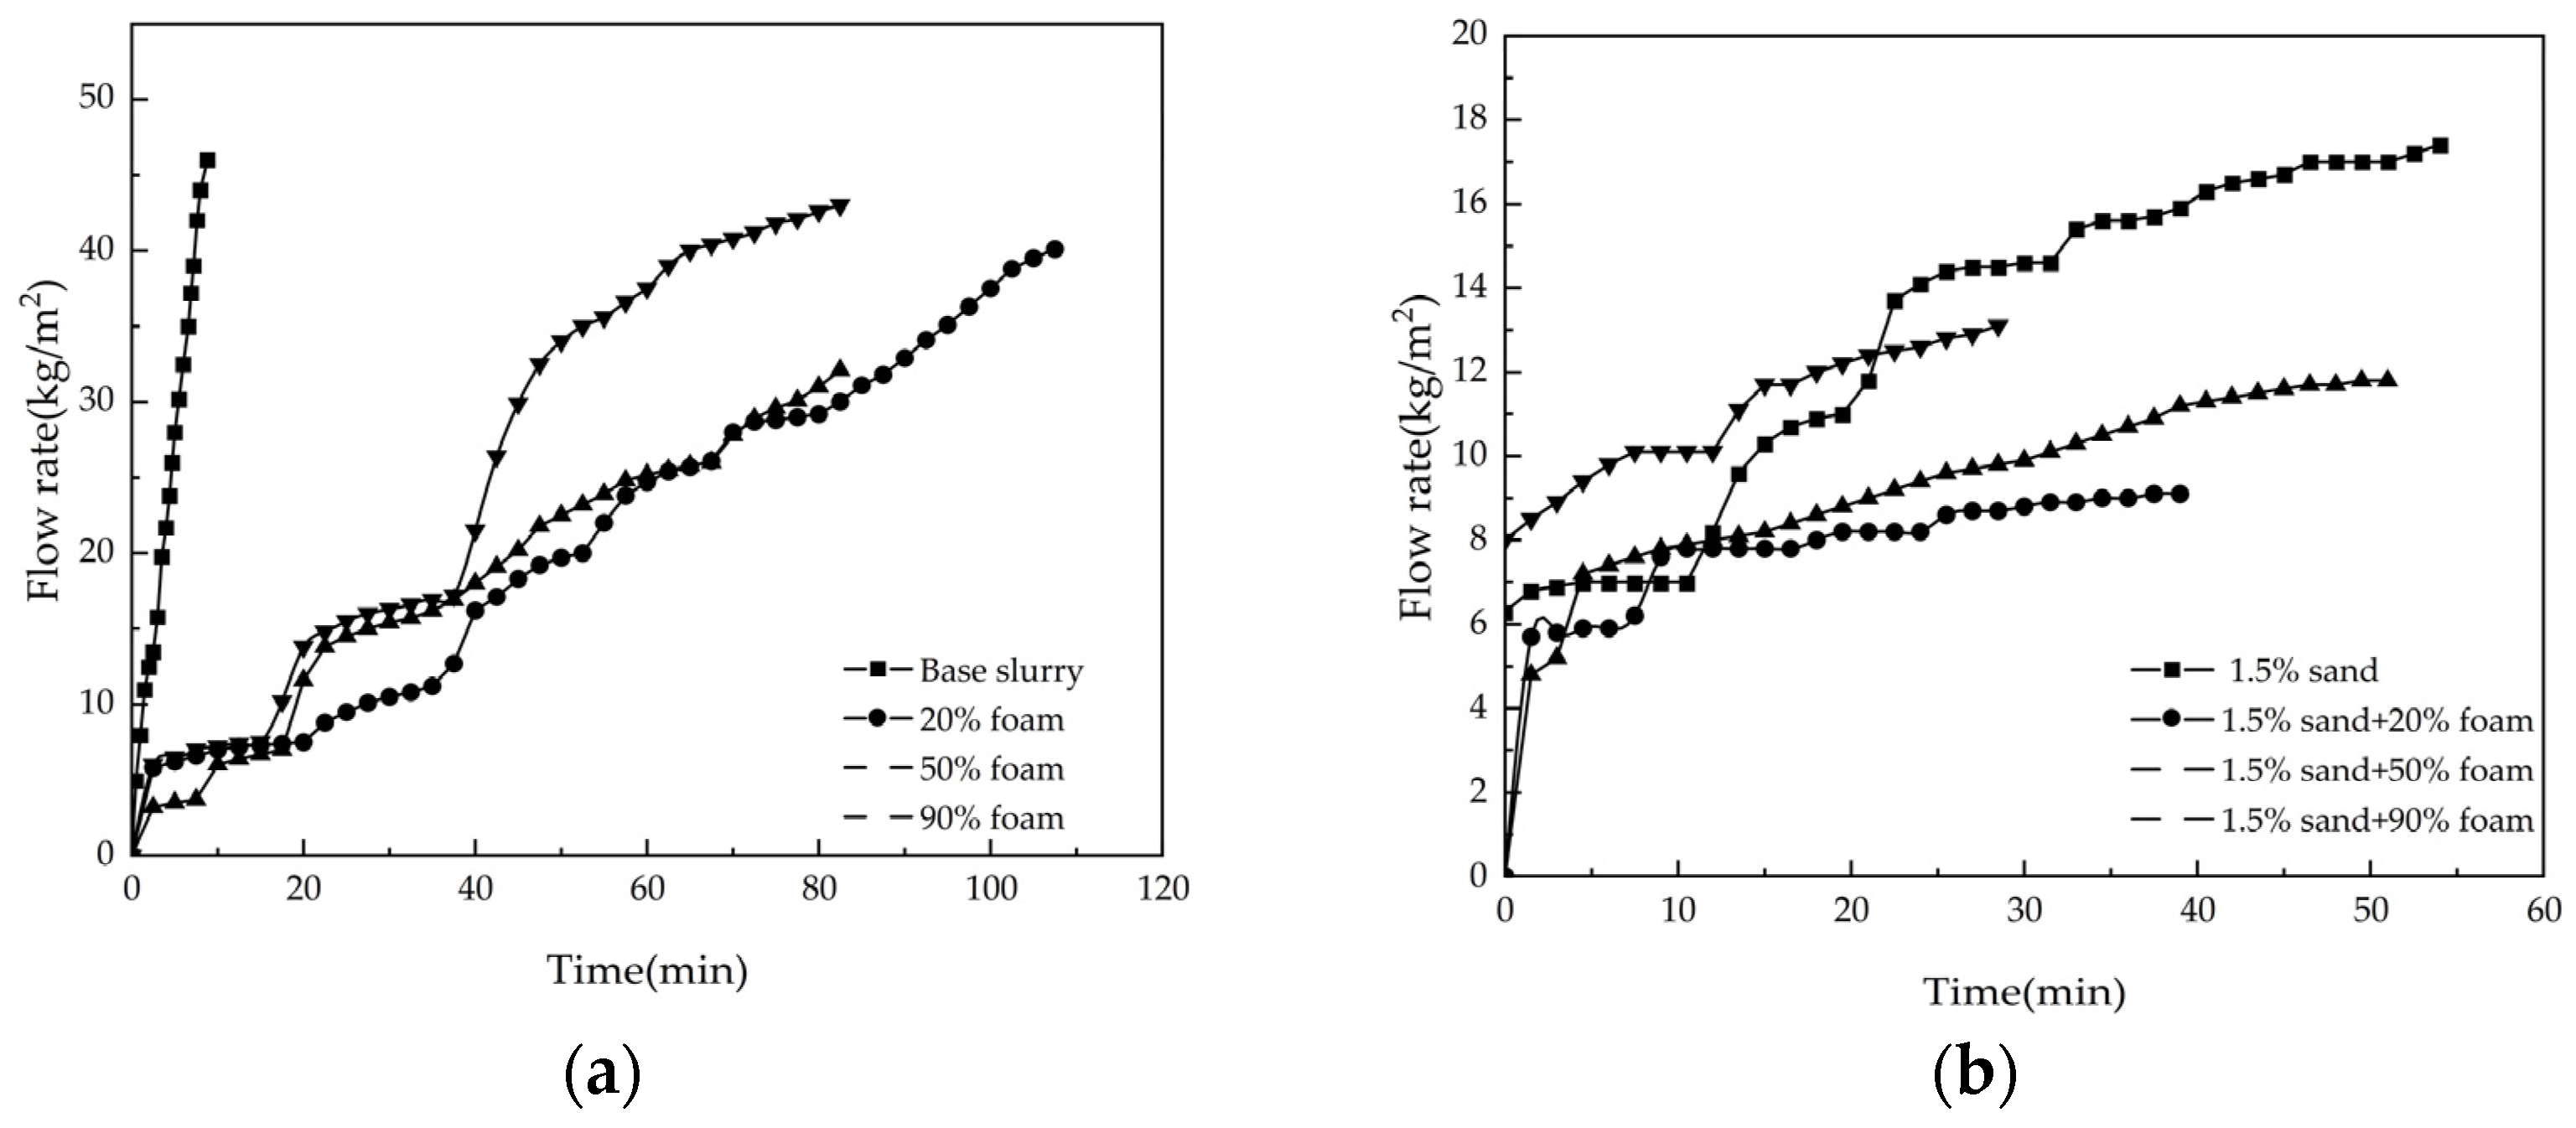
The flow–time curves for the slurry are shown in
Figure 12a. It can be observed that compared to pure slurry, the infiltration rate significantly decreases when foam is added to the slurry, and the total infiltration rate is lowest when the foam concentration is 20%. This is consistent with the previous numerical simulation results, indicating that adding an appropriate foam concentration to the slurry is beneficial for mud cake formation.
The flow–time curves for the slurry before and after adding sand are shown in
Figure 12a,b. A comparison shows that when sand is added to the same foam slurry, the infiltration rate of the slurry significantly decreases. This aligns with the previous numerical simulation finding that an increased swelling ratio helps accelerate mud cake formation.
The foam flow–pressure relationship curves under different infiltration pressures are shown in
Figure 13. It can be seen that within a certain range, the infiltration pressure has a noticeable impact on the flow rate. As the infiltration pressure increases, the flow rate also increases but gradually stabilizes. This is consistent with the conclusion from the numerical simulation that the effect of pressure gradient on the final membrane formation is relatively limited.
Due to constraints in experimental conditions and workload, it was not feasible to experimentally validate every numerical simulation scenario. Instead, representative parameters (such as foam concentration, bentonite swelling ratio, and infiltration pressure) were selected for the preliminary experimental validation of the model. Given the inherent differences between the idealized numerical model and practical laboratory conditions, an exact quantitative agreement between simulation and experiment was not expected; accordingly, some discrepancies in absolute values were observed. Nevertheless, the experiments confirmed that the qualitative trends predicted by the simulations were accurate, particularly with respect to infiltration behavior and mud film formation. This agreement in overall trends—despite minor differences in magnitude—demonstrates that the numerical model reliably captures the essential mechanisms and accurately predicts the qualitative influence of key factors, thereby fulfilling the study’s aim of validating trend predictions rather than achieving perfect numerical correspondence.
In conclusion, the experimental results are consistent with the patterns revealed by the previous numerical simulation results, providing a preliminary verification of the reliability of the numerical simulation outcomes.
6. Conclusions
This study primarily uses numerical simulations to investigate the influence of soil properties, foam slurry proportioning, and pressure gradient on the effectiveness of foam slurry wall formation. The main conclusions are as follows:
The membrane formation process of foam slurry can be divided into three stages—particle infiltration, initial membrane formation, and final membrane formation. During the initial membrane formation stage, bubbles play a significant role in accelerating the formation process by clogging the pores.
The particle size of the soil (especially the maximum particle size, dmax) significantly affects the membrane formation. Smaller particle sizes promote mud cake formation, while larger particle sizes increase permeability, thereby prolonging membrane formation time. An increase in porosity and gradation parameters (such as b and m) also increases the membrane formation time, but their overall impact on membrane formation is relatively small.
The foam slurry composition strongly influences final membrane formation quality. A swelling ratio (Rsw) of around 5% is found to be optimal. When Rsw is too low (Rsw = 2.5%) or foam concentration is too high (Cg = 30%), the slurry fails to form a stable filter cake. In contrast, a foam concentration of approximately 20%, combined with an adequate bentonite content, provides the best balance between bubble transport and effective clogging. Excessive bubble content with insufficient bentonite may lead to continued infiltration and the failure of cake formation.
The pressure gradient affects the membrane formation time and the depth of slurry penetration. Within a tested range up to G = 4000, membrane formation time shows a quadratic increase with pressure gradient. While a moderate increase in infiltration pressure can enhance bubble mobility and reduce formation time, excessively high pressure gradients are unfavorable for achieving a stable filter cake. Overall, the pressure gradient mainly influences the dynamics of bubble migration but has a less decisive impact on the final membrane formation outcome compared to soil and slurry parameters.
In summary, soil particle size and slurry formulation are the dominant factors in determining membrane formation performance. The pressure gradient should be carefully controlled within a reasonable range to avoid undermining filter cake stability. The recommended engineering parameters for effective foam slurry wall formation are as follows: swelling ratio ≈ 5%; foam concentration ≈ 20%; and maximum soil particle size < 1 mm.
Author Contributions
Conceptualization: J.Y. and L.H.; methodology: L.H. and L.C.; software: L.H. and X.L.; validation: L.C., B.C. and T.L.; formal analysis: L.H. and L.C.; investigation: L.H. and X.L.; resources: J.Y. and B.C.; data curation: L.H. and T.L.; writing—original draft preparation: L.H.; writing—review and editing: J.Y., L.C. and X.L.; visualization: L.H. and T.L.; supervision: J.Y.; project administration: J.Y. and L.C.; funding acquisition: J.Y. All authors have read and agreed to the published version of the manuscript.
Funding
This research was funded by the National Key Research and Development Program of China, grant number 2024YFF1700701.
Institutional Review Board Statement
Not applicable.
Informed Consent Statement
Not applicable.
Data Availability Statement
The data that support the findings of this study are available from the corresponding author upon reasonable request.
Conflicts of Interest
Author Long Chen was employed by the company Nanjing Zhongxing New Software Co., Ltd. The remaining authors declare that the research was conducted in the absence of any commercial or financial relationships that could be construed as a potential conflict of interest.
Appendix A
Table A1.
Summary table of numerical simulation schemes.
Table A1.
Summary table of numerical simulation schemes.
| Simulation Schemes | Soil Layer × Slurry | Soil Layer Porosity | Model Dimensions (mm) | Pressure (kPa) | Pressure Gradient |
|---|
| 1 | L1 × SL2 | 0.40 | 3 × 5 × 3 | 100 | 2000 |
| 2 | L2 × SL2 | 9 × 15 × 9 | 300 |
| 3 | L3 × SL2 | 0.34 | 6 × 10 × 6 | 200 | 2000 |
| 4 | L4 × SL2 | 0.36 |
| 5 | L5 × SL2 | 0.38 |
| 6 | L6 × SL2 | 0.40 |
| 7 | L7 × SL2 | 0.42 |
| 8 | L8 × SL2 | 0.44 |
| 9 | L9 × SL2 | 0.40 | 3 × 5 × 3 | 100 | 2000 |
| 10 | L10 × SL2 | 9 × 15 × 9 | 300 |
| 11 | L11 × SL2 | 0.40 | 6 × 10 × 6 | 200 | 2000 |
| 12 | L12 × SL2 |
| 13 | L13 × SL2 |
| 14 | L14 × SL2 |
| 15 | L15 × SL2 |
| 16 | L16 × SL2 |
| 17 | L17 × SL2 | 0.40 | 6 × 10 × 6 | 200 | 2000 |
| 18 | L18 × SL2 |
| 19 | L19 × SL2 |
| 20 | L6 × SL1 | 0.40 | 6 × 10 × 6 | 200 | 2000 |
| 21 | L6 × SL3 |
| 22 | L6 × SL4 |
| 23 | L6 × SL5 |
| 24 | L6 × SL6 |
| 25 | L6 × SL2 | 0.40 | 6 × 10 × 6 | 100 | 1000 |
| 26 | 300 | 3000 |
| 27 | 400 | 4000 |
References
- Zhu, D.; Zhao, C.; Zhao, C.; Xue, J. The Influence of Slurry Density on the Variation Law of Borehole Diameter in Bored Piles. J. Hydraul. Eng. 2015, 46, 349–353. (In Chinese) [Google Scholar]
- Zhao, C.; Liu, F.; Yang, Y.; Zhao, C. Study on the Influence of Mud Circulation Time on Vertical Bearing Characteristics of Single Pile in Sandy Soil. Chin. J. Rock Mech. Eng. 2016, 35, 3323–3330. (In Chinese) [Google Scholar]
- Min, F.; Zhu, W.; Wei, D.; Xia, S. Study on Variation Law of Pore Water Pressure in Soil Layer at Excavation Face during Formation of Mud Cake in Slurry Shield. Chin. J. Geotech. Eng. 2013, 35, 722–727. [Google Scholar]
- Wu, D.; Zhou, S.; Wen, X. Experimental Study on Mud Cake Formation Performance of Slurry Shield in Sandy Soil Layer. J. Rock Mech. Eng. 2015, 34, 3460–3467. [Google Scholar]
- Xu, Q.; Zhang, L.; Zhu, H.; Gong, Z.; Liu, J.; Zhu, Y. Laboratory Tests on Conditioning the Sandy Cobbly Soil for EPB Shield Tunnelling and Its Field Application. Tunn. Undergr. Space Technol. 2020, 105, 103512. [Google Scholar] [CrossRef]
- Ding, Y.; Li, G.; Cheng, Z.; Wang, J.; Chen, J. Analysis of Slot Wall Stability Mechanism during Construction of Diaphragm Wall. Chin. J. Rock Mech. Eng. 2013, 32, 2704–2709. [Google Scholar]
- Shi, S.; Zhang, W. Analysis of Slurry Trench Wall Stability of Deep Foundation Pit with Diaphragm Wall. Chin. J. Geotech. Eng. 2006, 28, 1418–1421. [Google Scholar]
- Luo, Y. Study and Discussion on Slurry Performance in Trench Construction of Diaphragm Wall. Chin. J. Geotech. Eng. 2010, 32, 447–450. [Google Scholar]
- Pu, X.; Li, S.; Li, Y.; Luo, X.; Xu, S.; Luo, J. Study on Leakage Prevention and Sealing Mechanism of Water-Based Microfoam Drilling Fluid. Nat. Gas Ind. 2005, 5, 47–49, 56. [Google Scholar]
- Wang, J.; Peng, Z.; Liu, M.; Li, F. Characteristics of Foam Plant Gum and Its Mechanism of Wall Protection and Leakage Prevention. J. Cent. South Univ. (Sci. Technol.) 2012, 43, 1419–1423. [Google Scholar]
- Huang, M.; Ning, J.; Yu, J.; Li, Y. Stability Analysis of Diaphragm Wall Trenching with Slurry Support in Sandy Strata. Chin. J. Rock Mech. Eng. 2023, 42, 1767–1777. [Google Scholar]
- Niu, T. Study on Factors Influencing Slurry Shield Mud Cake Formation and Excavation Face Stability. Master’s Thesis, Nanchang University, Nanchang, China, 2018. (In Chinese). [Google Scholar]
- Bai, Y.; Kong, X.; Liao, S. Study on Dynamic Formation Mechanism of Slurry Shield Mud Cake. Rock Soil Mech. 2010, 31, 19–24. [Google Scholar]
- Zhao, J.; Tan, Z.; Yu, R.; Jia, A.; Qu, C. Study on the Mix of Slurry Membrane for Soil Conditioning of EPB Shield and Its Application Effect in Water-Rich Gravel Strata. Adv. Civ. Eng. 2022, 2022, 7751053. [Google Scholar] [CrossRef]
- Liu, C.; Kou, W.; Lu, Y. Experimental Study on the Film-Forming Efficiency of Sand-Added Slurry in Sandy Strata. J. For. Eng. 2017, 2, 121–126. [Google Scholar]
- Ye, W.; Wang, J.; Fu, L.; Zhou, S.; Ning, J. Experimental Study on Slurry Cake Formation Characteristics of Slurry Shield in Medium-Coarse Sand Stratum in Fuzhou. Chin. J. Rock Mech. Eng. 2018, 37, 1260–1269. [Google Scholar]
- Weng, K.; Jiang, T.; Han, Y. Discussion on Construction Technology of Using Aerated Foam Mud to Treat Long Borehole Section in Leakage Stratum. Explor. Eng. (Geotech. Drill. Excav. Eng.) 2017, 44, 21–26. [Google Scholar]
- Yang, J.; Xue, Y.; Zhang, B.; He, X. Air Recyclable Foam Drilling Fluid Technology for Large Borehole in Fen-1 Well. Drill. Fluid Complet. Fluid 2007, 24, 86–88+130–131. [Google Scholar]
- Liu, Y.; Dai, F.; Xu, N.; Zhao, T.; Feng, P. Experimental and Numerical Investigation on the Tensile Fatigue Properties of Rocks Using the Cyclic Flattened Brazilian Disc Method. Soil Dyn. Earthq. Eng. 2018, 105, 68–82. [Google Scholar] [CrossRef]
- Zhu, X.; Zhang, Q.; Yu, Y.; Shi, X. Study on Penetration Mechanical Properties of EMAS Foamed Concrete Based on Discrete Element Method. J. Build. Mater. 2023, 26, 122–128. [Google Scholar]
- Chen, L. Numerical Simulation Study on the Mechanism and Regularity of Foam Slurry Wall Formation. Master’s Thesis, Hohai University, Nanjing, China, 2022. (In Chinese). [Google Scholar]
- Zhu, J.; Guo, W.; Wang, Y.; Wen, Y. Study on Grading Equation and Its Applicability of Continuously Graded Soil. Chin. J. Geotech. Eng. 2015, 37, 1931–1936. [Google Scholar]
- Jia, R.; Zhu, W.; Min, F. Influence of Slurry Particle Size Distribution and Formation Pore Size on the Formation of Slurry Shield Mud Cake. China J. Highw. Transp. 2017, 30, 100–108. [Google Scholar]
- Abd Elaty, M.A.A.; Azzam, W.R.; Eldesoky, A.G. Properties of Cement–Bentonite Mortar Developed by Mineral Additives for Primary Firm Secant Pile by Taguchi Method. Innov. Infrastruct. Solut. 2023, 8, 259. [Google Scholar] [CrossRef]
Figure 1.
Model computational domain discretization.
Figure 1.
Model computational domain discretization.
Figure 2.
Bubble enlargement program processing diagram.
Figure 2.
Bubble enlargement program processing diagram.
Figure 3.
Absence of stable mud cake formation after slurry infiltration (Scenario 22).
Figure 3.
Absence of stable mud cake formation after slurry infiltration (Scenario 22).
Figure 4.
Formation of stable mud cake upon infiltration of foamed slurry (Scenario 6).
Figure 4.
Formation of stable mud cake upon infiltration of foamed slurry (Scenario 6).
Figure 5.
Seepage behavior of foamed slurry in different soil layers.
Figure 5.
Seepage behavior of foamed slurry in different soil layers.
Figure 6.
Seepage behavior of foamed slurry in L6 soil layer.
Figure 6.
Seepage behavior of foamed slurry in L6 soil layer.
Figure 7.
Seepage behavior of foamed slurry in soil layers with different gradation parameters.
Figure 7.
Seepage behavior of foamed slurry in soil layers with different gradation parameters.
Figure 8.
Influence of parameters (b) and (m) on membrane formation time. (a) Plot of membrane formation duration (T) versus parameter (b). (b) Plot of membrane formation duration (T) versus parameter (m).
Figure 8.
Influence of parameters (b) and (m) on membrane formation time. (a) Plot of membrane formation duration (T) versus parameter (b). (b) Plot of membrane formation duration (T) versus parameter (m).
Figure 9.
Effect of foamed slurry mix ratio on membrane formation outcome. (a) Effect of water absorption ratio on membrane formation outcome. (b) Effect of foam concentration on membrane formation outcome.
Figure 9.
Effect of foamed slurry mix ratio on membrane formation outcome. (a) Effect of water absorption ratio on membrane formation outcome. (b) Effect of foam concentration on membrane formation outcome.
Figure 10.
Effect of pressure gradient on membrane formation outcome.
Figure 10.
Effect of pressure gradient on membrane formation outcome.
Figure 11.
Schematic diagram of experimental setup.
Figure 11.
Schematic diagram of experimental setup.
Figure 12.
Flow–time process curves of slurry under different conditions. (a) Without sand addition. (b) After sand addition.
Figure 12.
Flow–time process curves of slurry under different conditions. (a) Without sand addition. (b) After sand addition.
Figure 13.
Flow–pressure relationship curve of foamed slurry after sand addition.
Figure 13.
Flow–pressure relationship curve of foamed slurry after sand addition.
Table 1.
Seepage calculation scheme for foamed slurry under uniform particle size conditions.
Table 1.
Seepage calculation scheme for foamed slurry under uniform particle size conditions.
| Model Number | Particle Size Range (mm) | Model Dimensions (mm) | Porosity | Permeability Coefficient (cm/s) | Common Soil Types |
|---|
| L1 | 0.25~0.5 | 3 × 5 × 3 | 0.40 | 6.01 × 10⁻² | Silt |
| L2 | 1~2 | 9 × 15 × 9 | 0.40 | 3.30 | Gravel |
| L3 | 0.5~1 | 6 × 10 × 6 | 0.34 | 5.5 × 10⁻¹ | Sand |
| L4 | 0.36 | 5.8 × 10⁻¹ |
| L5 | 0.38 | 6.7 ×1 0−1 |
| L6 | 0.40 | 7.4 × 10⁻¹ |
| L7 | 0.42 | 8.8 × 10⁻¹ |
| L8 | 0.44 | 1.02 |
Table 2.
Seepage calculation scheme for foamed slurry under continuous particle size distribution conditions.
Table 2.
Seepage calculation scheme for foamed slurry under continuous particle size distribution conditions.
| Model Number | Model Dimensions (mm) | dmax | b | m | Porosity | Permeability Coefficient (cm/s) * | Common Soil Types |
|---|
| L9 | 3 × 5 × 3 | 0.5 | 0.9 | 4 | 0.40 | 3.09 × 10⁻² | Sand |
| L10 | 9 × 15 × 9 | 2 | 0.9 | 4 | 0.40 | 2.48 | Gravel |
| L11 | 6 × 10 × 6 | 1 | 0.6 | 4 | 0.40 | 6.6 × 10⁻¹ | Sand |
| L12 | 0.8 | 4 | 4.5 × 10⁻¹ |
| L13 | 0.9 | 4 | 3.9 × 10⁻¹ |
| L14 | 0.95 | 4 | 3.3 × 10⁻¹ |
| L15 | 0.99 | 4 | 1.1 × 10⁻¹ |
| L16 | 6 × 10 × 6 | 1 | 0.9 | 2 | 0.40 | 1.6 × 10⁻¹ |
| L17 | 0.9 | 6 | 5.7 × 10⁻¹ |
| L18 | 6 × 10 × 6 | 1 | 0.9 | 8 | 0.40 | 7.8 × 10⁻¹ |
| L19 | 0.9 | 10 | 8.1 × 10⁻¹ |
Table 3.
Foamed slurry model parameter scheme.
Table 3.
Foamed slurry model parameter scheme.
| Number | Water Absorption Ratio (%) | Foam Concentration (%) | Specific Gravity | Mud Viscosity (Pa·s) | Number of Bentonite Particles (Particles/cm3) | Number of Foam Particles (Particles/cm3) |
|---|
| SL1 | 2.5 | 20 | 0.86 | 1 × 10⁻³ | 28,993 | 117,507 |
| SL2 | 5 | 20 | 0.89 | 58,581 | 117,074 |
| SL3 | 10 | 20 | 0.95 | 119,376 | 117,233 |
| SL4 | 5 | 0 | 1.1 | 53,719 | 0 |
| SL5 | 5 | 10 | 0.97 | 63,846 | 64,969 |
| SL6 | 5 | 30 | 0.82 | 53,973 | 162,608 |
Table 4.
Classification of influence factors and parameter settings for the numerical modeling of foam slurry.
Table 4.
Classification of influence factors and parameter settings for the numerical modeling of foam slurry.
| Influence Factors | Parameter Studied | Range/Values Selected | Number of Cases |
|---|
| Soil Properties | Particle size | Particle size range: 0.5–2 mm; maximum particle size, dmax: 0.5/1/2 mm | 11 |
| | Gradation b | 0.6–0.99 | 5 |
| | Gradation m | 2–10 | 4 |
| Slurry Composition | Swelling ratio | 2.5–10% | 3 |
| | Foam concentration | 0–30% | 3 |
| Pressure Gradient | Infiltration pressure gradient | 1000/2000/3000/4000 | 4 |
| Disclaimer/Publisher’s Note: The statements, opinions and data contained in all publications are solely those of the individual author(s) and contributor(s) and not of MDPI and/or the editor(s). MDPI and/or the editor(s) disclaim responsibility for any injury to people or property resulting from any ideas, methods, instructions or products referred to in the content. |
© 2025 by the authors. Licensee MDPI, Basel, Switzerland. This article is an open access article distributed under the terms and conditions of the Creative Commons Attribution (CC BY) license (https://creativecommons.org/licenses/by/4.0/).


