
SGM-EMA: Speech Enhancement Method Score-Based Diffusion Model and EMA Mechanism

Abstract
1. Introduction
- We pay special attention to the score-based diffusion model and the multi-resolution U-Net model and make corresponding modifications to the U-Net structure to better handle speech enhancement tasks.
- We introduce an EMA mechanism that captures both multi-scale contextual information and local details, thereby enhancing the performance of speech enhancement.
- To verify the effectiveness of our proposed method, we conducted experiments on the VB-DMD and TIMIT-TUT datasets. The results show that our SGM-EMA method performed well on the speech enhancement task.
- We also conducted ablation studies to evaluate the contribution of the method in the predictor of the PC sampler and the EMA mechanism to the overall model performance.
2. Methodology
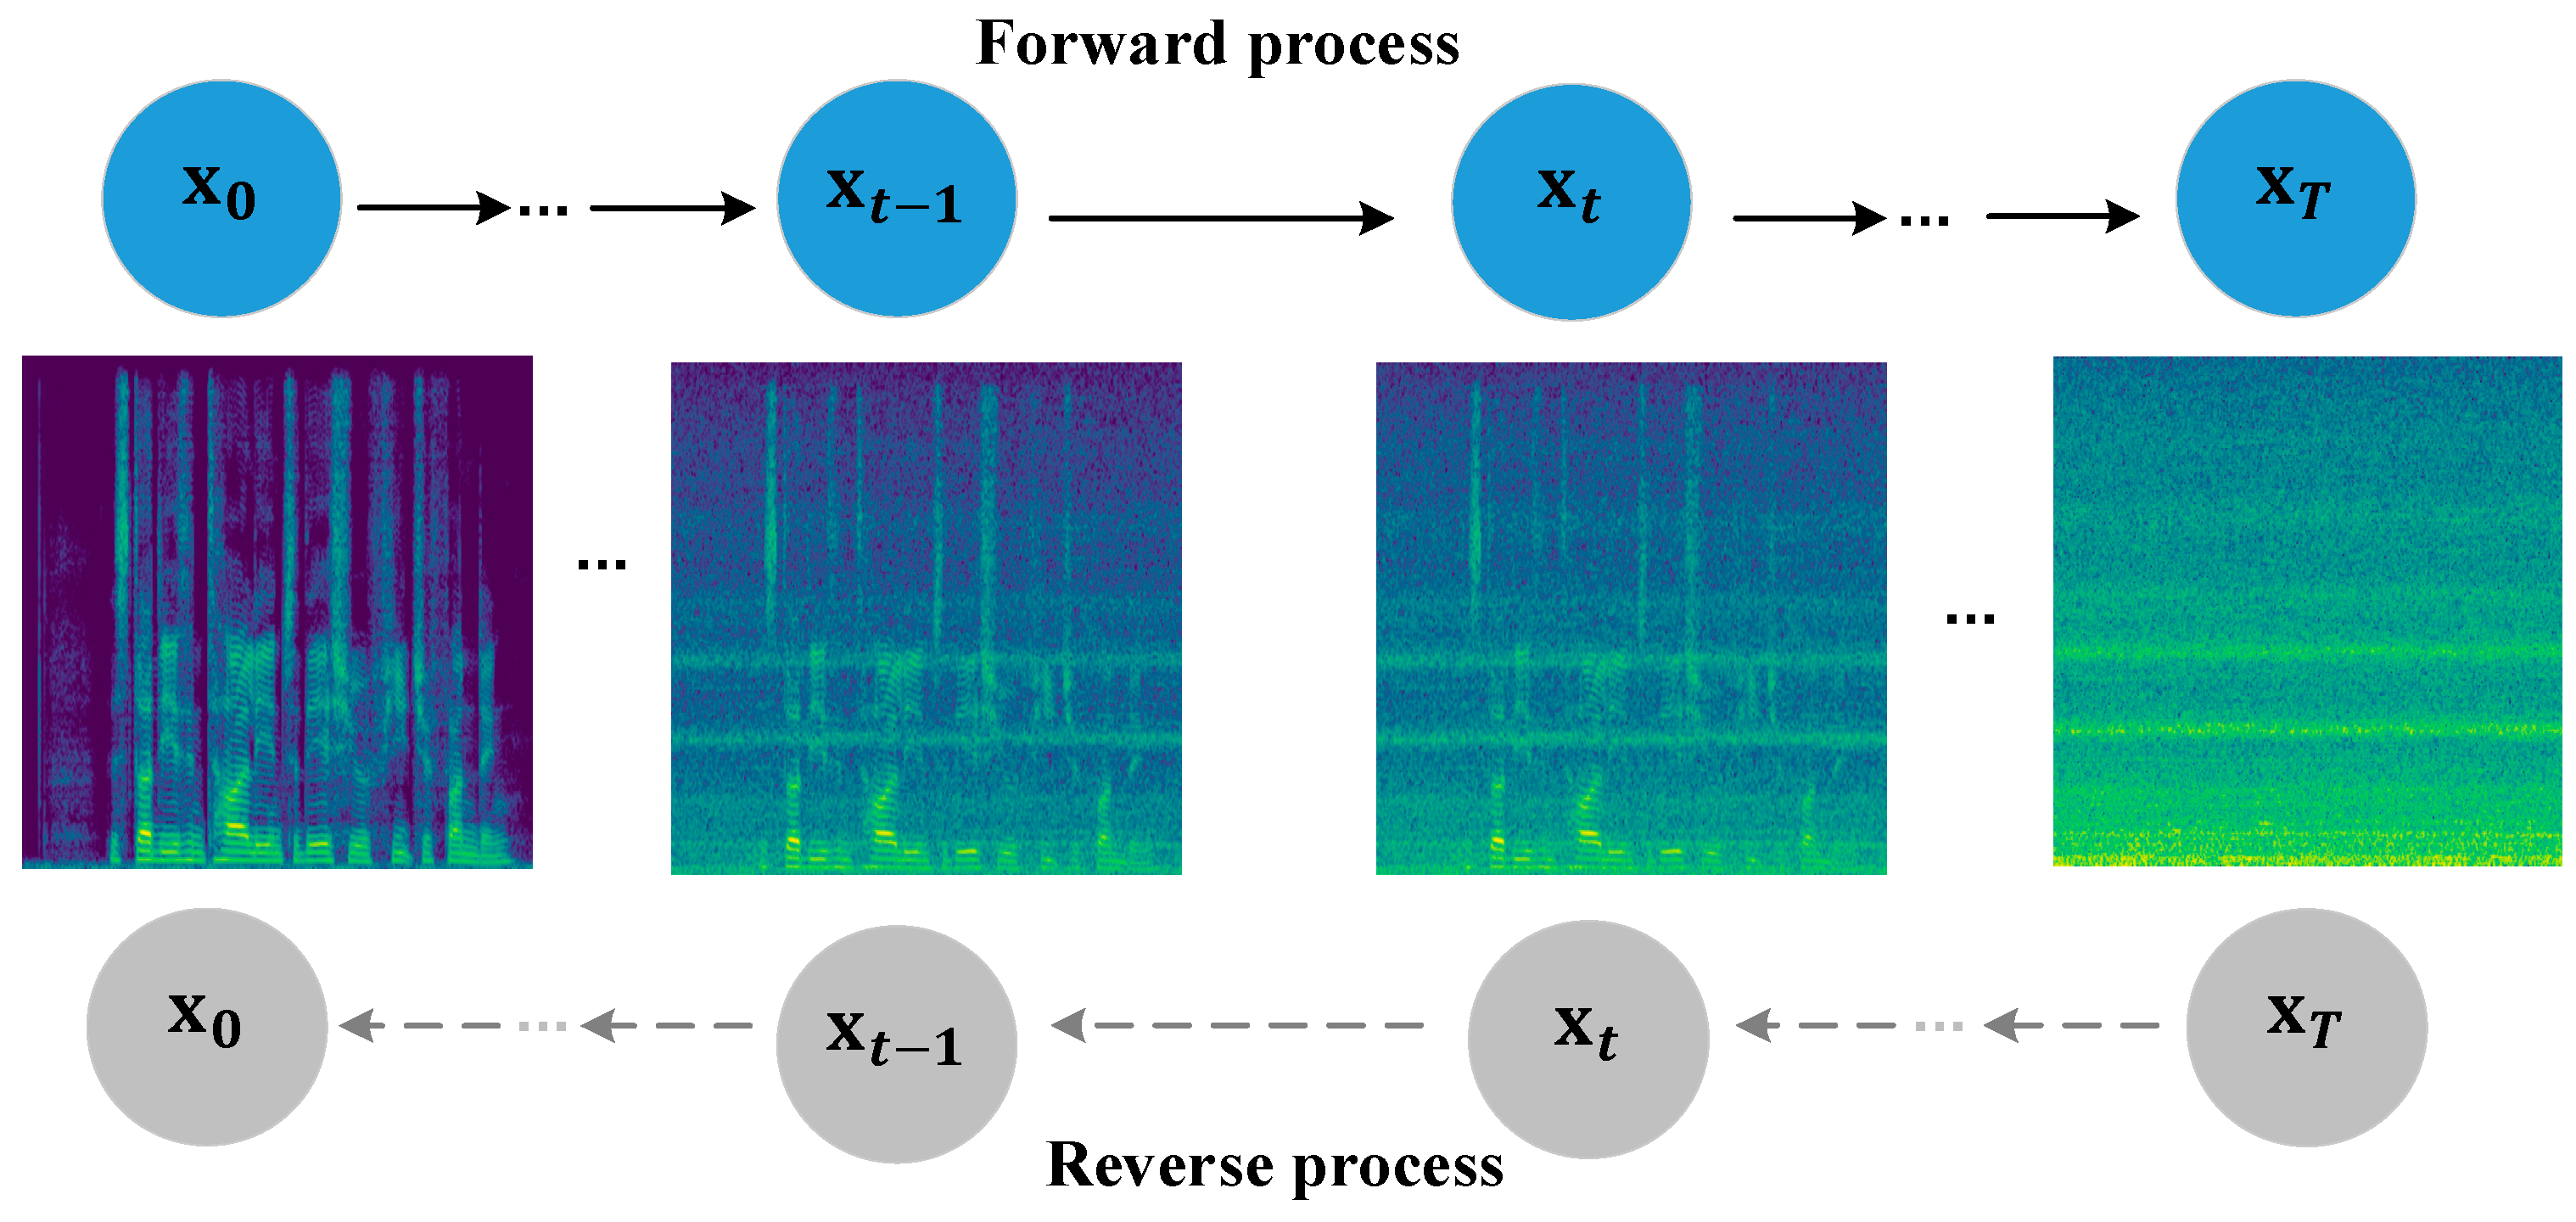
2.1. Diffusion Process Based on SDE
- (1)
- Forward process: The forward process is implemented by gradually adding Gaussian noise to clean speech. However, as the model is specifically designed for Gaussian noise, it may not generalize well to non-Gaussian or more complex real-world noise conditions. Following the approach of Song et al. [41], we designed a random diffusion process , which is the solution to the following linear stochastic differential equation (SDE):
- (2)
- Reverse process: The reverse process gradually removes noise from the noisy signal and estimates a signal close to the original clean speech. According to Song et al. [41] and Anderson et al. [42], the SDE in Equation (1) has a related reverse SDE. This is achieved by solving the following differential equation:
- (3)
- Training objective: The objective function for training the score model is derived as follows. Based on Equation (1), the forward diffusion process defines a Gaussian process, allowing the mean and variance of the process state to be determined when the initial conditions are known [43]. Consequently, this allows for direct sampling of at any time step given and by using the perturbation kernel:
2.2. Numerical SDE Solver
| Algorithm 1: Predictor–Corrector (PC) Sampling |
| Require: N: Number of discretization steps for the reverse-time SDE M: Number of Corrector steps 0 |
2.3. EMA Mechanism
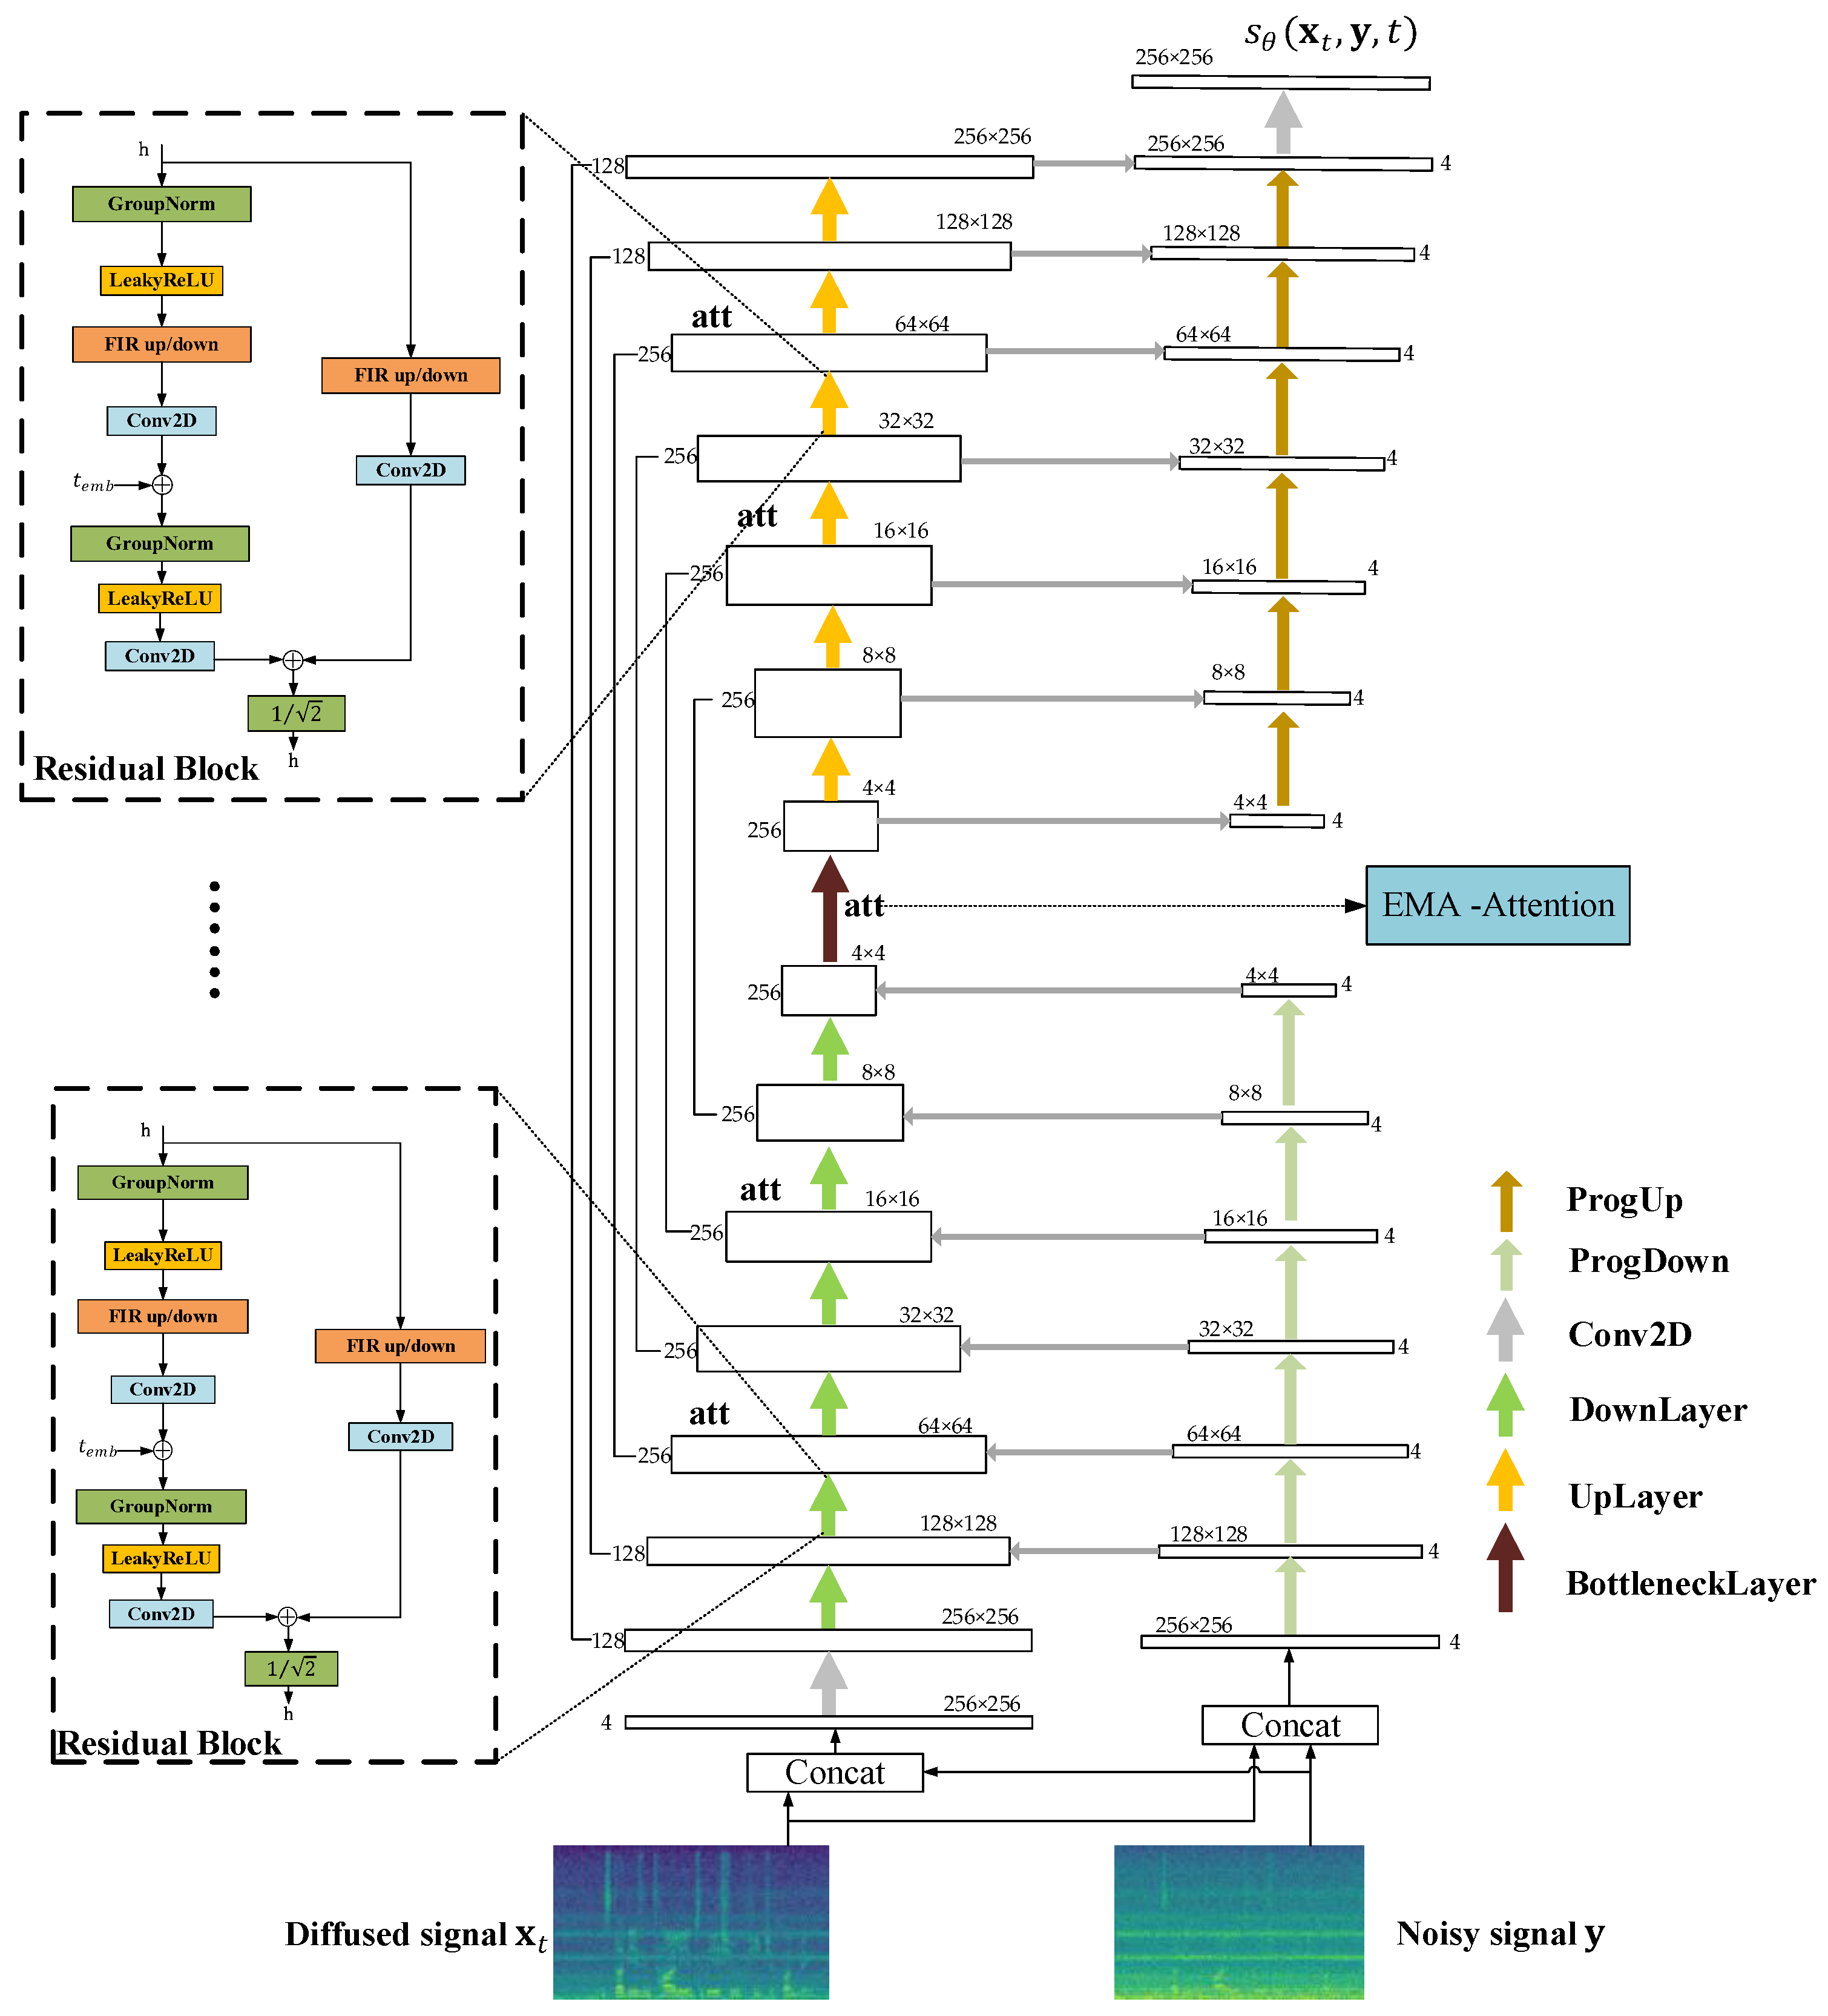
2.4. Multi-Resolution U-Net Network
3. Network Model Structure
4. Experimental Setup
4.1. Dataset
- (a)
- VB-DMD: The experiments used the publicly available VB-DMD dataset [59], which is widely used in speech enhancement and denoising research (it is available at https://doi.org/10.7488/ds/2117, accessed on 10 September 2024). The clean speech signal came from the VoiceBank dataset, with a sampling rate of 48 kHz, and the noisy signal came from the DEMAND dataset, with a sampling rate of 48 kHz. The dataset contains a variety of real-world background noises, such as cafes, streets, and offices. The training set (11,572 utterances) consisted of 28 speakers with signal-to-noise ratios (SNRs) of 15, 10, 5, and 0 dB. The test set (824 utterances) consisted of 2 speakers with SNRs of 17.5, 12.5, 7.5, and 2.5 dB. Both the training and test sets were resampled to 16 kHz.
- (b)
- TIMIT-TUT: The TIMIT-TUT dataset was created by selecting the complete test set of the acoustic–phonetic continuous speech corpus jointly constructed by Texas Instruments (TI), Massachusetts Institute of Technology (MIT), and Stanford Research Institute (SRI), and the noise signal from TUT. The TUT noise dataset covers a variety of sound events in daily environments, such as traffic noise, human voices, animal calls, etc. (it is available at https://paperswithcode.com/dataset/tut-sound-events-2017, accessed on 13 September 2024). The TIMIT [60] complete test set of clean speech consists of 1344 utterances spoken by 168 speakers with a sampling rate of 16 kHz (it is available at https://goo.gl/l0sPwz, accessed on 14 September 2024). The TIMIT-TUT mixed dataset was a random segment from a noise file randomly selected from the noise signal and added to the clean speech signal, generating a total of 1344 mixed speech samples for testing. All mixed datasets were resampled uniformly to 16 kHz, with a signal-to-noise ratio between 0 and 20 dB.
4.2. Hyperparameter Configuration
4.3. Baseline
4.4. Evaluation Metrics
- (a)
- PESQ: This metric assesses perceptual speech quality and is commonly used in voice communication and speech enhancement. It produces scores ranging from −0.5 to 4.5, where a higher score indicates better speech quality and a lower score indicates poor speech quality.
- (b)
- ESTOI: This is an objective indicator for evaluating speech intelligibility in speech enhancement systems. ESTOI provides scores between 0 and 1, where values closer to 1 indicate better speech intelligibility, and values closer to 0 indicate poorer speech intelligibility.
- (c)
- SI-SDR: This metric evaluates signal reconstruction accuracy in tasks such as speech enhancement, denoising, and source separation. Values below 10 dB suggest significant distortion and poor reconstruction, scores between 10 and 20 dB indicate acceptable quality with moderate artifacts, and values above 20 dB imply high-fidelity reconstruction with minimal distortion or noise.
4.5. Ablation Study
5. Experimental Results and Discussion
5.1. Experimental Results
5.2. Trade-Offs in Model Design
6. Conclusions
Author Contributions
Funding
Institutional Review Board Statement
Informed Consent Statement
Data Availability Statement
Conflicts of Interest
Abbreviations
| EMA | Efficient multi-scale attention |
| VB-DMD | VoiceBank-DEMAND |
| VB | VoiceBank |
| DMD | DEMAND |
| TIMIT | The DARPA TIMIT Acoustic–Phonetic Continuous Speech Corpus |
| TUT | TUT Sound Events 2017 |
| PESQ | Perceptual evaluation of speech quality |
| ESTOI | Extended short-time objective intelligibility |
| SI-SDR | Scale-invariant signal-to-distortion ratio |
| T-F | Time–frequency |
| D | Discriminant models |
| G | Generative models |
| SDE | Stochastic differential equation |
| SDE | Stochastic differential equations |
| PC | Predictor–corrector |
| U-Net | Convolutional Networks for Biomedical Image Segmentation |
| NCSN++ | Noise Conditional Score Network++ |
| Conv2D | Two-Dimensional Convolution |
| FIR | Finite impulse response |
| TI | Texas Instruments |
| MIT | Massachusetts Institute of Technology |
| SRI | Stanford Research Institute |
| SNR | Signal-to-noise ratio |
References
- Ephraim, Y.; Malah, D. Speech enhancement using a minimum-mean square error short-time spectral amplitude estimator. IEEE Trans. Acoust. Speech Signal Process. 1984, 32, 1109–1121. [Google Scholar] [CrossRef]
- Soares, A.S.P.; Parreira, W.D.; Souza, E.G.; do Nascimento, C.d.D.; Almeida, S.J.M.D. Voice activity detection using generalized exponential kernels for time and frequency domains. IEEE Trans. Circuits Syst. I Regul. Pap. 2019, 66, 2116–2123. [Google Scholar] [CrossRef]
- May, A.; Garakani, A.B.; Lu, Z.; Guo, D.; Liu, K.; Bellet, A.; Fan, L.; Collins, M.; Hsu, D.; Kingsbury, B.; et al. Kernel approximation methods for speech recognition. J. Mach. Learn. Res. 2019, 20, 1–36. [Google Scholar]
- Boll, S. Suppression of Acoustic Noise in Speech Using Spectral Subtraction. IEEE Trans. Acoust. Speech Signal Process 1979, 27, 113–120. [Google Scholar] [CrossRef]
- Yadava, T.; Nagaraja, B.G.; Jayanna, H.S. A spatial procedure to spectral subtraction for speech enhancement. Multimed. Tools Appl. 2022, 81, 23633–23647. [Google Scholar]
- Ioannides, G.; Rallis, V. Real-Time Speech Enhancement Using Spectral Subtraction with Minimum Statistics and Spectral Floor. arXiv 2023, arXiv:2302.10313. [Google Scholar]
- Li, C.; Jiang, T.; Wu, S. Single-channel speech enhancement based on improved frame-iterative spectral subtraction in the modulation domain. China Commun. 2021, 18, 100–115. [Google Scholar] [CrossRef]
- Ephraim, Y.; Van Trees, H.L. A Signal Subspace Approach for Speech Enhancement. IEEE Trans. Speech Audio Process 1995, 3, 251–266. [Google Scholar] [CrossRef]
- Asano, F.; Hayamizu, S.; Yamada, T.; Suzuki, Y.; Sone, T. Speech enhancement based on the subspace method. IEEE Trans. Speech Audio Process. 2000, 8, 497–507. [Google Scholar] [CrossRef]
- Chen, J.; Benesty, J.; Huang, Y.; Doclo, S. New Insights into the Noise Reduction Wiener Filter. IEEE Trans. Audio Speech Lang. Process 2006, 14, 1218–1234. [Google Scholar] [CrossRef]
- Abd El-Fattah, M.A.; Dessouky, M.I.; Abbas, A.M.; Diab, S.M.; El-Rabaie, S.M.; Al-Nuaimy, W.; Alshebeili, S.A.; Abd El-Samie, F.E. Speech enhancement with an adaptive Wiener filter. Int. J. Speech Technol. 2014, 17, 53–64. [Google Scholar] [CrossRef]
- Jadda, A.; Prabha, I.S. Speech enhancement via adaptive Wiener filtering and optimized deep learning framework. Int. J. Wavelets Multiresolution Inf. Process. 2023, 21, 2250032. [Google Scholar] [CrossRef]
- Garg, A. Speech enhancement using long short term memory with trained speech features and adaptive wiener filter. Multimed. Tools Appl. 2023, 82, 3647–3675. [Google Scholar] [CrossRef] [PubMed]
- Jaiswal, R.K.; Yeduri, S.R.; Cenkeramaddi, L.R. Single-channel speech enhancement using implicit Wiener filter for high-quality speech communication. Int. J. Speech Technol. 2022, 25, 745–758. [Google Scholar] [CrossRef]
- Martin, R. Speech enhancement based on minimum mean-square error estimation and supergaussian priors. IEEE Trans. Speech Audio Process 2005, 13, 845–856. [Google Scholar] [CrossRef]
- Wang, Z.; Zhang, T.; Shao, Y.; Ding, B. LSTM-convolutional-BLSTM encoder-decoder network for minimum mean-square error approach to speech enhancement. Appl. Acoust. 2021, 172, 107647. [Google Scholar] [CrossRef]
- Ephraim, Y.; Malah, D.; Juang, B.H. On the application of hidden Markov models for enhancing noisy speech. IEEE Trans. Acoust. Speech Signal Process. 1989, 37, 1846–1856. [Google Scholar] [CrossRef]
- Kundu, A.; Chatterjee, S.; Murthy, A.S.; Sreenivas, T.V. GMM based Bayesian approach to speech enhancement in signal/transform domain. In Proceedings of the 2008 IEEE International Conference on Acoustics, Speech and Signal Processing, Las Vegas, NV, USA, 31 March–4 April 2008. [Google Scholar]
- Ochieng, P. Deep neural network techniques for monaural speech enhancement and separation: State of the art analysis. Artif. Intell. Rev. 2023, 56, 3651–3703. [Google Scholar] [CrossRef]
- Ribas, D.; Miguel, A.; Ortega, A.; Lleida, E. Wiener filter and deep neural networks: A well-balanced pair for speech enhancement. Appl. Sci. 2022, 12, 9000. [Google Scholar] [CrossRef]
- Zhang, W.; Saijo, K.; Wang, Z.-Q.; Watanabe, S.; Qian, Y. Toward universal speech enhancement for diverse input conditions. In Proceedings of the 2023 IEEE Automatic Speech Recognition and Understanding Workshop (ASRU 2023), Taipei, Taiwan, 16–20 December 2023. [Google Scholar]
- Tan, K.; Wang, D.L. Towards model compression for deep learning based speech enhancement. IEEE/ACM Trans. Audio Speech Lang. Process. 2021, 29, 1785–1794. [Google Scholar] [CrossRef]
- Jannu, C.; Vanambathina, S.D. Shuffle attention u-net for speech enhancement in time domain. Int. J. Image Graph. 2024, 24, 2450043. [Google Scholar] [CrossRef]
- Wang, K.; He, B.; Zhu, W.P. TSTNN: Two-stage transformer based neural network for speech enhancement in the time domain. In Proceedings of the ICASSP 2021—2021 IEEE International Conference on Acoustics, Speech and Signal Processing (ICASSP), Toronto, ON, Canada, 6–11 June 2021; pp. 7098–7102. [Google Scholar]
- Zhang, Q.; Song, Q.; Ni, Z.; Nicolson, A.; Li, H. Time-frequency attention for monaural speech enhancement. In Proceedings of the ICASSP 2022—2022 IEEE International Conference on Acoustics, Speech and Signal Processing (ICASSP), Online, 7–13 May 2022; pp. 7852–7856. [Google Scholar]
- Chen, Y.T.; Wu, Z.T.; Hung, J.W. Cross-Domain Conv-TasNet Speech Enhancement Model with Two-Level Bi-Projection Fusion of Discrete Wavelet Transform. Appl. Sci. 2023, 13, 5992. [Google Scholar] [CrossRef]
- Tang, C.; Luo, C.; Zhao, Z.; Xie, W.; Zeng, W. Joint Time-Frequency and Time Domain Learning for Speech Enhancement. In Proceedings of the Twenty-Ninth International Conference on International Joint Conferences on Artificial Intelligence, Montreal, QC, Canada, 19–27 August 2021; pp. 3816–3822. [Google Scholar]
- Zhou, L.; Gao, Y.; Wang, Z.; Li, J.; Zhang, W. Complex spectral mapping with attention based convolution recurrent neural network for speech enhancement. arXiv 2021, arXiv:2104.05267. [Google Scholar]
- Pang, J.; Li, H.; Jiang, T.; Li, J.; Zhang, W. A Dual-Channel End-to-End Speech Enhancement Method Using Complex Operations in the Time Domain. Appl. Sci. 2023, 13, 7698. [Google Scholar] [CrossRef]
- Pandey, A.; Wang, D.L. Dense CNN with self-attention for time-domain speech enhancement. IEEE/ACM Trans. Audio Speech Lang. Process. 2021, 2, 1270–1279. [Google Scholar] [CrossRef]
- Saleem, N.; Gunawan, T.S.; Dhahbi, S.; Bourouis, S. Time domain speech enhancement with CNN and time-attention transformer. Digit. Signal Process. 2024, 147, 104408. [Google Scholar] [CrossRef]
- Phan, H.; Le Nguyen, H.; Chén, O.Y.; Koch, P.; Duong, N.Q.K.; McLoughlin, I.; Mertins, A. Self-attention generative adversarial network for speech enhancement. In Proceedings of the ICASSP 2021—2021 IEEE International Conference on Acoustics, Speech and Signal Processing (ICASSP), Toronto, ON, Canada, 6–11 June 2021; pp. 7103–7107. [Google Scholar]
- Cao, R.; Abdulatif, S.; Yang, B. CMGAN: Conformer-based metric GAN for speech enhancement. arXiv 2022, arXiv:2203.15149. [Google Scholar]
- Hamdan, M.; Punjabi, P. Generative Adversarial Networks for Speech Enhancement. In Proceedings of the 2024 7th International Conference on Signal Processing and Information Security (ICSPIS), Dubai, United Arab Emirates, 12–14 November 2024; pp. 1–5. [Google Scholar]
- Xiang, Y.; Højvang, J.L.; Rasmussen, M.H.; Christensen, M.G. A two-stage deep representation learning-based speech enhancement method using variational autoencoder and adversarial training. IEEE/ACM Trans. Audio Speech Lang. Process. 2023, 32, 164–177. [Google Scholar] [CrossRef]
- Halimeh, M.; Kellermann, W. Complex-valued spatial autoencoders for multichannel speech enhancement. In Proceedings of the ICASSP 2022—2022 IEEE International Conference on Acoustics, Speech and Signal Processing (ICASSP), Online, 7–13 May 2022; pp. 261–265. [Google Scholar]
- Zhang, J.; Jayasuriya, S.; Berisha, V. Restoring degraded speech via a modified diffusion model. arXiv 2021, arXiv:2104.11347. [Google Scholar]
- Serrà, J.; Pascual, S.; Pons, J.; Araz, R.O.; Scaini, D. Universal speech enhancement with score-based diffusion. arXiv 2022, arXiv:2206.03065. [Google Scholar]
- Richter, J.; Frintrop, S.; Gerkmann, T. Audio-visual speech enhancement with score-based generative models. In Proceedings of the Speech Communication, 15th ITG Conference, Aachen, Germany, 20–22 September 2023; pp. 275–279. [Google Scholar]
- Yang, M.; Zhang, C.; Xu, Y.; Wang, H.; Raj, B.; Yu, D. Usee: Unified speech enhancement and editing with conditional diffusion models. In Proceedings of the ICASSP 2024-2024 IEEE International Conference on Acoustics, Speech and Signal Processing (ICASSP), Seoul, Republic of Korea, 14–19 April 2024; pp. 7125–7129. [Google Scholar]
- Song, Y.; Sohl-Dickstein, J.; Kingma, D.P.; Kumar, A.; Ermon, S.; Poole, B. Score-based generative modeling through stochastic differential equations. arXiv 2020, arXiv:2011.13456. [Google Scholar]
- Anderson, B.D.O. Reverse-time diffusion equation models. Stoch. Process. Their Appl. 1982, 12, 313–326. [Google Scholar] [CrossRef]
- Särkkä, S.; Solin, A. Applied Stochastic Differential Equations; Cambridge University Press: Cambridge, UK, 2019. [Google Scholar]
- Vincent, P. A connection between score matching and denoising autoencoders. Neural Comput. 2011, 23, 1661–1674. [Google Scholar] [CrossRef]
- Hyvärinen, A.; Dayan, P. Estimation of non-normalized statistical models by score matching. J. Mach. Learn. Res. 2005, 6, 695–709. [Google Scholar]
- Song, Y.; Ermon, S. Generative modeling by estimating gradients of the data distribution. arXiv 2019, arXiv:1907.05600. [Google Scholar]
- Lin, J.; van Wijngaarden, A.J.L.; Wang, K.C.; Smith, M.C. Speech enhancement using multi-stage self-attentive temporal convolutional networks. IEEE/ACM Trans. Audio Speech Lang. Process. 2021, 29, 3440–3450. [Google Scholar] [CrossRef]
- Xu, X.; Hao, J. Multi-layer Feature Fusion Convolution Network for Audio-visual Speech Enhancement. arXiv 2021, arXiv:2101.05975. [Google Scholar]
- Ouyang, D.; He, S.; Zhang, G.; Luo, M.; Guo, H.; Zhan, J.; Huang, Z. Efficient multi-scale attention module with cross-spatial learning. In Proceedings of the ICASSP 2023—023 IEEE International Conference on Acoustics, Speech and Signal Processing (ICASSP), Rhodes, Greece, 4–10 June 2023; pp. 1–5. [Google Scholar]
- Lin, Z.; Chen, X.; Wang, J. MUSE: Flexible Voiceprint Receptive Fields and Multi-Path Fusion Enhanced Taylor Transformer for U-Net-based Speech Enhancement. arXiv 2024, arXiv:2406.04589. [Google Scholar]
- Ahmed, S.; Chen, C.W.; Ren, W.; Li, C.-J.; Chu, E.; Chen, J.-C.; Hussain, A.; Wang, H.-M.; Tsao, Y.; Hou, J.-C. Deep complex u-net with conformer for audio-visual speech enhancement. arXiv 2023, arXiv:2309.11059. [Google Scholar]
- Ronneberger, O.; Fischer, P.; Brox, T. U-net: Convolutional networks for biomedical image segmentation. In Medical Image Computing and Computer-Assisted Intervention, Proceedings of the MICCAI 2015: 18th International Conference, Munich, Germany, 5–9 October 2015; Proceedings, Part III 18; Springer International Publishing: Berlin/Heidelberg, Germany, 2015; pp. 234–241. [Google Scholar]
- Brock, A.; Donahue, J.; Simonyan, K. Large scale GAN training for high fidelity natural image synthesis. arXiv 2018, arXiv:1809.11096. [Google Scholar]
- Wu, Y.; He, K. Group Normalization. In Proceedings of the European Conference on Computer Vision (ECCV), Munich, Germany, 8–14 September 2018; pp. 3–19. [Google Scholar]
- Zhang, R. Making convolutional networks shift-invariant again. In Proceedings of the International Conference on Machine Learning, Long Beach, CA, USA, 9–15 June 2019; pp. 7324–7334. [Google Scholar]
- Richter, J.; Welker, S.; Lemercier, J.M.; Gerkmann, T. Speech enhancement and dereverberation with diffusion-based generative models. IEEE/ACM Trans. Audio Speech Lang. Process. 2023, 31, 2351–2364. [Google Scholar] [CrossRef]
- Karras, T.; Laine, S.; Aittala, M.; Hellsten, J.; Lehtinen, J.; Aila, T. Analyzing and improving the image quality of stylegan. In Proceedings of the IEEE/CVF Conference on Computer Vision and Pattern Recognition, Online, 14–19 June 2020; pp. 8110–8119. [Google Scholar]
- Vaswani, A.; Shazeer, N.; Parmar, N.; Uszkoreit, J.; Jones, L.; Gomez, A.N.; Kaiser, L.; Polosukhin, I. Attention is all you need. arXiv 2017, arXiv:1706.03762. [Google Scholar]
- Botinhao, C.V.; Wang, X.; Takaki, S.; Yamagishi, J. Investigating RNN-based speech enhancement methods for noise-robust text-to-speech. In Proceedings of the 9th ISCA Speech Synthesis Workshop, Sunnyvale, CA, USA, 13–16 September 2016; pp. 159–165. [Google Scholar]
- Zue, V.; Seneff, S.; Glass, J. Speech database development at MIT: TIMIT and beyond. Speech Commun. 1990, 9, 351–356. [Google Scholar] [CrossRef]
- Song, Y.; Ermon, S. Improved techniques for training score-based generative models. Adv. Neural Inf. Process. Syst. 2020, 33, 12438–12448. [Google Scholar]
- Fu, S.W.; Yu, C.; Hsieh, T.A.; Plantinga, P.; Ravanelli, M.; Lu, X.; Tsao, Y. Metricgan+: An improved version of metricgan for speech enhancement. arXiv 2021, arXiv:2104.03538. [Google Scholar]
- Baby, D.; Verhulst, S. Sergan: Speech enhancement using relativistic generative adversarial networks with gradient penalty. In Proceedings of the ICASSP 2019—2019 IEEE International Conference on Acoustics, Speech and Signal Processing (ICASSP), Brighton, UK, 12–17 May 2019; pp. 106–110. [Google Scholar]
- Abdulatif, S.; Cao, R.; Yang, B. Cmgan: Conformer-based metric-gan for monaural speech enhancement. IEEE/ACM Trans. Audio Speech Lang. Process. 2024, 32, 2477–2493. [Google Scholar] [CrossRef]
- Bie, X.; Leglaive, S.; Alameda-Pineda, X.; Girin, L. Unsupervised speech enhancement using dynamical variational autoencoders. IEEE/ACM Trans. Audio Speech Lang. Process. 2022, 30, 2993–3007. [Google Scholar] [CrossRef]
- Lu, Y.J.; Wang, Z.Q.; Watanabe, S.; Richard, A.; Yu, C.; Tzao, Y. Conditional diffusion probabilistic model for speech enhancement. In Proceedings of the ICASSP 2022—2022 IEEE International Conference on Acoustics, Speech and Signal Processing (ICASSP), Online, 7–13 May 2022; pp. 7402–7406. [Google Scholar]
- Rix, A.W.; Beerends, J.G.; Hollier, M.P.; Hekstra, A.P. Perceptual evaluation of speech quality (PESQ)—A new method for speech quality assessment of telephone networks and codecs. In Proceedings of the 2001 IEEE International Conference on Acoustics, Speech, and Signal Processing, Salt Lake City, UT, USA, 7–11 May 2001; Cat. No. 01CH37221. Volume 2, pp. 749–752. [Google Scholar]
- Jensen, J.; Taal, C.H. An algorithm for predicting the intelligibility of speech masked by modulated noise maskers. IEEE/ACM Trans. Audio Speech Lang. Process. 2016, 24, 2009–2022. [Google Scholar] [CrossRef]
- Le Roux, J.; Wisdom, S.; Erdogan, H.; Hershey, J.R. SDR–half-baked or well done? In Proceedings of the ICASSP 2019—2019 IEEE International Conference on Acoustics, Speech and Signal Processing (ICASSP), Brighton, UK, 12–17 May 2019; pp. 626–630. [Google Scholar]


| Dataset Type | SNR | Quantity | Number of Speakers | Sampling Rate |
|---|---|---|---|---|
| VB-DMD Training Set | 15 dB, 10 dB, 5 dB, 0 dB | 11,572 | 28 | 16 kHz |
| VB-DMD Test Set | 17.5 dB, 12.5 dB, 7.5 dB, 2.5 dB | 824 | 2 | 16 kHz |
| TIMIT-TUT Test Set | 0–20 dB uniform sampling | 1344 | 168 | 16 kHz |
| Number of Encoder Layers | Resolution | Channels | Normalization |
|---|---|---|---|
| 1 | 256 × 256 | 128 | Group normalization |
| 2 | 128 × 128 | 128 | |
| 3 | 64 × 64 | 256 | |
| 4 | 32 × 32 | 256 | |
| 5 | 16 × 16 | 256 | |
| 6 | 8 × 8 | 256 | |
| 7 | 4 × 4 | 256 |
| Name | Specific Configuration |
|---|---|
| Operating System | Linux-5.15.0-86-generic-x86_64-with-glibc2.35 |
| Processor | NVIDIA vGPU-32 GB |
| Memory | 32 GB |
| OS Bit | 64-bit |
| Programming Language | CPython 3.12.3 |
| Dataset | VB-DMD and TIMIT-TUT |
| Deep Learning Framework | PyTorch Lightning 2.1.4 |
| Experiment Number | Model A | Model B | Model C | PESQ (↑) | ESTOI (↑) | SI-SDR (↑) |
|---|---|---|---|---|---|---|
| 1 | × | × | × | 2.12 ± 0.49 | 0.76 ± 0.09 | 12.8 ± 4.1 |
| 2 | × | × | √ | 2.24 ± 0.51 | 0.80 ± 0.09 | 14.1 ± 4.0 |
| 3 | √ | × | × | 2.57 ± 0.65 | 0.78 ± 0.10 | 16.3 ± 3.7 |
| 4 | √ | × | √ | 2.69 ± 0.63 | 0.86 ± 0.10 | 17.3 ± 3.5 |
| 5 | × | √ | × | 2.72 ± 0.63 | 0.85 ± 0.10 | 16.6 ± 3.1 |
| 6 | × | √ | √ | 2.89 ± 0.80 | 0.91 ± 0.07 | 19.6 ± 3.5 |
| Experiment Number | Model A | Model B | Model C | PESQ (↑) | ESTOI (↑) | SI-SDR (↑) |
|---|---|---|---|---|---|---|
| 1 | × | × | × | 1.74 ± 0.40 | 0.72 ± 0.11 | 11.2 ± 4.1 |
| 2 | × | × | √ | 1.81 ± 0.44 | 0.75 ± 0.12 | 12.1 ± 4.4 |
| 3 | √ | × | × | 2.40 ± 0.56 | 0.71 ± 0.10 | 15.1 ± 4.2 |
| 4 | √ | × | √ | 2.58 ± 0.53 | 0.76 ± 0.09 | 16.3 ± 3.5 |
| 5 | × | √ | × | 2.63 ± 0.53 | 0.80 ± 0.11 | 15.8 ± 4.1 |
| 6 | × | √ | √ | 2.79 ± 0.66 | 0.86 ± 0.10 | 17.1 ± 3.5 |
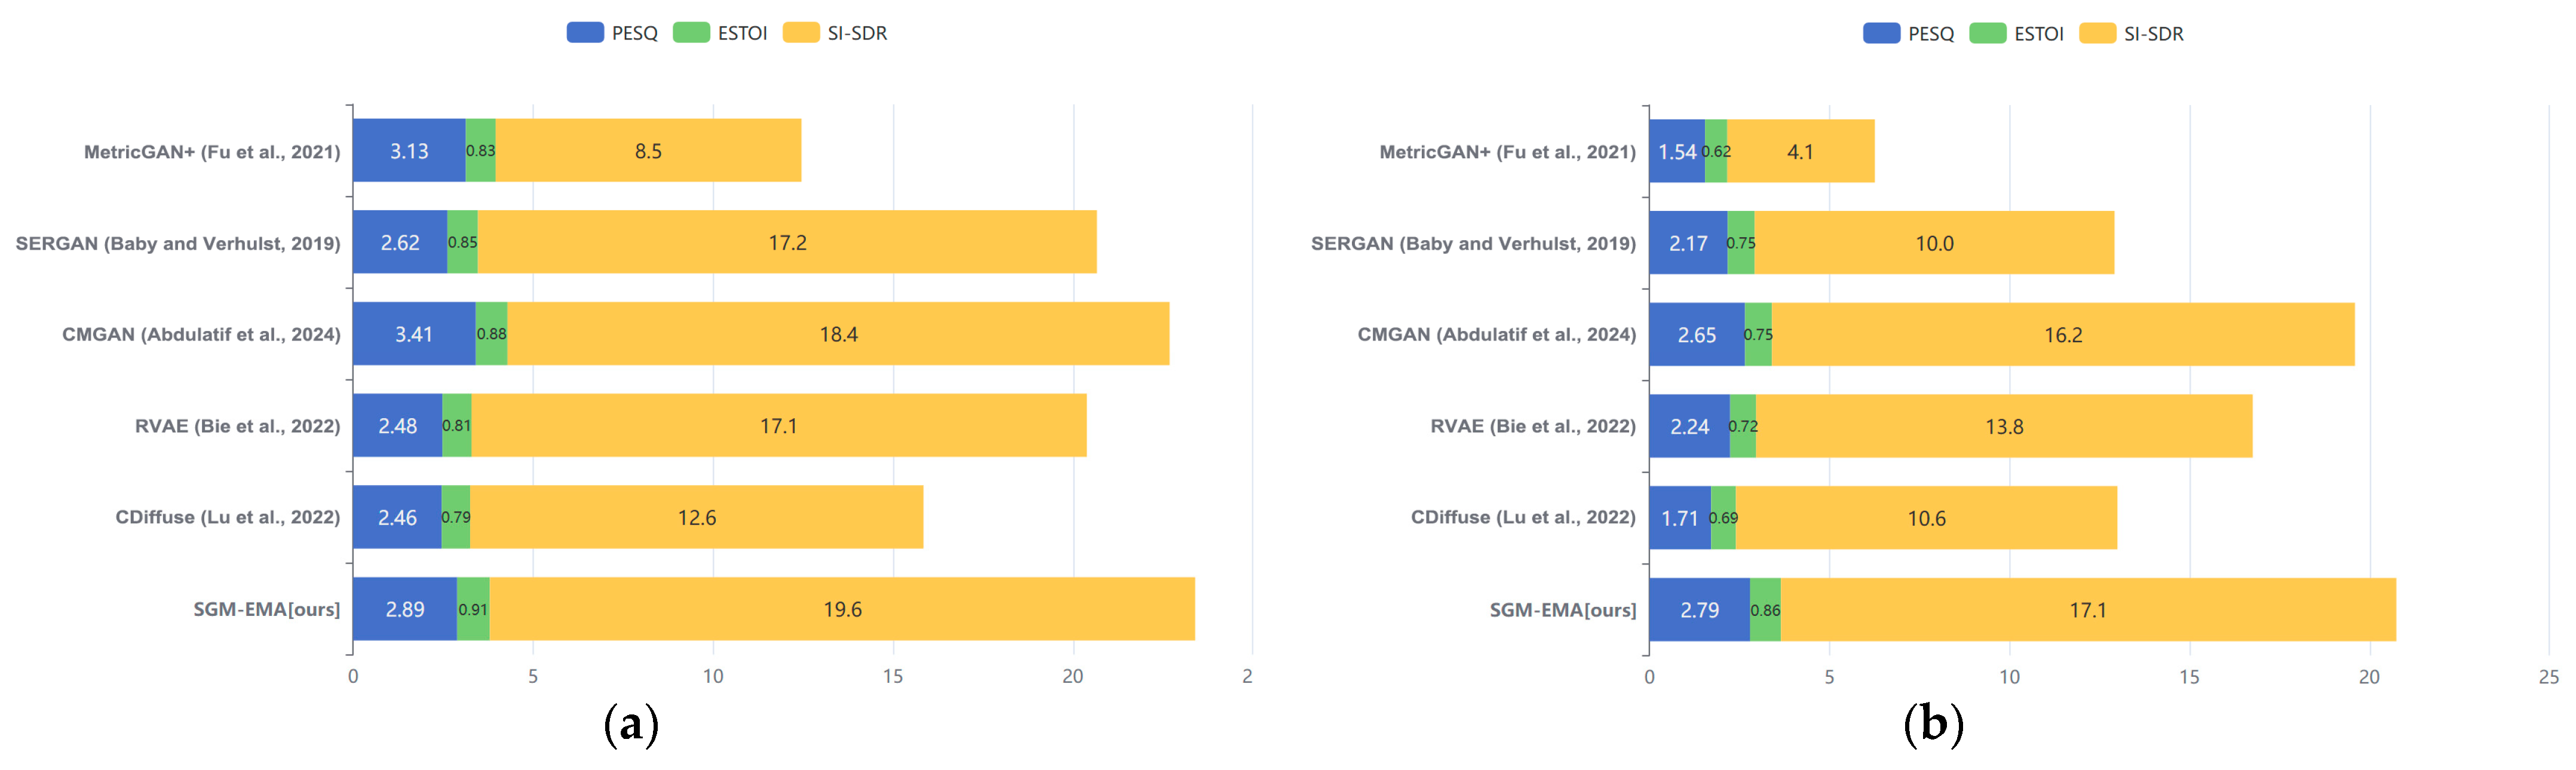
| Method | Type | Training Set | Test Set | PESQ (↑) | ESTOI (↑) | SI-SDR (↑) |
|---|---|---|---|---|---|---|
| MetricGAN+ [62] | D | VB-DMD | VB-DMD | 3.13 ± 0.55 (±0.68) | 0.83 ± 0.11 (±0.14) | 8.5 ± 3.6 (±4.5) |
| SERGAN [63] | D | VB-DMD | VB-DMD | 2.62 ± 0.63 (±0.78) | 0.85 ± 0.06 (±0.08) | 17.2 ± 3.2 (±4.0) |
| CMGAN [64] | D | VB-DMD | VB-DMD | 3.41 ± 0.68 (±0.84) | 0.88 ± 0.10 (±0.12) | 18.4 ± 4.2 (±5.2) |
| RVAE [65] | G | VB | VB-DMD | 2.48 ± 0.55 (±0.68) | 0.81 ± 0.11 (±0.14) | 17.1 ± 5.0 (±6.2) |
| CDiffuse [66] | G | VB-DMD | VB-DMD | 2.46 ± 0.51 (±0.63) | 0.79 ± 0.11 (±0.14) | 12.6 ± 5.0 (±6.2) |
| SGM-EMA [ours] | G | VB-DMD | VB-DMD | 2.89 ± 0.80 (±0.99) | 0.91 ± 0.07 (±0.09) | 19.6 ± 3.5 (±4.3) |
| Method | Type | Training Set | Test Set | PESQ (↑) | ESTOI (↑) | SI-SDR (↑) |
|---|---|---|---|---|---|---|
| MetricGAN+ [62] | D | VB-DMD | TIMIT-TUT | 1.54 ± 0.53 (±0.66) | 0.62 ± 0.12 (±0.15) | 4.1 ± 3.1 (±3.9) |
| SERGAN [63] | D | VB-DMD | TIMIT-TUT | 2.17 ± 0.58 (±0.72) | 0.75 ± 0.07 (±0.09) | 10.0 ± 2.8 (±3.5) |
| CMGAN [64] | D | VB-DMD | TIMIT-TUT | 2.65 ± 0.60 (±0.75) | 0.75 ± 0.09 (±0.11) | 16.2 ± 3.6 (±4.5) |
| RVAE [65] | G | VB | TIMIT-TUT | 2.24 ± 0.49 (±0.61) | 0.72 ± 0.11 (±0.14) | 13.8 ± 4.8 (±6.0) |
| CDiffuse [66] | G | VB-DMD | TIMIT-TUT | 1.71 ± 0.42 (±0.52) | 0.69 ± 0.11 (±0.14) | 10.6 ± 3.2 (±4.0) |
| SGM-EMA [ours] | G | VB-DMD | TIMIT-TUT | 2.79 ± 0.66 (±0.82) | 0.86 ± 0.10 (±0.12) | 17.1 ± 3.5 (±4.4) |
Disclaimer/Publisher’s Note: The statements, opinions and data contained in all publications are solely those of the individual author(s) and contributor(s) and not of MDPI and/or the editor(s). MDPI and/or the editor(s) disclaim responsibility for any injury to people or property resulting from any ideas, methods, instructions or products referred to in the content. |
© 2025 by the authors. Licensee MDPI, Basel, Switzerland. This article is an open access article distributed under the terms and conditions of the Creative Commons Attribution (CC BY) license (https://creativecommons.org/licenses/by/4.0/).
Share and Cite
Wu, Y.; Li, Z.; Huang, H. SGM-EMA: Speech Enhancement Method Score-Based Diffusion Model and EMA Mechanism. Appl. Sci. 2025, 15, 5243. https://doi.org/10.3390/app15105243
Wu Y, Li Z, Huang H. SGM-EMA: Speech Enhancement Method Score-Based Diffusion Model and EMA Mechanism. Applied Sciences. 2025; 15(10):5243. https://doi.org/10.3390/app15105243
Chicago/Turabian StyleWu, Yuezhou, Zhiri Li, and Hua Huang. 2025. "SGM-EMA: Speech Enhancement Method Score-Based Diffusion Model and EMA Mechanism" Applied Sciences 15, no. 10: 5243. https://doi.org/10.3390/app15105243
APA StyleWu, Y., Li, Z., & Huang, H. (2025). SGM-EMA: Speech Enhancement Method Score-Based Diffusion Model and EMA Mechanism. Applied Sciences, 15(10), 5243. https://doi.org/10.3390/app15105243