Article

Applications of Linear and Ensemble-Based Machine Learning for Predicting Winning Teams in League of Legends

by
Supratik Chowdhury
1,
Mominul Ahsan
2,* and
Phoebe Barraclough
2
1
Data Modelling & Engineering, Ministry of Justice, 102 Petty France, Whitehall, London SW1H 9AJ, UK
2
Department of Computer Science, University of York, Deramore Lane, York YO10 5GH, UK
*
Author to whom correspondence should be addressed.
Appl. Sci. 2025, 15(10), 5241; https://doi.org/10.3390/app15105241
Submission received: 27 February 2025 / Revised: 2 May 2025 / Accepted: 7 May 2025 / Published: 8 May 2025

Abstract

:
Over the last decade, advancements in machine learning and easier model deployment have led to increased commercial applications. One such use case is esports, where machine learning (ML) is used to understand predictors of success. League of Legends, one of the most popular esports, has been a particular academic focus. Investigations into League are divided into two areas: qualitative analyses of factors such as perseverance and group dynamics and quantitative research to create models to predict match outcomes via either pre-game player information or in-game match data. Few studies have integrated both pre-game and in-game data to improve modeling, often using datasets that may not represent the broader player community. This study investigates the factors influencing the accuracy of match prediction models in League of Legends. Evaluating the effects of training on data that are representative of the actual player on the basis of accuracy and determining whether models that amalgamate pre-game and in-game features yield superior results. By utilizing a dataset derived from the Riot API, this research work introduces a novel “streak” feature and constructs models using logistic regression, random forest, C5.0 Gradient Boost and XGBoost, evaluating model performance against recent literature. The results indicate that employing a dataset that more accurately reflects the general player population leads to a slight decrease in the efficacy of the models compared with those using professional datasets only; however, the models demonstrate potential for greater generalizability across a wider range of ranks. The models that incorporate both pre-game and in-game data outperformed most existing studies that focus solely on one type of data, achieving a peak accuracy of 76.8% for the best-performing model. These findings guide future work on feature engineering via the Riot API and model application for broader player populations in esports. Additionally, these insights can be applied to build and improve tools that provide real-time predictions of match results.

1. Introduction

Recent advancements in machine learning (ML) have led to its application across a diverse array of sectors. ML has been used in fraud detection [1], healthcare [2], cybersecurity [3], and spam detection [4]. In sports, ML techniques have been applied to refine gameplay [5], inform gambling tactics [6] or forecast outcomes [7], with recent work creating frameworks that can be generalized across a diverse range of sports [8]. Concurrently, the video game industry, valued at over USD 200 billion as of 2020 with an expected annual growth rate of 13% [9], has seen a shift towards competitive, online, live-service games that have evolved over time. This shift has contributed to the establishment of professional esports communities around the most popular leading competitive titles [10].
One of these titles is League of Legends, a large online game attracting 150 million players [11], generating USD 1.75 bn in 2020, with an eSports prize pool of USD 2 m in recent years [12]. As such, there is an increasing focus on applying machines to decipher drivers of team victories and predict game outcomes. The Riot Games public API also provides a large set of historical training data on matches and individual players [13], further enabling research on the applications of ML in this space.
Two distinct types of studies dominate this research domain. The first type encompasses experimental research that examines external determinants linked to triumph or aspects that are not inherently documented by the API’s data. This includes examining the impact of team communication and cooperation [14], the direction of attention of players at differing skill levels [15], or the influence of winning/losing streaks and mental tilt [16]. Owing to their experimental nature, sample sizes are usually small and are focused on important factors in the experiment.
The second type of studies are large-scale studies attempting to apply quantitative techniques to high-volume, high-dimensional data extracted from the Riot API or professional match datasets. These latter studies can be further categorized as prediction using ‘pre-game’ features—the characteristics of individual players prior to a match, such as experience [17] and role [18]—and ‘in-game’ match event data, such as resources acquired, opponents eliminated, or objectives captured [19,20,21] at various points in the match. The source for these studies is a mixture of public game data from the API and esports datasets from sources such as Kaggle (which are also partially derived from the API) [22]. These large-scale quantitative studies tend to focus primarily on exploring game-specific factors influencing match success to build better models for predicting victory in games. Studies focusing on pre-game features in isolation are less common, although they have shown reasonable accuracy when focusing on factors such as player experience [17]. Typically, studies combine pre-game and in-game factors by extracting in-game data from an arbitrary time point in matches (e.g., [23]), taking data from the end of a match [24], or building real-time prediction models [25].
This study attempts to fill a specific set of gaps in the current literature, which are the lack of studies that combine pre-game/in-game factors together while exploring their relative importance on a representatively sampled dataset (i.e., ensuring a split of skill ranks representative of the wider player base), which also attempt to include some element of engineering features that can act as proxies for factors deemed important in offline qualitative studies (in this case, the effect of winning/losing streaks) [26]).
This study aims to explore whether representative datasets on match performance can be used to build better predictive models of match outcomes. The objectives of this study are to engineer a dataset using the Riot API, which is representative of the player base and contains data across all ranks of players, and to train a suite of models (logistic regression, random forest, Gradient Boost and XGBoost) to predict the outcome of the match, optimizing for accuracy. A new feature from the API, ‘streak’, will be engineered to quantify a player’s current win/loss streak going into the game and assess the importance of this predictor in determining the match outcome. The methodology is focused on improving prediction accuracy for matches in the general player population. The hypothesis is that a combined model has superior predictive performance compared with individual pre-game/in-game models and that a streak is an important pre-game predictor of match outcome, as offline experimental studies have shown it to be an important psychological factor in success [26]. The significance of these contributions is multifaceted. In a world where the competitive landscape is increasingly fierce and many games are being developed as live services [27], ensuring player contentment is essential for their continued engagement. It is vital to offer an equitable and well-balanced gaming experience to all participants to maintain their involvement [28]. The proposed method has the following contributions:
  • The findings from this research have the potential to enhance matchmaking algorithms, which could positively affect players’ perceptions of match fairness [26], thereby increasing both player retention and revenue.
  • Furthermore, the broader infrastructure that contributes to the game’s success, including esports, benefits from the incorporation of machine learning (ML) techniques. These techniques could facilitate player development, enable talent scouts to identify emerging players more effectively, and aid coaches in formulating strategic plans, similar to their applications in traditional sports [5]. In particular, the influence of winning/losing streaks on match prediction is statistically significant (p < 0.05), but its impact on prediction is relatively small.
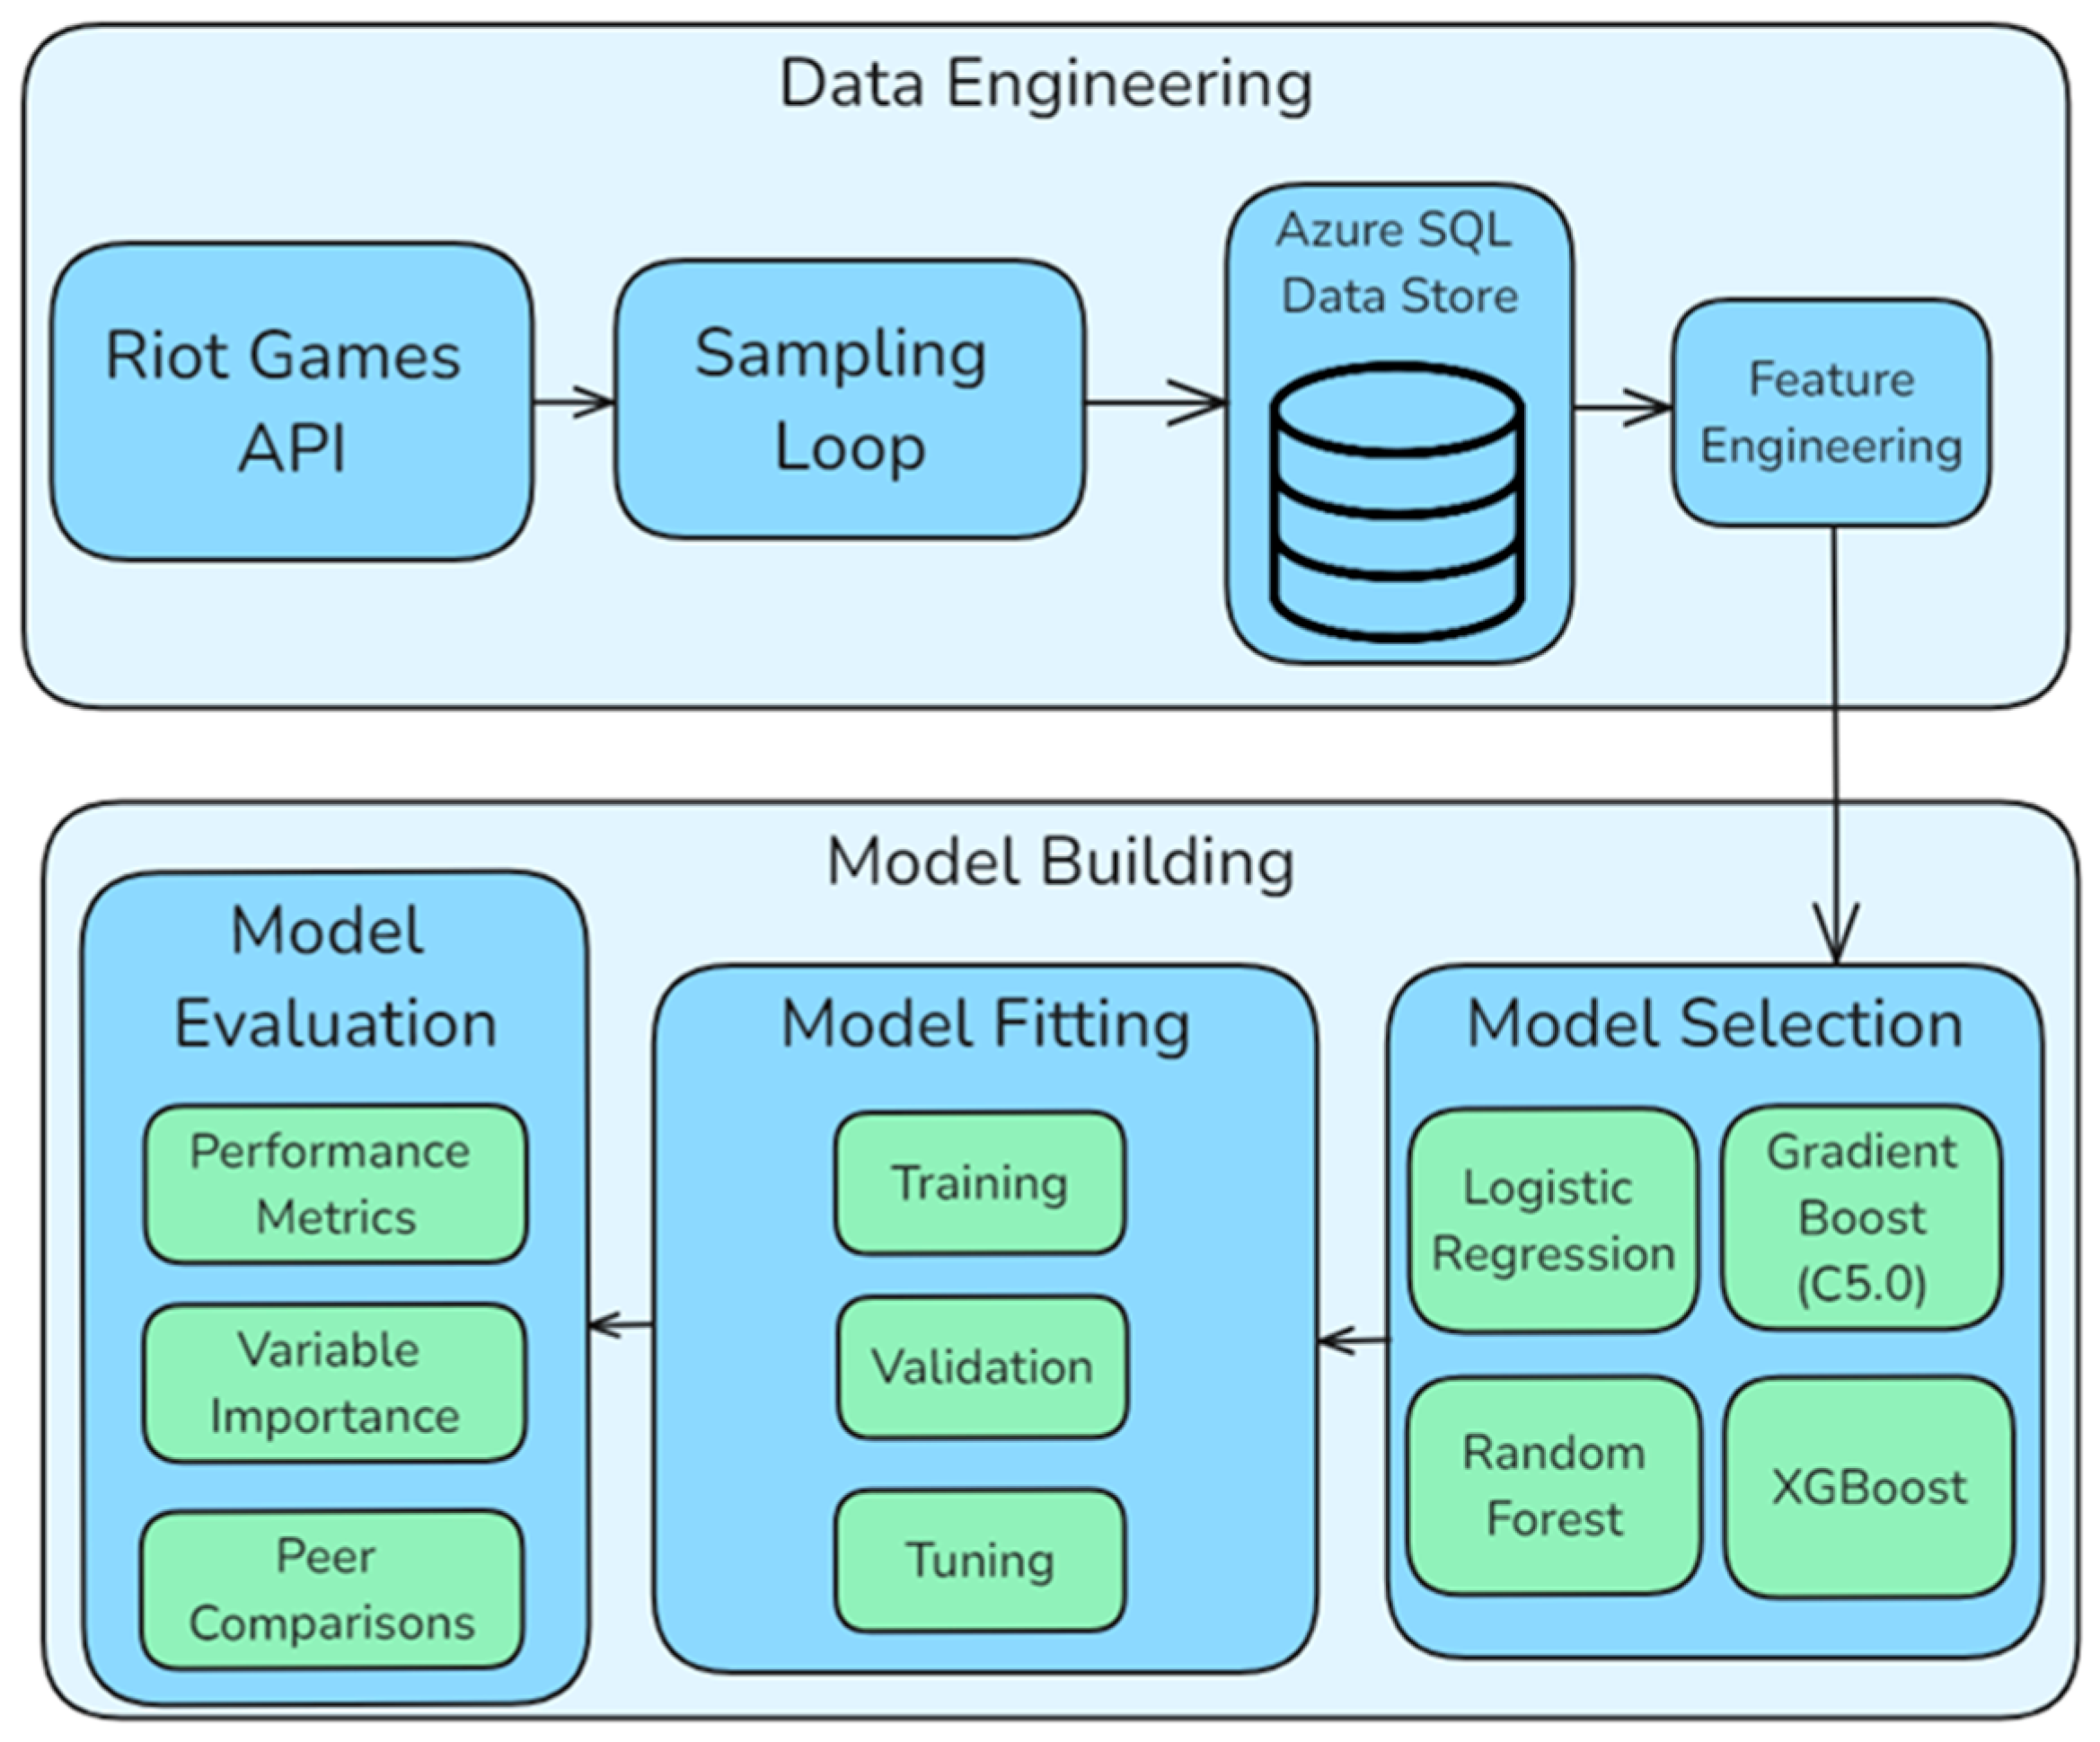
  • This study provides a data engineering framework to allow easy representative sampling from the Riot API, which can be extended to incorporate further features easily.
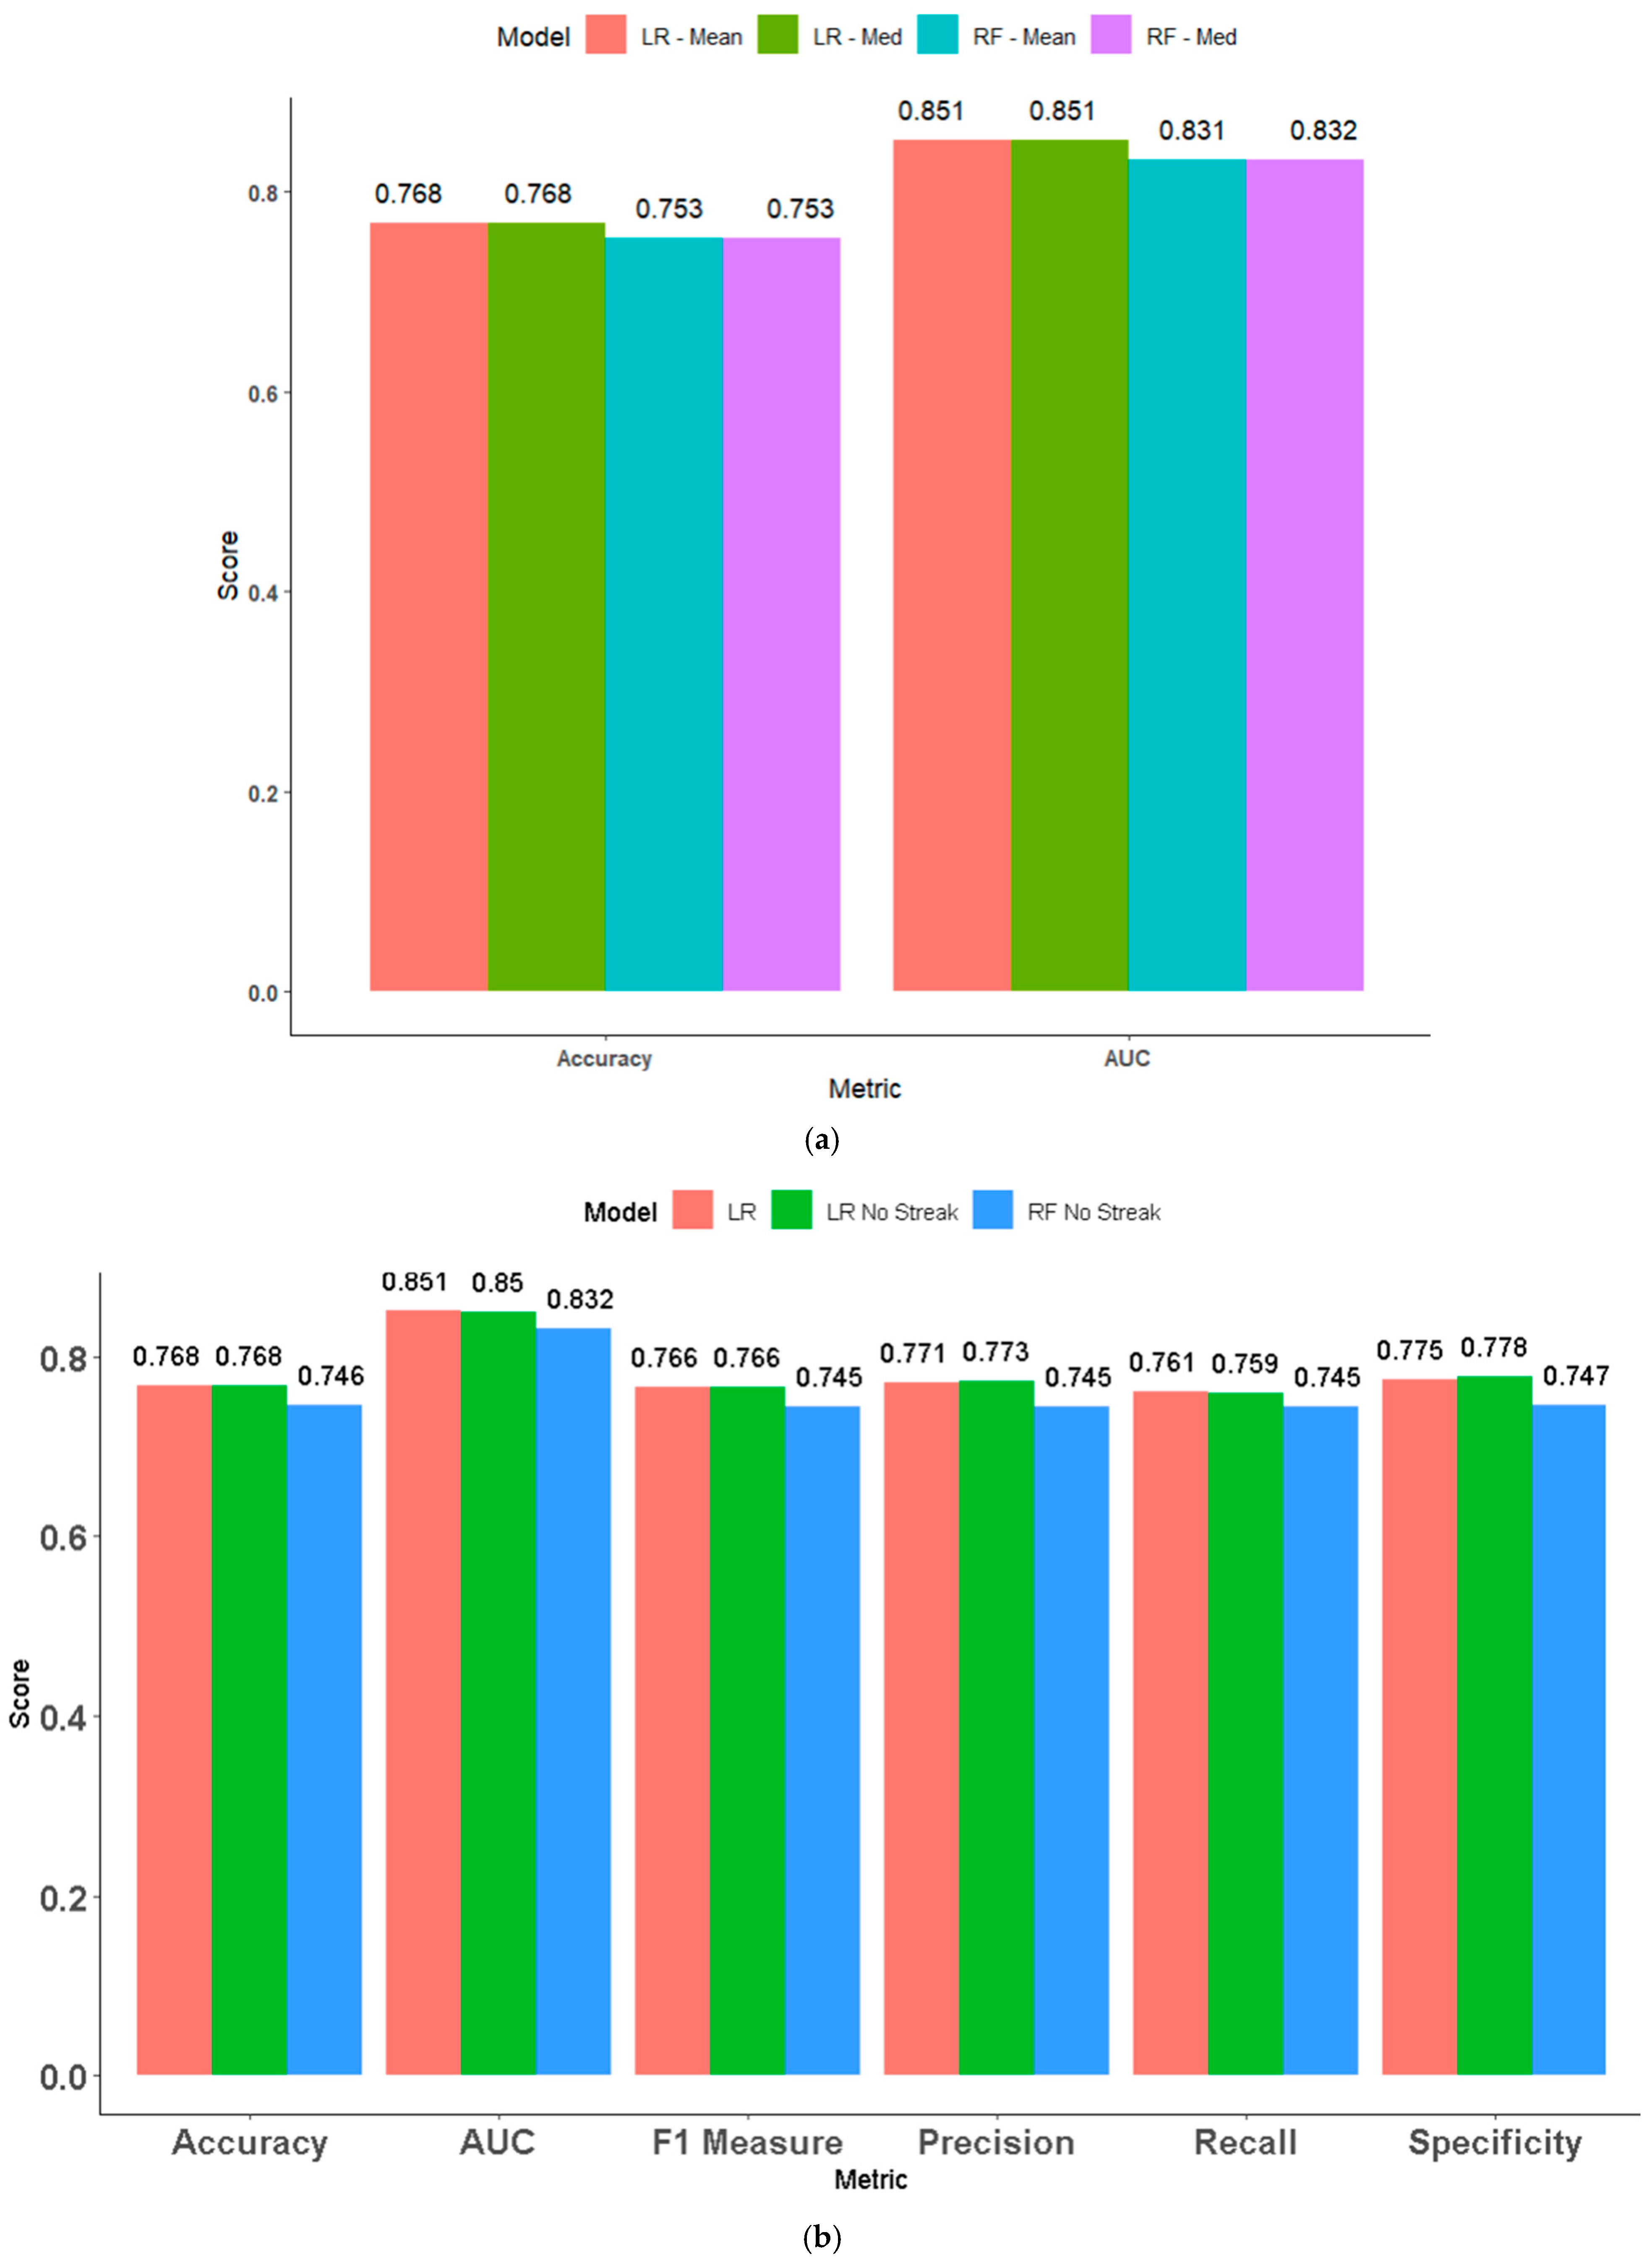
  • It explores the relative importance of pre-game vs. in-game in the context of predicting match outcomes while also ensuring that the results are generalizable across all different skill levels in the player base, as opposed to professional matches, which are the focus of much of the literature. The models built on representative training data still have high accuracy (76.8%) when combining pre-game and in-game features.
  • Finally, it bridges the findings of offline, player-centric studies looking at the effects of factors such as mindset, tilt, and ‘streakiness’ with online game-centric studies built around model training high-volume API data. It does this by engineering a novel ‘streak’ feature from the API and providing a set of functions to enable replication of this feature engineering in the future. It explored the impact of this streak feature on the prediction accuracy. By doing so, it will assess whether the findings of smaller, focused qualitative studies are equally applicable at macro scales.
The rest of this paper is organized as follows. An overview of League of Legends and the current research space is provided in Section 2. Section 3 provides an overview of the methodology used for extracting the dataset from the API, including representative checks and transformations applied. Section 4 provides an overview of how the models were built and their respective performance metrics. Finally, a summary of conclusions is given, and avenues for further work to build on these conclusions are discussed.

2. Review of the Existing Literature

2.1. Overview of League of Legends

League of Legends, created by Riot Games, is a highly competitive multiplayer title. It has a monthly player count approaching 150 million [11] and commands a notable 15% of the market share among U.S. PC arena-battler games [12]. Riot Games provides an API [13] that offers access to extensive historical data on players and matches. The game’s widespread popularity facilitates the extraction of sizeable datasets. Such comprehensive datasets are particularly advantageous for machine learning research, which relies on large volumes of data to increase the accuracy of its generalizability [29]. Matches comprise two teams of five players, with players able to select from a wide variety of characters (called ‘champions’) that excel at specific strategic play, such as offense, supporting teammates, or defense. The game takes place on a map divided into three ‘lanes’ (top, middle, bottom), and layered with strategic objectives for players to capture, with their ultimate goal being to advance to the enemy team’s ‘base’ on the opposing side of the map. The efficacy of team composition—choosing champions that not only counter the opposition but also harmonize with allies—evolves swiftly in response to updates by developers [30]. Given the unique playstyle of each champion, proficiency with certain champions is expected to develop over time through experience [31]. Within a match, participants can obliterate objectives and adversaries to garner resources that subsequently bolster their ‘champion’. This mechanism establishes a game with a substantial skill cap, necessitating the development of both individual and collective strategies, swift adaptation to opponents’ tactics, mastery over one’s chosen character to make judicious choices, and an awareness of the broader metagame as essential components of optimal play [32]. Moreover, this has catalyzed the emergence of a vibrant and expanding professional landscape [33], thereby generating a unique research space dedicated to the cultivation of these burgeoning digital athletes and ascertaining the determinants of team success [34].

2.2. Current Research on Machine Learning for Match Prediction

The utilization of ML in League of Legends spans a wide array of investigative pursuits, encompassing areas such as forecasting match outcomes, examining qualitative elements that contribute to success, and analyzing aspects of human interaction such as teamwork and competition [35], as well as the underlying causes of intrateam conflict [36]. This domain is split into research relying on offline primary data derived from experiments or interviews and studies leveraging online secondary data obtained through the API. The latter type predominantly focuses on predicting match outcomes via API and usually employs two distinct types of feature sets: those analyzing pre-game data, which include all the information available prior to the start of a match, and those assessing ‘in-game’ (in-game) data, which pertain to the dynamics and events occurring during the course of a match.
Pre-game data encompass information about player attributes before they commence a match, such as their selected champion, level of experience, and historical performance in matches. Do et al. [17] reported that a neural network model trained exclusively on data concerning players’ experience with their selected champions reached a prediction accuracy of approximately 75%. Nonetheless, this analysis was confined to data procured from North American players, and regional distinctions have been identified as a significant factor affecting match results [37]. Hitar-Garcia et al. [38] expanded upon this by incorporating data on the synergistic relationships between champions within a team, achieving comparable accuracy rates, albeit with a reduced dataset size. Furthermore, strategic decisions made during the pre-game phase, such as the banning of certain champions, have been shown to significantly impact match outcomes [39].
While pre-game factors provide valuable insights, they alone do not conclusively determine the outcome of a match. The dynamic decisions, actions, and reactions players exhibit throughout gameplay significantly influence the chances of victory, highlighting the critical role of in-game data. In-game data capture real-time events during a match, such as player elimination, destruction of objectives, and acquisition of resources. Lin [24] utilized gradient-boosted trees, which achieved prediction accuracies of approximately 95% with in-game data. However, the in-game data employed were collected at the match’s end, leading to potential overfitting. This is because, by nature, winning teams are likely to have higher in-game metrics such as acquired resources and opponent eliminations (or lower “negative” features such as number of times eliminated), making it less effective for predictions before the match concludes. The features towards the end of the match are a direct consequence of the outcome. Luis et al. [40] supported this notion by demonstrating that data from early game events possess less predictive value than data from later games. The variation in predictive power can also be attributed to differences in the machine learning techniques used. This underscores the complexity of accurately forecasting match outcomes solely on the basis of early-game data and highlights the importance of considering the temporal aspect of in-game data for more effective predictions. Ani et al. [41] leveraged ensemble methods to construct models that integrate pre-game, in-game, and combined feature sets, reaching an impressive accuracy rate of 99.75%. Nonetheless, it is important to note that their research focused exclusively on data from professional esports matches. This specificity suggests that the findings may not be generalizable to the broader player base. The distinct dynamics and strategic considerations at the professional level may differ significantly from those encountered by the average player, potentially limiting the utility of these models outside the context of professional gaming. Other studies focus on either pre-game or in-game factors separately, leading to a gap in this space for generalizable models (built from a representative dataset regarding player skill, not just professional datasets) that combine pre-game and in-game factors.
The use of data exclusively from APIs to construct predictive models presents inherent limitations. Li et al. [42] illustrate that broader strategic maneuvers, such as strategic control over specific areas of the map, can lead to victories even in scenarios where other indicators suggest a disadvantage. This highlights the significant role of metagaming, the process of recognizing and employing optimal team strategies, in achieving success [43]. However, this type of data, which is pivotal for understanding the full scope of game dynamics, often eludes capture by APIs.
Similarly, Jadowski [44] achieved an accuracy of approximately 67% using only early in-game data, concluding that to increase the predictive accuracy, “substantially more data and context” would be needed. This underscores a critical limitation of relying solely on API data: while it can provide a wealth of information in terms of volume, it falls short in capturing the nuanced, external factors that significantly influence match outcomes. The complexity of strategic decisions and their impact on game results highlight the need to incorporate broader datasets and contextual analysis to grasp and predict the dynamics of gameplay effectively.
Experimental research endeavors to bridge the divide left by API-based studies by delving into the broader elements that underpin successful teams. Donaldson [45] discovered that the mental resilience of players plays a crucial role in their capacity to develop expertise over time. Similarly, Kim et al. [46] reported that the collective intelligence of a team markedly impacts match outcomes, with higher levels of collective intelligence leading to enhanced teamwork capabilities. These findings echo the importance of communication [47] and the willingness to collaborate [48] as fundamental components of team success. Moreover, Kou et al. [26] reported that players’ perceptions of a match, potentially skewed by their winning or losing streaks, can significantly affect their in-game decisions and, consequently, the match’s outcome. However, experimental studies are disadvantaged by small sample sizes (e.g., [46] n = 248). One solution to overcome this challenge is the development of proxy features for experimental factors via online data sources. However, there appears to be a lack of research aimed at implementing this approach. Crafting proxy features to simulate these experimental factors in predictive models could enrich the analysis by incorporating the nuanced, nonquantifiable aspects of team dynamics and player psychology, although no studies have yet explored this avenue. This is another gap that this paper will bridge.

2.3. Research Gap

There are critical gaps in this research domain, which are the focus of this paper’s contribution. Specifically, no current research paper has the following:
  • Data from nonprofessional matches (important for the generalization of predictions)
  • A representative split of player skill in their dataset was ensured via the player’s in-game ranking.
  • Pre-game and in-game features are combined in one model.
  • Researchers have attempted to engineer features that could be linked to factors explored in experimental studies, such as the effects of tilt and streakiness.
This study explores these gaps by designing a randomized sampling method to extract a representative dataset API, combining both pre-game and in-game factors to test whether combined feature sets perform better, and engineering a new feature called ‘streak’ to explore the importance of this psychological predictor related to the offline work explored by Kou et al. [26].

3. Proposed Research Methodology

The overall data engineering and machine learning pipeline of the study is illustrated below. The data are sourced directly from the Riot Games API, which provides a RESTFUL interface to query previous match outcomes along with associated player characteristics and match events related to that outcome. Figure 1 shows the overall workflow of this study, which comprises a data engineering and storage phase followed by model training.

3.1. Sampling

A relational model to depict the API endpoints of interest is illustrated in Figure 2. Figure 3 details the sampling logic employed, which incorporates a stratified random selection process. Here, a division is first chosen at random from a predefined set of rankings in the game (a total of 31 possible ranks exist). A player within this rank is subsequently selected. The most recent match played by this player is then identified. Finally, all participants within this chosen match are extracted from the sample, capturing the relevant predictors for analysis. This iterative process is repeated to acquire a comprehensive dataset. This methodology offers a distinct advantage over prior research by guaranteeing that a representative sample is stratified across ranking tiers. This refinement is expected to enhance the generalizability of the findings.
In total, 34,000 records were extracted, providing data on 3400 matches (ten players in each match). As per Figure 1, these denormalized data were stored in a single relational database table, on an Azure SQL instance, for the duration of this study.

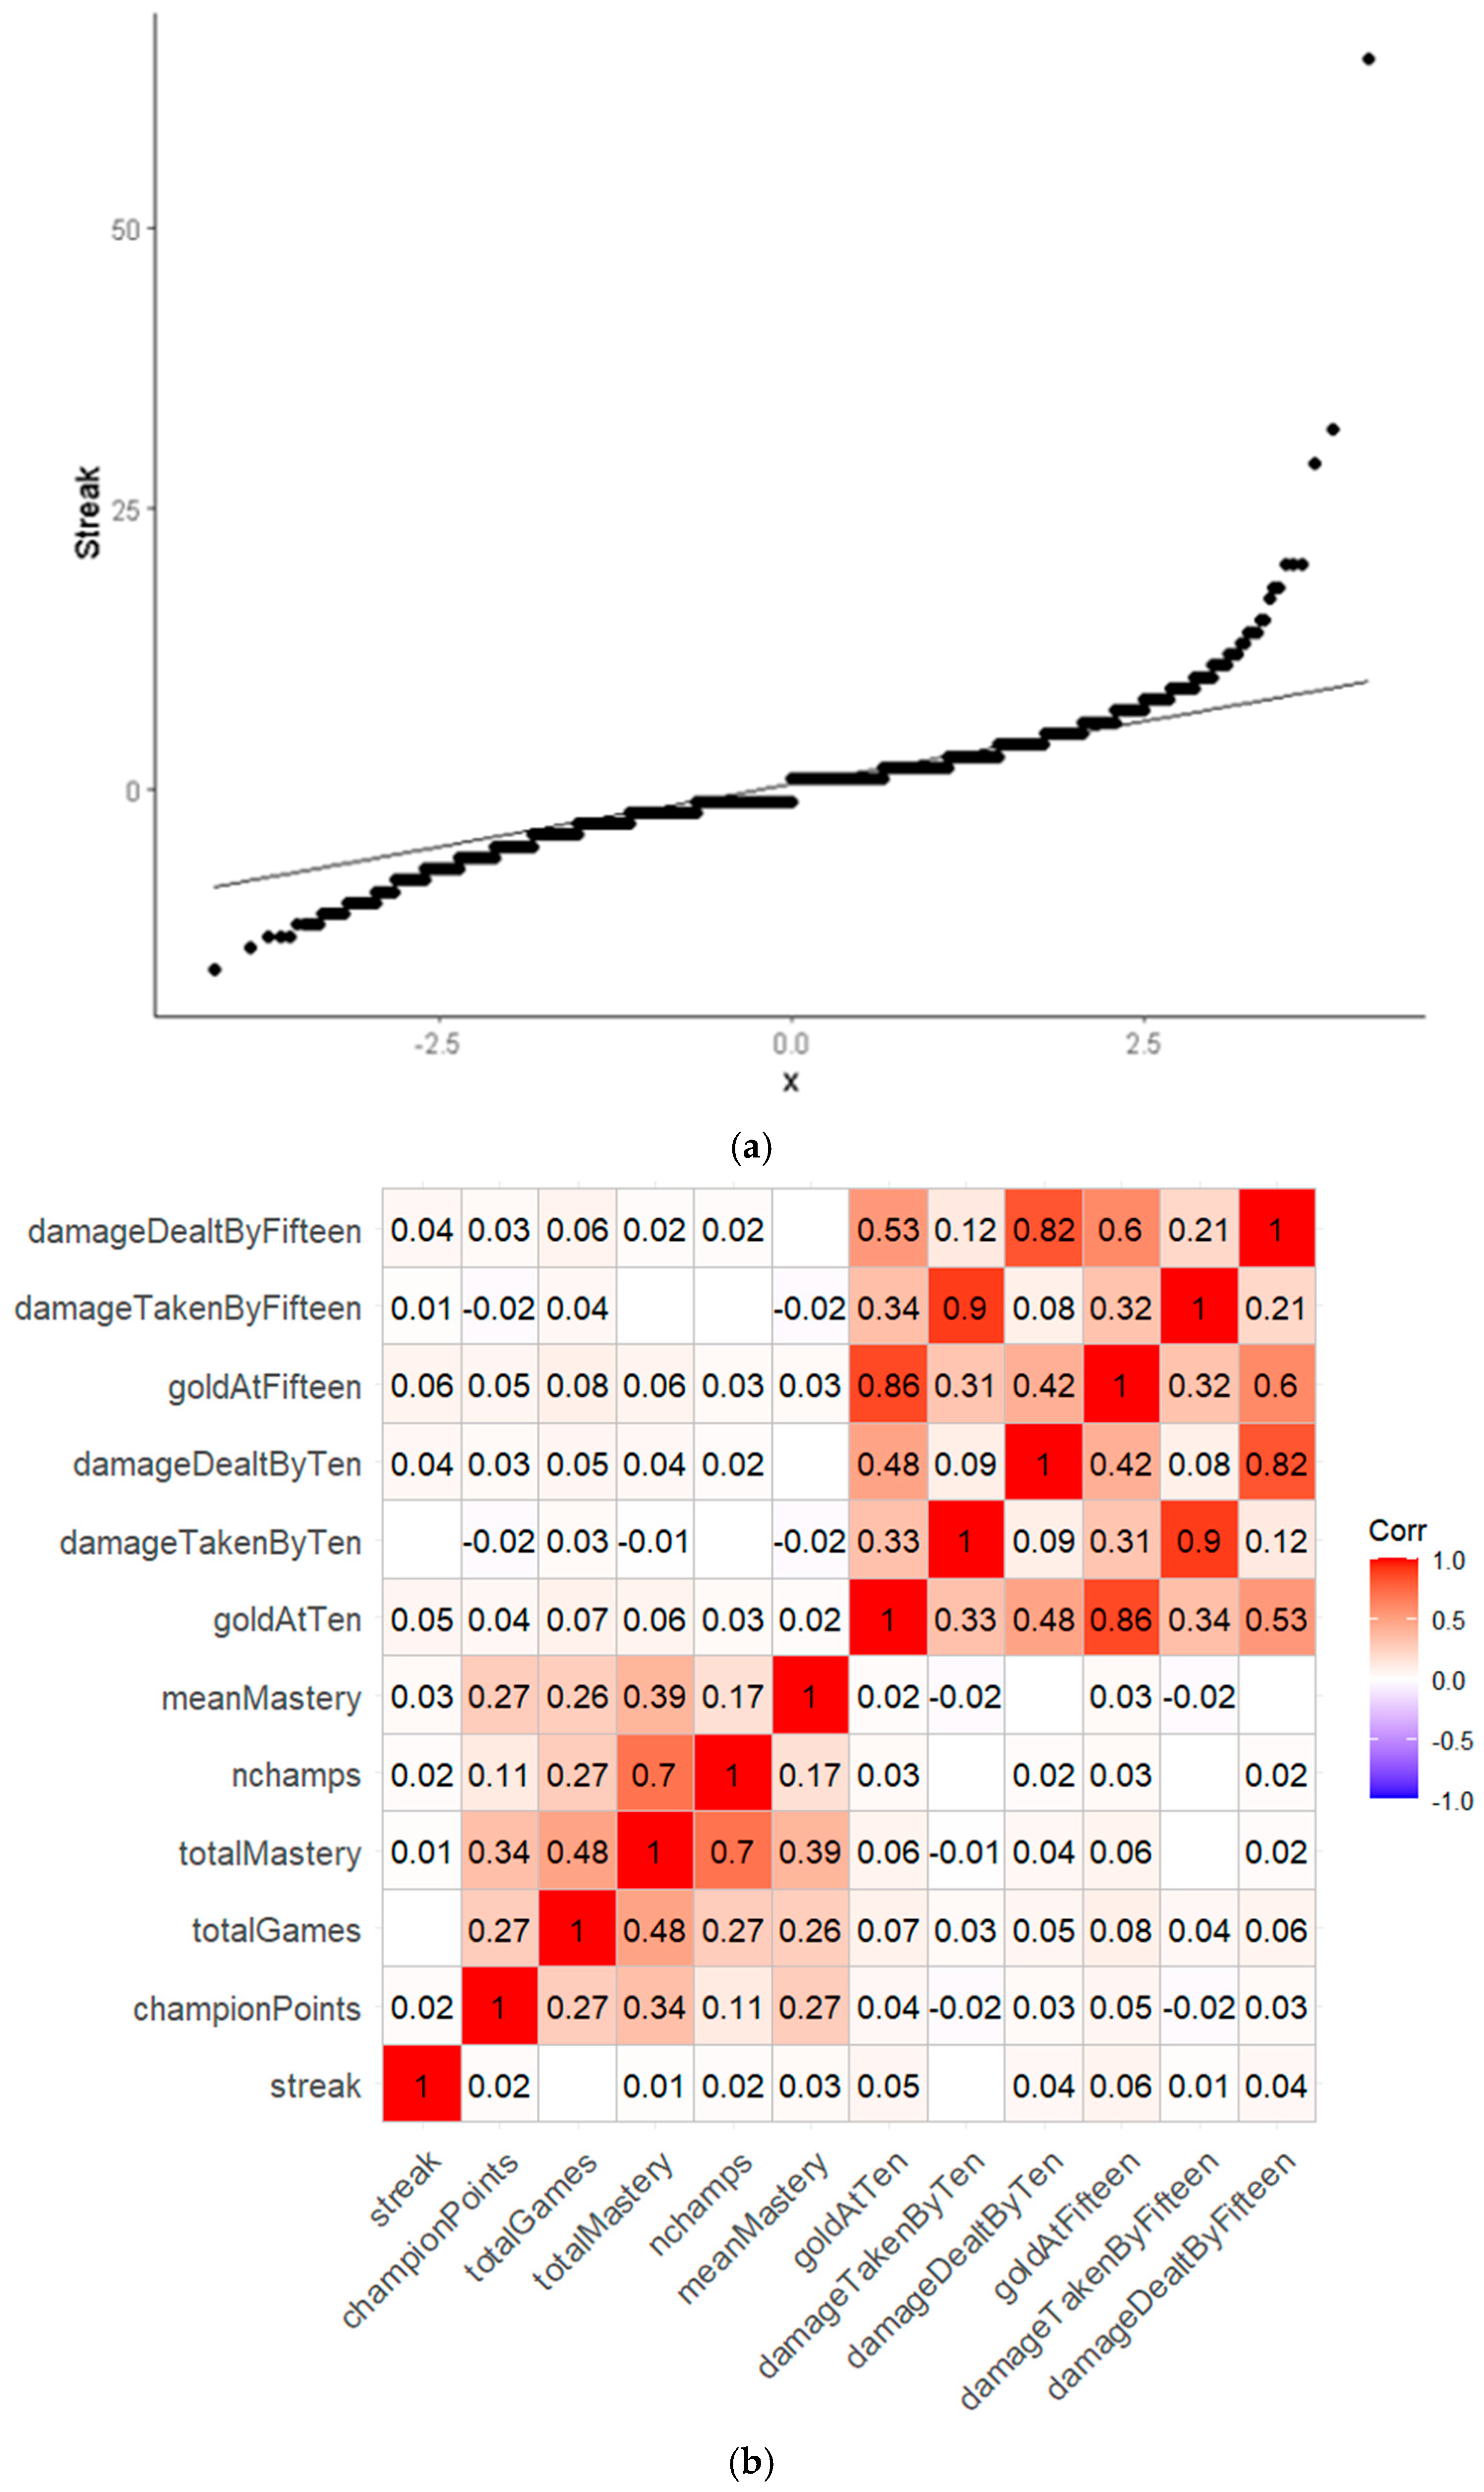
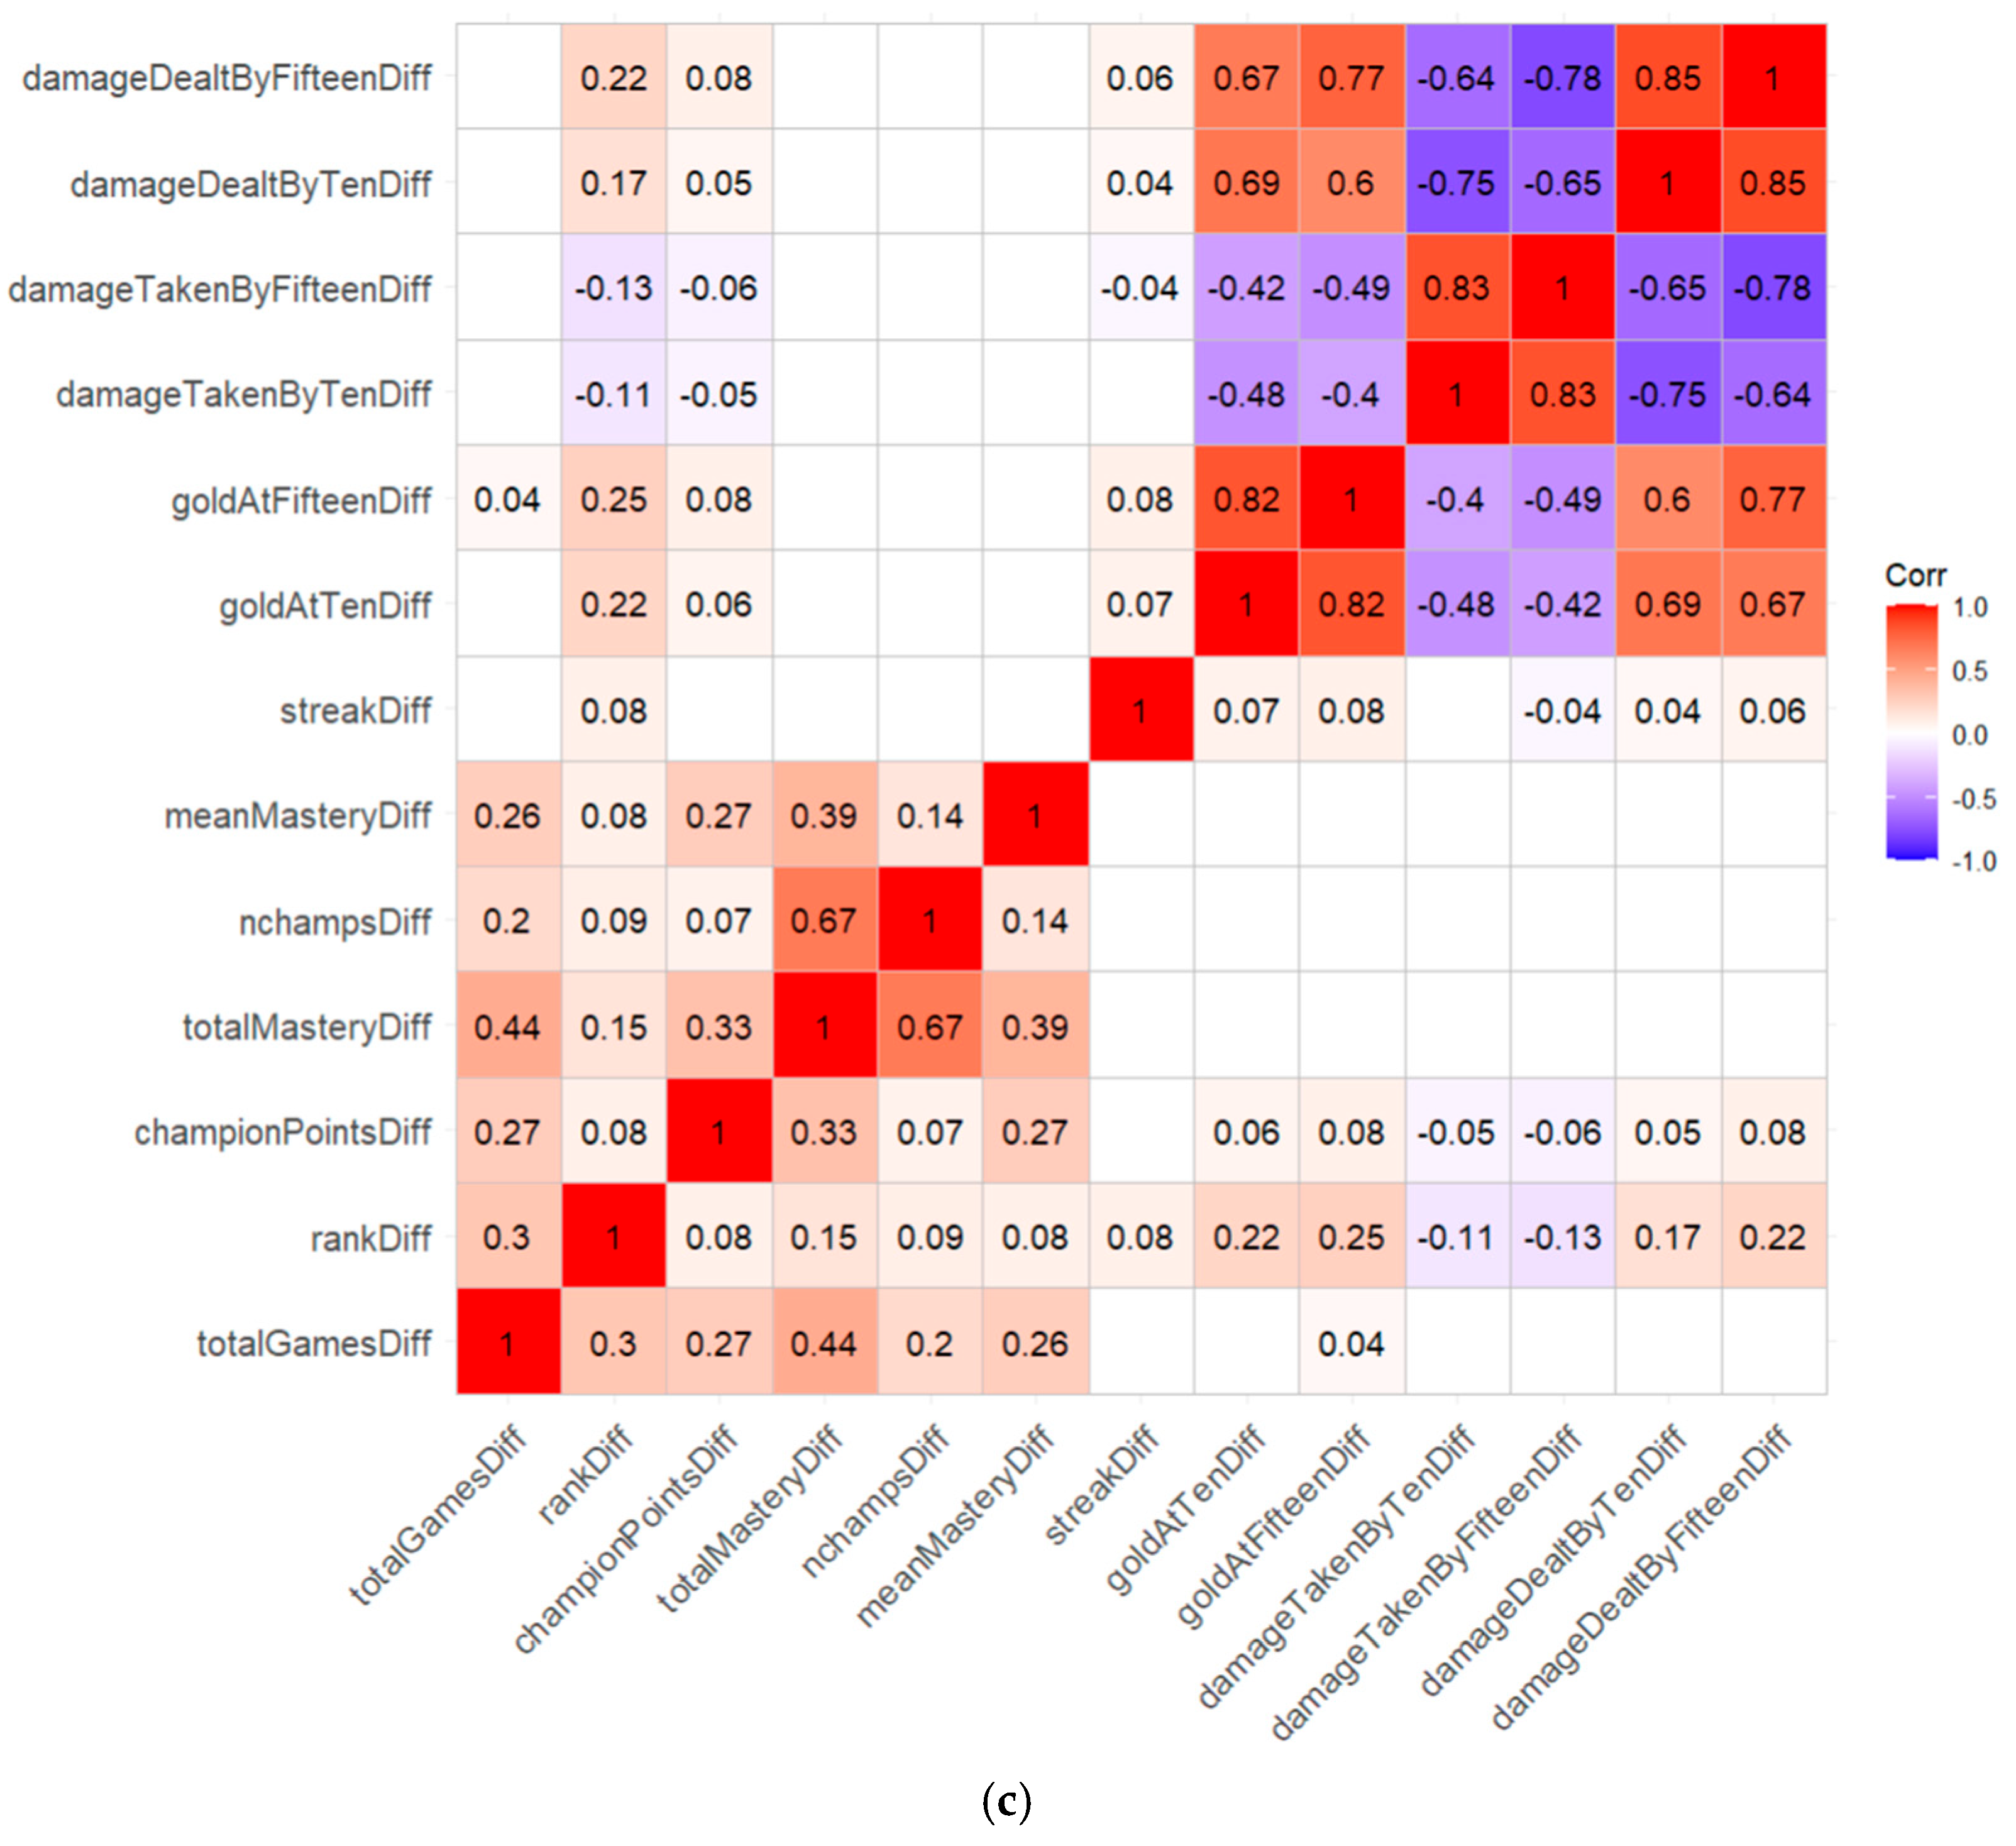
3.2. Feature Engineering

During the data extraction process, several player features were captured to characterize their in-game performance and pregame statistics and champion selection tendencies. These features included a player’s champion experience, current ranking tier, and overall seasonal win-loss record. To assess the diversity of a player’s champion pool, which can indicate adaptability [49], metrics such as champion points for the chosen character (“championPoints”), total champion mastery (“totalMastery”), and the number of unique champions played (“nchamps”) were collected. Wins and losses were utilized to calculate the total number of games played and the win rate. However, because existing research suggests that the overall win rate is not a strong predictor of future success [44], it was excluded from further analysis. A streak metric was computed, obtained by recursively querying past games for each player-match combination. This was calculated by querying the player_matches endpoint for the last 200 games an individual played, identifying the matches preceding the given match. The matches endpoint was then used to loop through these previous matches and calculate an integer value for the number of matches a player had won or lost in a row prior to the given match. A negative streak value signifies a series of recent losses, whereas a positive value indicates a winning streak. Due to rate limits on the API restricting the ability to arbitrarily query all player history for all matches, some streak data could not be computed—in instances where a player’s current match was not in the last 200 matches they played. This was dealt with at the data cleaning stage, outlined below.
Compared with pre-game player profile data, in-game predictors offer a richer feature space. The match timeline endpoint provides over 100 features capturing match events at 60 s intervals. However, prior research has highlighted the issue of high correlation within in-game feature sets [21], as many features exhibit a dependency or direct influence on each other. This was addressed by a correlation analysis postextraction, as detailed below. In-game predictors were categorized into player-specific and match-specific groups. Match-specific features included the team securing the first elimination and the first objective (tower), along with the outcome variable (win/loss). Player-specific predictors included gold acquired, damage dealt, and damage taken at both 10 and 15 min. These specific timestamps were chosen because of their prevalence in past studies [50] and because they represent relatively early phases in the game before a match outcome can be easily determined.
To ensure data quality, several cleaning steps were implemented. Duplicate matches and instances of games ending prematurely (i.e., less than 15 min) through surrender were eliminated from the dataset. Additionally, any errors identified within tier or rank data were rectified. The prevalence of missing data points across features was calculated, as this phenomenon can introduce bias into machine learning models [51]. Most features contained less than 3% missing values, and these records were excluded.
The ‘streak’ feature contained approximately 20% missing values, which would have resulted in a sizable reduction in sample size if excluded. Multiple avenues of imputation were considered. Firstly, sampling from a normal distribution. The normality of the streak was assessed using a QQ plot (Figure 4a) and a D’Agostino test of normality. Streak proved to be significantly different from normal (p < 2.2 × 10⁻¹⁶), discontinuing this approach. Secondly, extrapolating streak from other feature values was considered. A collinearity analysis on the raw features (Figure 4b) showed streak has no strong correlation with other features that could be used to compute a statistically sound estimated value. As such, mean value imputation for streak was utilized as the base because of its low probability of biasing the feature space [52]; however, in Section 4.3, we also performed sensitivity analysis by comparing the effect on model performance when using median imputation instead. Both mean and median values were calculated separately per response class (mean: 0.046—win, 0.029—loss; median: 1—win, −1—loss).
Sample representativeness was verified across ranks by counting matches in each tier (Table 1) and ensuring that class balance was appropriate (Table 2).
The rank profile is similar to published statistics [53], making the sample reasonably representative. The prediction labels were also reasonably balanced (Table 2), so rebalancing techniques such as oversampling were not necessary [54].
In this research, emphasis is placed on assessing the performance of teams as a whole rather than individual players, given that the outcome of a match (‘T1_win’) is applicable only to team-based results. To facilitate this analysis, player-specific features were aggregated and averaged per team to represent each team’s overall average features. To further streamline the feature set, Team 1 was designated the reference point, and a ‘difference’ metric was created for each numeric predictor by calculating the disparity between the average values of Teams 1 and 2 (T1–T2) features. These newly crafted ‘Diff’ predictors constituted the primary set of features employed in the study.
The refined dataset encompasses data from 3054 matches, featuring 15 predictors—7 pre-game and 8 in-game—with a single binary label to predict (T1_win). While an initial collinearity analysis was performed on the raw features (i.e., non-“diff”-ed), the analysis was not useful as it could not show any negative correlation—since features such as damage dealt, gold taken, and damage taken in their raw forms are always positive for both teams. Collinearity analysis of the diff predictors proved more insightful, revealing that greater damageTakenDiff (indicating that Team 1 sustained more damage) is inversely associated with goldDiffs and damageDealtDiffs. This finding implies that teams failing to effectively manage their health are at a disadvantage in terms of gathering resources and launching counterattacks. The analysis also revealed a slight negative correlation between rankDiff and damageTaken, suggesting that teams with higher rankings exhibit better control over their health status. In a game context, this means a higher-ranked team will on average be able to both deal more damage over time to their opponents while negating counterattacks or damage to themselves (i.e., they do not ‘trade’ blows).
The final engineered feature set (Table 3) contains seven pre-game predictors and eight in-game predictors along with the binary label of whether Team 1 won.

3.3. Models

Four classification methods were employed: Gradient Boost, XGBoost, logistic regression, and random forest. These are commonly employed in the literature [17,38,39,41,55] and therefore are reasonable reference points for the purposes of the study, removing the choice of model as a confounding variable when comparing results to those of similar studies. They are also simple, interpretable models that have been demonstrated to scale well to both large datasets and small (which this study is).

3.3.1. Logistic Regression

Logistic regression (LR) is a specialized form of generalized linear model designed for scenarios where the outcome variable is binary, indicative of ‘success’ or ‘failure’, and is associated with probabilities. Linear regression techniques are not suitable for such cases because probabilities are constrained to the interval (0, 1). Sperandei [56] details how the mathematical framework of the LR overcomes this limitation by focusing on the log odds of the binary outcome variable. For a binary outcome Y with a ‘success’ outcome Y s occurring with probability p , the odds of Y s are p 1 p . Odds span 0 ,   for p approaching 1 and 0. The mapping from probabilities to odds is nonlinear, with probabilities less than 0.5 corresponding to odds between 0 and 1 and probabilities greater than 0.5 corresponding to odds greater than 1. This asymmetry is resolved by linearizing the relationship between explanatory variables and the binary response variable by taking the natural logarithm of the odds, log p 1 p . This transformation expands the span of values of odds to ( , + ) , thereby enabling linear modeling of the relationship between predictors and the response variable through the logit link function (Equation (1)).
log p 1 p = β 0 + β 1 x 1 + β 2 x 2 + β n x n                          
The transformation of probabilities to log odds, which maps the raw binary response values to   o r + , renders traditional least squares fitting methods inapplicable. To address this, logistic regression employs maximum likelihood estimation to optimize the fit. This method works by associating the observed response values with the expected values predicted by the model for a chosen initial set of parameters, denoted as β 0 β n , optimizing fit by minimizing log-loss via Gradient Descent [57]. The response variable can be mapped back to probability via the logistic function (Equation (2)).
y = 1 1 + e β 0 + β 1 x 1 +   β n x n                            
Regression stands out for its simplicity, adaptability to both categorical and numeric predictors, and ease with which it can be extended through regularization techniques to prevent overfitting. Its high interpretability is a significant advantage, as it offers explicit coefficients for each predictor, indicating the direction and magnitude of their effects on the outcome. However, it operates under the assumption of a linear relationship between the predictors and the log odds of the response variable, which can lead to biased estimates in more complex problem spaces where this linearity does not hold. Additionally, in situations where the feature space exceeds the number of observations, logistic regression is susceptible to overfitting, highlighting its limitations in handling high-dimensional data without adequate regularization or dimensionality reduction.

3.3.2. Random Forest

Random forest (RF) is an ensemble model derived from decision trees, applicable for both classification and regression tasks. Decision trees function by recursively constructing a search tree that best divides the data into distinct response classes according to their predictor variables. An example of this process is outlined by Quinlan et al. in their discussion of the ID3 algorithm [58], which employs a greedy method [59]. For the root node, p, Entropy (E3) is computed for each response class i.
E ( p ) = i = 1 n p i × l o g ( p i )
Dividing the dataset using each predictor, the Entropy of the resultant child nodes is determined, and the information gain—which signifies a decrease in Entropy—is then calculated (Equation (4), where p represents the parent node and p j represents the child nodes from splitting via predictor T ). The predictor that results in the highest information gain is chosen for the split. This iterative procedure continues until the response classes are entirely segregated, there are no remaining predictors to split on, or a predetermined depth limitation is reached.
G a i n ( p , T ) = E p j = 1 n p j × E ( p j )
Decision tree models are straightforward and easy to interpret; however, their inherent low bias renders them prone to overfitting unless measures such as pruning or limiting their depth are implemented [60].
Random forest addresses these limitations by integrating multiple decision trees to improve model robustness and accuracy. The original RF algorithm by Breiman [61] constructs an ensemble of decision trees, each developed from a bootstrapped sample of the data. Unlike decision trees that consider all the predictors for splitting at each node, the RF selects a random subset of predictors at each node, increasing the diversity among the trees. This method, known as ‘bagging’ (bootstrap aggregating), significantly reduces the risk of overfitting by ensuring that most trees are uncorrelated [62] while preserving the model’s interpretability and computational efficiency [63]. Ensemble models have been shown to perform better than individual models do if each model in the ensemble is better than random [64]. However, the RF may underperform when predicting values outside the training data’s range [65], and it can still overfit if low-information predictors are abundant in the feature space [66]. Careful hyperparameter tuning and validation can alleviate this [67].

3.3.3. Gradient Boost and XGBoost

Gradient Boost builds upon the ensemble-of-trees approach of random forest by sequentially building trees that attempt to minimize the error of the previous tree’s predictions. The algorithm functions as follows:
  • Initializing a model with a weak learner (a decision tree with limited depth)
  • Quantifying the model error is quantified via a chosen loss function (usually Cross Entropy for classification).
  • Gradient Descent is used to compute the direction and magnitude of the steepest decrease in error.
  • Subsequent weak learners attempt to minimize loss based on the derivative of the loss function with respect to the previous tree’s prediction.
  • The outputs of subsequent learners are scaled down by a learning rate hyperparameter before being added to the ensemble. This limits the rate of improvement per iteration step, reduces overfitting, and aids convergence.
XGBoost follows the same basic ensemble building algorithm as Gradient Boost but with some notable optimizations aimed at efficient computation for large datasets. As detailed by Chen and Guestrin in their original paper [68], XGBoost functions as follows:
  • A regularization parameter is added to determine the optimal split, further reducing overfitting.
  • An approximate greedy algorithm that utilizes a Weighted Quantile Sketch algorithm for selecting the optimal split is introduced. This vastly improves performance on large, highly dimensional datasets, as it also allows parallelization.
  • A novel sparsity-aware splitting algorithm that optimizes for missing data by creating default directions to follow when building the tree ensures that only nonmissing branches are visited. This also reduces the need for preprocessing to remove missing observations.
  • Cache-aware access is implemented by allocating a buffer in the cache for computed gradients, which rapidly increases the speed at which subsequent trees can compute their loss.
  • This method optimizes for hard-disk access in large datasets by compressing data, reducing the need for repeated reads on the hard drive. In instances where data are split across multiple drives, XGBoost can also make use of sharding to parallelize access to data, further improving training speed.

3.4. Training and Evaluation

Model training was conducted via the ‘tidymodels’ R package [69]. All code and model artifacts are available for reproducibility. Training (75%; n = 2290) and test (25%; n = 764) sets were created, with the test set being kept separate until final model validation. Both sets were stratified by the target variable (T1_win) to ensure equal representativeness in each set. To increase generalizability, tenfold cross-validation (of just the training set) was utilized for parameter tuning. A standard logistic regression model was adopted, with the possibility of applying L1/L2 regularization with the ‘glmnet’ engine should overfitting occur after cross-validation [70]. The hyperparameters for the random forest, Gradient Boost, and XGBoost models were refined using Grid Search. Despite the potential of Bayesian optimization for identifying superior global solutions, Grid Search was chosen for its ability to be parallelized, thereby reducing the computation time. It is noted for its efficiency and effectiveness across both categorical and numeric predictors [71].
All features were standardized using z-score scaling to have a mean of 0 and standard deviation of 1 prior to training. All models were developed using the R package tidymodels for the underlying modeling framework (encompassing compute engines, train/test splits, cross-validation on the training set, and performance metric evaluation against the test set).
The logistic regression model was built via the ‘glm’ engine, the random forest model via the ‘ranger’ engine, the Gradient Boost model via the ‘C5.0’ boost_tree engine, and XGBoost via the ‘xgboost’ engine. Tenfold cross-validation was employed for all models on just the 75% (n = 2290) training data for estimating fit before testing performance of the final model on the unseen 25% (n = 764) test set.
Hyperparameters for the tree-based models were tuned via Grid Search, optimizing selected parameters for accuracy. XGBoost and C5.0 employed grid latin hypercubes for the search space, employing tidymodels’ auto-calculated ranges based on the feature space.
The XGBoost model was sized at 1000 trees to optimize training performance within the limited available compute. The hyperparameters tuned for XGBoost were as follows:
  • Tree depth;
  • Minimum number of data points at a node for further splitting;
  • Minimum loss reduction for a split;
  • Fraction of training data used for each tree;
  • Number of predictors sampled at each split;
  • Learning rate.
The C5.0 model was sized at 100 trees, as it typically converges faster than XGBoost (depending on the learning rate XGBoost employs), with more trees being more prone to overfitting as it lacks XGBoost’s regularized approach. The hyperparameters tuned for C5.0 were as follows:
  • Minimum number of data points at a node for further splitting;
  • Fraction of training data used for each tree.
The random forest model tuned the following hyperparameters:
  • Number of predictors sampled at each split;
  • Minimum data points at node for further splitting.
Accuracy (Equation (5)) was chosen as the main measure of model performance, as the dataset had negligible class imbalance, which would otherwise make accuracy a misleading metric. For completeness, precision (Equation (6)), recall/sensitivity (Equation (7)), F1 (Equation (8)), and specificity (Equation (9)) will also be examined for the initial model comparisons (in Section 4.1); however, accuracy will be the main metric of interest. Much of the existing literature in this research domain is focused on accuracy as the core metric. This is primarily because datasets are usually well balanced (as is the case in this study), and there are no differential consequences to predicting false positives or false negatives like there might be in other domains (e.g., in healthcare, where false negatives can have dire consequences). Predicting wins and losses are of equal importance, and the accuracy metric captures this requirement best. In order to focus on the novel aspects of this paper—the combining of pre-game/in-game predictors on a representative dataset and the engineering approach to streak—the study will also use accuracy as the primary metric to enable better comparability to existing work (in Section 4.4.1).
A c c u r a c y = T r u e   P o s i t i v e + T r u e   N e g a t i v e T r u e   P o s i t i v e + T r u e   N e g a t i v e + F a l s e   P o s i t i v e + F a l s e   N e g a t i v e
P r e c i s i o n = T r u e   P o s i t i v e T r u e   P o s i t i v e + F a l s e   P o s i t i v e
R e c a l l   ( o r   S e n s i t i v i t y ) = T r u e   P o s i t i v e T r u e   P o s i t i v e + F a l s e   N e g a t i v e
F 1   M e a s u r e = 2 ( P r e c i s i o n R e c a l l ) P r e c i s i o n + R e c a l l
S p e c i f i c i t y = T r u e   N e g a t i v e T r u e   N e g a t i v e + F a l s e   N e g a t i v e

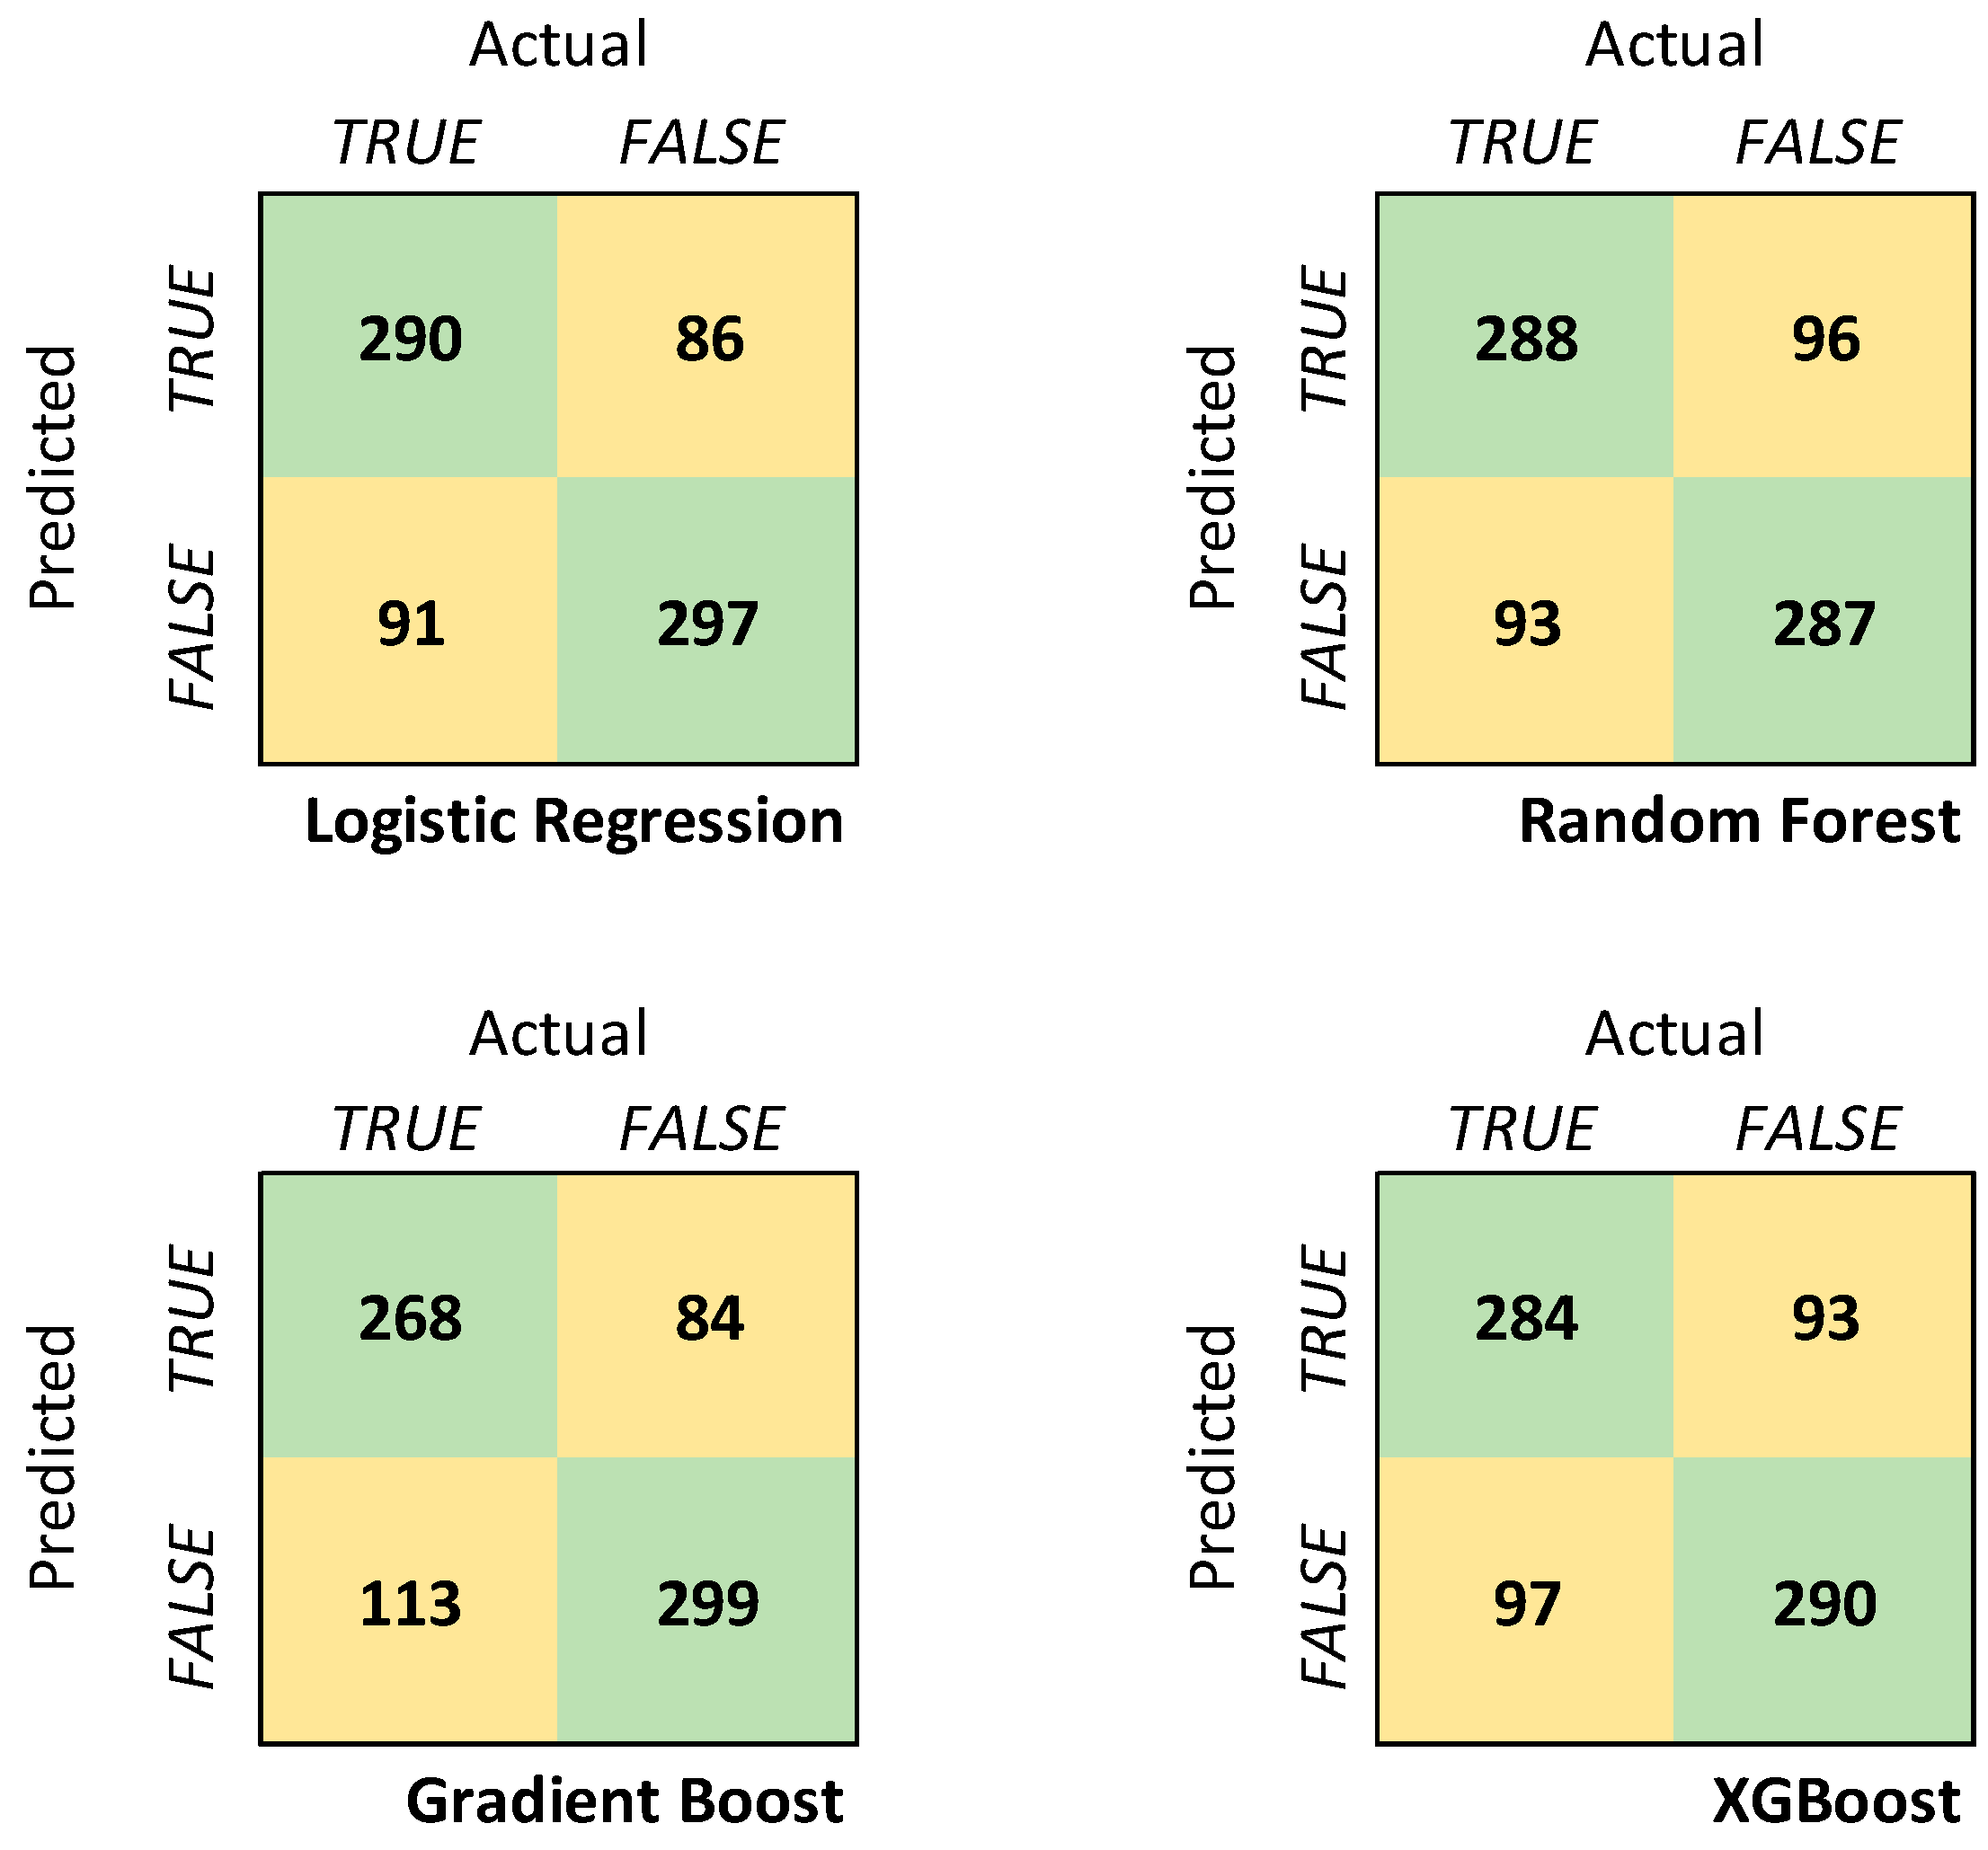
4. Results and Discussion

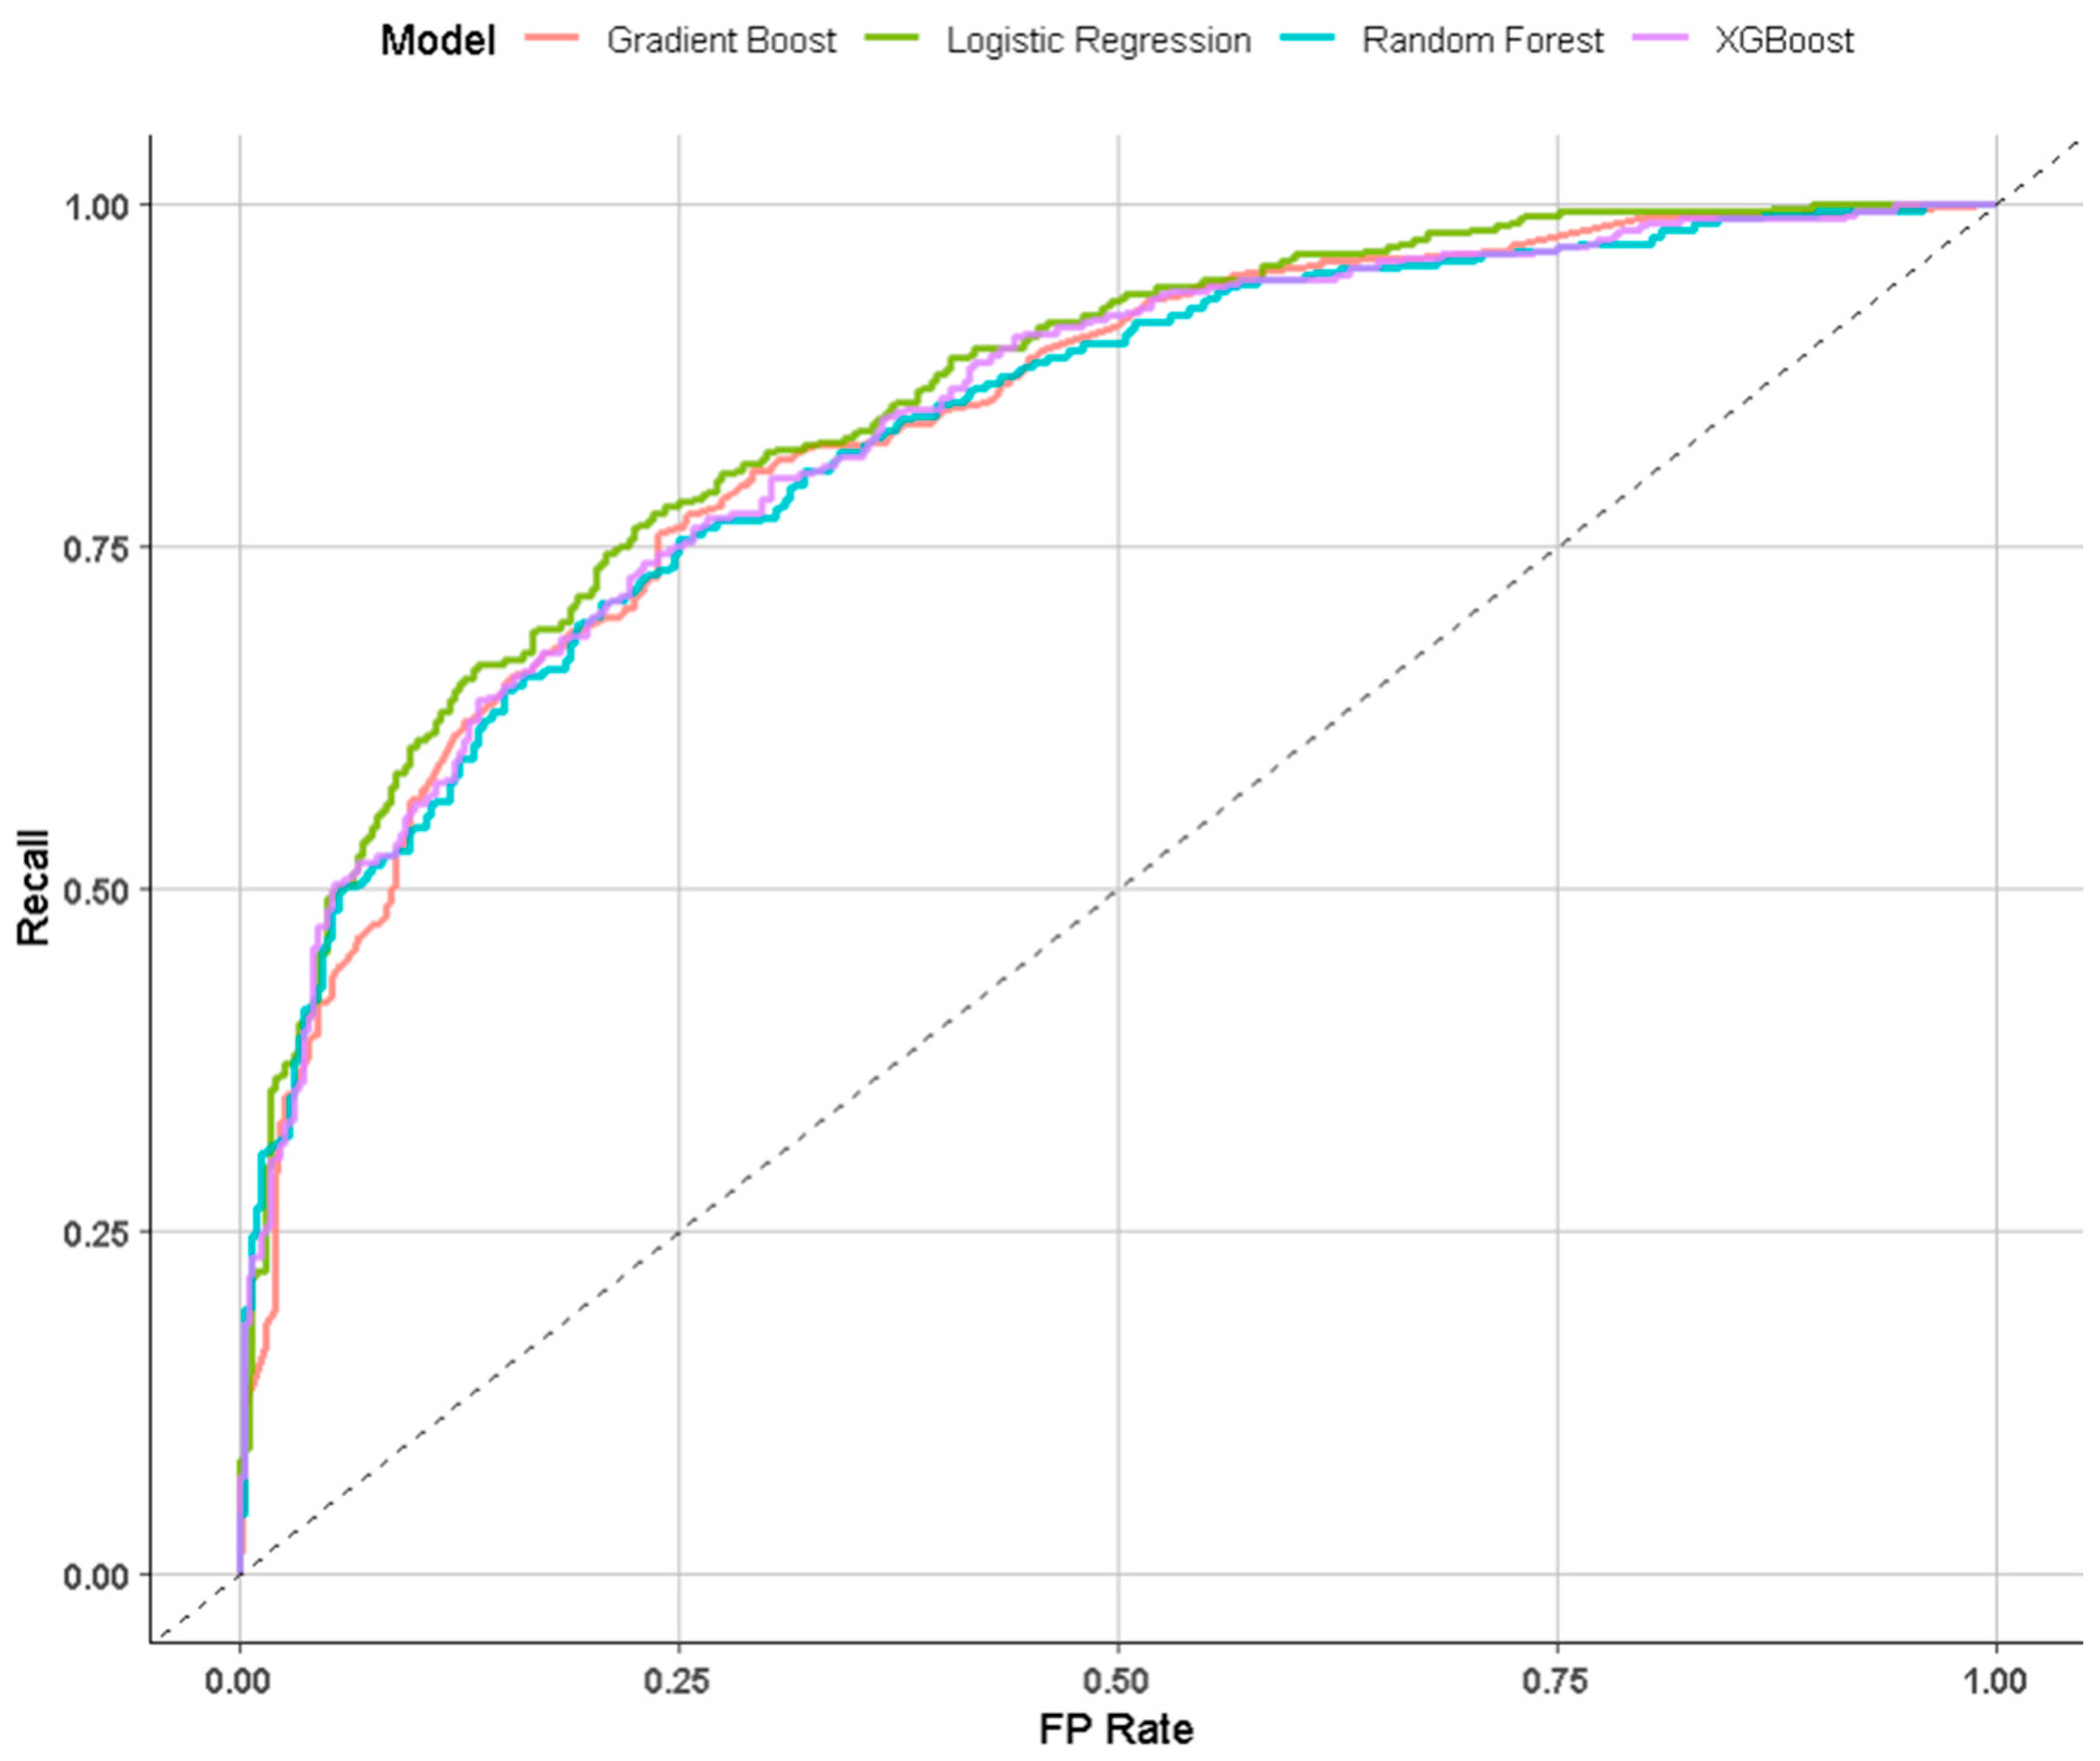
4.1. Combined Pre-Game/In-Game Model Performance

The confusion matrices for each model are shown in Figure 5 below. The label is whether T1 won or not. Logistic regression had the highest overall accuracy and the highest number of true positive predictions. Gradient Boost had the lowest accuracy; however, it achieved the highest number of true negative predictions, giving it the highest specificity of all the models, but it also had the lowest number of true positives. Random Forest and XGBoost are very similar, with Random Forest slightly outperforming overall, as it correctly classified four more wins than XGBoost, whereas XGBoost correctly classified three more losses.
Figure 6 below shows the ROC curve for each model, and Figure 7 shows the accuracy and AUC for each model. As seen from both, logistic regression is the most accurate model and has the highest AUC and thus the ability to best differentiate wins and losses.
Compared with the (LR) model, the RF model demonstrated marginally lower accuracy and AUC. The test results suggest good generalizability, with little evidence of overfitting. Notably, LR attained the highest AUC value at 0.851, and according to Figure 6, it exhibited superior ability in distinguishing between true positives and true negatives. Conversely, Figure 7 indicates that the disparities between the models are negligible. Both GB and XGB lagged behind LR and RF in terms of accuracy, although GB recorded a slightly higher AUC than RF did. The LR combined model is thus the preferred model (given accuracy specifically is our metric of interest) and will act as the base model for comparison to others going forward.
This performance difference could be attributed to multiple factors. First, the use of tenfold cross-validation in conjunction with the internal bootstrapping mechanism inherent in tree-based models might have limited the pool of available information during the hyperparameter tuning phase, possibly leading to the selection of suboptimal hyperparameters and a consequent reduction in average accuracy [72]. Specifically, this could be due to the relatively modest sample size of 3054 combined with the following multiple layers of validation:
-
The external train/test split mechanism that was used (75%/25%) meant only 75% of data were available for training at all (n = 2290).
-
Cross-validation during the training phase meant only 90% of data were available during any given iteration (2290 × 0.9 = 2061).
-
The internal bootstrapping mechanisms of tree models further reduce the information space. The ranger engine, for instance, internally reserves 36.8% of samples for out-of-bag error estimation during its training phase, meaning each tree would be trained on 2061 × 0.632 = 1302 samples. C5.0 and XGBoost also use the sample size hyperparameter to train on a subset of data only.
-
This could have meant increased variance in performance across both folds and trees within the models; however, it does mean comprehensive validation of models against unseen data at multiple layers.
Secondly, the relatively constrained feature space could increase the correlation between trees, thereby increasing the generalization error [73]. Practically, however, the differences are nearly negligible.

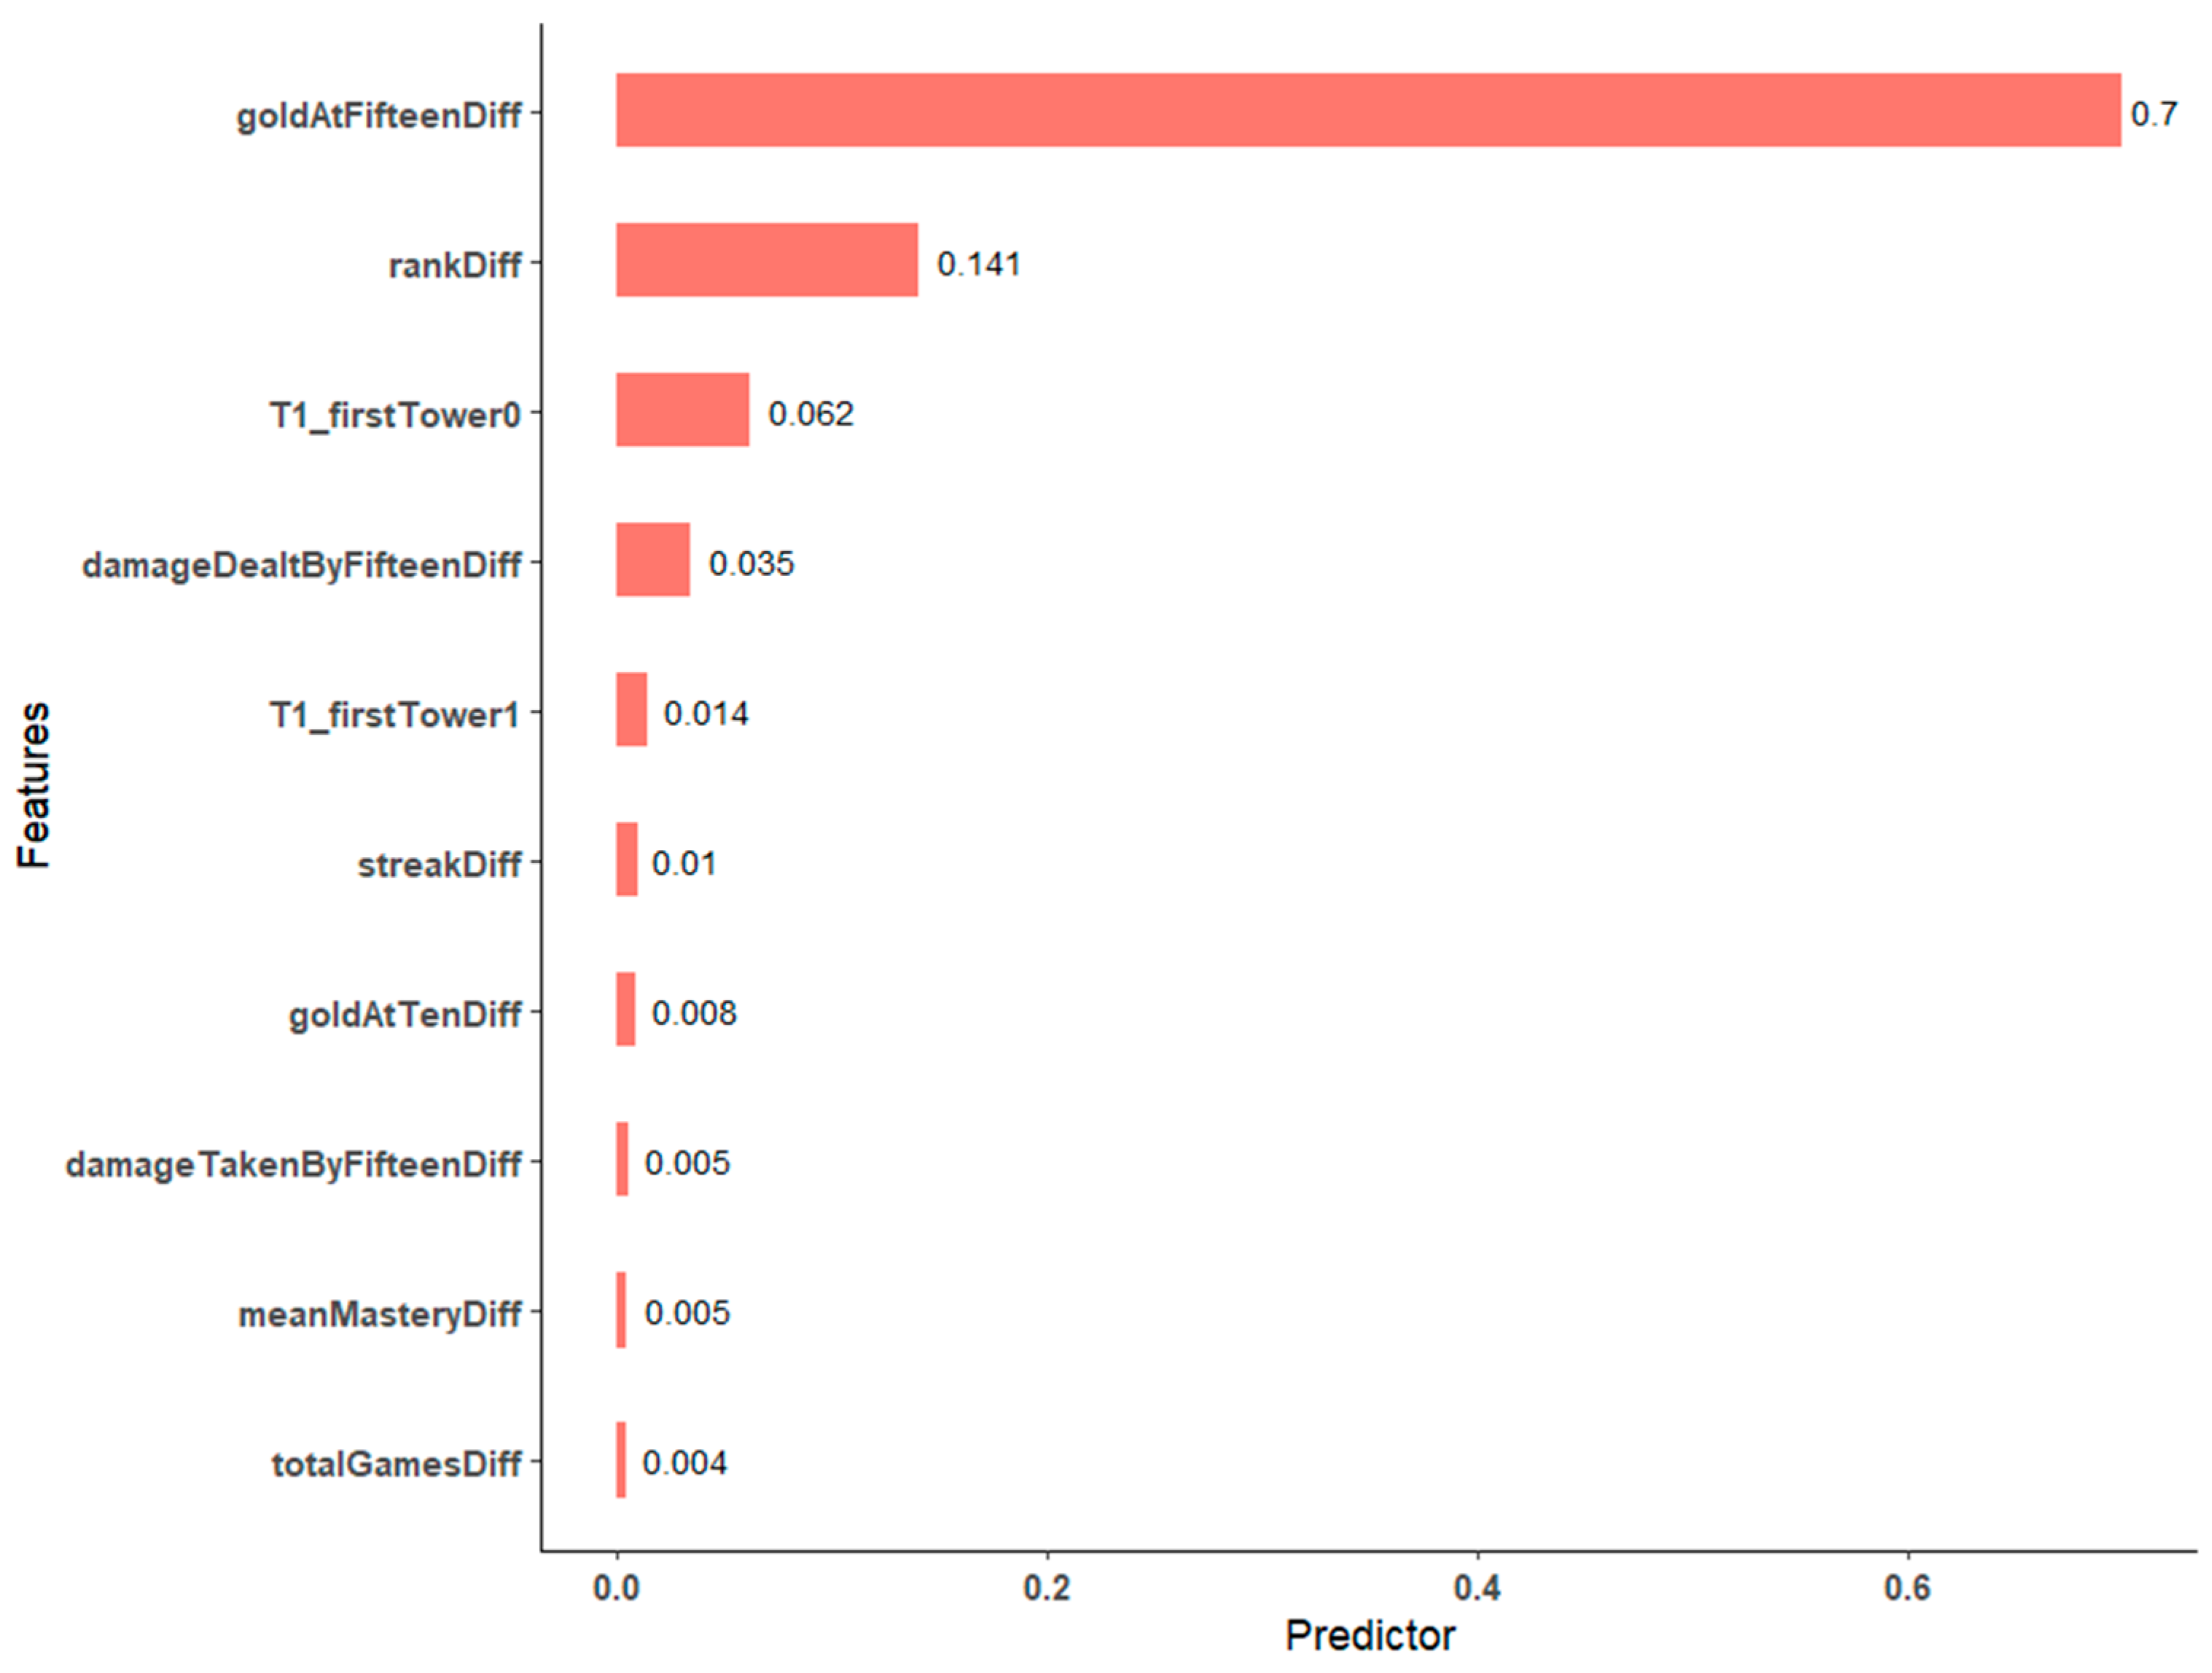
4.2. Variable Importance Groups

To delve deeper into the relative significance of pre-game and in-game features within a unified model, feature importance differences between the pre-game and in-game variables were determined. Feature importance is quantified on the basis of the average decrease in Gini impurity resulting from a predictor’s involvement in node splits across all decision trees within the ensemble [74]. Predictors that exhibit higher scores are more important. According to Figure 8, in-game variables are generally more influential predictors, with four of the top five most pivotal predictors belonging to the in-game category, with ‘gold’ emerging as a particularly potent predictor. This observation is corroborated by existing research that acknowledges the disproportionately significant role of ‘gold’ in determining match outcomes [40]. Nevertheless, pre-game variables retain their relevance, with ‘rankDiff’ being identified as the second most influential predictor. Beyond the top six predictors, it is interesting to note that pre-game variables demonstrate superior strength compared with their in-game counterparts, underscoring that while in-game factors are predominantly more influential, pre-game factors still hold considerable predictive power.
Comparing the best-performing model (LR) against itself and the second-best-performing model (RF) with only pre-game and in-game feature sets in Figure 9 and Figure 10 below, there is a noticeable decline in performance across all the metrics when only pre-game features are employed. Specifically, the accuracy was reduced by approximately 20% in both the pre-game-only LR and RF models, as shown in Figure 9, relative to the accuracy of the combined LR model. An interesting observation from Figure 9 is the increase in recall for the RF model, which managed to correctly identify a higher percentage of wins, thus achieving a superior F1 score, albeit the LR model surpassed it in all other aspects. Consequently, it is evident that predictor sets exclusively based on pre-game variables are suboptimal compared with those that amalgamate both pre-game and in-game variables for this feature set.
Compared with those based solely on pre-game variables, models utilizing only in-game variables demonstrated superior performance, which aligns with expectations due to their elevated variable importance. This finding agrees with the literature [24,41]. Specifically, the in-game RF model exceeded the performance of the in-game LR model across all metrics except for the area under the curve (AUC) in Figure 10, implying that the combined LR model attributed more significance to pre-game factors. Nonetheless, both in-game-focused models outperformed the LR model, which integrated both the pre-game and in-game variables. This underscores the importance of pre-game factors, as the comprehensive LR model achieves better results than the combined RF model does, reinforcing the notion that pre-game variables, though not solely determinative, contribute meaningfully to prediction accuracy.

4.3. Effect of Streak

In examining the importance of streaks, exponentiated coefficients and test statistics for the logistic regression model (Table 4) were computed to allow like-for-like comparison of the effect size of statistically significant features. It should be noted that the Odds Ratios listed in Table 4 show the effect on odds of losing (as winning was set as the reference level for this statistic). ‘streakDiff’ emerged as one of the few predictors identified as statistically significant, others being ‘rankDiff’ and ‘goldAtFifteenDiff’. Its exponentiated coefficient indicated a marginally larger effect size than the other two coefficients did. However, it is important to note that the utility of statistical significance diminishes with increasing sample size because the relative portion of variance attributable to noise decreases, increasing the likelihood of identifying significant associations [75]. Streak was also the only feature used to contain imputed data. Consequently, additional evidence is necessary to substantiate these findings. Specifically, an expanded data engineering methodology over a longer timeframe that allows comprehensive collection of streak data would greatly benefit this space.
Figure 8 above suggests that a streak is important in isolation as a pre-game predictor, being the second most important pre-game predictor behind rankDiff; however, overall, the difference in ranks between players is a more important pre-game predictor, and in-game predictors overall carry far more weight in determining match outcomes. This is further corroborated when the variable importance in the XGBoost (the third most accurate) model is examined, as shown in Figure 11 below. Streak is considered the 6th most important predictor only, far less important than rankDiff and goldAtFifteenDiff at the top. This agrees with the findings from the logistic regression coefficients as well (since they show the impact on the odds ratio for losing streaks and therefore have the lowest effect size of the three).
In practical terms within a game context, we can interpret this as for each unit increase in “streakDiff”, the odds of Team 1 losing are multiplied by 0.880 (or a decrease of 12%), all else being equal. This is a very modest effect size in real terms compared to the far larger impact of unit increases in rank (a unit increase decreases odds of losing by 50%) and goldAtFifteen (a unit increase decreases odds of losing by 83%).
To analyze model sensitivity to streak, comparator models with streakDiff removed and streakDiff imputed using median values (rather than the mean) were created, again only for LR and RF as the two best-performing models.
Figure 12a shows a sensitivity analysis for streak imputation by comparing performance between LR and RF models trained using the base (mean-imputed) streak feature against the same models trained with the median-imputed streak feature, all else being equal. Accuracy showed no difference in performance between the two imputation methodologies, and AUC only showed a difference of 0.001 for the RF model. AUC, specificity, precision and recall are excluded for visual clarity, but they all also showed no difference between the two imputation methods and, importantly, did not influence the most performant model either positively or negatively.
Figure 12b shows model performance with the streak removed, comparing both LR and RF versions to the base LR combined model. Eliminating ‘streak’ from the features seemingly exerts minimal influence. Notably, small increases in specificity and precision and a decrease in recall are observed when the logistic regression (LR) models are compared with those without Streak, implying that ‘streak’ plays a slightly more significant role in predicting victories than in predicting losses.
These findings contradict existing qualitative research, which suggests that players attribute more significance to losing streaks [26], but the observed discrepancies are minor. We can reasonably conclude that, due to the relative unimportance of streak as a feature overall, the imputation method is unlikely to have introduced significant bias, as shown by the sensitivity analysis in Figure 12a. The finding further corroborates the result that streak (as computed in this study) is unlikely to be a significant performance indicator at scale. The construct validity of streak as a feature needs to be carefully evaluated when attempting to correlate these findings with offline studies, as the ‘streak’ variable serves as a surrogate measure for the psychological states of confidence or tilt, which are influenced by consecutive wins or losses, respectively [76], but also additional factors [16]. In summary, the investigation revealed a negligible effect of ‘streak’ on the outcomes of matches, but further study on larger datasets is needed without the need to impute streaks for missing data. There seems to be a difference in how the feature is treated in linear models versus tree-based models as well, which should be explored in the future.

4.4. Critical Analysis and Discussion

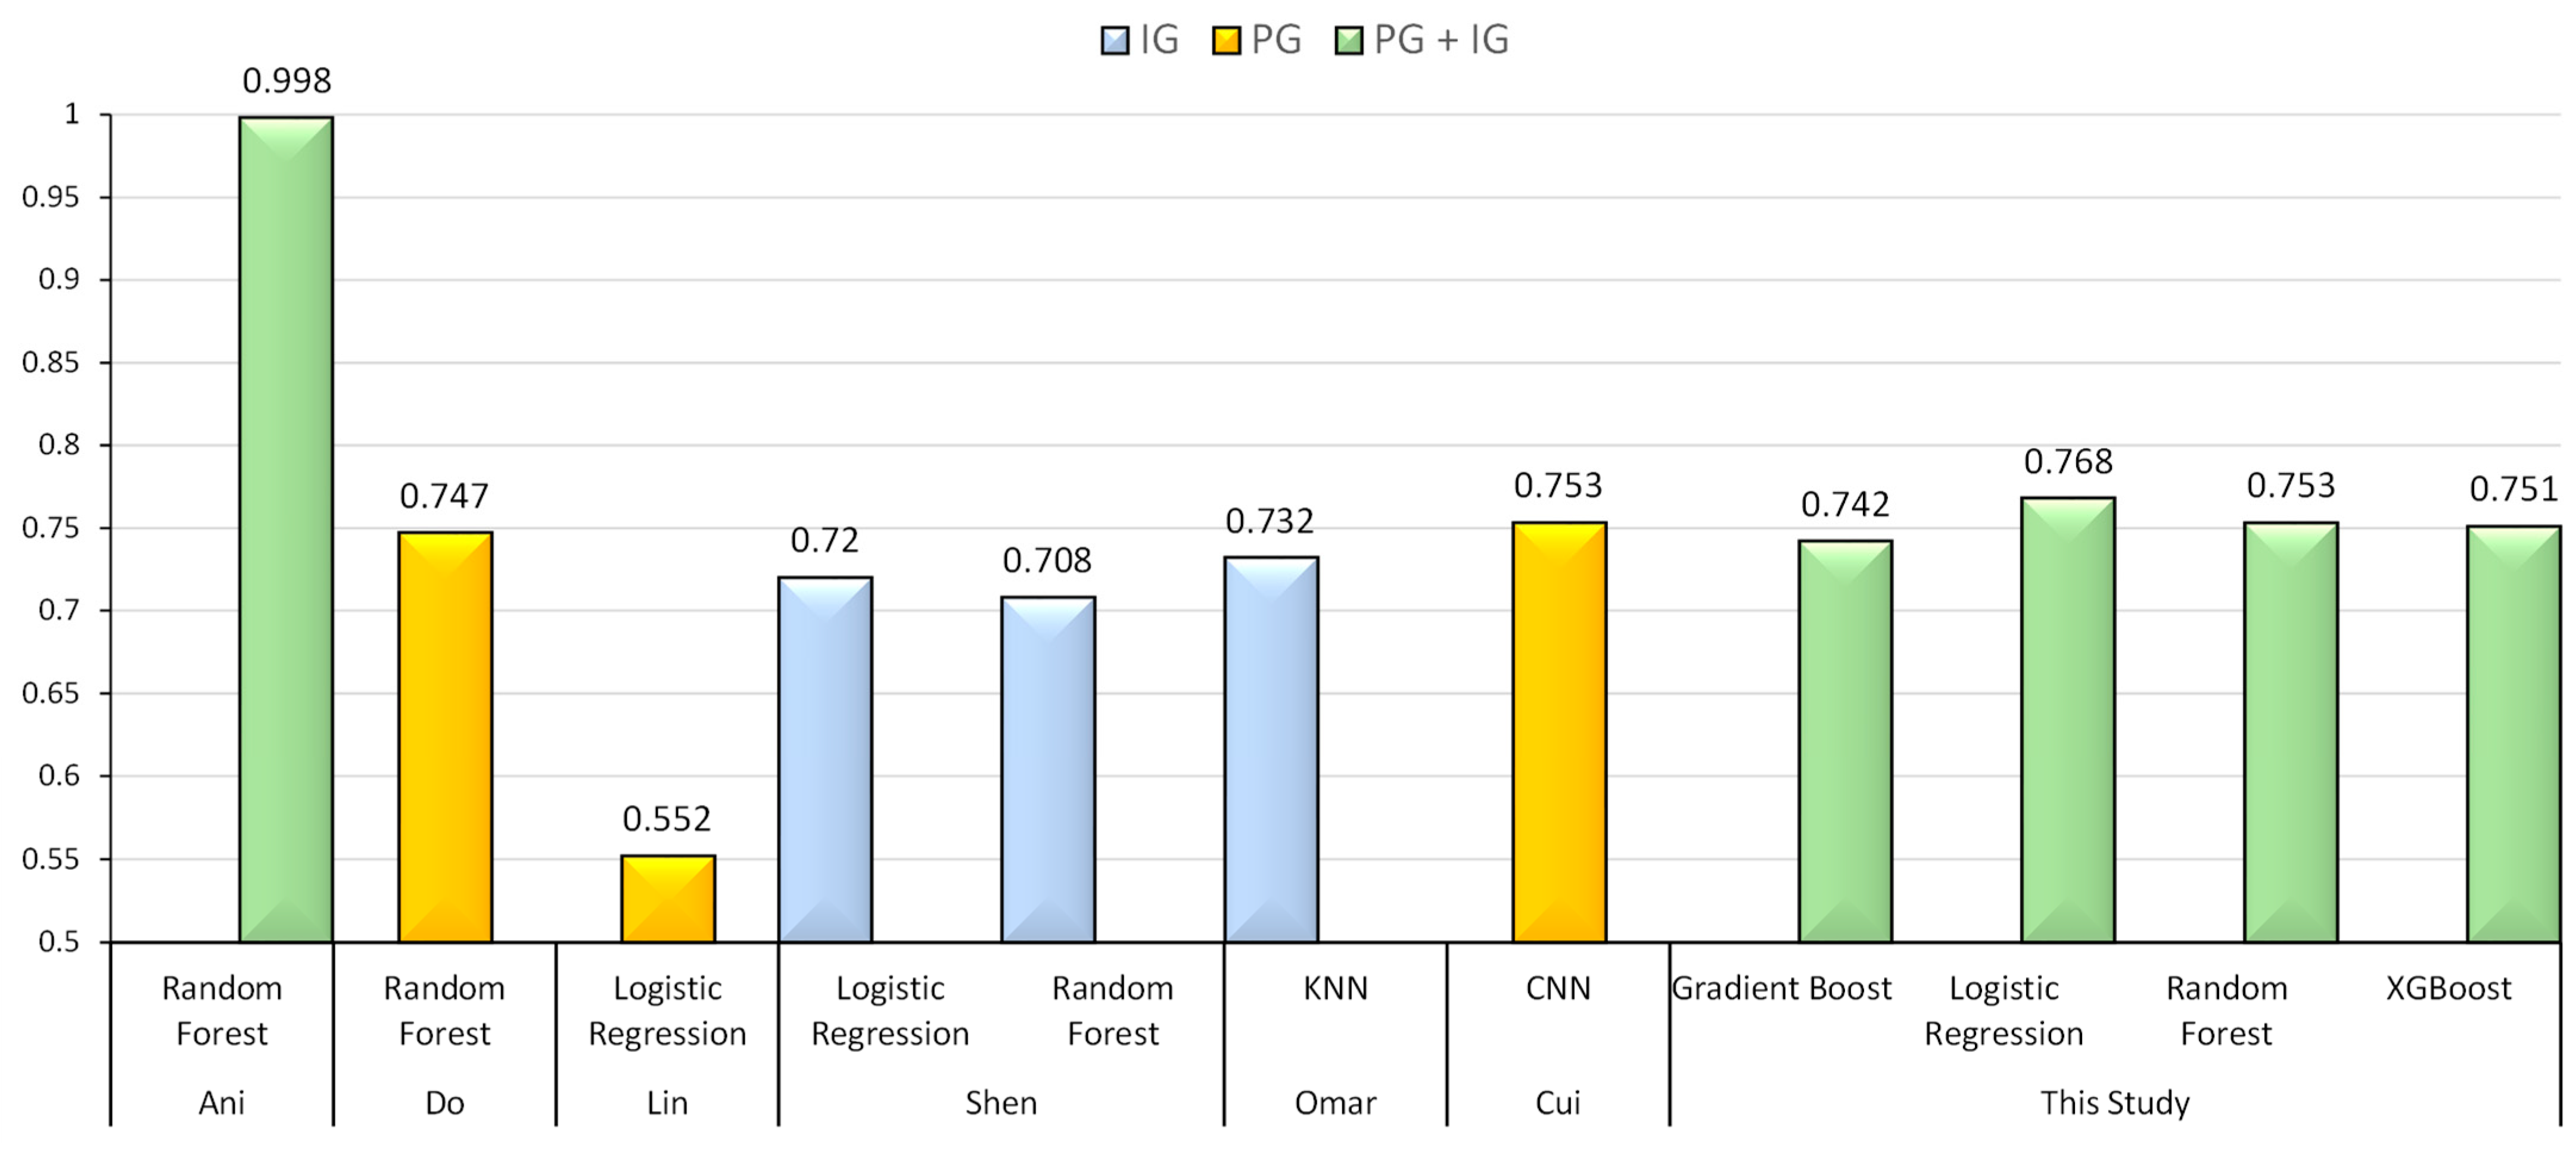
4.4.1. Combined Model Performance Against Existing Literature

Figure 13 shows that the combined models outperformed a sample of pre-game-only/in-game-only studies in terms of accuracy. Ani [41] has the highest accuracy, although this is to be expected as they trained and tested exclusively on professional match data, while this study’s models are derived from a dataset containing a wider range of ranks and skills.
Even the weakest performer, the Gradient Boost combined model, exhibits superior performance in comparison with most other methods, yet it does not surpass the results of Do’s pre-game study [17], an outcome that can likely be attributed to differences in methodology. Do’s study employs a bespoke-architected Deep Neural Network, identifying a player’s win rate on a chosen champion as a critical feature, a variable not accounted for in the present analysis owing to it not being available as a direct endpoint in the API. Engineering the same feature would have required additional API calls that would have limited the feature space elsewhere or reduced the sample size. More recent studies have attempted to branch out from Do’s approach, most notably Cordova [80], who enhanced the pre-game feature space from Do’s study with additional information on individual players’ win rates in their specific roles on the team, achieving a 97% accuracy with logistic regression. Cui [79] also highlights a pre-game-focused approach, modeling specifically on the match a player has between their chosen character and that character’s suitability for their role, achieving a 75.32% accuracy based on this feature alone. In contrast, Omar [78] focuses mainly on in-game features and achieves an accuracy of 73.2%. This variability highlights the untapped potential in both pre-game and in-game feature spaces, outlining how advanced feature engineering combined with higher volume data (to enable more sophisticated modeling approaches) is crucial to unlocking that potential. The limitations inherent to the feature space in this study undoubtedly affect accuracy, although the findings still show the importance of combining both pre-game and in-game features for prediction.
Future work should conduct this comparison with an expanded set of features. In summary, the integration of pre-game and in-game predictors yields a noticeable enhancement in predictive accuracy, even when trained on (and predicting across) a diverse spectrum of player abilities. While some loss in accuracy is seen compared with papers such as Ani et al. [41], this is to be expected due to the representative nature of this study’s dataset, which should, in theory, result in more generalizable predictions across the player base and not be specific to professional players. The accuracy and generalizability of models trained on specific ranks but tested against different ranks constitute a future research avenue that could highlight important differences between players at different skill levels and should be explored.

4.4.2. The Effect of Streak

An interesting finding of this study is that streak may not be as important a factor in determining the outcome of matches as offline, qualitative studies may suggest. However, there are several angles to consider here. Firstly, at a data level, the imputation requirement of streak in this study does have the potential to introduce bias, although this is partially accounted for by the sensitivity analysis carried out in Section 4.3. However, future studies should attempt to mitigate this via collecting data over a longer timeframe to account for the rate limits of the Riot API.
The construct validity of what was computed is a more interesting point to consider. This study treats streak as an integer variable, which implicitly introduces the assumption that smaller/larger values of streak will have smaller/larger effects, respectively (i.e., that the actual numerical value of the streak matters). It could be the case, however, that the streak itself has more impact as a categorical variable (e.g., “player is on a winning/losing streak”) or a binned variable (e.g., “player has lost less than 3 matches in a row”, “between 3 and 5 matches in a row”, etc.). A valuable addition to future work would be to account for the various possible constructs of streak and explore their relative importance.

4.4.3. Strengths of This Work

The proposed data engineering and model engineering approach demonstrates how a representative dataset comprising player matches across a wide range of skill ranks combined with a feature space mixing pre-game and early in-game predictors can lead to increases in model accuracy over just using pre-game or in-game predictors in isolation and, in theory, serve as a more generalizable model that can be further developed for live match prediction. The model also explores the impact of a newly engineered feature not found in the current literature, the win/loss streak of players, and the gap between qualitative studies focusing on the impact of player mindset/tilt on a small sample and quantitative studies exploring large-scale factors critical to success. The model also lays some groundwork for further developing the feature space via the proposed data engineering methodology, which can be easily adjusted to increase the feature set while retaining the characteristics of representative data.

4.4.4. Limitations and Future Research

This research focused exclusively on data from European players to streamline the data-gathering process, given that distinct geographic areas have separate API endpoints. Kho [37] reported that variations in styles across regions diminish the predictive ability when findings are applied universally. Importantly, however, Kho’s analysis was based on professional esports competitions, whereas gameplay at competitive levels may adhere to tacit strategies that are not prevalent in lower tiers. This observation does not negate the possibility of regional distinctions among lower-ranking players, suggesting an area ripe for future investigation. Generalizability of the model in this study on data from other regions would be a useful research avenue to assess how feature significance varies by geography.
An additional potential limitation identified in this study pertains to the method of data consolidation at the match level, which involves averaging the metrics of individual players within a team to create a team-wide feature set, aggregating individual contributions within the team. Gaina et al. [55] demonstrated the variable impact of players occupying distinct positions on the outcome of a match. Specifically, their findings suggest that the performance of individuals in the ‘Mid’ lane offers the most reliable forecast of match results. However, the field presents a lack of consensus on this matter, as evidenced by Eaton’s [81] research, which attributes the greatest influence to the ‘Carry’ role. This discrepancy may stem from the utilization of differing sets of features in their analyses or the temporal gap between the studies (2018 vs. 2016), a period during which modifications by the developers could have altered the relative influence of each role [30]. More recent research by Bahrololloomi et al. [82] revealed no difference in importance between various roles when attempting to optimize models for individual player contributions.
Finally, while the sensitivity analysis of streak suggested imputation had a low impact (due to streak’s relative unimportance overall), future studies should apply the data engineering framework from this study over a longer timeframe to account for the Riot API rate limitations while still collecting sufficient, real data on player streaks—and explore the various methods of construction for this feature to accurately capture its impact.
In general, there are opportunities to increase the scope of studies on data available via the Riot API through longer-term data collection, allowing a much richer dataset. This would allow more nuanced exploration of inter-feature relationships (especially in-game features), which more recent studies are attempting to do [78], and this would also open the door to applying more sophisticated machine learning methods, such as those demonstrated in [83] (ensemble-of-ensembles models, pipeline-based feature selection and hyperparameter optimization), methods that may otherwise be computationally efficient and risk overfitting on small datasets with fewer features.

5. Conclusions

In doing so, this research work addresses key research gaps, provides a novel contribution, and suggests specific future research avenues. The study has demonstrated that match prediction models built on representative datasets still achieve reasonable accuracy when combining pre-game and in-game factors. It has also demonstrated the low relative impact of player streaks on match outcomes, although the statistical significance of this finding and the conflicting findings from offline player-centric studies focusing on similar psychological factors suggest that more research is needed in this space. The study’s data engineering methodology can be easily extended to incorporate a larger number of factors from the Riot API and, combined with the method, ensure representative samples across ranks via random sampling to ensure that future models are generalizable across the player base.
The implications of these findings span several areas of research. Finding better ways to engineer in-game and pre-game feature sets will enable improved matchmaking, provide coaches and players with better tools to improve microperformance within individual games, enhance the ability of scouts to identify high-potential amateur candidates, and aid in the eventual development of real-time models [19]. A critical future direction will involve assessing the performance of models built on generalized player data against matches of a specific rank. Furthermore, examining the role of psychological factors by enhancing our streak feature engineering pipeline and building other similar features to act as proxies will help supplement this. This will allow a closer linking of psychological factors such as stress to game data and more widely allow the creation of key performance indicators through a scientific process, an area that esports coaches have highlighted as lacking [34]. The key summary points are presented as follows:
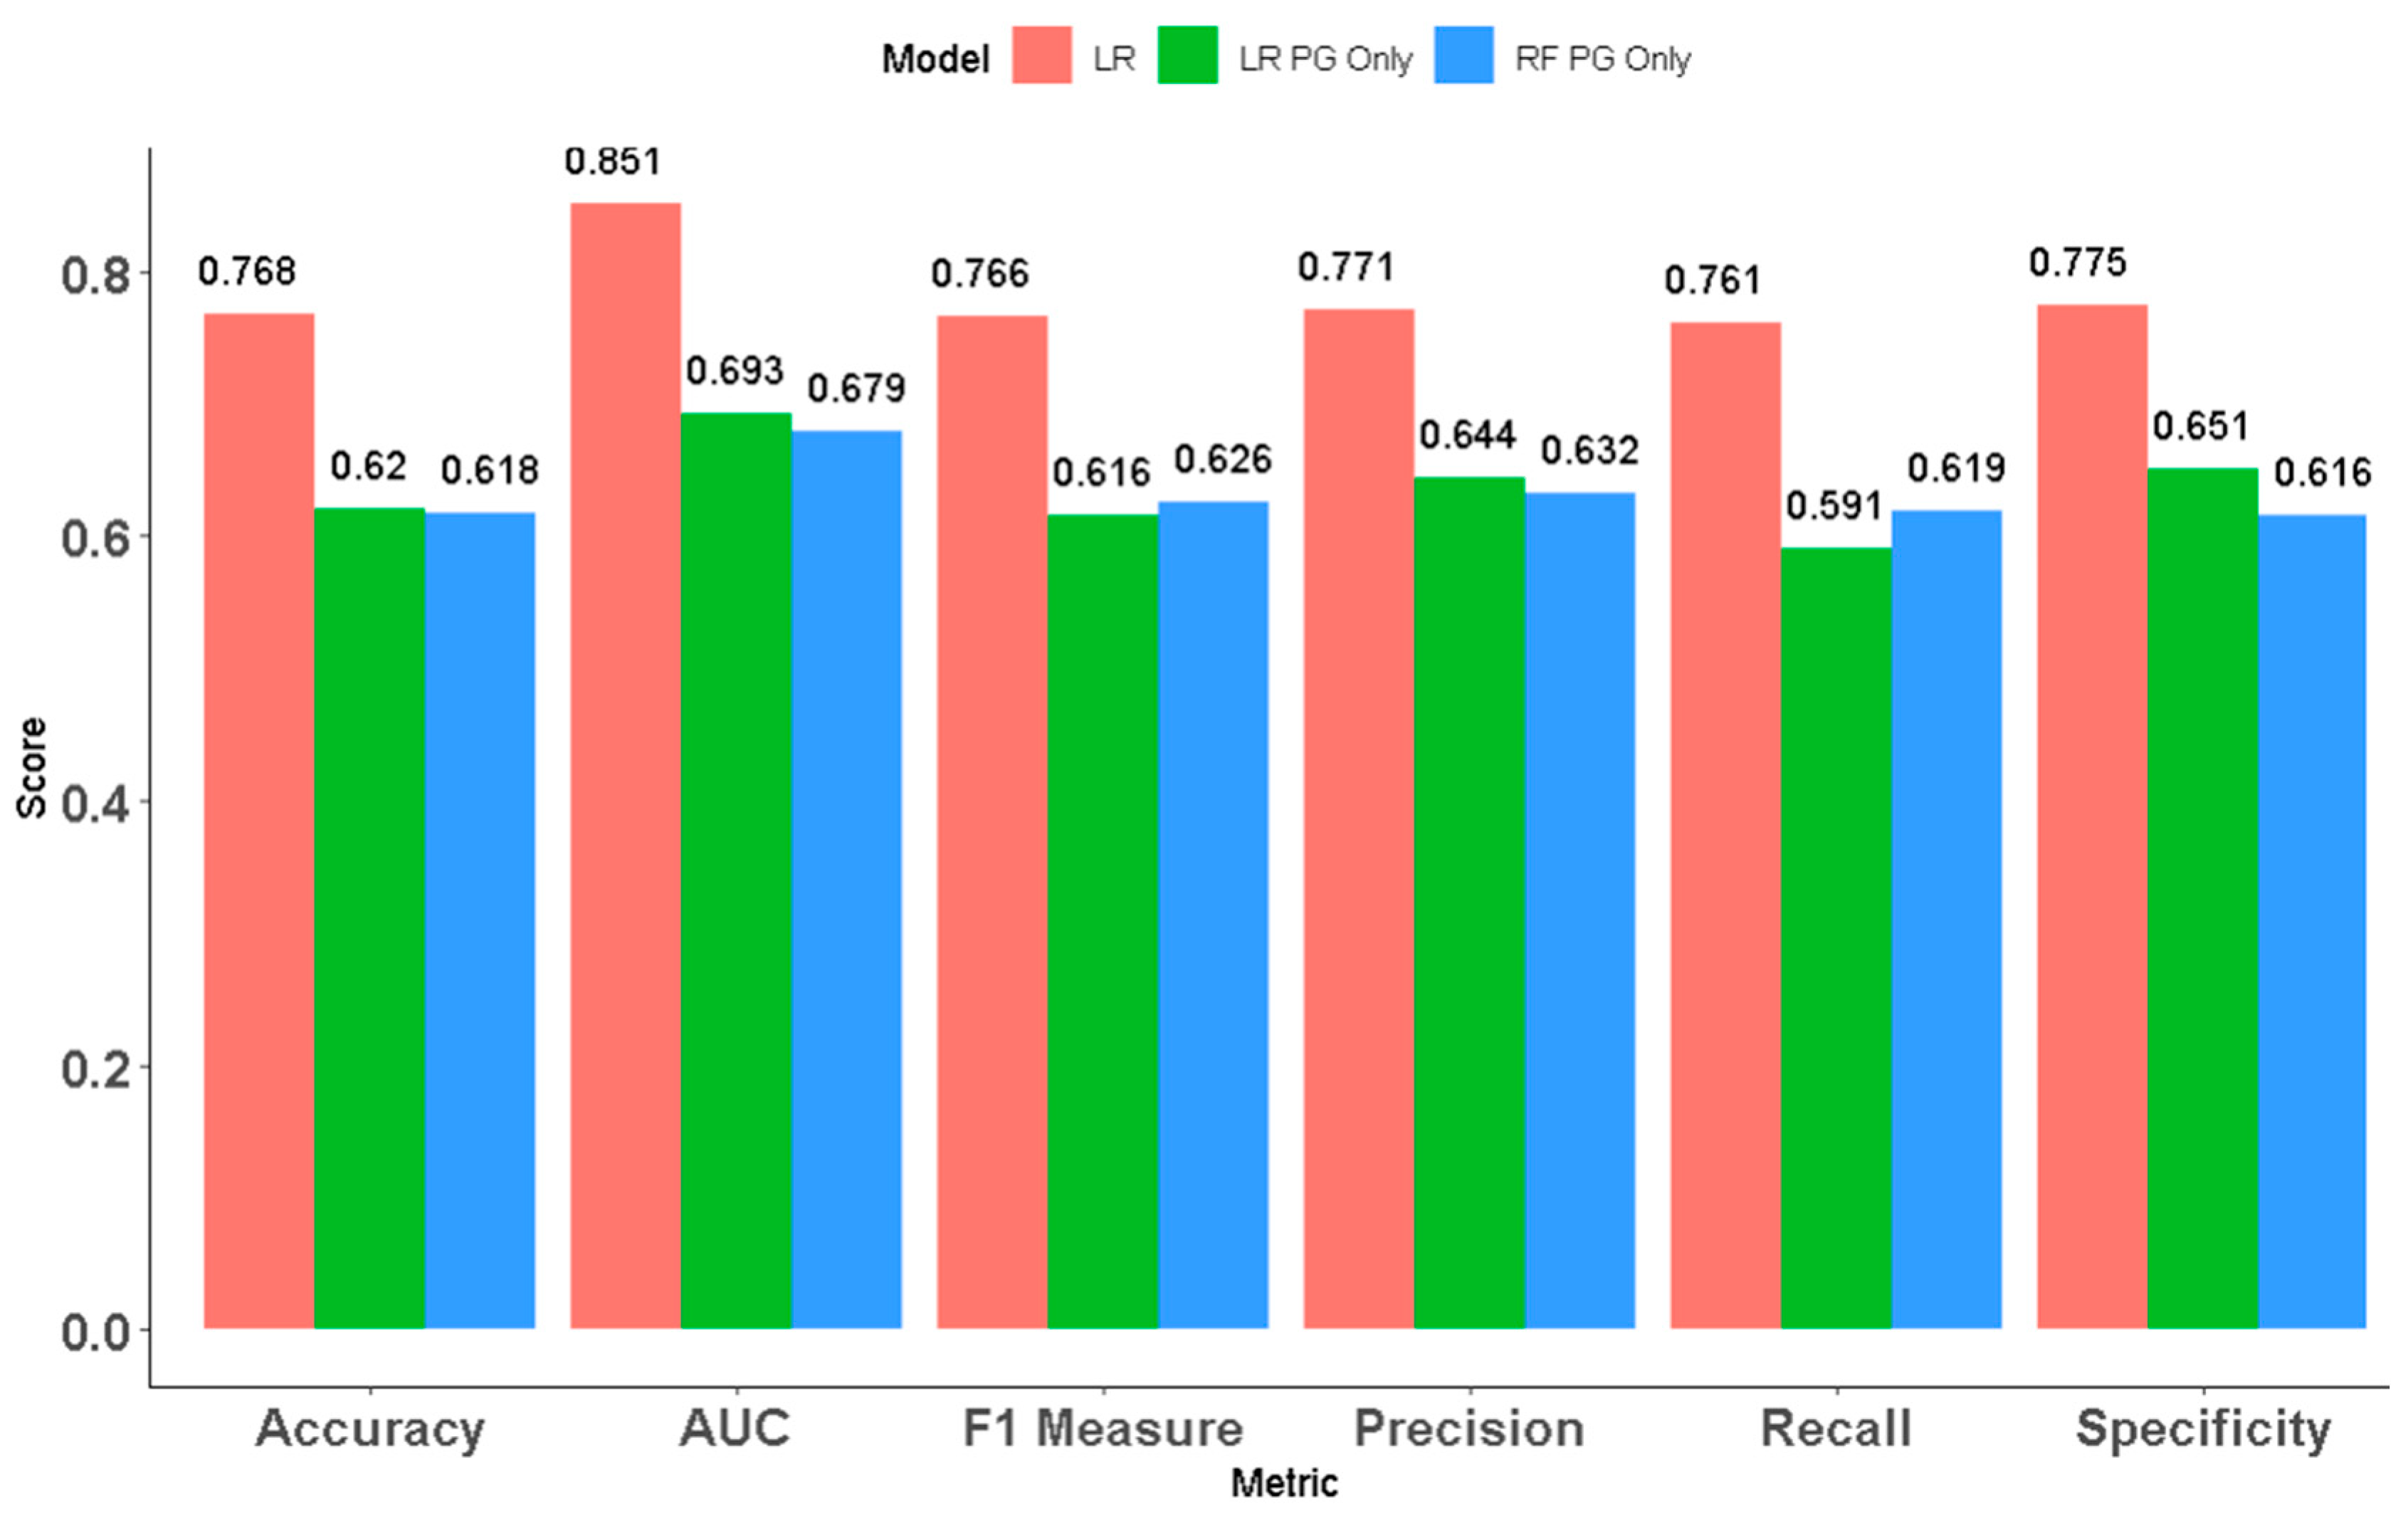
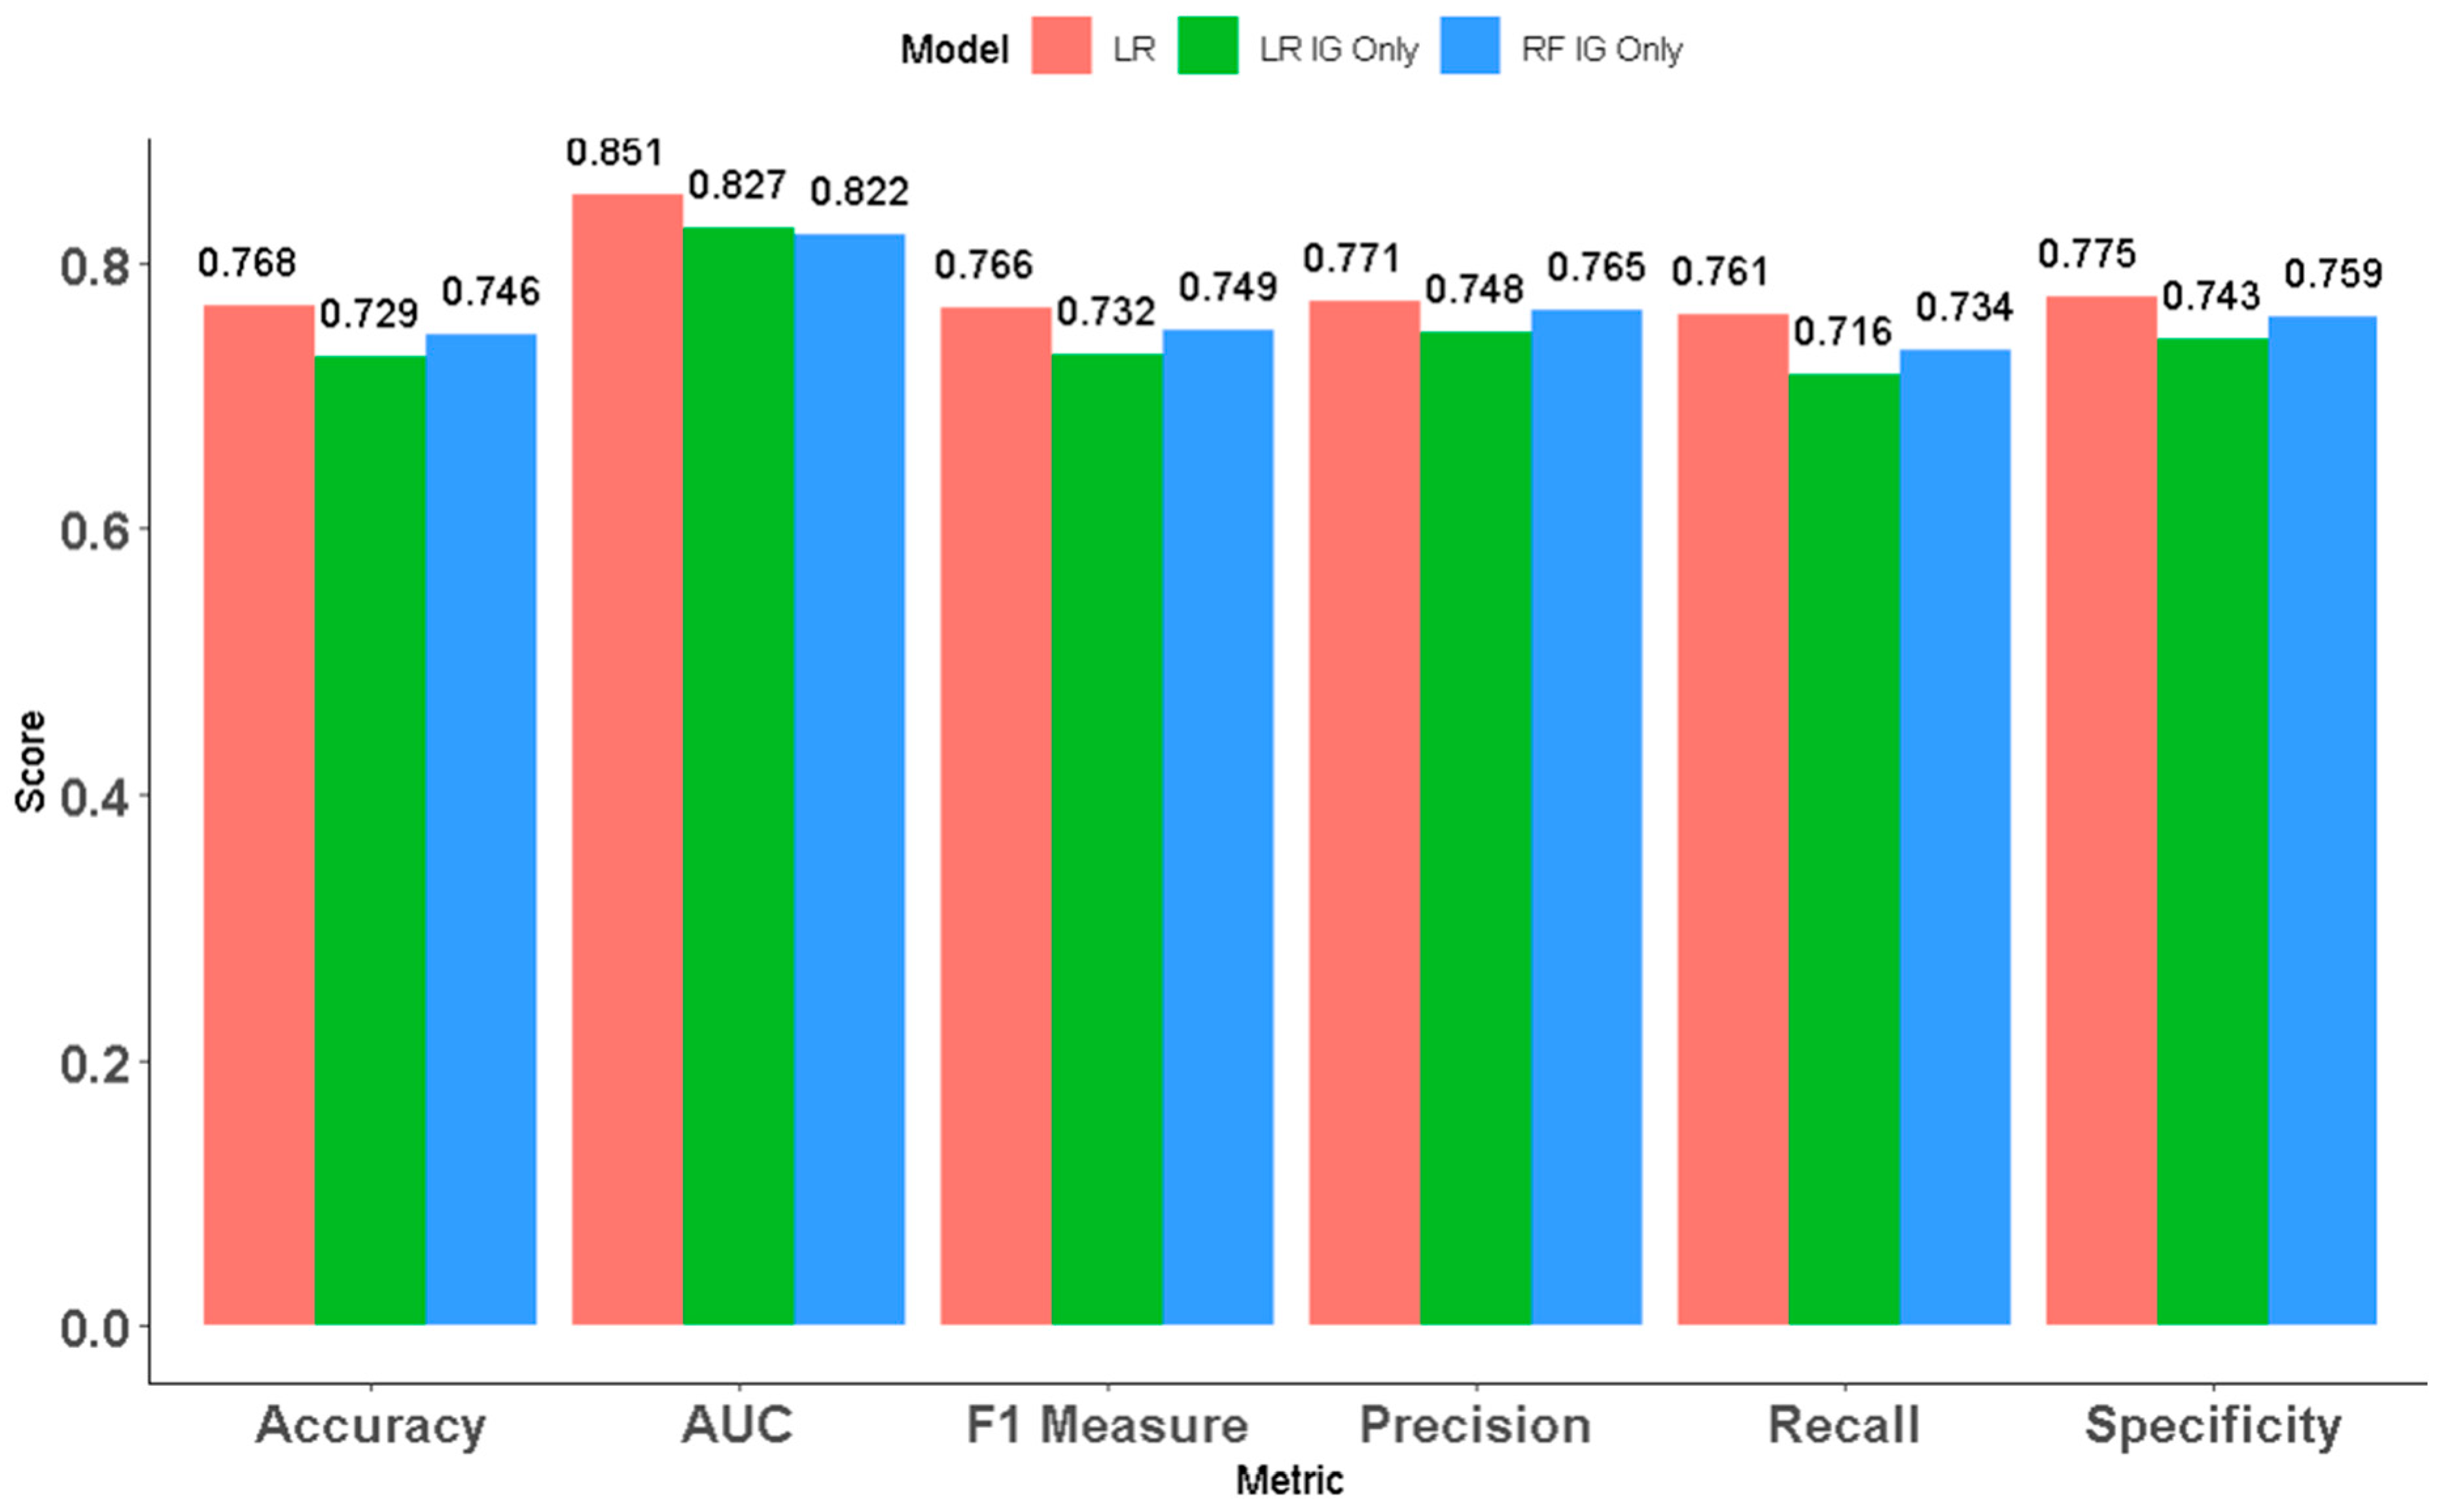
  • Models trained on a representative dataset (by rank split of players) of matches show reasonable accuracy (76.8% for the best-performing model) compared with models trained on datasets from professional matches only.
  • Streak is a relatively important pre-game predictor but has low predictive power in a combined pre-game/in-game model. In-game predictors contribute more to feature importance than pre-game predictors do.
  • Compared with the models trained on only pre-game (62% for the best performing) or in-game (74.6% for the best performing) features, the models trained on the combined pre-game and early in-game feature sets have improved accuracy.

Author Contributions

All authors have equal contributions to prepare and finalize the manuscript. Conceptualization, S.C. and M.A.; methodology, S.C., M.A. and P.B.; software, S.C. and M.A.; validation, S.C., M.A. and P.B.; formal analysis, S.C., M.A. and P.B.; investigation, S.C., M.A. and P.B.; data curation, S.C. and M.A.; writing—original draft preparation, S.C., M.A. and P.B.; writing—review and editing, S.C., M.A. and P.B.; visualization, S.C., M.A. and P.B.; supervision, M.A. and P.B. All authors have read and agreed to the published version of the manuscript.

Funding

This research received no external funding.

Institutional Review Board Statement

Not applicable.

Informed Consent Statement

Not applicable.

Data Availability Statement

The data presented in this study are available in the article.

Acknowledgments

This research used AI tools such as GPT-4 to improve the quality of manuscripts, for instance, grammatical checking. These tools aided in enriching technical readability, but the core study, results, and findings remain the sole responsibility of the authors.

Conflicts of Interest

The authors declare no conflicts of interest.

References

  1. Bhattacharyya, S.; Jha, S.; Tharakunnel, K.; Westland, J.C. Data mining for credit card fraud: A comparative study. Decis. Support Syst. 2011, 50, 602–613. [Google Scholar] [CrossRef]
  2. Raghupathi, W.; Raghupathi, V. Big data analytics in healthcare: Promise and potential. Health Inf. Sci. Syst. 2014, 2, 3. [Google Scholar] [CrossRef] [PubMed]
  3. Balkanli, E.; Zincir-Heywood, A.N. On the analysis of backscatter traffic. In Proceedings of the 2014 IEEE 39th Conference on Local Computer Networks (LCN), Edmonton, AB, Canada, 8–11 September 2014; pp. 671–678. [Google Scholar] [CrossRef]
  4. Hina, M.; Ali, M.; Javed, A.R.; Srivastava, G.; Gadekallu, T.R.; Jalil, Z. Email Classification and Forensics Analysis using Machine Learning. In Proceedings of the 2021 IEEE SmartWorld, Ubiquitous Intelligence & Computing, Advanced & Trusted Computing, Scalable Computing & Communications, Internet of People and Smart City Innovation (SmartWorld/SCALCOM/UIC/ATC/IOP/SCI), Virtual, 18–21 October 2021; pp. 630–635. [Google Scholar] [CrossRef]
  5. Herold, M.; Goes, F.; Nopp, S.; Bauer, P.; Thompson, C.; Meyer, T. Machine learning in men’s professional football: Current applications and future directions for improving attacking play. Int. J. Sports Sci. Coach. 2019, 14, 798–817. [Google Scholar] [CrossRef]
  6. Cornman, A.; Spellman, G.; Wright, D. Machine Learning for Professional Tennis Match Prediction and Betting; Working Paper; Stanford University: Stanford, CA, USA, 2017. [Google Scholar]
  7. Miljković, D.; Gajić, L.; Kovačević, A.; Konjović, Z. The use of data mining for basketball matches outcomes prediction. In Proceedings of the IEEE 8th International Symposium on Intelligent and Informatics, Subotica, Serbia, 10–11 September 2010; pp. 309–312. [Google Scholar] [CrossRef]
  8. Bunker, R.P.; Thabtah, F. A machine learning framework for sport result prediction. Appl. Comput. Inform. 2019, 15, 27–33. [Google Scholar] [CrossRef]
  9. Gaming Market Size, Share & Growth|Research Report [2028]. Available online: https://www.fortunebusinessinsights.com/gaming-market-105730 (accessed on 23 May 2022).
  10. Sibley, A. Predicting Win Rates in Competitive OverwatchTM; Louisiana State University: Baton Rouge, LA, USA, 2019. [Google Scholar]
  11. League of Legends Live Player Count and Statistics. Available online: https://activeplayer.io/league-of-legends/ (accessed on 27 October 2022).
  12. League of Legends—Statistics & Facts|Statista. Available online: https://www.statista.com/topics/4266/league-of-legends/#dossierKeyfigures (accessed on 23 May 2022).
  13. Riot Developer Portal. Available online: https://developer.riotgames.com/terms#definitions (accessed on 20 May 2022).
  14. Caino, P.C.G.; Resett, S. Toxic Behavior and Tilt as Predictors of Mental Toughness in League of Legends Players of Argentina. In Communications in Computer and Information Science; CCIS: Cham, Switzerland, 2024; Volume 1958, pp. 464–468. [Google Scholar] [CrossRef]
  15. Jeong, I.; Kudo, K.; Kaneko, N.; Nakazawa, K. Esports experts have a wide gaze distribution and short gaze fixation duration: A focus on League of Legends players. PLoS ONE 2024, 19, e0288770. [Google Scholar] [CrossRef] [PubMed]
  16. Fuentes, R. A Qualitative Examination of Tilt in League of Legends Esports Players. Master’s Thesis, Högskolan i Halmstad, Halmstad, Sweden, 2021. [Google Scholar]
  17. Do, T.D.; Wang, S.I.; Yu, D.S.; Mcmillian, M.G.; Mcmahan, R.P.; Wang, I. Using Machine Learning to Predict Game Outcomes Based on Player-Champion Experience in League of Legends. In Proceedings of the 16th International Conference on the Foundations of Digital Games (FDG) 2021, Montreal, QC, Canada, 3–6 August 2021. [Google Scholar] [CrossRef]
  18. Eaton, J.A.; Mendonça, D.J.; Sangster, M.-D.D. Attack, Damage and Carry: Role Familiarity and Team Performance in League of Legends. In Proceedings of the Human Factors and Ergonomics Society Annual Meeting, Philadelphia, PA, USA, 1–5 October 2018; Volume 1, pp. 130–134. [Google Scholar] [CrossRef]
  19. Maymin, P.Z. Smart kills and worthless deaths: eSports analytics for League of Legends. J. Quant. Anal. Sports 2020, 17, 11–27. [Google Scholar] [CrossRef]
  20. Birant, K.U. Multi-view rank-based random forest: A new algorithm for prediction in eSports. Expert Syst. 2021, 39, e12857. [Google Scholar] [CrossRef]
  21. Liang, M. Research on Prediction of the Game Winner Based on Artificial Intelligence Methods. In Proceedings of the 5th International Conference on Advances in Image Processing, Chengdu, China, 12–14 November 2021; pp. 97–102. [Google Scholar] [CrossRef]
  22. League of Legends—1.000.000+ Master+ 1v1 Matchup|Kaggle. Available online: https://www.kaggle.com/datasets/jasperan/league-of-legends-1v1-matchups-results (accessed on 20 May 2022).
  23. Laurel, K.E.Y.; Gutierrez, A.N.R.; Tan, K.A.S.; Baldovino, R.G. Using Multiple AI Classification Models to Predict the Winner of a League of Legends (LoL) Game Based on its First 10-Minutes of Gameplay. In Proceedings of the 2023 International Conference on Consumer Electronics—Taiwan (ICCE-Taiwan), Pingtung, Taiwan, 17–19 July 2023; pp. 693–694. [Google Scholar] [CrossRef]
  24. Lin, L. League of Legends Match Outcome Prediction; Computer Science Department, Stanford University: Stanford, CA, USA, 2016. [Google Scholar]
  25. Junior, J.; Campelo, C.E. League of Legends: Real-Time Result Prediction. arXiv 2023, arXiv:2309.02449. [Google Scholar]
  26. Kou, Y.; Li, Y.; Gui, X.; Suzuki-Gill, E. Playing with streakiness in online games: How players perceive and react to winning and losing streaks in league of legends. In Proceedings of the 2018 CHI Conference on Human Factors in Computing Systems, Montreal, QC, Canada, 21–26 April 2018; pp. 1–14. [Google Scholar] [CrossRef]
  27. Dubois, L.-E.; Weststar, J. Games-as-a-service: Conflicted identities on the new front-line of video game development. New Media Soc. 2021, 24, 2332–2353. [Google Scholar] [CrossRef]
  28. Demediuk, S.; Murrin, A.; Bulger, D.; Hitchens, M.; Drachen, A.; Raffe, W.L.; Tamassia, M. Player retention in league of legends: A study using survival analysis. In Proceedings of the Australasian Computer Science Week Multiconference, Brisbane, QLD, Australia, 29 January–2 February 2018; pp. 1–9. [Google Scholar] [CrossRef]
  29. Figueroa, R.L.; Zeng-Treitler, Q.; Kandula, S.; Ngo, L.H. Predicting sample size required for classification performance. BMC Med. Inform. Decis. Mak. 2012, 12, 8. [Google Scholar] [CrossRef]
  30. Kica, A.; La Manna, A.; O’Donnell, L.; Paolillo, T.; Claypool, M. Nerfs, Buffs and Bugs—Analysis of the Impact of Patching on League of Legends. In Proceedings of the 2016 International Conference on Collaboration Technologies and Systems (CTS), Orlando, FL, USA, 31 October–4 November 2016; pp. 128–135. [Google Scholar]
  31. Do, T.D.; Yu, D.S.; Anwer, S.; Wang, S.I. Using Collaborative Filtering to Recommend Champions in League of Legends. In Proceedings of the 2020 IEEE Conference on Games (CoG), Osaka, Japan, 24–27 August 2020; pp. 650–653. [Google Scholar] [CrossRef]
  32. Mora-Cantallops, M.; Sicilia, M. Team efficiency and network structure: The case of professional League of Legends. Soc. Netw. 2019, 58, 105–115. [Google Scholar] [CrossRef]
  33. Jonquière, É. Investigating the Role of Esport on the Free to Play Business Model: An Analysis of League of Legends Economic Success. Master’s Thesis, ISCTE-Instituto Universitario de Lisboa, Lisboa, Portugal, 2020. [Google Scholar]
  34. Sabtan, B.; Cao, S.; Paul, N. Current practice and challenges in coaching Esports players: An interview study with league of legends professional team coaches. Entertain. Comput. 2022, 42, 100481. [Google Scholar] [CrossRef]
  35. Kou, Y.; Gui, X.; Kow, Y.M. Ranking Practices and Distinction in League of Legends. In Proceedings of the 2016 Annual Symposium on Computer-Human Interaction in Play (CHI PLAY 2016), Austin, TX, USA, 16–19 October 2016; pp. 4–9. [Google Scholar]
  36. Monge, C.K.; O’brien, T.C. Effects of individual toxic behavior on team performance in League of Legends. Media Psychol. 2021, 25, 82–105. [Google Scholar] [CrossRef]
  37. Kho, L.C.; Kasihmuddin, M.S.M.; Mansor, M.A.; Sathasivam, S. Science & Technology Logic Mining in League of Legends. Pertanika J. Sci. Technol. 2020, 28, 211–225. [Google Scholar]
  38. Hitar-García, J.A.; Morán-Fernández, L.; Bolón-Canedo, V. Machine Learning Methods for Predicting League of Legends Game Outcome. IEEE Trans. Games 2022, 15, 171–181. [Google Scholar] [CrossRef]
  39. Costa, L.M.; Mantovani, R.G.; Souza, F.C.M.; Xexeo, G. Feature Analysis to League of Legends Victory Prediction on the Picks and Bans Phase. In Proceedings of the 2021 IEEE Conference on Games (CoG), Copenhagen, Denmark, 17–20 August 2021; pp. 1–5. [Google Scholar] [CrossRef]
  40. Luis, A.; Silva, C.; Pappa, G.L.; Chaimowicz, L. Continuous Outcome Prediction of League of Legends Competitive Matches Using Recurrent Neural Networks. In Proceedings of the SBC—Proceedings of SBGames 2018, Foz do Iguaçu, Brazil, 29 October–1 November 2018. [Google Scholar]
  41. Ani, R.; Harikumar, V.; Devan, A.K.; Deepa, O. Victory prediction in League of Legends using Feature Selection and Ensemble methods. In Proceedings of the 2019 International Conference on Intelligent Computing and Control Systems (ICCS), Madurai, India, 15–17 May 2019; pp. 74–77. [Google Scholar] [CrossRef]
  42. Li, Q.; Xu, P.; Chan, Y.Y.; Wang, Y.; Wang, Z.; Qu, H.; Ma, X. A Visual Analytics Approach for Understanding Reasons behind Snowballing and Comeback in MOBA Games. IEEE Trans. Vis. Comput. Graph. 2016, 23, 211–220. [Google Scholar] [CrossRef]
  43. Peabody, D. Detecting Metagame Shifts in League of Legends Using Unsupervised Learning; University of New Orleans: New Orleans, LA, USA, 2018. [Google Scholar]
  44. Jadowski, R.; Cunningham, S. Statistical Models for Predicting Results in Professional League of Legends. In Lecture Notes of the Institute for Computer Sciences, Social-Informatics and Telecommunications Engineering (LNICST); Springer International Publishing: Cham, Switzerland, 2022; Volume 422, pp. 138–152. [Google Scholar] [CrossRef]
  45. Donaldson, S. Mechanics and Metagame. Games Cult. 2015, 12, 426–444. [Google Scholar] [CrossRef]
  46. Kim, Y.J.; Engel, D.; Woolley, A.W.; Lin, J.Y.T.; McArthur, N.; Malone, T.W. What Makes a Strong Team? Using Collective Intelligence to Predict Team Performance in League of Legends. In Proceedings of the 2017 ACM Conference on Computer Supported Cooperative Work and Social Computing, Portland, OR, USA, 25 February–1 March 2017. [Google Scholar] [CrossRef]
  47. Leavitt, A.; Keegan, B.C.; Clark, J. Ping to win? Nonverbal communication and team performance in competitive online multiplayer games. In Proceedings of the 2016 CHI Conference on Human Factors in Computing Systems, San Jose, CA, USA, 7–12 May 2016; pp. 4337–4350. [Google Scholar] [CrossRef]
  48. Ong, H.Y.; Deolalikar, S.; Peng, M.V. Player Behavior and Optimal Team Composition for Online Multiplayer Games. arXiv 2015, arXiv:1503.02230. [Google Scholar]
  49. Zhang, X.; Gu, X.; Niu, B.; Feng, Y.Y. Investigating the Impact of Champion Features and Player Information on Champion Usage in League of Legends. In Proceedings of the 2017 International Conference on Information Technology—ICIT 2017, Singapore, 27–29 December 2017. [Google Scholar] [CrossRef]
  50. Cruz, A.C.S.; De, T.; Filho, M.; Malheiros, Y. League of Legends: An Application of Classification Algorithms to Verify the Prediction Importance of Main In-Game Variables. In Proceedings of the SB Games 2021, Gramado, Brazil, 18–21 October 2021. [Google Scholar]
  51. Chu, X.; Ilyas, I.F.; Krishnan, S.; Wang, J. Data cleaning: Overview and emerging challenges. In Proceedings of the ACM SIGMOD International Conference on Management of Data, San Francisco, CA, USA, 26 June–1 July 2016; Association for Computing Machinery: New York, NY, USA, 2016; pp. 2201–2206. [Google Scholar] [CrossRef]
  52. Somasundaram, R.; Nedunchezhian, R. Evaluation of Three Simple Imputation Methods for Enhancing Preprocessing of Data with Missing Values. Int. J. Comput. Appl. 2011, 21, 14–19. [Google Scholar] [CrossRef]
  53. League of Legends Rank Distribution in Solo Queue—November 2022|Esports Tales. Available online: https://www.esportstales.com/league-of-legends/rank-distribution-percentage-of-players-by-tier (accessed on 13 December 2022).
  54. Zhang, S.; Sadaoui, S.; Mouhoub, M. An Empirical Analysis of Imbalanced Data Classification. Comput. Inf. Sci. 2014, 8, 151. [Google Scholar] [CrossRef]
  55. Gaina, R.; Nordmoen, C. League of Legends: A Study of Early Game Impact; School of Electronic Engineering and Computer Science, Queen Mary University of London: London, UK, 2018. [Google Scholar]
  56. Sperandei, S. Understanding logistic regression analysis. Biochem. Med. 2014, 24, 12–18. [Google Scholar] [CrossRef] [PubMed]
  57. Albert, A.; Anderson, J.A. On the existence of maximum likelihood estimates in logistic regression models. Biometrika 1984, 71, 1–10. [Google Scholar] [CrossRef]
  58. Quinlan, J.R. Induction of decision trees. Mach. Learn. 1986, 1, 81–106. [Google Scholar] [CrossRef]
  59. Hssina, B.; Merbouha, A.; Ezzikouri, H.; Erritali, M. A comparative study of decision tree ID3 and C4.5. Int. J. Adv. Comput. Sci. Appl. 2014, 4, 13–19. [Google Scholar] [CrossRef]
  60. Cohen, P.R.; Jensen, D. Overfitting explained. In Sixth International Workshop on Artificial Intelligence and Statistics. Mach. Learn. Res. 1997, 115–122. [Google Scholar]
  61. Breiman, L. Random forests. Mach. Learn. 2001, 45, 5–32. [Google Scholar] [CrossRef]
  62. Rokach, L. Decision forest: Twenty years of research. Inf. Fusion 2016, 27, 111–125. [Google Scholar] [CrossRef]
  63. Armano, G.; Tamponi, E. Building forests of local trees. Pattern Recognit. 2018, 76, 380–390. [Google Scholar] [CrossRef]
  64. Lindgren, T. Random Rule Sets—Combining Random Covering with the Random Subspace Method. Int. J. Mach. Learn. Comput. 2018, 8, 8–13. [Google Scholar] [CrossRef]
  65. Loh, W.-Y.; Chen, C.-W.; Zheng, W. Extrapolation errors in linear model trees. ACM Trans. Knowl. Discov. Data 2007, 1, 6-es. [Google Scholar] [CrossRef]
  66. Fox, E.W.; Hill, R.A.; Leibowitz, S.G.; Olsen, A.R.; Thornbrugh, D.J.; Weber, M.H. Assessing the accuracy and stability of variable selection methods for random forest modeling in ecology. Environ. Monit. Assess. 2017, 189, 316. [Google Scholar] [CrossRef]
  67. Kohavi, R. A Study of Cross-Validation and Bootstrap for Accuracy Estimation and Model Selection; Morgan Kaufman Publishing: Burlington, MA, USA, 1995. [Google Scholar]
  68. Chen, T.; Guestrin, C. XGBoost: A Scalable Tree Boosting System. In Proceedings of the ACM SIGKDD International Conference on Knowledge Discovery and Data Mining, San Francisco, CA, USA, 13–17 August 2016; pp. 785–794. [Google Scholar] [CrossRef]
  69. Tidymodels. Available online: https://www.tidymodels.org/ (accessed on 13 December 2022).
  70. Wang, S.; Peng, J.; Liu, W. An ℓ2/ℓ1 regularization framework for diverse learning tasks. Signal Process. 2015, 109, 206–211. [Google Scholar] [CrossRef]
  71. Eggensperger, K.; Feurer, M.; Hutter, F.; Berstra, J.; Snoek, J.; Hoos, H.; Leyton-Brown, K. Towards an Empirical Foundation for Assessing Bayesian Optimization of Hyperparameters. NIPS Workshop Bayesian Optim. Theory Pract. 2013, 10, 1–5. [Google Scholar]
  72. Neunhoeffer, M.; Sternberg, S. How Cross-Validation Can Go Wrong and What to Do About It. Political Anal. 2018, 27, 101–106. [Google Scholar] [CrossRef]
  73. Mentch, L.; Hooker, G. Quantifying Uncertainty in Random Forests via Confidence Intervals and Hypothesis Tests. J. Mach. Learn. Res. 2014, 17, 1–41. [Google Scholar]
  74. Archer, K.J.; Kimes, R.V. Empirical characterization of random forest variable importance measures. Comput. Stat. Data Anal. 2008, 52, 2249–2260. [Google Scholar] [CrossRef]
  75. Thiese, M.S.; Ronna, B.; Ott, U. P value interpretations and considerations. J. Thorac. Dis. 2016, 8, E928–E931. [Google Scholar] [CrossRef]
  76. Wu, M.; Lee, J.S.; Steinkuehler, C. Understanding Tilt in Esports: A Study on Young League of Legends Players. In Proceedings of the 2021 CHI Conference on Human Factors in Computing Systems, Virtual, 8–13 May 2021; pp. 1–9. [Google Scholar] [CrossRef]
  77. Shen, Q. A machine learning approach to predict the result of League of Legends. In Proceedings of the 2022 International Conference on Machine Learning and Knowledge Engineering (MLKE), Guilin, China, 25–27 February 2022; pp. 38–45. [Google Scholar] [CrossRef]
  78. Omar, H.I.; Prayogo, M.; Muliawan, V.; Gunawan, A.A.S.; Setiawan, K.E. Finding Feature Importance in Optimized Classification Model: League of Legends Ranked Matches. In Proceedings of the 2024 IEEE International Conference on Artificial Intelligence and Mechatronics Systems (AIMS), Bandung, Indonesia, 22–23 February 2024; pp. 1–5. [Google Scholar] [CrossRef]
  79. Cui, H. Research on winning rate prediction of e-sport League of Legends based on machine learning. In Proceedings of the International Conference on Optics, Electronics, and Communication Engineering (OECE 2024), Wuhan, China, 12 November 2024; Volume 133953E. [Google Scholar] [CrossRef]
  80. Cordova, C.J.A.; Villaceran, C.V.A.; Peña, C.F. Predicting League of Legends Match Outcomes Through Machine Learning Models Using Past Match Player Performance. In Proceedings of the 2024 IEEE International Conference on Computing (ICOCO), Kuala Lumpur, Malaysia, 12–14 December 2024; pp. 522–527. [Google Scholar] [CrossRef]
  81. Eaton, J.A.; Sangster, M.-D.D.; Renaud, M.; Mendonca, D.J.; Gray, W.D. Carrying the Team: The Importance of One Player’s Survival for Team Success in League of Legends. In Proceedings of the Human Factors and Ergonomics Society Annual Meeting; SAGE Publications: Los Angeles, CA, USA, 2017; pp. 272–276. [Google Scholar] [CrossRef]
  82. Bahrololloomi, F.; Klonowski, F.; Sauer, S.; Horst, R.; Dörner, R. E-Sports Player Performance Metrics for Predicting the Outcome of League of Legends Matches Considering Player Roles. SN Comput. Sci. 2023, 4, 238. [Google Scholar] [CrossRef]
  83. Asgarkhani, N.; Kazemi, F.; Jankowski, R. Machine learning-based prediction of residual drift and seismic risk assessment of steel moment-resisting frames considering soil-structure interaction. Comput. Struct. 2023, 289, 107181. [Google Scholar] [CrossRef]
Figure 1. A comprehensive framework for predicting winning teams in League of Legends utilizing machine learning techniques.
Applsci 15 05241 g001
Figure 2. Relational model of the Riot API endpoints used in the study.
Applsci 15 05241 g002
Figure 3. Sampling logic diagram (the yellow text specifies the API endpoints used).
Applsci 15 05241 g003
Figure 4. (a) QQ plot for non-missing streak data. (b) Collinearity analysis of raw features. (c) Collinearity plot of the final aggregated dataset.
Applsci 15 05241 g004aApplsci 15 05241 g004b
Figure 5. The confusion matrices show the performance of all the models in this study.
Applsci 15 05241 g005
Figure 6. ROC curves for each model.
Applsci 15 05241 g006
Figure 7. Comparison of accuracy and AUC for each model.
Applsci 15 05241 g007
Figure 8. Variable importance by predictor type—scaled to 100 maximum.
Applsci 15 05241 g008
Figure 9. The base LR model was compared with the pre-game (PG) only LR and RF models.
Applsci 15 05241 g009
Figure 10. The base LR model was compared with the in-game (IG) only LR and RF models.
Applsci 15 05241 g010
Figure 11. Feature importance (based on impurity reduction) from the XGBoost model.
Applsci 15 05241 g011
Figure 12. (a) Sensitivity analysis of mean vs. median imputed streak. (b) Comparison of the models with the streak removed.
Applsci 15 05241 g012
Figure 13. Performance comparison of this study combining pre-game/in-game models with existing methods from Ani [41], Do [17], Lin [24], Shen [77], Omar [78], Cui [79].
Applsci 15 05241 g013
Table 1. Sample representativeness.
RankRecords%
Iron21187%
Bronze550518%
Silver579719%
Gold556918%
Platinum564318%
Diamond490516%
Master9803%
Grandmaster170%
Table 2. Class balance.
Team 1 WonRecords%
False15,30050.1%
True15,24049.9%
Table 3. The final engineered feature set comprises seven pre-game predictors, eight in-game predictors, and a binary label.
Pre-Game PredictorsIn-Game Predictors
Average difference between teams in:Whether Team 1 eliminated an opponent first
Total games playedWhether Team 1 secured the first objective of the game
RankAverage difference between teams in:
Experience on selected characterDifference in average gold acquired at 10 min
Total experience across all charactersDifference in average gold acquired at 15 min
Number of characters played across all gamesDifference in average damage taken by 10 min
Mean experience across all charactersDifference in average damage taken by 15 min
Current win/loss streakDifference in average damage dealt by 10 min
Difference in average damage dealt by 15 min
Table 4. Logistic regression parameter statistics.
PredictorOdds Ratiop Value
rankDiff0.5132.76 × 10−25
streakDiff0.8801.95 × 10−2
goldAtFifteenDiff0.1762.79 × 10−28
Disclaimer/Publisher’s Note: The statements, opinions and data contained in all publications are solely those of the individual author(s) and contributor(s) and not of MDPI and/or the editor(s). MDPI and/or the editor(s) disclaim responsibility for any injury to people or property resulting from any ideas, methods, instructions or products referred to in the content.

