Abstract
Background: Accurate estrus identification in dairy cows is essential for enhancing reproductive efficiency and economic performance. The dispersed nature of estrus data and individual cow differences pose significant challenges for accurate identification. Methods: This study gathered cow estrus data from 812 literature sources using Python 3.9 crawler technology. The data were then preprocessed using CiteSpace 6.4. We constructed a knowledge graph depicting physiological, behavioral, and appearance changes during estrus through entity and relationship extraction. To uncover potential relationships within the graph, we applied and compared two association rule algorithms: FP-Growth and Apriori. We utilized Boolean functions derived from association rule learning to validate the ability of the rules to identify normal estrus. Additionally, we employed an enhanced Iforest-OCSVM anomaly detection model to assess the performance of the association rules in detecting abnormal estrus. Furthermore, we optimized the Incremental FP-Growth Algorithm for Dynamic Knowledge Expansion. Results: Based on the initial knowledge graph with 86 entities and 9 relationships, mining added 17 new strong association relationships marked by ‘with’, enhancing its completeness and providing deeper insights into estrus behaviors and physiological changes. Furthermore, these strong association rules exhibited notable effectiveness in both normal and abnormal estrus detection, validating their robustness in practical applications. The algorithm’s optimization bolstered its scalability, making it more adaptable to future data expansions and complex knowledge integrations. Conclusions: By constructing a knowledge graph that integrates physiological, behavioral, and appearance changes during estrus, we established a comprehensive framework for understanding cow estrus. Association rule mining, particularly with the FP-Growth algorithm, added 17 new strong association relationships to the graph, enriching its content and offering deeper insights into estrus behaviors and physiological changes. The strong association rules derived from FP-Growth demonstrated notable effectiveness in both normal and abnormal estrus detection, validating their robustness and practical utility in enhancing estrus identification accuracy, and providing a robust foundation for future multi-dimensional estrus research.
1. Introduction
Accurate detection of cow estrus and timely breeding are crucial for improving the reproductive rate of cows and herd productivity [1]. Cow estrus is characterized by multi-dimensional changes, including behavioral, appearance, and physiological aspects. Behaviorally, cows may exhibit increased activity, restlessness, and mounting behavior [2]. Appearance changes can involve mucous membrane congestion and vulva swelling [3]. Physiologically, there might be alterations in reproductive tract status and hormone levels [4]. These examples are not exhaustive; other signs may also be present. Traditional methods, such as using pedometers and observing mounting behavior, have limitations in accuracy and efficiency [5]. Moreover, estrus in cows is influenced by various factors, such as milk production, which adds to the complexity of estrus detection [6]. To address these challenges, automated systems using sensors (e.g., accelerometers, pedometers, and thermometers [7]) have been increasingly used to gather and interpret animal data [8]. These systems can provide more accurate and comprehensive information on cow estrus.
In the booming era of smart agriculture, multi-source data fusion and intelligent analysis technologies offer innovative solutions for enhancing agricultural practices. Knowledge graphs have emerged as a powerful tool for organizing and managing multidimensional data related to cow estrus, encompassing behavioral, physiological, and environmental information [9]. Meanwhile, machine learning algorithms, particularly unsupervised learning methods like Isolation Forest (Iforest) and One-Class Support Vector Machine (OC-SVM), demonstrate significant advantages in handling complex data patterns and detecting anomalies [10].
This study integrates multidimensional estrus features through a knowledge graph [11] and uncovers hidden relationships among entities using the FP-Growth association rule mining method, thereby enriching the knowledge graph and boosting its predictive power [12]. Building on this foundation, the study further validates the effectiveness of association rules in normal and abnormal estrus detection using Boolean functions and the Iforest-OC-SVM model. The results highlight the practical value of association rules in enhancing decision-making for estrus management.
In this study, we gathered knowledge from the domestic and international literature on cow estrus using web crawler technology. The entities required for the knowledge graph of cow estrus, namely, behavioral changes, appearance changes, and physiological changes, were filtered and refined. Then, the relationships between entities were established based on estrus data to initially construct the knowledge graph. To further improve the accuracy of estrus identification, we used the FP-Growth algorithm to mine strong association rules from the knowledge graph [13]. The FP-Growth algorithm is more efficient and scalable than the Apriori algorithm, as it avoids the need for generating candidate itemsets and reduces the number of database scans [14]. The strong association rules mined by the FP-Growth algorithm were then used to supplement the knowledge graph, enhancing its ability to accurately identify estrus. Moreover, by employing the FP-Growth association rule mining method, we revealed implicit relationships among entities, thereby enriching the knowledge graph and enhancing its predictive capabilities. Specifically, we optimized the algorithm through the development of an Incremental FP-Growth Algorithm for Dynamic Knowledge Expansion, which significantly improved its scalability and adaptability for future data expansions [9]. To validate the effectiveness of the strong association rules mined by the FP-Growth algorithm, two sets of experiments were conducted: one based on Boolean functions derived from association rule learning for normal estrus verification, and another using an Iforest-OCSVM model with association rule-based feature weighting for abnormal estrus detection [15].
The results indicated that incorporating association rules significantly enhanced the knowledge graph’s ability to uncover hidden relationships and improved the accuracy of estrus identification [16]. Specifically, the Boolean functions based on strong association rules demonstrated a notable reduction in false positives and negatives compared to the initial knowledge graph. Meanwhile, the Iforest-OCSVM model with feature weighting showed superior performance in detecting abnormal estrus, highlighting the practical value of association rules in both normal and abnormal estrus scenarios [17]. This comprehensive approach not only enriches the knowledge graph but also provides a robust framework for real-world applications in estrus management.
To further substantiate these findings, we conducted comparative experiments. These included evaluations of the Iforest-OCSVM model without feature weighting, the Iforest-OCSVM model with association-rule-based feature weighting excluding the lift metric, and the Iforest-OCSVM model with CNN-based feature extraction. These additional experiments were designed to provide a more nuanced understanding of how the different feature weighting and extraction strategies impacted the model’s performance across various metrics such as accuracy, precision, recall, and F1-Score. The comparative analysis across these methods allowed for a thorough examination of the model’s capabilities, reinforcing the benefits observed with the integration of association-rule-based feature weighting and advanced feature extraction techniques. The successful outcomes of these experiments underscore the model’s enhanced predictive capabilities and its potential for practical application in estrus management.
2. Knowledge Sources and Processing
The construction of the knowledge graph of cow estrus was an iterative process that began with the acquisition of structured, semi-structured, and unstructured data through estrus data gathering. Subsequently, data cleaning and preprocessing were performed to ensure data quality.
2.1. Knowledge Sources
Knowledge acquisition is the first and foremost condition for constructing a knowledge graph. The China National Knowledge Infrastructure (CNKI) database, chosen for its comprehensive and authoritative coverage of academic fields, offers extensive, high-quality, and peer-reviewed literature in both Chinese and English. With a user-friendly interface and features like citation analysis and visualization tools, the CNKI provides unique insights into local agricultural contexts, making it an invaluable resource for cow estrus research. Therefore, in this study, we selected the CNKI as our primary data source, to ensure the accuracy and comprehensiveness of the literature review. Moreover, the fact that the CNKI’s Chinese and English literature are cited on other platforms and websites further demonstrates the authority of its data.
In order to efficiently acquire and analyze academic literature related to cow estrus, this study developed and deployed a set of crawler programs, which were specifically used to extract Chinese and English literature with the keyword ’cow estrus’ from the China Knowledge Network (CNKI). This study focused on literature published from January 2018 to September 2024, to ensure comprehensive coverage of the latest scientific research. Through a systematic search strategy, we obtained 812 documents in English and Chinese related to cow estrus from CNKI. This collection of documents marked the successful completion of the data gathering phase and provided rich primary materials for the subsequent research, such as automated estrus identification technology, aiming to comprehensively cover the relevant research papers within this time period. Through a systematic search strategy, we obtained a total of 812 documents from the CNKI in English and Chinese related to cow estrus. The acquisition of these documents signified the success of the data gathering phase, and provided a wealth of primary materials for our subsequent research.
2.2. Data De-Duplication
Low-quality data can compromise accuracy and cause incorrect predictions. In cow estrus research, where data are limited, foundational literature is often cited across studies, and identical datasets may be reused. This highlights the need for data enhancement. Data de-duplication is essential for solving these issues. It cleans data through the removal of duplicates, precise filtering, integration, transformation, and generalization, improving knowledge extraction [18]. In this study, literature data were meticulously processed. Duplicates were removed; data were accurately filtered; and sources from various times, sources, and elements were included to guarantee the accuracy of the subsequent analysis.
CiteSpace is a scientific graphing knowledge visualization tool. It was developed in 2004 based on co-citation theory and pathfinder network algorithms. The software performs multivariate, time-sharing, and dynamic citation analysis of bibliographies in specific fields, in order to explore the critical paths and knowledge inflection points in the evolution of subject areas. Finally, visualization techniques were used to graph the knowledge areas reflecting the knowledge evolution process and development frontiers of the discipline [19]. The screening of literature for data processing is shown in Figure 1.
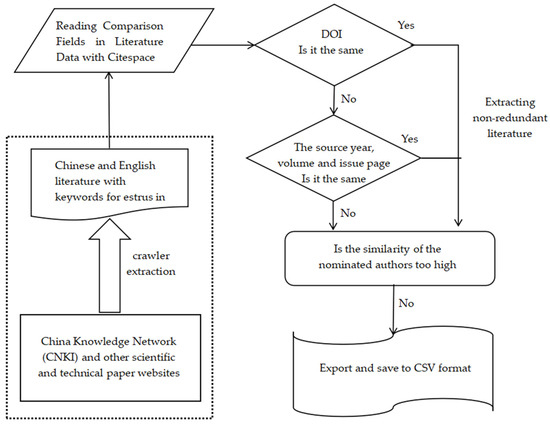
Figure 1.
Screening and extraction of literature.
In this study, a rigorous and systematic approach was employed to screen literature related to cow estrus, ensuring the accuracy and relevance of the selected sources. Initially, relevant SCI and EI literature data were retrieved from the China Knowledge Network (CNKI). By comparing the Digital Object Identifiers (DOIs) of these literature works, initial potential duplicates were identified. If the DOIs were identical, further verification was conducted to check whether the source year, volume, and issue pages of the documents were the same, to confirm their duplicity. Documents with matching source year, volume, issue, and page information were deemed duplicates and subsequently excluded from the study.
For non-duplicate literature, an in-depth analysis of authorship information was performed to assess the similarity of authors’ names. This step was crucial in excluding literature that might be subject to authorship confusion or misattribution. Finally, the screened high-quality, non-duplicated literature was exported and saved in CSV format for subsequent data analysis and research. This systematic screening process ensured that the literature base of our study was solid and reliable, providing accurate literature support for estrus research in cows.
2.3. Data Screening
In our review of the literature related to cow estrus, we found that there is relatively little literature that directly describes the behavioral, appearance, and physiological changes that occur during cow estrus. Most studies tend to use estrus as a starting point for exploring other topics, such as the health management of cows and reproductive efficiency improvement. In view of this, in order to gain a deeper understanding of the specific characteristics of cow estrus, we used content analysis to systematically review and filter relevant literature.
Content analysis is a research method used to identify patterns of recorded communication, which mainly consists of two methods, manual coding and semi-automatic analysis, to extract and analyze knowledge [20]. Since cow estrus data are more complex and decentralized compared to other estrus data, this study mainly used a semi-automatic coding method to screen the data. Conducting content analysis involves the systematic gathering of data from a set of texts, which can be written, verbal, or visual, and the content analysis can be quantitative (focusing on counting and measuring) or qualitative (focusing on interpretation and understanding). In both types, words, themes, and concepts in a text can be categorized or ‘coded’ and then the results are analyzed [21].
In a content analysis of research related to cow estrus, this study established a manual coding scheme to define taxonomies of behavioral, appearance, and physiological changes and define relative subcategories, to organize and categorize data through a hierarchical coding system. We classified the changes observed in the literature into three main categories of behavioral, appearance, and physiological changes, respectively.
- Behavioral changes: This category was given code 1 and covers behavioral changes during cow estrus.
- Appearance change: This category was assigned code 2 and describes visible changes in the appearance of the cow.
- Physiological changes: This category was assigned code 3 and includes changes in the cow at the physiological level.
Each category was further subdivided into specific subcategories with unique coding, e.g., the subcategories of behavioral changes were locomotion, vocalization, feeding, and others (milk production, defecation, sidling, etc.), and the subcategories of appearance changes were subsequently coded for the entire selected literature, which detailed all types of characteristics of the cow in estrus. The specific coding rules are shown in Table 1.

Table 1.
Encoding and descriptions of cow estrus subtypes.
A total of 286 journal articles were identified from an initial gathering of 812 articles in English and Chinese, using keywords such as ‘behavior’, ‘appearance’, ‘physiology’, and ‘cattle’, along with related descriptions. Only articles with titles relevant to these topics were retained.
3. Graph Construction
Before the construction of the knowledge graph, the knowledge distribution was first analyzed in terms of frequency. Using the Python language to read the extracted estrus data file, each row represents an independent transaction, i.e., a specific cow estrus event, and each column represents a non-repeated estrus representation, totaling 286 estrus events. The frequency of estrus was counted and the results were ranked in descending order, as shown in Table 2, giving the top ten accompanying frequency for cow estrus. Among them, climbing span increase was the most frequent estrus phenomenon, with an occurrence probability of 0.30769.
Table 2.
Estrus phenotypes that ranked in the top ten frequency of occurrence in cows estrus.
Knowledge extraction is the core aspect of knowledge graph construction, which mainly involves the tasks of Named Entity Recognition (NER) and Relationship Extraction (RE), where semantic relationships are needed to describe the connections between entities in a knowledge graph. Using Named Entity Recognition and Relationship Extraction techniques, entities and relationships were extracted from the data to ensure the accuracy and consistency of entities through entity disambiguation and classification [22]. After knowledge fusion to eliminate data redundancy, the processed knowledge was finally stored in a graph database to form a knowledge graph of cow estrus.
3.1. Knowledge Graph
A knowledge graph is a structured representation of knowledge that captures entities and their semantic relationships. It integrates information from various sources into a unified framework, enabling efficient knowledge retrieval and analysis. In this study, the knowledge graph of cow estrus consisted of 86 entities and 9 relationships, representing physiological, behavioral, and appearance changes during estrus. Each piece of knowledge was represented as a triple, consisting of a subject, a predicate, and an object. For example, a triple might be (Increased activity, is a sign of, Estrus), indicating that increased activity is a sign of estrus in cows. This structure allowed us to represent complex relationships in a clear and standardized way.
By constructing this knowledge graph, we aimed to organize the fragmented knowledge related to cow estrus. It provides a comprehensive and structured platform for researchers to explore and analyze estrus behaviors and physiological changes. This integration facilitates a deeper understanding of the complex interactions between different aspects of cow estrus, supporting more effective research and management strategies.
3.2. Entity Extraction and Harmonization
Entity recognition refers to identifying specific entities within a statement. The main function of entity recognition in the context of cow estrus is to identify each entity within the statement, such as recognizing the entities ‘cow estrus’, ‘restless’, and ‘chirping’ from a sentence like ‘Cows in estrus often display restlessness and chirping behavior’. In this paper, entity extraction was primarily achieved through text cleaning, word segmentation, and the application of coding rules.
First, the central entity in the knowledge graph was ’normal estrus’, which was connected to three main categories of entities: behavioral changes, appearance changes, and physiological changes. The category of behavioral changes was further subdivided into locomotor behavior, vocal behavior, feeding behavior, and other behaviors, which reflect the behavior of the cow during estrus. The category of external changes included external features, uterine morphology, and vulvar changes, which relate to the physical posture and organ morphology of the cow during estrus. The physiological changes category covered changes in body temperature, hormonal changes, and other compounds, which are physiological processes occurring in the body of the cow during estrus.
After completing this series of operations, we organized this information into a uniform format and stored it in CSV files, which are ideal for data storage and exchange because of their flexibility and ease of use. In a CSV file, each row represents a phrase or concept, while the columns contain related attribute information such as the source of the phrase, its type, and potential connections to other concepts.
Inconsistent entities increase processing complexity because additional normalization steps are needed to handle these inconsistencies. Entity harmonization helps to improve the accuracy of entity recognition (NER). In named entity recognition, entity disambiguation and entity unification are key steps for improving the accuracy and reliability of NER. Entity disambiguation determines the exact meaning of an entity, while entity unification standardizes entity names to ensure that they match known entities, as shown in Table 3.
Table 3.
Names of entities before and after specification and harmonization.
We conducted a thorough review of the primary literature, identifying key terms and their various forms of expression under the guidance of veterinary experts. We then developed a set of standardized rules to graph these terms onto a unified set of terms. For example, the expressions ‘loud’ and ‘howling’ were standardized as ’howling,’ and the terms ’flushed vulva’ and ’dark red vulva’ were standardized to ’vulvar flushing’. In addition, for complex expressions such as ’anxiety’, ‘looking left and right’, and ’excitement’, we combined them into ’excitement and restlessness’. Through this normalization process, we successfully transformed the non-standardized expressions into structured terms, which greatly improved the consistency and comparability of the data. These structured data were then organized into CSV files, which provided a high-quality input for constructing the knowledge graph.
3.3. Relational Extraction
Relational extraction played a crucial role in constructing the knowledge graph for estrus research in cows, enabling us to reveal the intrinsic connections between different concepts in the text. Although we successfully extracted key entities from the text through entity recognition techniques, including the main categories of ’Behavioral changes’, ’Appearance changes’, and ’Physiological changes’, and their relationships such as ’Motor behavior’ and ’Internal signs’, we were also able to identify the relationships between the different concepts in the text and the relationships between the concepts in the text and their subcategories. However, these relationships needed to be further extracted, as shown in Figure 2, which shows the eight relationships of the three categories of key entities.
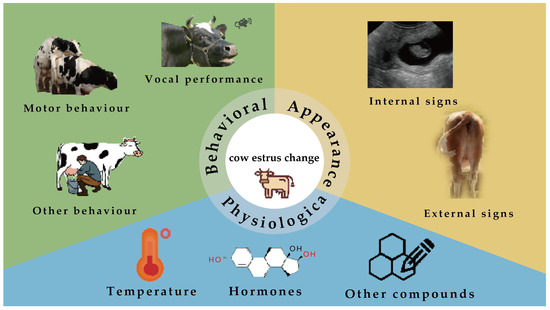
Figure 2.
Relationships of cow estrus entities.
However, the interactions and associations between these entities remained unclear. And the purpose of relationship extraction was to clarify the relationship between these entities. Figure 3 shows the 86 entities and 9 relationships in the cow estrus. Through relationship extraction, we could have a deeper understanding of how the various concepts related to cow estrus are interconnected, and the knowledge graph stores the knowledge in a structured form, which makes information retrieval more efficient.
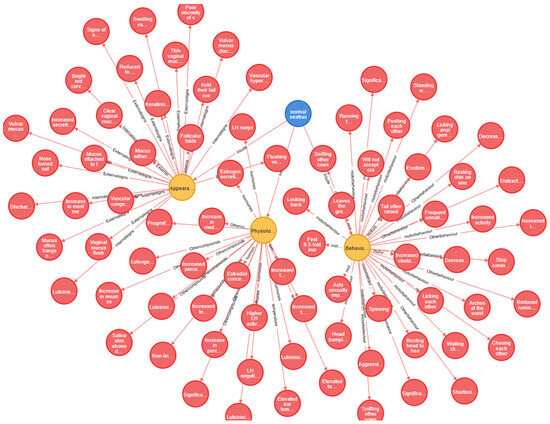
Figure 3.
Partial visualization of the knowledge graph of cow estrus.
3.4. Knowledge Graph Construction
In this study, the Cypher query language and Neo4j graph database were used to build and store the knowledge graphs. By using the LOAD CSV command of the Cypher language, we were able to efficiently import data from CSV files into the graph database, create entity nodes, and establish relationships between them. Through this series of data importing and relationship building steps, we successfully constructed a structured knowledge graph of cow estrus, which can accurately represent the complex relationships between types, variations, and behaviors.
The cow estrus knowledge graph comprises 83 entities divided into ‘change’, ‘behavior’, and ‘type’ categories, with ‘behavior’ being the most common (80 instances). The relationships within this knowledge graph are defined by nine types, which include ‘vocal performance’, ‘motor behavior’, ‘other behavior’, ‘external signs’, ‘temperature’, ‘hormones’, ‘other compounds’, ‘internal signs’, and ‘include’. Using the filtered and harmonized data and the defined relationships, we constructed a cow estrus knowledge graph, as shown in Figure 3.
4. Association Rule Mining
The knowledge graph could be used as a data source for association rule mining, while the association relationships mined by association rule algorithms could complement the knowledge graph and help validate and revise the existing entities and relationships. Since cow estrus is associated with multiple estrus changes, there may be complex interrelationships between these estrus relationships, and these relationships may not be obvious or captured in an initial knowledge graph. Mining association rules can help understand and cope with these complexities and uncertainties, complement and refine the implicit relationships in the knowledge graph of bovine estrus, increase the application value of the knowledge graph, and provide a deeper understanding and more effective strategies for managing bovine estrus.
4.1. Association Rules
Association rule learning is an unsupervised learning technique that examines the dependency of one dataset item on another and graphs it accordingly to make it more profitable. It tries to identify interesting relationships or associations between the variables of a dataset [23]. This is based on different rules to discover interesting relationships between variables in a database. Association rule mining is used to search for relationships between attributes in a transaction database. The overall process of rule discovery is very complex and involves pre-processing techniques, rule mining steps, and post-processing, where visualization is performed. Visualization of the discovered association rules is an essential step in the overall association rule mining pipeline that enhances the user’s understanding of the rule mining results [24].
In association rules, Support and Confidence are two very important concepts. They are used to measure the strength and reliability of a rule. Support indicates how often an itemset (e.g., a set of items in a transaction database) occurs in all transactions [25]. For itemsets X and Y, support is defined as
Support indicates the probability that a particular itemset occurs in all possible transactions. Minimum support (min support) is usually used as a threshold to filter itemsets, and itemsets with a support greater than or equal to the min support are called frequent itemsets, before they are considered to extract useful association rules. Confidence is the conditional probability that a transaction containing itemset X also contains itemset Y. Confidence is the probability that a transaction containing itemset X also contains itemset Y. For itemsets X and Y, the confidence level is defined as
A strong association rule usually has high support and high confidence, while in practical applications, the thresholds of support and confidence can be set according to the characteristics of specific problems and datasets. In this study, the research object was cow estrus, and since estrus behaviors in cows have various forms of expression and may not have a high incidence in the population, setting a lower threshold helped to capture more potential estrus behaviors, thus improving the sensitivity of the analysis. The magnitude of support depends on the specifics of the dataset, but in general, a support below 0.1 (or 10%) is considered low. In this study, support levels of 0.02, 0.03, and 0.05 were set for the algorithmic comparisons.
4.2. Comparison of Association Rule Algorithms
There are several mining algorithms for association rules. The most popular algorithm is Apriori, which is used to obtain association rules from large databases and for discovering knowledge [26]. The Apriori algorithm is based on the a priori nature of frequent itemsets, and adopts a bottom-up approach, i.e., starting from a single itemset and gradually increasing the size of the itemset until all frequent itemsets satisfying the minimum support threshold have been found. Starting from 1-frequent itemset, rule mining is performed by iterating through a layer-by-layer search to gradually find the higher-order frequent sets, and the flow of this algorithm is shown in Figure 4.
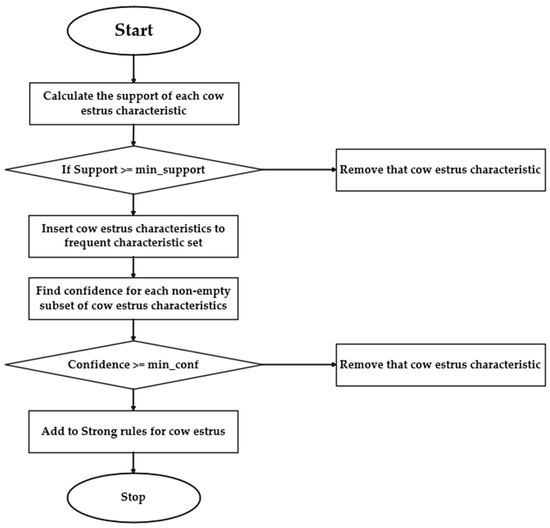
Figure 4.
Flowchart of Apriori algorithm based on cow estrus.
Figure 4 shows the flow of the Apriori algorithm for the characteristics of cow estrus. This algorithm calculates the support of each feature to form a frequent feature set with those exceeding min_support. Then, it assesses the subset confidence; those meeting the min_confidence become strong rules for estrus detection. However, the downside of the Apriori algorithm is its high cost, due to many candidate sets and database scans. To address this, the FP-Growth algorithm, using the FP-tree structure, was used to efficiently mine complete frequency patterns [27].
FP-tree is an extended prefix tree structure for storing significant and quantitative information related to frequency patterns, avoiding the drawbacks of Apriori-based approaches. It is based on a prefix tree representation of a given transaction database (called an FP-tree), which saves a lot of memory when storing transactions [28].
As shown in Figure 5, the first step was to go through the gathered data of cows in estrus and analyze each document to extract all the items in it (e.g., behavioral changes, appearance changes, physiological changes, etc.). A dataset D was created which contained a list of all the items of cows in estrus. The second step traversed the cow dataset D and calculated the number of occurrences of each item. According to the set minimum support threshold, the items with occurrence number greater than or equal to this threshold were retained, which constituted the frequent item set. The third step traversed the dataset D again, this time scanning each document according to the order of the frequent itemsets and constructing an FP-tree, which is a compact data structure for storing information about frequent itemsets. During the construction process, the items of each document were inserted into the FP-tree in the order of the most frequent itemsets.
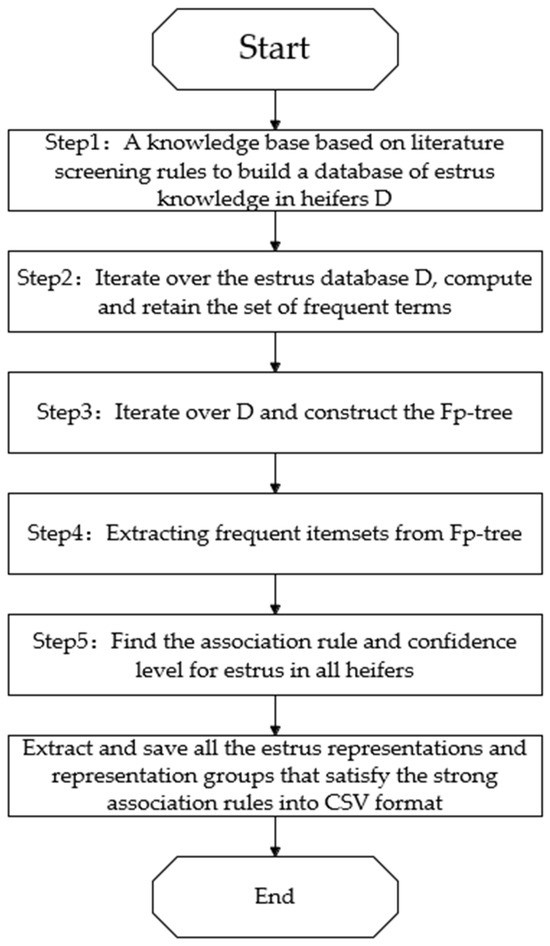
Figure 5.
Flowchart of the FP-Growth algorithm applied for predicting cow estrus.
In this study, we analyzed the performance of Apriori algorithm and FP-Growth algorithm in depth by comparing their ability to mine association rules at different support levels. The number of association rules mined by the two algorithms with different support levels is shown in Figure 6.
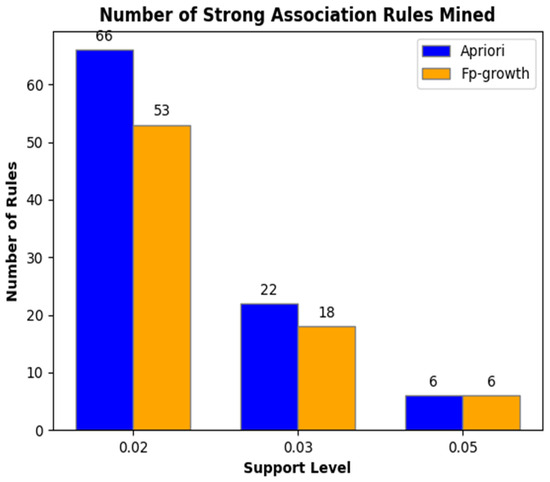
Figure 6.
Number of association rules mined by Apriori with FP-Growth for different support thresholds.
The experimental results revealed that at a support level of 0.02, the Apriori algorithm successfully mined 66 strong association rules, whereas the FP-Growth algorithm identified 53. As the support threshold was increased to 0.03, the number of rules mined by Apriori decreased to 22, and FP-Growth to 18. Further raising the support to 0.05 resulted in both algorithms extracting only six rules. This trend demonstrates that the number of rules mined by both algorithms diminished as the support threshold increased. Notably, FP-Growth demonstrated superior performance at lower support levels, while both algorithms exhibited comparable efficiency at higher support levels.
Given insights from veterinary expertise and the correlation with estrus behavior in cows, we chose to focus on a median support value for our analysis. As shown in Table 4, when the support was set to 0.03, the two association algorithms yielded a moderate number of strong association rules, which we believe offered a balanced perspective for our discussion. This approach allowed us to leverage rules that were neither overly abundant nor too sparse, ensuring that the derived insights were both meaningful and actionable for understanding estrus-related patterns.
Table 4.
Confidence and support for strong association rules.
In this study on association rule mining of estrus behavior in cows, we successfully identified a series of key behavioral patterns through the analysis of a large dataset. Our findings revealed that the combination of ‘Vulvar flushing’ with ‘Agitation’ and ‘Increased crawling’ exhibited the highest confidence level, indicating that these behaviors almost invariably occur concurrently during estrus. Additionally, the association between ‘Follicle initiation’ and the combined behaviors of ‘Vulvar swelling’ and ‘Mooing’ demonstrated a very high confidence level of 0.9. Furthermore, the triad of ‘Vulvar redness’, ‘Vulvar swelling’, and ‘Increased crawling’ emerged as the association rules with the highest support, underscoring their status as typical symptoms of estrus. The strong correlation among these symptoms suggests that their co-occurrence significantly increases the probability of estrus.
The application of strong association rules is pivotal in the process of estrus validation in cows. By identifying behaviors that are closely linked to estrus, we can establish robust rules that serve as a foundation for enhanced prediction and diagnosis. In the context of cow estrus, these rules enabled us to uncover complex interactions among various factors, including behavioral, appearance, and physiological changes. For instance, specific behavioral patterns such as increased locomotion and vocalization were found to be strongly associated with physiological changes like temperature fluctuations and hormone levels. This integration of multi-dimensional data through association rule mining provides a comprehensive understanding of a cow’s estrus cycle.
Moreover, the implementation of strong association rules allowed for the validation and refinement of our knowledge graph, ensuring that the captured relationships and entities accurately reflect the underlying biological processes. This precision is crucial for developing effective heat detection and management strategies, which in turn enhance the reproductive efficiency and welfare of the herd.
For the potential future expansion of the cow estrus knowledge graph, it was imperative to evaluate the runtime performance of different algorithms across various support levels. Such an analysis not only aided in selecting the most suitable algorithms for the current dataset but also provided guidance on the scalability and optimization of the knowledge graph. By thoroughly studying the algorithmic performance under different support thresholds, we ensured that the knowledge graph remains efficient and accurate, even as the volume of data grows. For example, Figure 7 illustrates the runtime of the two algorithms in deriving strong association rules under varying support levels, highlighting the importance of algorithmic efficiency in handling large-scale data.
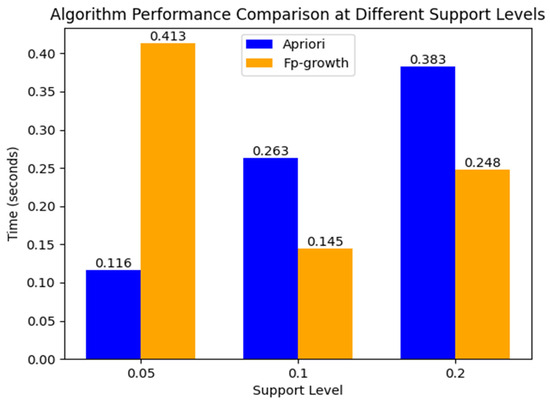
Figure 7.
Apriori algorithm and FP-Growth algorithm times for different support thresholds.
When analyzing the performance of the Apriori algorithm and the FP-Growth algorithm across different support thresholds, we observed significant differences in their processing efficiency. At a support level of 0.05, FP-Growth demonstrated superior time performance, completing the task in 0.116 s compared to Apriori’s 0.413 s. However, as the support was increased to 0.1, FP-Growth’s efficiency decreased slightly (0.145 s), while Apriori’s runtime improved significantly (0.263 s). When the support was further raised to 0.2, Apriori’s runtime increased to 0.383 s, while FP-Growth’s runtime decreased to 0.248 s.
This trend suggests that FP-Growth is more efficient at lower support levels, where it can effectively construct compact FP-trees to manage large datasets. In contrast, Apriori benefits more from higher support thresholds, as its pruning mechanism becomes more effective in reducing the search space. This phenomenon highlights the trade-off between the two algorithms: FP-Growth excels in scenarios with lower support, due to its tree-based structure, while Apriori performs better as support increases, leveraging its candidate pruning strategy to optimize performance [29].
4.3. Introduction of Lift
Lift, a key measure of how interesting a rule is in association rule analysis, describes the ratio of the conditional probability of an item set appearing in another item set to the probability of that item set appearing in the aggregate, given that one item set is known. In the analysis of cow estrus behavior, we found many association rules with low support but high confidence. Although these rules do not appear frequently in the dataset, once one condition is satisfied, the probability of another condition increases greatly, and they are also commonly used as the basis for determining cow estrus in the livestock industry. However, the utility and value of these rules may not be fully assessed by relying on support and confidence alone. Therefore, we further analyzed these rules by calculating the lift degree. For example, suppose we found a correlation rule: ’If a cow exhibits a specific behavior X, there is a high probability that she will also exhibit behavior Y.’ Although behavior X and behavior Y occur infrequently in the aggregate (i.e., with low support), if the lift is high, this suggests that the probability of behavior Y occurring is much higher than the probability of it occurring randomly, conditionally on the cow displaying behavior X. Such a rule is an important guide for practical reproductive management and decision making. The elevation degree formula is as follows:
The significance of the lift metric lies in its ability to not only quantify the strength of association between itemsets but also determine whether this association holds practical significance. When the lift is greater than 1, this indicates a positive association between the antecedent and consequent in the rule, meaning that the occurrence of the antecedent increases the likelihood of the consequent occurring. A lift equal to 1 implies independence between the itemsets, while a lift less than 1 suggests a negative association.
For example, an analysis might uncover a rule with low support but high confidence, such as ‘if item A is purchased, item B will be purchased’. While this combination may not be common across all transactions, if a large percentage of customers who purchased item A also purchased item B, the confidence level for this rule remains high. Further calculation of the lift reveals whether this association is meaningful. If the lift is significantly greater than 1, this indicates that the purchase of item A positively promotes the purchase of item B. Such rules, even with low support, can provide valuable insights for marketing strategies or product layout.
In this study, we focused on strong association rules with a lift greater than 1. We calculated the lift for three sets of data mined by three different algorithms, each with support levels of 0.2, 0.4, and 0.5, and a confidence level of 0.7. After filtering, the effective strong association rules with a lift greater than 1 were those presented in Table 5.
Table 5.
Strong association rule set enhancement in cow estrus.
Due to the unstructured variability and decentralized distribution of cow heat knowledge data, after the introduction of elevation, there was still a large amount of missing low-support but high-confidence and high-elevation association rule knowledge, which are also of very considerable reference value for cow heat, as shown in Table 6.
Table 6.
The set of association rule items with low support and high confidence and lift greater than 1.
In the process of constructing a knowledge graph of cow estrus, it was important to introduce strong association rules with low support but high confidence. Although these rules appear infrequently in the dataset, they often represent patterns and associations that are rare but critical, which were essential for a deeper understanding and prediction of cow heat behavior. As highlighted in the context of unstructured data processing, these low-frequency but high-confidence rules could provide additional insights and help us capture the nuances and complexities of cow heat behavior.
Therefore, incorporating these low-support but high-confidence strong association rules into the knowledge graph not only improved the completeness and depth of the graph, but also enhanced its predictive and decision-support capabilities for practical applications. This is of great practical significance for improving the reproductive efficiency of dairy cows and optimizing reproductive management strategies.
4.4. Completing the Knowledge Graph of Cow Estrus
In this study, we successfully extracted 17 sets of strong association rules from a large amount of data on estrus behavior in cows by applying association rule mining techniques. These rules revealed a variety of behavioral and physiological characteristics that occur during estrus, such as ‘growling’ and ‘increased climbing’, ‘decreased feed intake’ and ‘excitement’, ‘frequent micturition’ and ‘agitation’. These findings suggest that estrus behavior in cows does not occur in isolation, but is a complex and interrelated set of physiological and behavioral responses. This is shown in Figure 8.
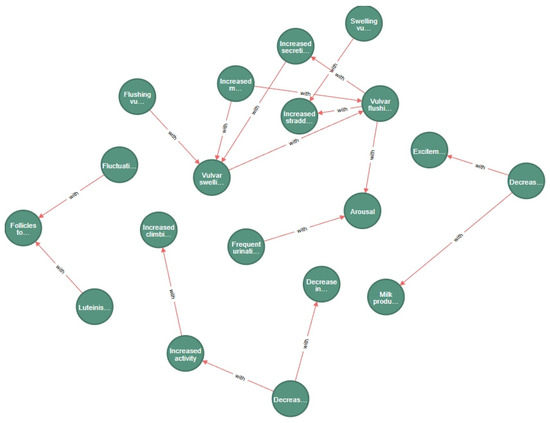
Figure 8.
Graph of strong association rule entities and their relationships.
In order to further deepen the scientific value of these rules, we decided to define these relationships as ’concomitant’ and incorporate them into a comprehensive knowledge graph.
Based on the original knowledge graph of dairy cows, we successfully identified and added 17 new ’concomitant’ relationships, which are related to various behavioral, appearance, and physiological changes of cows during heat, through in-depth research and data mining. This expansion kept the number of entities in the knowledge graph at 86, while increasing the number of relationship types to 10. This enriched our understanding of the interactions between behavioral and physiological changes in cow estrus. The graphing was also made more accurate and complete by utilizing these mined strong association rules, helping us to better understand and determine cow estrus.
4.5. Incremental FP-Growth Algorithm for Dynamic Knowledge Expansion
In dairy cow estrus research, the continuous integration of emerging literature and sensor-generated data demands algorithms capable of efficiently handling dynamically evolving datasets. The traditional FP-Growth algorithm requires reconstructing the entire FP-Tree from scratch when new data are introduced, leading to significant computational overhead. For instance, reprocessing 100 new estrus cases could take minutes under a full recomputation approach, whereas incremental updates would only process the newly added data, thereby optimizing resource utilization. To address this challenge, we proposed an incremental FP-Growth algorithm that dynamically updates the FP-Tree by reusing existing structures and locally modifying affected components, ensuring scalability and efficiency in knowledge graph expansion, as shown in the Figure 9.
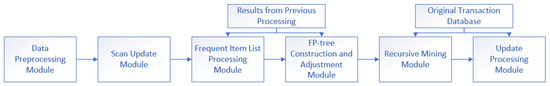
Figure 9.
Association rule mining model based on incremental FP-Growth algorithm.
The incremental FP-Growth algorithm functions as follows: Initially, the data preprocessing module cleans and transforms raw data into a suitable format. Subsequently, the scan update module identifies new transactions and updates the frequent item list processing module, which refreshes the frequent itemset list by integrating results from previous processing and the original transaction database. Based on this updated list, the FP-tree construction and adjustment module generates or modifies the FP-tree. The recursive mining module then extracts association rules from the FP-tree. Finally, the update processing module records the new rules and adjusts the transaction database. This incremental approach is significant and innovative as it enhances efficiency in dynamic data environments by updating association rules incrementally, reducing redundant computations, and improving the response speed to data changes.
The incremental FP-Growth algorithm holds substantial significance in the field of data mining, particularly for dynamic datasets. Its ability to update association rules incrementally without full recomputation makes it highly efficient. This is especially valuable in scenarios where data are continuously updated, such as in dairy cow estrus research, where new observations and data points are regularly added. The algorithm’s efficiency in processing new data and its capacity to maintain and update association rules dynamically are crucial for a timely and accurate analysis.
5. Validation of Association Rules
Although a knowledge graph was constructed and 22 strong association rules were identified, and while the introduction of lift led to the deletion of 10 rules and the addition of 7 new ones, the accuracy of these rules in predicting estrus cannot be assessed solely based on these metrics. Therefore, we developed rule-based Boolean functions to judge estrus, and compared the association rules mined by the knowledge graph-based approach and the FP-Growth-based approach to assess whether the association rules positively impacted the completeness of the knowledge graph.
5.1. Data Preparation and Quantification of the Characteristics of Association Rules
To ensure the reliability and generalizability of the results, we utilized an independent dataset that was not involved in the rule mining process. The data were gathered through web crawling techniques to extract information on cow estrus and non-estrus cases from various online resources, excluding the China National Knowledge Infrastructure (CNKI). This approach allowed us to gather a wide range of data from different sources, ensuring diversity and comprehensiveness. Specifically, we sourced data from websites such as the Journal of Dairy Science, which provided data on estrus and non-estrus behaviors. Additionally, we utilized data from agricultural databases and research institutions to supplement our dataset.
The data underwent a series of preprocessing steps, similar to the workflow depicted in Figure 1 for processing the CNKI data. This included the removal of duplicates and the correction of inconsistencies to ensure data quality. The dataset was then randomly divided into training and testing sets, maintaining the randomness and representativeness of the data. Specifically, 70% of the data were used for training and 30% were used for testing. This split ratio was chosen to provide a sufficient amount of data for both training and validation, ensuring that the model could be effectively evaluated.
To assess the impact of dataset size on the performance of the estrus prediction model, we prepared three different datasets, with 200, 500, and 1000 data entries, respectively. These datasets were randomly selected to ensure representativeness and unbiased results. The data were carefully cleaned and preprocessed to remove duplicates and inconsistencies, ensuring the quality and reliability of the dataset.
The data source of this study was based on the quantitative indicators related to estrus in heifers extracted from the literature knowledge base, and the CiteSpace literature indexing tool was used to systematically sort and screen six types of quantifiable core features in the strong association rules: increase in the multiplicity of the amount of exercise, increase in body temperature, decrease in the amount of ruminating, decrease in the amount of rumination, shortening of ruminating time, change in the amount of milk production, and change in the amount of laying down time. These indexes were summarized through empirical studies in several literature studies, covering multi-dimensional patterns of change in the physiology, behavior, and production performance of heifers during estrus.
In constructing an abnormal estrus discrimination model, the core challenge of feature quantification lay in the individual differences and environmental heterogeneity of heifers. Baseline values of exercise during estrus may vary significantly among heifers of different breeds, ages, and rearing conditions. If absolute values are used directly, such as ‘1000 step increase in exercise’ as the discriminant threshold, this will lead to limited generalization, feature range expansion, and reduced interpretability. Individual baseline differences make it difficult to adapt absolute thresholds to different farms or herds, and the model would be prone to overfitting to a specific dataset, while due to the significant differences in the milk production of high-yielding and low-yielding cows, the range of absolute values fluctuates. Due to the significant difference between high-yielding cows and low-yielding cows, the range of fluctuation of the absolute value may be greatly expanded, leading to a decrease in model differentiation. Moreover, absolute values lack a uniform scale of biological significance, which is not conducive to cross-study comparison and application.
In order to effectively eliminate the influence of individual cow differences and heterogeneity of the breeding environment on the characterization of features, this study used literature data for constructing a knowledge map of estrus in cows, and organized all quantitative data indexes and adopted relative rate of change or multiples as the core quantitative indexes, as shown in the Table 7.
Table 7.
Quantitative indicators of normal estrus characteristics in cattle.
5.2. Boolean Functions in Normal Estrus Prediction
The Boolean function validation model based on association rule learning proposed in this study incorporates the FP-Growth algorithm for extracting strong association rules and using them to construct a logical encoding, which in turn realized the accurate determination of the estrus status of heifers. Specifically, based on these strong association rules, we combined the feature variables to form a logical expression through logical operations such as and, or, and not. For example, if the result of frequent item set mining shows that ‘increased body temperature and activity’ or ‘vulvar swelling’ is a combination of strongly correlated features of cow estrus, the corresponding Boolean expression is shown in Equation (4) as an example:
In this formula, T means increase in body temperature, A means increase in activity, and S means swelling of the vulva. If the combination of input features satisfies the logic expression, the Boolean function outputs ‘True’, indicating that the cow is in estrus; otherwise, it outputs ‘False’. This Boolean function discriminant model based on association rule learning not only inherits the clarity and interpretability of Boolean logic, but also enhances the adaptability and accuracy of the cow estrus determination model through data-driven association rule mining. The specific flow chart is shown in Figure 10.
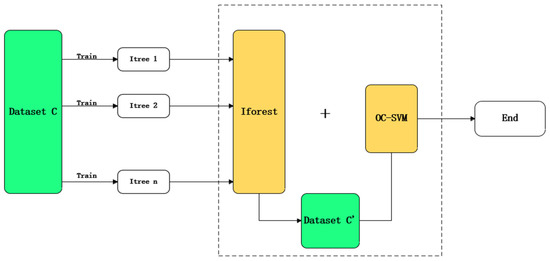
Figure 10.
Theory of implementation of the model for determining abnormal cow estrus.
5.3. Iforest-OCSVM in Abnormal Estrus Prediction
In order to test association rules for abnormal estrus determination in cow estrus, we adopted a progressive strategy based on Iforest with strong association rule weighting combined with weighted one-class support vector machine OC-SVM, to achieve efficient and robust abnormal discrimination. The framework is mainly divided into two key phases: the coarse screening phase, and the fine judgment phase.
In the coarse screening stage, we utilized Iforest to perform rapid preliminary screening of the estrus data. Isolated forest can efficiently isolate anomalous samples by constructing a randomized tree structure. This method is particularly suitable for preliminary screening of large-scale data because it can narrow down the scope of anomaly detection by eliminating high-confidence normal samples in a shorter period of time. With this stage, we were able to significantly reduce the amount of data for subsequent processing and improve the overall detection efficiency.
In the fine-tuning stage, we analyzed the suspected abnormal samples output from the isolated forest in depth. Here, weighted OC-SVM was used. OC-SVM is able to finely distinguish anomalous samples with fuzzy boundaries by constructing a maximally spaced hyperplane. This progressive strategy not only improved the efficiency of anomaly detection, but also enhanced the robustness and adaptability of the model.
Different characteristics are often not equally important for the detection of abnormalities in estrus studies in heifers. Some features may be decisive for the description of normal data, while others may be more prominent in the performance of abnormal data. Therefore, weighting features and constructing a weighted feature matrix can more accurately reflect the essential characteristics of the data. This study proposed an association-rule-driven feature weighting fusion method, i.e., defining feature weights based on a strong association rule of FP-Growth mining. This method could capture the synergistic effect between features more accurately, thus improving the model’s sensitivity to anomalous data and its detection accuracy. Second, strong association rules can quantify the importance of features in anomaly detection. In the mining process, metrics such as the support and confidence of each rule can be used as a basis for measuring the importance of features. Rules with higher support indicate that the combination of features appears more frequently in the data and may be important for anomaly detection; rules with higher confidence indicate that the association between the combination of features and anomalies is stronger. By transforming these indicators into weights, the actual contribution of features in anomaly detection can be reflected more scientifically. The formula for defining feature weights is as follows:
In this formula, indicates the weight of the first feature, the value range is between [0, 1], the larger the weight, the more important the feature is in cow estrus. represents the support degree of the first feature in the dataset, that is, the frequency of the feature, and a higher support degree means that the feature is more common in the data. The degree of enhancement of the first feature is the strength of the association rule between the feature and other features. When the degree of enhancement is greater than 1, this means that there is a positive correlation between the features, and the larger the value, the stronger the correlation. In the denominator, the sum of the product of support and lift of all features is used to normalize the weights to ensure that the sum of all weights is 1. If a feature participates in more than one rule, its weight will be determined by all the related rules, which enhances the global importance of the feature. The sum of the product of support and lift of all features is used for normalization. And the resultant weight [0, 1] reflects the combined importance of the features for estrus discrimination. The rule weight calculation provides a data-driven feature importance scale for the model by quantifying the universality and uniqueness of features in association rules. The method retains the structured information of the knowledge graph and enhances the robustness of the model through normalization and multi-rule fusion, which is a key point of innovation for detecting association rules in the realization of abnormal estrus detection.
5.4. Evaluation Metrics and Experimental Comparison
We used four model evaluation metrics in our experiments, namely Precision, Recall, the reconciled mean of Precision and Recall (F1-Score), and Intersection over Union (IoU).
Before analyzing, it is necessary to understand the definitions of the two types of samples: positive samples are samples that belong to a specific category, which is usually the focus of the study, while negative samples are samples that do not belong to that category. The specific meanings are shown in Table 8.
Table 8.
The meaning of samples.
True Positives (TP) are samples that were correctly predicted as positive. False Positives (FP) are samples that were incorrectly predicted as positive when they were actually negative. False Negatives (FN) are samples that were incorrectly predicted as negative when they were actually positive. True Negatives (TN) are samples that were correctly predicted as negative.
Accuracy is the proportion of all predicted samples that are correctly categorized.
Precision is defined as the proportion of true positive cases among all predicted positive cases, as shown in the formula below.
Recall is the ratio of the number of positive classes predicted to be positive to the number of classes that are actually positive, as shown in the formula below.
Fl-score is the reconciled mean of Precision and Recall, as shown in the formula below.
Through the comprehensive analysis of these metrics, this study comprehensively evaluated and compared the performance of the two Boolean function validation models, graph-based and rule-based, so as to select the most suitable method for practical application.
To validate the effectiveness of these rules, we developed rule-based Boolean functions to assess the estrus status of cows. The results showed that the precision of estrus identification improved significantly with the introduction of lift, demonstrating the effectiveness of the optimized rules in various environments, as shown in Table 9.
Table 9.
Performance metrics across different data sizes.
To further validate the effectiveness of the strong association rules, we conducted an experiment comparing the performance of the knowledge-graph-based approach with the association-rule-based approach. The experiment involved using Boolean functions derived from both the initial knowledge graph and the enhanced knowledge graph with strong association rules. As demonstrated in Table 9, we conducted an experiment to further validate the effectiveness of the strong association rules. The experiment compared the performance of two approaches: the knowledge-graph-based method and the association-rule-based method. The data used for the experiment were varied in size, including 200, 500, and 1000 data entries, which allowed us to assess the scalability and robustness of each approach.
The results of this comparative analysis are depicted in Figure 11. This figure presents a visual representation of the performance metrics—accuracy, precision, recall, and F1 score—across both methods and different dataset sizes. It provides a clear and concise comparison that underscores the advantages of integrating strong association rules into the knowledge-graph-based approach, as evidenced by the improved performance metrics.
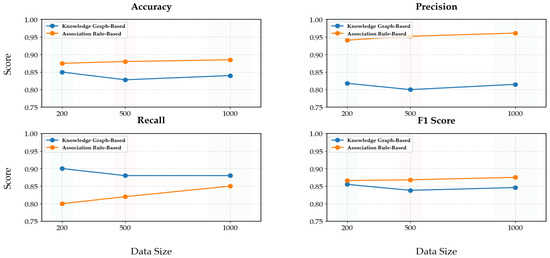
Figure 11.
Performance comparison of knowledge-graph-based and association-rule-based methods validated by Boolean functions across data sizes.
The key findings are as follows: In terms of accuracy, the knowledge-graph-based approach with strong association rules consistently outperformed the initial knowledge-graph-based approach. For precision, the precision of estrus identification was significantly higher when using the strong association rules, indicating a reduction in false positives. Regarding recall, the recall improved with the introduction of strong association rules, indicating a reduction in false negatives. The F1 score, which balances precision and recall, was also higher for the knowledge-graph-based approach with strong association rules. These results clearly demonstrate that the knowledge-graph-based approach, enhanced with strong association rules, outperformed the initial approach in terms of accuracy, precision, recall, and F1 score. The improvement in performance was consistent across different dataset sizes, indicating the robustness and effectiveness of the enhanced approach in accurately identifying estrus in cows.
To assess the effectiveness of the association rules in detecting abnormal estrus, we conducted a comparative experiment involving four distinct approaches: the Iforest-OCSVM model with association rule-based feature weighting, the standard Iforest-OCSVM without feature weighting, the Iforest-OCSVM model with association rule-based feature weighting excluding the Lift metric, and the Iforest-OCSVM model with CNN-based feature extraction. This experiment was conducted on a dataset comprising 1000 samples. The outcomes, as detailed in Table 8, revealed that the Iforest-OCSVM model augmented with association-rule-based feature weighting achieved superior performance over the other models across accuracy, precision, recall, and F1-score metrics. These findings underscore the significant contribution of integrating association rules with feature weighting to enhance the detection of abnormal estrus, and also demonstrate the potential of CNN-based feature extraction for improving model performance.
The results presented in Table 10 demonstrate that the Iforest-OCSVM model enhanced with association-rule-based feature weighting outperformed the standard model across all evaluation metrics. Specifically, the weighted model exhibited improvements of 5% in accuracy, 6% in precision, 7% in recall, and 6% in F1-score over the unweighted counterpart. These enhancements underscore the substantial benefit of integrating association-rule-based feature weighting, which refined the model’s ability to effectively detect abnormal estrus, as shown in Figure 12.
Table 10.
Performance of Iforest-OSVM anomalous heat detection before and after association-rule-based feature fusion weighting.
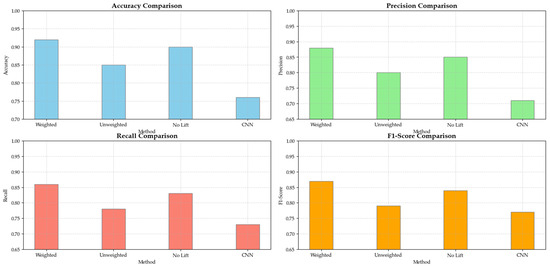
Figure 12.
Performance Comparison of Anomaly Detection Models.
Additionally, the model excluding the Lift metric from the association-rule-based feature weighting also showed competitive performance, achieving 0.90 in accuracy and 0.84 in F1-score. This suggests that while the Lift metric contributed to the model’s performance, its exclusion did not significantly diminish the model’s effectiveness.
The CNN model’s lower accuracy in detecting cow estrus was mainly due to its limited feature extraction capability for non-image data, its model complexity leading to overfitting, and inadequate data preprocessing. In contrast, association rules exceled by effectively capturing relationships between features, providing interpretable and actionable insights, and enhancing the robustness and completeness of the knowledge graph. These advantages make association rules a more suitable approach for this specific application.
These findings highlight the effectiveness of association-rule-based feature weighting, including the Lift metric, in enhancing estrus detection and also point to the potential of CNN-based approaches, warranting further investigation.
6. Conclusions and Future Work
In this study, we constructed and completed a knowledge graph for cow estrus by systematically gathering and organizing 812 academic literature studies using web crawlers. The process involved rigorous de-duplication, screening, and in-depth entity identification to ensure the accuracy and comprehensiveness of the data. Through entity and relationship extraction, we integrated the knowledge into a structured framework encompassing 86 core entities and 9 key relationships. This structured approach not only organized the dispersed knowledge related to cow estrus but also provided a comprehensive foundation for further analysis and application.
To enhance the graph, we employed association rule mining using the Apriori and FP-Growth algorithms. This process uncovered 17 significant rules that highlight key behavioral and physiological characteristics during estrus. These rules were meticulously integrated into the knowledge graph, expanding its relationships and significantly improving its accuracy and usefulness for estrus determination. The association rule mining step was crucial for uncovering hidden relationships within the data, thereby enriching the graph’s content and providing deeper insights into estrus behaviors and physiological changes. Then, we proposed an incremental FP-Growth algorithm that dynamically updated the FP-Tree. The incremental FP-Growth algorithm enhances scalability and lays a solid foundation for future expansion to more complex and diverse datasets. This makes it better able to handle the increasing volume and variety of data that may arise in cow heat research, ensuring efficient and effective data processing and analysis.
To validate this, we conducted experiments comparing the initial knowledge graph approach with the enhanced approach incorporating strong association rules. The enhanced method, which utilized association rules, outperformed the initial method across all evaluation metrics, including accuracy, precision, recall, and F1 score. This highlights the superior performance of the association rule-based approach in estrus identification.
Furthermore, we performed validation experiments based on quantified association rules to assess their effectiveness in detecting abnormal estrus using the Iforest-OCSVM model. These experiments confirmed that the association rules not only improved the accuracy of normal estrus detection but also enhanced the identification of abnormal estrus, providing a more reliable basis for decision-making in estrus management. This study thus provides a robust technical foundation for intelligent reasoning and early warning in cow estrus management, while advancing breeding efficiency and livestock management. In future work, we will explore the optimization of preprocessing steps for sensor data, particularly focusing on standardization and normalization. Sensor data, often collected from various devices with different units and value ranges, can significantly impact model performance. We plan to investigate data standardization techniques, such as Z-Score normalization, to unify the value ranges of diverse sensor data, thereby enhancing model stability and accuracy. Additionally, we aim to develop methods that dynamically adjust preprocessing parameters in real time to accommodate changes in sensor data. We will also study how to improve data consistency and model robustness when integrating data from multiple sensors through standardized processing. These efforts are expected to further improve the model’s performance and reliability in handling complex sensor data, providing a more effective solution for estrus anomaly detection in cows. In addition, we will focus on further validating these rules and exploring additional applications of the knowledge graph in cow estrus identification, with the aim of optimizing breeding programs and driving innovation in the cow breeding industry.
Author Contributions
Conceptualization, Z.C. and L.D.; methodology, Z.C.; software, Z.C.; validation, H.Y., L.D. and C.P.; formal analysis, L.D., C.P. and H.Y.; investigation, Z.C. and Q.L.; resources, Z.C. and L.Y.; data curation, Z.C.; writing—original draft preparation, Z.C. and B.Y.; writing—review and editing, Z.C. and B.Y.; visualization, Z.C. and C.P.; supervision, L.D., C.P. and H.Y.; project administration, L.Y. and L.D.; funding acquisition, L.D. and Q.L. All authors have read and agreed to the published version of the manuscript.
Funding
This research was funded by the National Key Research and Development Program of China (2021YFD1300502), the Key Special Project ‘Promoting Mongolia through Technology’ (2022EEDSKJXM012-2), and the Beijing Nova Program (2022114).
Institutional Review Board Statement
Not applicable.
Informed Consent Statement
Not applicable.
Data Availability Statement
The data presented in this study were primarily derived from the literature and involve the privacy of other authors. Due to the sensitive nature of the information and the need to respect the confidentiality and intellectual property rights of the original authors, the data will not be made publicly available. However, specific data points and references used in this research can be provided upon request to verify the findings and conclusions drawn in this study.
Acknowledgments
We are grateful for the pivotal contributions made by Yunmei He and Xiaoyan Wang to our research project. He’s profound insights at the outset of our study were instrumental in shaping its direction and defining its scope, playing a crucial role in the conceptual development of our work. Moreover, Xiaoyan Wang’s meticulous assistance in data analysis was invaluable, enhancing the reliability and robustness of our results. We hereby acknowledge their significant contributions to the success of this research endeavor.
Conflicts of Interest
The authors declare there are no conflicts of interest.
References
- Ranasinghe, R.M.; Nakao, T.; Kobayashi, A. Incidence of error in estrus detection based on secondary estrus signs in a 24-h tie-stalled dairy herd with low fertility. Reprod. Domest. Anim. 2009, 44, 643–646. [Google Scholar] [CrossRef] [PubMed]
- Senger, P.L. The Estrus Detection Problem: New Concepts, Technologies, and Possibilities. J. Dairy Sci. 1994, 77, 2745–2753. [Google Scholar] [CrossRef]
- Aungier, S.P.M.; Roche, J.F.; Sheehy, M.; Crowe, M.A. Effects of management and health on the use of activity monitoring for estrus detection in dairy cows. J. Dairy Sci. 2012, 95, 2452–2466. [Google Scholar] [CrossRef]
- Mayo, L.M.; Silvia, W.J.; Ray, D.L.; Jones, B.W.; Stone, A.E.; Tsai, I.C.; Clark, J.D.; Bewley, J.M.; Heersche, G., Jr. Automated estrus detection using multiple commercial precision dairy monitoring technologies in synchronized dairy cows. J. Dairy Sci. 2019, 102, 2645–2656. [Google Scholar] [CrossRef]
- Wang, J.; Zhang, Y.; Wang, J.; Zhao, K.; Li, X.; Liu, B. Using machine-learning technique for estrus onset detection in dairy cows from acceleration and location data acquired by a neck-tag. Biosyst. Eng. 2022, 214, 193–206. [Google Scholar] [CrossRef]
- Benaissa, S.; Tuyttens, F.A.M.; Plets, D.; Trogh, J.; Martens, L.; Vandaele, L.; Joseph, W.; Sonck, B. Calving and estrus detection in dairy cattle using a combination of indoor localization and accelerometer sensors. Comput. Electron. Agric. 2020, 168, 105153. [Google Scholar] [CrossRef]
- Brown, D.D.; Kays, R.; Wikelski, M.; Wilson, R.; Klimley, A.P. Observing the unwatchable through acceleration logging of animal behavior. Anim. Biotelemetry 2013, 1, 20. [Google Scholar] [CrossRef]
- Reith, S.; Hoy, S. Review: Behavioral signs of estrus and the potential of fully automated systems for detection of estrus in dairy cattle. Animal 2018, 12, 398–407. [Google Scholar] [CrossRef]
- Peng, C.; Xia, F.; Naseriparsa, M.; Osborne, F. Knowledge Graphs: Opportunities and Challenges. Artif. Intell. Rev. 2023, 56, 13071–13102. [Google Scholar] [CrossRef]
- Gagliardi, I.; Teresa, A. Exploring and Visualizing Multilingual Cultural Heritage Data Using Multi-Layer Semantic Graphs and Transformers. Electronics 2024, 13, 3741. [Google Scholar] [CrossRef]
- Hairong, W.; Wang, D.; Xu, X. Research on the Construction Method of Rice Knowledge Graph. Autom. Control Comput. Sci. 2022, 56, 291–299. [Google Scholar] [CrossRef]
- Wan, Y.; Liu, Y.; Chen, Z.; Chen, C.; Li, X.; Hu, F.; Packianather, M. Making knowledge graphs work for smart manufacturing: Research topics, applications and prospects. J. Manuf. Syst. 2024, 76, 103–132. [Google Scholar] [CrossRef]
- Shen, T.; Zhang, F.; Cheng, J. A comprehensive overview of knowledge graph completion. Knowl.-Based Syst. 2022, 255, 109597. [Google Scholar] [CrossRef]
- Yu, M.; Zhang, Q.; Yu, J.; Zhao, M.; Li, X.; Jin, D.; Yang, M.; Yu, R. Knowledge graph completion using topological correlation and multi-perspective independence. Knowl.-Based Syst. 2023, 259, 110031. [Google Scholar] [CrossRef]
- Chee, C.-H.; Jaafar, J.; Aziz, I.A.; Hasan, M.H.; Yeoh, W. Algorithms for frequent itemset mining: A literature review. Artif. Intell. Rev. 2019, 52, 2603–2621. [Google Scholar] [CrossRef]
- Jang, H.-J.; Yang, Y.; Park, J.S.; Kim, B. FP-Growth Algorithm for Discovering Region-Based Association Rule in the IoT Environment. Electronics 2021, 10, 3091. [Google Scholar] [CrossRef]
- Zhong, H.; Li, W.; Zhang, Q.; Lin, R.; Tang, Y. A unified embedding-based relation completion framework for knowledge graph. Knowl.-Based Syst. 2024, 289, 111468. [Google Scholar] [CrossRef]
- Maharana, K.; Mondal, S.; Nemade, B. A review: Data pre-processing and data augmentation techniques. Glob. Transit. Proc. 2022, 3, 91–99. [Google Scholar] [CrossRef]
- Teng, Y.; Huang, Y.; Yang, S. Applying Knowledge Graph to Analyze the Historical Landscape Based on CiteSpace. Wirel. Commun. Mob. Comput. 2022, 2022, 3867541. [Google Scholar] [CrossRef]
- Zhang, N.; Ouyang, F. An integrated approach for knowledge extraction and analysis in collaborative knowledge construction. Int. J. Educ. Technol. High. Educ. 2023, 20, 45. [Google Scholar] [CrossRef]
- White, M.; Marsh, E. Content Analysis: A Flexible Methodology. Libr. Trends 2006, 55, 22–45. [Google Scholar] [CrossRef]
- Paulheim, H. Knowledge graph refinement: A survey of approaches and evaluation methods. Semant. Web 2016, 8, 489–508. [Google Scholar] [CrossRef]
- Yosef, A.; Roth, I.; Shnaider, E.; Baranes, A.; Schneider, M. Horizontal Learning Approach to Discover Association Rules. Computers 2024, 13, 62. [Google Scholar] [CrossRef]
- Fister, I.; Fister, I.; Fister, D.; Podgorelec, V.; Salcedo-Sanz, S. A comprehensive review of visualization methods for association rule mining: Taxonomy, challenges, open problems and future ideas. Expert Syst. Appl. 2023, 233, 120901. [Google Scholar] [CrossRef]
- Guillamet, G.H.; Seguí, F.L.; Vidal-Alaball, J.; López, B. CauRuler: Causal irredundant association rule miner for complex patient trajectory modelling. Comput. Biol. Med. 2023, 155, 106636. [Google Scholar] [CrossRef]
- Al-Maolegi, M.; Arkok, B. An Improved Apriori Algorithm For Association Rules. Int. J. Nat. Lang. Comput. 2014, 3, 21–29. [Google Scholar] [CrossRef]
- Wang, H.-B.; Gao, Y.-J. Research on parallelization of Apriori algorithm in association rule mining. Procedia Comput. Sci. 2021, 183, 641–647. [Google Scholar] [CrossRef]
- Borgelt, C. An implementation of the FP-growth algorithm. In Proceedings of the 1st International Workshop on Open Source Data Mining: Frequent Pattern Mining Implementations; Association for Computing Machinery: Chicago, IL, USA, 2005; pp. 1–5. [Google Scholar]
- Alcan, D.; Ozdemir, K.; Ozkan, B.; Mucan, A.Y.; Ozcan, T. A Comparative Analysis of Apriori and FP-Growth Algorithms for Market Basket Analysis Using Multi-Level Association Rule Mining; Springer Nature: Cham, Switzerland, 2023; pp. 128–137. [Google Scholar]
Disclaimer/Publisher’s Note: The statements, opinions and data contained in all publications are solely those of the individual author(s) and contributor(s) and not of MDPI and/or the editor(s). MDPI and/or the editor(s) disclaim responsibility for any injury to people or property resulting from any ideas, methods, instructions or products referred to in the content. |
© 2025 by the authors. Licensee MDPI, Basel, Switzerland. This article is an open access article distributed under the terms and conditions of the Creative Commons Attribution (CC BY) license (https://creativecommons.org/licenses/by/4.0/).