
A New Approach to Designing Advance Stress Release Boreholes to Mitigate Rockburst Hazards in Deep Boring-Machine-Constructed Tunnels


Abstract
1. Introduction
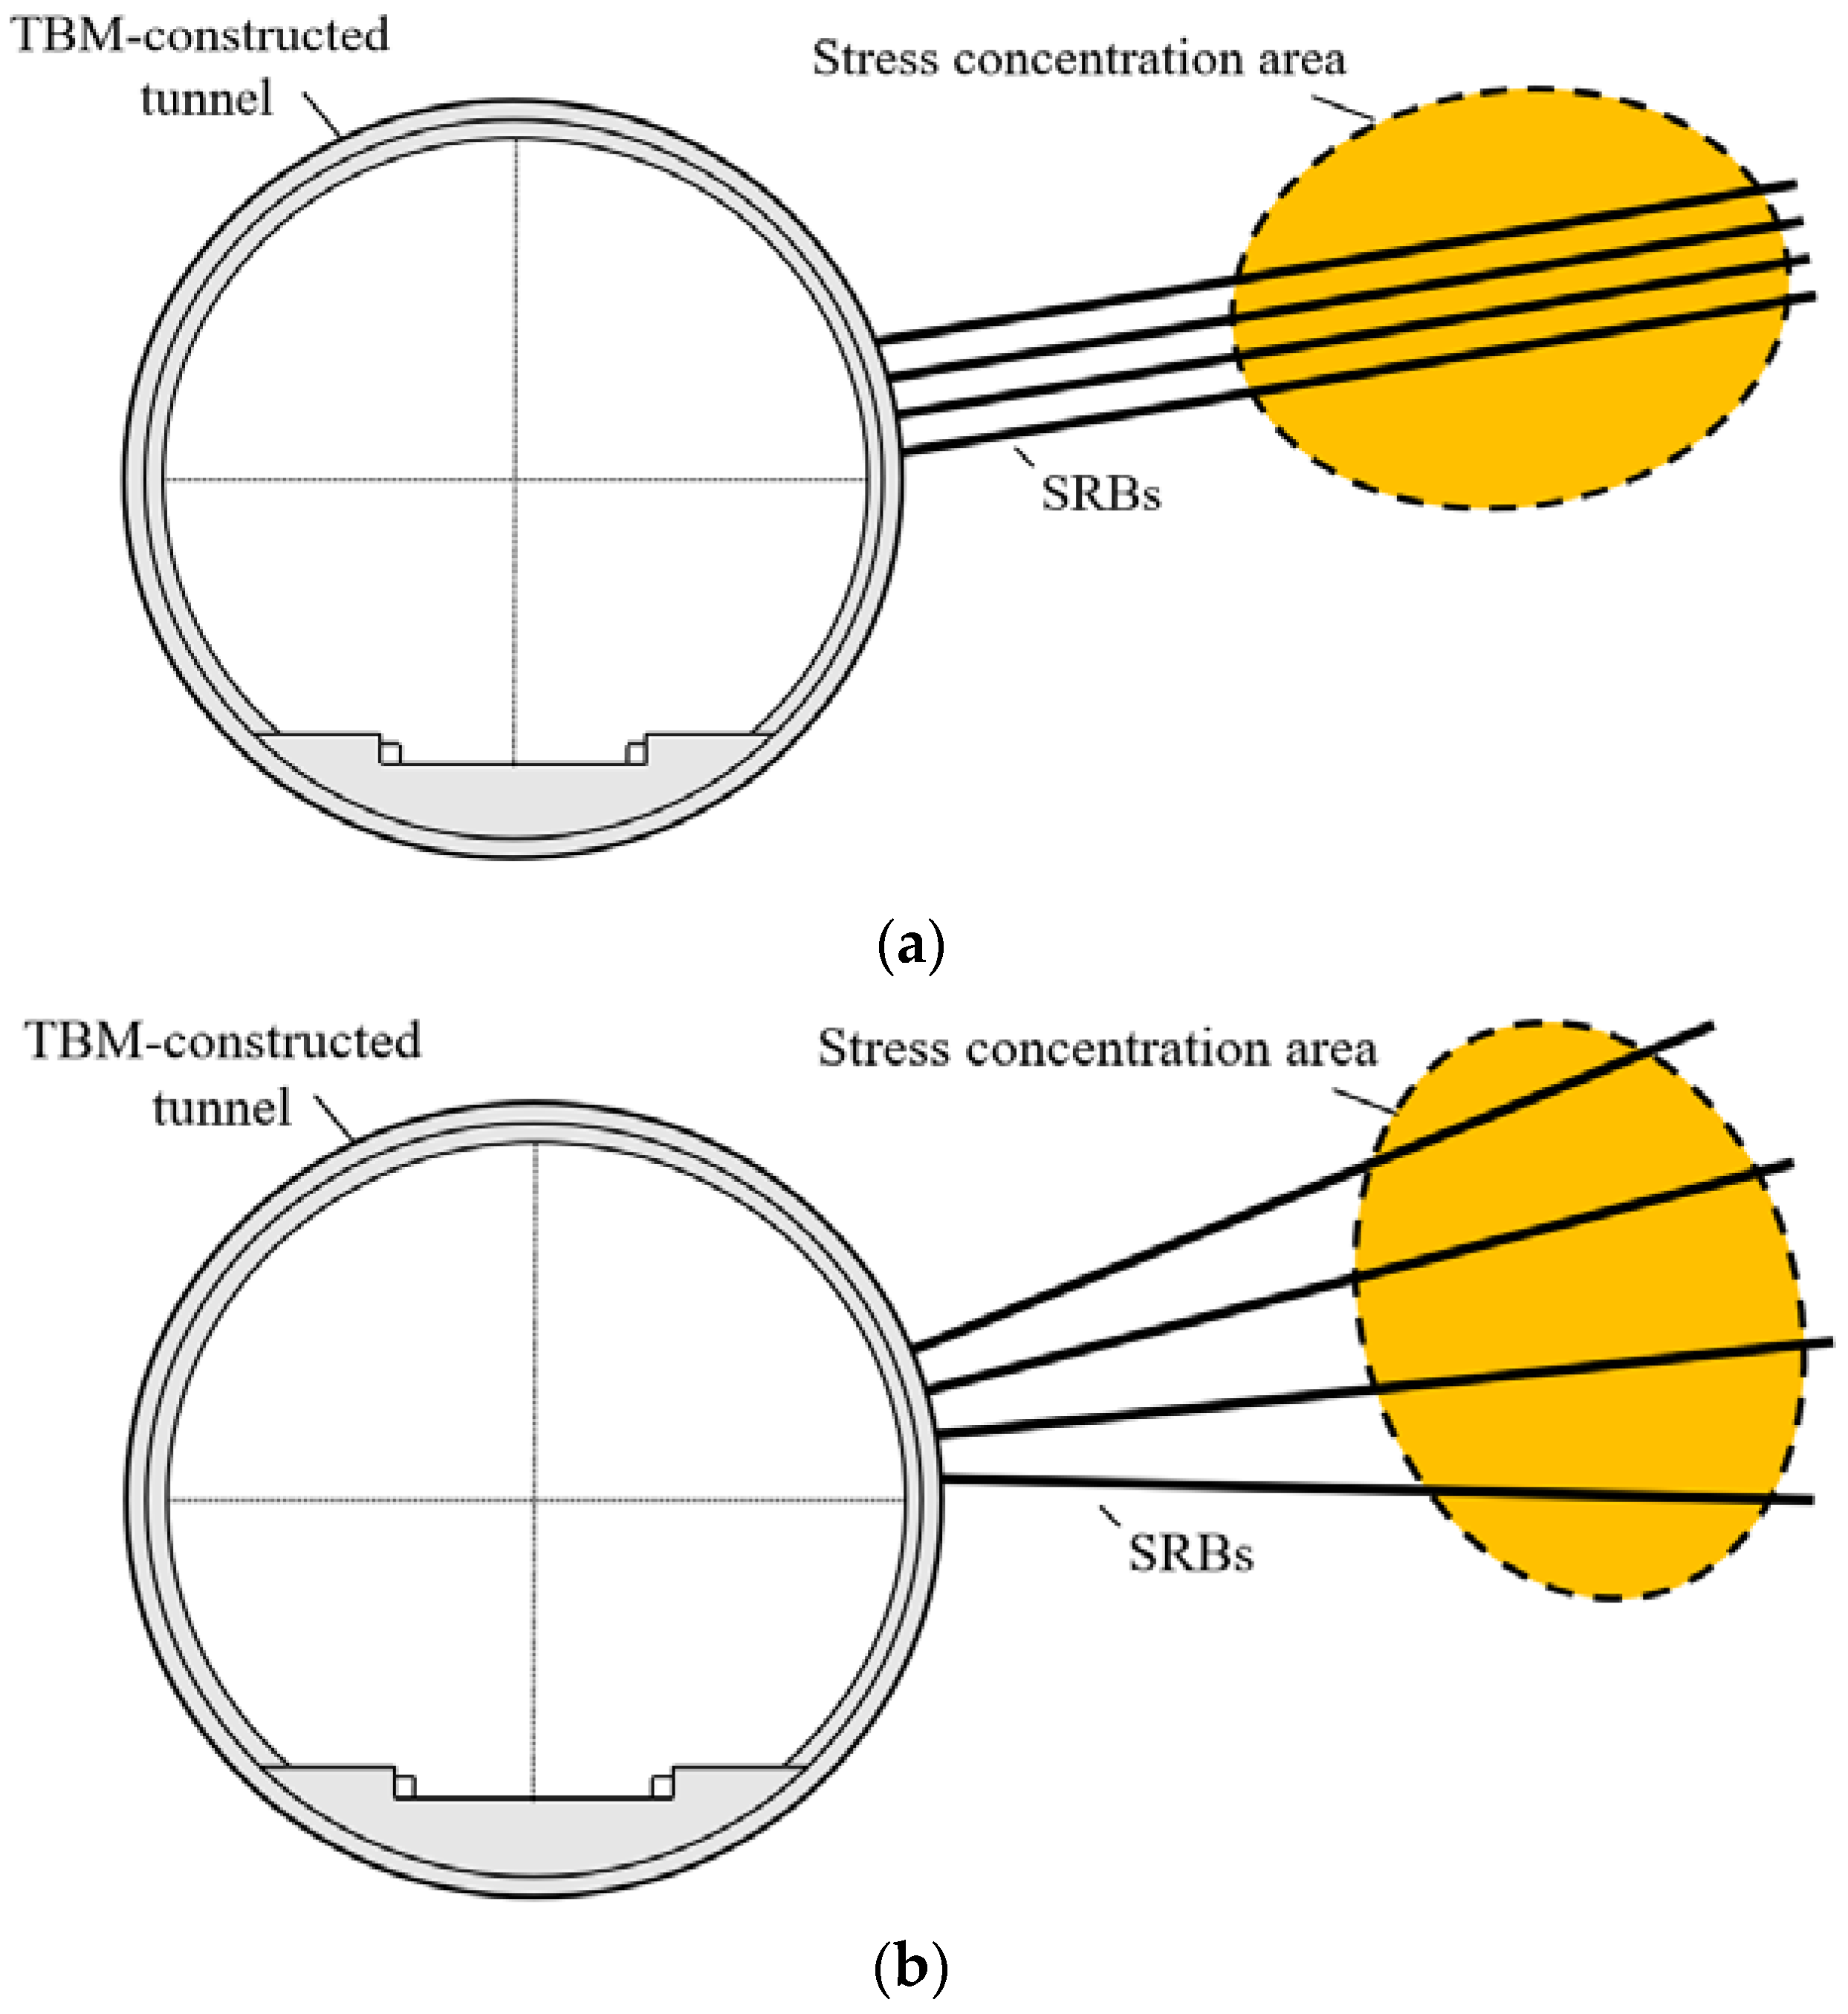
2. Stress Release and Energy Dissipation Mechanisms of TBM Tunnel ASRBs
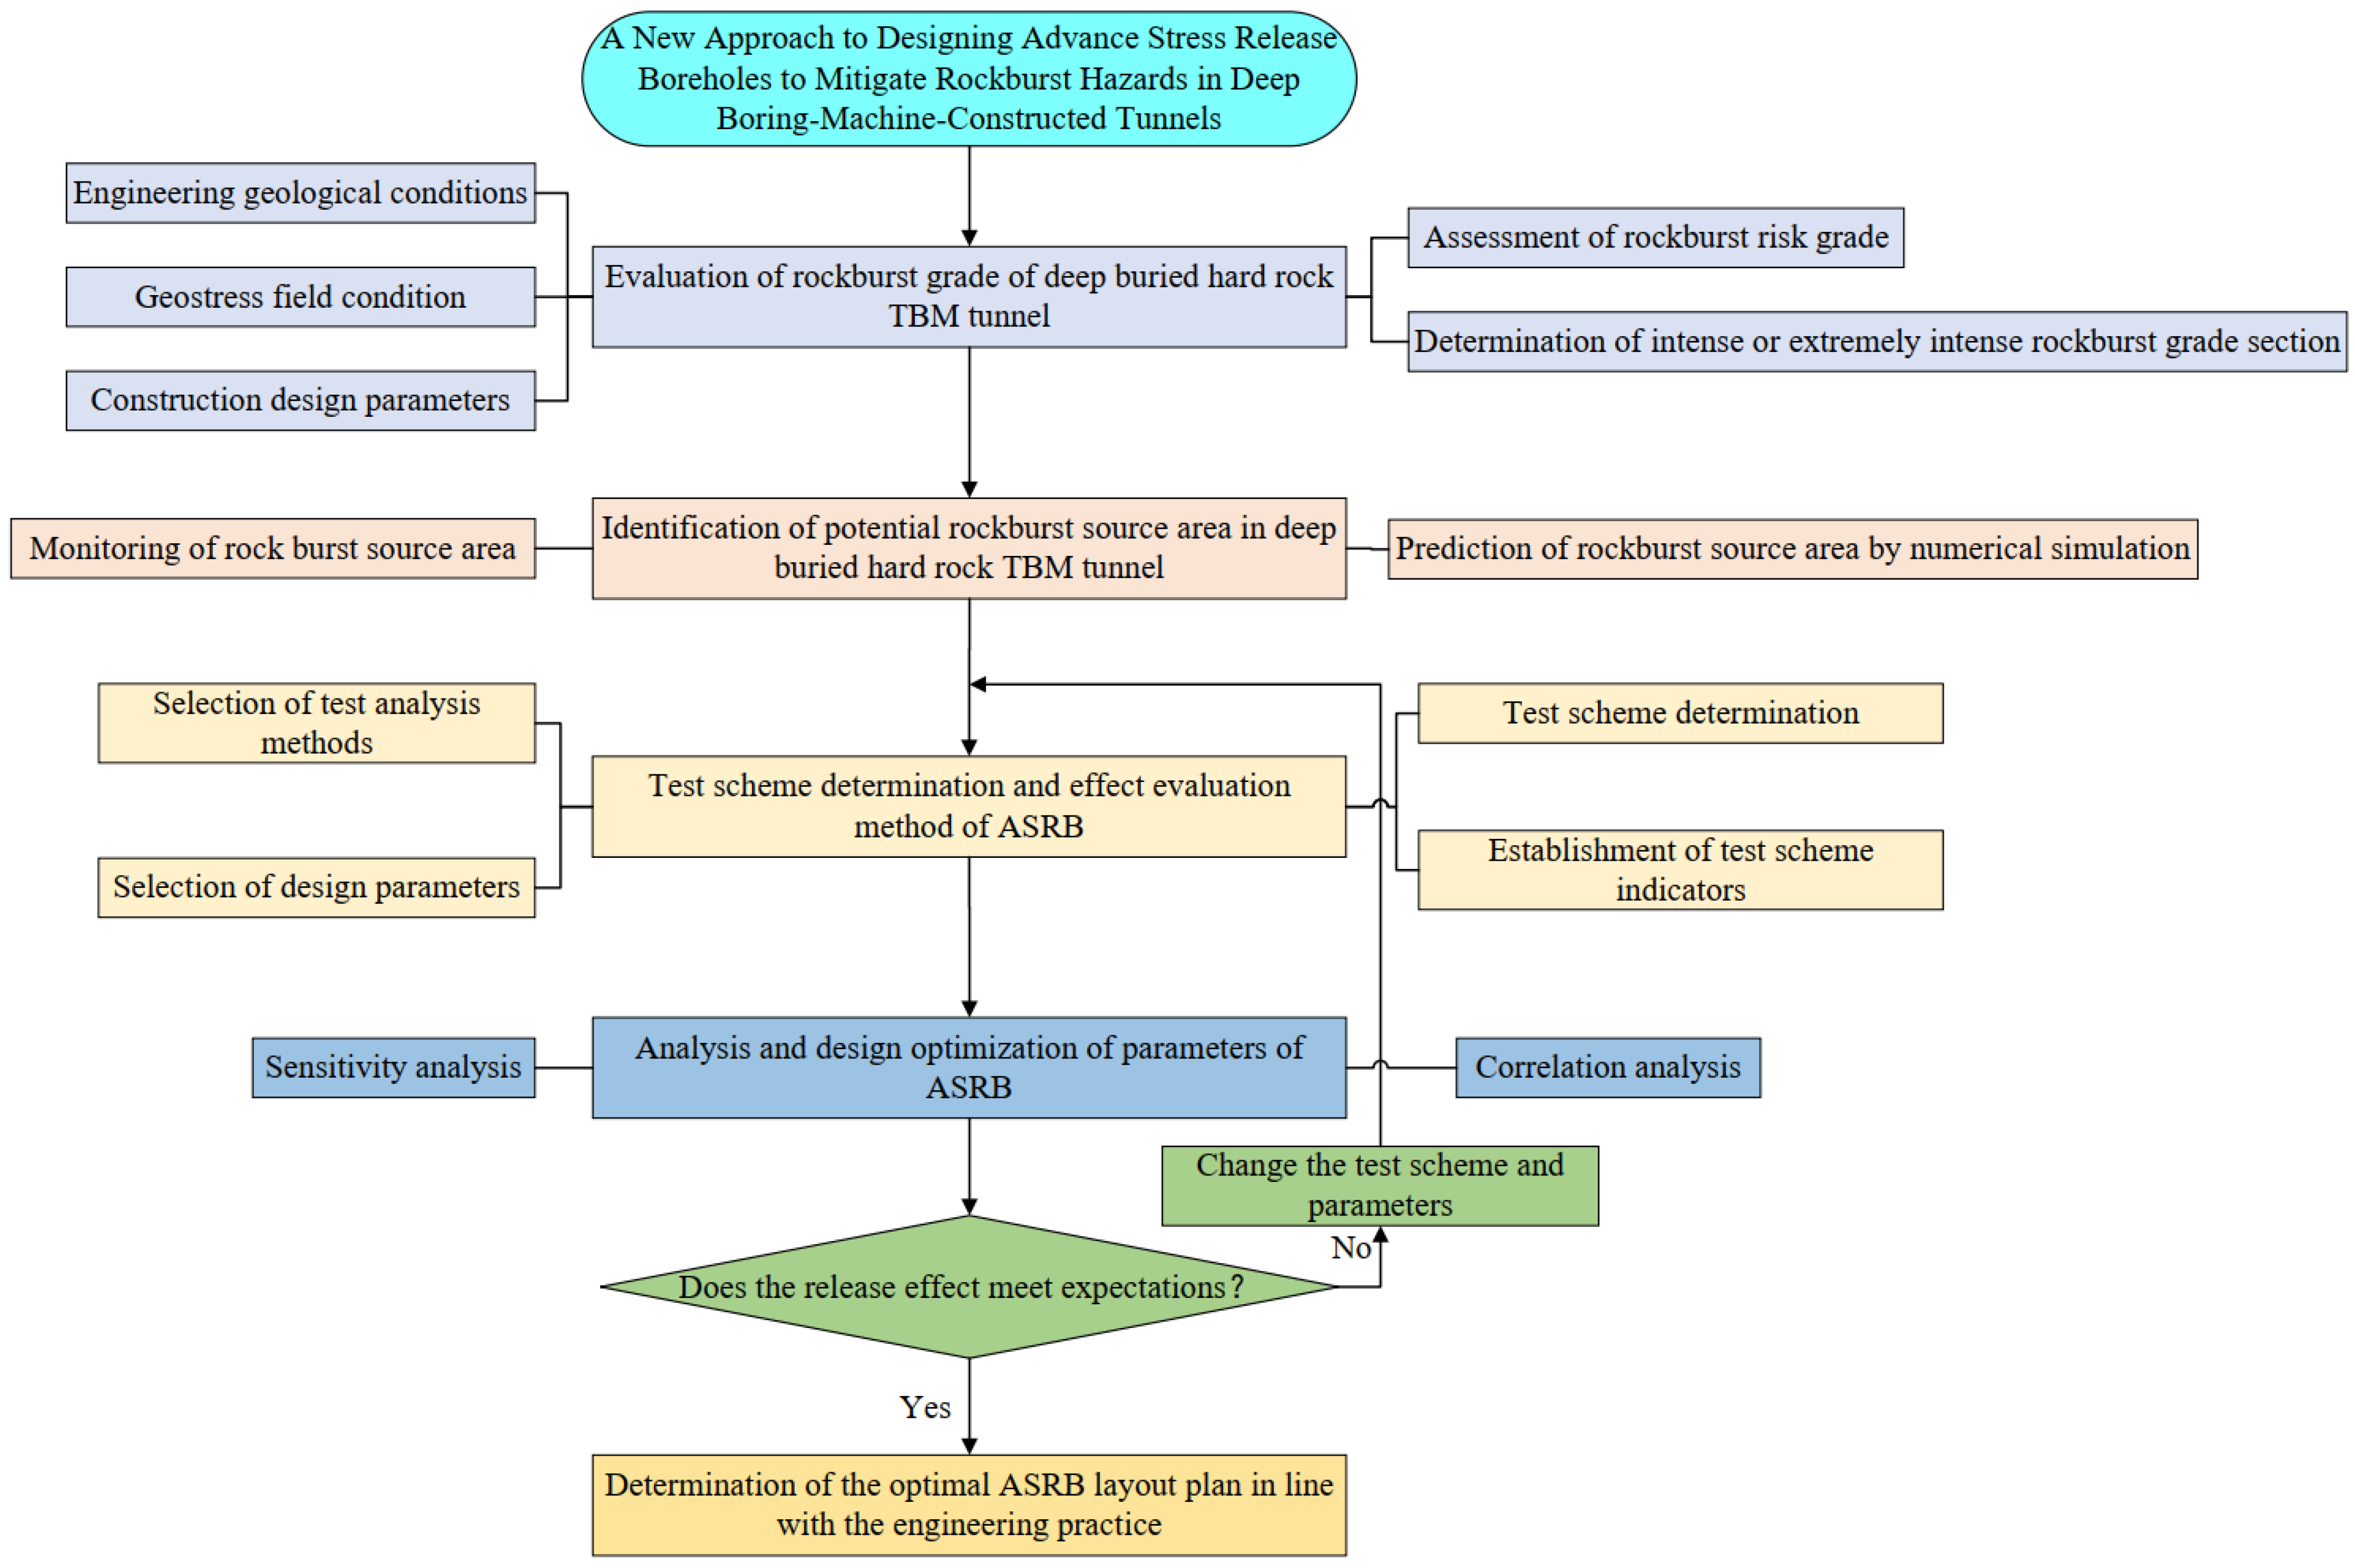
3. Parameter Design Method of TBM Tunnel ASRBs
3.1. Evaluation of Rockburst Grade in Deeply Buried Hard Rock TBM Tunnels
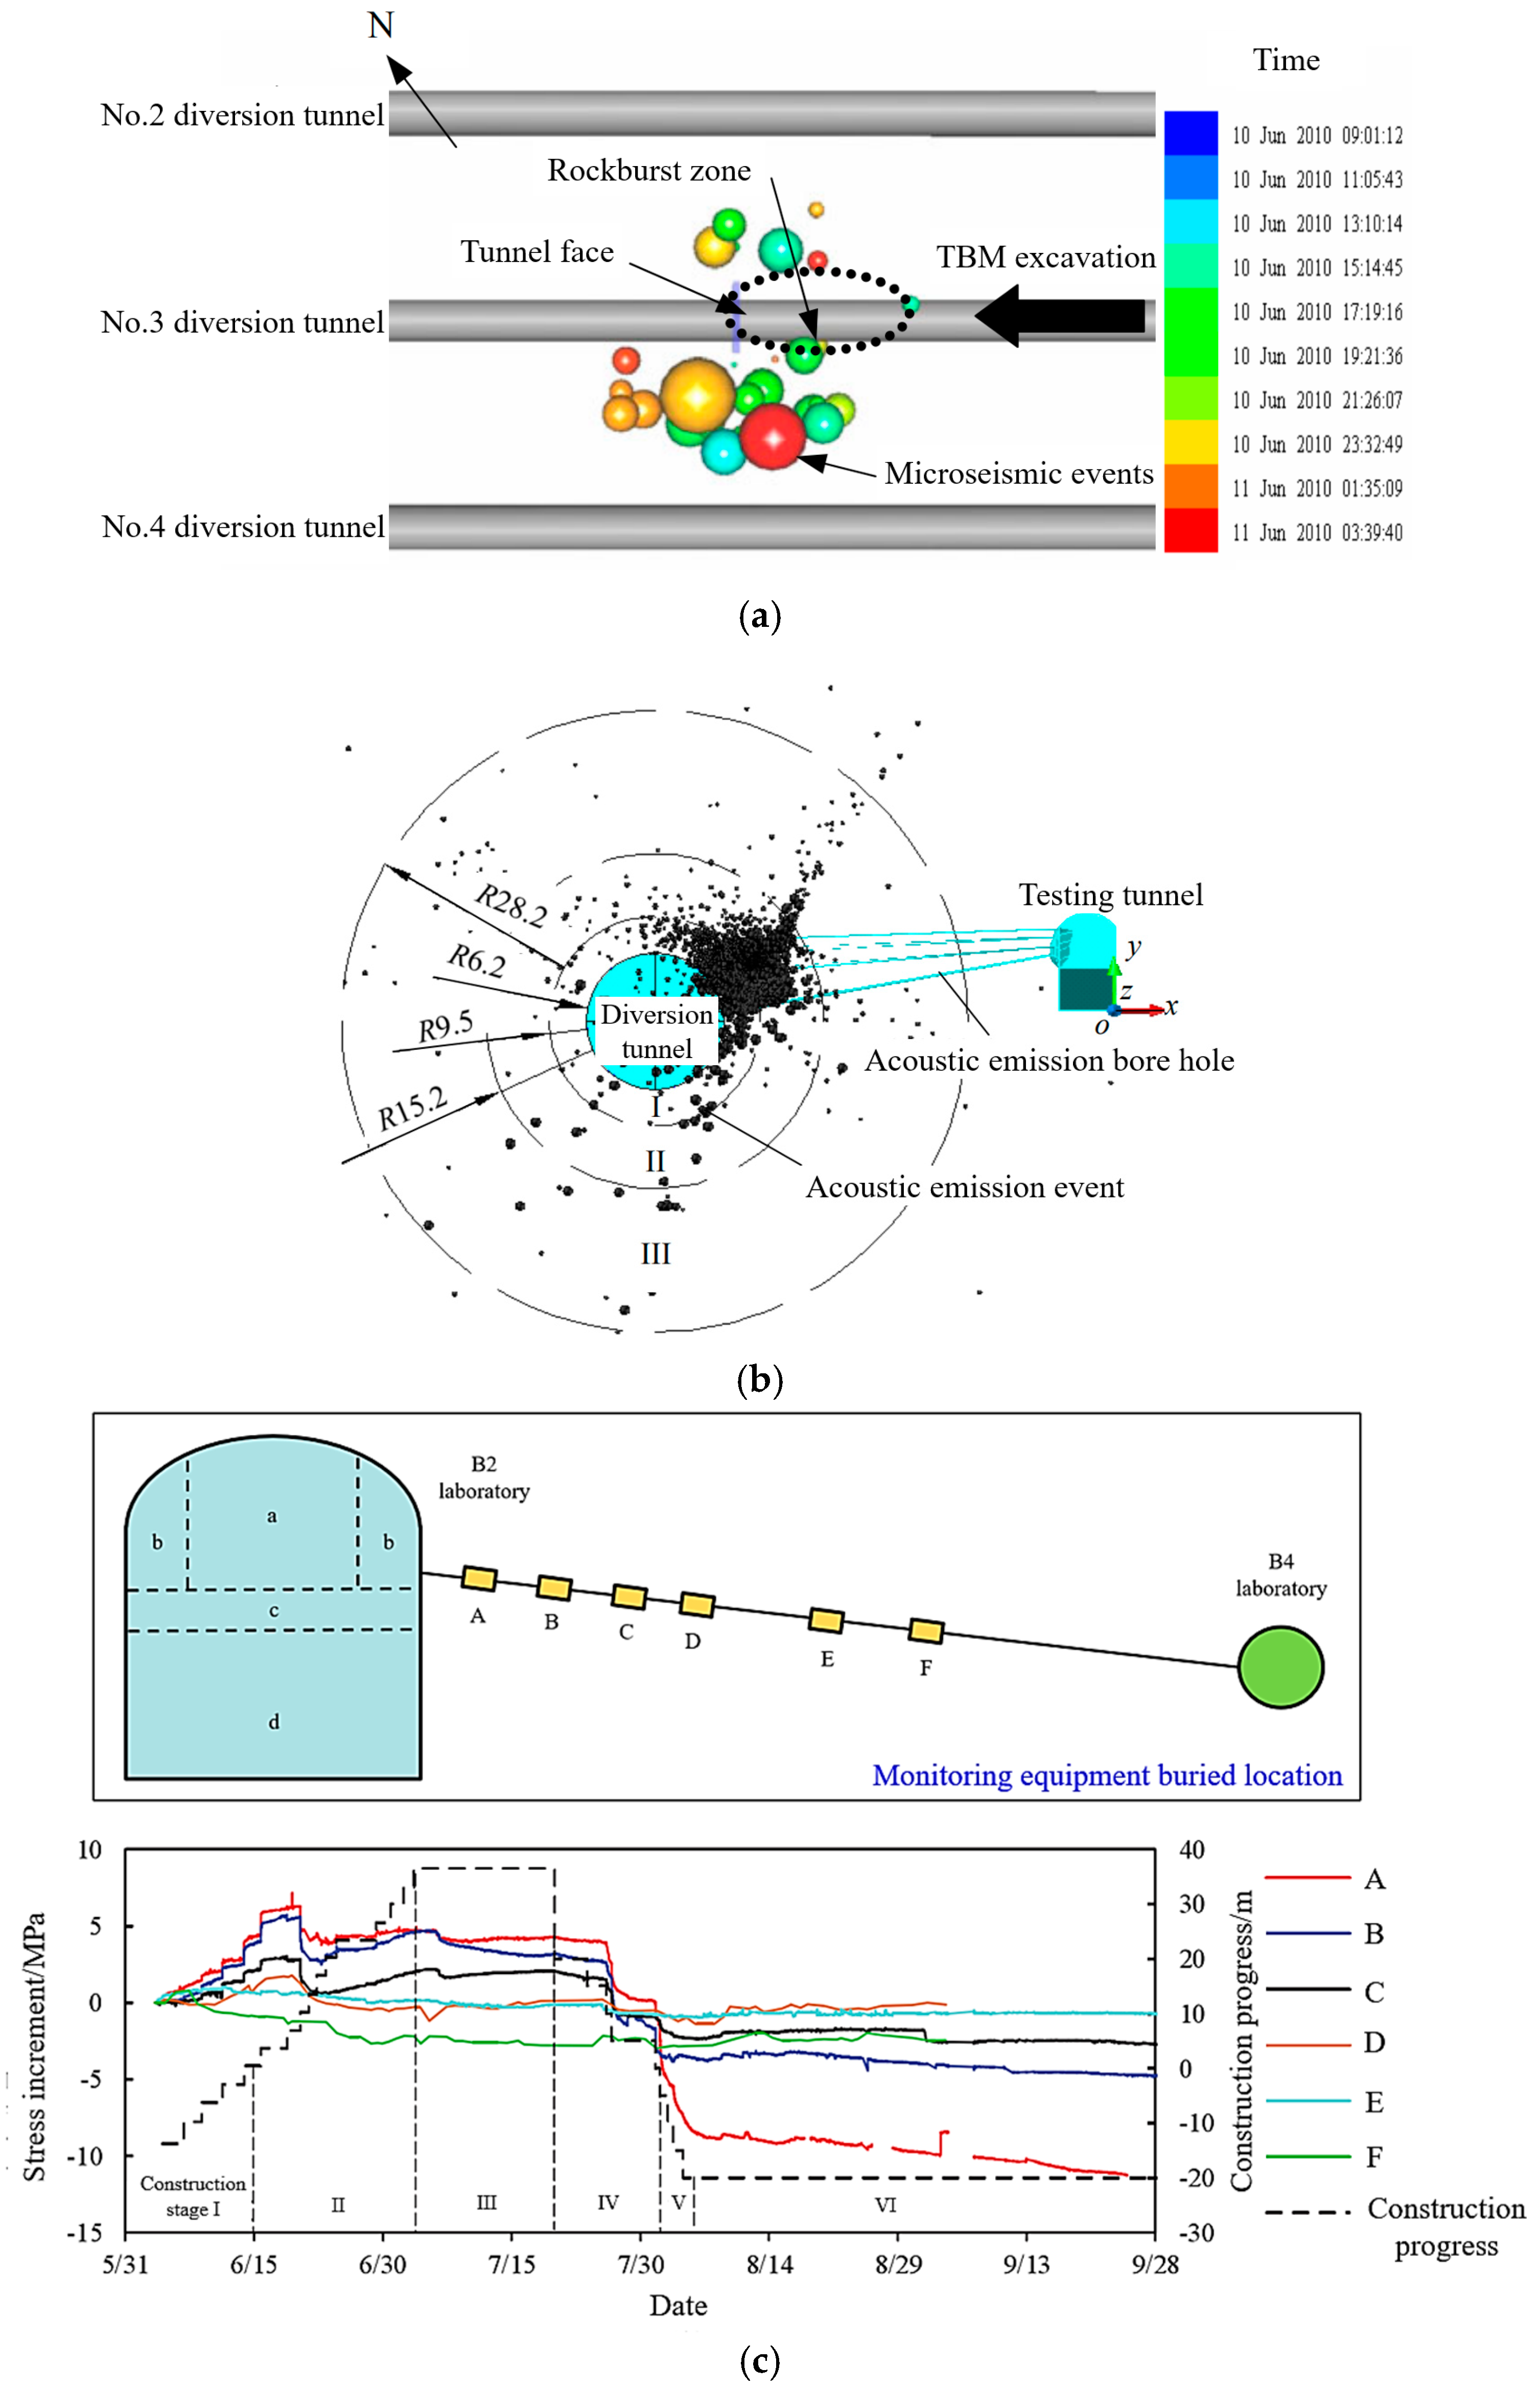
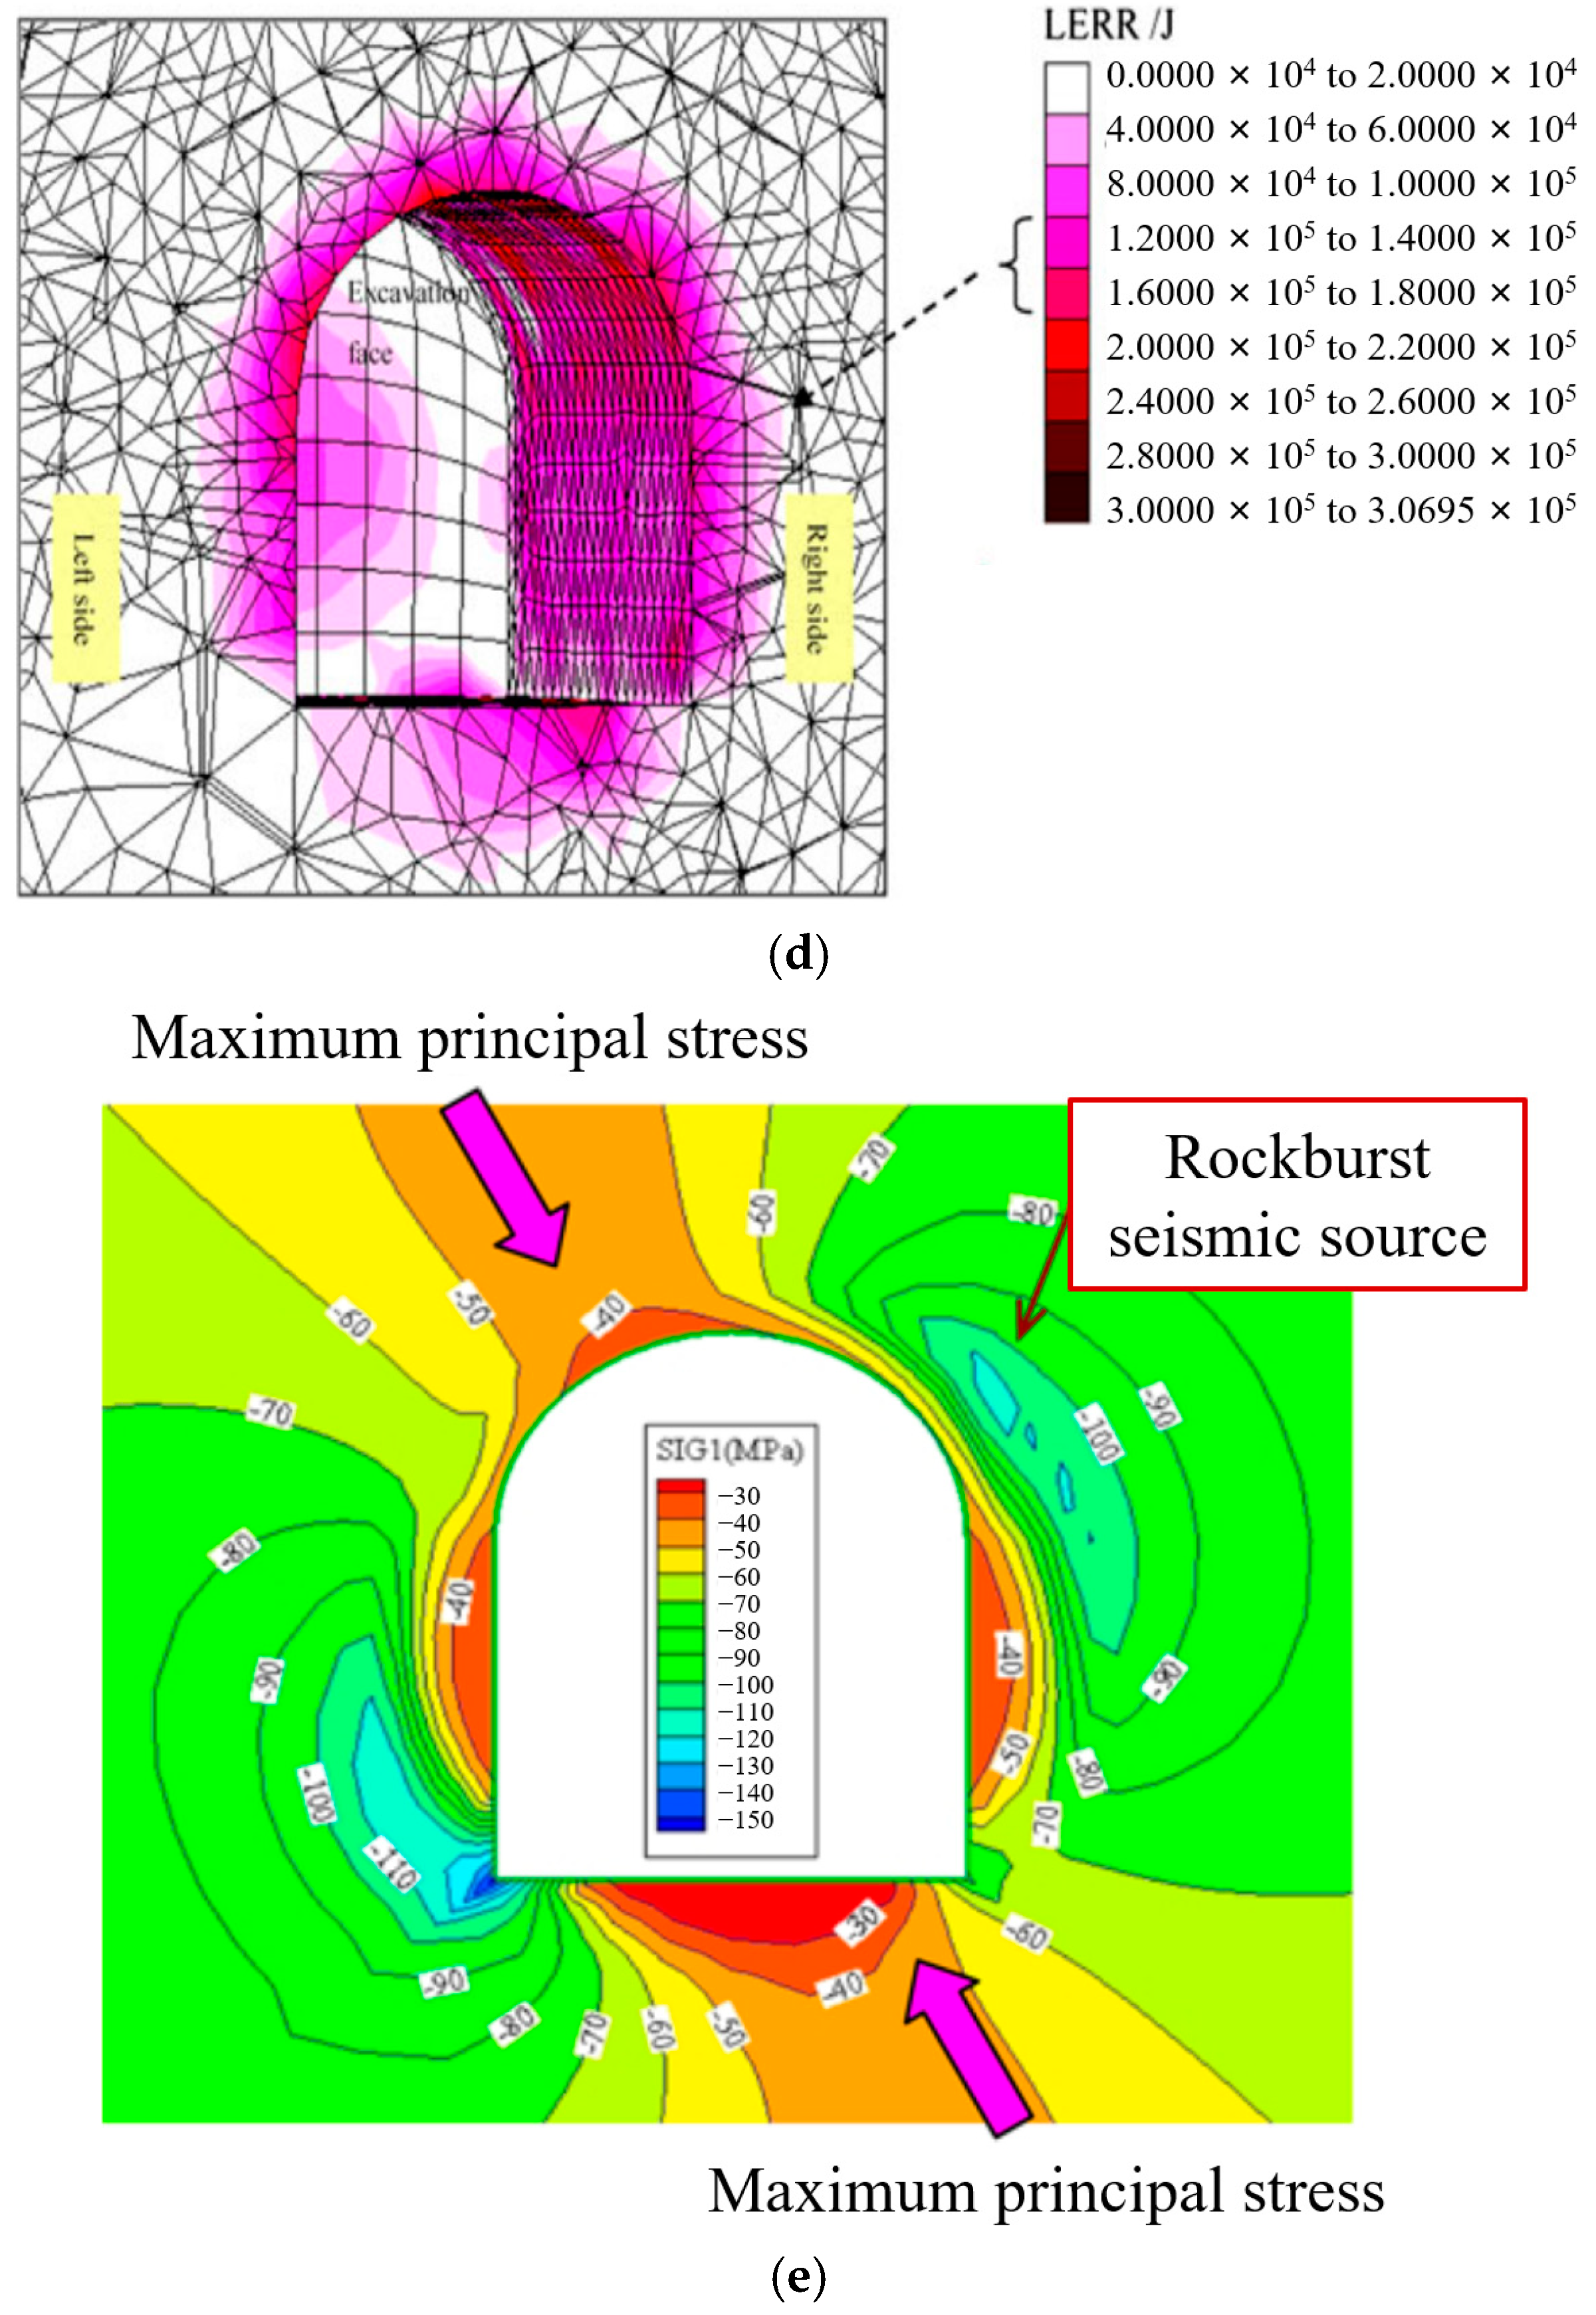
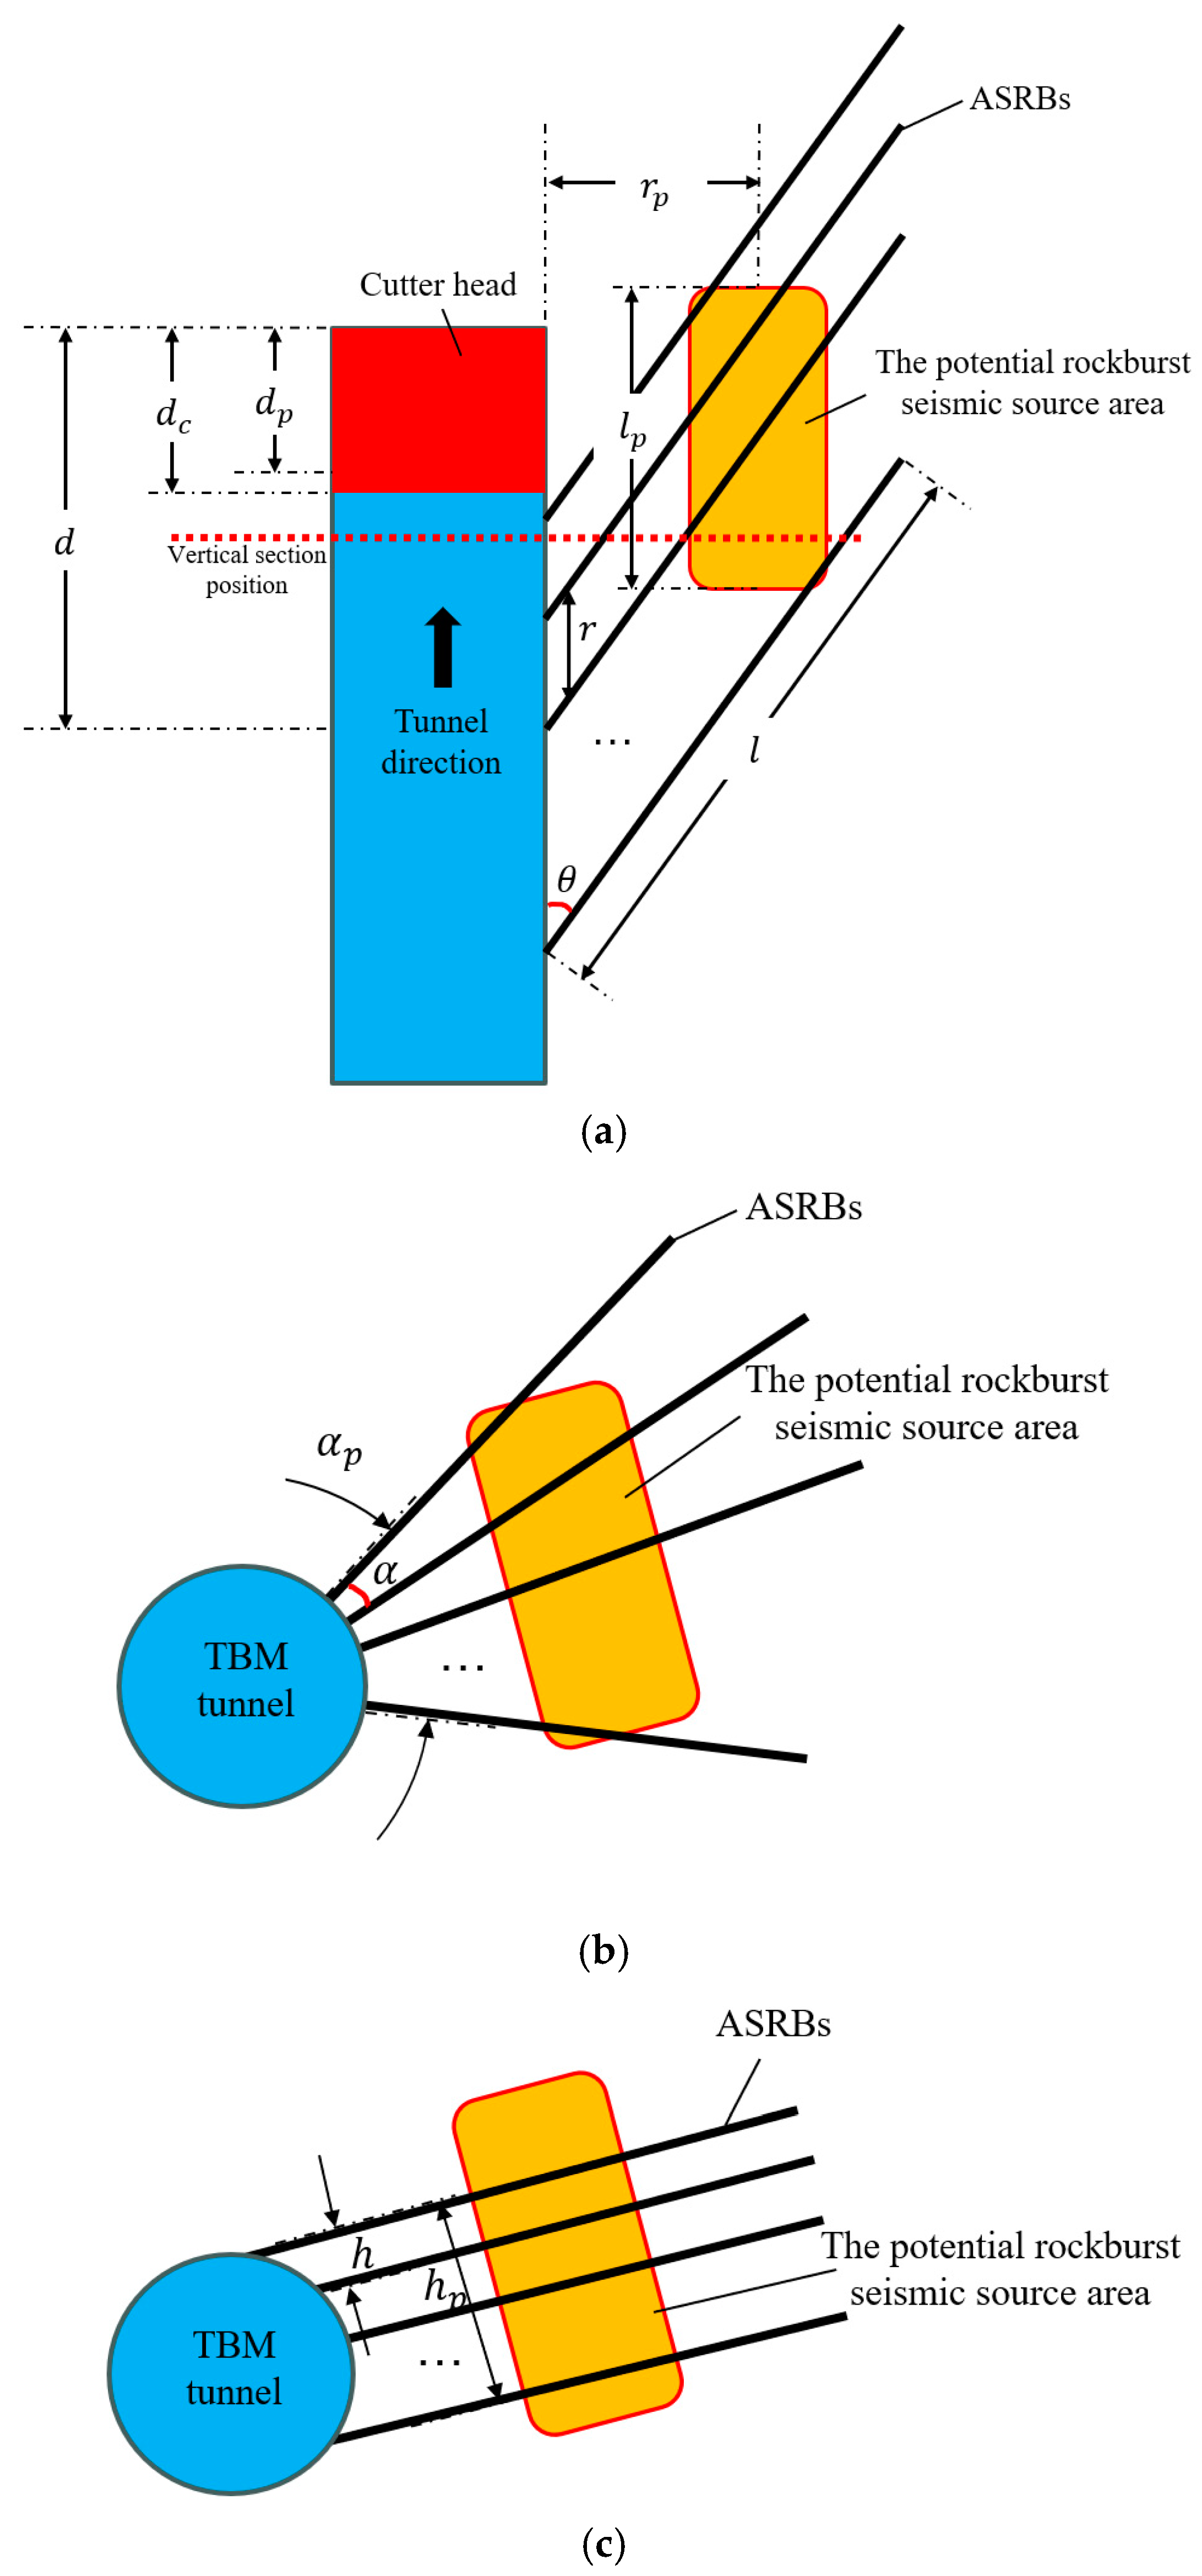
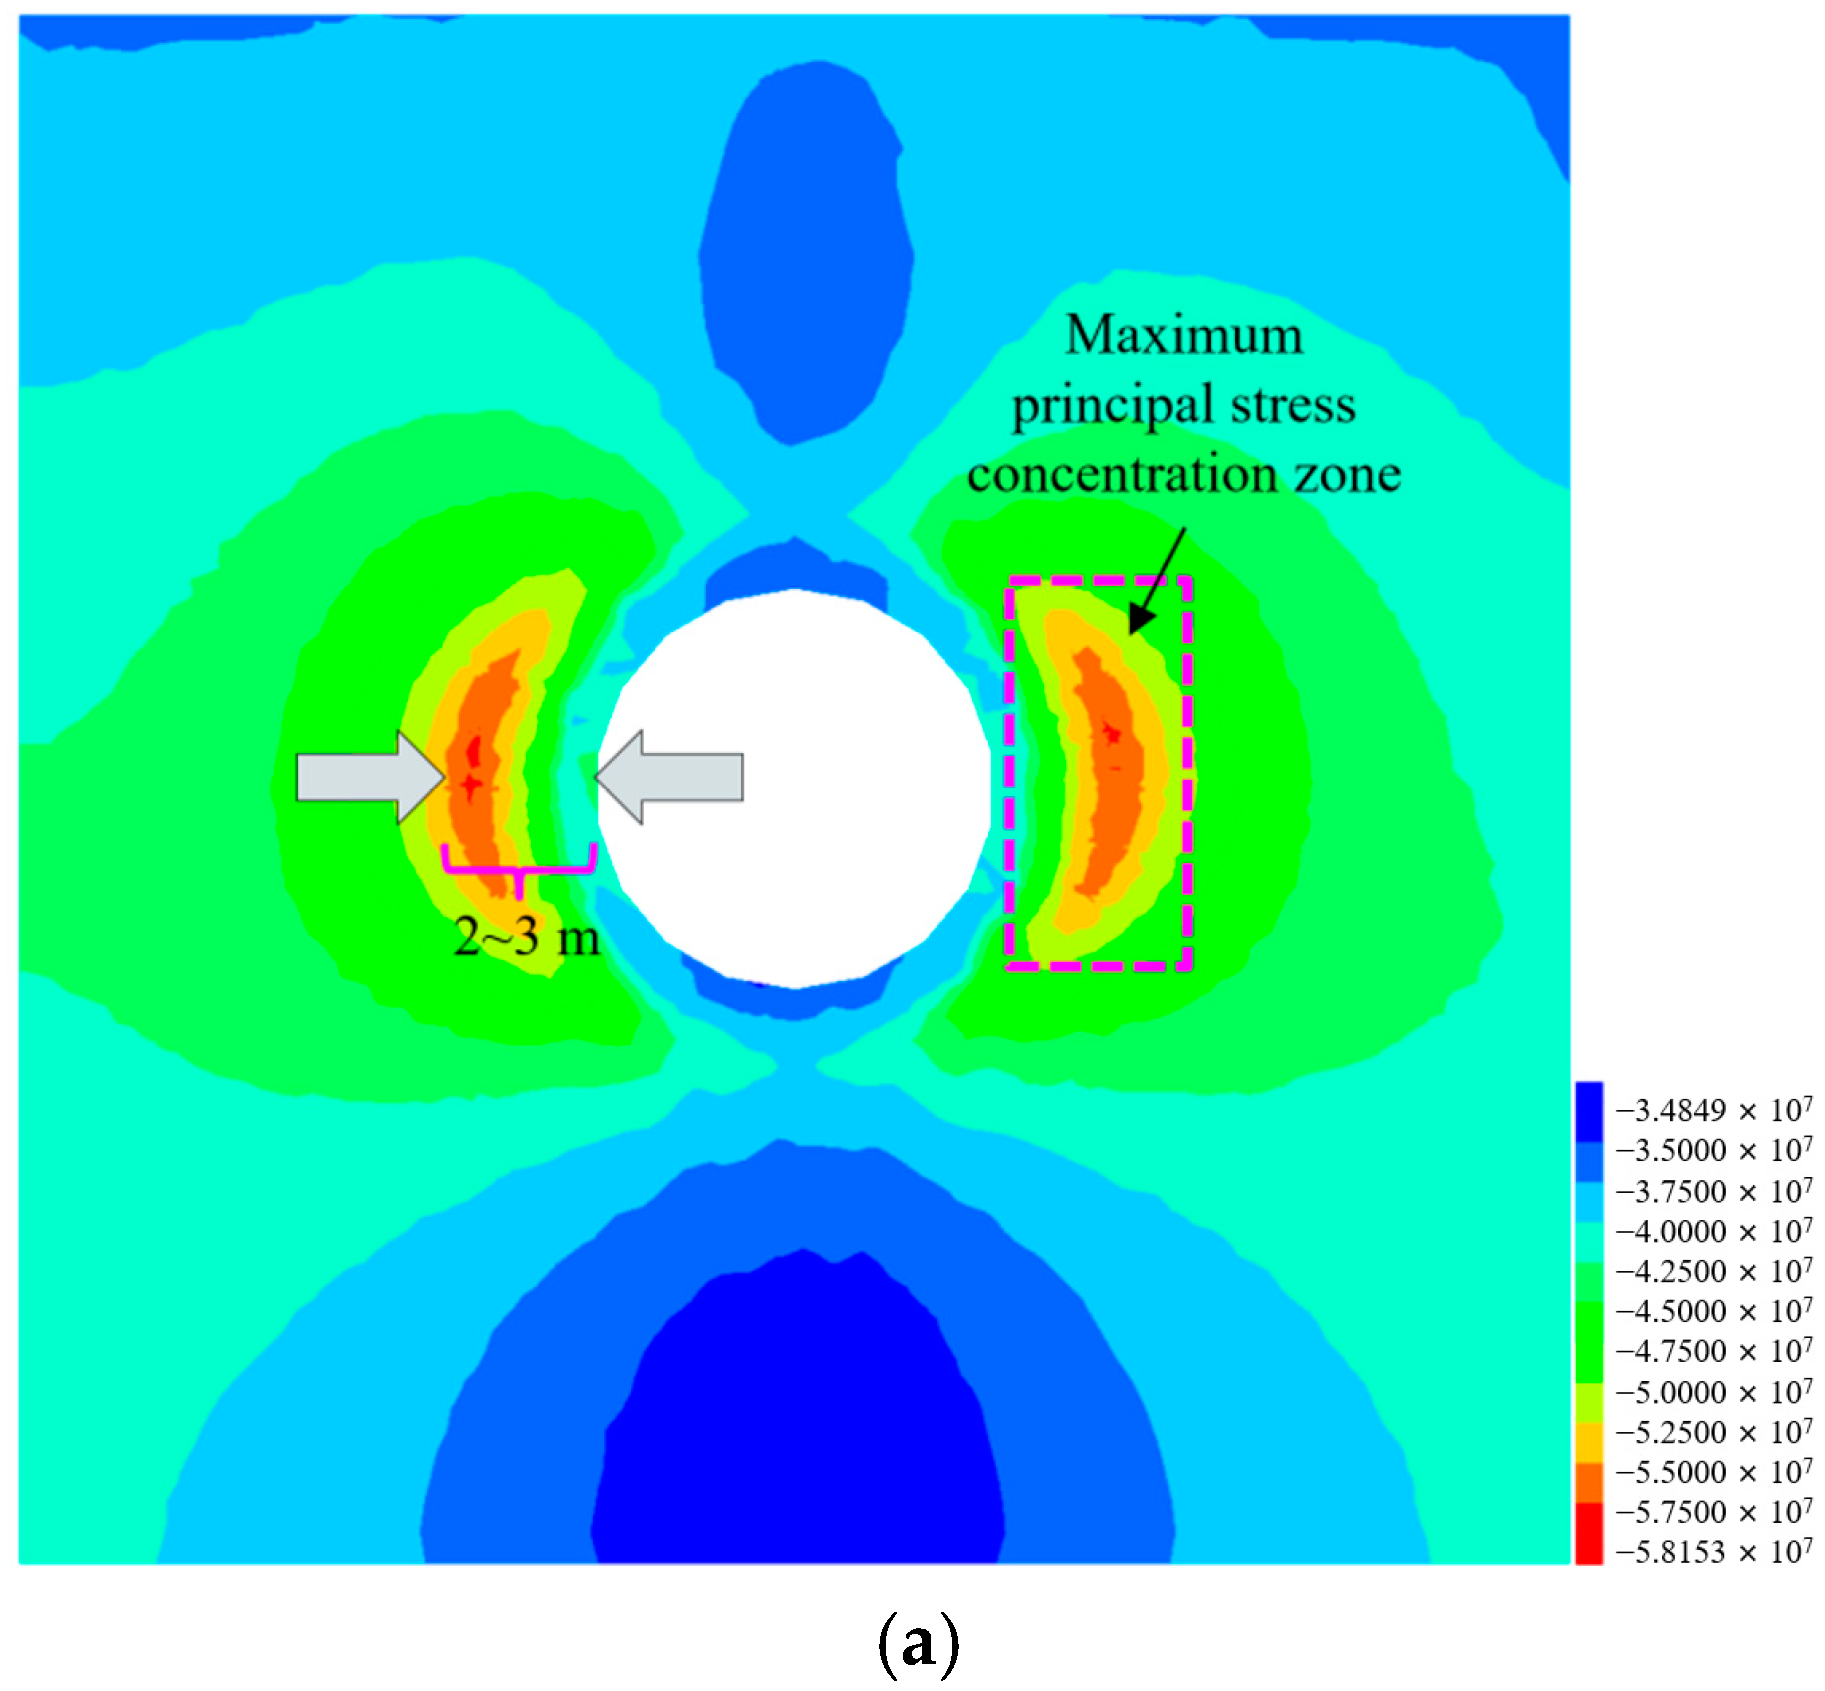
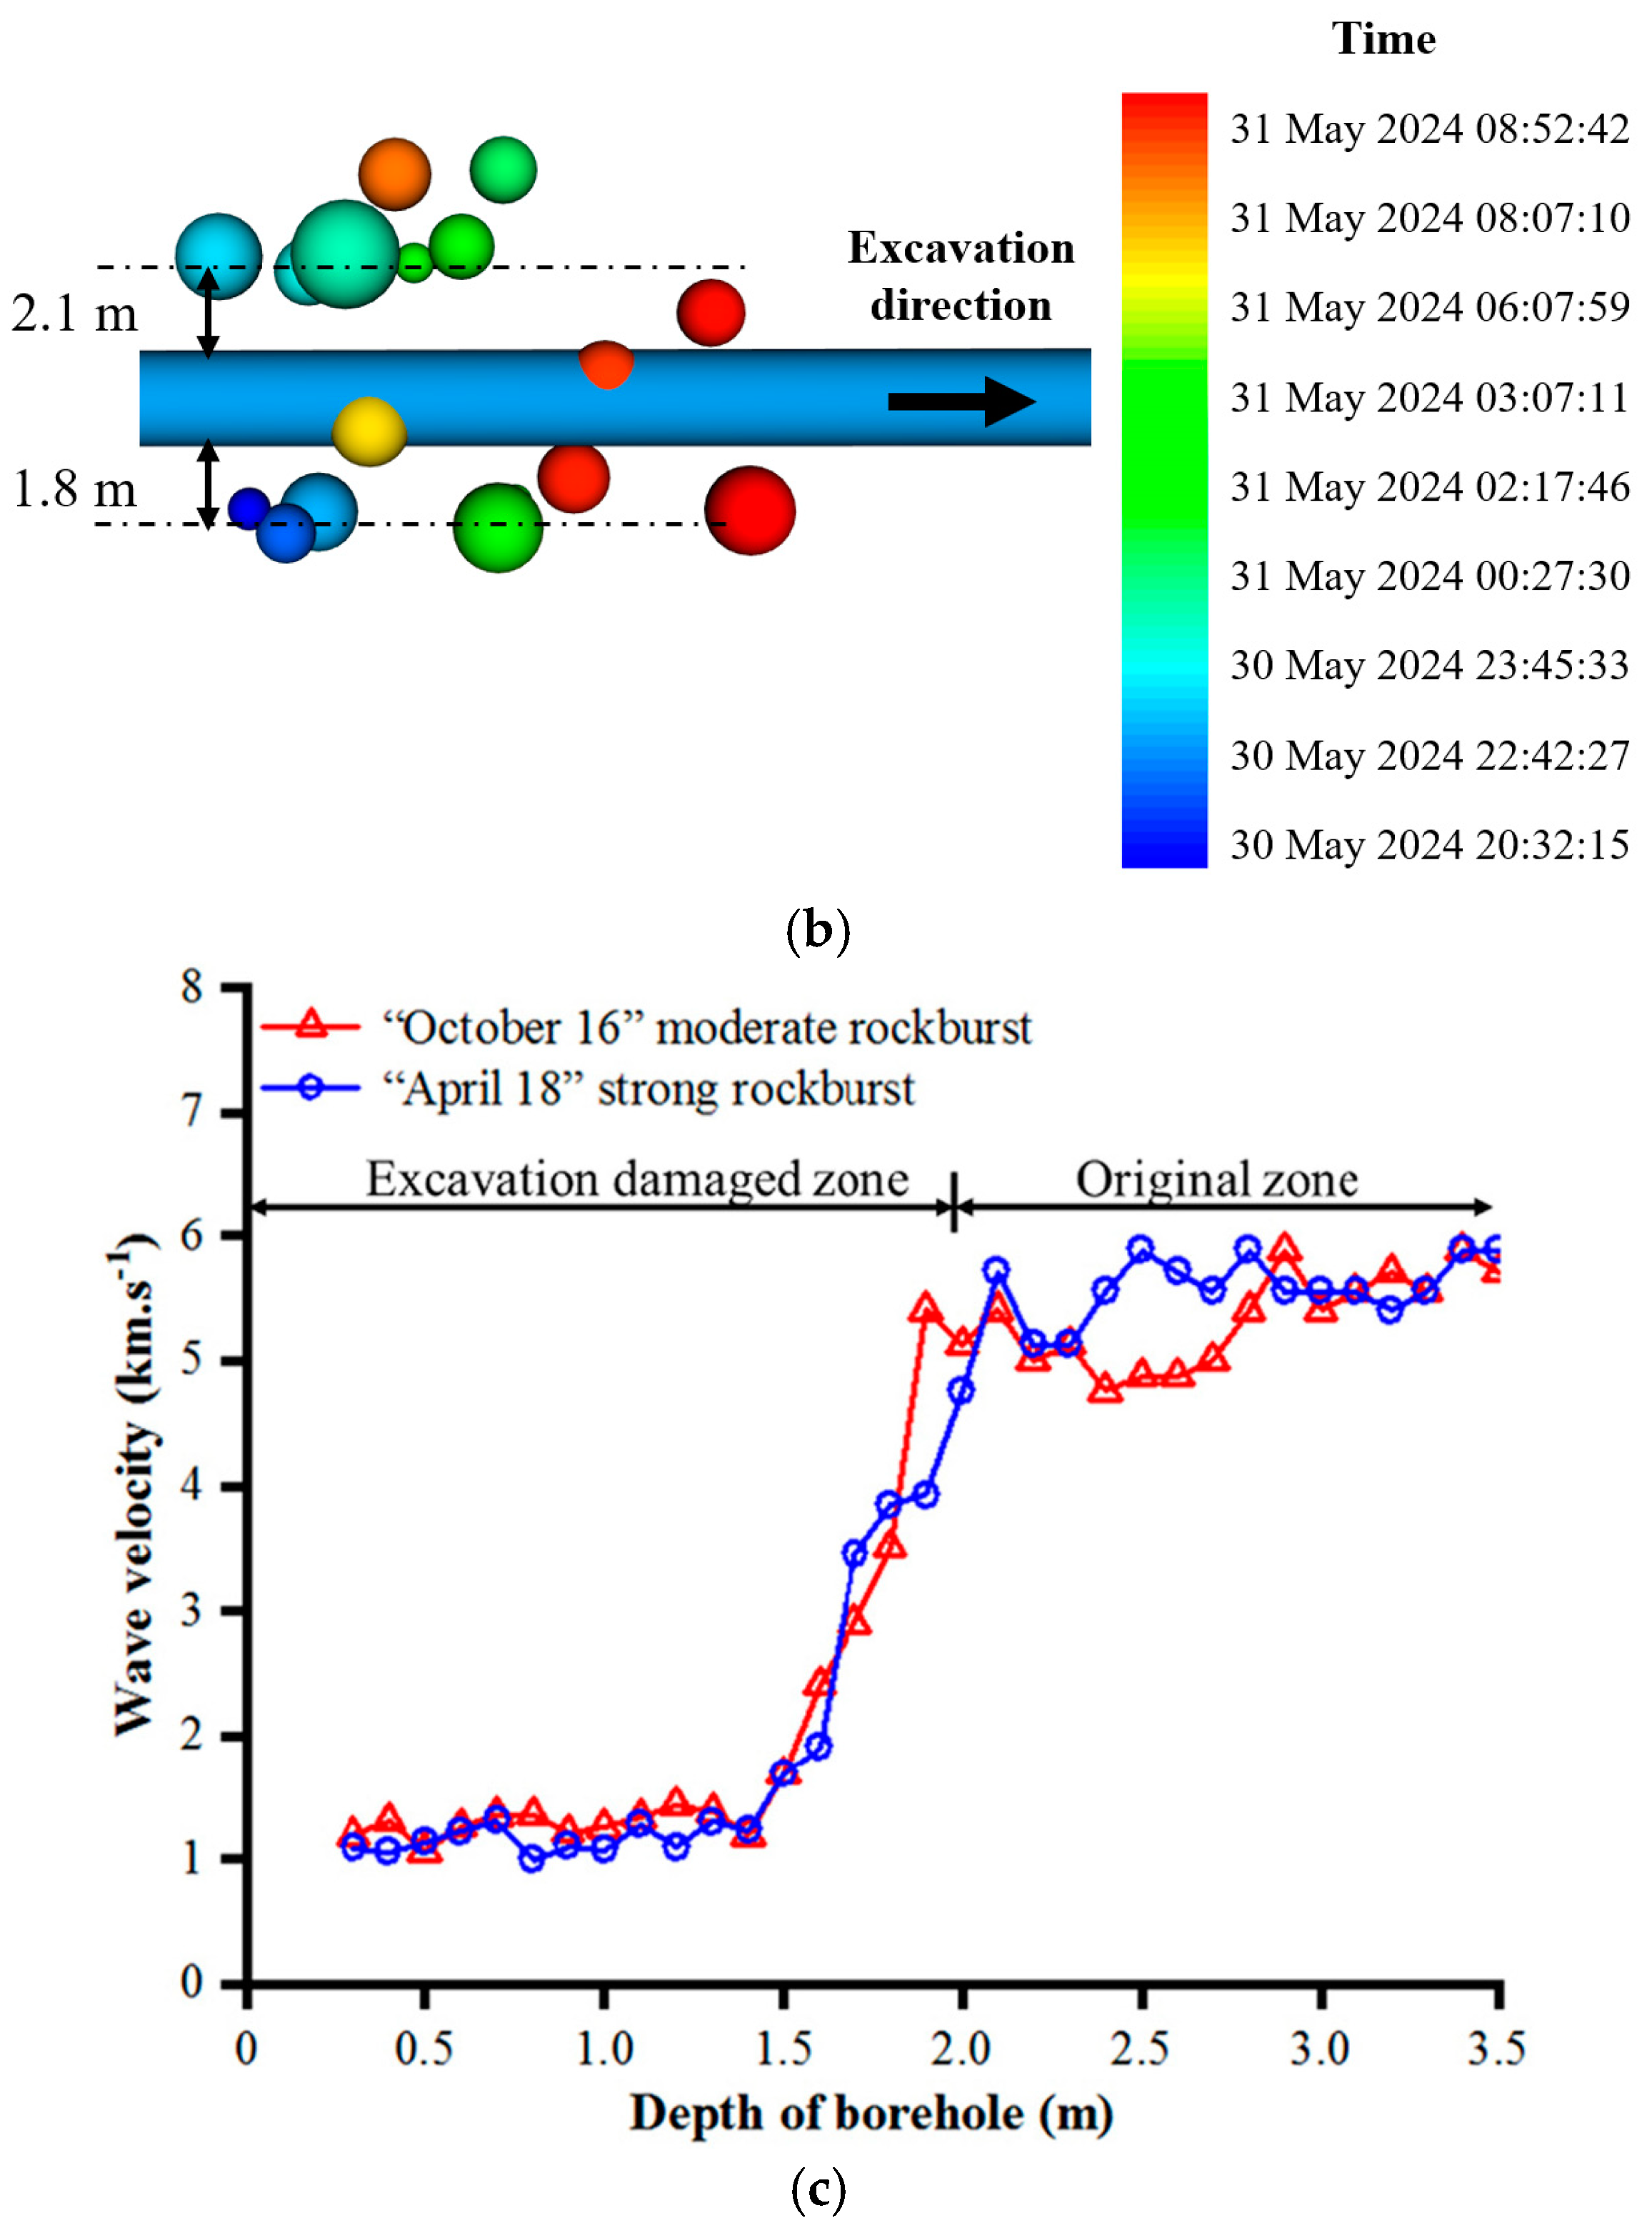
3.2. Identification of Potential Rockburst Source Areas in Deeply Buried Hard Rock TBM Tunnels
3.3. Test Scheme Determination for ASRBs and Method for Evaluating Their Stress Release Effect
3.3.1. Selection of Test Analysis Method
3.3.2. Selection of Design Parameters
3.3.3. Selection of Test Scheme
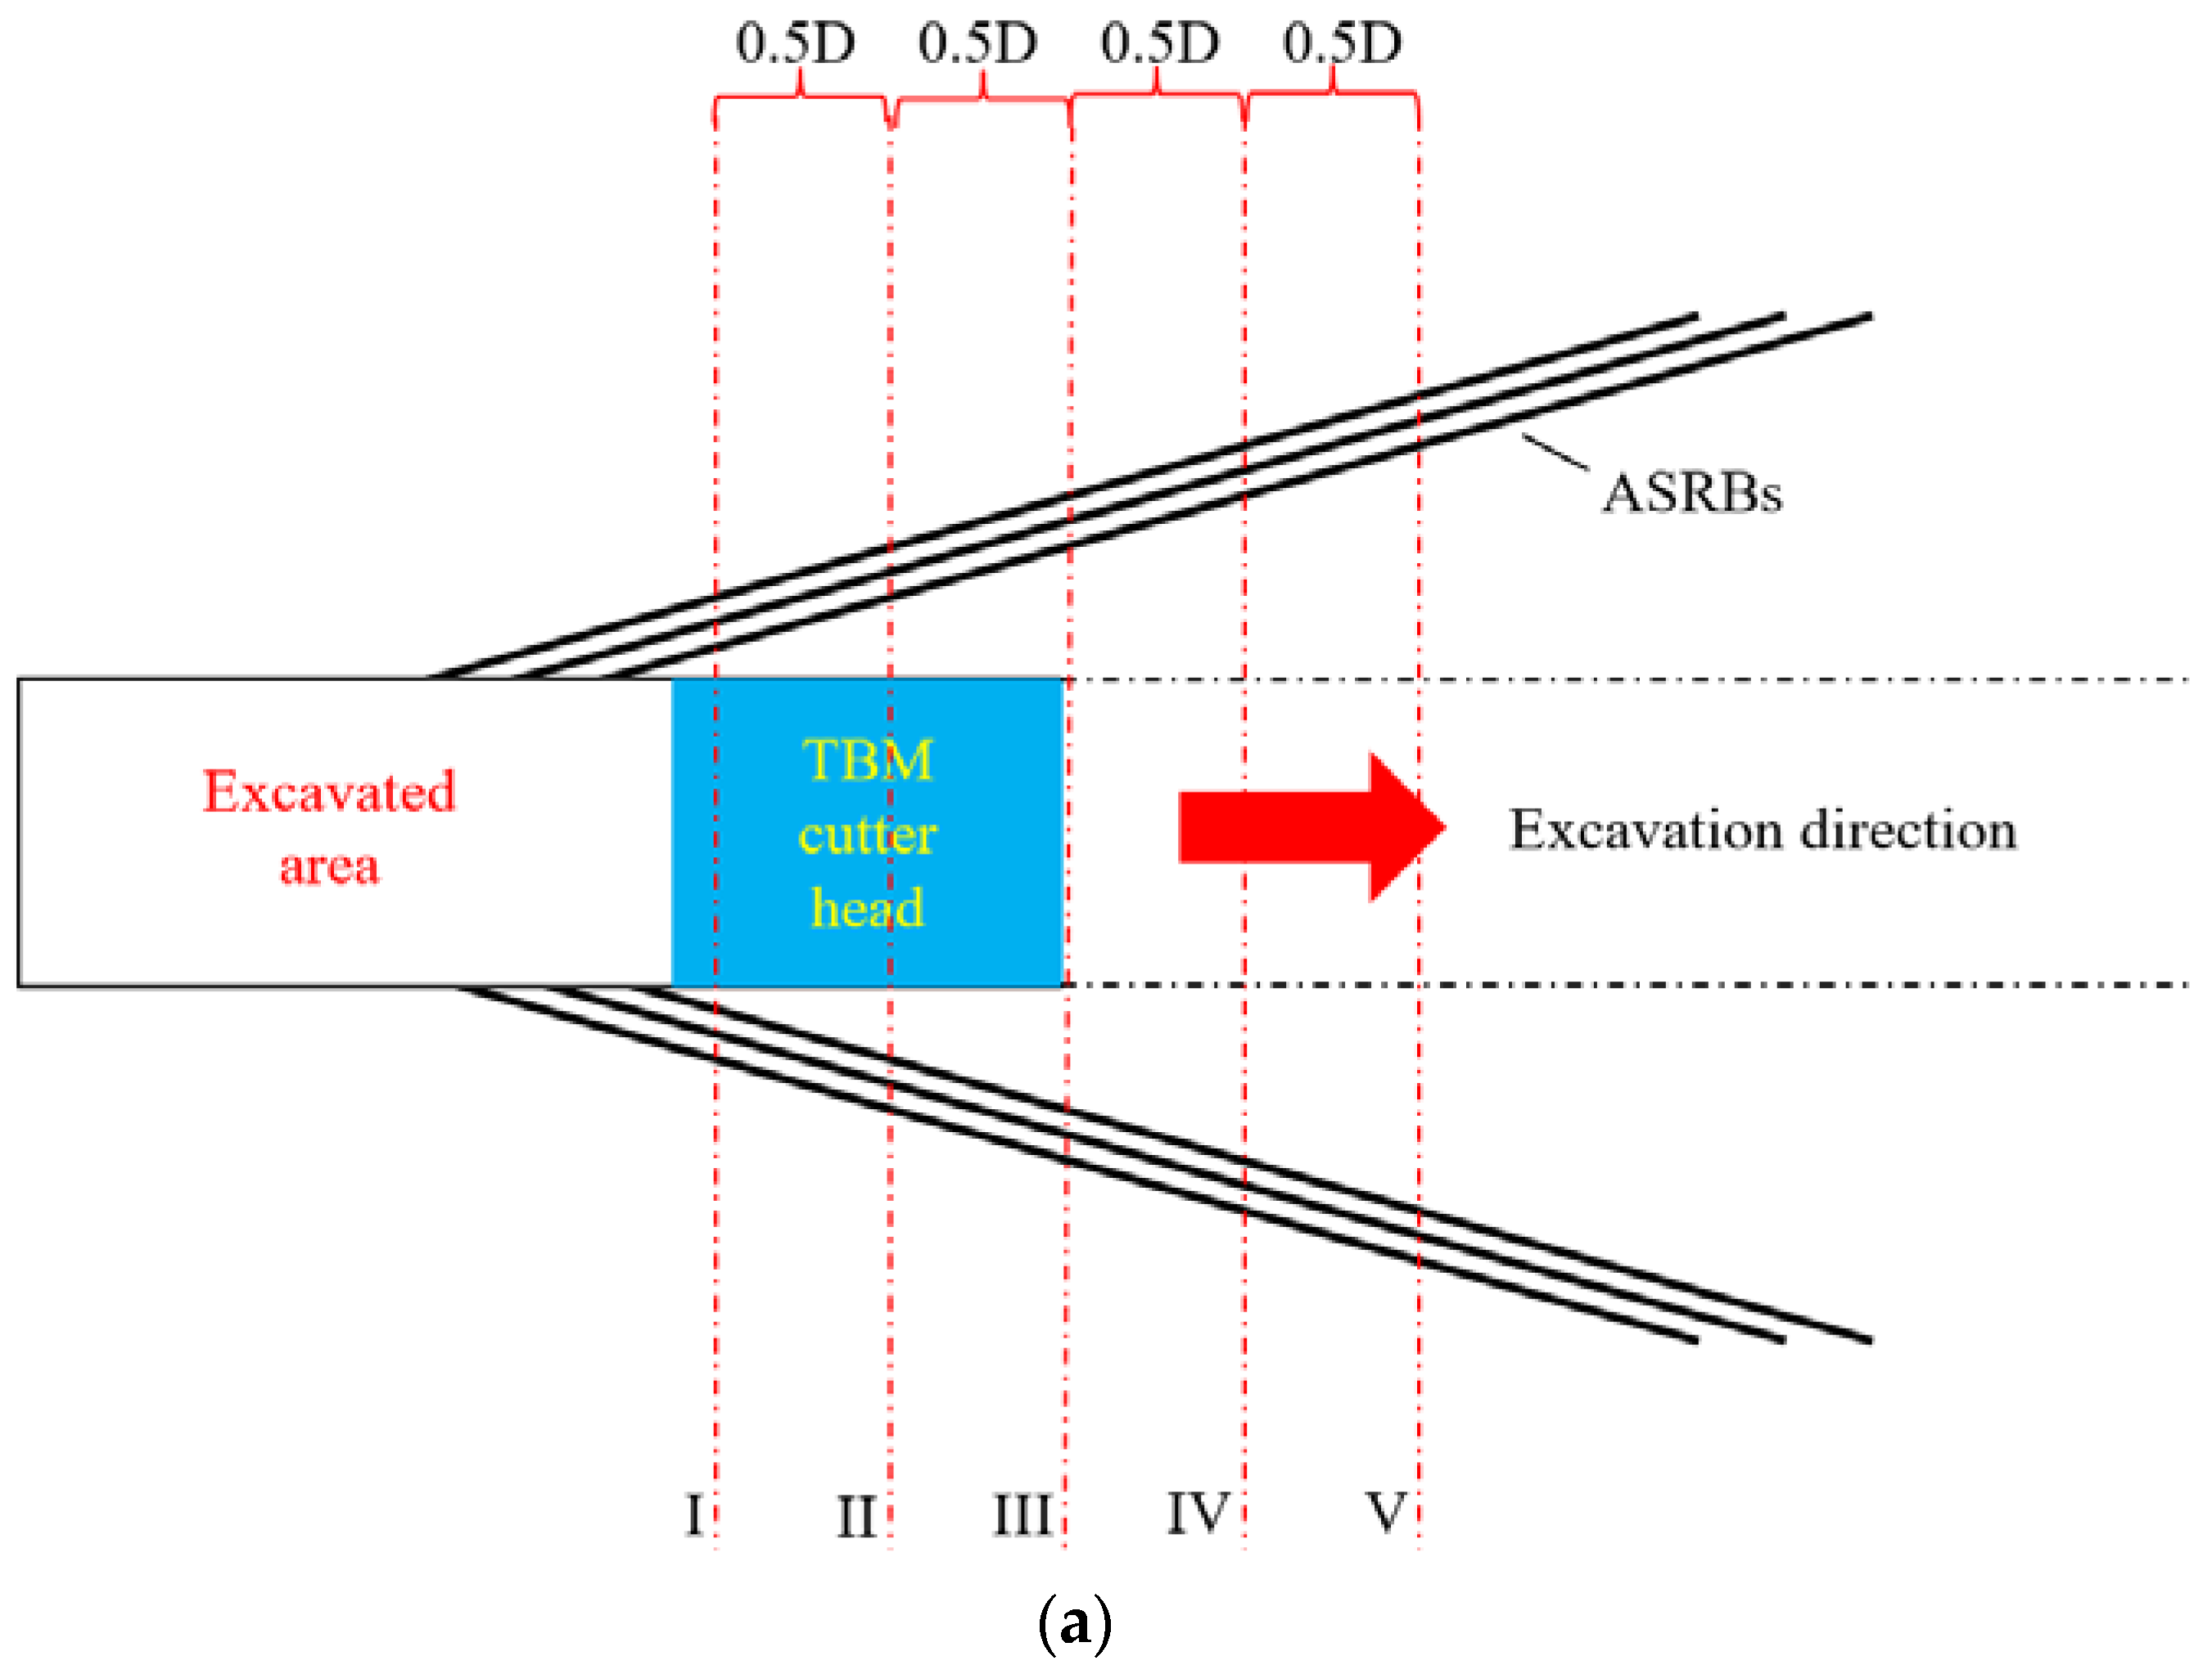
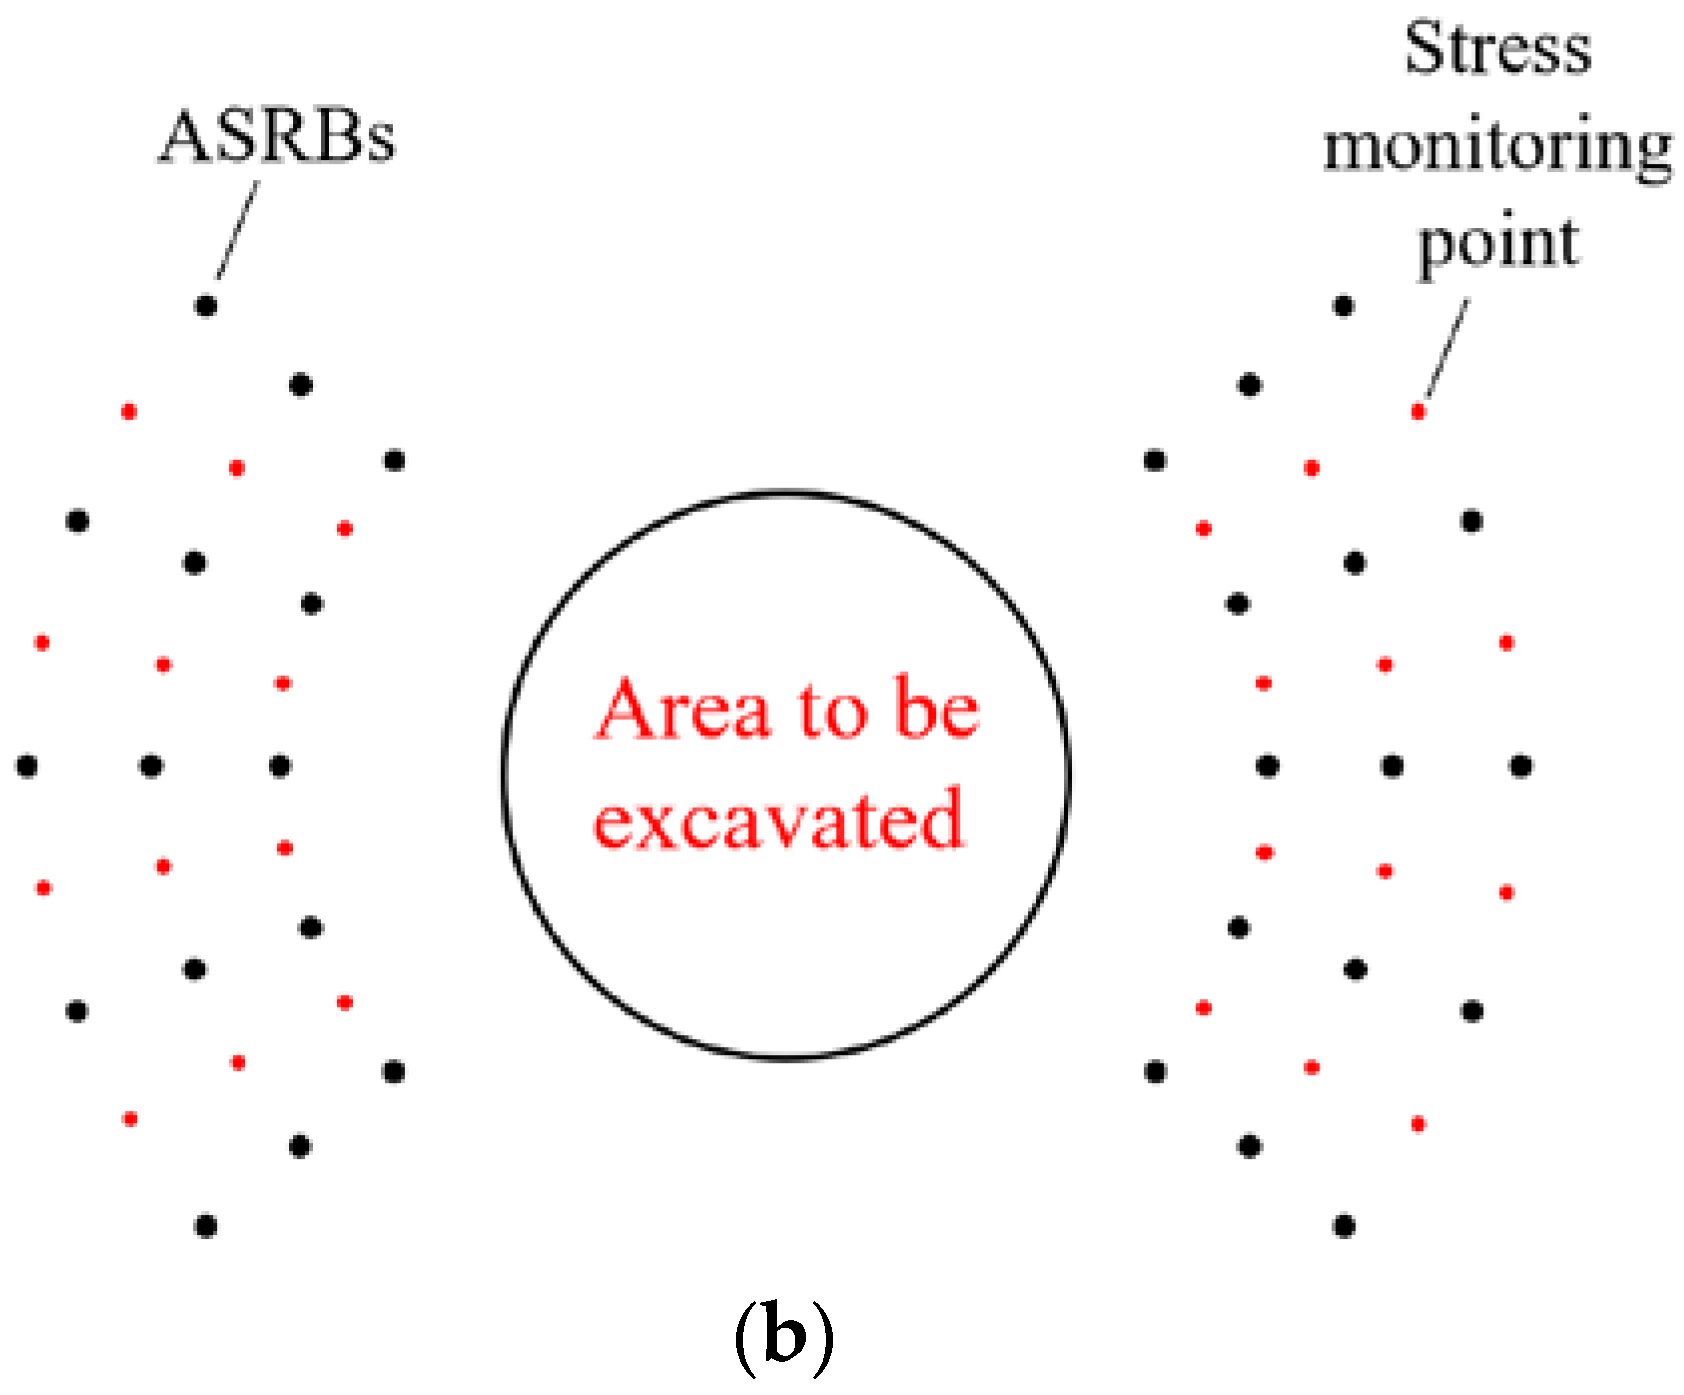
3.3.4. Establishment of Test Scheme Indicators
- (1)
- Stress aspect
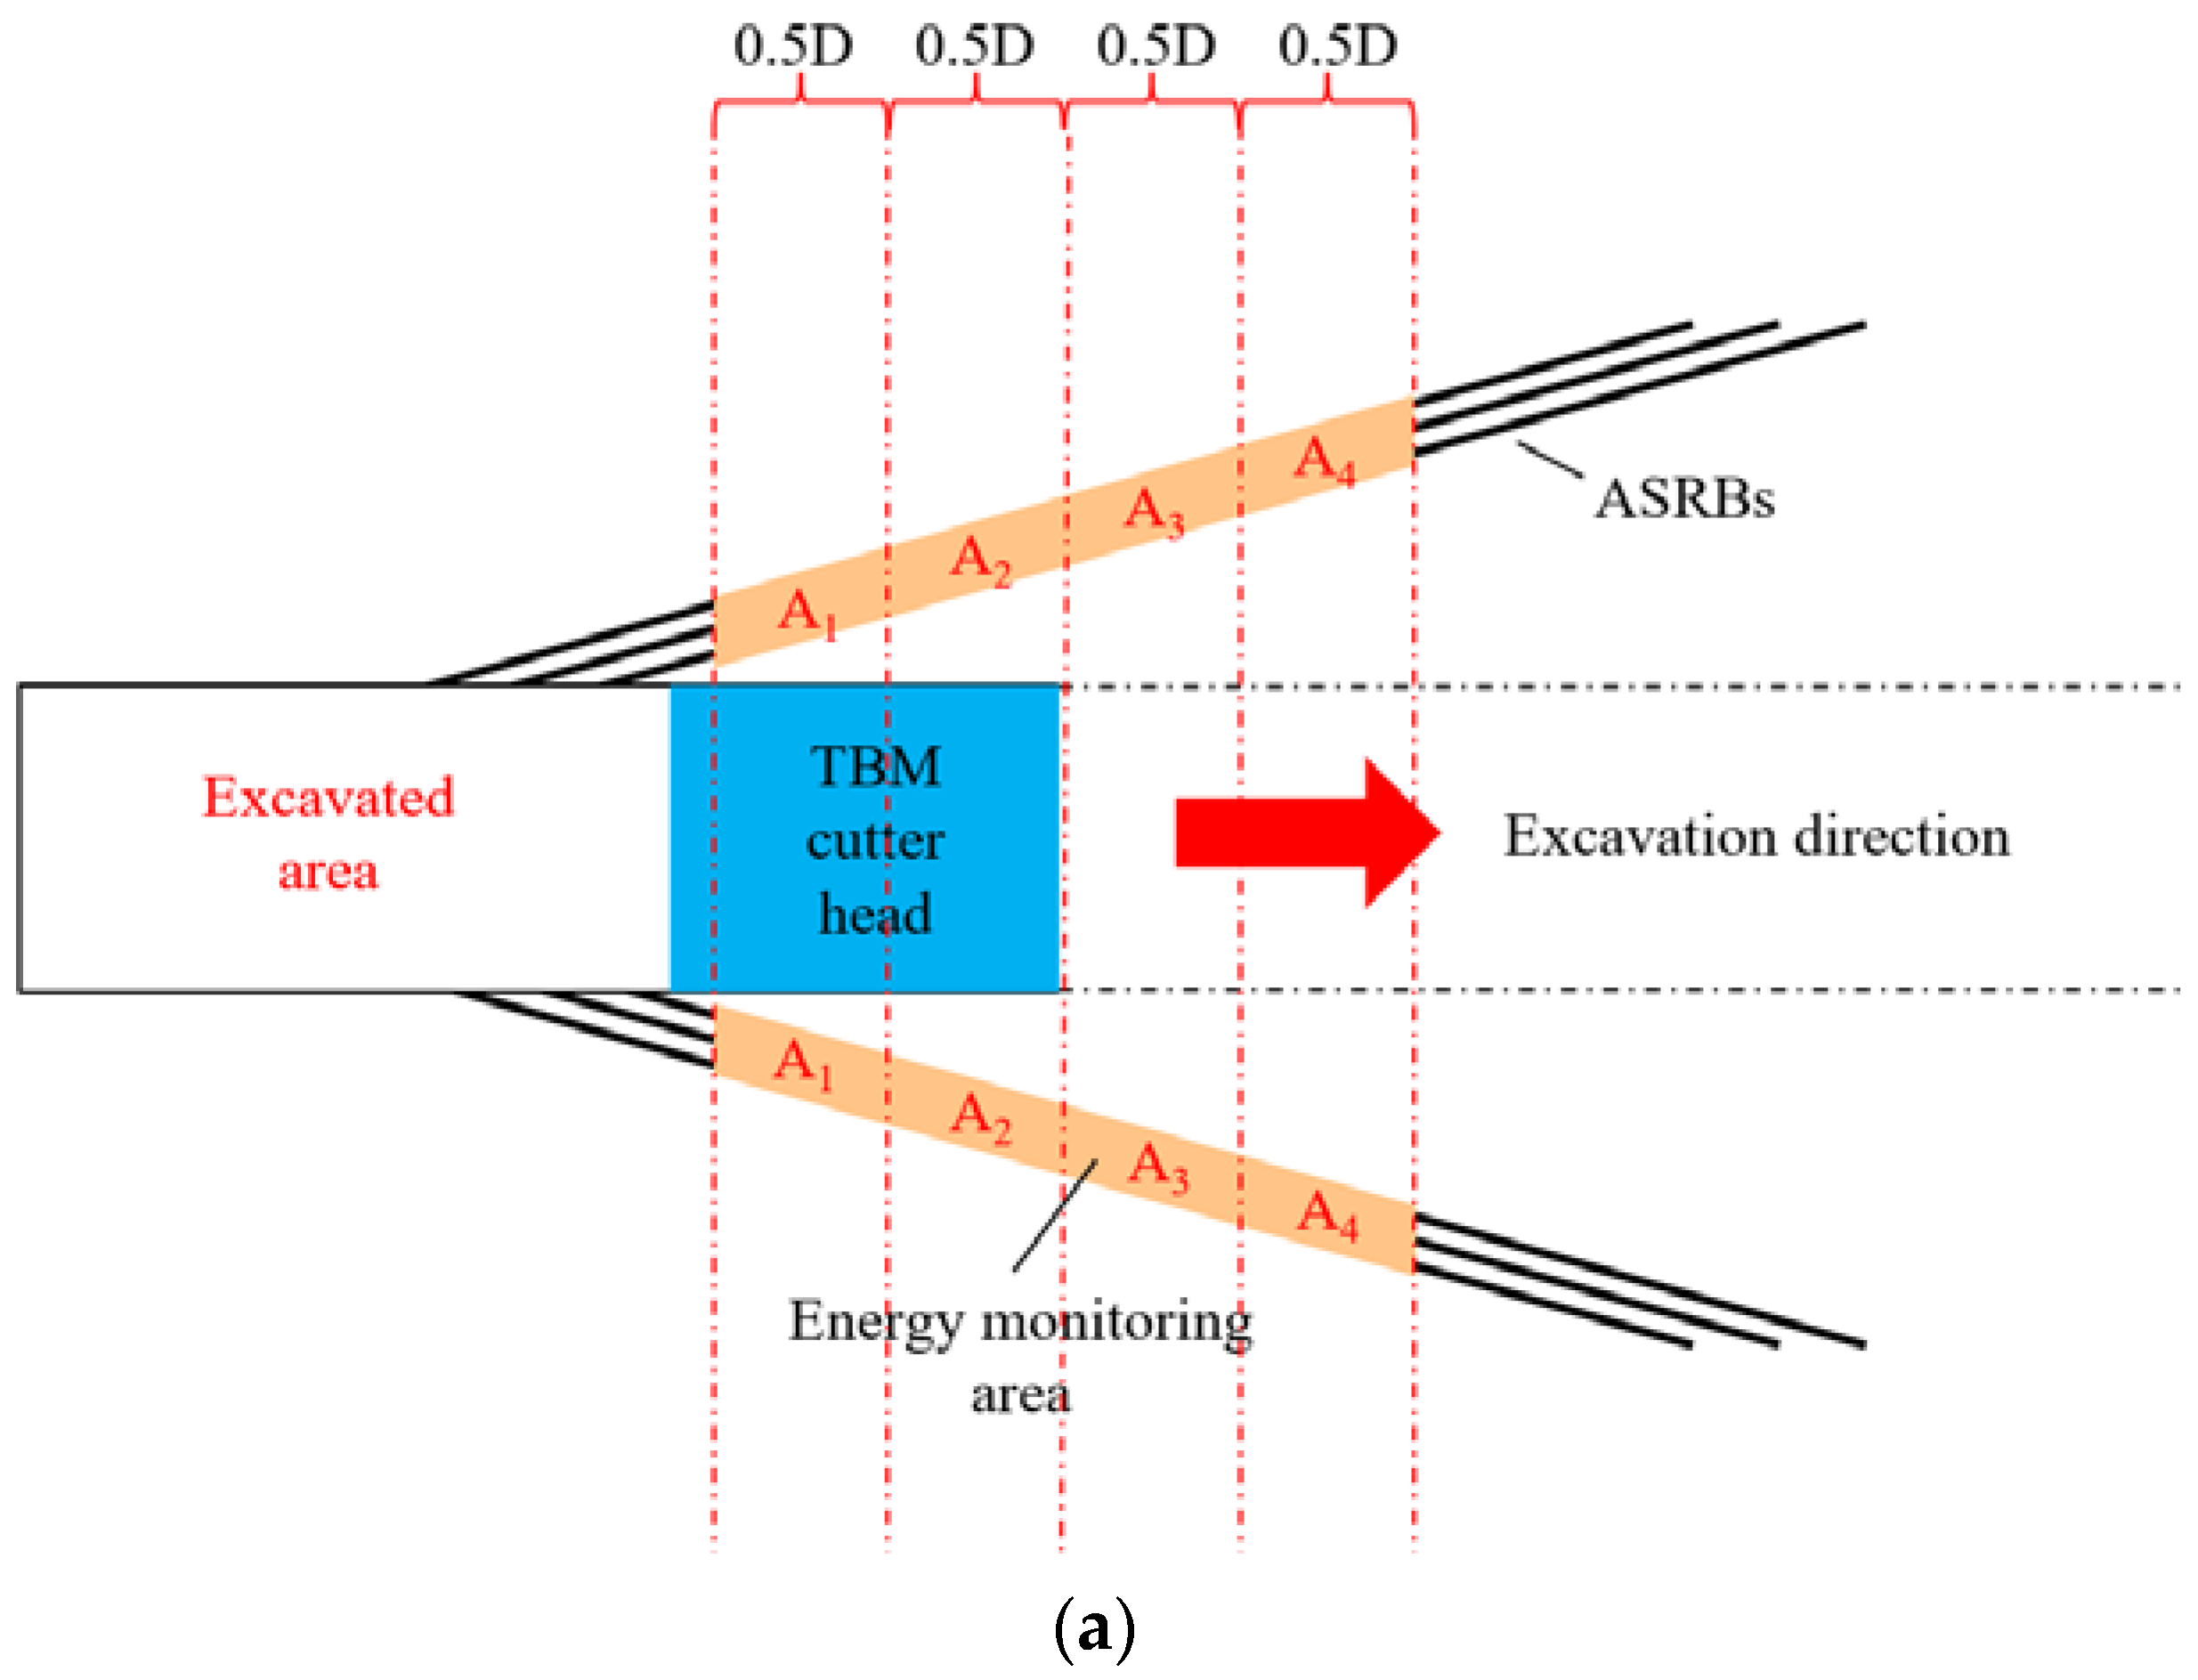
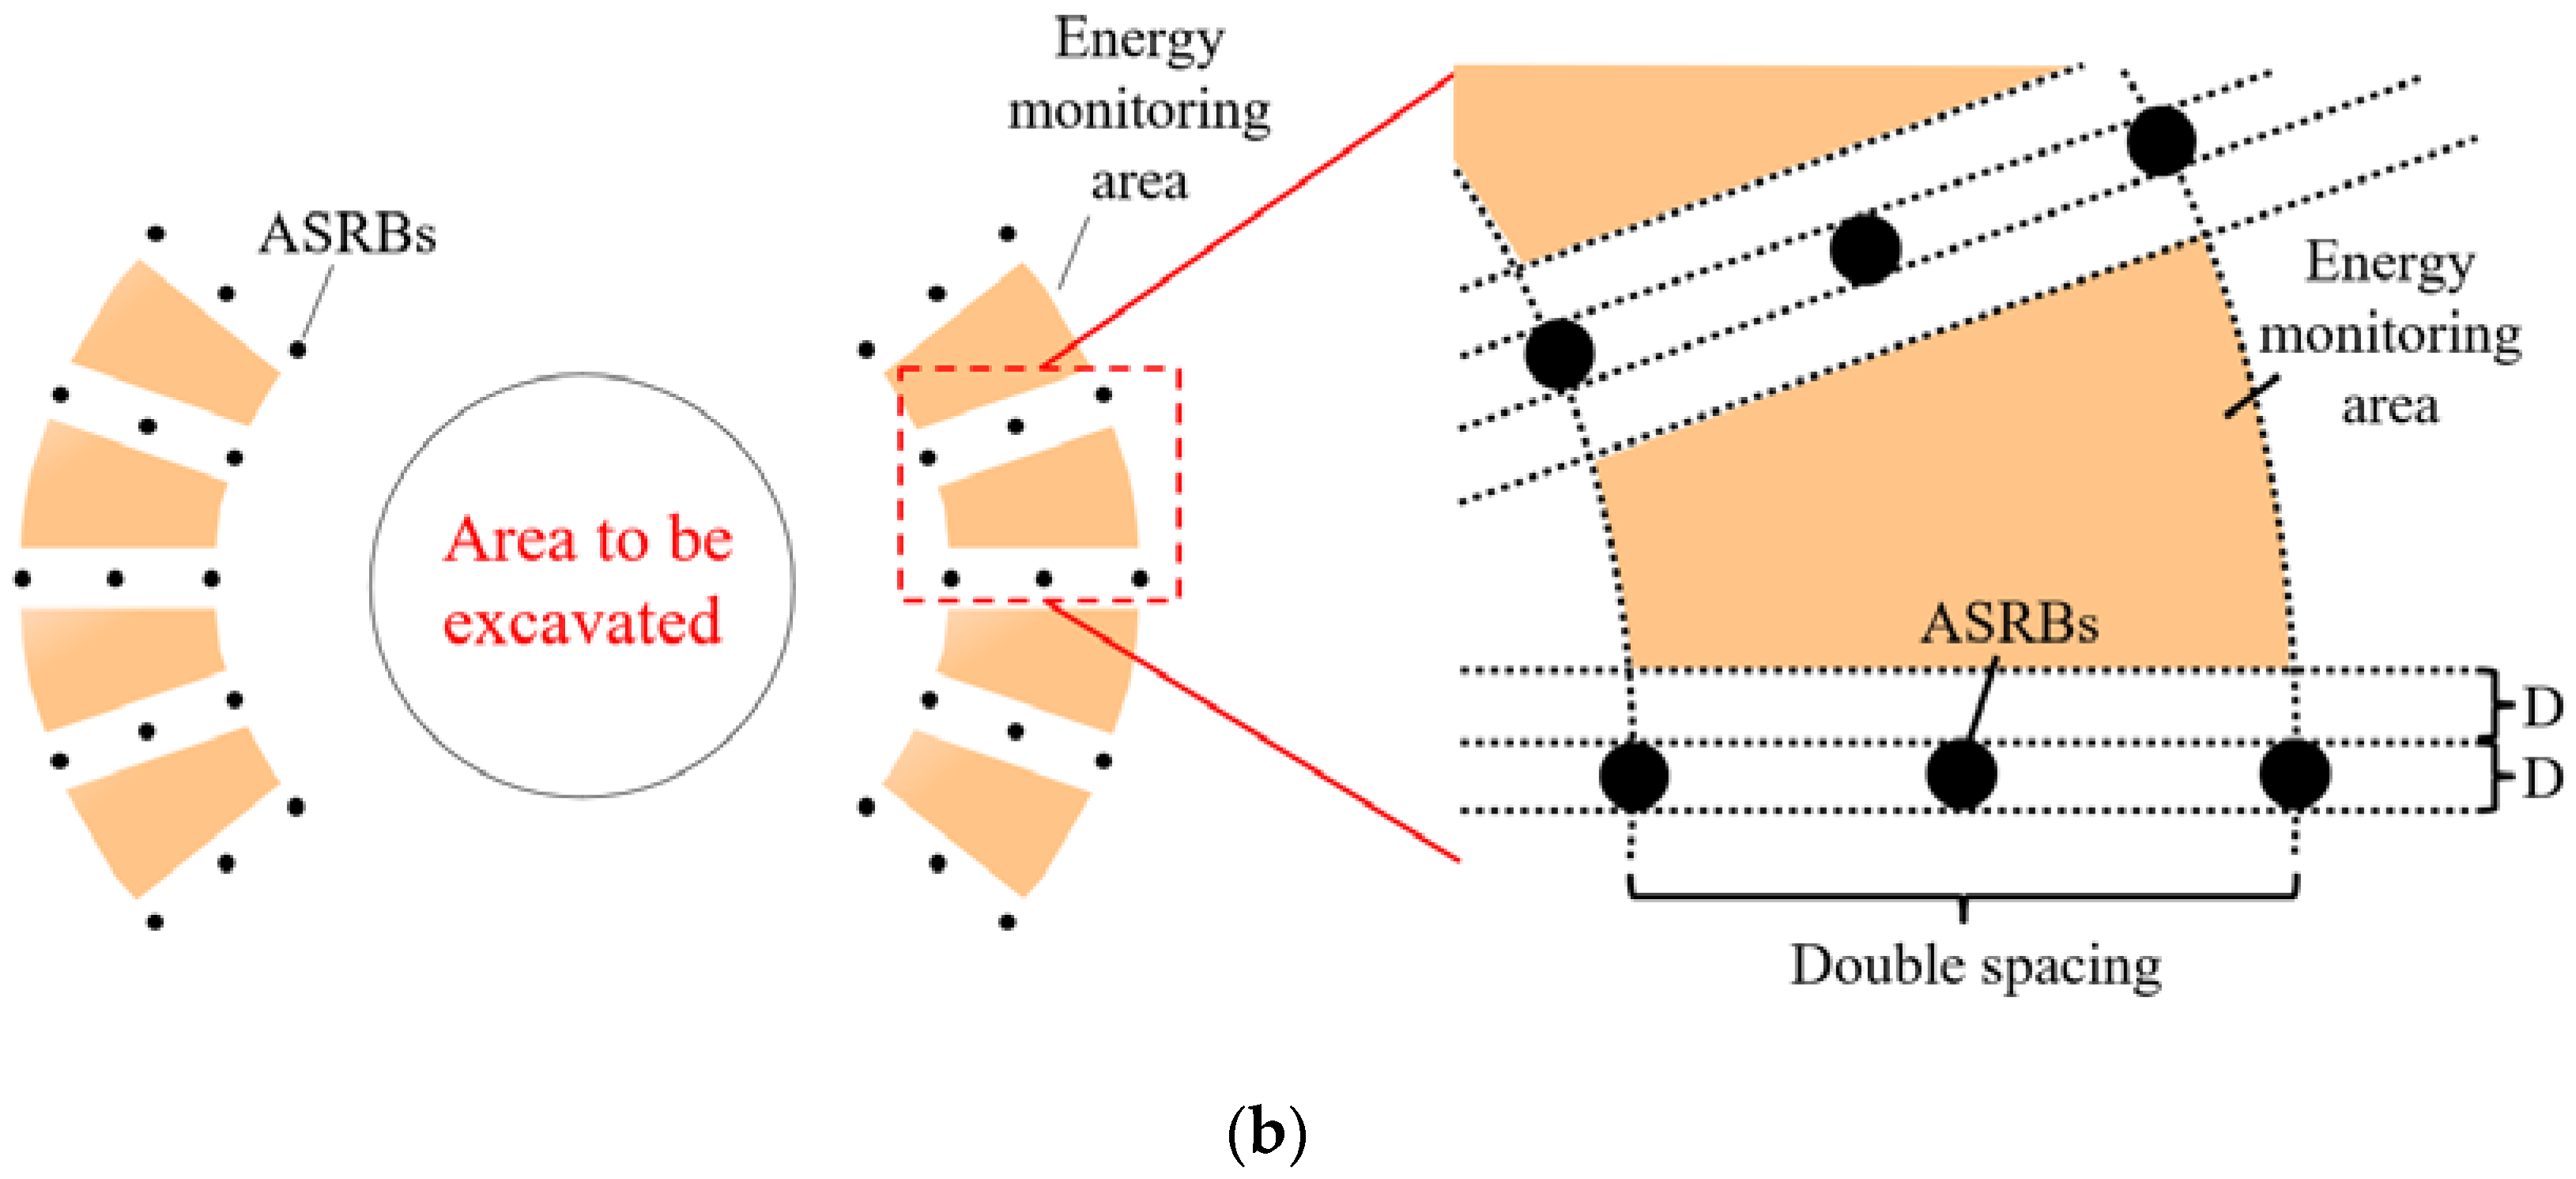
- (2)
- Energy aspect
3.4. Analysis and Design Optimization of ASRB Parameters
3.5. Selection of the Optimal ASRB Layout Plan in Line with Engineering Best Practices
4. Engineering Application of the ASRB Parameter Design Method
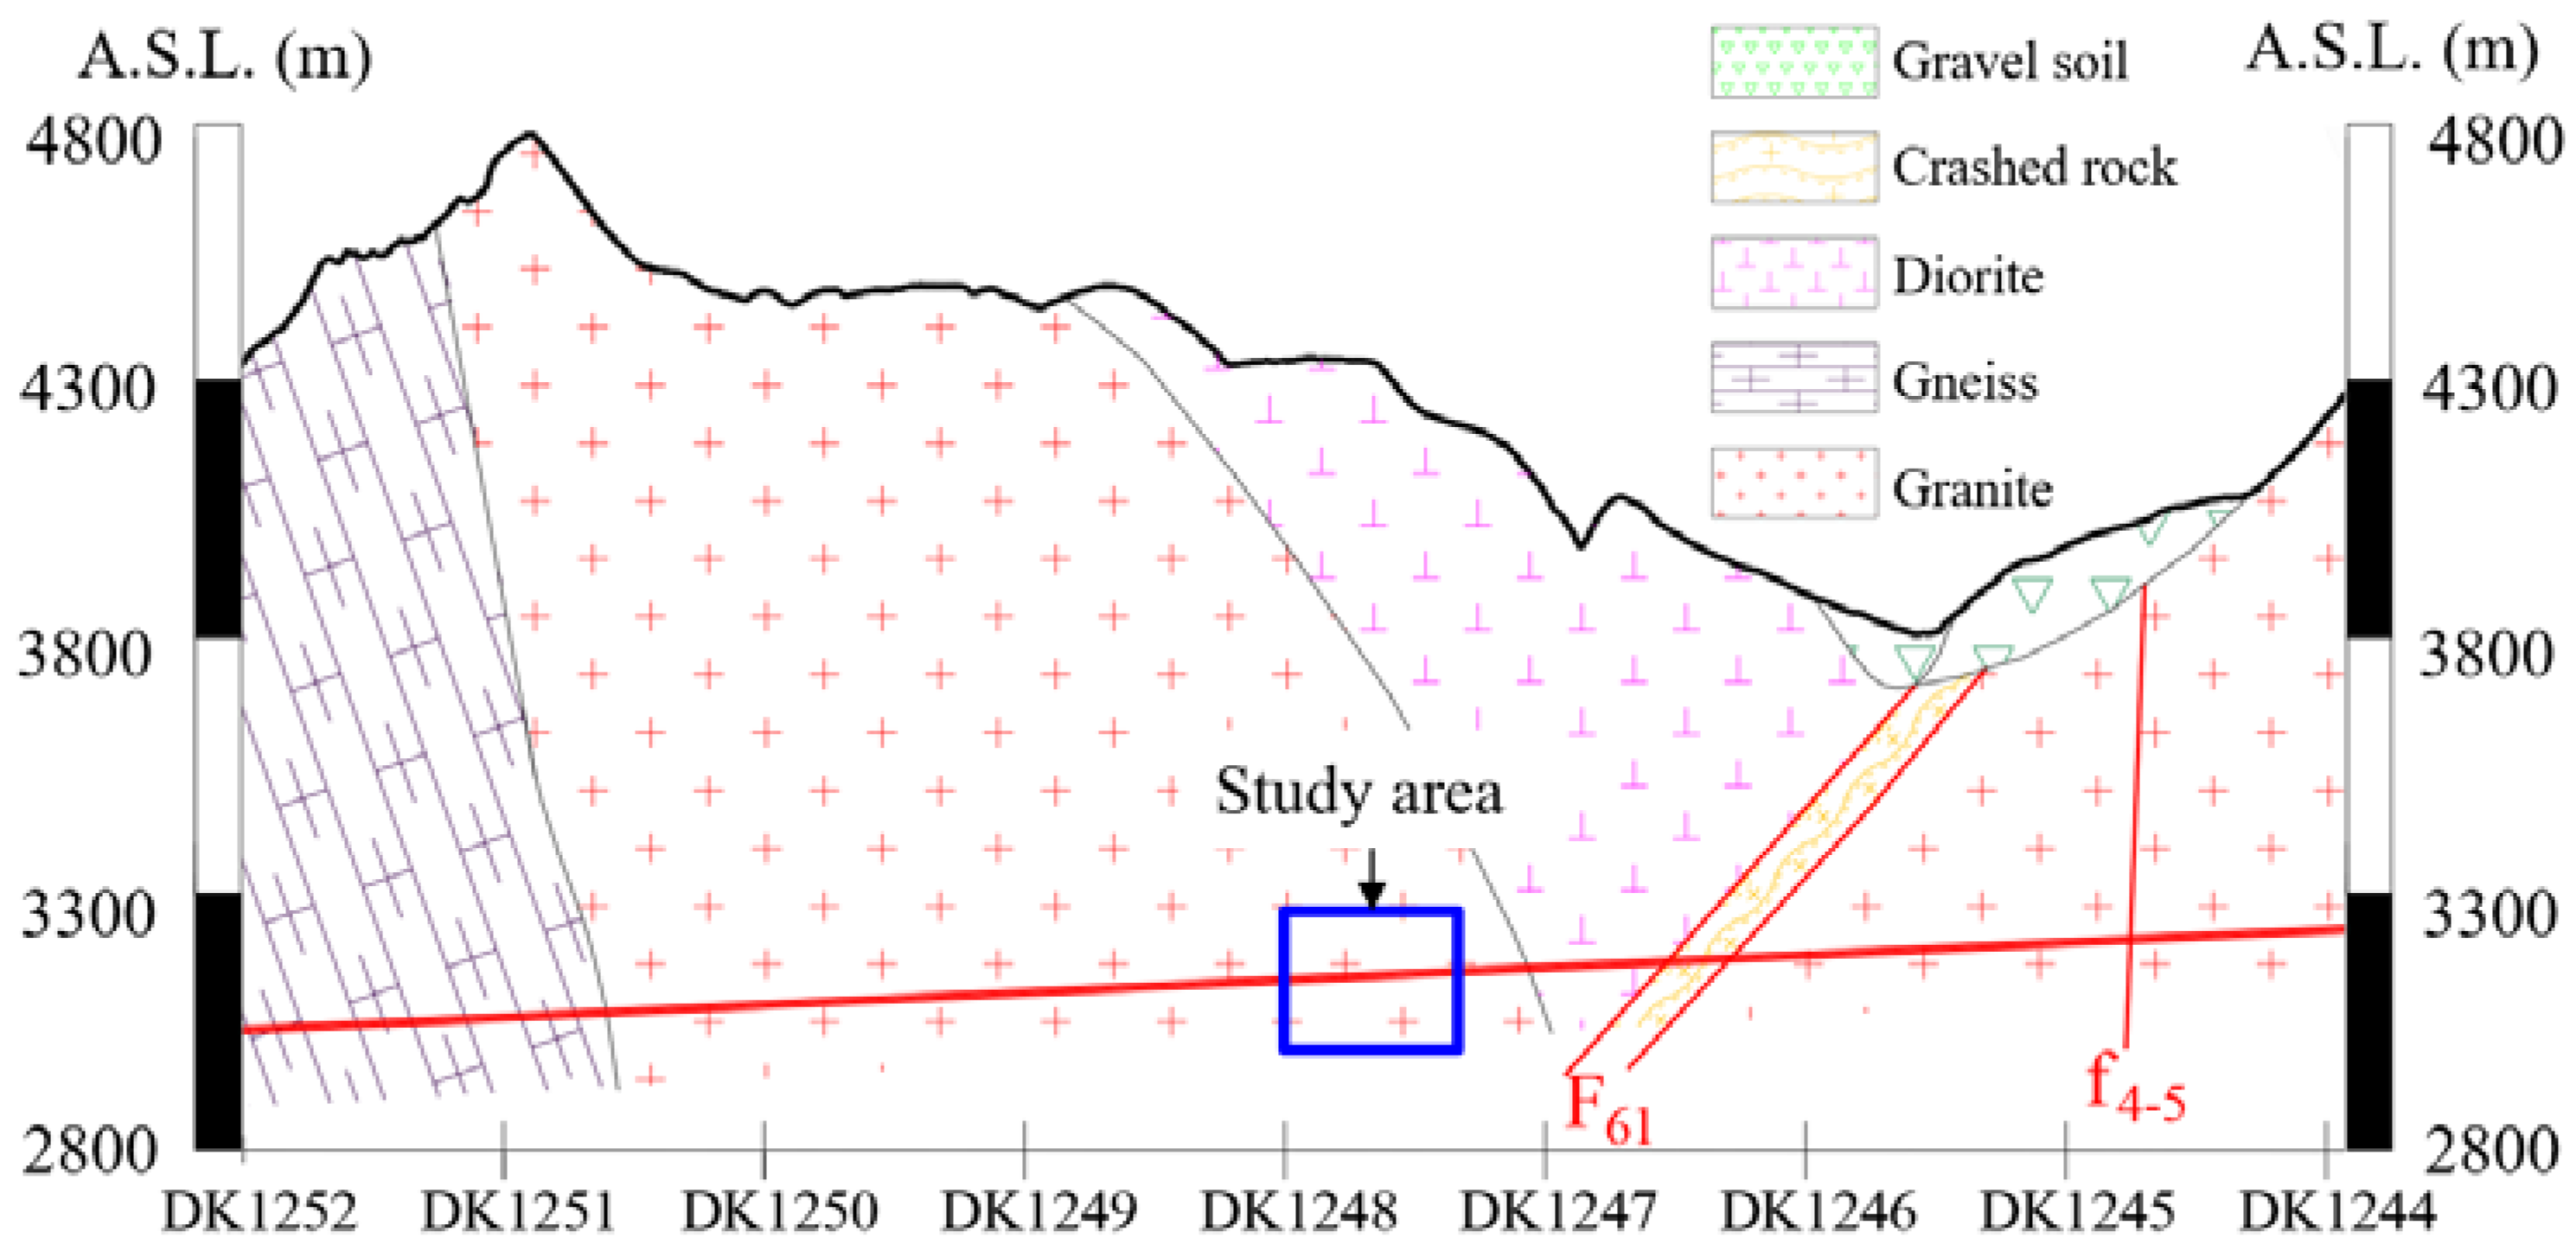
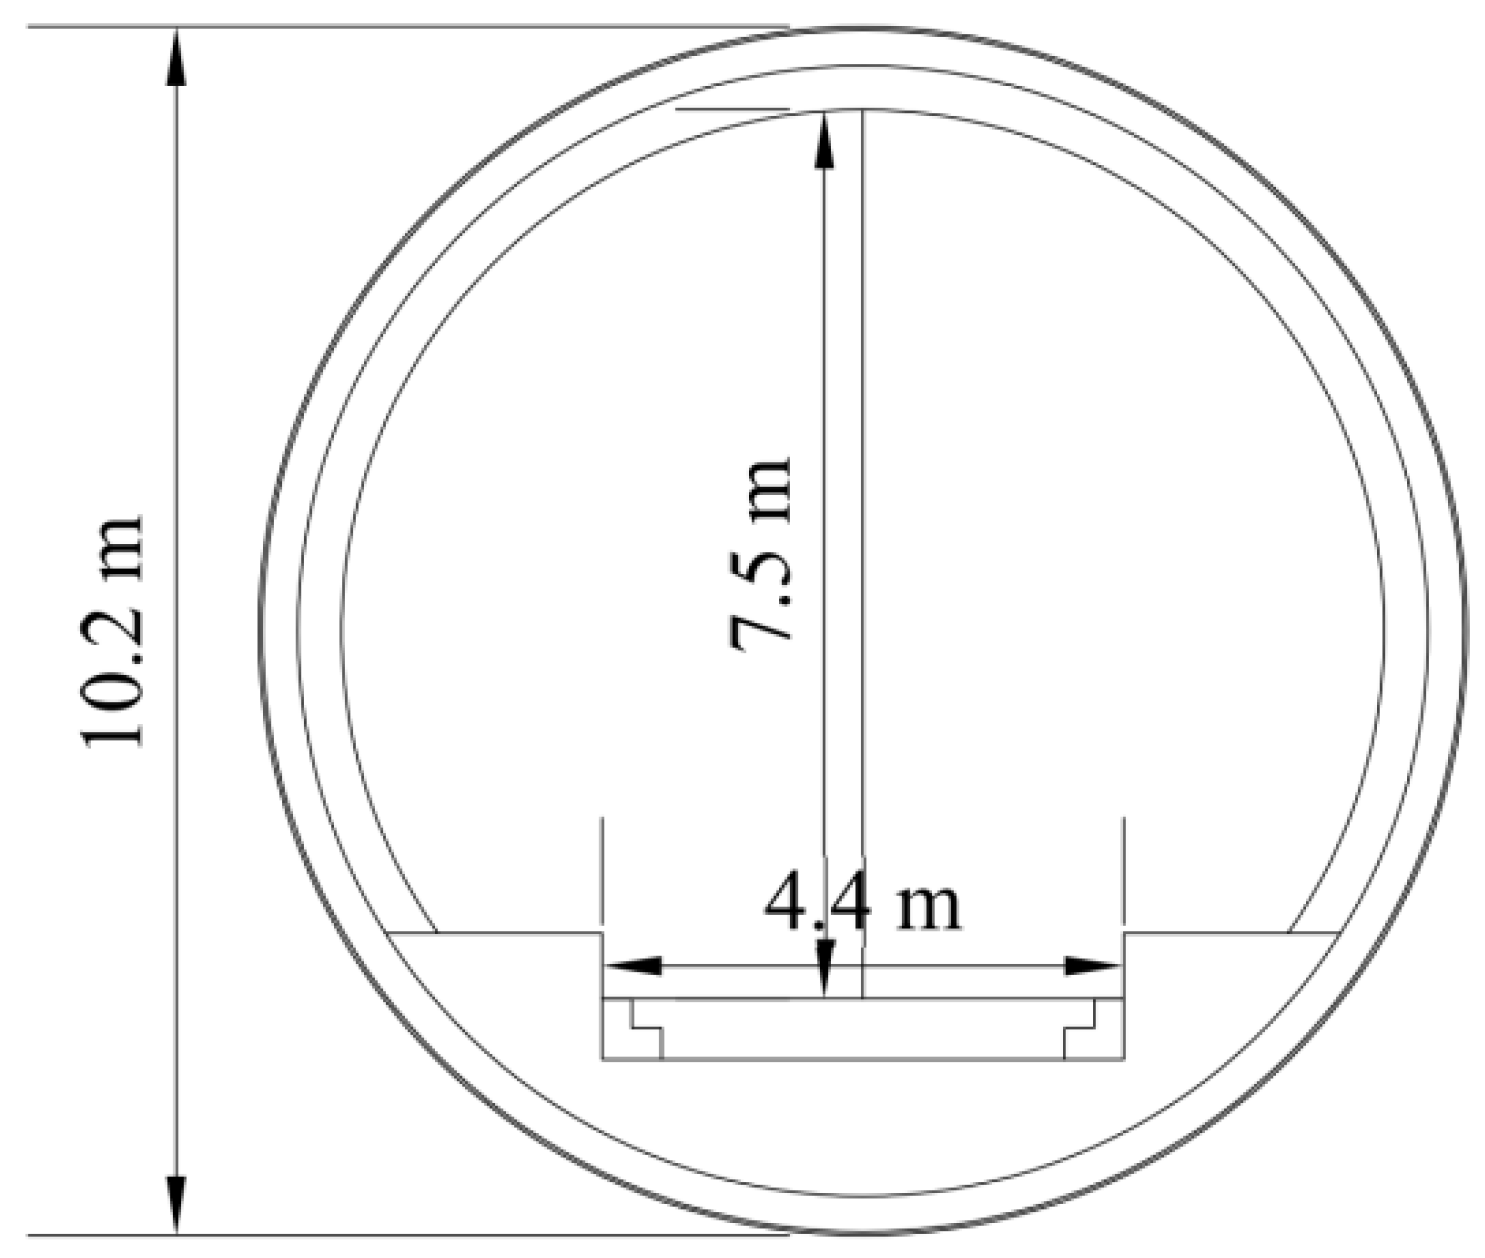
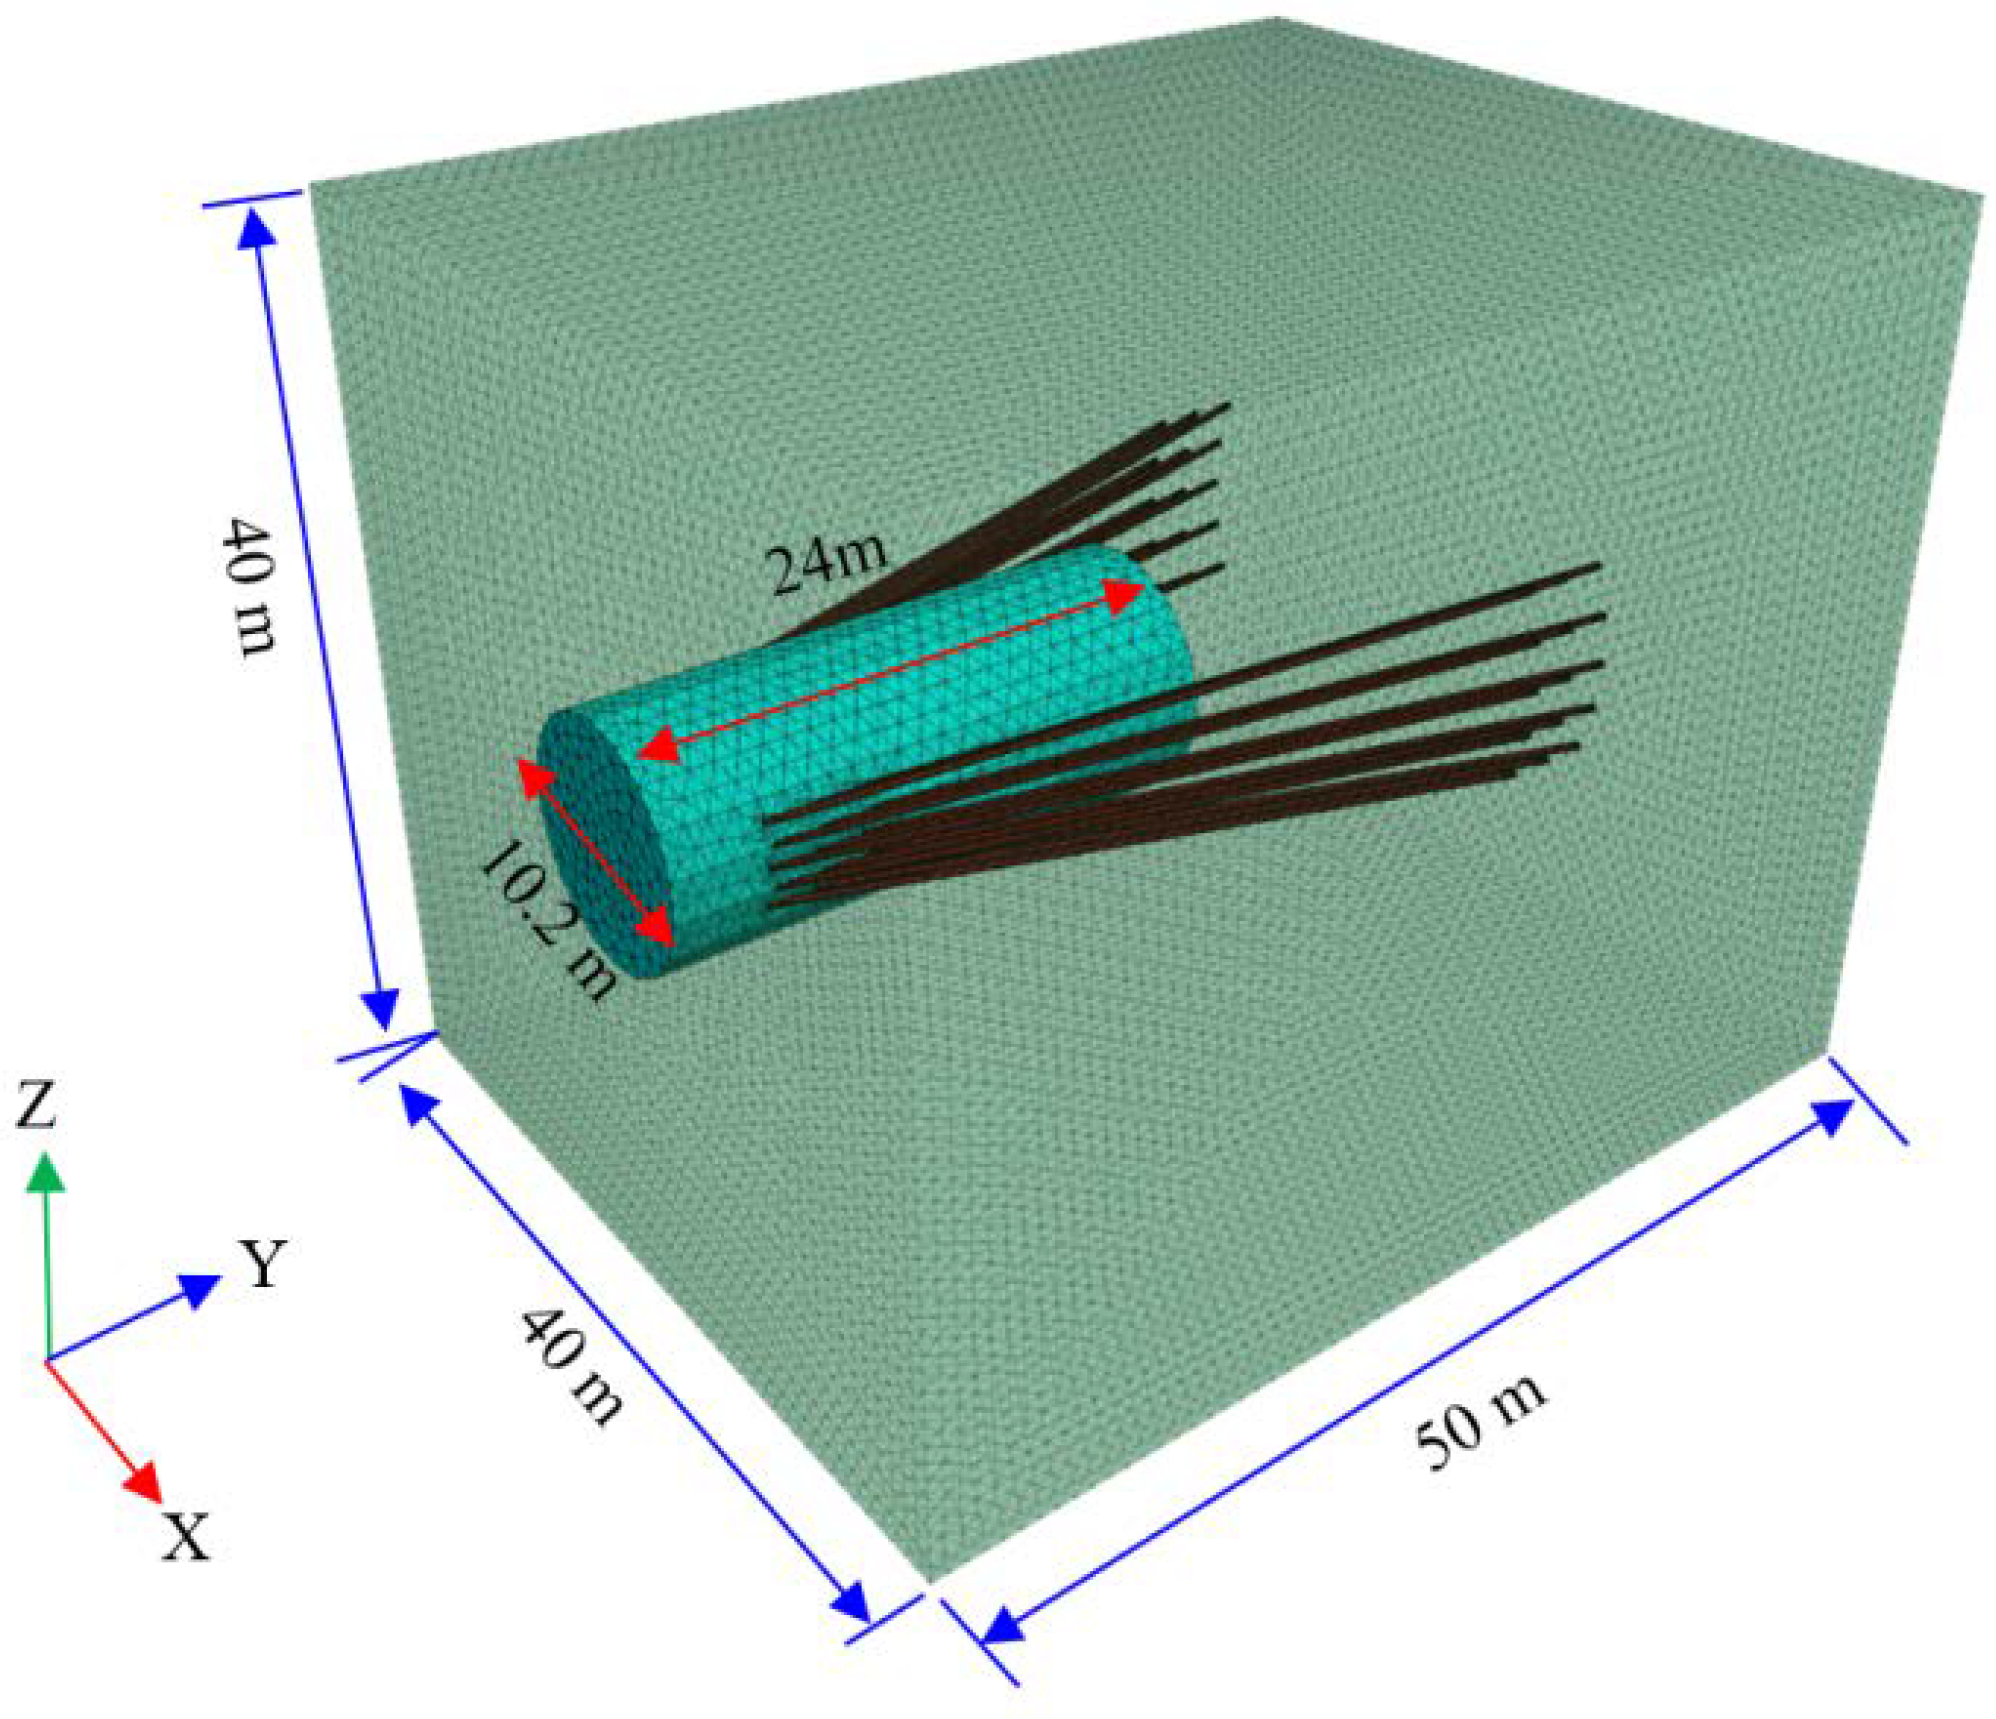
4.1. Engineering Background
4.2. Scheme Design and Effect Evaluation of ASRBs
4.2.1. Determination of Test Analysis Method
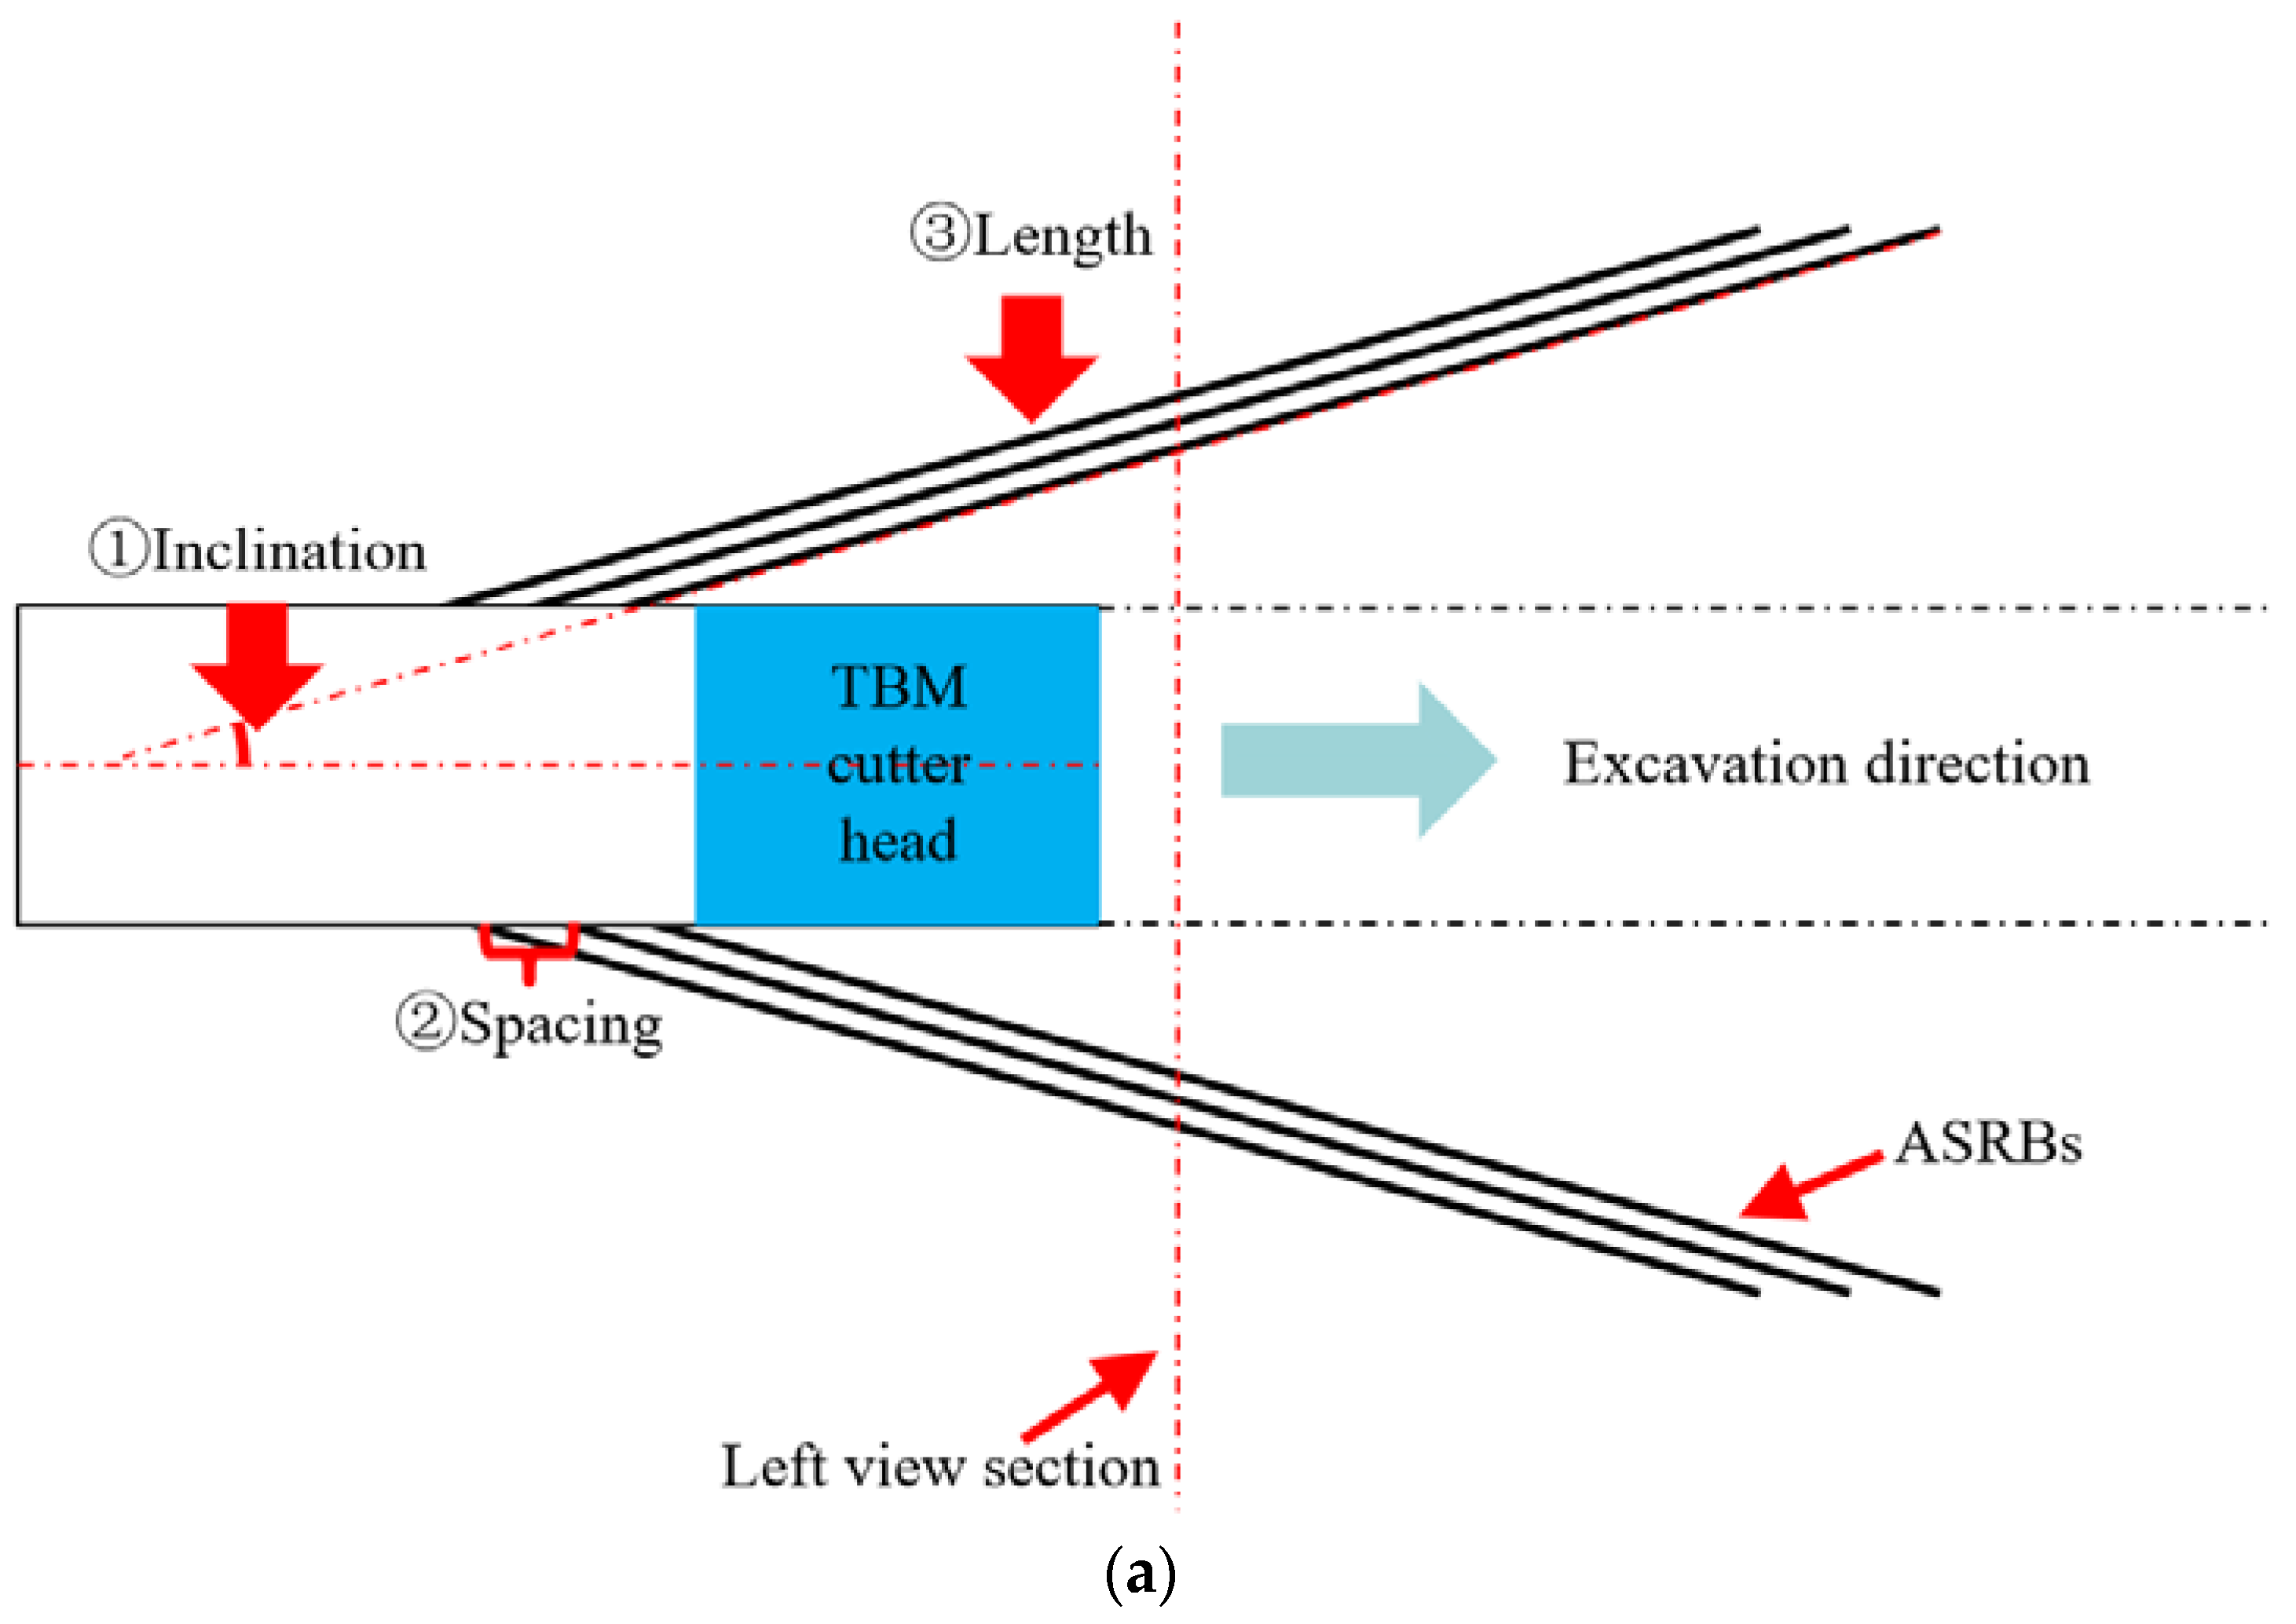
4.2.2. Determination of Design Parameters
- Inclination: the included angle between the ASRB axis and the tunnel axis (unit: °).
- Spacing: the axial spacing of the tunnel between the ASRBs of adjacent rows (unit: m).
- Length: the distance from the borehole bottom to the tunnel side wall in the ASRB (unit: m).
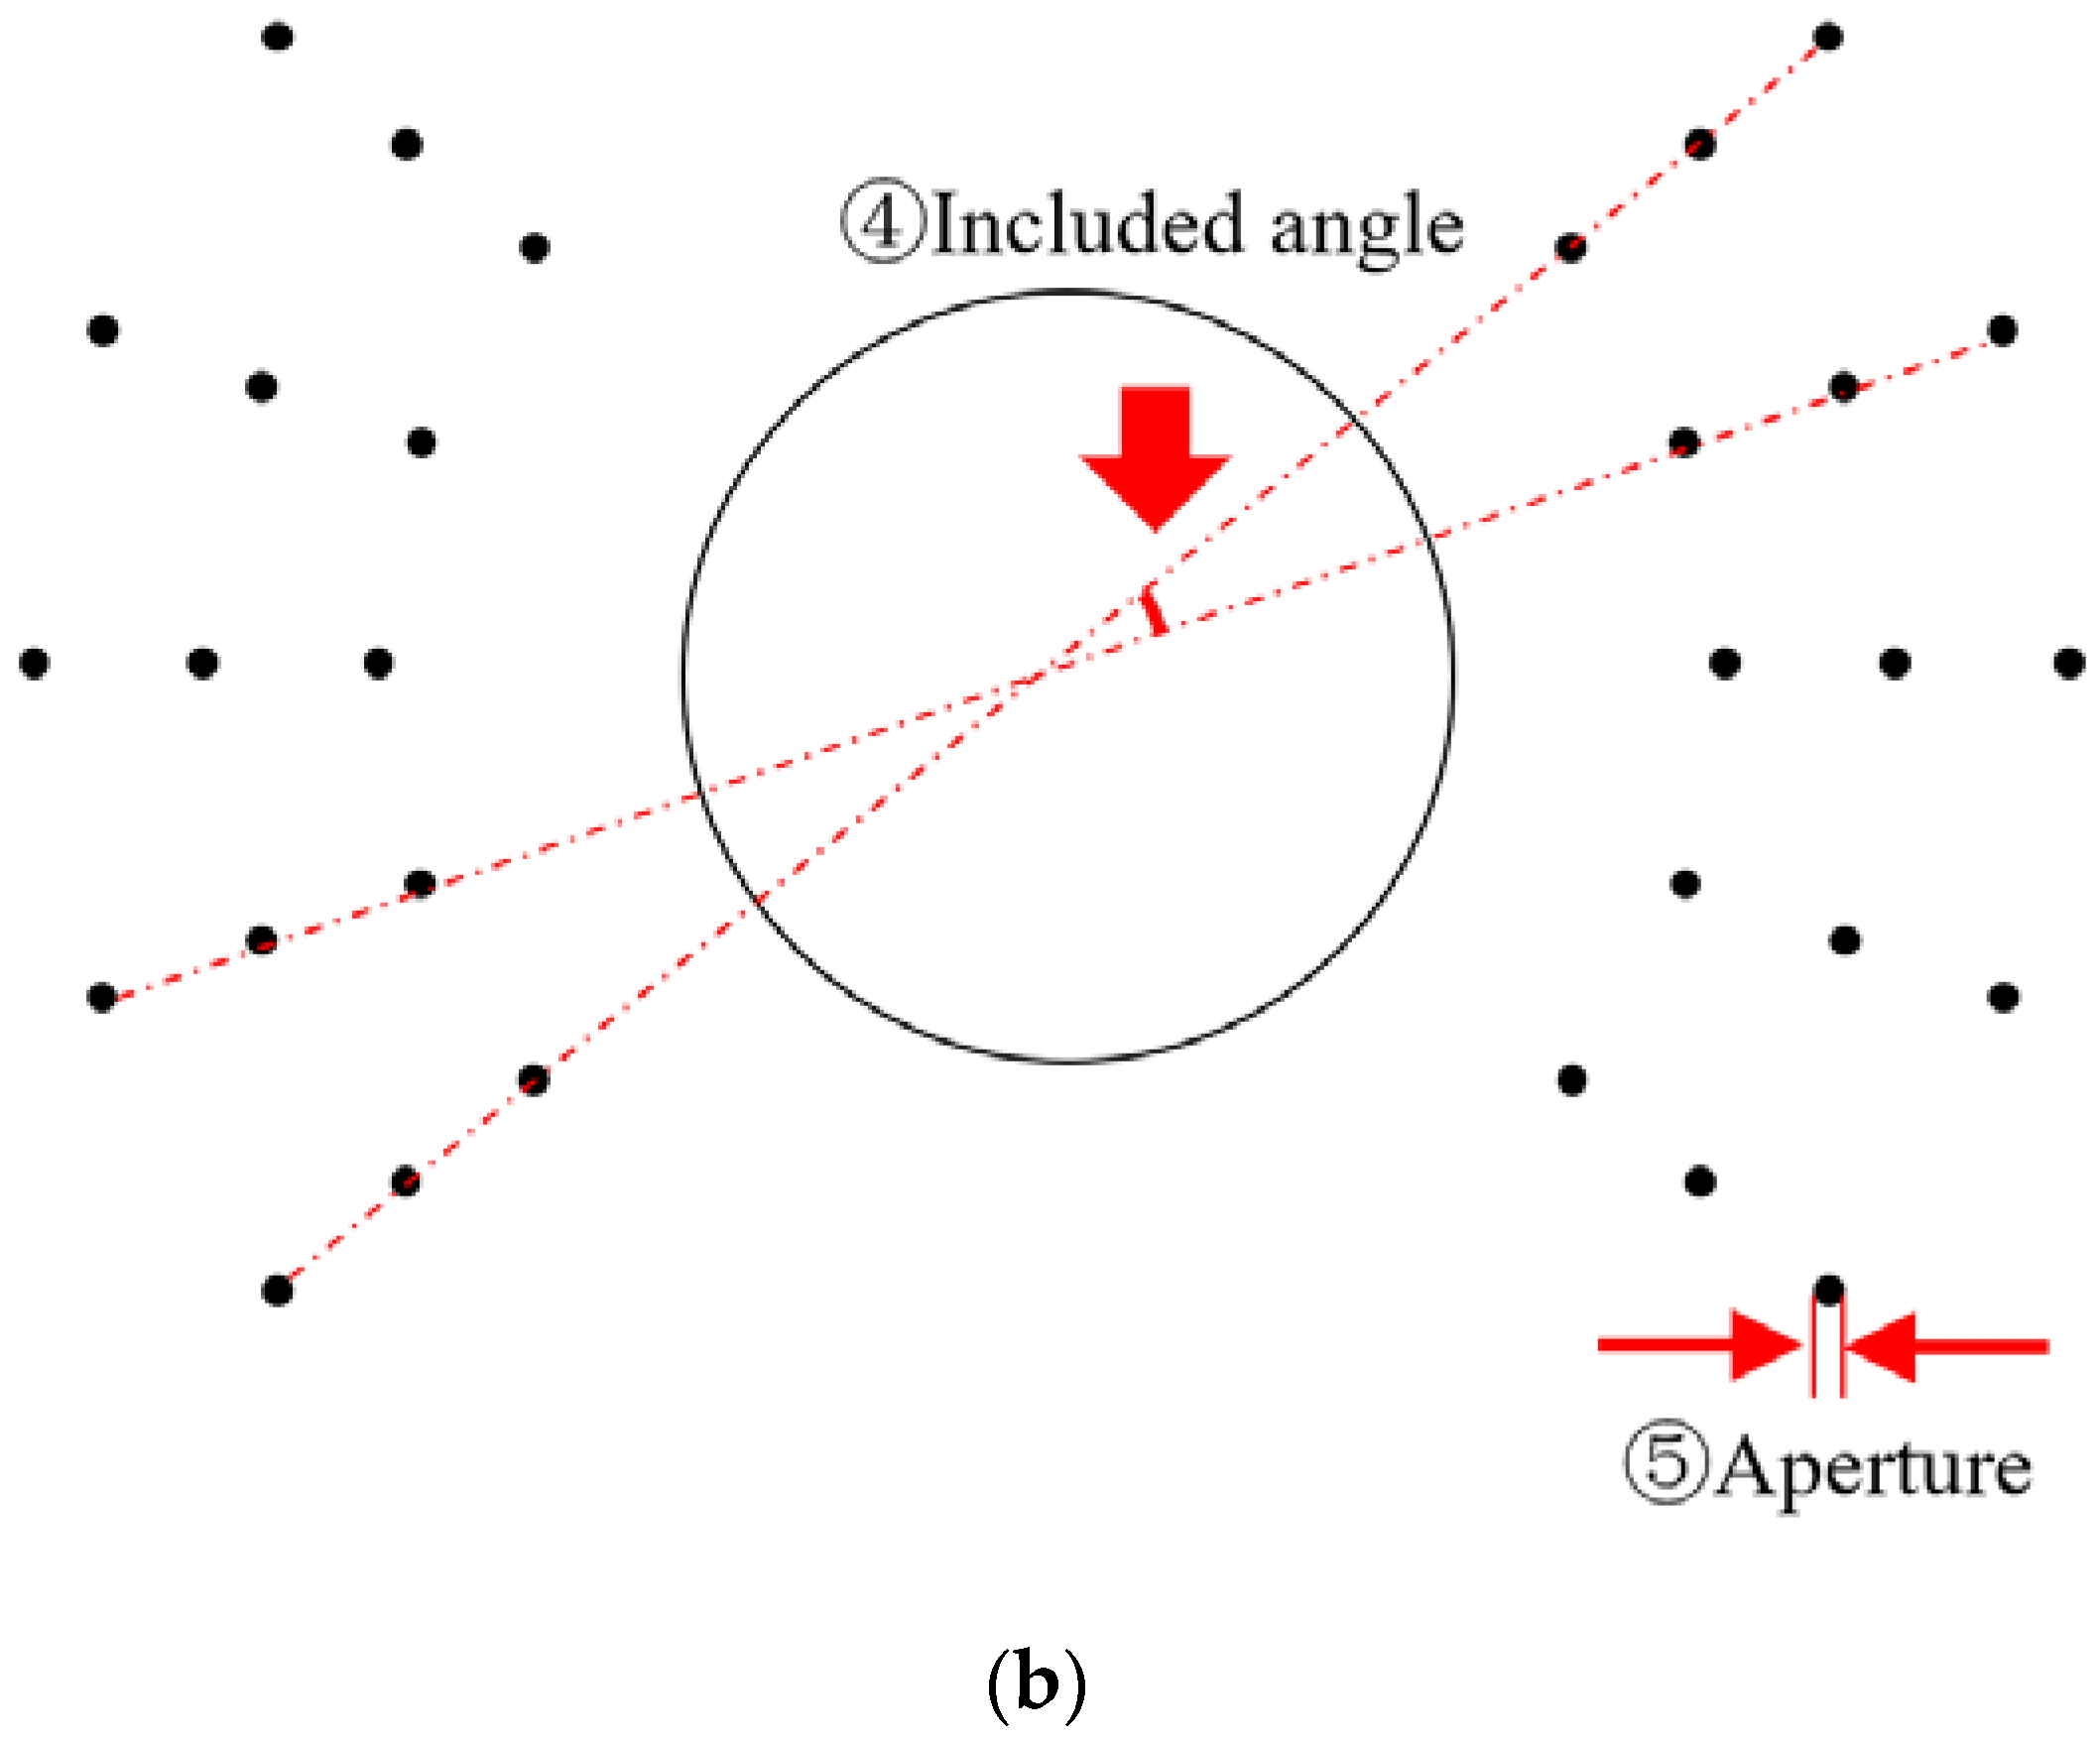
- Included angle: the sharp angle between the two adjacent ASRBs on one side of the tunnel cross-section and the line connecting the tunnel center (unit: °).
- Aperture: the diameter of the circle on the cross-section of the ASRB (unit: m)
4.2.3. Determination of Test Scheme
4.2.4. Determination of Test Scheme Indicators
- (1)
- Stress aspect
- (2)
- Energy aspect
4.3. Analysis and Design Optimization of ASRB Parameters
4.3.1. Orthogonal Test Results
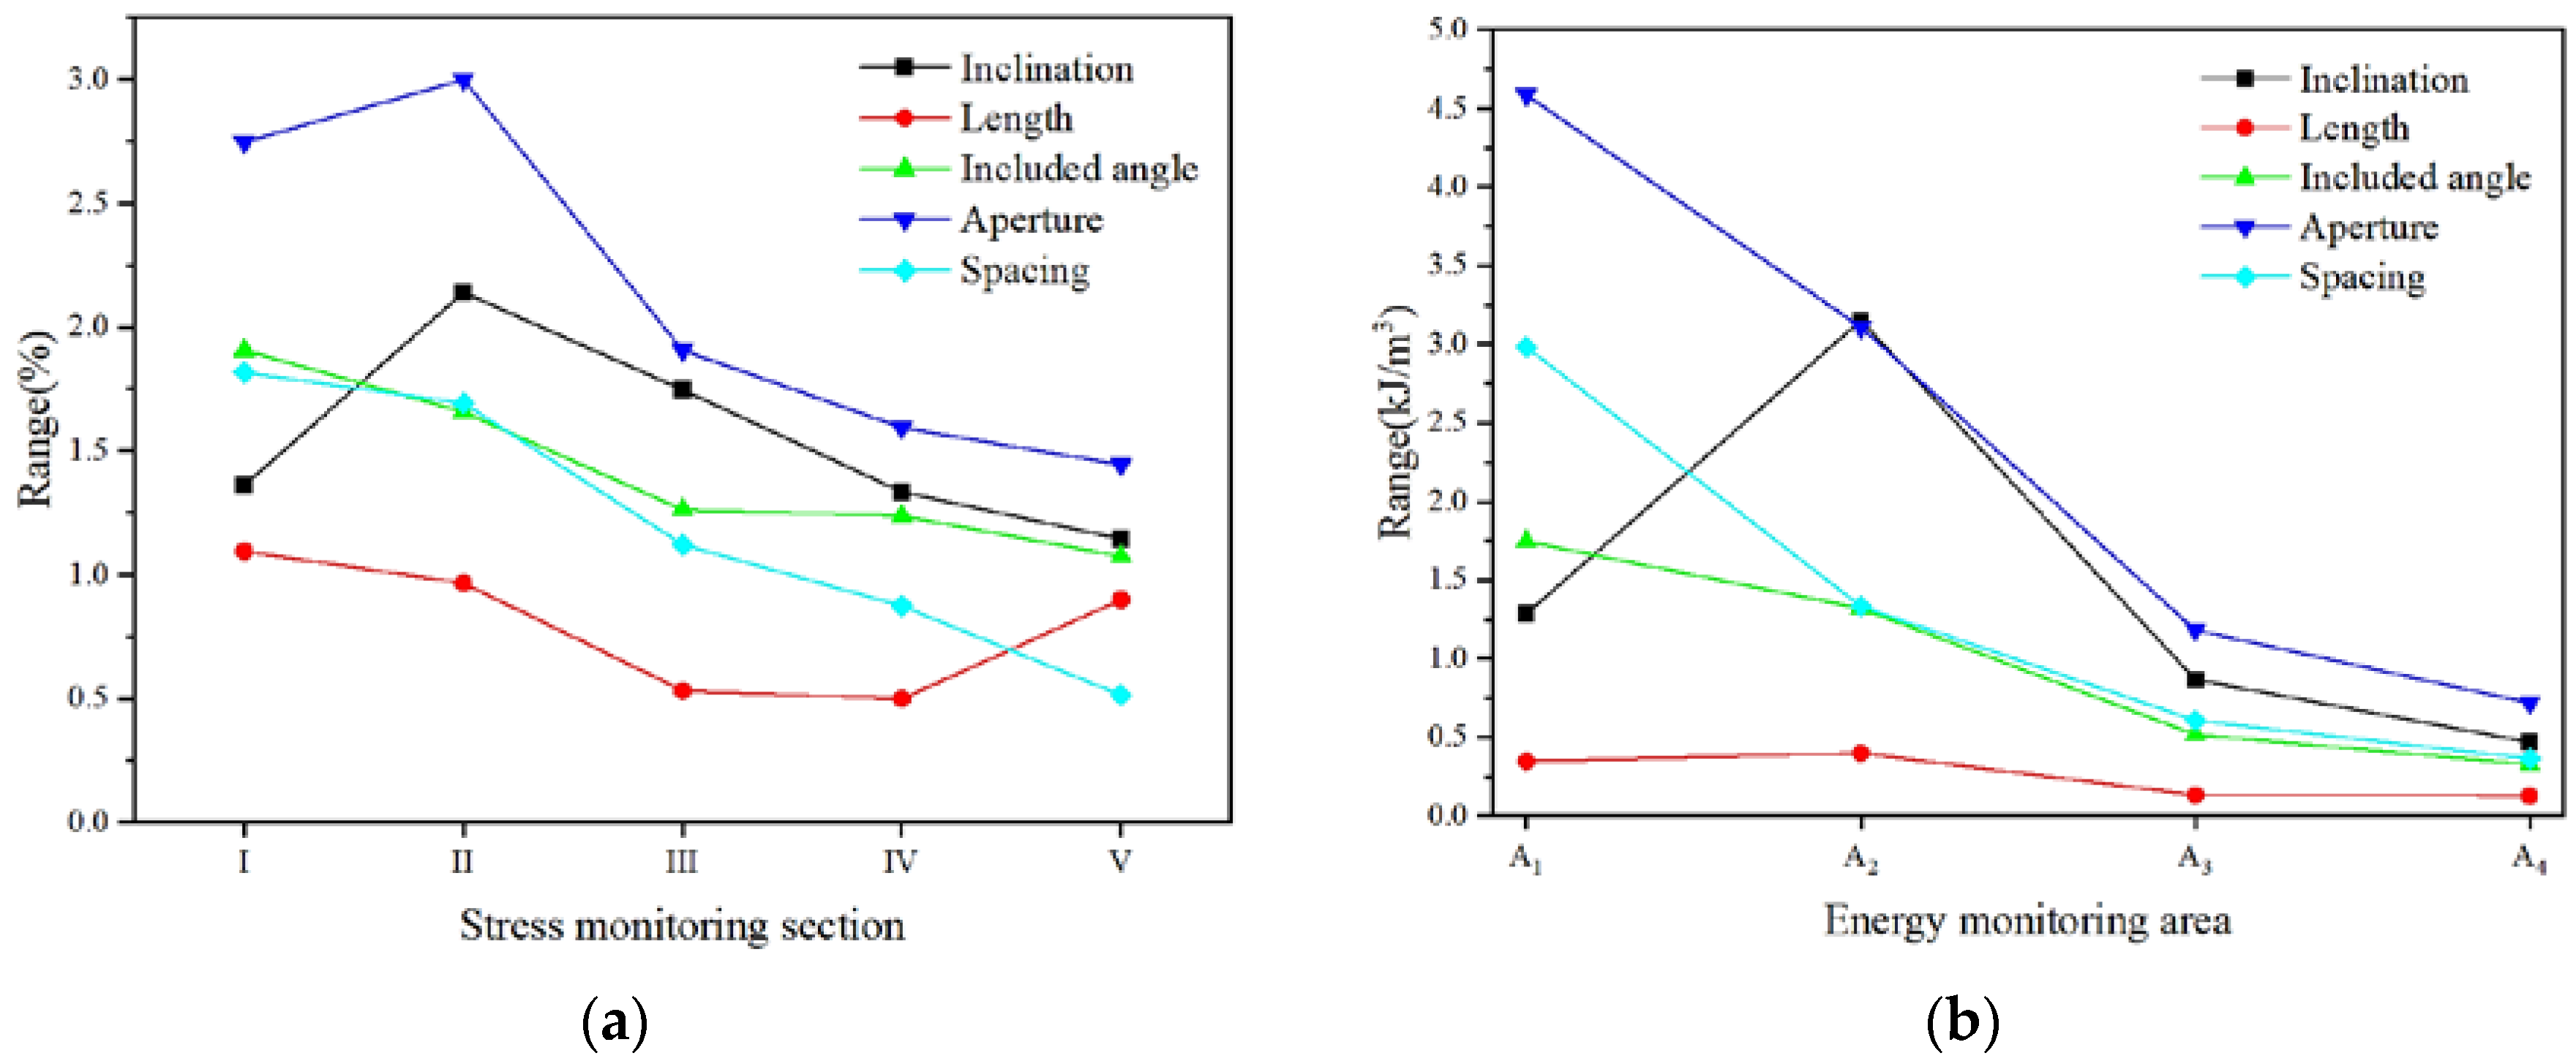
4.3.2. Sensitivity Analysis
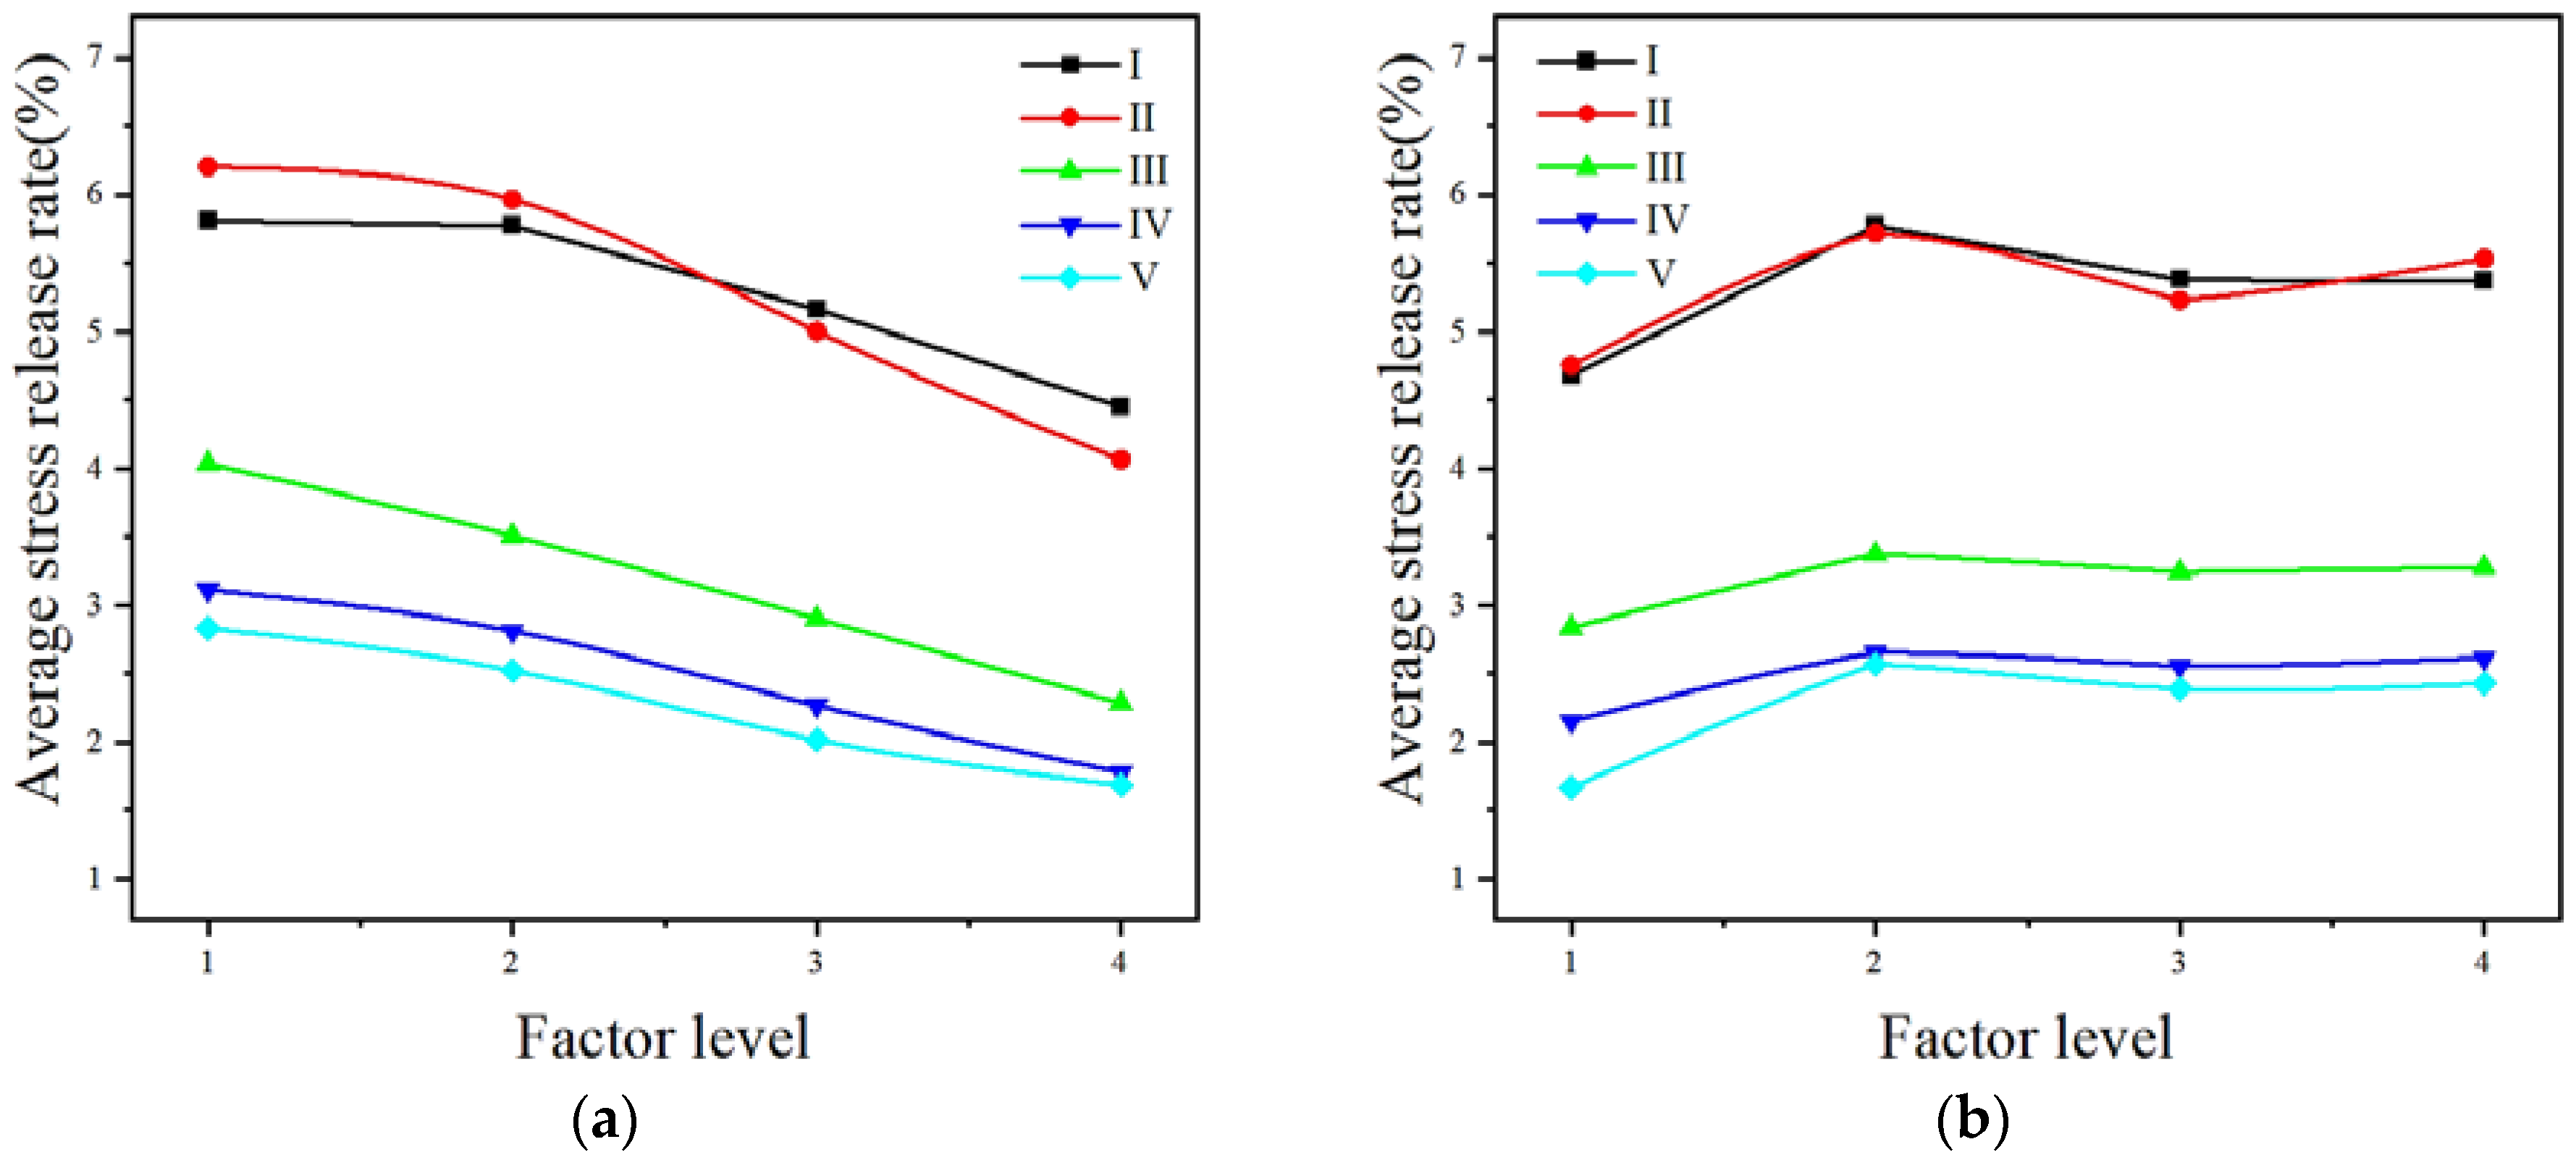
4.3.3. Correlation Analysis
- (1)
- Stress aspect
- (2)
- Energy aspect
4.4. Determination of the Optimal ASRB Layout Plan in Line with Engineering Best Practices
5. Discussion
5.1. Necessity of Parameter Optimization
5.2. Method Applicability
6. Conclusions
- (1)
- The design method for ASRBs for a deeply buried hard rock TBM tunnel is proposed. This method is based on previous geological data and measured data and comprehensively considers the location of the stress release area and the degree of stress concentration. It can be effectively applied in the design of the layout plan for advance stress release boreholes in the early stage of tunnel construction.
- (2)
- By comparing the range of each factor in each stress release area fore and aft of the current tunneling head, the sensitivity of the five important design parameters of ASRBs to the stress release effect is, in descending order, “aperture”, “inclination”, “included angle”, “spacing”, and “length”. From the perspective of engineering construction, since the “aperture” parameter is closely related to the on-site drilling equipment and the workload and construction difficulty of on-site construction, it is often difficult to change this parameter. By reasonably optimizing the “inclination”, “included angle”, and “spacing” parameters, the stress release effect can be better improved without increasing the construction workload and instead only optimizing the drilling layout.
- (3)
- Along the direction of a TBM, the sensitivity of various borehole parameters to the stress release effect shows a decreasing trend. This shows that the stress release effect of the surrounding rock mass close to the TBM can be greatly affected by improving the ASRB parameters, while in the deep rock mass far away from the TBM-constructed area, although there are ASRBs, the release effect is limited by the borehole parameters.
- (4)
- From the calculation results of each factor, whether from the perspective of the average stress release rate or the average volume release energy, the “length” factor has no significant impact on the pressure release and energy dissipation effect of ASRBs. The levels of the “inclination”, “included angle”, and “spacing” factors have a negative correlation with the stress release effect, while the “aperture” factor has a positive correlation. This shows that under the factor level and simulation conditions set in this study, the layout of “small inclination”, “small included angle”, “small spacing”, and “large aperture” ASRBs often has a better stress release effect than other layouts.
- (5)
- Along the direction of the tunnel axis, the relationship between the average stress release rate of each monitoring point is I ≈ II > III > IV > V, which shows a decreasing trend along the direction of the TBM. The relationship between the average volume release energy of each area is, in descending order, “A1”, “A2”, “A3”, and “A4”, which also gradually decreases along the direction of the TBM. This shows that under the simulation environment discussed in this study, the ASRB release area is mainly concentrated in the range of one borehole diameter behind the face.
Author Contributions
Funding
Institutional Review Board Statement
Informed Consent Statement
Data Availability Statement
Conflicts of Interest
Appendix A

| Monitoring Section | Factor Level | Stress Release Effect of Each Factor (%) | ||||
|---|---|---|---|---|---|---|
| Inclination | Length | Included Angle | Aperture | Spacing | ||
| I | 1 | 5.81 | 4.68 | 6.12 | 4.15 | 6.42 |
| 2 | 5.77 | 5.77 | 5.49 | 4.45 | 5.55 | |
| 3 | 5.16 | 5.38 | 5.38 | 5.70 | 4.63 | |
| 4 | 4.45 | 5.37 | 4.21 | 6.90 | 4.60 | |
| Range | 1.36 | 1.10 | 1.91 | 2.75 | 1.82 | |
| Influence degree of factors | Aperture > Included angle > Spacing > Inclination > Length | |||||
| II | 1 | 6.20 | 4.75 | 5.98 | 3.95 | 6.33 |
| 2 | 5.96 | 5.72 | 5.50 | 4.59 | 5.56 | |
| 3 | 5.00 | 5.23 | 5.43 | 5.74 | 4.71 | |
| 4 | 4.06 | 5.53 | 4.32 | 6.95 | 4.63 | |
| Range | 2.14 | 0.97 | 1.66 | 3.00 | 1.69 | |
| Influence degree of factors | Aperture > Inclination > Spacing > Included angle > Length | |||||
| III | 1 | 4.04 | 2.84 | 3.66 | 2.35 | 3.84 |
| 2 | 3.51 | 3.37 | 3.34 | 2.58 | 3.34 | |
| 3 | 2.90 | 3.24 | 3.35 | 3.54 | 2.72 | |
| 4 | 2.29 | 3.28 | 2.40 | 4.26 | 2.84 | |
| Range | 1.75 | 0.53 | 1.26 | 1.91 | 1.12 | |
| Influence degree of factors | Aperture > Inclination > Included angle > Spacing > Length | |||||
| IV | 1 | 3.11 | 2.15 | 2.97 | 1.87 | 2.99 |
| 2 | 2.81 | 2.65 | 2.64 | 1.95 | 2.60 | |
| 3 | 2.27 | 2.56 | 2.63 | 2.70 | 2.12 | |
| 4 | 1.78 | 2.61 | 1.73 | 3.46 | 2.27 | |
| Range | 1.34 | 0.50 | 1.24 | 1.60 | 0.88 | |
| Influence degree of factors | Aperture > Inclination > Included angle > Spacing > Length | |||||
| V | 1 | 2.83 | 1.67 | 2.72 | 1.64 | 2.56 |
| 2 | 2.52 | 2.57 | 2.50 | 1.84 | 2.34 | |
| 3 | 2.02 | 2.39 | 2.20 | 2.48 | 2.04 | |
| 4 | 1.69 | 2.43 | 1.65 | 3.09 | 2.13 | |
| Range | 1.15 | 0.90 | 1.08 | 1.45 | 0.52 | |
| Influence degree of factors | Aperture > Inclination > Included angle > Length > Spacing | |||||
| Monitoring Area | Factor Level | Energy Release Effect of Each Factor (J/m3) | ||||
|---|---|---|---|---|---|---|
| Inclination | Length | Included Angle | Aperture | Spacing | ||
| A1 | 1 | 9081.40 | 8254.90 | 9242.85 | 6172.47 | 9930.12 |
| 2 | 8598.09 | 8602.82 | 8454.61 | 7517.74 | 8787.13 | |
| 3 | 8033.13 | 8395.30 | 8312.55 | 9060.52 | 7843.70 | |
| 4 | 7795.67 | 8255.27 | 7498.28 | 10757.56 | 6947.34 | |
| Range | 1285.73 | 347.91 | 1744.57 | 4585.09 | 2982.78 | |
| Influence degree of factors | Aperture > Spacing > Included angle > Inclination > Length | |||||
| A2 | 1 | 7223.09 | 5474.82 | 6220.69 | 4080.70 | 6240.01 |
| 2 | 6075.19 | 5804.13 | 5570.70 | 4973.82 | 5594.87 | |
| 3 | 4789.90 | 5404.53 | 5467.40 | 5916.12 | 5416.65 | |
| 4 | 4070.54 | 5475.24 | 4899.91 | 7188.07 | 4907.18 | |
| Range | 3152.55 | 399.60 | 1320.78 | 3107.37 | 1332.84 | |
| Influence degree of factors | Inclination > Aperture > Spacing > Included angle > Length | |||||
| A3 | 1 | 2495.17 | 1957.28 | 2228.04 | 1408.79 | 2319.61 |
| 2 | 2034.40 | 2032.40 | 2025.76 | 1749.22 | 2012.70 | |
| 3 | 1731.22 | 2001.38 | 1925.57 | 2139.45 | 1844.99 | |
| 4 | 1628.37 | 1898.10 | 1709.79 | 2591.70 | 1711.86 | |
| Range | 866.80 | 134.30 | 518.25 | 1182.91 | 607.76 | |
| Influence degree of factors | Aperture > Inclination > Spacing > Included angle > Length | |||||
| A4 | 1 | 1554.91 | 1180.99 | 1440.09 | 918.26 | 1482.78 |
| 2 | 1279.18 | 1297.90 | 1284.48 | 1111.55 | 1278.68 | |
| 3 | 1084.63 | 1307.88 | 1215.00 | 1384.22 | 1170.59 | |
| 4 | 1131.97 | 1263.91 | 1111.11 | 1636.66 | 1118.63 | |
| Range | 470.28 | 126.89 | 328.98 | 718.40 | 364.16 | |
| Influence degree of factors | Aperture > Inclination > Spacing > Included angle > Length | |||||
References
- Qian, Q. Main developments and direction of geological prediction and informatized technology of tunnel engineering construction. Tunn. Constr. 2017, 37, 251–263. (In Chinese) [Google Scholar]
- Mazaira, A.; Konicek, P. Intense rockburst impacts in deep underground construction and their prevention. Can. Geotech. J. 2015, 52, 1426–1439. [Google Scholar] [CrossRef]
- Kaiser, P.; Moss, A. Deformation-based support design for highly stressed ground with a focus on rockburst damage mitigation. J. Rock Mech. Geotech. Eng. 2022, 14, 50–66. [Google Scholar] [CrossRef]
- Qi, M. Development, CurrentStatus, and Prospects of TBM Tunneling Technology in China. Tunn. Constr. 2021, 41, 1964–1979. (In Chinese) [Google Scholar]
- Zhang, J.; Mei, Z.; Gao, J.; Tang, Y.; Zhang, Y. Research on TBM type selection and key construction technology of extra long tunnel of Dahuofang water conveyance project. Mod. Tunn. Technol. 2010, 47, 1–10. (In Chinese) [Google Scholar] [CrossRef]
- Kaiser, P.; Cai, M. Design of rock support system under rockburst condition. J. Rock Mech. Geotech. Eng. 2012, 4, 215–227. [Google Scholar] [CrossRef]
- Zhou, H.; Meng, F.; Zhang, C.; Hu, D.; Yang, F.; Lu, J.J. Analysis of rockburst mechanisms induced by structural planes in deep tunnels. Bull. Eng. Geol. Environ. 2015, 74, 1435–1451. [Google Scholar] [CrossRef]
- Feng, X.; Zhou, Y.; Jiang, Q. Rock mechanics contributions to recent hydroelectric developments in China. J. Rock Mech. Geotech. Eng. 2019, 11, 511–526. [Google Scholar] [CrossRef]
- Adoko, A.; Gokceoglu; Wu, L.; Zuo, Q. Knowledge-based and data-driven fuzzy modeling for rockburst prediction. Int. J. Rock Mech. Min. Sci. 2013, 61, 86–95. [Google Scholar] [CrossRef]
- Qiu, S.; Feng, X.; Zhang, C.; Xiang, T. Estimation of rockburst wall-rock velocity invoked by slab flexure sources in deep tunnels. Can. Geotech. J. 2014, 51, 520–539. [Google Scholar] [CrossRef]
- He, B.; Wang, L.; Feng, X.; Zhen, R. Failure Modes of Jointed Granite Subjected to Weak Dynamic Disturbance Under True-Triaxial Compression. Rock Mech. Rock Eng. 2023, 56, 7939–7957. [Google Scholar] [CrossRef]
- Farhadian, H. A new empirical chart for rockburst analysis in tunneling: Tunnel rockburst classification (TRC). Int. J. Min. Sci. Technol. 2021, 31, 603–610. [Google Scholar] [CrossRef]
- Hou, J.; Zhang, C.; Shan, Z. Rock burst characteristics and prevention measures in the deep diversion tunnel of Jinping II Hydropower Station. J. Undergr. Space Eng. 2011, 7, 1251–1257. (In Chinese) [Google Scholar]
- Yang, J.; Yang, X.; Zhang, W.; Liu, Y.; Dong, B.; Li, B. Comparative study of the excavation damage and rockburst of the deeply buried Jinping II diversion tunnels using a TBM and the drilling-blasting method. Adv. Civ. Eng. 2020, 2020, 8876214. [Google Scholar]
- Tan, W. Research on Rockburst Prevention and Control Technology for Super-Long and Deep-Buried Tunnel of the Hanjiang-Wei River Diversion Project. Master’s Thesis, Southwest Jiaotong University, Chengdu, China, 2015. (In Chinese). [Google Scholar]
- Xue, J. The construction technology of open TBM safely and quickly passing through the strong rock burst stratum of the tunnel—Taking the Lingnan TBM construction section of Qinling Tunnel of the Hanjiang-Wei River Diversion Project as an example. Tunn. Constr. 2019, 39, 989–997. (In Chinese) [Google Scholar]
- Du, L.; Hong, K.; Wang, J.; Li, Q.; Yang, Y.; Li, W.; Huang, J. Rock burst characteristics and prevention and control technology in TBM construction of deep tunnel. Tunn. Constr. 2021, 41, 1–15. (In Chinese) [Google Scholar]
- Ullah, I.; Peach, G.; Nadeem, M. Tunnel boring machine advance ground investigation in rockburst-prone ground conditions on Neelum Jhelum project. In Proceedings of the Engineering Challenges for Sustainable Underground Use: Proceedings of the 1st GeoMEast International Congress and Exhibition, Egypt 2017 on Sustainable Civil Infrastructures, Sharm Elsheikh, Egypt, 15–19 July 2017; pp. 53–75. [Google Scholar]
- Amici, R.; Peach, G.; Nadeem, M. TBM in Azad Kashmir region of Pakistan: In situ stress measurements for rockburst prevision. Geotech. Res. 2018, 6, 39–51. [Google Scholar] [CrossRef]
- Naji, A.; Rehman, H.; Emad, M.; Ahmad, S.; Kim, J.; Yoo, H. Static and dynamic influence of the shear zone on rockburst occurrence in the headrace tunnel of the Neelum Jhelum hydropower project, Pakistan. Energies 2019, 12, 2124. [Google Scholar] [CrossRef]
- Wang, M.; Si, Y.; Hu, J.; Deng, H. Coordinated control technology of surrounding rock pressure relief in deep roadway. J. Henan Univ. Technol. (Nat. Sci. Ed.) 2017, 36, 9–16. (In Chinese) [Google Scholar] [CrossRef]
- Sainoki, A.; Emad, M.; Mitri, H. Study on the efficiency of destress blasting in deep mine drift development. Can. Geotech. J. 2017, 54, 518–528. [Google Scholar] [CrossRef]
- Feng, X.; Xiao, Y.; Feng, G.; Yao, Z.; Chen, B.; Yang, C.; Su, G. Study on the development process of rockbursts. Chin. J. Rock Mech. Eng. 2019, 38, 649–673. (In Chinese) [Google Scholar] [CrossRef]
- Tian, S.; Zhao, Y.; Shi, S.; Qiao, Z.; Wang, W. Prevention and control methods and application of typical rock burst disasters in Lalin section tunnel of Sichuan-Tibet Railway. China Railw. Sci. 2020, 41, 71–80. (In Chinese) [Google Scholar]
- Li, C. Application of stress-relief blasting construction technology in deep buried high-stress diversion tunnel. Railw. Constr. Technol. 2012, 11, 9–12. (In Chinese) [Google Scholar]
- Konicek, P.; Soucek, K.; Stas, L.; Singh, R. Long-hole destress blasting for rockburst control during deep underground coal mining. Int. J. Rock Mech. Min. Sci. 2013, 61, 141–153. [Google Scholar] [CrossRef]
- Wojtecki, L.; Konicek, P.; Mendecki, M.; Zuberek, W. Evaluation of destress blasting effectiveness using the seismic moment tensor inversion and seismic effect methods. Int. J. Geomech. 2022, 22, 04022010. [Google Scholar] [CrossRef]
- Konicek, P.; Saharan, M.; Mitri, H. Destress blasting in coal mining–state-of-the-art review. Procedia Eng. 2011, 26, 179–194. [Google Scholar] [CrossRef]
- Qin, F. Study on the Precursory and Evolution Law of Rock Burst Microfracture in the Project of Water Diversion from Han River to Wei River. Master’s Thesis, Dalian University of Technology, Dalian, China, 2021. (In Chinese). [Google Scholar]
- Liu, F. Study on the Characteristics of Rockburst Preparation and Microseismic Monitoring and Early Warning in the Deep Tunnel from the Han River to the Wei River. Ph.D. Thesis, Dalian University of Technology, Dalian, China, 2020. (In Chinese). [Google Scholar]
- Wang, P.; Jiang, Y.; Li, P.; Zhou, J.; Zhou, Z. Experimental Analysis of Pressure Relief Effect of Surrounding Rock in High-Stress Roadways under Different Drilling Parameters. Appl. Sci. 2023, 13, 2511. [Google Scholar] [CrossRef]
- Xiao, P.; Li, D.; Zhu, Q. Strain Energy Release and Deep Rock Failure Due to Excavation in Pre-Stressed Rock. Minerals 2022, 12, 488. [Google Scholar] [CrossRef]
- Zeng, W.; Yang, S.; Tian, W. Experimental and numerical investigation of brittle sandstone specimens containing different shapes of holes under uniaxial compression. Eng. Fract. Mech. 2018, 200, 430–450. [Google Scholar] [CrossRef]
- Chen, G.; Feng, X.; Zhang, C.; Jiang, Q.; Su, G. Research on the prevention and control measures of the damage induced by the excavation of deep hard rock tunnel. J. Rock Mech. Eng. 2008, 27, 2064–2071. (In Chinese) [Google Scholar]
- Jia, C.; Jiang, Y.; Zhang, X.; Wang, D.; Luan, H.; Wang, C. Laboratory and numerical experimental study on pressure relief mechanism of large diameter borehole. J. Geotech. Eng. 2017, 39, 1115–1122. (In Chinese) [Google Scholar]
- Zhang, H.; Zhu, Y.; Chen, L.; Hu, W.; Chen, S. The Prevention and Control Mechanism of Rockburst Hazards and Its Application in the Construction of a Deeply Buried Tunnel. Appl. Sci. 2019, 9, 3629. [Google Scholar] [CrossRef]
- Guo, H.; Tong, J.; Sun, Q.; Xu, Y.; Luo, W.; Yang, Y. Determination Method of Excavation Damage Zone Based on Surrounding Rock Damage-Fracture Ratio in Underground Engineering. Front. Earth Sci. 2022, 10, 836313. [Google Scholar] [CrossRef]
- Manouchehrian, A.; Cai, M. Numerical modeling of rockburst near fault zones in deep tunnels. Tunn. Undergr. Space Technol. 2018, 80, 164–180. [Google Scholar] [CrossRef]
- Hao, J.; Bian, H.; Shi, Y.; Chen, A.; Liu, J.; Zhang, P.; Peng, L.; Tang, J.; Wang, X. Research on Pressure Relief Hole Parameters Based on Abutment Pressure Distribution Pattern. Shock Vib. 2021, 2021, 7143590. [Google Scholar] [CrossRef]
- Liu, H.; He, Y.; Xu, J.; Han, L. Numerical simulation and industrial test of borehole pressure relief technology in deep coal roadway. J. Coal 2007, 32, 33–37. (In Chinese) [Google Scholar]
- Wang, Y.; Wang, J.; Yi, J.; Wang, F.; Ai, K. Research on prevention and control of rock burst in deep tunnel based on rapid stress release. Geotech. Mech. 2012, 33, 547–553. (In Chinese) [Google Scholar] [CrossRef]
- Meng, T. Stress relief blasting technology for large buried deep and long tunnels. Railw. Constr. 2014, 3, 63–65. (In Chinese) [Google Scholar]
- Itasca. FLAC3D_Fast Lagrangian Analysis of Continua in 3 Dimensions; Itasca: Minneapolis, MN, USA, 2009. [Google Scholar]
- Liu, L.; Zhang, C.; Zhu, W.; Zhang, C.; Wu, X. Risk Assessment and Countermeasures for TBM Excavation in Deep Broken Rock Mass. J. Rock Mech. Eng. 2015, 34, 3348–3355. (In Chinese) [Google Scholar] [CrossRef]
- Fang, D.; Liu, N.; Zhang, C.; Zhu, W.; Chen, X. Risk Control of Rock Burst in Large Diameter TBM Excavation in High Stress Areas. J. Rock Mech. Eng. 2013, 32, 2100–2107. (In Chinese) [Google Scholar]
- Askaripour, M.; Saeidi, A.; Rouleau, A.; Mercier-Langevin, P. Rockburst in underground excavations: A review of mechanism, classification, and prediction methods. Undergr. Space 2022, 7, 577–607. [Google Scholar] [CrossRef]
- Li, N.; Feng, X.; Jimenez, R. Predicting rock burst hazard with incomplete data using Bayesian networks. Tunn. Undergr. Space Technol. 2017, 61, 61–70. [Google Scholar] [CrossRef]
- Zhou, J.; Li, X.; Mitri, H. Evaluation method of rockburst: State-of-the-art literature review. Tunn. Undergr. Space Technol. 2018, 81, 632–659. [Google Scholar] [CrossRef]
- Tao, Z. Support design of tunnels subjected to rockbursting. In Proceedings of the ISRM International Symposium, Madrid, Spain, 12–16 September 1988; OnePetro: Richardson, TX, USA, 1988. [Google Scholar]
- Turchaninov, I.; Markov, G.; Gzovsky, M.; Kazikayev, D.; Frenze, U.; Batugin, S.; Chabdarova, U. State of stress in the upper part of the Earth’s crust based on direct measurements in mines and on tectonophysical and seismological studies. Phys. Earth Planet. Inter. 1972, 6, 229–234. [Google Scholar] [CrossRef]
- Russenes, B. Analysis of Rock Spalling for Tunnels in Steep Valley Sides. Master’s Thesis, Norwegian Institute of Technology, Department of Geology, Trondheim, Norway, 1974; 247p. (In Norwegian). [Google Scholar]
- Kidybiński, A. Bursting liability indices of coal. J. Rock Mech. Min. Sci. Geomech. Abstr. Pergamon 1981, 18, 295–304. [Google Scholar] [CrossRef]
- Feng, T.; Xie, X.; Wang, W.; Pan, C. Rock brittleness and brittleness coefficient describing rock burst tendency. Rock Brittleness Brittleness Coeff. Descr. Rock Burst Tendency 2000, 20, 18–19. (In Chinese) [Google Scholar]
- Qiu, S.; Feng, X.; Zhang, C.; Wu, W. Establishment and verification of rockburst tendency index RVI for deep buried hard rock tunnel. J. Rock Mech. Eng. 2011, 30, 1126–1141. (In Chinese) [Google Scholar]
- Heal, D.; Potvin, Y.; Hudyma, M. Evaluating Rockburst Damage Potential in Underground Mining. In Proceedings of the 41st US Symposium on Rock Mechanics (USRMS), Golden, CO, USA, 17–21 June 2006. [Google Scholar]
- Feng, G.; Feng, X.; Chen, B.; Xiao, Y.; Zhao, Z. Effects of structural planes on the microseismicity associated with rockburst development processes in deep tunnels of the Jinping-II Hydropower Station, China. Tunn. Undergr. Space Technol. 2019, 84, 273–280. [Google Scholar] [CrossRef]
- Xu, N.; Li, T.; Dai, F.; Zhang, R.; Tang, C.; Tang, L. Microseismic monitoring of strainburst activities in deep tunnels at the Jinping II hydropower station, China. Rock Mech. Rock Eng. 2016, 49, 981–1000. [Google Scholar] [CrossRef]
- Zhang, Z.; Luo, C.; Zhang, H.; Guo, R. Rockburst identification method based on energy storage limit of surrounding rock. Energies 2020, 13, 343. [Google Scholar] [CrossRef]
- Zhao, T.; Guo, W.; Tan, Y.; Lu, C.; Wang, C. Case histories of rock bursts under complicated geological conditions. Bull. Eng. Geol. Environ. 2018, 77, 1529–1545. [Google Scholar] [CrossRef]
- Li, S.; Zheng, M. Development and engineering application of three-dimensional disturbed stress measurement system for deep hard rock engineering based on Fiber Bragg Grating. Chin. J. Rock Mech. Eng. 2023, 43, 1–14. (In Chinese) [Google Scholar] [CrossRef]
- Chen, B.; Feng, X.; Zeng, X.; Xiao, Y.; Zhang, Z.; MIng, H.; Feng, G. Real-time microseismic monitoring and its characteristic analysis during TBM tunneling in deep-buried tunnel. Chin. J. Rock Mech. Eng. 2011, 30, 275–283. (In Chinese) [Google Scholar]
- Chen, B.; Feng, X.; Xiao, Y.; MIng, H.; Zhang, C.; Hou, J.; Chu, W. Acoustic emission test on damage evolution of surrounding rock in deep-buried tunnel during TBM excavation. Chin. J. Rock Mech. Eng. 2010, 29, 1562–1569. (In Chinese) [Google Scholar]
- Jiang, Q.; Feng, X.; Xiang, T.; Su, G. Rockburst characteristics and numerical simulation based on a new energy index: A case study of a tunnel at 2500 m depth. Bull. Eng. Geol. Environ. 2010, 69, 381–388. [Google Scholar] [CrossRef]
- Jiang, Q.; Feng, X.; Chen, G. Study on deterioration model for hard rockmass under high geo-stress. In Advance in Heterogeneous Material Mechanics 2008, China; Fan, J.H., Chen, H.B., Eds.; Advances in Heterogeneous Material Mechanics: Huangshan, China, 2008; pp. 1108–1112. [Google Scholar]
- Li, S.; Kuang, Z.; Xiao, Y.; Qiao, Z.; Yang, W. Rockburst tendency prediction based on an integrating method of combination weighting and matter-element extension theory: A case study in the Bayu Tunnel of the Sichuan-Tibet Railway. Eng. Geol. 2022, 308, 106796. [Google Scholar] [CrossRef]
| Project Name | References | TBM-Constructed Tunnel Length/m | Maximum Overburden of Tunnel/m | Stratigraphic Lithology and Rock Strength (UCS/MPa) | Percentage of Length of Rockburst Section/% | Rockburst Mechanisms or Its Manifestation |
|---|---|---|---|---|---|---|
| Headrace Tunnel Project for the Jinping Cascade II Hydropower Station | (Hou et al. 2011, Yang et al. 2020) [13,14] | 15,092 | 2525 | T2b Marble: 70~100 | SR: 16.85% MR: 6.29% IR: 3.43% ER: 4.46% Total: 31.03% | SR: folding and belling failure and extrusion and slabbing failure MR: structural plane-controlled failures or extrusion and slabbing failures |
| Qinling Tunnel in the Hanjiang–Weihe River Diversion Project | [15,16,17] | 8521 | 2012 | Quartzite, granite, and diorite: 107~317 | Total: 41.65% | SR: flaky flaking type MR: between flaky flaking type and explosive ejection type IR: explosive ejection type |
| The Neelum Jhelum hydroelectric project | [18,19,20] | 20,000 | 2000 | Sandstone: 130~170 | SR: 79.65% MR: 5.31% IR: 0.89% Total: 85.85% | SR: some light damage to the rock support and surrounding rock MR: spitting, spalling, or shallow slabbing to the rock support and surrounding rock IR: violent ejection of rock into the tunnel and severe damage to the installed support |
| Layout Location | Schematic Diagram of the Drilling Design Scheme | Applied Tunnel Engineering | References | The Specific Layout of the SRBs |
|---|---|---|---|---|
| Tunnel side wall |  | Zaoquan Coal Mine Project | [39] | SRBs are staggered in the side wall of the tunnel, such that the distance between transverse SRBs is 1.5 m, the distance between rows is 0.5 m, and the borehole diameter is 100 mm. |
| Tunnel arch position | 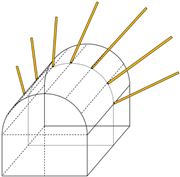 | Water Diversion Project from Han River to Wei River | [30] | The 13 SRBs are symmetrically and evenly arranged at the top arch of the tunnel, with an aperture of 89 mm, a borehole depth of 5.0 m, and a borehole elevation of 15° |
| Tunnel face position | 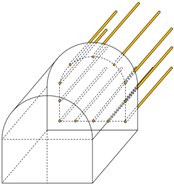 | Headrace Tunnel Project for Jinping Cascade II Hydropower Station, Bayu Tunnel Project | [41,42] | The SRBs are uniformly arranged along the excavation contour or on the circumference at a certain distance from the excavation contour and arranged in multiple rows according to different stress concentrations. |
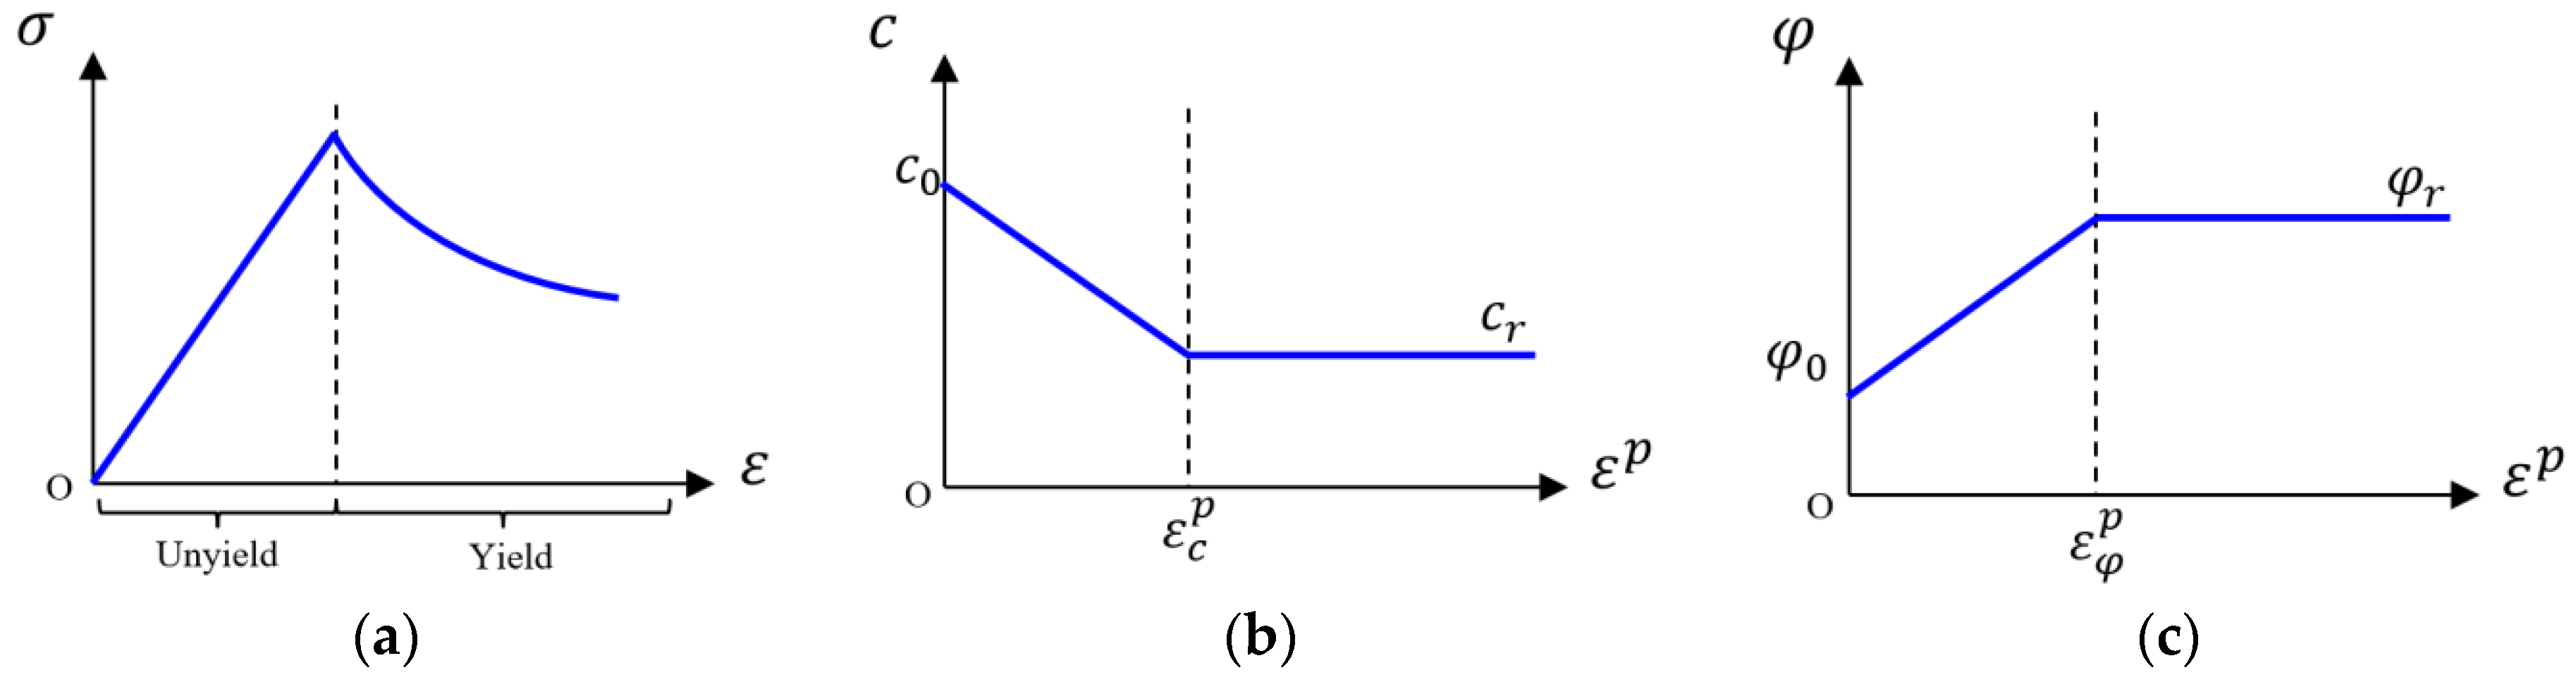
| Parameters | Value |
|---|---|
| Young’s modulus/GPa | 20.00 |
| Poisson’s ratio | 0.25 |
| Dilation angle/° | 10.00 |
| Initial cohesion /MPa | 12.60 |
| Plastic strain limit of cohesion | 0.004 |
| Residual cohesion /MPa | 8.52 |
| Initial internal friction angle/° | 10.00 |
| Plastic strain limit of internal friction | 0.005 |
| Residual internal friction angle/° | 35.00 |
| Stress Release Techniques | Application Scenario | Control Parameters for Stress Release Effect | Advantages | Disadvantages |
|---|---|---|---|---|
| Stress release blast technique | Tunnels constructed by the drilling and blasting method | Length, spacing, borehole location, explosive quantity, etc. | Good stress release effect, short construction period, mature process and easy to apply on the project site | Release borehole parameters rely on empirical values, the blasting effect is not easy to control, and preliminary blasting tests need to be carried out in the field beforehand. |
| SRBs | Tunnels constructed by the drilling and blasting method | Length, spacing, borehole location, etc. | Short construction period, controlled release effect, low construction costs, and mature technology | Limited stress release effects and difficult to carry out in TBM-constructed tunnels |
| High-pressure water injection drilling | Drilling and blasting method and TBM-constructed tunnel | Length, spacing, borehole location, water injection pressure, water injection time, etc. | Reduces the strength of the surface layer of the surrounding rock, facilitates the emergence and expansion of fractures, and reduces the integrity and energy storage capacity of the rock mass | Water injection has a limited impact and limited stress release, and often needs to be combined with other stress release measures to be effective. |
| ASRBs | TBM-constructed tunnel | Length, spacing, inclination, included angle, aperture, etc. | Stress release technology for deep-buried hard rock TBM-constructed tunnels with simple procedures, low cost, and controllable release effect | Limited stress release effect and difficulty in applying tunnel palm faces |
| Type | Criterion | References | Assessment Indexes | Rockburst Grade Assessment Results | |||
|---|---|---|---|---|---|---|---|
| None | Slight | Moderate | Intense | ||||
| Single-factor criteria | Tao Zhenyu criterion | [49] | [14.5,+∞) | [5.5,14.5) | [2.5,5.5) | [0,2.5) | |
| The Turchaninov criterion | [50] | [0,0.3) | [0.3,0.5) | [0.5,0.8) | [0.8,+∞) | ||
| The Russenes criterion | [51] | [0,0.2) | [0.2,0.3) | [0.3,0.55) | [0.55,+∞) | ||
| Strain energy storage index | [52] | [0,2.0) | - | [2.0,5.0] | [5.0,+∞) | ||
| Brittleness coefficient | [53] | [0,3.0] | (3.0,5.0) | [5.0,+∞) | - | ||
| Composite-factor criteria | Rockburst vulnerability index | [54] | - | - | - | - | |
| Excavation vulnerability potential | [55] | [0,50.0) | [50.0,85.0) | [85.0,105) | [105,+∞) | ||
| Test Analysis Methods | Design Ideas | Advantages of the Design Method | Disadvantages of the Design Method | Design Content | Number of Tests |
|---|---|---|---|---|---|
| Comprehensive test | Simulate and analyze all combinations | The correlation between borehole parameters and release effect can be analyzed | The number of research and simulation cases will be too large | All possible combinations of borehole parameters | |
| Control variable method test | Analyze each borehole parameter in turn among various borehole parameters | The number of tests can be greatly reduced, and some important factors can be analyzed separately | The research scheme is not comprehensive enough, and the interference between different factors may be ignored | A parameter combination scheme when one factor changes and the others remain unchanged | |
| Orthogonal test | Use the orthogonal table to arrange the test content | The number of tests is greatly reduced, and the correlation between various factors can be analyzed | The research program is not comprehensive enough | A combination scheme designed according to the orthogonal table |
| Factors | Factor Level | |||
|---|---|---|---|---|
| 1 | 2 | 3 | 4 | |
| Inclination (°) | 13.00 | 14.30 | 15.60 | 16.90 |
| Length (m) | 30.00 | 33.00 | 36.00 | 39.00 |
| Included angle (°) | 10.00 | 11.00 | 12.00 | 13.00 |
| Aperture (m) | 0.20 | 0.22 | 0.24 | 0.26 |
| Spacing (m) | 2.00 | 2.20 | 2.40 | 2.60 |
| Experiment Number | Inclination (°) | Length (m) | Included Angle (°) | Aperture (m) | Spacing (m) |
|---|---|---|---|---|---|
| 1 | 13.00 | 30.00 | 10.00 | 0.20 | 2.00 |
| 2 | 13.00 | 33.00 | 11.00 | 0.22 | 2.20 |
| 3 | 13.00 | 36.00 | 12.00 | 0.24 | 2.40 |
| 4 | 13.00 | 39.00 | 13.00 | 0.26 | 2.60 |
| 5 | 14.30 | 30.00 | 11.00 | 0.24 | 2.60 |
| 6 | 14.30 | 33.00 | 10.00 | 0.26 | 2.40 |
| 7 | 14.30 | 36.00 | 13.00 | 0.20 | 2.20 |
| 8 | 14.30 | 39.00 | 12.00 | 0.22 | 2.00 |
| 9 | 15.60 | 30.00 | 12.00 | 0.26 | 2.20 |
| 10 | 15.60 | 33.00 | 13.00 | 0.24 | 2.00 |
| 11 | 15.60 | 36.00 | 10.00 | 0.22 | 2.60 |
| 12 | 15.60 | 39.00 | 11.00 | 0.20 | 2.40 |
| 13 | 16.90 | 30.00 | 13.00 | 0.22 | 2.40 |
| 14 | 16.90 | 33.00 | 12.00 | 0.20 | 2.60 |
| 15 | 16.90 | 36.00 | 11.00 | 0.26 | 2.00 |
| 16 | 16.90 | 39.00 | 10.00 | 0.24 | 2.20 |
| Experiment Number | Average Stress Release Rate (%) | Average Volume Release Energy (KJ/m3) | |||||||
|---|---|---|---|---|---|---|---|---|---|
| I | II | III | IV | V | A1 | A2 | A3 | A4 | |
| 1 | 5.98 | 5.98 | 3.99 | 3.12 | 2.36 | 9.17 | 7.08 | 2.52 | 1.53 |
| 2 | 5.87 | 6.34 | 3.93 | 2.97 | 3.03 | 8.94 | 7.01 | 2.43 | 1.48 |
| 3 | 5.70 | 6.08 | 4.15 | 3.14 | 2.88 | 9.19 | 7.27 | 2.52 | 1.58 |
| 4 | 5.69 | 6.41 | 4.07 | 3.22 | 3.06 | 9.03 | 7.53 | 2.52 | 1.63 |
| 5 | 5.04 | 5.35 | 3.33 | 2.60 | 2.24 | 7.81 | 5.79 | 1.98 | 1.20 |
| 6 | 8.00 | 8.09 | 4.78 | 4.04 | 3.88 | 11.54 | 8.55 | 2.84 | 1.77 |
| 7 | 3.87 | 3.80 | 2.10 | 1.59 | 1.48 | 5.94 | 3.90 | 1.28 | 0.84 |
| 8 | 6.18 | 6.61 | 3.82 | 3.02 | 2.49 | 9.11 | 6.07 | 2.04 | 1.30 |
| 9 | 6.47 | 6.47 | 3.95 | 3.14 | 2.25 | 10.64 | 6.36 | 2.33 | 1.35 |
| 10 | 6.07 | 5.87 | 3.32 | 2.37 | 2.21 | 9.62 | 5.49 | 2.04 | 1.31 |
| 11 | 4.51 | 4.20 | 2.49 | 2.04 | 2.04 | 6.63 | 4.14 | 1.53 | 1.01 |
| 12 | 3.60 | 3.46 | 1.85 | 1.53 | 1.57 | 5.25 | 3.17 | 1.02 | 0.67 |
| 13 | 1.22 | 1.20 | 0.09 | -0.25 | -0.17 | 5.40 | 2.68 | 1.00 | 0.66 |
| 14 | 3.15 | 2.57 | 1.46 | 1.23 | 1.16 | 4.32 | 2.17 | 0.82 | 0.63 |
| 15 | 7.43 | 6.84 | 4.23 | 3.45 | 3.16 | 11.82 | 6.32 | 2.68 | 1.79 |
| 16 | 5.99 | 5.64 | 3.37 | 2.68 | 2.60 | 9.63 | 5.12 | 2.02 | 1.45 |
Disclaimer/Publisher’s Note: The statements, opinions and data contained in all publications are solely those of the individual author(s) and contributor(s) and not of MDPI and/or the editor(s). MDPI and/or the editor(s) disclaim responsibility for any injury to people or property resulting from any ideas, methods, instructions or products referred to in the content. |
© 2024 by the authors. Licensee MDPI, Basel, Switzerland. This article is an open access article distributed under the terms and conditions of the Creative Commons Attribution (CC BY) license (https://creativecommons.org/licenses/by/4.0/).
Share and Cite
Xie, Z.; Qiu, S.; Li, S.; Xiao, Y.; Zheng, M.; Kuang, Z. A New Approach to Designing Advance Stress Release Boreholes to Mitigate Rockburst Hazards in Deep Boring-Machine-Constructed Tunnels. Appl. Sci. 2025, 15, 95. https://doi.org/10.3390/app15010095
Xie Z, Qiu S, Li S, Xiao Y, Zheng M, Kuang Z. A New Approach to Designing Advance Stress Release Boreholes to Mitigate Rockburst Hazards in Deep Boring-Machine-Constructed Tunnels. Applied Sciences. 2025; 15(1):95. https://doi.org/10.3390/app15010095
Chicago/Turabian StyleXie, Zhenkun, Shili Qiu, Shaojun Li, Yaxun Xiao, Minzong Zheng, and Zhihao Kuang. 2025. "A New Approach to Designing Advance Stress Release Boreholes to Mitigate Rockburst Hazards in Deep Boring-Machine-Constructed Tunnels" Applied Sciences 15, no. 1: 95. https://doi.org/10.3390/app15010095
APA StyleXie, Z., Qiu, S., Li, S., Xiao, Y., Zheng, M., & Kuang, Z. (2025). A New Approach to Designing Advance Stress Release Boreholes to Mitigate Rockburst Hazards in Deep Boring-Machine-Constructed Tunnels. Applied Sciences, 15(1), 95. https://doi.org/10.3390/app15010095