1. Introduction
Trauma is a phenomenon of experiencing psychologically, emotionally, or physically overwhelming events, affecting 70–90% of individuals at some point in their lifetime [
1]. While universal, the impact of trauma is particularly profound during childhood and adolescence, critical periods of brain growth and reorganization. Developmental vulnerabilities in emotion regulation and stress coping mechanisms make children more susceptible to trauma’s long-term effects, including disrupted neurodevelopment and maladaptive behaviors [
2,
3].
Childhood trauma has been linked to the development of post-traumatic stress disorder (PTSD), anxiety disorders, and depression later in life [
4]. These findings underscore the importance of understanding the underlying brain mechanisms to facilitate early interventions [
5]. Magnetic Resonance Imaging (MRI) has been a cornerstone for exploring structural brain changes in trauma-exposed individuals [
6]. Studies have revealed associations between childhood trauma and alterations in brain regions, e.g., a thinner superior frontal gyrus (SFG) cortex and thicker right caudal middle frontal gyrus and left isthmus cingulate [
7]. Additionally, distinct gray matter volume patterns in the prefrontal, cerebellar, limbic, and sensory networks have been identified [
8].
Analyzing MRI data poses unique challenges due to its multi-dimensional nature, requiring computational approaches to extract meaningful insights [
9]. Traditional machine learning techniques, such as Support Vector Machines (SVMs) and Principal Component Analysis (PCA), have been widely used in neuroimaging studies. SVMs are particularly effective in both linear and non-linear classification tasks [
10], while PCA aids in reducing dimensionality by identifying components that explain the largest variance in the data [
11]. However, these methods also face limitations in capturing the intricate, non-linear, and irregular relationships inherent in brain imaging data [
12].
Deep learning methods, particularly convolutional neural networks (CNNs), have shown promise in learning high-dimensional features from image-based data [
13]. CNNs are commonly applied to tasks such as image classification and segmentation, but their grid-based architecture struggles to effectively handle the irregular patterns and non-Euclidean relationships present in brain imaging data [
14]. This limitation has spurred interest in more flexible models like graph neural networks (GNNs), which excel in modeling complex, non-linear structures and relationships in data [
15].
GNNs have emerged as a powerful alternative, combining the feature-learning capabilities of neural networks with the flexibility to handle graph-structured data [
16]. Unlike CNNs, GNNs can directly model the relational and irregular patterns found in neuroimaging, such as connections between brain regions or irregular spatial distributions [
14]. GNNs also share theoretical advantages with kernel-based models like SVMs but provide additional capacity for learning hierarchical representations of structural data [
17,
18]. Recent studies have reviewed GNN-based methods in network neuroscience, highlighting applications such as disease classification, missing brain graph synthesis, and biomarker discovery, emphasizing their potential in advancing the diagnosis of neurological disorders and population graph integration [
19,
20]. For example, BrainGNN has been proposed as a framework to analyze fMRI data, leveraging ROI-aware graph convolutions and salient ROI-selection mechanisms to outperform traditional fMRI analysis methods in identifying biomarkers for Autism Spectrum Disorder (ASD) and task decoding in Human Connectome Project (HCP) data [
20]. Despite these strengths, GNN applications in neuroimaging still remain limited and have not been applied to examine the structural changes related to childhood trauma and related psychopathologies.
To address this gap, this study applies GNNs to analyze structural MRI data from children and adolescents exposed to trauma showing various types of psychopathologies. By leveraging the ability of GNNs to model complex, non-linear relationships, this research aims to classify trauma-exposed individuals, identify key structural patterns, and evaluate the feasibility of GNN-based approaches in neuroimaging. Ultimately, this study seeks to advance our understanding of trauma-related brain changes while demonstrating the potential of GNNs as a transformative tool in computational neuroscience.
2. Methods
2.1. Data Acquisition
For this study, a total of 33 participants aged between 10 and 18 years were recruited. The trauma-exposed group consisted of 15 individuals with significant trauma experiences and various comorbid psychopathologies related to trauma exposure, identified through a review of medical records from the child and adolescent psychiatry outpatient clinic of a university hospital. Of these, nine were female, with a mean age of 15.13 years (SD = 0.83). The control group included eighteen participants recruited from the local community, five of whom were female, with a mean age of 15.16 years (SD = 1.54).
Participants were excluded if they met any of the following criteria: (1) comorbid psychotic, tic, or pervasive developmental disorders; (2) diagnosed central nervous system (CNS) disorders; (3) active use of psychiatric medications at the time of participation; (4) positive results on urine toxicology or pregnancy tests; (5) Wechsler Abbreviated Scale of Intelligence (WASI) [
21] scores below 70; or (6) medical conditions or physical limitations precluding MRI scanning (e.g., presence of metal implants, claustrophobia).
All clinical assessments were conducted by licensed child and adolescent psychiatrists through structured interviews with participants and their parents. Diagnoses for the trauma-exposed group were confirmed, and psychiatric disorders for the control group were ruled out using the Schedule for Affective Disorders and Schizophrenia for School-Age Children-Present and Lifetime Version (K-SADS) [
22]. Written informed consent and assent were obtained from all participants and their legal guardians before the study.
All participants underwent brain imaging using a 3.0-Tesla GE Discovery 750w MRI scanner (GE Healthcare, Milwaukee, WI, USA). High-resolution T1-weighted anatomical images were collected to support spatial normalization, employing the following parameters: repetition time (TR) = 2200 ms, echo time (TE) = 2.48 ms, flip angle = 8°, field of view (FOV) = 230 mm (0.9 × 0.9 × 0.9 mm³ voxels), 176 axial slices, matrix size = 256 × 208, slice thickness = 1.0 mm, and a distance factor of 50%. These imaging parameters were optimized to ensure detailed acquisition of brain structure data.
2.2. Data Preprocessing
To ensure the quality and consistency of the imaging data, preprocessing steps were performed using the AFNI 24.0.17 software suite. First, skull and non-brain tissues were removed to isolate brain tissues. The images were then normalized to a standard space using the Automated Anatomical Labeling (AAL) template [
23]. This normalization process involved aligning the input data with the template, ensuring accurate mapping of anatomical structures for subsequent region-of-interest (ROI)-based analysis.
Following normalization, a whole-brain ROI-based signal intensity analysis was conducted. A predefined AAL atlas was used to define the ROIs, and the mean signal intensity was calculated for each ROI. This preprocessing step facilitated the quantification of regional signal characteristics, laying the groundwork for group comparisons and statistical analyses in the later stages of the study.
2.3. Graph Neural Network (GNN) Approach
The proposed graph neural network (GNN) model was trained in an unsupervised manner to learn graph representations from brain imaging data. The process involved two key steps: (1) graph construction and (2) graph neural network modeling.
2.3.1. Graph Construction
The graph was constructed based on the correlation matrix of the ROI mean values derived for each participant. Edges (
) were defined using a threshold of 0.5, meaning that an edge between two nodes,
i and
j, was included if the absolute value of their correlation coefficient (
) exceeded the threshold. The edge weight (
) was set to the correlation value.
represents the edge set, and
denotes the weight of the edge between nodes
i and
j.
2.3.2. Graph Neural Network Architecture
The GNN model consisted of two graph convolution layers, followed by a pooling layer to generate graph-level representations. Node features (
) and edge indices (
) were used to update node embeddings. The node embedding update at layer
l was performed using a graph convolution operation, as shown in Equation (
2):
where
is the degree matrix,
is the adjacency matrix,
represents the node embeddings at layer
l,
is the trainable weight matrix for layer
l, and
is the activation function (ReLU).
The final graph representation was obtained by applying mean pooling to the node embeddings from the last graph convolution layer. This step aggregated the information from all nodes to form a single vector representation of the graph, as shown in Equation (
3):
where
N is the number of nodes in the graph, and
is the embedding of node
i.
2.3.3. Unsupervised Training Objective
The model was trained to preserve the graph structure by minimizing a reconstruction loss, as shown in Equation (
4):
where
is the true adjacency matrix, and
is the reconstructed adjacency matrix predicted by the model.
2.3.4. Implementation Details
The hidden dimension of the GNN layers was set to 64, and the Adam optimizer was used with a learning rate of 0.001, a commonly used value in neural network training with the Adam optimizer, to balance convergence speed and stability. The training process was conducted for 100 epochs to ensure convergence and sufficient learning of the graph representations.
All analyses and model training were performed using Python 3.12.6 and PyTorch 2.5.1. Additional libraries included NumPy, Pandas, and PyTorch Geometric for graph-related computations.
3. Results
3.1. Descriptive Analysis
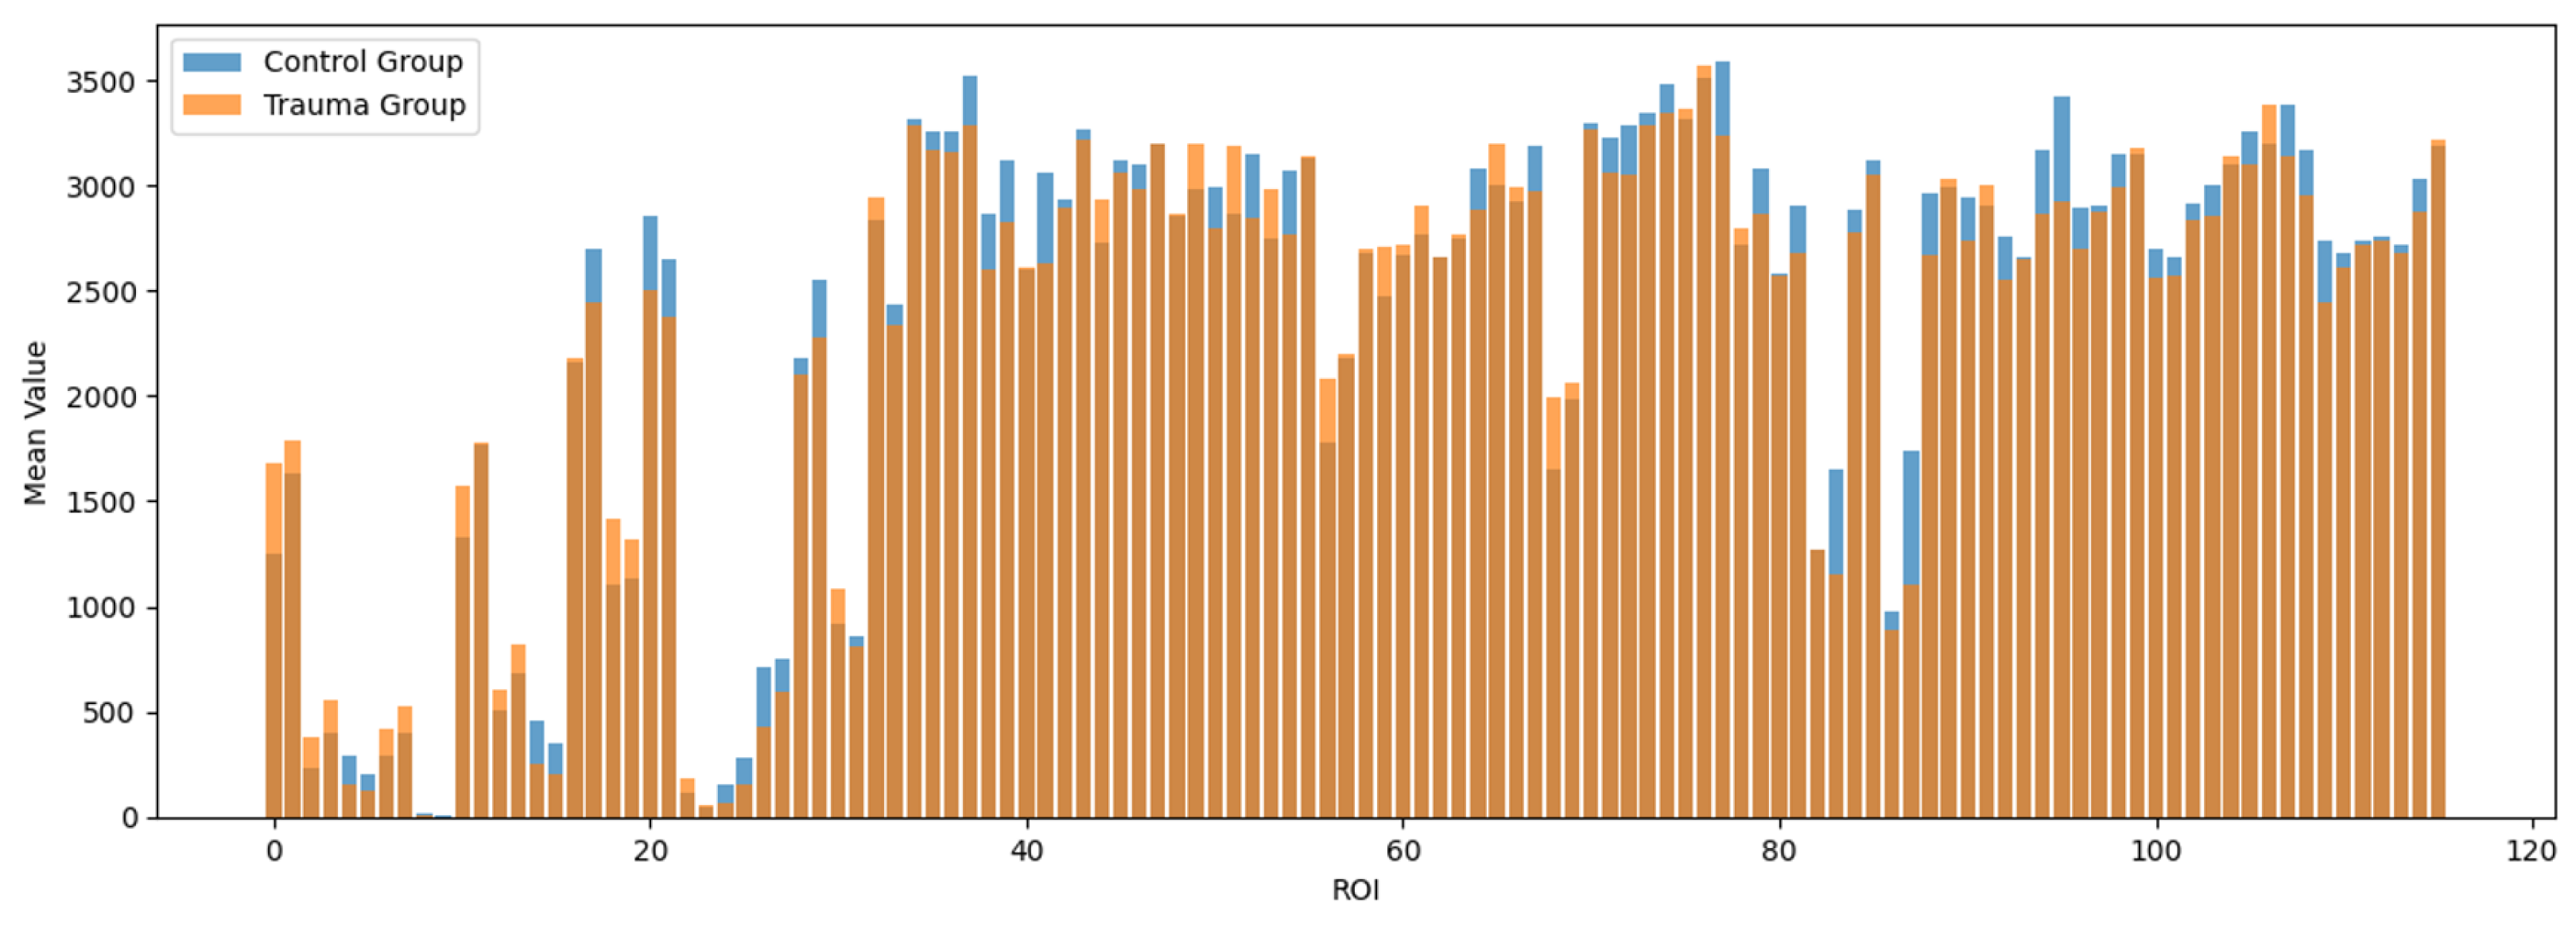
To examine the regional distribution of brain signals processed through AFNI and the AAL atlas, descriptive statistics were conducted for the 116 regions defined by the atlas. The mean signal intensities for each region are visualized in
Figure 1.
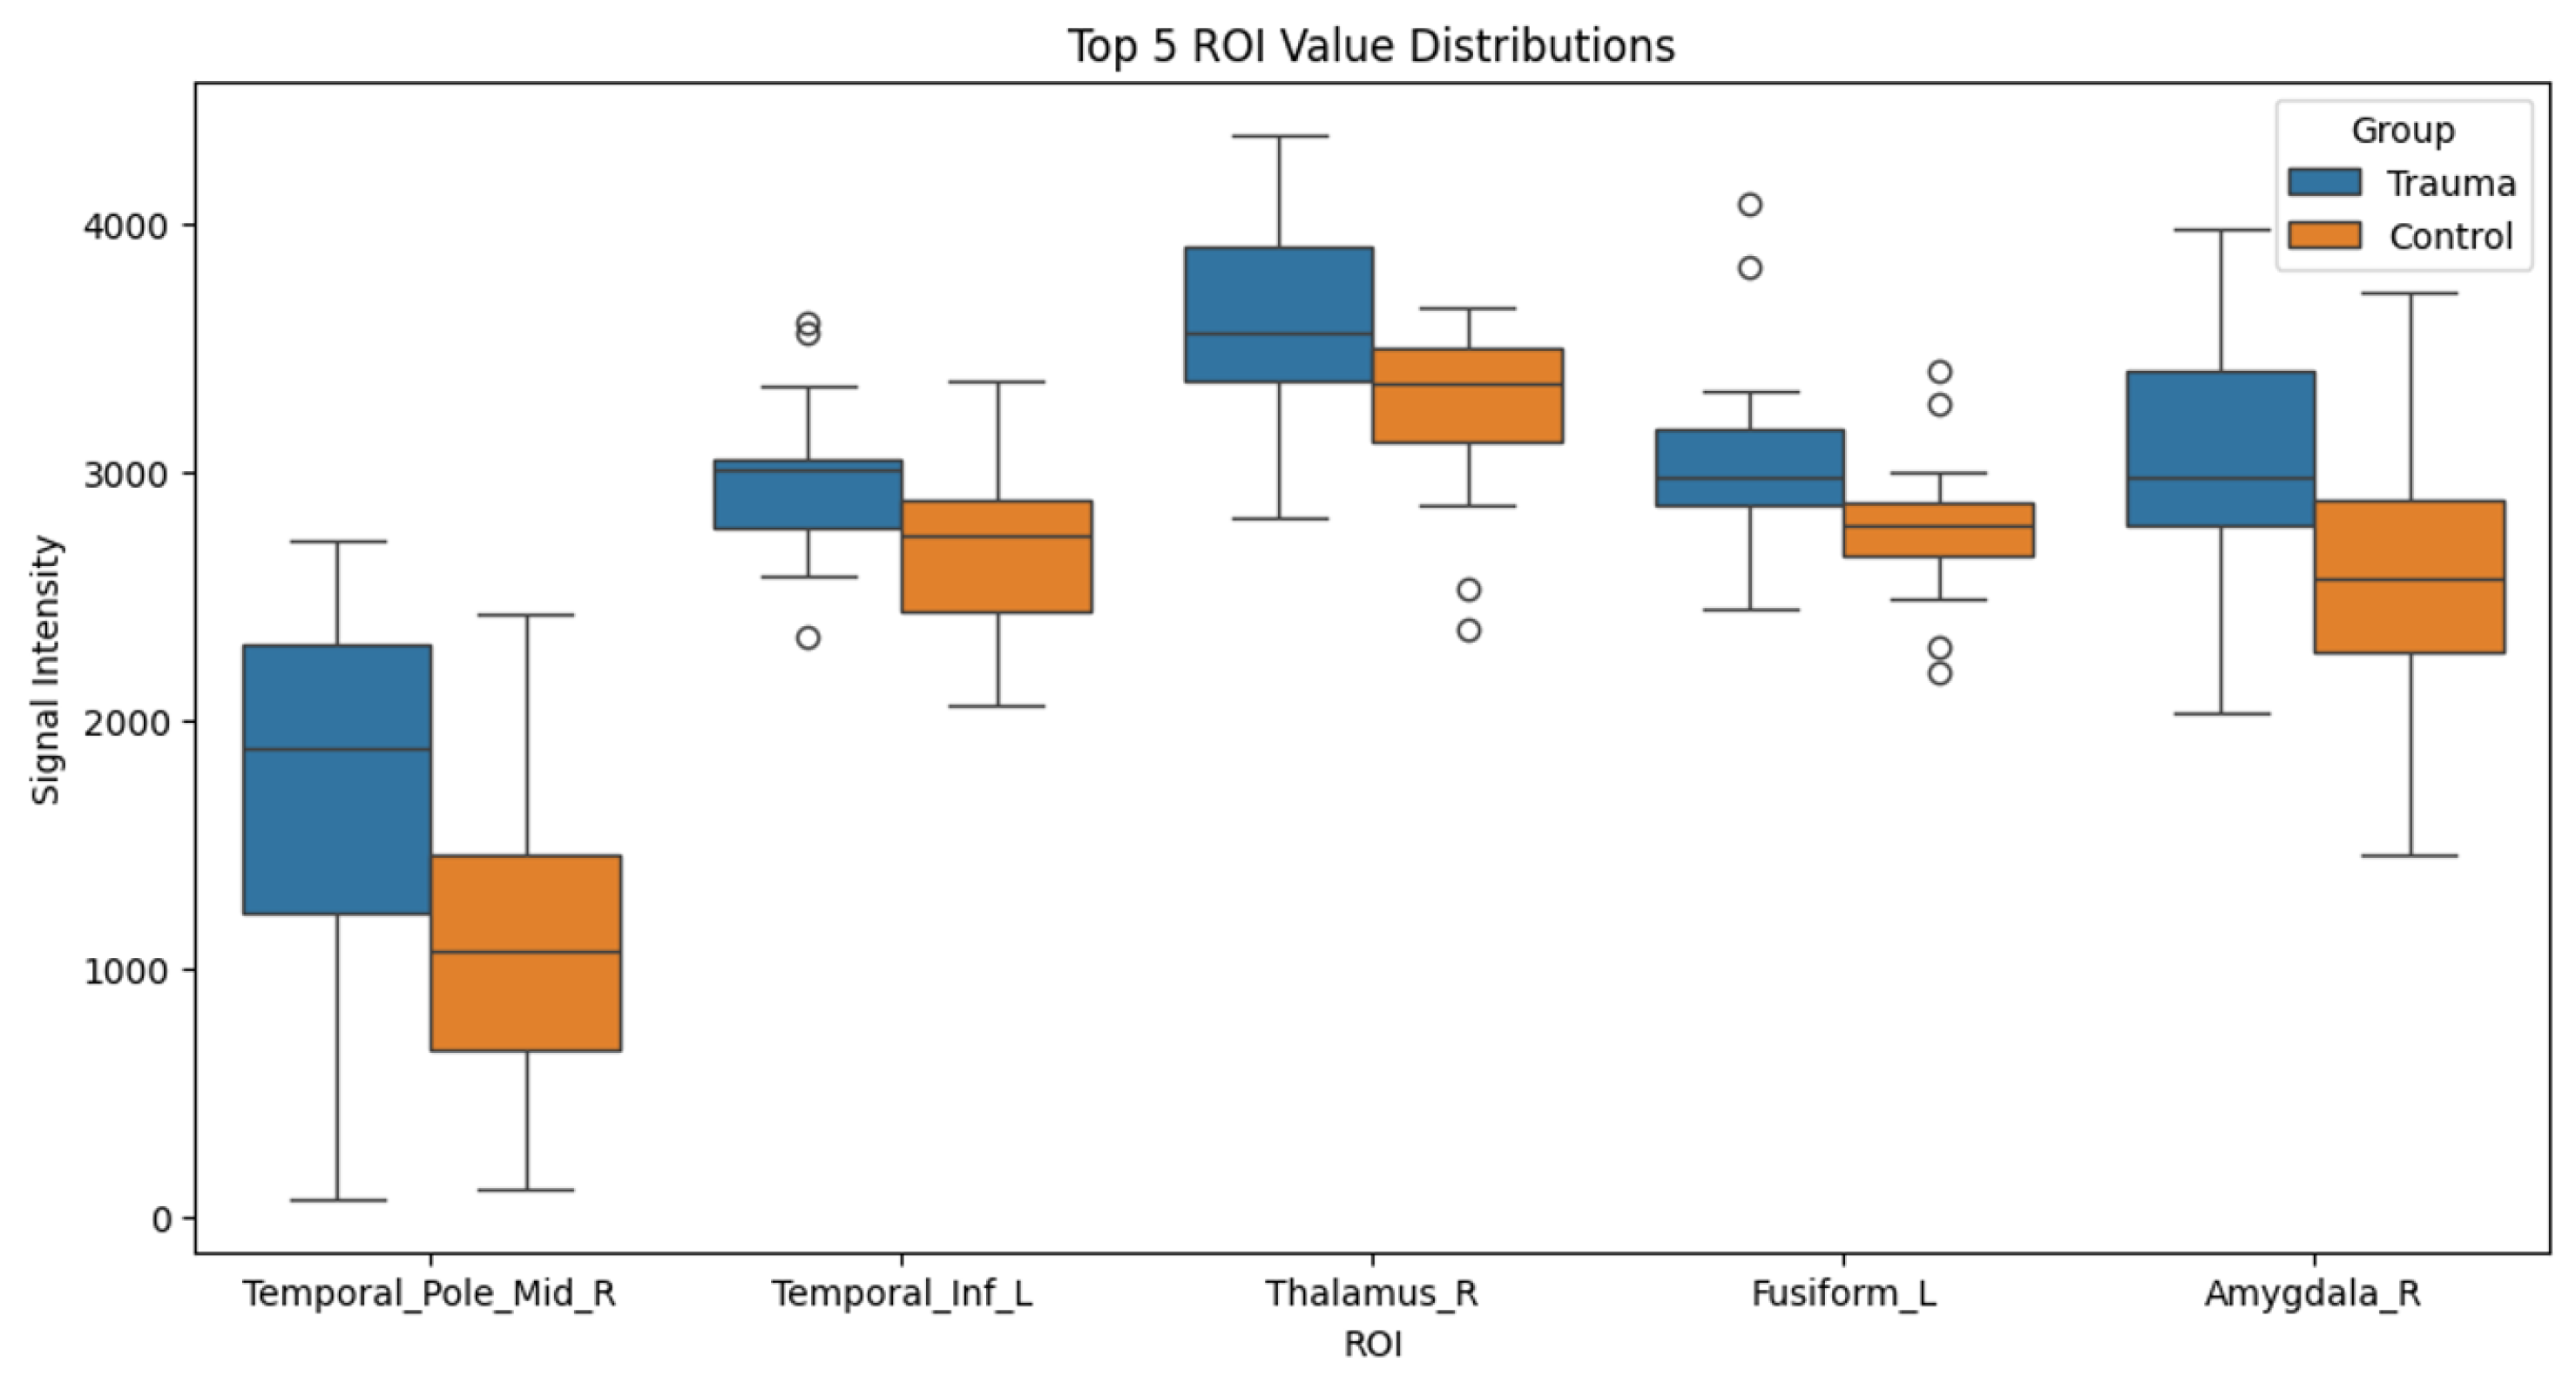
Subsequently, independent
t-tests were performed to identify regions with significant differences in signal intensities between the trauma-exposed and control groups. The regions showing significant differences were as follows: the middle temporal gyrus (MTG) (Control: M = 1742.616, SD = 737.373; Trauma: M = 1101.460, SD = 609.891; t = 2.688,
p = 0.012), the left inferior temporal gyrus (LITG) (Control: M = 2966.947, SD = 345.417; Trauma: M = 2665.265, SD = 354.601; t = 2.468,
p = 0.019), the right thalamus (Control: M = 3587.764, SD = 449.178; Trauma: M = 3236.774, SD = 351.921; t = 2.462,
p = 0.021), the left fusiform gyrus (Control: M = 3073.378, SD = 424.227; Trauma: M = 2764.026, SD = 295.638; t = 2.383,
p = 0.025), and the right amygdala (Control: M = 3057.784, SD = 525.829; Trauma: M = 2632.298, SD = 597.392; t = 2.175,
p = 0.037). These differences are summarized in
Table 1 and visualized in
Figure 2.
3.2. Graph Modeling and Analysis with GNN
In this study, the brain networks of the trauma-exposed group and the control group were modeled as graphs, with 116 nodes representing predefined Regions of Interest (ROIs). Edges were generated based on the correlations between ROIs, with edge weights reflecting the correlation coefficients. These correlation networks were used as input for graph neural network (GNN) analysis.
The structural analysis of the graphs revealed that the trauma-exposed group had fewer edges and lower mean edge weights compared to the control group, indicating reduced connectivity strength. Additionally, the trauma-exposed group exhibited higher variability in edge weights, suggesting irregular connection patterns.
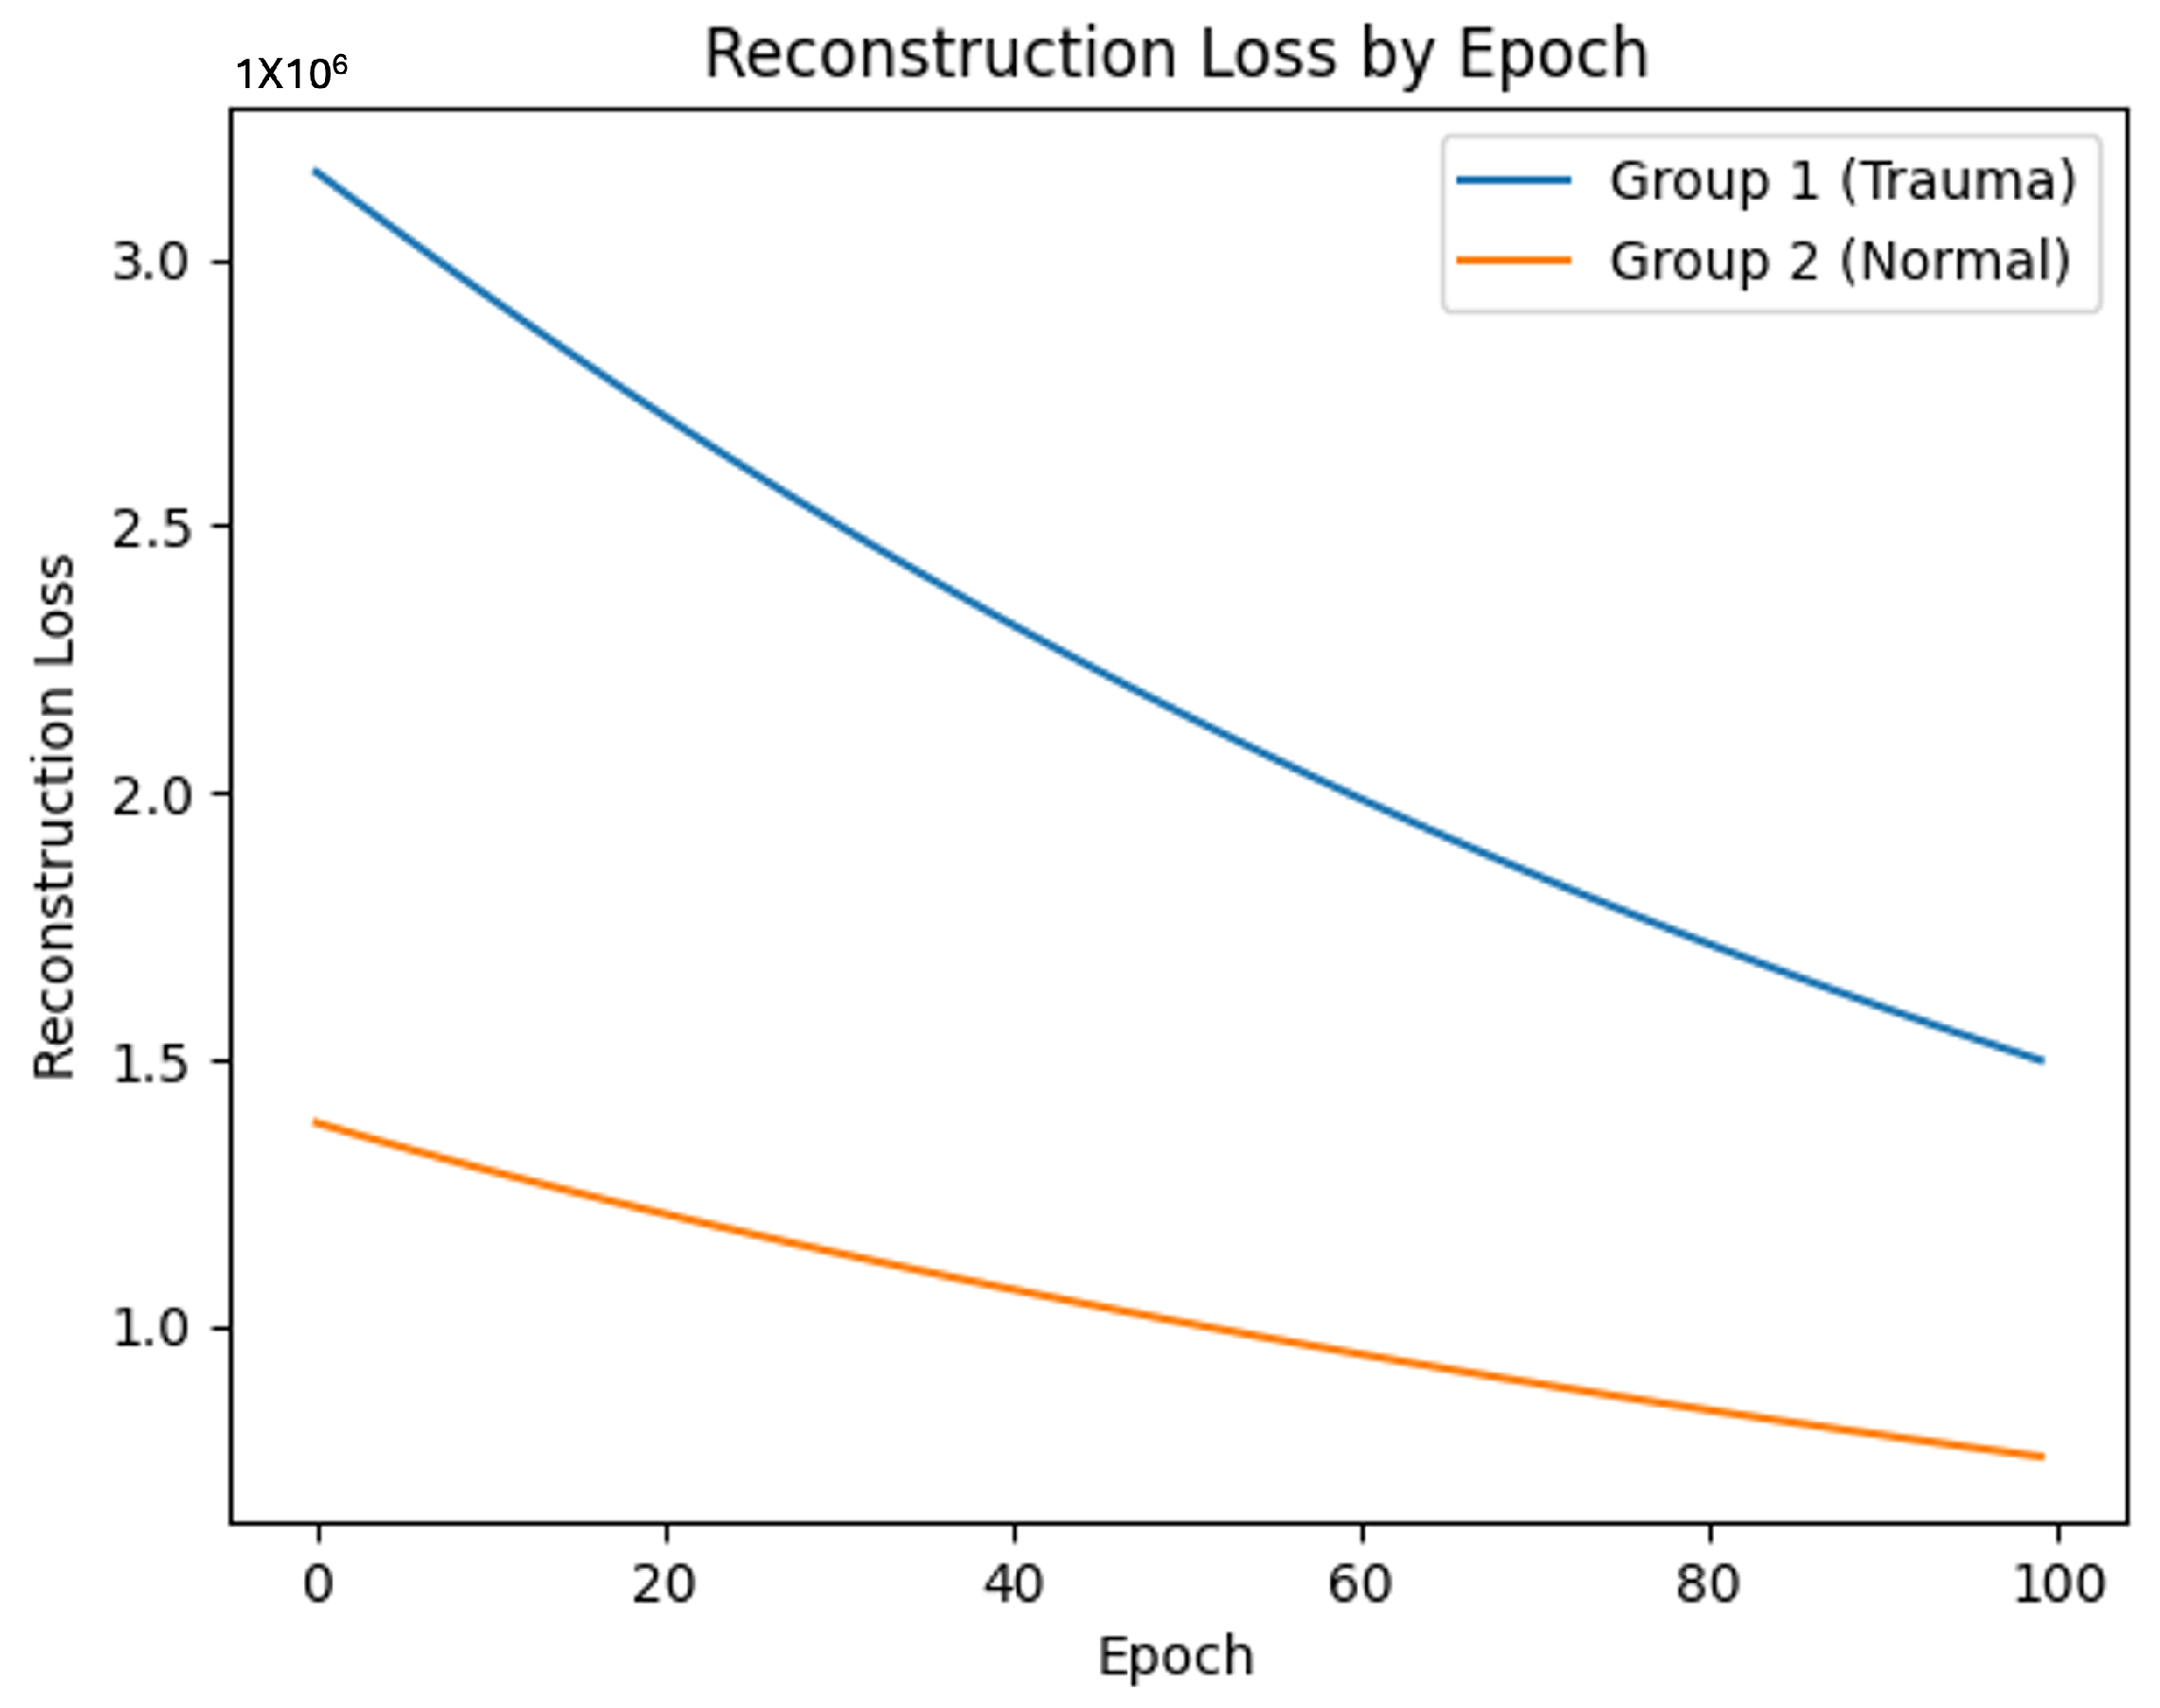
When training the GNN model on these graph data, the trauma-exposed group showed slower learning progress and less effective graph reconstruction compared to the control group. The reconstruction loss was consistently higher for the trauma-exposed group, suggesting that their brain network patterns were more challenging for the GNN to model effectively. These observations point to notable differences in brain network structure and connectivity between the two groups.
Figure 3 illustrates the consistently higher reconstruction loss for the trauma-exposed group across training epochs, reflecting the greater difficulty in modeling their brain network patterns.
Further analysis will explore specific ROIs contributing to these group differences, providing a more detailed understanding of the regional characteristics of the brain networks.
3.3. ROI-Level GNN Analysis
The ROI-level analysis using the GNN model revealed distinct patterns of node importance between the trauma-exposed and control groups, highlighting key regions of the brain associated with their respective characteristics.
In the trauma-exposed group, the posterior cerebellum, specifically the Cerebellum Lobule VII, demonstrated the highest node importance score (26.8617). This was followed by regions such as the Cerebellum Lobules IV and V, left Posterior Cingulate Cortex, left Hemisphere, left Cerebellum Crus II, and right Inferior Occipital Gyrus.
In contrast, the control group exhibited the highest node importance in the Right Lingual Gyrus (23.4322), a region involved in visual processing. Other important regions in this group included the right Cerebellum Lobule VI and the right Inferior Temporal Gyrus.
Figure 4 illustrates the filtered brain networks for the trauma-exposed and control groups, highlighting the structural differences between the groups. The visualization displays connections and nodes retained after filtering, where only those above the median threshold for connectivity were visualized, emphasizing the network structure within each group.
4. Discussion
To our knowledge, this is the first study that has applied the novel technology of graph neural networks (GNNs) in this domain to investigate structural brain changes in children with trauma exposure and comorbid psychopathologies. To this aim, we collected and analyzed MRI-based brain data from participants with significant trauma exposure and from controls and applied a whole-brain, ROI-based GNN approach to analyze their brain constructional patterns.
The analysis revealed notable differences in network patterns between the two groups. A simple comparison of mean densities across brain regions using t-tests showed significant differences in areas such as the middle temporal gyrus, where the control group exhibited higher mean density compared to the trauma-exposed group, and the left inferior temporal gyrus, with the control group again showing higher density compared to the trauma-exposed group. These findings highlighted specific brain regions with pronounced density variation between the trauma-exposed and control groups. However, by applying GNNs, we extended these results to uncover deeper, non-linear patterns by accounting for the complex and intrinsic connectivity between brain regions, providing a more comprehensive understanding of the underlying network differences.
By applying the GNN training process, the trauma-exposed group exhibited a simpler network structure, as evidenced by higher and more consistent reconstruction loss. In contrast, the control group demonstrated more diverse and complex network patterns, suggesting greater variability and richness in brain connectivity. These findings indicate that the GNN model effectively captured and distinguished the underlying patterns in brain structures related to trauma exposure and comorbid psychopathologies, providing meaningful insights into the network differences between the two groups.
The simpler network patterns observed in the trauma-exposed group may reflect neural adaptations to chronic stress or trauma. Research has suggested that prolonged exposure to stress during critical developmental periods can disrupt typical neural connectivity patterns, leading to more rigid and less adaptive networks [
24]. This may result from the heightened allostatic load, where the brain reallocates resources to prioritize survival-oriented processes, such as hypervigilance or threat detection, at the expense of higher-order cognitive and emotional functions [
25]. In this context, the reduced network variability and complexity in the trauma-exposed group may be indicative of impaired neuroplasticity, limiting the brain’s ability to adapt to novel stimuli or environments.
At the ROI level, the control group showed higher node importance in brain regions typically associated with general functions, such as the right lingual gyrus for visual perception [
26], which may reflect the normal patterns of neuro-cognitive functions in adolescence [
27]. In contrast, the trauma-exposed group exhibited high node importance in regions related to cognitive and emotional regulation, particularly the posterior cerebellum (Cerebellum 7b) [
28]. This region is known to play a key role in integrating cognitive and emotional processes under conditions of stress [
29]. These findings align with clinical observations of children with trauma exposure, who often exhibit difficulties in flexible problem-solving [
30], emotional regulation [
31], and social adaptation [
32]. The prominence of the posterior cerebellum in the trauma-exposed group may reflect neural adaptations to trauma, highlighting its increased role in compensating for stress-related disruptions [
33]. Clinically, this suggests that trauma-related neurodevelopmental changes may predispose children to specific cognitive and emotional challenges, underscoring the importance of early interventions to mitigate these effects [
34].
Prior studies on trauma and brain structure have mainly reported findings such as reduced amygdala volume [
35] and smaller gray matter volumes in regions like the left superior parietal lobule and right superior frontal gyrus [
36]. These studies largely relied on visual inspection of MRI images, focusing on differences in white and gray matter volumes. In contrast, this study utilized GNNs to analyze connectivity density across brain regions, providing new and meaningful results. Our findings extend from the previous findings by highlighting the regions (such as the posterior cerebellum) that have been previously implicated in trauma-related brain changes. This aligns with existing literature [
37], affirming the validity of our GNN-based approach.
The findings of this study hold significance for future research on the roles of specific brain regions in response to trauma, disease, or other experiences. By successfully applying GNNs, we were able to move beyond traditional CNNs or machine learning models, which may overlook the irregular and relational nature of brain image data [
14], and demonstrate the applicability of GNNs for brain imaging research. Furthermore, this study suggests that GNNs can uncover meaningful insights beyond the traditionally discussed frontal lobe regions [
38], highlighting the importance of other brain areas.
Nevertheless, this study has limitations. The relatively small sample size and the generic GNN model architecture used in this analysis may restrict the generalizability of the results. In addition, the patient group had heterogeneous presentations of trauma exposure (physical abuse, sexual abuse, neglect, etc.) as well as comorbid psychopathologies (internalizing and externalizing). While this study focused on trauma exposure as the primary variable, other factors such as substance use or medication use were not controlled and should be considered in future research. While this study highlights structural differences in the brain, the neurodevelopmental changes in these differences could not be examined due to the cross-sectional design. Future research should explore the neuro-developmental trajectory of the observed structural changes. Also explore more tailored GNN architectures and training methods that align with the unique characteristics of brain image data. Additionally, combining GNNs with complementary methods, such as functional connectivity analysis, may provide a more comprehensive understanding of brain networks. While this study used an unsupervised approach to analyze group differences, future studies could validate the effectiveness of GNNs by incorporating supervised learning with defined target variables. Expanding on these directions will further establish GNNs as a robust tool for brain imaging research. As this study represents an early-stage exploration, it should be considered a pilot study, and more comprehensive longitudinal research is needed to better understand the causal relationships between trauma exposure and brain connectivity changes.
5. Conclusions
This study investigated the brain networks of children and adolescents exposed to trauma and comorbid psychopathologies, applying a novel graph neural network (GNN) approach to analyze whole-brain structure. By leveraging ROI-based brain network modeling, we demonstrated the utility of GNNs in capturing complex connectivity patterns, uncovering meaningful differences between the trauma-exposed and control groups.
Our findings revealed that the trauma-exposed group exhibited simplified and uniform connectivity, with key regions such as the posterior cerebellum showing heightened importance, whereas the control group displayed richer and more complex networks centered on general motor and visual processing areas. These results reflect not only the brain structure linked to trauma but also the potential of GNNs to provide deeper insights into brain network organization beyond traditional approaches.
This study highlights the potential of GNNs to bridge gaps in existing neuroimaging methodologies, enabling a more comprehensive understanding of how trauma impacts brain development. While the findings offer promising directions, future work should address the limitations of small sample sizes and explore optimized GNN architectures tailored to the unique properties of brain imaging data.
By presenting a novel application of GNNs to trauma-related brain research, this study lays the groundwork for further exploration into brain connectivity, providing a foundation for targeted interventions and advancing the role of machine learning in neuroimaging.


 ,
, 

