Article

Study on the Multi-Hazard Responses of Transmission Tower-Line Systems Under Fire and Wind Loads Using ABAQUS

1
Shandong Electric Power Engineering Consulting Institute Corporation Limited, Jinan 250013, China
2
School of Civil Engineering, Shandong Jianzhu University, Jinan 250101, China
3
Key Laboratory of Building Structural Retrofitting & Underground Space Engineering, Ministry of Education, Shandong Jianzhu University, Jinan 250101, China
*
Author to whom correspondence should be addressed.
Appl. Sci. 2025, 15(1), 255; https://doi.org/10.3390/app15010255
Submission received: 11 November 2024 / Revised: 27 December 2024 / Accepted: 30 December 2024 / Published: 30 December 2024
(This article belongs to the Special Issue Structural Dynamics and Risk Assessment of Structures)

Abstract

:
Transmission lines are usually located outdoors and are subjected to wind loads year-round. When a fire occurs, transmission towers are exposed to the combined effects of fire and wind loads. This paper investigates the impact of high temperatures on the bearing capacity of transmission tower-line systems under wind load and explores the effects of uneven horizontal spacing distribution and changes in the elevation of the target tower on the bearing capacity of the tower-line system. The failure criteria for transmission tower components at high temperatures were determined by considering the constitutive relationship of steel at ambient temperature and the variation patterns in material strength and elastic modulus with temperature. A finite element model of the transmission tower-line system was established using ABAQUS (2023). This paper studied the effects of temperature, uneven horizontal spacing distribution, and changes in the elevation of the target tower on the response of the transmission tower-line system by comparing collapse-resisting wind speeds and collapse processes under various conditions. The research indicates that the load-bearing capacity of the transmission tower-line system decreases as temperature increases. When the temperature exceeds 400 °C, the collapse-resisting wind speed of the transmission tower drops sharply. At temperatures above 600 °C, the transmission tower may collapse even at the annual average wind speed. In addition, the uneven horizontal spacing distribution and changes in the elevation of the target tower have an adverse effect on the stability of the transmission tower-line system. It is recommended to choose steel materials with higher fire resistance or apply fire-resistant coatings to existing steel, and to avoid extremely uneven spacing distributions and excessively high target tower elevations.

1. Introduction

Global electricity consumption has rapidly increased, leading to the construction of numerous transmission lines over the past few decades. For instance, in 2023, the State Grid Corporation of China invested more than CNY 500 billion in transmission line development. Transmission lines are essential for delivering electricity. Their safety affects not only the reliability of the power supply but also the functioning of the socio-economic system [1,2,3,4]. Therefore, studying the failure mechanisms of transmission lines under various hazards is crucial.
The transmission tower-line system is sensitive to wind loads, with collapses occurring during strong winds. Its design typically accounts for high-wind scenarios [5]. Many scholars have studied the failure mechanisms of transmission towers under wind loads. Deng et al. [6] examined the effect of the wind load incident angle on the dynamic response of the system through wind tunnel experiments. Cai et al. [7] analyzed the vulnerability of the system under extreme wind speeds, considering the effects of wind speed, wind direction angle, and horizontal span distance. Edgar et al. [8] conducted a nonlinear analysis of transmission towers under wind loads, indicating that an aerodynamic model of the tower could better assess its failure mechanisms. Yan Bo et al. [9] explored the effect of wind direction angle on the dynamic response of transmission towers under wind loads. Zhang et al. [10] used static and dynamic time-history analysis methods to assess the ultimate load-bearing capacity of transmission towers under wind loads. Fu et al. [11] proposed a method for evaluating the vulnerability of transmission towers, validating the accuracy of the assessment by comparing simulation results with experimental data. Okamura et al. [12] conducted wind tunnel tests on a transmission tower, analyzing its wind-induced vibration characteristics and dynamic parameters using full-scale measurements. Li Tao et al. [13] also performed wind tunnel tests on a transmission tower, calculating its response parameters under typhoon conditions. Shehata et al. [14] conducted a response analysis of transmission towers under gusty wind loads, investigating the variation of internal forces in the tower members. Chen et al. [15] carried out field tests on the wind-induced vibration response of transmission lines, identifying and analyzing the responses of both the conductors and transmission towers under wind loads. Guo et al. [16] performed wind tunnel tests on transmission towers, comparing experimental values with finite element theoretical predictions to determine the most unfavorable slope for the tower. Liang Bo et al. [17] simulated wind loads using the Kármán wind speed spectrum and analyzed the wind-induced vibration response of the transmission tower using finite element methods. They found that the conductors adversely affected the dynamic response of the tower-line system. Zhang et al. [18] developed a finite element model of the transmission tower-line system and analyzed the impact of the ground wire on the wind-induced vibration response of the transmission tower, estimating the maximum wind speed for the system. Zhang Linlin et al. [19] established a three-tower, two-line model for wind-induced dynamic response analysis, comparing the results with those from single-tower calculations. Zhao Guifeng et al. [20] conducted wind tunnel tests to study the wind-induced dynamic response of the tower-line system, finding that transmission lines and insulators significantly impacted the transmission tower structure. Jeddi et al. [21] performed wind-induced vibration response analysis under multi-angle wind loads using an aeroelastic model in wind tunnel experiments, investigating the effects of higher-order vibration modes on the wind-induced response of the transmission tower. Wu et al. [22] analyzed the wind-induced vibration response of the transmission tower-line system, identifying locations of potential collapse and assessing the safety of the transmission tower under wind loads. Savory et al. [23] conducted a four-year field observation on a transmission tower in southern England, analyzing a large amount of measured data to study the effects of wind loads on the forces at the base of the transmission tower foundation.
Fire is one of the most frequent and devastating natural hazards, often causing significant direct economic losses that can exceed those from earthquakes, and is one of the more common natural disasters [24]. The mechanical properties of steel are significantly influenced by temperature, with its strength and elastic modulus varying at different temperatures. When the temperature reaches the melting point, the material’s strength and elastic modulus approach zero. Many scholars have studied the mechanical properties of different steel structures and steel components under fire conditions. Lou et al. [25] conducted fire tests on a 36 m × 12 m portal steel frame and found that asymmetric fires caused the frame to collapse out of the plane. Ren et al. [26] proposed a calculation method for the internal forces and deflections of steel frame beams under fire conditions, using this method to analyze the impact of different initial restraint conditions on the results. Liu Hongbo et al. [27] carried out fire tests on steel frame structures and observed that the structure experienced a reverse arching effect, which was highly detrimental to the integrity of the frame. Ruan Shipeng et al. [28] performed a spread fire test on a two-story steel frame structure, revealing that steel components affected by the spread fire exhibited a different temperature increase pattern compared to previous studies, requiring three distinct stages: heat-up due to diffusing hot gases, direct fire heating, and cooling. Wang et al. [29] studied the fire resistance of Q460 steel beams using the equivalent stiffness method, proposing a simplified method to predict the critical temperature of Q460 steel beams under non-uniform temperature distribution. Yang et al. [30] investigated the effects of longitudinally non-uniform fires on steel columns, finding that the critical temperature of columns with longitudinally non-uniform heating was higher than that of uniformly heated columns. Wang Weiyong et al. [31], based on existing creep models and combined with steel column fire test data, proposed a time-dependent reinforced creep model for Q345 steel and the Norton creep model. Xue Xuanxi et al. [32] suggested that the mechanical properties of steel columns at high temperatures are influenced by fire temperature, cooling methods, and fatigue strain amplitudes, and fitted fatigue life and cyclic stress–strain curves for Q690 high-strength steel based on experimental data. Ferraz et al. [33] investigated the mechanical properties of steel columns under different ventilation conditions and fire locations, finding that localized fires caused uneven heating of the steel columns, with more pronounced temperature gradients on the cross-section as the distance from the fire source decreased. Ragheb et al. [34], based on cross-sectional geometry and temperature gradients, proposed a new method to estimate the buckling load capacity of I-beams under fire conditions. Li Guoqiang et al. [35], considering the effects of fire temperature, load ratio, axial restraint stiffness ratio, slenderness ratio, and material strength, proposed a simplified method for calculating the residual load capacity of restrained steel columns after a fire. Although the performance of steel structures and steel components in fire has been extensively studied, research on transmission towers under fire conditions remains relatively scarce.
In recent years, frequent forest fires have posed significant threats not only to forests, lives, and property within affected areas but also to the safe operation of transmission lines traversing forested regions. Transmission lines are usually located outdoors and are subjected to wind loads year-round. When a fire occurs, transmission towers are exposed to the combined effects of fire and wind loads. Therefore, it is necessary to study the multi-hazard response of transmission tower-line systems under fire and wind loads. The paper investigates the impact of high temperatures on the bearing capacity of transmission tower-line systems under wind load and explores the effects of uneven horizontal spacing distribution and changes in the elevation of the target tower on the bearing capacity of the tower-line system. The failure criteria for transmission tower components at high temperatures were determined by considering the constitutive relationship of steel at ambient temperature and the variation patterns in material strength and elastic modulus with temperature. A finite element model of the transmission tower-line system was established using ABAQUS software. The paper studied the effects of temperature, uneven horizontal spacing distribution, and changes in the elevation of the target tower on the response of the transmission tower-line system by comparing collapse-resisting wind speeds and collapse processes under various conditions.

2. Failure Criteria for Components at High Temperatures

2.1. Reduction Factors for Yield Strength and Elastic Modulus

Currently, research on transmission tower-line systems rarely considers fire conditions, and investigations into their high-temperature response are scarce. Transmission tower components are typically constructed from equal-leg angle steel, and their constitutive relationship undergoes significant changes at elevated temperatures compared to ambient conditions. The distance between the transmission tower’s conductor (or ground wire) and the ground is generally large, making it less affected by temperature. This paper exclusively examines the response of the transmission tower-line system when a fire occurs around the target transmission tower. When a fire occurs, the temperature of the steel rises rapidly, and once it exceeds 400 °C, the steel’s yield strength and elastic modulus decrease sharply [36]. Steel exhibits excellent tensile and compressive properties at ambient temperature, but at high temperatures, its strength gradually decreases as the temperature rises, leading to insufficient structural load-bearing capacity and even instability or collapse. According to the “Technical Specification for Fire Protection of Steel Structures” (GB 51249-2017) [37], the reduction factors for yield strength and elastic modulus of steel at high temperatures are calculated using Equations (1) and (2), respectively.
η T = 1.0 20   ° C T s 300   ° C 1.24 × 10 8 T s 3 2.096 × 10 5 T s 2 + 9.228 × 10 3 T s 0.2168 300   ° C T s < 800   ° C 0.5 T s / 2000 800   ° C T s 1000   ° C
χ T = 7 T s 4780 6 T s 4760   20   ° C T s < 600   ° C 1000 T s 6 T s 2800   600   ° C T s 1000   ° C
In the formula, η T is the reduction factor for the yield strength of steel at high temperatures; χ T is the reduction factor for the elastic modulus of steel at high temperatures; T s is the environmental temperature. The variation of the reduction factors for the yield strength and elastic modulus of steel at high temperatures with temperature is illustrated in Figure 1. It can be observed that when the temperature is below 300 °C, the yield strength of steel remains unchanged with temperature, and the elastic modulus shows little variation. When the temperature reaches 800 °C, both η T and χ T approach 0.1.

2.2. Failure Criteria of Materials

Under high-temperature conditions, the mechanical properties of steel can change significantly, directly affecting the load-bearing capacity of components. In the case of transmission towers, the components are generally slender members, and the risk of buckling failure must be taken into account. Under high-temperature conditions, the risk of buckling increases for compression members, while tension members primarily need to consider strength issues. According to the “Code for Design of Steel Structures” (GB50017-2017) [38], the tensile yield strength and the compressive buckling stress of components at high temperatures are calculated using Equations (3) and (4), respectively.
f c T = f η T
f t T = f η T φ
In the formula, f c T is the tensile yield strength of the steel; f t T is the compressive buckling stress of the steel; f is the design strength of the steel; φ is the stability coefficient for axially loaded compression members; η T is the reduction factor for the yield strength of steel at high temperatures.
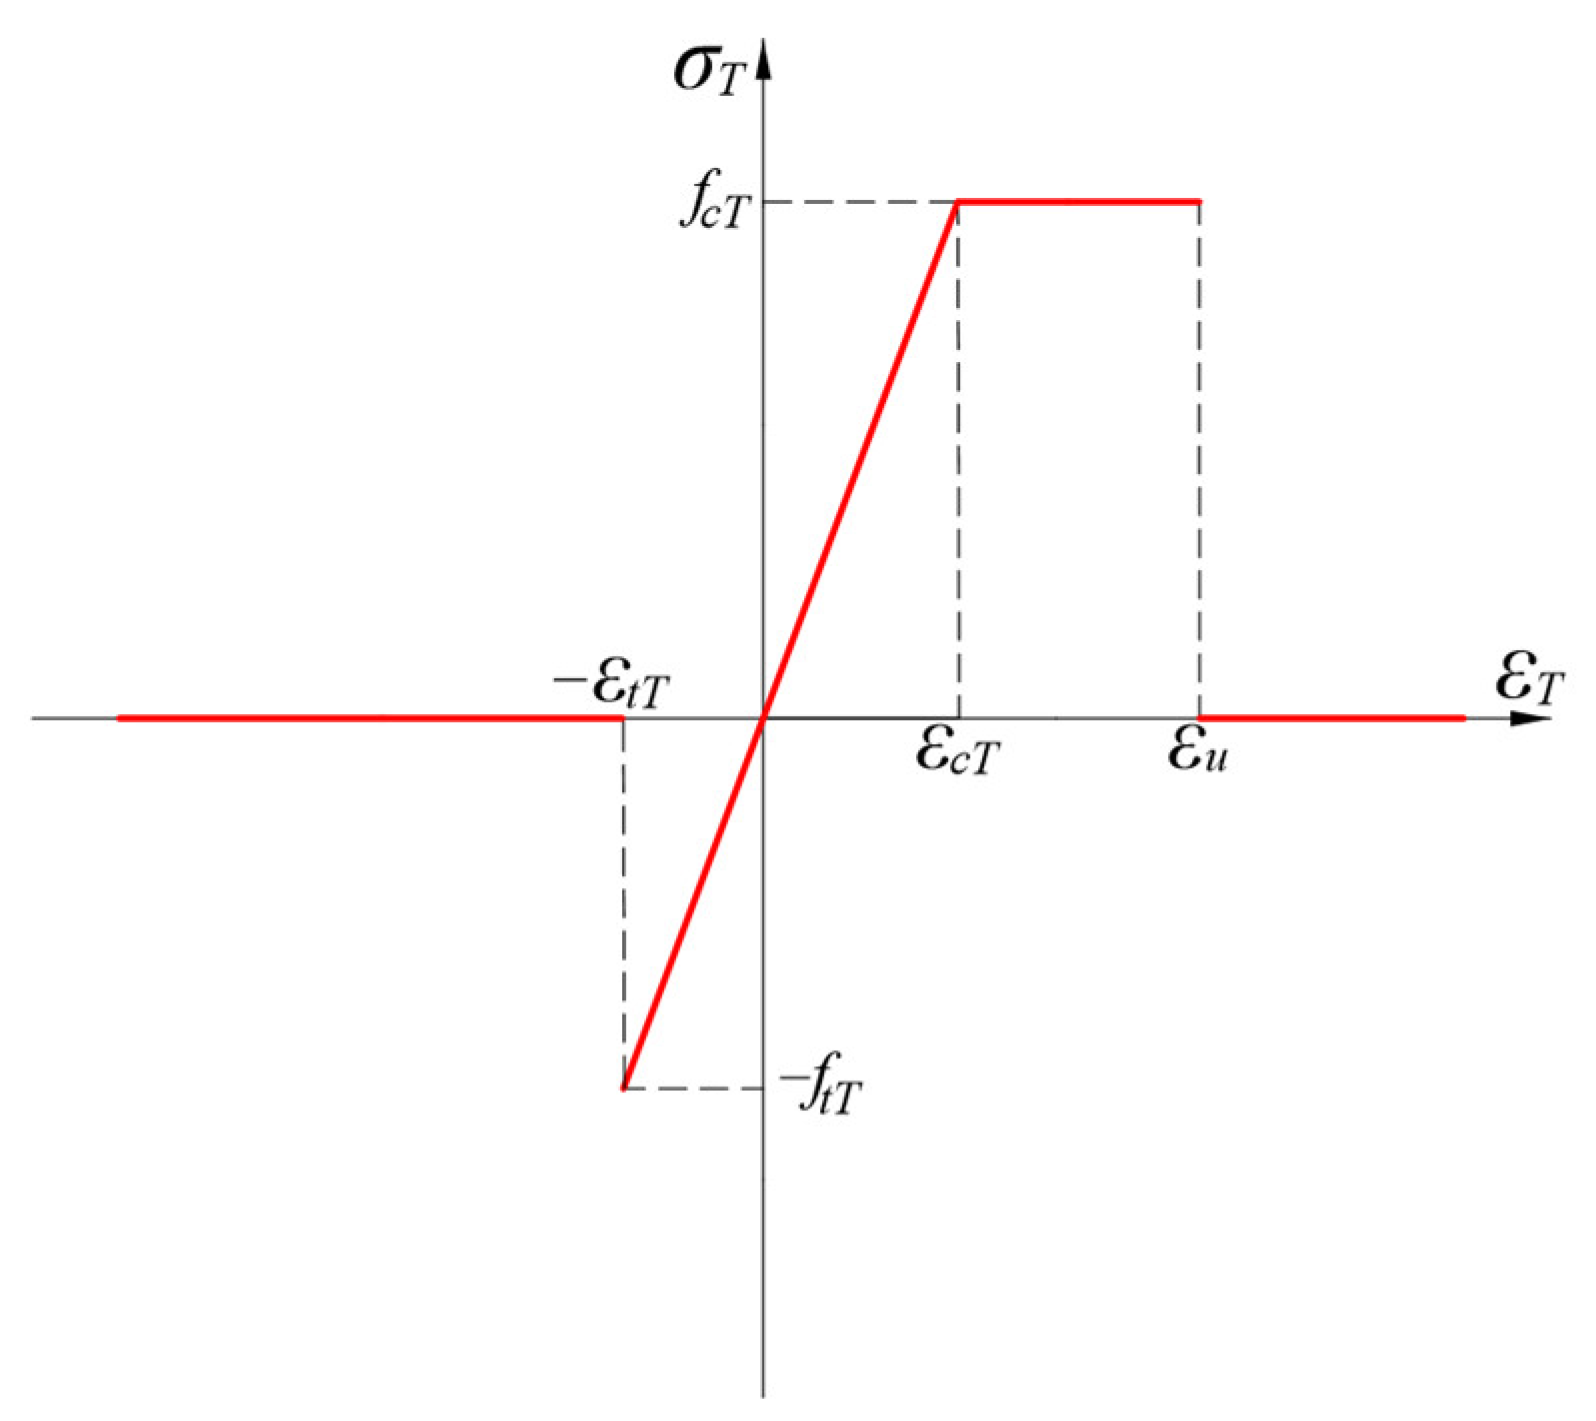
Steel is modeled using an ideal elastic–plastic constitutive model and its stress–strain relationship at high temperatures is shown in Figure 2. The stress–strain relationship and failure criteria are represented by Equation (5). At high temperatures, when the strain of a compression member reaches the compressive buckling strain, the member fails and loses its load-bearing capacity. For tension members, failure is considered to occur when the ultimate strain (0.02) is reached. This material failure criterion provides a basis for assessing the failure of components in subsequent finite element analyses.
Figure 2. The stress–strain curve of steel at high temperatures.
Applsci 15 00255 g002
σ T = E s T ε T     ε t T ε T ε c T f c T ε c T < ε T < ε u 0   ε T ε t T   o r   ε T ε u
ε c T = f c T E s T
ε t T = f t T E s T
E s T = E s χ T
In the formula, σ T is the stress of the steel at high temperatures; E s T is the elastic modulus of the steel at high temperatures; ε T is the strain of the steel at high temperatures; ε t T is the tensile yield strain of the steel at high temperatures; ε c T is the compressive buckling strain of the steel at high temperatures; f c T is the tensile yield strength of the steel at high temperatures; f t T is the compressive buckling stress of the steel at high temperatures; ε u is the ultimate strain for tension, taken as 0.02; E s is the elastic modulus of the steel at room temperature; χ T is the reduction factor for the elastic modulus of the steel at high temperatures.

3. Project Overview

3.1. Finite Element Model

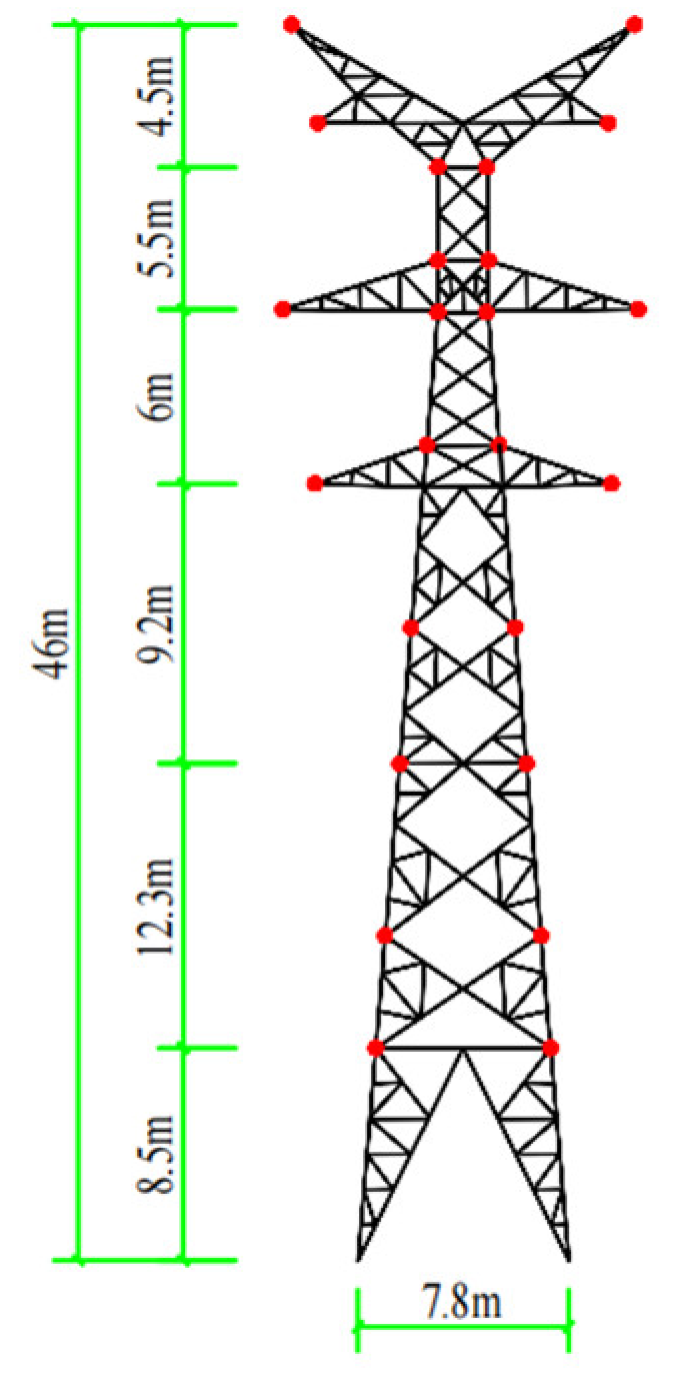
The model is based on a 220 kV transmission tower, which is a straight-line tower with a height of 30 m, a total height of 46 m, and a base width of 7.8 m. The main material of the transmission tower is Q345 equal-angle steel, while the diagonal members are made of Q235 equal-angle steel. The conductor model is 2 × LGJ-400/50 with an outer diameter of 27.63 mm, and the ground wire model is JLB-150 with an outer diameter of 15.7 mm. The basic wind speed is 27 m/s. The modeling process takes into account the effects of node plates and bolts. The dimensions of the transmission tower are shown in Figure 3. In the ABAQUS finite element software, the transmission tower is modeled using beam elements (B31) for the tower members, while truss elements (T3D2) are used for the ground wire and conductors, with each conductor (or ground wire) divided into 50 elements. The base of the transmission tower is constrained as a fixed end, and the ends of the conductors (and ground wire) are constrained as hinged. The transmission tower model is illustrated in Figure 4. The materials and relevant parameters for each component of the transmission tower are presented in Table 1. A damage evolution model is used within the material properties module. Once a component reaches its failure criteria, it is deactivated in the analysis and does not influence the remaining undamaged components.

3.2. Load Application

Transmission lines are usually located outdoors and are subjected to wind loads year-round. When a fire occurs, transmission towers are exposed to the combined effects of fire and wind loads. This paper investigates the transmission tower-line system under fire conditions while simultaneously considering the effects of wind loads. The pulsating wind is a key factor in structural vibration, and relevant design parameters are taken based on specifications. The pulsating wind pressure under wind load is represented by Equation (9):
P(hi,t) = I0(hi)B(hi)u(t)
where P(hi, t) is the fluctuating wind pressure value at height h i above ground at time t; I 0 ( h i ) represents the spatial correlation of fluctuating wind pressure, which is a random variable with a variance of 1; u ( t ) is the wind speed spectrum; B ( h i ) is the wind pressure intensity coefficient, which is expressed as in Equation (10):
B ( h i ) = A i μ s ( h i ) μ z ( h i ) ω 0 24 K r μ z ( h i )
In the formula, A i , μ s ( h i ) , μ z ( h i ) , ω 0 are the windward area of the structure at the height h i above the ground, the wind load shape coefficient, the wind pressure height change coefficient, and the basic wind pressure; K r is related to the roughness of the ground.
The power spectral density function of the Davenport wind speed spectrum is represented by Equation (11):
S u ( ω ) = 4 3 π a 2 ω ( 1 + a 2 ω 2 ) 4 3
In the formula, ω 0 ; a = 600 π V ¯ 10 .
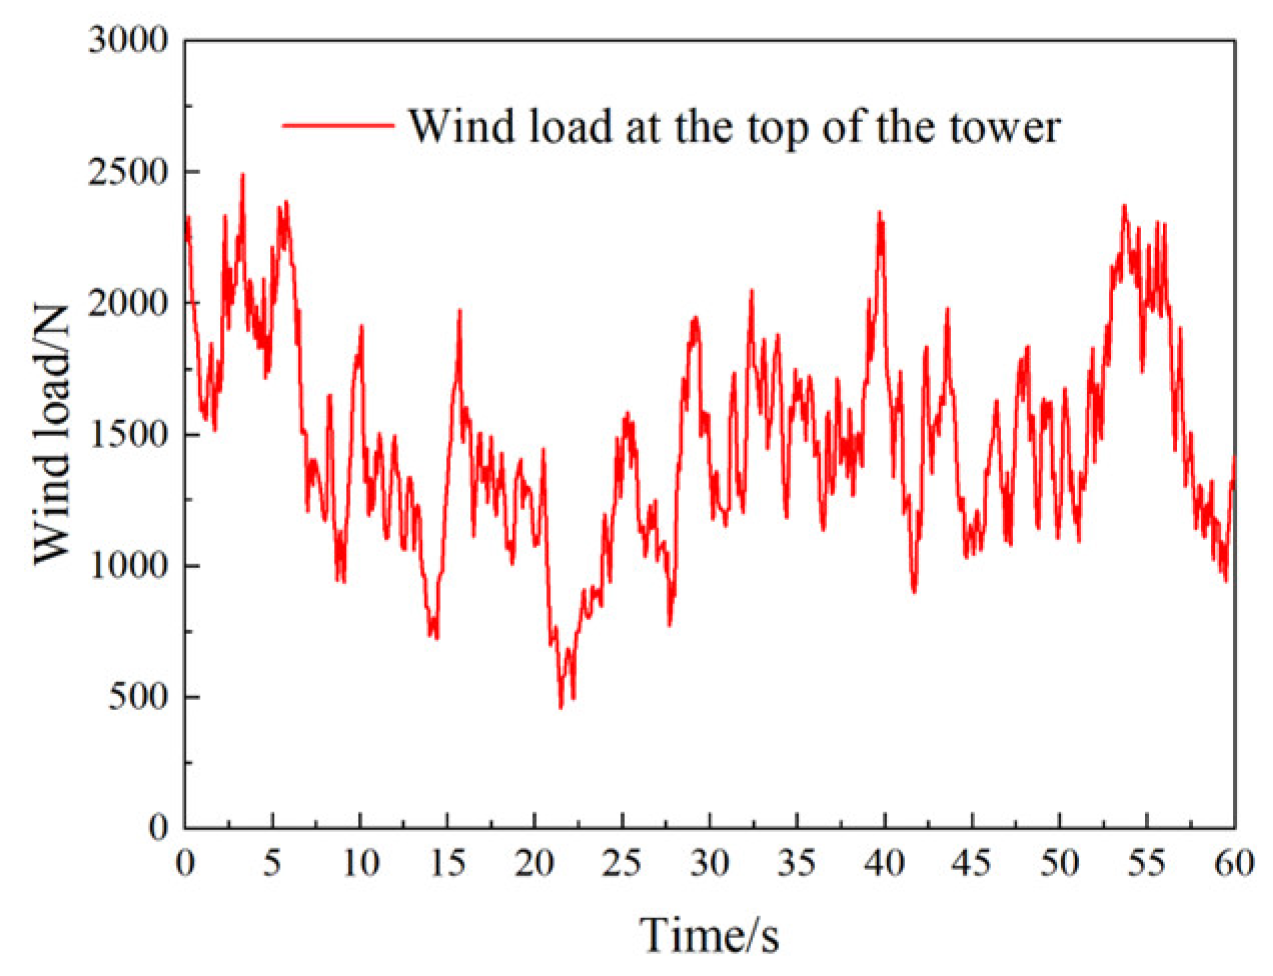
A MATLAB (2023) program was developed to calculate the Davenport gust wind speed spectrum. The program generates the required wind load dynamic time history, which is then input into ABAQUS to simulate the dynamic effect of wind load on the transmission tower. The wind load application points on the transmission tower structure are shown in Figure 3. Figure 5 presents the wind load time-history data at the top of the tower under a wind speed of 10 m/s. In addition to the wind load, gravity and an isothermal temperature field were also applied to the model.

4. Finite Element Simulation Results

4.1. Modal Analysis

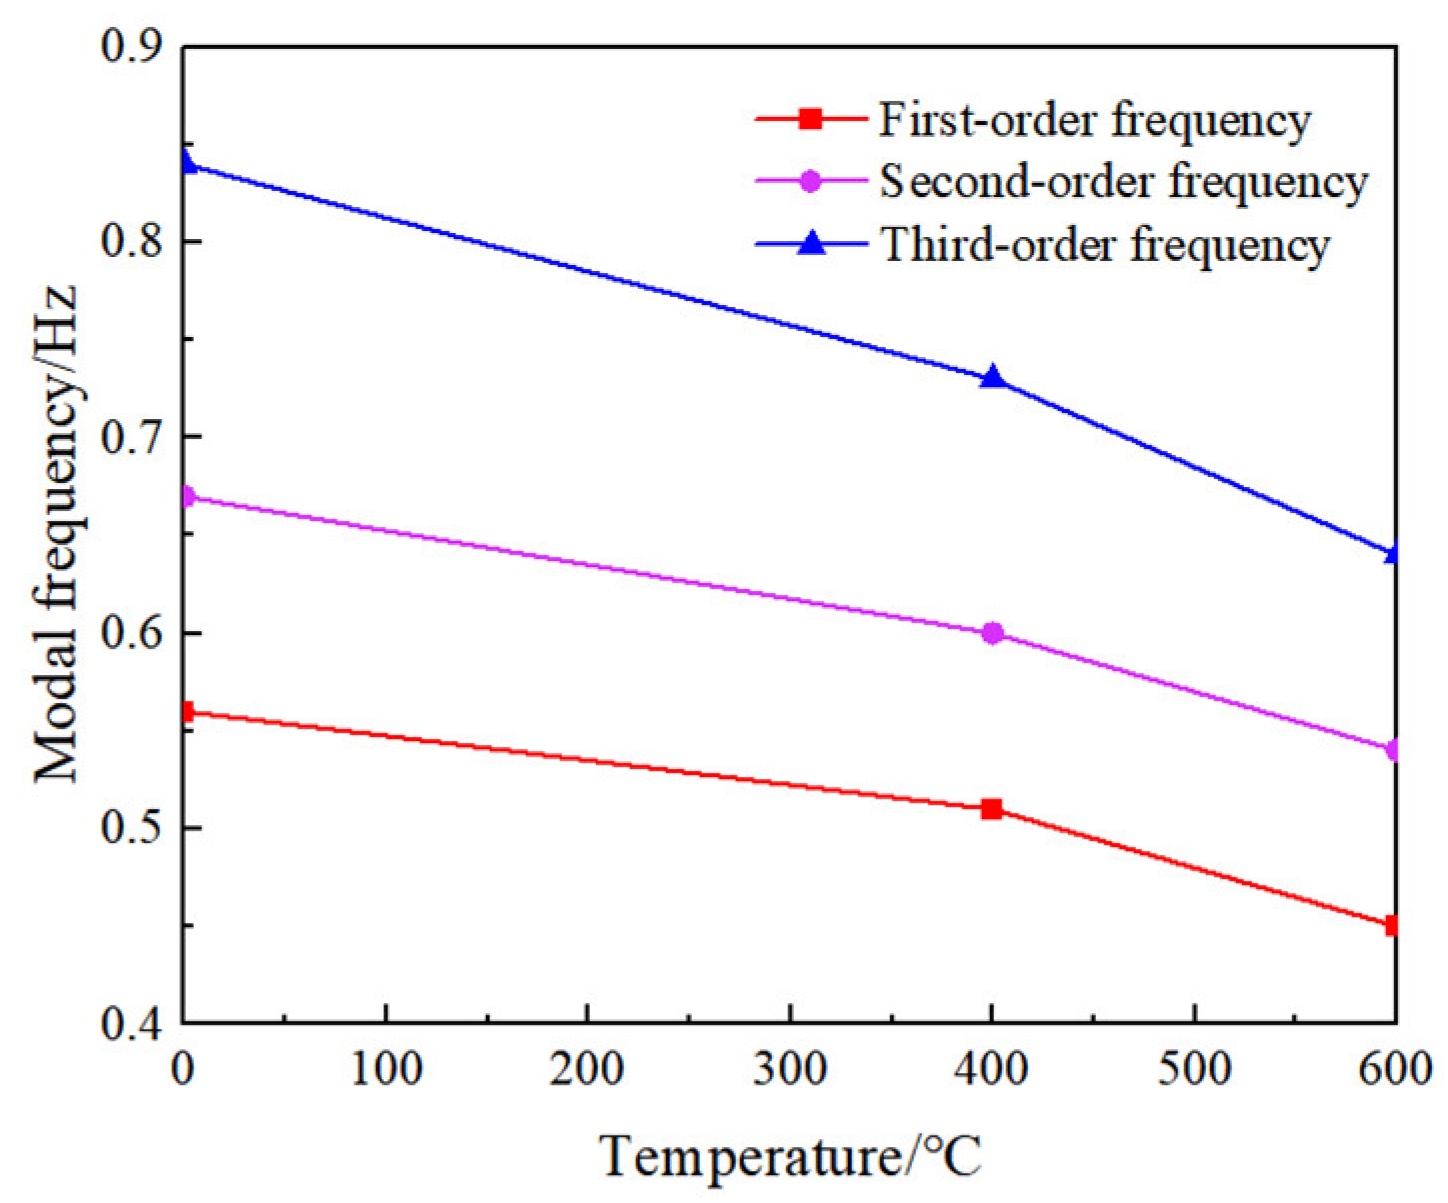
The elastic modulus of steel is temperature-dependent, and under the combined effects of fire and wind load, the dynamic characteristics of the transmission tower-line system change with increasing temperature. Using the subspace iteration method in ABAQUS, modal analysis was conducted on a three-tower, four-line model at temperatures of ambient temperature, 400 °C, and 600 °C. The calculation results are presented in Table 2 and Figure 6. The results indicate that as the temperature increases, the modal frequencies of the transmission tower-line system gradually decrease. Under the condition of ambient temperature, the first modal frequency of the transmission tower-line system is 0.56 Hz, with a period of 1.79 s. When the temperature rises to 600 °C, the first modal frequency decreases to 0.42 Hz, the period increases to 2.38 s, and the structural natural frequency decreases by 23.81%. The second and third modal frequencies of the transmission tower-line system also exhibit a similar trend. This is attributed to the reduction in the elastic modulus of steel with increasing temperature, which in turn decreases the overall stiffness of the transmission tower-line system. This trend reflects that under fire conditions, the overall stiffness of the transmission tower-line system diminishes, leading to an increase in the fundamental period.

4.2. Collapse Analysis of Transmission Tower-Line System at Ambient Temperature

The study selects eight key members of the middle tower as observed targets to analyze the collapse process of the transmission tower-line system under ambient temperature conditions. The positions of the observed members are shown in Figure 7. When the wind speed reaches 27 m/s, the transmission tower-line system collapses, and the collapse process is illustrated in Figure 8. The wind speed at the moment of collapse is defined as the collapse-resisting wind speed. At 3.30 s, observation member 1 fails first, losing its load-bearing capacity. Subsequently, between 3.30 s and 3.55 s, observed members 2, 3, and 4 fail in sequence. Observed members 5, 6, 7, and 8 remain intact. The failure of the central and lateral support members results in a significant decrease in tower rigidity, ultimately leading to overall collapse.

4.3. Collapse Analysis of Transmission Tower-Line System at High Temperature

Under the combined effects of fire and wind loads, the collapse process of the transmission tower-line system is influenced by temperature changes. The collapse process of the transmission tower-line system at different temperatures (400 °C and 600 °C) is analyzed and compared with the collapse process at ambient temperature. The collapse-resisting wind speeds of the transmission tower-line system under ambient temperature, 400 °C, and 600 °C conditions are 27 m/s, 26 m/s, and 12 m/s, respectively, as shown in Figure 9. It can be observed that with increasing temperature, the collapse-resisting wind speed of the observed members significantly decreases. This is because, at high temperatures, the yield strength of the steel gradually decreases with rising temperature, leading to a reduction in structural load-bearing capacity, which means the transmission tower-line system may fail at lower wind speeds.
The collapse process of the transmission tower-line system is shown in Table 3 and Figure 10 and Figure 11. The results indicate that an increase in temperature accelerates the collapse process of the transmission tower-line system, causing it to lose stability in a shorter time. Compared to ambient temperature, under the 400 °C condition, the instability of observed member 1 occurs earlier at 2.95 s, followed by the failure of observed members 2, 3, and 4 within the next 0.05 s. Observed members 5, 6, 7, and 8 remain intact. The tower loses its load-bearing capacity and collapses. Under the 600 °C condition, the instability process is further accelerated, with observed member 1 failing at 2.7 s, followed by the failure of observed members 2, 3, and 4 within the next 0.15 s. This ultimately leads to the complete collapse of the transmission tower.
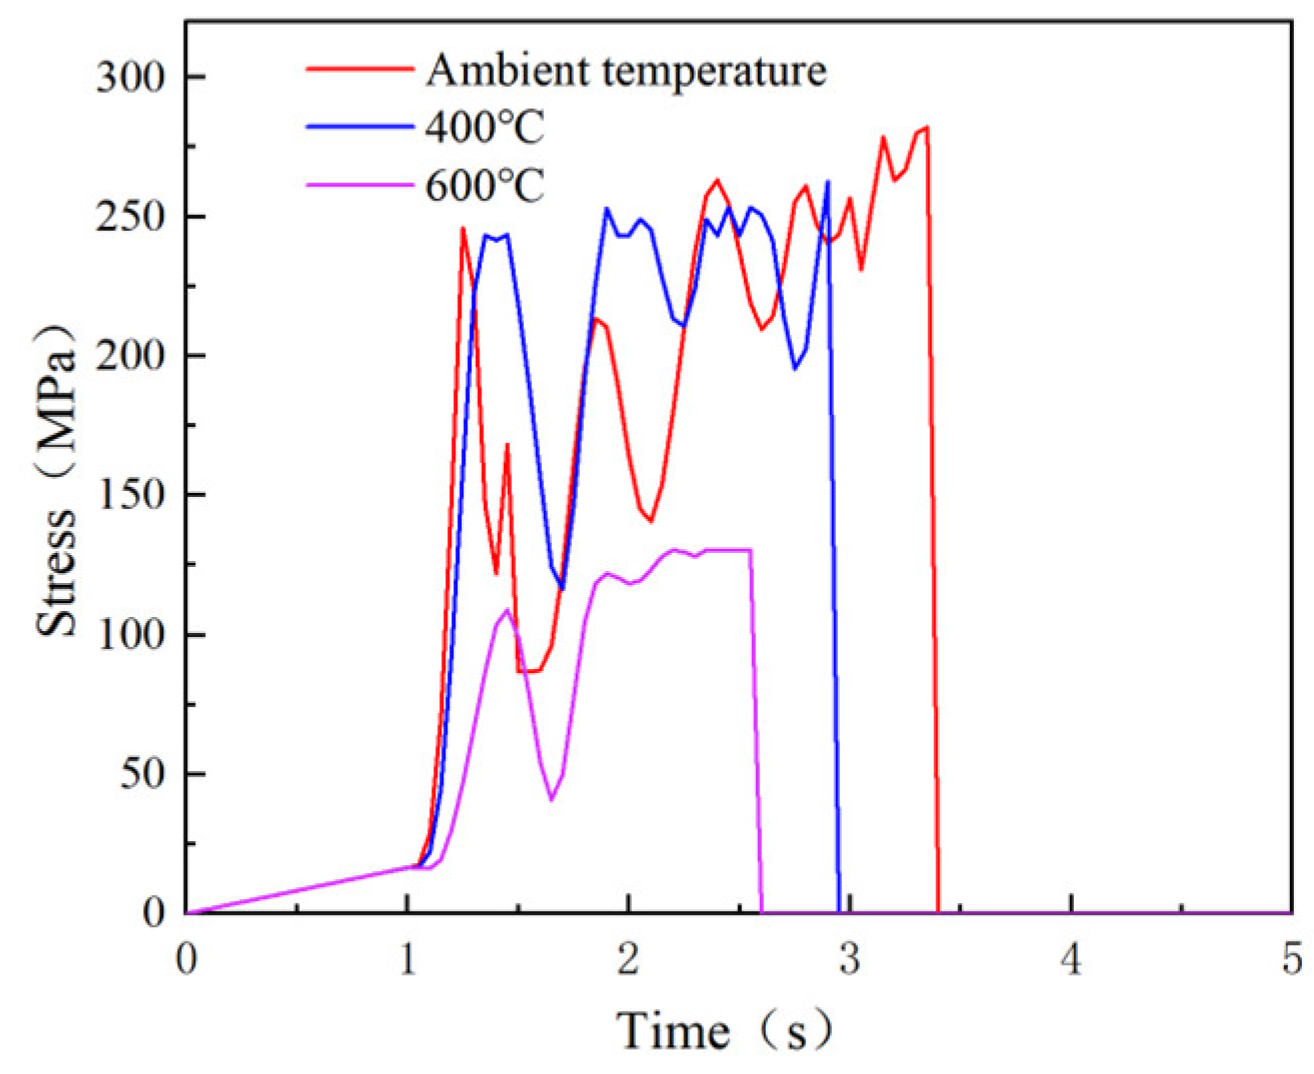
During the collapse process of the transmission tower-line system, observed member 1 is always the first component to fail. The failure of observed members 2, 3, and 4 occurs shortly afterward. Under high-temperature conditions, the load-bearing capacity of various parts of the tower rapidly decreases, leading to almost simultaneous failure after instability. Observed members 5, 6, 7, and 8 remain intact. Observation member 1 is defined as the most critical member, and its stress–time history is shown in Figure 12.

4.4. Study on the Influence of Horizontal Spacing

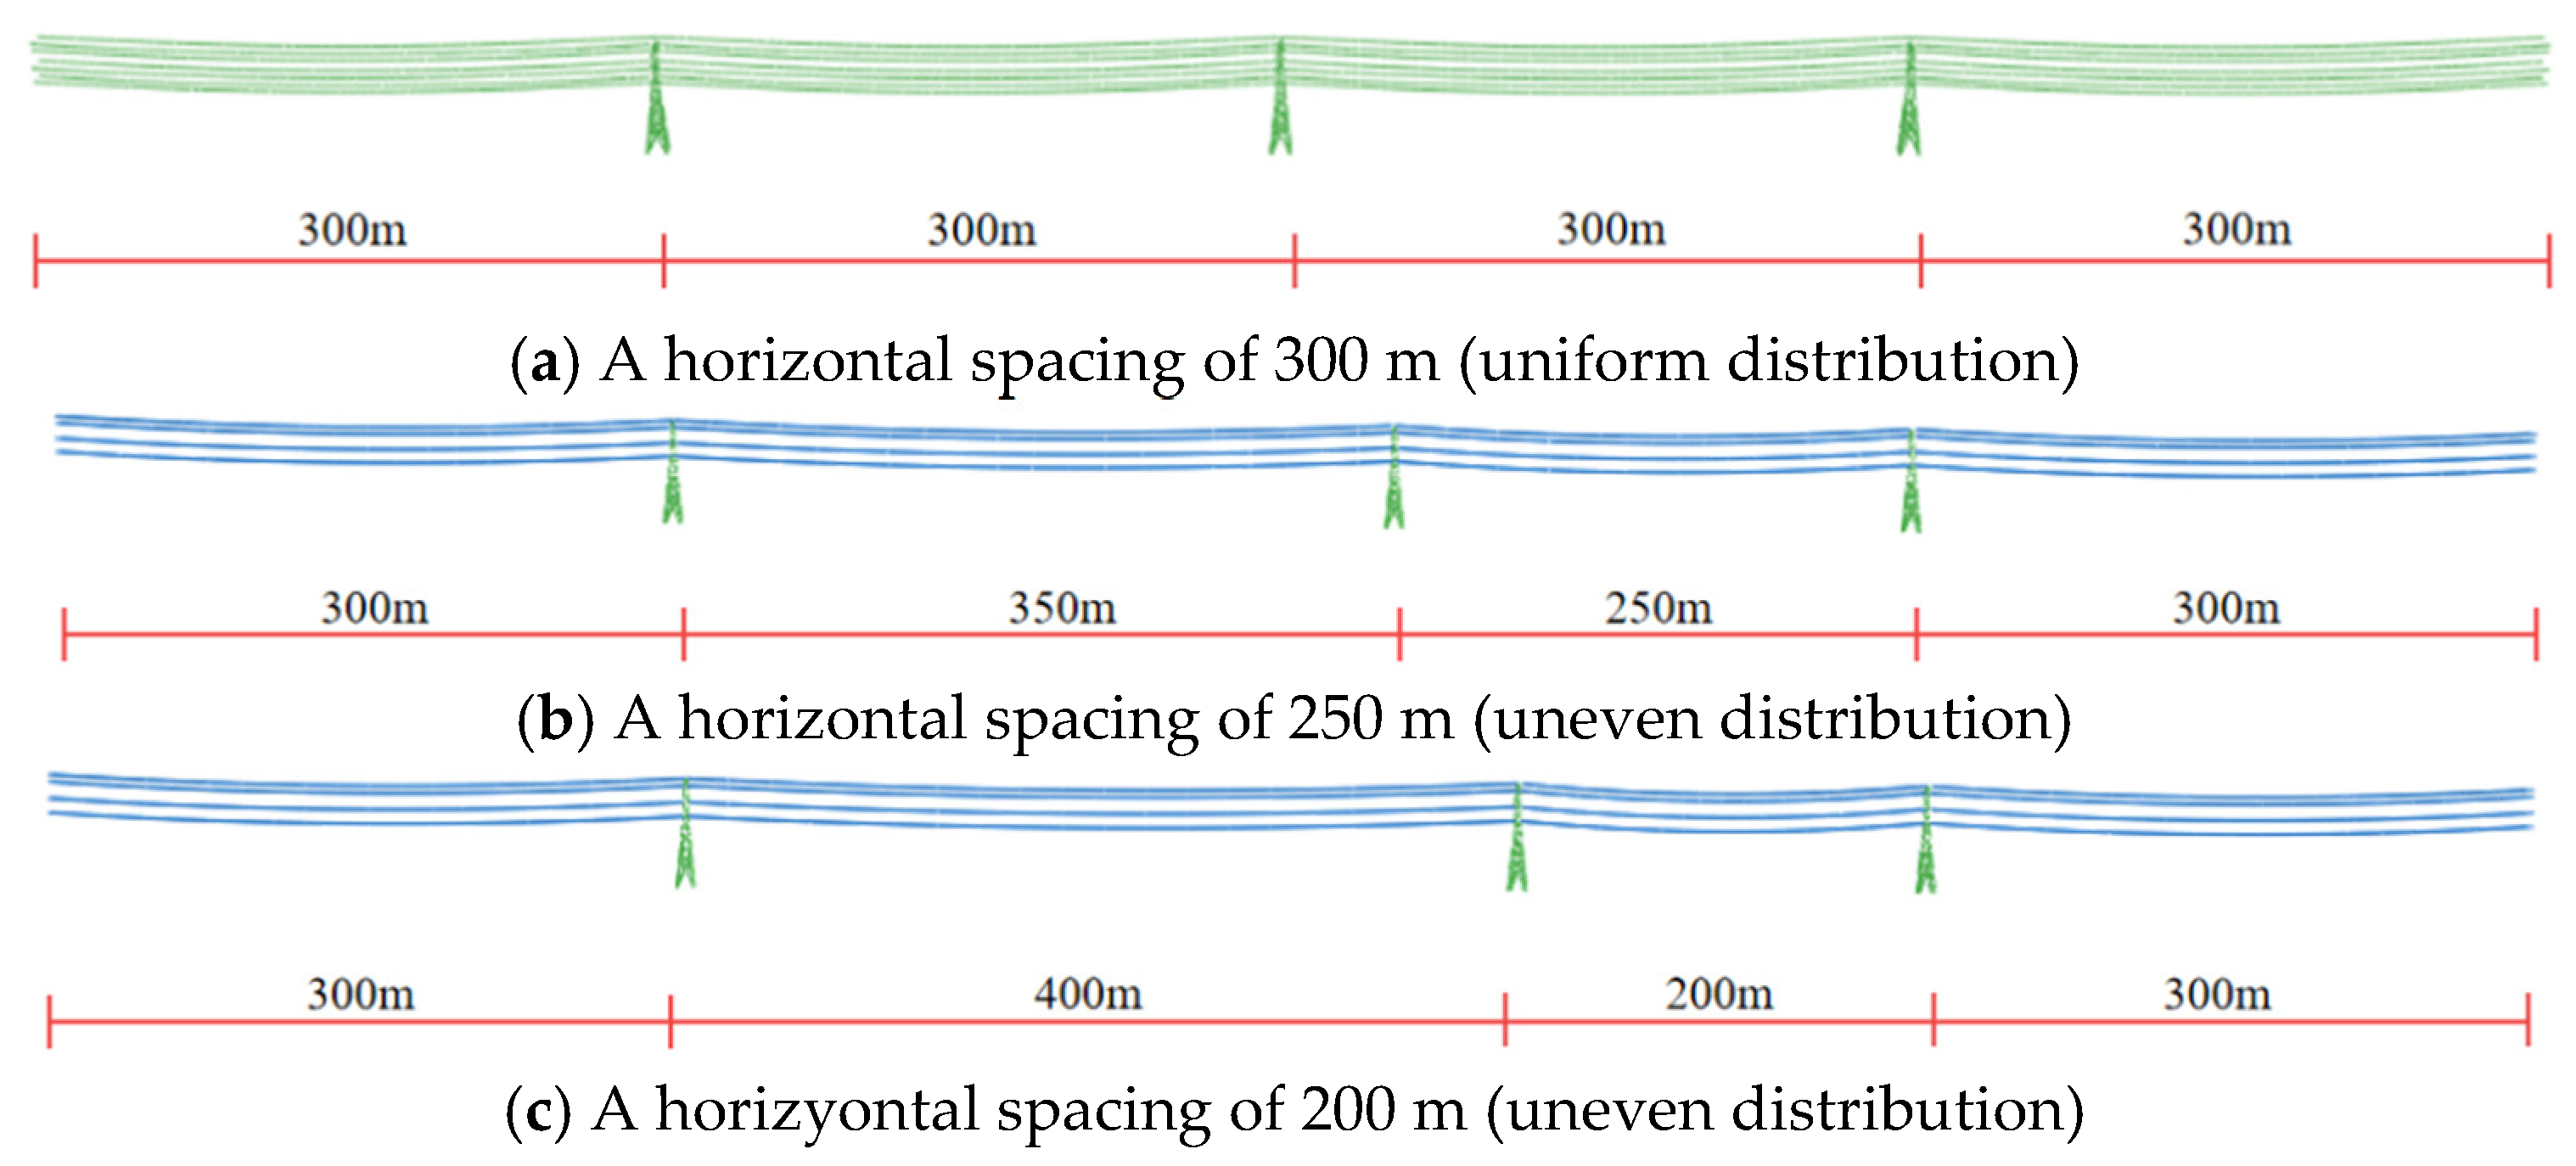
Under the combined effects of fire and wind loads, the uneven distribution of horizontal spacing between the crossarms affects the stability of the transmission tower-line system. To study the impact of uneven horizontal spacing distribution on the transmission tower, three tower-line models with horizontal spacings of 300 m (uniform distribution), 250 m (uneven distribution), and 200 m (uneven distribution) are established, as shown in Figure 13.
Under ambient temperature conditions, a comparison of the collapse-resisting wind speeds of the transmission tower-line system with horizontal spacings of 300 m (uniform distribution), 250 m (uneven distribution), and 200 m (uneven distribution) is conducted, as shown in Figure 14 and Table 4. From the figures and tables, it can be observed that the uneven distribution of horizontal spacing reduces the stability of the transmission tower-line system. The more uneven the distribution of the horizontal spacing, the lower the stability of the transmission tower-line system. As the temperature increases, the adverse effects of the uneven horizontal spacing distribution on the transmission tower become more significant. Compared to the 300 m (uniform distribution) condition, the collapse-resisting wind speed of the observed members at 250 m (uneven distribution) significantly decreases. This is because the uneven distribution of the spacing causes uneven loading on the tower, further exacerbating stress concentration within the structure and reducing the stability of the transmission tower-line system. Under the 200 m (uneven distribution) condition, the collapse-resisting wind speed of the observed members further decreases. This is because the more uneven the horizontal spacing distribution, the more uneven the load on the transmission tower, which further intensifies the stress concentration. Under the 250 m (uneven distribution) condition, compared to the 300 m (uniform distribution) condition, the collapse-resisting wind speed of the observed members at ambient temperature, 400 °C, and 600 °C decreases by 7.40%, 7.69%, and 16.67%, respectively. Under the 200 m (uneven distribution) condition, compared to the 300 m (uniform distribution) condition, the collapse-resisting wind speed of the observed members at ambient temperature, 400 °C, and 600 °C decreases by 11.11%, 15.38%, and 25.00%, respectively. This is because high temperatures not only reduce the yield strength of the steel but also exacerbate the stress concentration caused by the uneven horizontal spacing distribution.
The collapse processes of the transmission tower-line system with horizontal spacings of 300 m (uniform distribution), 250 m (uneven distribution), and 200 m (uneven distribution) are shown in Figure 8, Figure 15 and Figure 16, and Table 5. The results indicate that the uneven distribution of horizontal spacing accelerates the collapse process of the transmission tower-line system, causing it to lose stability in a shorter period. Moreover, the greater the degree of unevenness in the horizontal spacing, the more pronounced this trend of accelerated instability becomes. When the horizontal spacing is 300 m (uniform distribution), observed member 1 fails first at 3.30 s, losing its load-bearing capacity. Subsequently, between 3.30 s and 3.55 s, observed members 2, 3, and 4 fail in sequence. Observed members 5, 6, 7, and 8 remain intact. The failure of the central and lateral support members leads to a significant reduction in tower rigidity, ultimately causing overall collapse. When the horizontal spacing is 250 m (uneven distribution), the instability of observed member 1 occurs earlier at 3.10 s, and within the next 0.15 s, observed members 2, 3, and 4 fail in sequence. Observed members 5, 6, 7, and 8 remain intact. The tower loses its load-bearing capacity and collapses. When the horizontal spacing is 200 m (uneven distribution), the instability process accelerates further. Observed member 1 fails at 3.00 s, and within the next 0.10 s, observed members 2, 3, and 4 fail in sequence, ultimately causing the entire transmission tower to collapse. The stress–time histories of the most critical members of the transmission tower-line system with horizontal spacings of 300 m (uniform distribution), 250 m (uneven distribution), and 200 m (uneven distribution) under the combined effects of fire and wind loads are shown in Figure 17.

4.5. Study on the Influence of Elevation

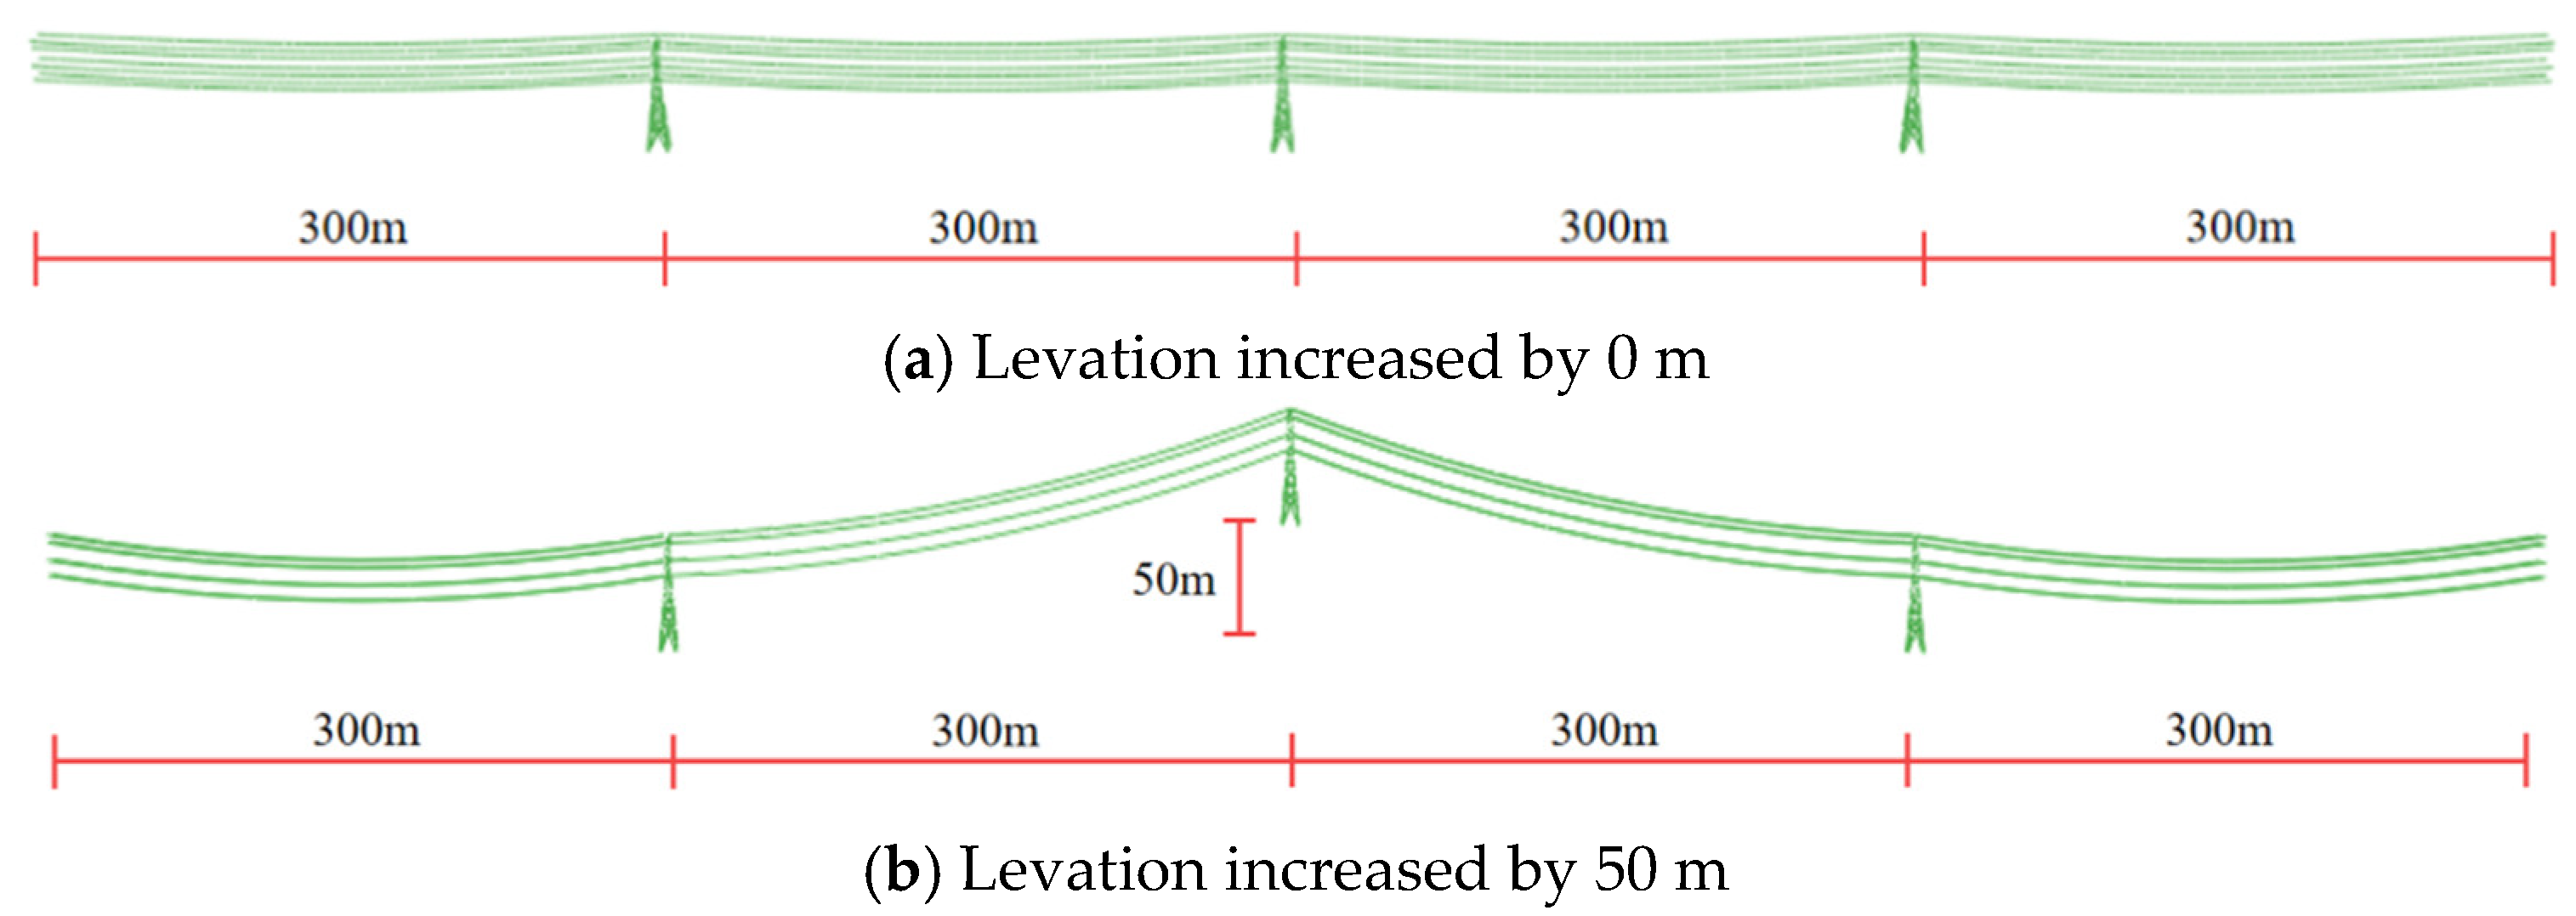
Under the combined effects of fire and wind loads, the elevation of the observation tower affects the stability of the transmission tower-line system. To investigate the impact of changes in the observation tower elevation on the transmission tower, three tower-line models are established with tower base heights of 0 m and 50 m, as shown in Figure 18.
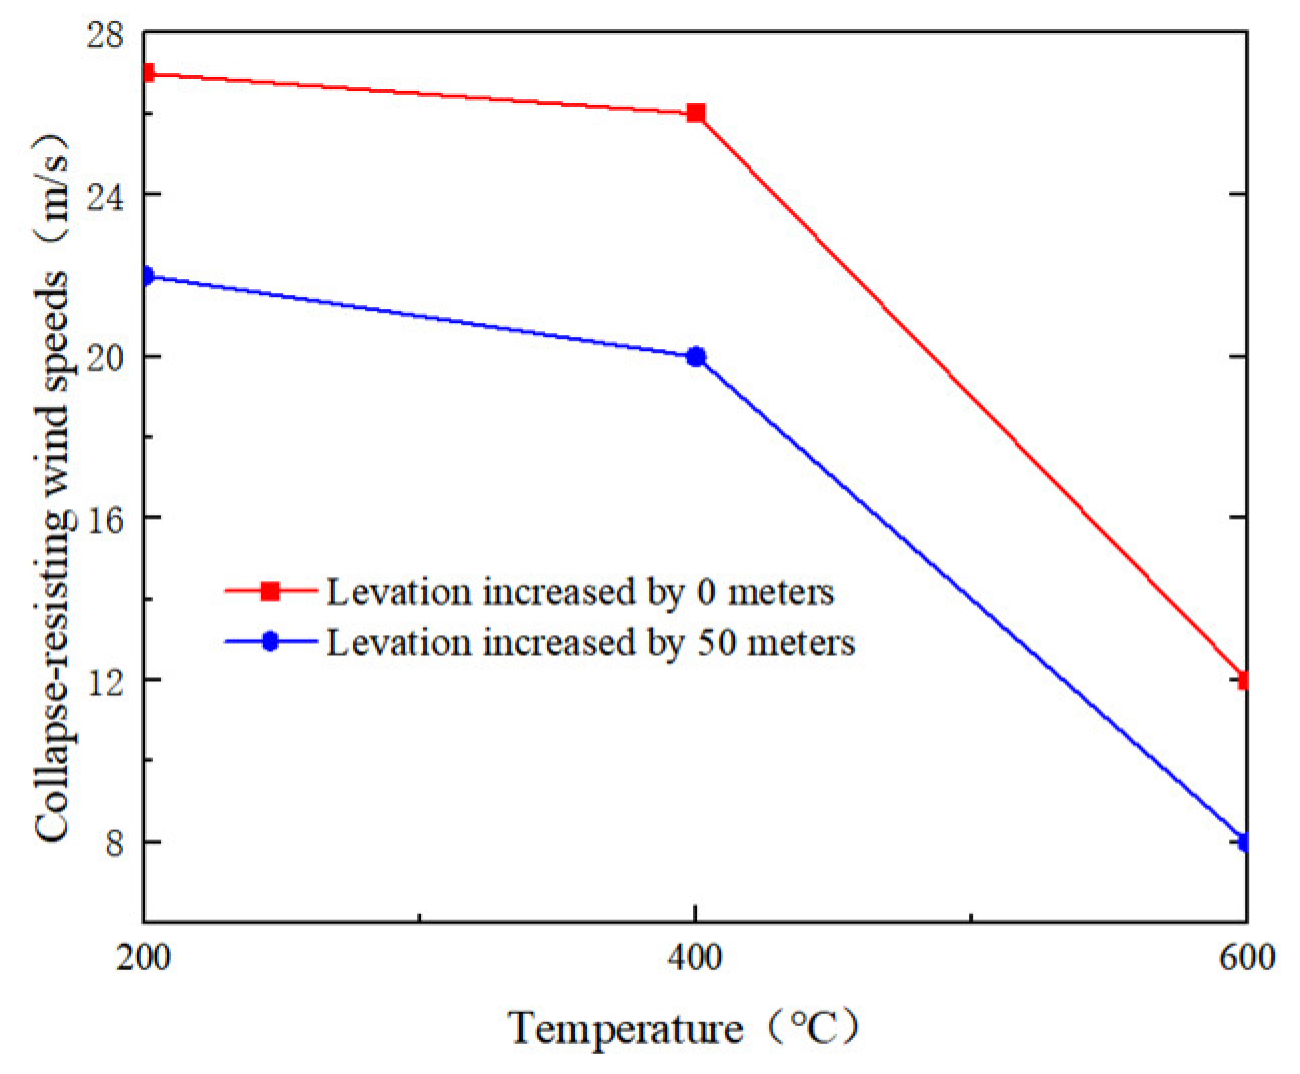
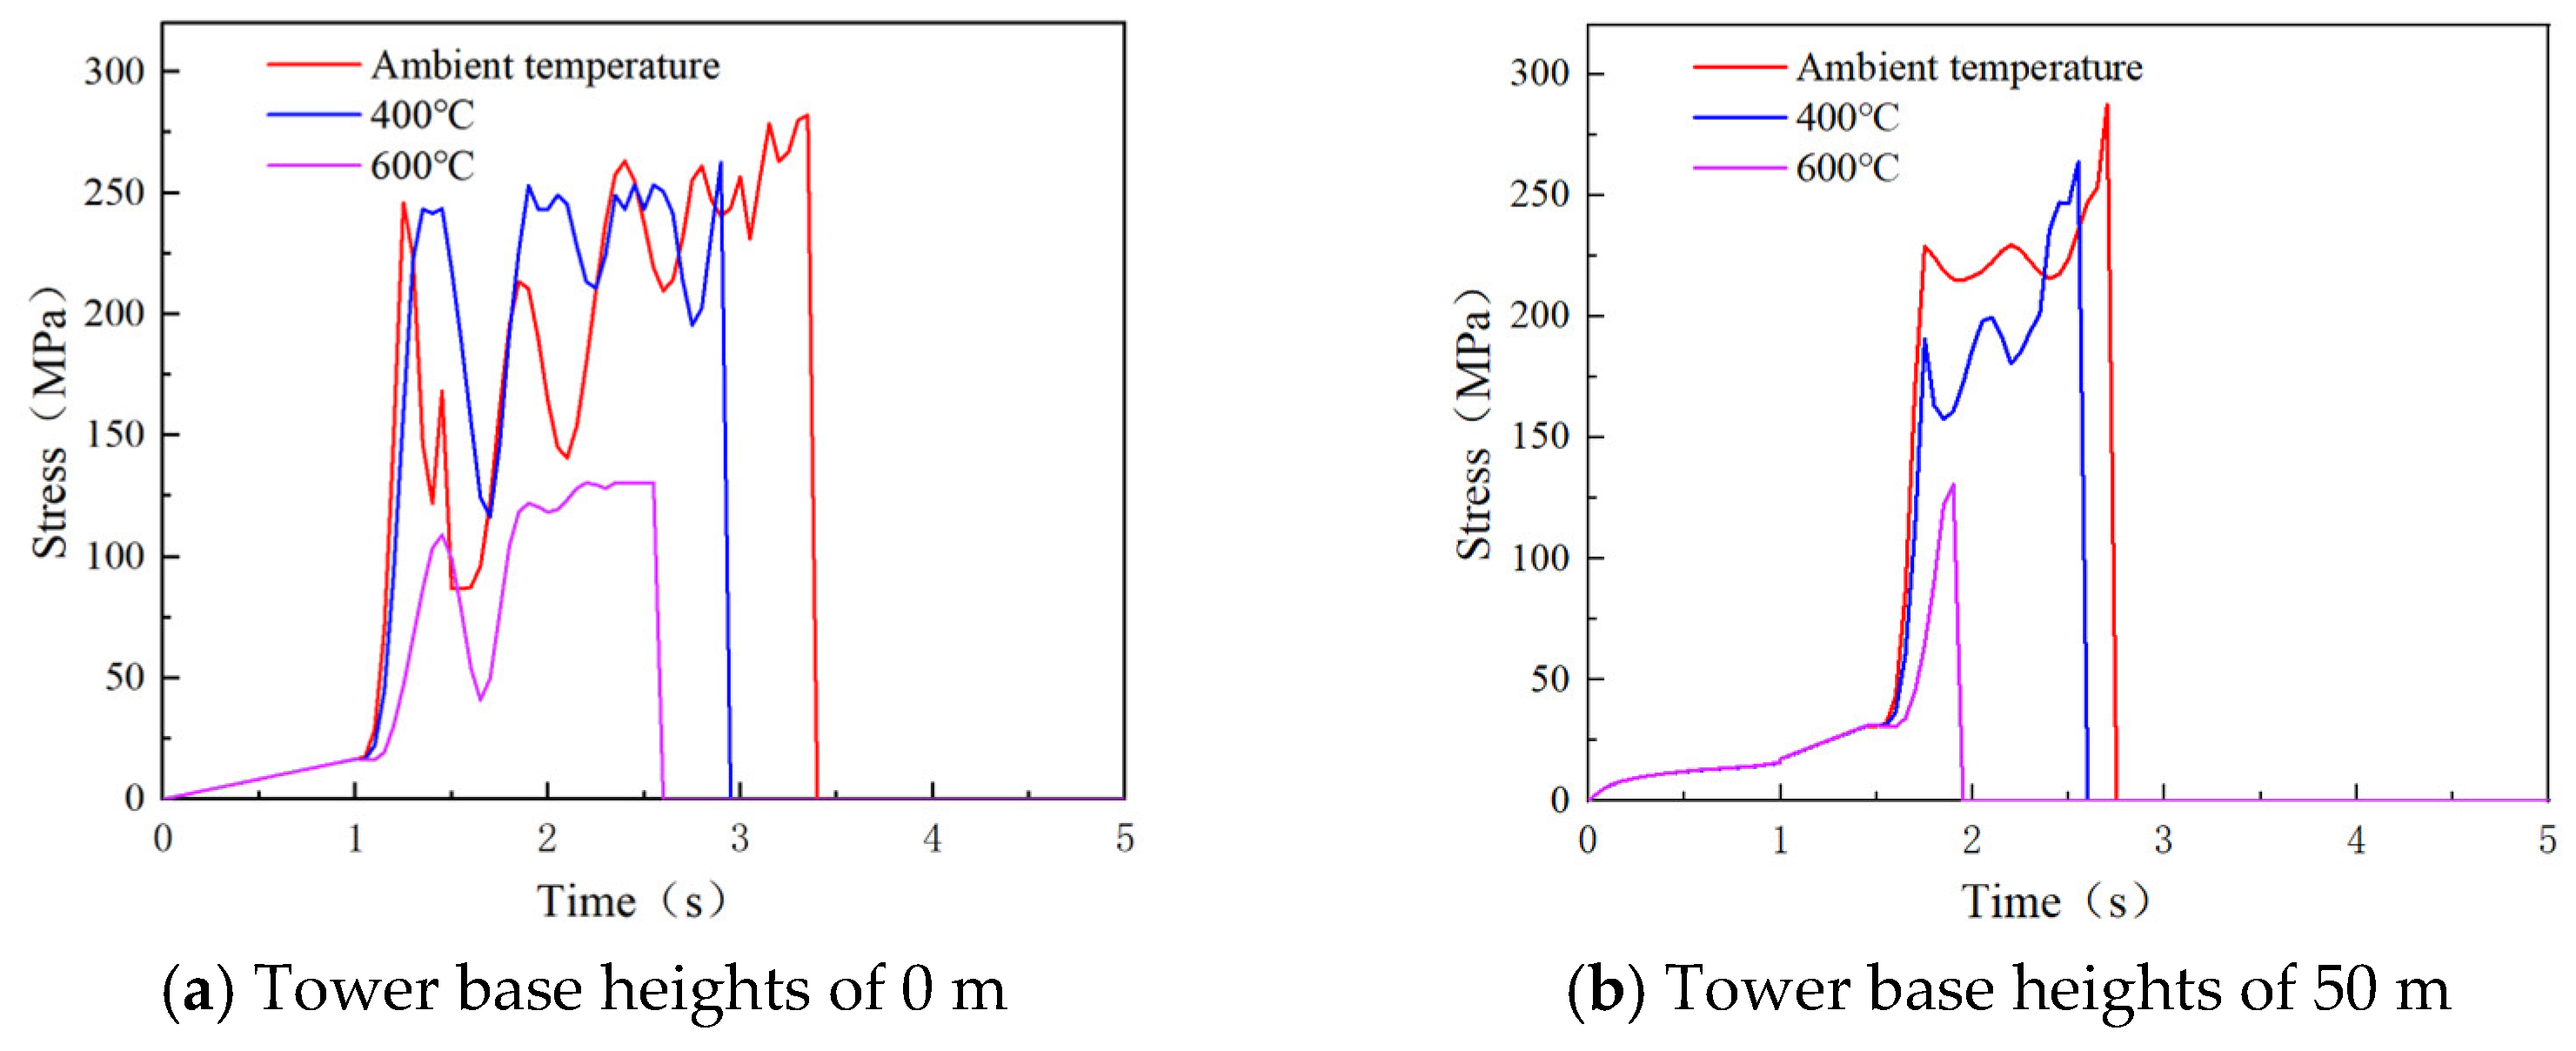
Under ambient temperature conditions, a comparison is made between the collapse-resisting wind speeds of the transmission tower-line systems with tower base heights of 0 m and 50 m, as shown in Figure 19 and Table 6. From the figures and tables, it can be observed that the increase in tower height reduces the stability of the transmission tower-line system. As the temperature increases, the detrimental effects of a higher observation tower elevation on the transmission tower become more pronounced. Compared to the condition with a tower base height of 0 m, the collapse-resisting wind speed of the observation members significantly decreases when the tower base height is 50 m. This is because as the observation tower height increases, the wind load on the transmission tower also increases, leading to higher stresses in the transmission tower-line system. Moreover, the increased observation tower height also increases the flexibility of the transmission tower-line system, making it more prone to lateral displacement under wind load. When the tower base height is 50 m, compared to the 0 m base height, the collapse-resisting wind speed of the observation members decreases by 18.52%, 23.08%, and 33.33% under ambient temperature, 400 °C, and 600 °C, respectively. This is because high temperatures not only reduce the yield strength of the steel but also make the response of the transmission tower-line system more significant under greater wind loads.
The collapse process of the transmission tower-line systems with tower base heights of 0 m and 50 m is shown in Figure 8 and Figure 20 and Table 7. The results indicate that an increase in observation tower elevation accelerates the collapse process of the transmission tower-line system, causing it to lose stability in a shorter time. When the tower base height is 0 m, observed member 1 fails first at 3.30 s, losing its load-bearing capacity. Subsequently, between 3.30 s and 3.55 s, observed members 2, 3, and 4 fail in sequence. Observed members 5, 6, 7, and 8 remain intact. The failure of the central and lateral support members leads to a significant decrease in tower rigidity, ultimately resulting in overall collapse. When the tower base height is 50 m, the failure time of observed member 1 is advanced to 2.75 s, and within the subsequent 0.10 s, observed members 2, 3, and 4 fail in sequence. Observed members 5, 6, 7, and 8 remain intact. The tower loses its load-bearing capacity and collapses. The stress–time history of the observation members in the transmission tower-line systems with tower base heights of 0 m and 50 m under fire–wind load conditions is shown in Figure 21.

5. Conclusions

The failure criteria for transmission tower components at high temperatures were determined by considering the constitutive relationship of steel at ambient temperature, the changes in material strength and elastic modulus with temperature, and the buckling failure characteristics of slender-angle steel components under compression. A finite element model of the transmission tower-line system was established using ABAQUS software to analyze its response under the combined effects of fire and wind loads. The paper studied the effects of temperature, uneven horizontal spacing distribution, and changes in the elevation of the target tower on the response of the transmission tower-line system by comparing collapse-resisting wind speeds and collapse processes under various conditions. The findings of the study are as follows:
(1)
The uneven horizontal spacing distribution reduces the stability of the transmission tower-line system. Compared to the condition with a horizontal spacing of 300 m (uniform distribution), the collapse-resisting wind speeds of the observed members are significantly reduced when the horizontal spacing is 250 m (uneven distribution). The more uneven the distribution of the horizontal spacing, the lower the stability of the transmission tower-line system. When the horizontal spacing is 200 m (uneven distribution), the collapse-resisting wind speeds of the observed members further decrease. During the design process, extreme uneven spacing distributions should be avoided to enhance the stability of the transmission tower.
(2)
The increase in the target tower height reduces the stability of the transmission tower-line system. Compared to the condition with a tower base height of 0 m, the collapse-resisting wind speeds of the observed members are significantly reduced when the tower base height is 50 m. During the design process, excessively high target towers should be avoided.
(3)
As the temperature increases, the adverse effects of uneven horizontal spacing distribution and increased target tower height on the transmission tower become more significant. With rising temperatures, the structural disaster resistance gradually weakens. It is recommended to choose steel materials with higher fire resistance or apply fire-resistant coatings to existing steel to enhance the bearing capacity of the transmission tower in high-temperature environments.
(4)
This paper investigates the disaster mechanism of transmission towers under the combined action of fire and wind loads, providing a reference for enhancing their disaster resistance and optimizing design schemes. Future research could further explore the impact of other disaster factors, such as ice and snow loads, seismic loads, etc., on transmission towers, offering insights for the design and safety assessment of transmission towers in complex environments.

Author Contributions

Methodology, L.Z.; Software, S.Z.; Writing—original draft, H.M.; Writing—review & editing, W.W.; Project administration, X.H. All authors have read and agreed to the published version of the manuscript.

Funding

This research was funded by National Natural Science Foundation of China grant number 51908340 and The APC was funded by Wenming Wang.

Institutional Review Board Statement

Not applicable.

Informed Consent Statement

Not applicable.

Data Availability Statement

The original contributions presented in this study are included in the article. Further inquiries can be directed to the corresponding author.

Conflicts of Interest

Authors Xiwei He and Lijuan Zhang were employed by the company Shandong Electric Power Engineering Consulting Institute Corporation Limited. The remaining authors declare that the research was conducted in the absence of any commercial or financial relationships that could be construed as a potential conflict of interest.

References

  1. Tian, L.; Yu, Q.; Ma, R.; Wang, C. The collapse analysis of a transmission tower under wind excitation. Open Civ. Eng. J. 2014, 8, 136–142. [Google Scholar] [CrossRef]
  2. Zhang, W.; Zhu, J.; Liu, H.; Niu, H. Probabilistic capacity assessment of lattice transmission towers under strong wind. Front. Built Environ. 2015, 1, 20. [Google Scholar] [CrossRef]
  3. Savory, E.; Parke, G.A.R.; Zeinoddini, M.; Toy, N.; Disney, P. Modelling of tornado and microburst-induced wind loading and failure of a lattice transmission tower. Eng. Struct. 2001, 23, 365–375. [Google Scholar] [CrossRef]
  4. Li, H.; Bai, H. Research status and development trends of disaster resistance for high-voltage transmission tower-line systems. J. Civ. Eng. 2007, 2, 39–46. [Google Scholar]
  5. Wang, W.; Wang, G.; Sheng, H.; Gao, Y.; Lv, X. Research on multi-hazard response of transmission tower-line systems under rare earthquake-wind combined actions. World Earthq. Eng. 2023, 39, 165–173. [Google Scholar]
  6. Deng, H.Z.; Xu, H.J.; Duan, C.Y.; Jin, X.H.; Wang, Z.H. Experimental and numerical study on the responses of a transmission tower to skew incident winds. J. Wind. Eng. Ind. Aerodyn. 2016, 157, 171–188. [Google Scholar] [CrossRef]
  7. Cai, Y.; Xie, Q.; Xue, S.; Hu, L.; Kareem, A. Fragility modelling framework for transmission line towers under winds. Eng. Struct. 2019, 191, 686–697. [Google Scholar] [CrossRef]
  8. Edgar, T.H.; Sordo, E. Structural behaviour of lattice transmission towers subjected to wind load. Struct. Infrastruct. Eng. 2017, 13, 1462–1475. [Google Scholar] [CrossRef]
  9. Yan, B.; Sheng, J.; Jiang, K.; Qi, S.; Zhao, B.C. Dynamic stability of cat head type transmission towers under icing and wind loads. Sci. Technol. Eng. 2021, 21, 11166–11175. [Google Scholar]
  10. Zhang, J.; Xie, Q. Failure analysis of transmission tower subjected to strong wind load. J. Constr. Steel Res. 2019, 160, 271–279. [Google Scholar] [CrossRef]
  11. Fu, X.; Li, H.N.; Tian, L.; Wang, J.; Cheng, H. Fragility analysis of transmission line subjected to wind loading. J. Perform. Constr. Facil. 2019, 33, 04019044. [Google Scholar] [CrossRef]
  12. Okamura, T.; Ohkuma, T.; Hongo, E.; Okada, H. Wind response analysis of a transmission tower in a mountainous area. J. Wind. Eng. Ind. Aerodyn. 2003, 91, 53–63. [Google Scholar] [CrossRef]
  13. Li, T.; Wang, Q.; Wu, D.; Su, J.; Cheng, Y.; Lou, W. Wind tunnel tests and wind vibration response analysis of 1000 kV transmission towers under typhoon wind field. J. Electr. Power Sci. Technol. 2021, 36, 76–82. [Google Scholar]
  14. Shehata, A.Y.; El Damatty, A.A. Behaviour of guyed transmission line structures under downburst wind loading. Wind. Struct. 2007, 10, 249–268. [Google Scholar] [CrossRef]
  15. Chen, B.; Wu, J.; Ouyang, Y.; Yang, D. Response evaluation and vibration control of a transmission tower-line system in mountain areas subjected to cable rupture. Struct. Monit. Maint. 2018, 5, 151–171. [Google Scholar]
  16. Guo, J.; Xiao, C.; Li, J. Wind tunnel tests and dynamic analysis of wind-induced response of a transmission tower on a hill. Adv. Struct. Eng. 2021, 24, 3594–3606. [Google Scholar] [CrossRef]
  17. Liang, B.; Xu, J. Numerical simulation of dynamic wind response of overhead transmission towers. J. Tongji Univ. Nat. Sci. 2002, 5, 583–587. [Google Scholar]
  18. Zhang, W.; Xiao, Y.; Li, C.; Zheng, Q.; Tang, Y. Wind load investigation of self-supported lattice transmission tower based on wind tunnel tests. Eng. Struct. 2022, 252, 113575. [Google Scholar] [CrossRef]
  19. Zhang, L.; Xie, Q.; Li, J. Wind-induced dynamic response analysis of multi-tower coupled system in transmission lines. J. Disaster Prev. Mitig. Eng. 2006, 3, 261–267. [Google Scholar]
  20. Zhao, G.; Xie, Q.; Liang, S.; Li, J. Wind-induced nonlinear vibration aeroelastic model wind tunnel test of high-voltage transmission tower-line system. J. Tongji Univ. Nat. Sci. 2009, 37, 1157–1164. [Google Scholar]
  21. Jeddi, A.B.; Azzi, Z.; Shafieezadeh, A.; Elawady, A.; Chowdhury, A.G.; Irwin, P. Revisit of underestimated wind drag coefficients and gust response factors of lattice transmission towers based on aeroelastic wind tunnel testing and multi-sensor data fusion. Eng. Struct. 2023, 278, 115486. [Google Scholar] [CrossRef]
  22. Wu, C.; Yang, X.; Zhang, B.; Liu, Z.; Zhao, Y. Dynamic response of a cat head type transmission tower-line system under strong wind. J. Phys. Conf. Ser. 2021, 1986, 012098. [Google Scholar] [CrossRef]
  23. Savory, E.; Parke, G.A.R.; Disney, P.; Toy, N. Wind-induced transmission tower foundation loads: A field study-design code comparison. J. Wind. Eng. Ind. Aerodyn. 2008, 96, 1103–1110. [Google Scholar] [CrossRef]
  24. Liu, T.; Zhong, M.; Xing, J. Industrial accidents: Challenges for China’s economic and social development. Saf. Sci. 2005, 43, 503–522. [Google Scholar] [CrossRef]
  25. Lou, G.; Wang, C.; Jiang, J.; Jiang, Y.; Wang, L.; Li, G.Q. Experimental and numerical study on thermal-structural behavior of steel portal frames in real fires. Fire Saf. J. 2018, 98, 48–62. [Google Scholar] [CrossRef]
  26. Ren, W. Experimental and Theoretical Study on Catenary Mechanism of Steel Frame Beam Subject to Fire. Fire Technol. 2023, 59, 3493–3523. [Google Scholar] [CrossRef]
  27. Liu, H.; Chen, H.; Wang, L.; Li, Z.; Chen, Z. Fire resistance performance test study of full-scale steel frame structure under real fire. J. Build. Struct. 2024, 45, 14–24. [Google Scholar]
  28. Ruan, S.; Zhao, J.; Song, Z.; Duan, L. Fire resistance performance test study of steel frame structures under spreading fire. J. Build. Struct. 2022, 43, 103–114. [Google Scholar]
  29. Wang, W.; Zhou, H.; Zhou, Y.; Xu, L. A simplified approach for fire resistance design of high strength Q460 steel beams subjected to non-uniform temperature distribution. Fire Technol. 2018, 54, 437–460. [Google Scholar] [CrossRef]
  30. Yang, J.; Wang, W.; Shi, Y.; Xu, L. Experimental study on fire resistance of cold-formed steel built-up box columns. Thin Walled Struct. 2020, 147, 106564. [Google Scholar] [CrossRef]
  31. Wang, W.; Yan, S.; Zhang, L.; Wang, B. High-temperature creep tests of Q345 steel and study on fire resistance of steel columns considering creep effects. J. Build. Struct. 2016, 37, 47–54. [Google Scholar]
  32. Xue, X.; Wang, F.; Shi, Y.; Wang, W. Study on ultra-low cycle fatigue performance of Q690 high-strength steel after fire. J. Build. Struct. 2023, 44, 119–128. [Google Scholar]
  33. Ferraz, G.; Santiago, A.; Rodrigues, J.P.; Barata, P. Thermal analysis of hollow steel columns exposed to localised fires. Fire Technol. 2016, 52, 663–681. [Google Scholar] [CrossRef]
  34. Ragheb, W.F. Local buckling capacity of steel I-section beams subjected to uniform or linear temperature gradient. Thin Walled Struct. 2017, 119, 304–314. [Google Scholar] [CrossRef]
  35. Li, G.; Miao, J.; Song, L. Study on the influence parameters of residual axial compressive capacity of constrained high-strength steel columns after fire. J. Build. Struct. 2020, 41, 87–94. [Google Scholar]
  36. Li, X. Prediction Model of Yield Critical Temperature for Steel Components Under Sudden Temperature Changes. Ph.D. Thesis, Xinjiang University, Ürümqi, China, 2022. [Google Scholar]
  37. GB 51249-2017; Technical Specification for Fire Protection of Building Steel Structures. Ministry of Housing and Urban-Rural Development: Beijing, China, 2017.
  38. GB 50017-2017; Design Code for Steel Structures. China Planning Press: Beijing, China, 2017.
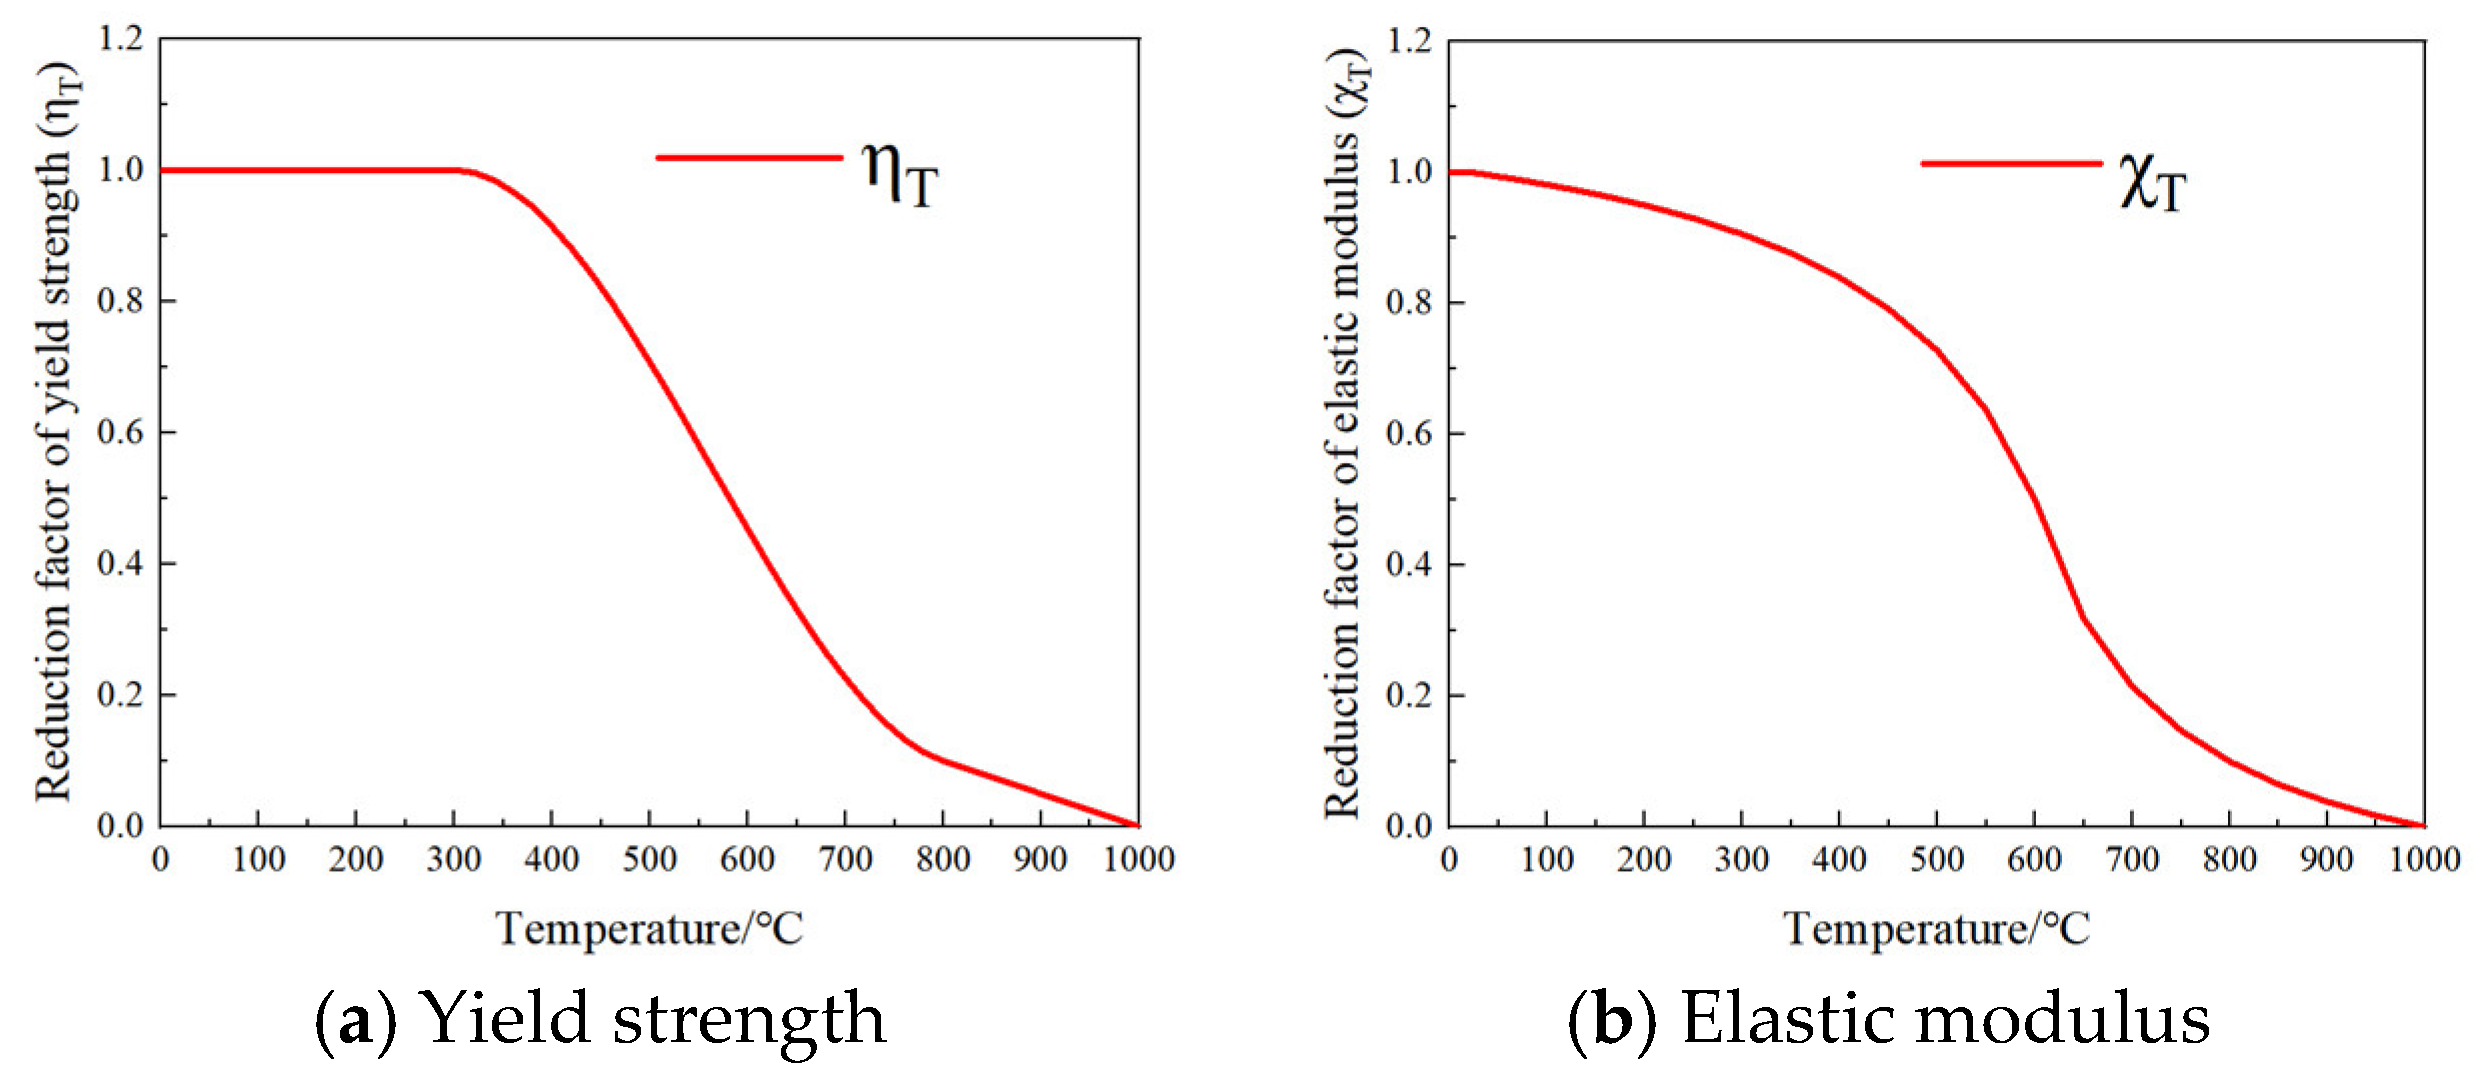
Figure 1. Reduction factor at high temperatures.
Applsci 15 00255 g001
Figure 3. Dimensions of the transmission tower.
Applsci 15 00255 g003
Figure 4. Model of the transmission tower.
Applsci 15 00255 g004
Figure 5. Time-history curve of wind load.
Applsci 15 00255 g005
Figure 6. Natural vibration characteristics of transmission tower-line systems.
Applsci 15 00255 g006
Figure 7. The position of the observed members.
Applsci 15 00255 g007
Figure 8. The collapse process of transmission towers under ambient temperature conditions (stress in Pa).
Applsci 15 00255 g008
Figure 9. Collapse-resisting wind speed under different temperature conditions.
Applsci 15 00255 g009
Figure 10. Collapse process of the transmission tower under 400 °C conditions. (stress in Pa).
Applsci 15 00255 g010
Figure 11. Collapse process of the transmission tower under 600 °C conditions. (stress in Pa).
Applsci 15 00255 g011
Figure 12. Time-history diagram of stress under different temperature conditions.
Applsci 15 00255 g012
Figure 13. Three-tower four-line model.
Applsci 15 00255 g013
Figure 14. Collapse-resisting wind speed under different horizontal spacing conditions.
Applsci 15 00255 g014
Figure 15. Collapse process of the transmission tower with a horizontal spacing of 250 m (uneven distribution) (stress in Pa).
Applsci 15 00255 g015
Figure 16. Collapse process of the transmission tower with a horizontal spacing of 200 m (uneven distribution) (stress in Pa).
Applsci 15 00255 g016
Figure 17. Time-history diagram of stress under different horizontal spacing conditions.
Applsci 15 00255 g017
Figure 18. Three-tower four-line model.
Applsci 15 00255 g018
Figure 19. Collapse-resisting wind speed under different target tower elevation conditions.
Applsci 15 00255 g019
Figure 20. Collapse process of the transmission tower with a tower base height of 50 m (stress in Pa).
Applsci 15 00255 g020
Figure 21. Time-history diagram of stress under different target tower elevation conditions.
Applsci 15 00255 g021
Table 1. Materials and parameters.
PartMaterialParameterNumerical Value
Inclined memberQ235Density/kg·m−37850
Elastic modulus/GPa200
Yield stress/MPa235
Coefficient of linear expansion/℃1.17 × 10−5
Main memberQ345Density/kg·m−37850
Elastic modulus/GPa200
Yield stress/MPa345
Coefficient of linear expansion/℃1.20 × 10−5
Conductor2 × LGJ-400/50Density/kg·m−33333
Elastic modulus/GPa69
Yield stress/MPa700
Ground wireJLB-150Density/kg·m−36593
Elastic modulus/GPa147
Yield stress/MPa830
Table 2. Natural vibration characteristics of transmission tower-line systems.
Modal OrderAmbient Temperature400 °C600 °C
Frequency/HzPeriod/sFrequency/HzPeriod/sFrequency/HzPeriod/s
First Order0.561.790.511.960.422.38
Second Order0.671.490.621.610.531.89
Third Order0.841.190.791.270.711.41
Table 3. Failure times of members under different temperature conditions.
Observed Members/TemperatureAmbient Temperature400 °C600 °C
Observed members 13.30 s2.95 s2.60 s
Observed members 2, 3, 43.55 s3.00 s2.75 s
Observed members 5, 6, 7, 8IntactIntactIntact
Table 4. Collapse-resisting wind speed under different horizontal spacing conditions.
Horizontal Spacing/TemperatureAmbient Temperature400 °C600 °C
300 m (uniform distribution))27 m/s26 m/s12 m/s
250 m (non-uniform distribution)25 m/s24 m/s10 m/s
200 m (non-uniform distribution)24 m/s22 m/s9 m/s
Table 5. Failure time of members under different horizontal spacing conditions.
Observed Members/Horizontal Spacing300 m (Uniform Distribution)250 m (Uneven Distribution)200 m (Uneven Distribution)
Observed members 13.30 s3.10 s3.00 s
Observed members 2, 3, 43.55 s3.25 s3.10 s
Observed members 5, 6, 7, 8IntactIntactIntact
Table 6. Collapse-resisting wind speed under different target tower elevation conditions.
Tower Base Height
/Temperature
Ambient Temperature400 °C600 °C
0 m27 m/s26 m/s12 m/s
50 m22 m/s20 m/s8 m/s
Table 7. Failure time of members under different target tower elevation conditions.
Observed Members/Tower Base Height0 m50 m
Observed members 13.30 s2.75 s
Observed members 2, 3, 43.55 s2.85 s
Observed members 5, 6, 7, 8IntactIntact
Disclaimer/Publisher’s Note: The statements, opinions and data contained in all publications are solely those of the individual author(s) and contributor(s) and not of MDPI and/or the editor(s). MDPI and/or the editor(s) disclaim responsibility for any injury to people or property resulting from any ideas, methods, instructions or products referred to in the content.