Article

Deformation and Instability Mechanisms of a Shaft and Roadway Under the Influence of Rock Mass Subsidence

1
School of Civil Engineering, University of New South Wales, Sydney, NSW 2052, Australia
2
Engineering Research Center of Underground Mine Engineering, Ministry of Education, Anhui University of Science and Technology, Huainan 232001, China
*
Author to whom correspondence should be addressed.
Appl. Sci. 2025, 15(1), 163; https://doi.org/10.3390/app15010163
Submission received: 12 November 2024 / Revised: 18 December 2024 / Accepted: 20 December 2024 / Published: 27 December 2024

Abstract

:
Investigating deformation and failure mechanisms in shafts and roadways due to rock subsidence is crucial for preventing structural failures in underground construction. This study employs FLAC3D software (vision 5.00) to develop a mechanical coupling model representing the geological and structural configuration of a stratum–shaft–roadway system. The model sets maximum subsidence displacements (MSDs) of the horsehead roadway’s roof at 0.5 m, 1.0 m, and 1.5 m to simulate secondary soil consolidation from hydrophobic water at the shaft’s base. By analyzing Mises stress and plastic zone distributions, this study characterizes stress failure patterns and elucidates instability mechanisms through stress and displacement responses. The results indicate the following: (1) Increasing MSD intensifies tensile stress on overlying strata results in vertical displacement about one-fifth of the MSD at 100 m above the roadway. (2) As subsidence increases, the disturbance range of the overlying rock, shaft failure extent, and number of tensile failure units rise. MSD transitions expand the shaft failure range and evolve tensile failure from sporadic to large-scale uniformity. (3) Shaft failure arises from the combined effects of instability and deformation in the horsehead and connecting roadways, compounded by geological conditions. Excitation-induced disturbances cause bending of thin bedrock, affecting the bedrock–loose layer interface and leading to shaft rupture. (4) Measures including establishing protective coal pillars and enhancing support strength are recommended to prevent shaft damage from mining subsidence and water drainage.

1. Introduction

Coal mine shafts serve as a critical conduit for both surface and subterranean transport within the mining industry, playing an essential role in ensuring the operational safety of mines [1,2,3,4]. In regions such as Huanghuai and Northeast China, vertical shafts are predominantly utilized due to the specific geological conditions of coal seam occurrences [5,6,7]. Since the significant damage to nine shaft walls in the Huaibei mining area in 1987, over a hundred vertical shafts in China have experienced varying degrees of structural impairment, representing a substantial hazard to mining safety and incurring considerable economic costs [8,9]. A primary factor contributing to numerous instances of shaft damage is the drainage induced by coal extraction activities; this process triggers secondary consolidation settlement of the soil layers adjacent to the shaft, which in turn generates vertical additional forces and leads to tensile damage in the shaft structure [10,11,12]. Understanding the impact of bedrock settlement on the stress distribution and deformation of the shaft is imperative for devising strategies to prevent and mitigate incidents of shaft fracturing [13,14,15,16]. The phenomenon of shaft failure due to overlying rock settlement has garnered the intense focus of researchers, yielding a wealth of scholarly findings.
In theoretical research, significant advancements have been made in understanding shaft behavior in complex geological settings. Cheng et al. [17] and Lou and Su [18] employed fuzzy inversion techniques to assess negative friction forces in hydrophobic settlement formations, elucidating stress mechanics during alluvial layer settlement. Building on this foundation, Yan et al. [19] and Lu et al. [20] developed mechanical models to evaluate shaft stability under porous seepage conditions, considering factors such as inclination angle, azimuth, and weak plane orientation. Ma and Chen [21] proposed a method to determine the equivalent density of shaft collapse pressure in shale formations. Following this, Zhang et al. [22], based on Ma and Chen [21], introduced an analytical model using stability theory to calculate collapse pressure. They applied elastic–plastic mechanics to resolve stresses and displacements around the shaft, formulating an equilibrium path that defines the relationship between internal pressure and radial displacement. Ma and Yu [23] advanced a sensitivity analysis technique to quantify the influence of individual input parameters on shaft stability uncertainty, highlighting each parameter’s singular impact amidst prevailing uncertainties. Mu [24] concretized theoretical research by investigating internal force distribution and stress patterns of shaft walls under spatially axisymmetric conditions. Wu et al. [25] used Midas GTX NX to construct a numerical model accurately capturing pre- and post-excavation stress and deformation in surrounding rock masses, aligning with engineering practice.
In the experimental research domain, Yao et al. [26] conducted model experiments on a composite shaft structure comprising double-layer steel plates and high-strength concrete. Their study elucidated the vertical stress, deformation, and strength characteristics under combined axial loads and lateral pressures. Cui et al. [27] developed a novel approach to couple the stress field within shaft formations and predict stability for KT-II type unstable geologies using principal factors of shaft collapse and empirical data. Zhang et al. [9] employed the Mohr–Coulomb failure criterion and a multi-tiered confidence modeling framework to address three geo-stress scenarios—normal fault, strike–slip fault, and reverse fault. They crafted a visual analytical model for assessing shaft stability across various orientations and inclinations. Additionally, they used a stochastic uncertainty simulation technique with an interval confidence approach to determine the probability distribution of shaft failure in reservoirs with low formation pressure coefficients.
Despite extensive theoretical and empirical research by scholars such as Gao et al. [28], Hendel et al. [29], and Zhang et al. [30], instability-related disasters in deep mining shafts persist. This issue is partly due to challenges in scaling and visualizing interactions between hydrophobic rock settlement and shaft structures, which obscure comprehensive understanding and leave specific mechanisms of shaft settlement unexplained [8,29,31]. The key to solving this problem is how to effectively reproduce or equivalently simulate the hydrophobic process. Based on above analysis, a detailed analysis integrating the quantitative effects of hydrophobic settlement on the horsehead roadway’s covering strata, along with stress and displacement field distributions and structural failure patterns using appropriate method models [8,32,33], is imperative. This approach aims to accurately assess how overlying rock settlement impacts shaft wall integrity.
The objective of this study is to decipher the mechanisms responsible for shaft damage attributable to the subsidence of overlying rock strata. Utilizing the actual geological conditions and the specific structural configuration, a mechanical coupling model comprising the stratified rock, shaft, and horsehead roadway was constructed via Fast Lagrangian Analysis of Continua 3D (FLAC3D). The model imposed maximum subsidence displacements (MSDs ( d max )) of 0.5 m, 1.0 m, and 1.5 m on the horsehead roadway’s roof, simulating the secondary consolidation of the soil layer adjacent to the shaft, which is affected by hydrophobic water at its base. Analyses of the stress and displacement fields within this model were conducted to uncover the instability mechanisms of the shaft. Additionally, the integration of Mises stress values and the distribution of plastic zones facilitated a detailed examination of the shaft’s structural failure characteristics.

2. Establishment and Calculation Process of a Numerical Model

Utilizing advanced numerical simulation techniques and harnessing the computational and visual capabilities of modern computer software, this research will investigate the failure and instability of the surrounding rock in the Gubei Mine’s auxiliary shaft roadway. Simulations will model the evolution of the stress field, displacement field, and failure distribution of the rock encompassing the auxiliary shaft roadway, with a focus on the effects of the geo-stress environment. The aim is to uncover the distinct stress instability traits of the auxiliary shaft and its adjacent roadways, thereby offering valuable insights for the development of effective support and control strategies for the surrounding rock in these underground structures.

2.1. Selection of Computing Software

The FLAC3D software, developed by ITASCA Consulting Group, is an advanced computational tool utilized in this simulation for its proficiency in modeling the three-dimensional stress characteristics and plastic flow behavior of geological materials, including soil and rock [8,34]. It incorporates an explicit Lagrangian algorithm and a mixed discretization technique, which together enable the precise simulation of material plasticity and flow phenomena [35,36]. This software not only facilitates the efficient construction of tunnel and support structure models, but its simulation outcomes are also acknowledged for their robustness within the industry, as evidenced by widespread acceptance [37]. Given its alignment with the objectives of this investigation, FLAC3D was selected as the simulation platform of choice [38].

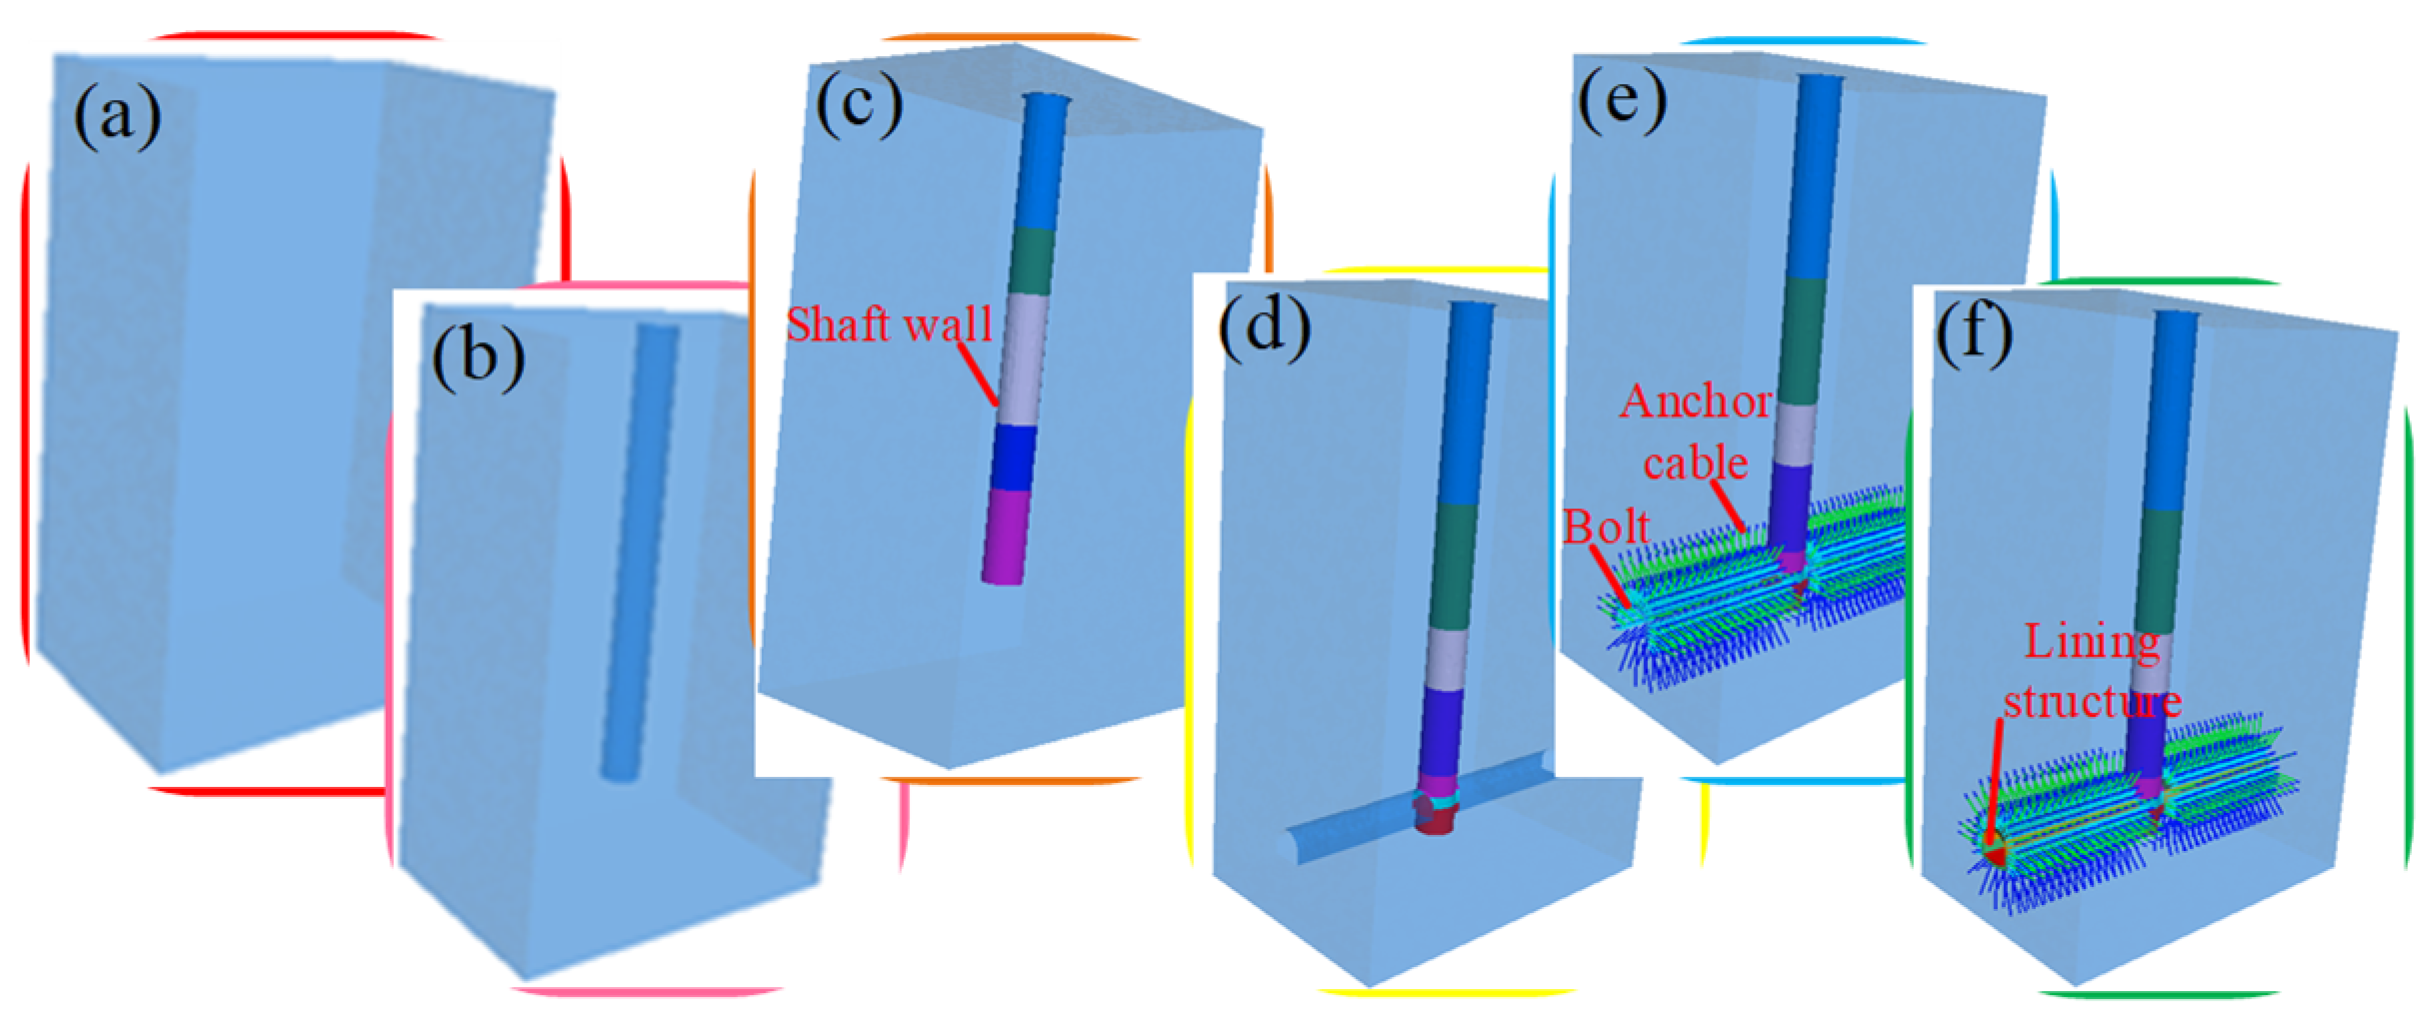
2.2. Establishment of Numerical Model and Parameter Settings

(1)
Establishment of numerical model
This study focuses on a shaft with an outer diameter of 9.1 m and an auxiliary horsehead roadway inclined at 45 degrees, both reinforced with 0.5 m thick C50 concrete linings. The shaft’s underground roadway, located within the shaft bottom parking lot, resides at a depth of 650 m below ground level, subject to an original geo-stress of 17.2 MPa. A computational mesh, accounting for the range of influence and boundary effects, was generated employing the Rhino & Griddle interface. Subsequently, this mesh was imported into FLAC3D (vision 5.00) for the development of a three-dimensional finite difference model, as depicted in Figure 1. The model dimensions are 132 m in height, 70 m in length, and 50 m in width, with horizontally fixed displacement boundaries on all four sides, a vertically fixed displacement boundary at the base, and a boundary condition of vertical stress applied at the top surface. To ensure that the results from the numerical model accurately reflect the actual conditions, the following steps were taken: (1) The orientation and thickness of the constructed rock layers align with the observed exposure of the bottom layer. (2) The lateral pressure coefficient and support form of the model are consistent with real-world conditions, specifically employing a lateral pressure coefficient of 0.75. The stratigraphy and thickness of each geological layer are detailed in Table 1.
To mirror the complexities of real-world engineering conditions, a large deformation strain approach was adopted for the simulations. Additionally, two types of measurement points were established in the model. The first type was positioned at the center of the horsehead roadway’s roof to monitor settlement displacement (as detailed in Section 3). The second type was placed on the inner side of the shaft lining to measure the Mises stress of the shaft unit and assess the extent of shaft damage (as detailed in Section 3.5).
(2)
Setting of model parameters
The geological stratification within the study area, as delineated in Table 1, chiefly comprises siltstone, fine sandstone, coal seams, mudstone, and medium sandstone. The mechanical parameters for the numerical model were derived from controlled laboratory tests and modified to reflect in situ conditions of the shaft and horsehead roadway using the Hoek–Brown strength criterion and the Geological Strength Index (GSI). These adjusted parameters for select strata and the borehole are detailed in Table 2. The density data of the rock layer are provided directly by the mining party, whereas other parameters are derived from uniaxial and triaxial compression tests on core rock samples. For the remaining layers, the parameters were established using engineering analogy and interpolation methods [8]. Engineering analogy involves referencing geological parameters previously studied and determined within the same mining area. In contrast, interpolation estimates parameters based on understanding the strength relationships between rock masses with unknown parameters and those with known parameters.

2.3. Setting of Constitutive Model for Numerical Simulation

In this study, the strain softening model is selected as the mechanical model for the numerical simulation depicted in Figure 1. This model builds on the Mohr–Coulomb (M-C) framework with non-correlated shear and correlated tensile flow rules. Unlike the M-C model, the parameters of the strain softening model undergo softening or hardening after the specimen yields. The M-C yield criterion determines rock mass failure as follows [39]:
f s = σ 1 σ 3 1 + sin ϕ 1 sin ϕ 2 c 1 + sin ϕ 1 sin ϕ f t = σ 3 σ t
where σ1 and σ3 are the maximum and minimum principal stresses, respectively; c and φ are the cohesion and internal friction angle, respectively. When fs > 0, the material will undergo shear failure. Under normal stress conditions, the tensile strength of rock mass is very low, so the tensile strength criterion (fs > 0) can be used to determine whether the rock mass has undergone tensile failure [40].
In the strain softening model, the incremental form of principal stress and strain is expressed by Hooke’s Law as follows:
Δ σ 1 = α 1 Δ ε 1 e + α 2 Δ ε 2 e + Δ ε 3 e Δ σ 2 = α 1 Δ ε 2 e + α 2 Δ ε 1 e + Δ ε 3 e Δ σ 3 = α 1 Δ ε 3 e + α 2 Δ ε 1 e + Δ ε 2 e
Among these, Δ ε 1 e , Δ ε 2 e , and Δ ε 3 e represent the incremental expressions of the principal strain, while α 1 and α 2 are material constants defined by the shear modulus G and bulk modulus K , as follows:
α 1 = K + 4 3 G α 2 = K 2 3 G
The shear yield function expression for the strain softening model is given as follows:
F sy = σ 1 σ 3 N φ + 2 c N φ
where N φ = 1 + sin φ 1 sin φ .
The equation for tensile yield strength is expressed as follows:
F ty = σ 1 σ 3
It is generally assumed that the total strain increment can be decomposed into elastic and plastic components. The flow law for plastic yielding is expressed as follows:
Δ ε i p = λ g σ i
where i = 1, 3: λ represents the plasticity coefficient to be determined, g denotes the potential function, and its shear yield component is g s . The corresponding non-correlation equation is given as follows:
g s = σ 1 σ 3 N ψ
where N ψ = 1 + sin ψ 1 sin ψ , ψ is the shear dilation angle.
The tensile yield component of the potential function is g t , and its associated flow law is expressed as follows:
g t = σ 3
The plastic strain increment associated with shear failure is expressed as follows:
Δ ε 1 ps = λ s Δ ε 2 ps = 0 Δ ε 3 ps = λ s N φ
By substituting Equation (9) into Equation (2), the modified equation for shear failure stress is derived as follows:
σ 1 N = σ 1 I λ s α 1 α 2 N ψ σ 2 N = σ 2 I α 2 λ s 1 N ψ σ 3 N = σ 3 I λ s α 2 α 1 N ψ
where superscripts N and I denote the stress states of the element after and before correction, respectively. Consequently, the stress correction equation for unit tensile failure is derived as follows:
σ 1 N = σ 1 I λ t α 2 σ 2 N = σ 2 I λ t α 2 σ 3 N = σ 3 I λ t α 1

2.4. Numerical Simulation Scheme

Figure 2 illustrates the excavation and support process of the shaft and horsehead roadway. The shaft employs only lining support, whereas the initial support for the horsehead roadway combines bolts and anchor cables, with a spacing of 0.8 m between bolts and 1.6 m between anchor cables. The secondary support for the horsehead roadway is consistent with that of the shaft, utilizing a lining structure. To replicate the rock layers’ natural settlement process within the model, an initial equilibrium state is established post-application of boundary constraints and after grouping and assigning rock layer parameters (refer to Figure 2a). Upon achieving this equilibrium, the displacement and velocity parameters are reset to zero in preparation for the next phase of the simulation. Subsequent to this reset, the shaft excavation is simulated, and the lining, representing the shaft wall, is incorporated into the model (see Figure 2c). A second equilibrium is attained, followed by another reset of the displacement and velocity parameters, facilitating an accurate assessment of the horsehead roadway roof subsidence and its consequential effects on the overlaying rock mass deformation [41]. The final stage encompasses the excavation of the horsehead roadway and construction of its lining (refer to Figure 2f). Based on empirical measurements, the maximum consolidation settlement displacement of the upper rock mass in the horsehead roadway approaches 1.5 m. To dynamically analyze the stress and failure evolution process and mechanisms of the shaft during settlement, the rock parameters were adjusted to achieve MSD values of 0.5 m, 1.0 m, and 1.5 m.

3. Simulation Results and Analysis

To simulate the secondary consolidation settlement effects associated with hydrophobic water at the shaft’s base, the model’s calculations were terminated upon achieving predetermined MSDs—0.5 m, 1.0 m, and 1.5 m—at the center of the horsehead roadway’s roof, serving as the criterion for halting the simulation. Subsequent analyses of the stress and displacement fields for the model and shaft were conducted at each of these displacement milestones. The spatial distribution curves reflecting the subsidence impact on the surrounding rock of the horsehead roadway’s roof at these respective displacement levels are depicted in Figure 3.
Owing to the shaft’s proximity, the displacement curve of the horsehead roadway’s roof demonstrates an approximately inverse relationship, whereby displacement decreases with closer proximity to the shaft and increases with distance from it. Additionally, there is a direct correlation between the magnitude of subsidence displacement and its variance: the greater the subsidence displacement and the distance from the shaft, the more pronounced the variability in the subsidence displacement.

3.1. Overall Three-Dimensional Displacement Field of the Model

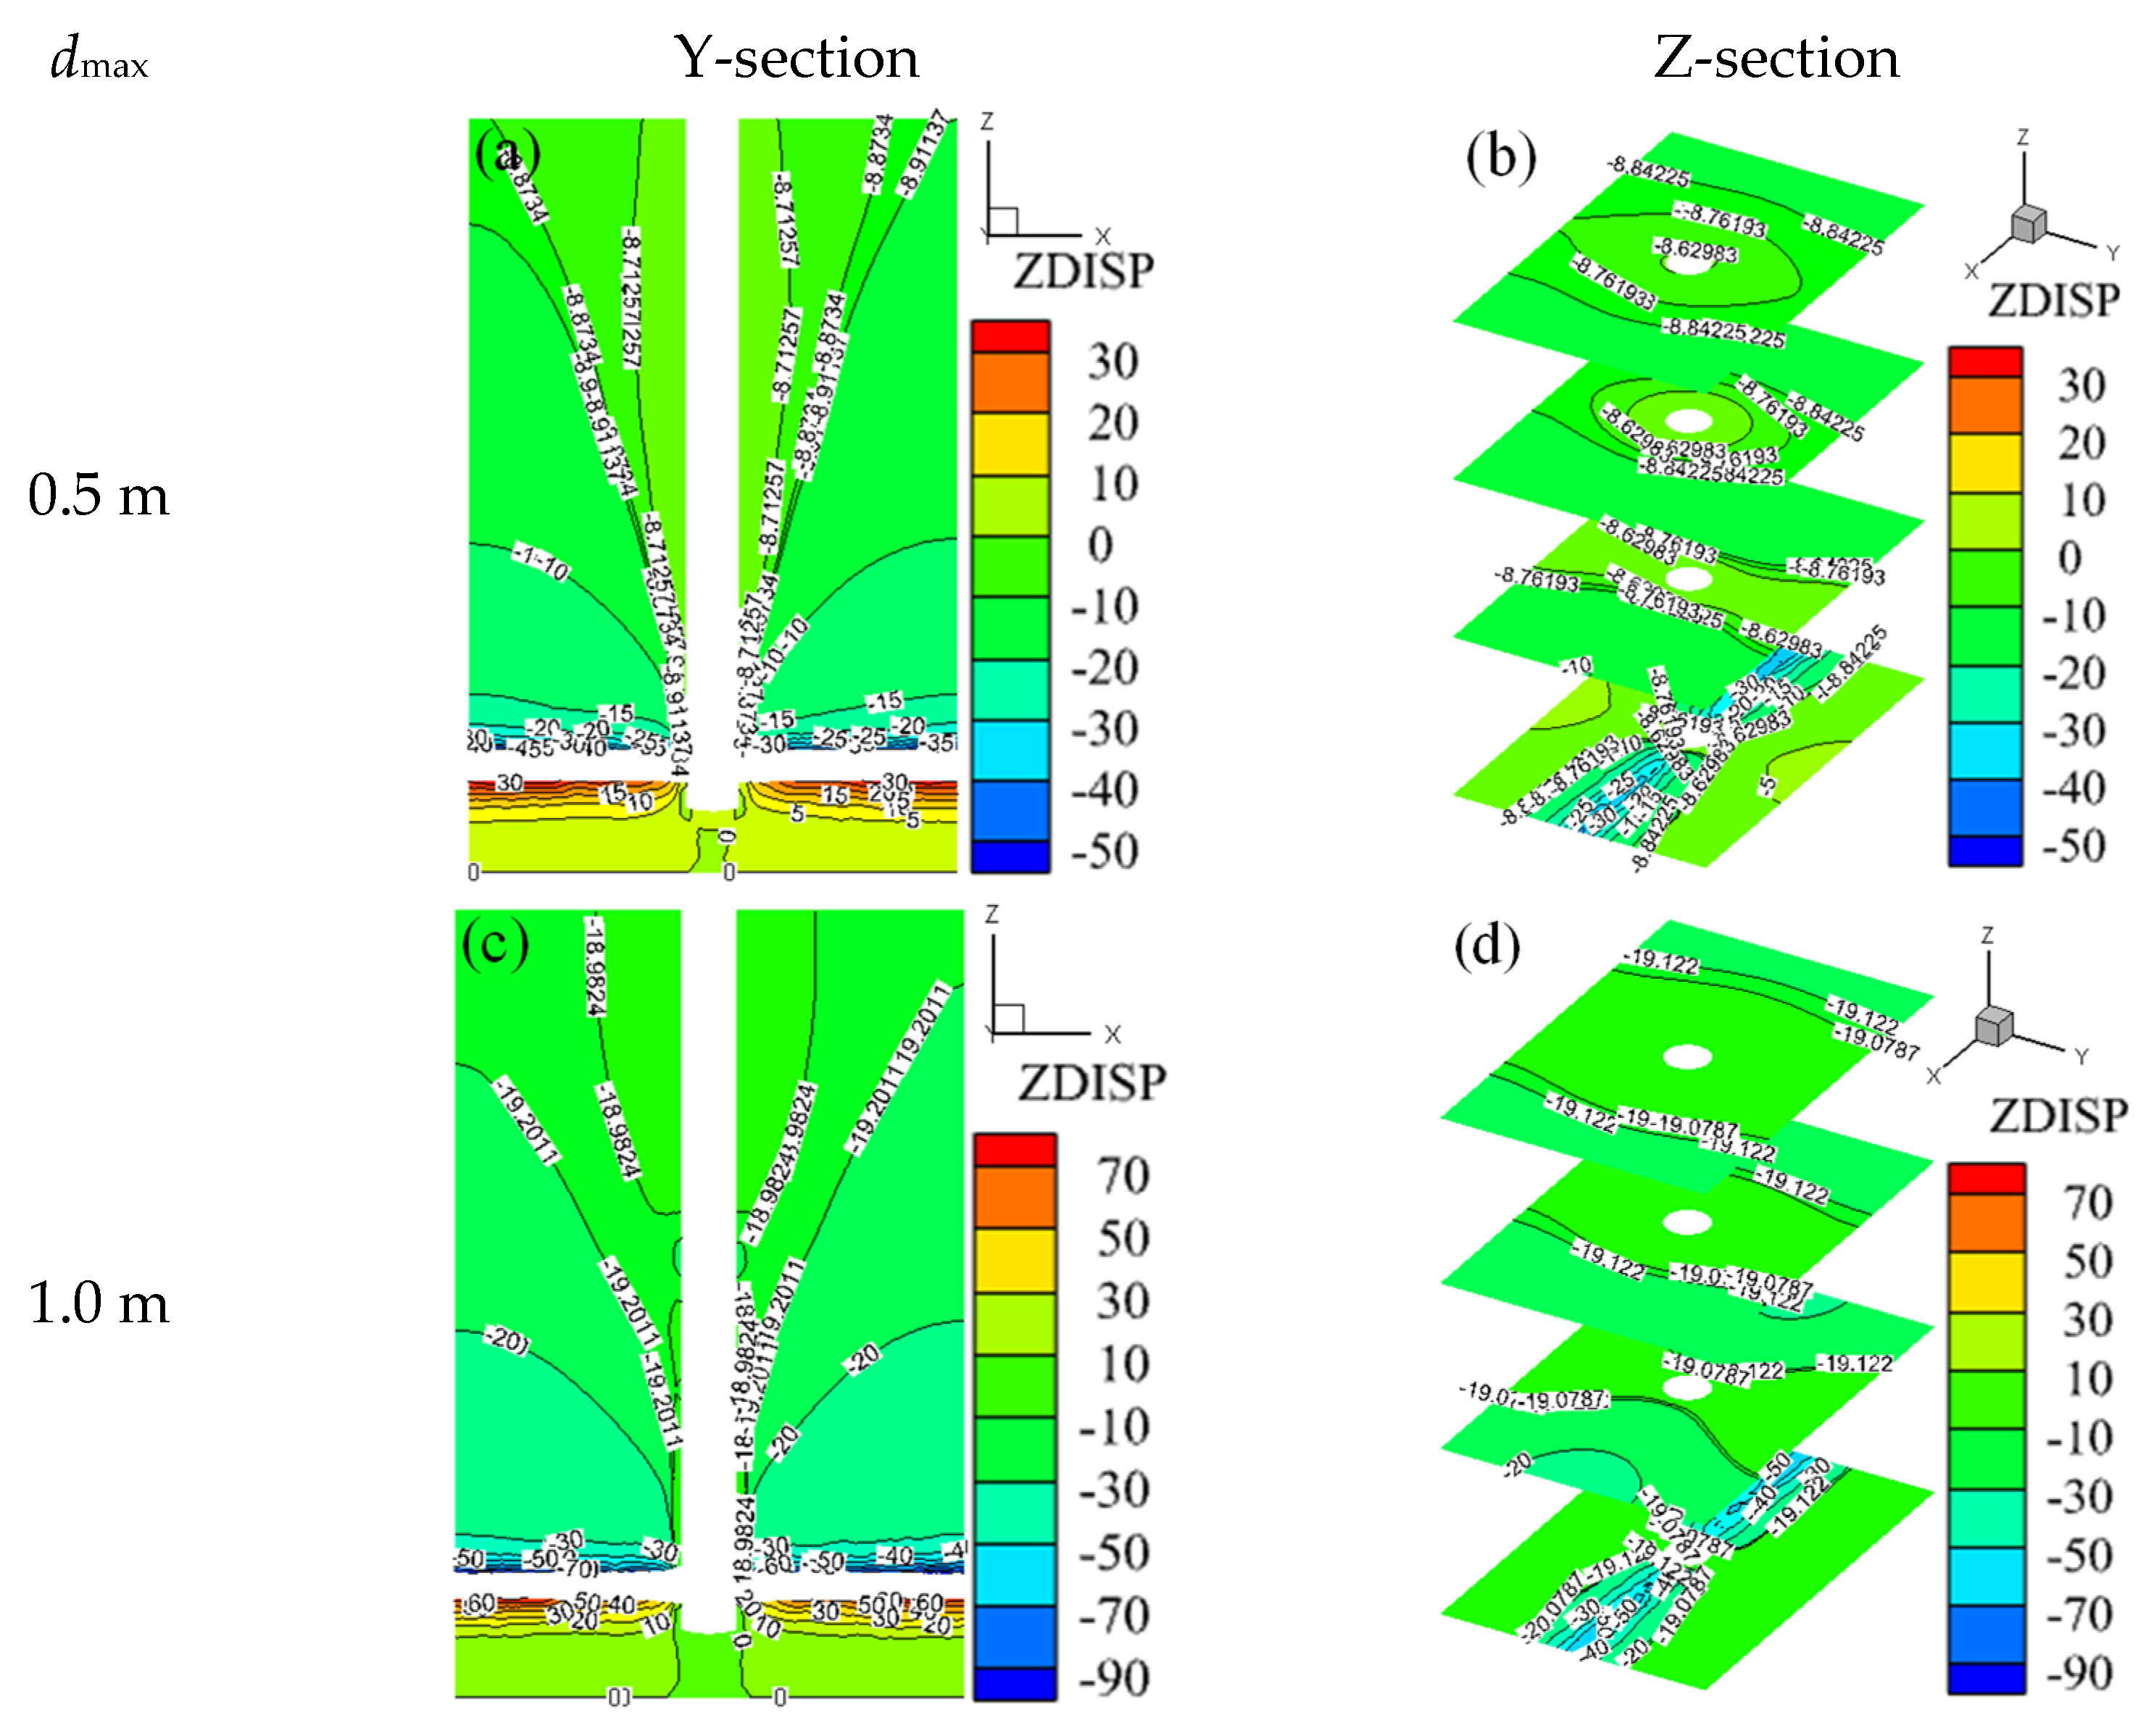
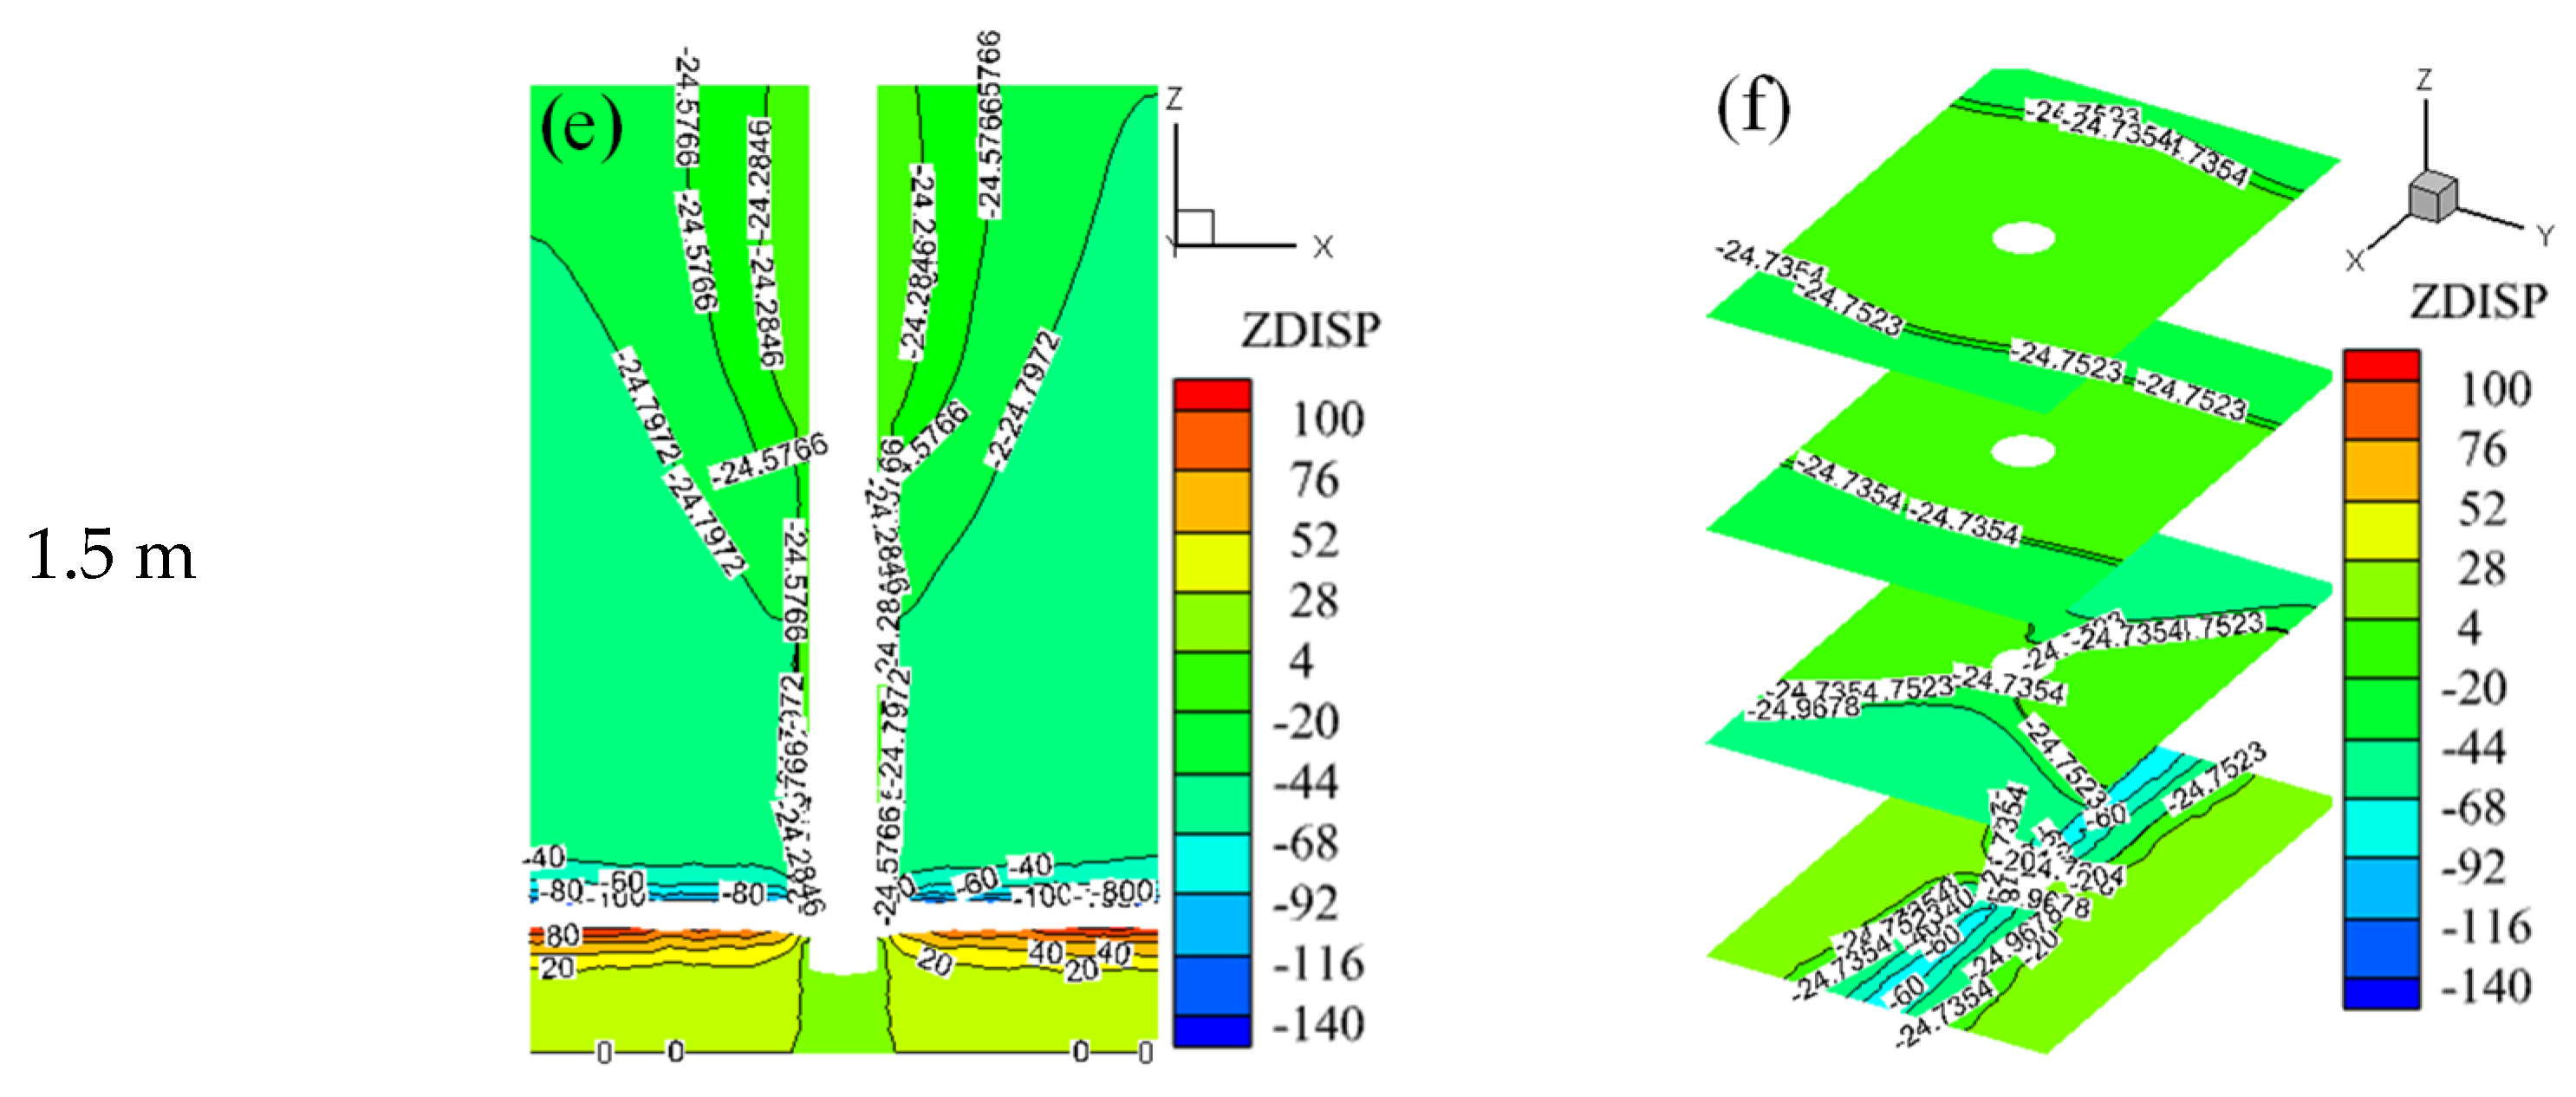
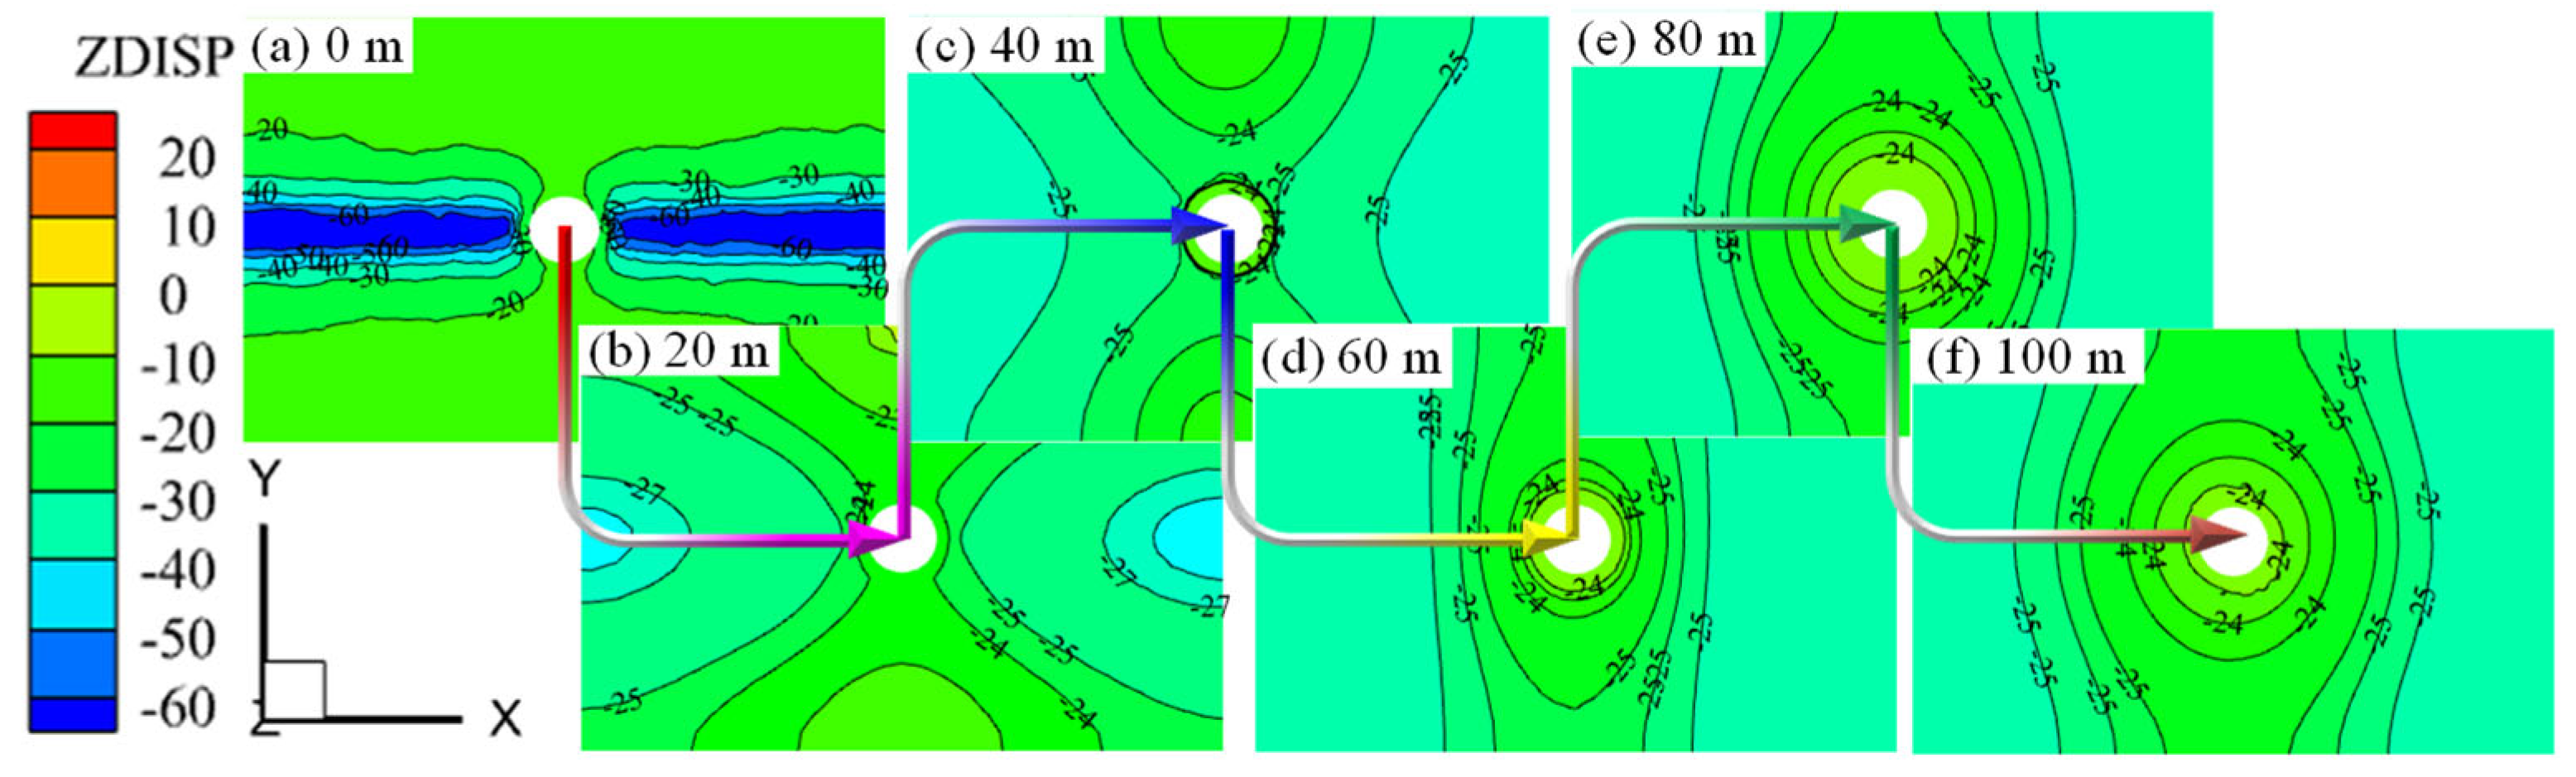
3.1.1. Overall Z-Direction Displacement Field of the Model

The model exhibits a pattern where the vertical displacement progressively diminishes in a divergent fashion from the interface of the horsehead roadway and the shaft upwards to the model’s summit. This diminishing trend amplifies as the subsidence displacement of the horsehead roadway’s roof escalates, thereby extending the sphere of influence upon the overlying rock strata. At roof subsidence displacements of 0.5 m, 1.0 m, and 1.5 m for the horsehead roadway, the resultant Z-direction displacement fields within the model are illustrated in Figure 4.
At a subsidence displacement of 0.5 m for the horsehead roadway’s roof, the Z-direction displacement within the roof region predominantly ranges from 0.3 m to 0.5 m, diverging upward to the model’s apex where it tapers off, as depicted by the displacement contour line in Figure 4a. The displacement at the model’s top measures approximately 9 cm, correlating to roughly one-fifth of the horsehead roadway’s roof subsidence displacement. The Z-direction displacement field’s four cross-sections along the Z-axis, illustrated in Figure 4b, are situated at distances of 100 m (the model’s top surface), 66 m, 33 m, and 0 m (the horsehead roadway’s roof) from the model’s summit downward. These cross-sections reflect the transition of the Z-direction displacement contour line from an O-shape, evident at the 100 m and 66 m levels, to an X-shape at the 33 m and 0 m levels, indicating a shift in displacement pattern with decreasing distance from the roof. Furthermore, beyond 33 m from the horsehead roadway’s roof, the Z-direction displacement contour line’s density variation is relatively subdued, and the maximum displacement ( d max ) within this plane is approximately 10 cm.
With a 1.0 m MSD of the horsehead roadway’s roof, the Z-direction displacement at the roof predominantly falls within the range of 0.6 to 1.0 m, projecting divergently upwards and diminishing towards the model’s apex, as shown by the displacement contour line in Figure 4c. At this increased displacement level, the model’s summit registers a displacement of approximately 19 cm, maintaining the proportionality of about one-fifth the MSD experienced by the horsehead roadway’s roof. An analysis of Figure 4 reveals a transformation of the Z-axis displacement contour line within vertical sections: transitioning from an O-shape at the 100 m and 66 m levels to an X-shape closer to the roof, at the 33 m and 0 m levels. Moreover, when compared to a subsidence displacement of 0.5 m, the 1.0 m displacement notably influences the 33 m section, evidenced by increased contour line density in contrast to the 66 m and 100 m sections, with the peak Z-direction displacement surpassing 20 cm.
When the horsehead roadway’s roof undergoes the MSD of 1.5 m, the Z-direction displacement ranges from 1.0 to 1.5 m at the point of the roof. The displacement profile exhibits an initial upward extension of approximately 30 m before diverging and tapering off towards the model’s apex, as illustrated by the displacement contour line in Figure 4e. The displacement registered at the model’s summit is approximately 25 cm, aligning closely with one-fifth of the horsehead roadway’s roof MSD. Observations from Figure 4f indicate that, in the vertical sections, the Z-direction displacement contour line shifts from an O-shape at the 100 m and 66 m levels to an X-shape at the 33 m and 0 m levels as the distance from the horsehead roadway’s roof decreases. Moreover, when contrasted with a 0.5 m roof subsidence displacement, the 1.5 m displacement exerts a pronounced effect on the 33 m section. This is characterized by a high relative density of the contour lines compared to the 66 m and 100 m sections, with the peak Z-direction displacement exceeding 25 cm.

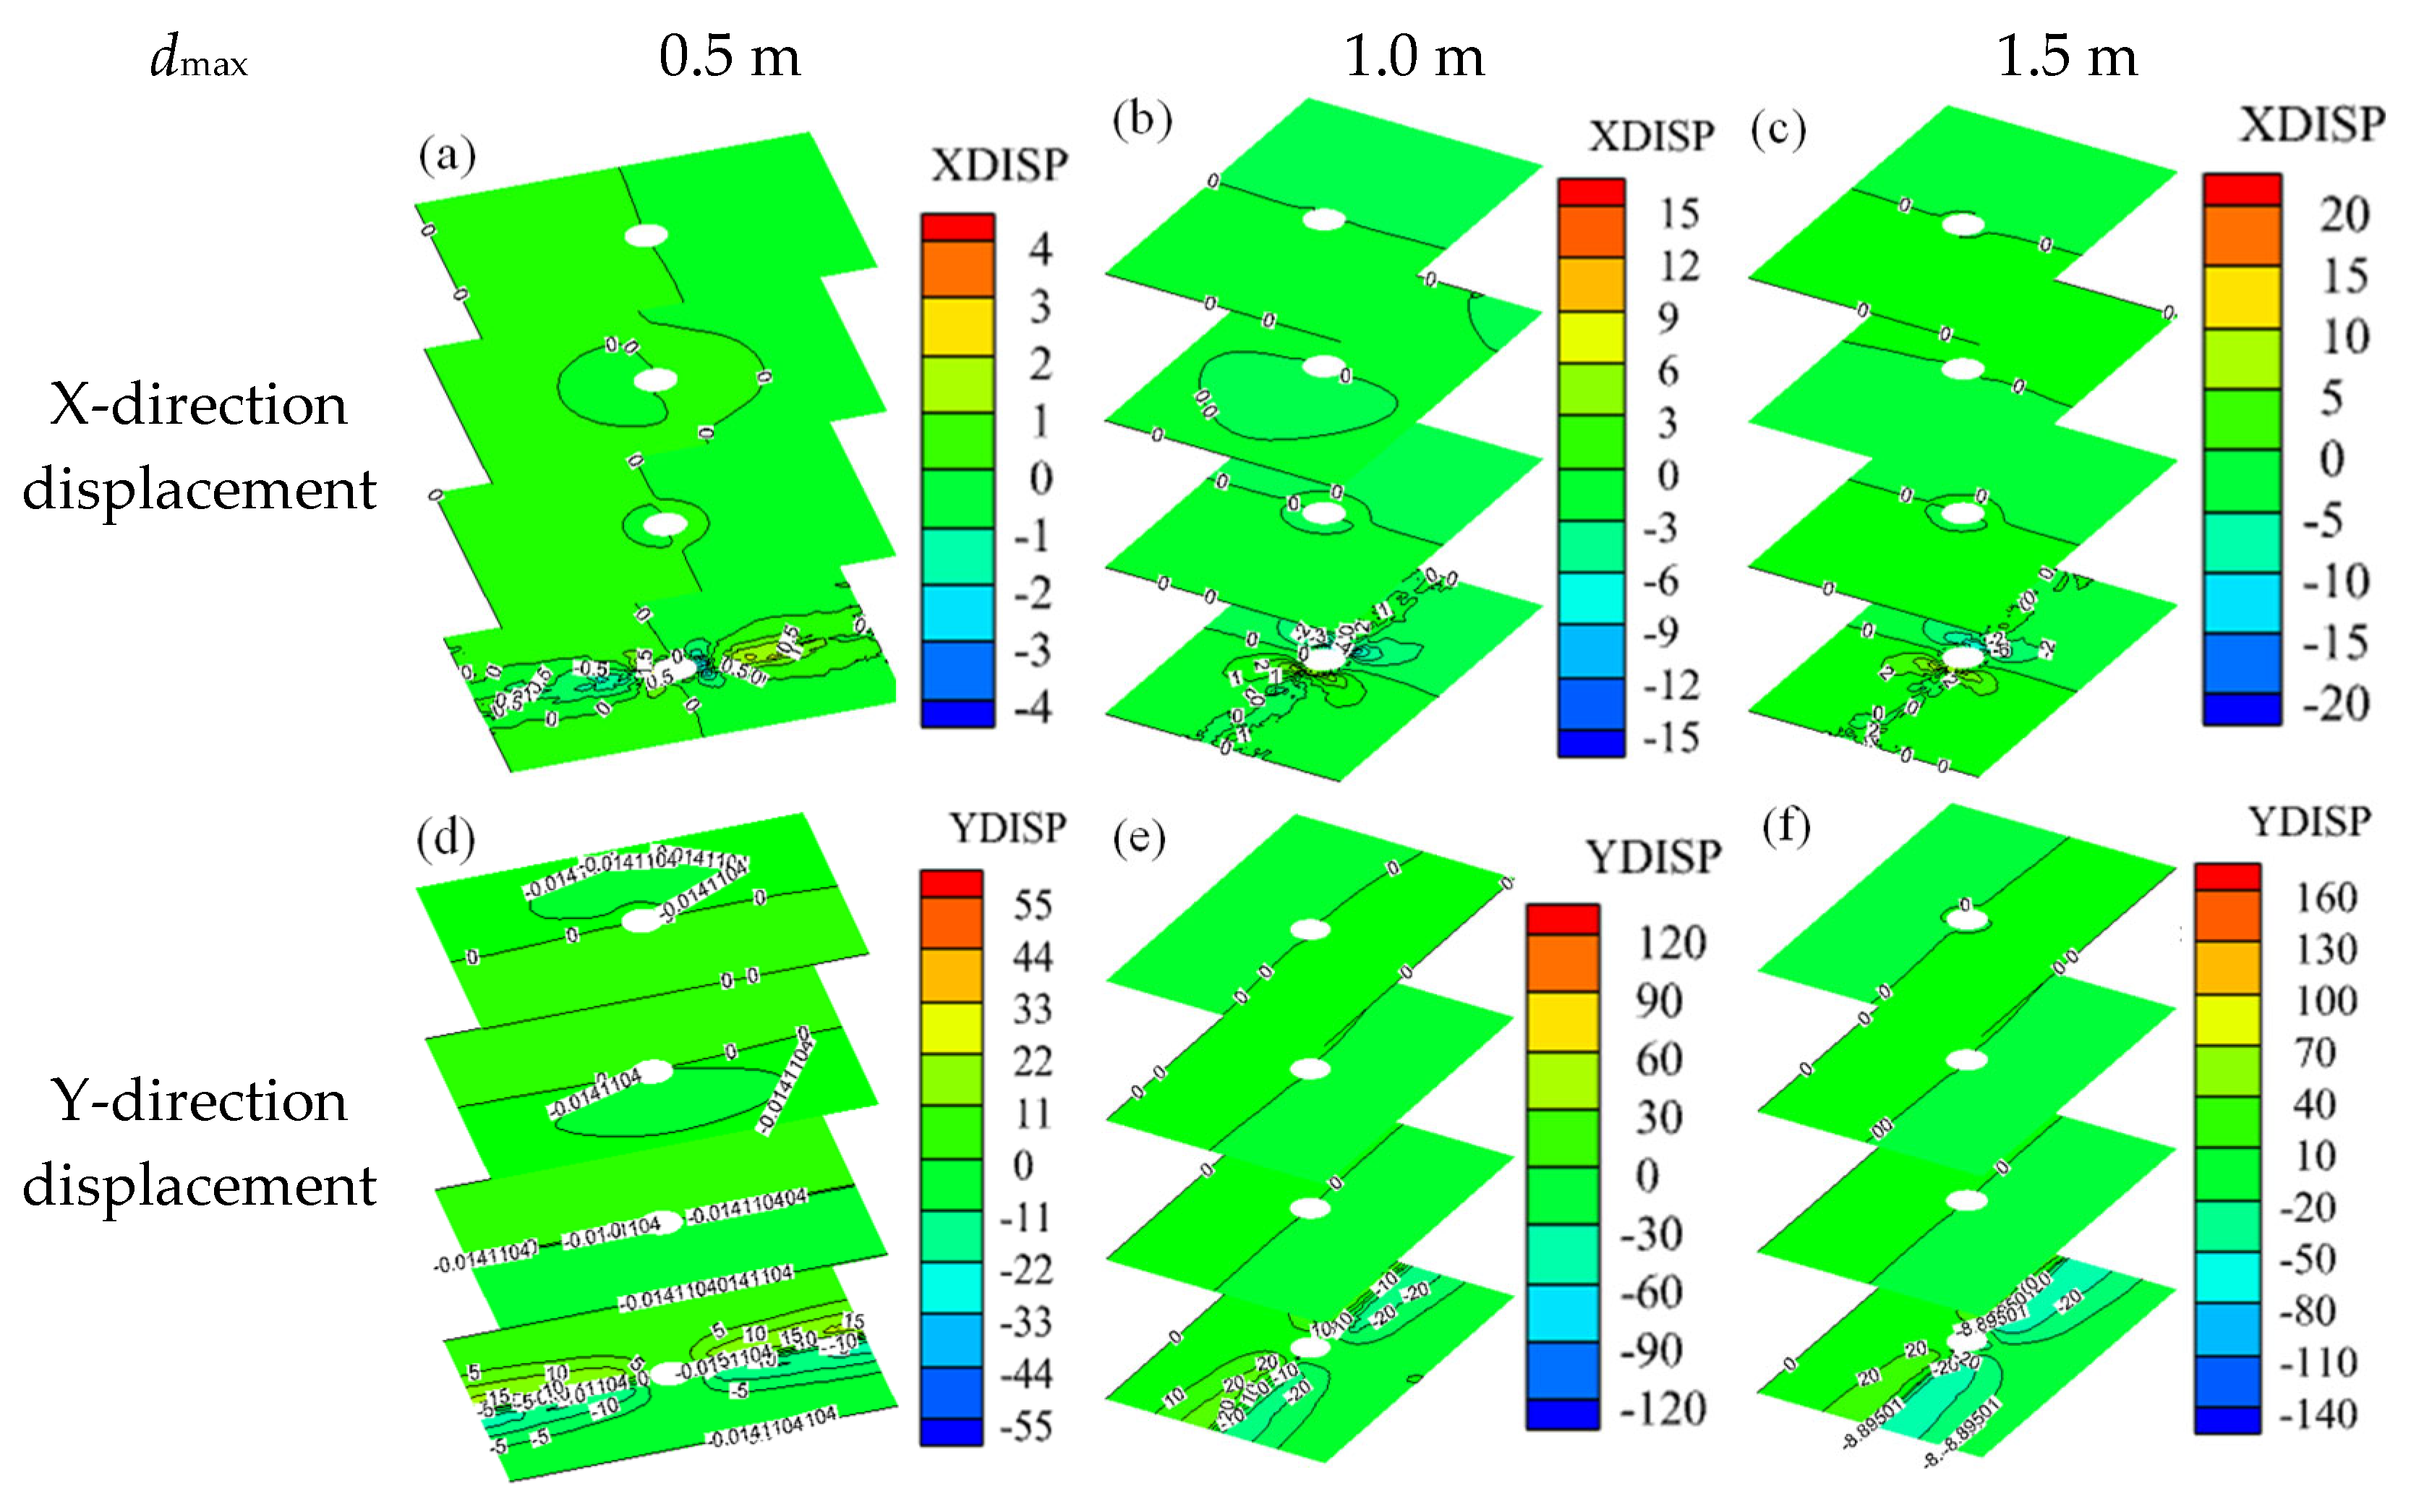
3.1.2. Overall X and Y-Direction Displacement Fields of the Model

The horizontal displacements within the model, observed in the X and Y-directions, are primarily concentrated at the intersection of the shaft and the horsehead roadway. At this locus, the X-direction displacement contour lines exhibit a high density with a petal-like configuration, whereas the Y-direction displacement contours are more compactly arrayed along the longitudinal axis of the horsehead roadway’s roof. Additionally, the subsidence displacement of the roadway’s roof is observed to increase concurrently with the horizontal displacements of the overlying rock in both the X and Y-directions. In contrast to the Z-direction displacement, however, the significant influence of the horizontal displacements on the roof’s subsidence displacement is confined to within a 33 m radius, as depicted in Figure 5.
For the model’s X-direction displacement field, a 0.5 m MSD at the horsehead roadway’s roof results in the most pronounced displacement at the shaft and roadway junction, reaching up to 4 cm. This region is characterized by a petal-shaped contour line of high density. Within the X-Y plane at the roadway’s roof level, the X-direction displacement attenuates with increasing distance from the shaft, leading to a more dispersed contour line distribution (see Figure 5a). At a roof subsidence displacement of 1.0 m, the overall pattern of the model’s X-direction displacement field remains consistent with the 0.5 m scenario, yet it exhibits a notable increase in magnitude, with the maximum displacement at the shaft–roadway interface rising to 15 cm, an increment of approximately 10 cm. The contour line density at this juncture is exceptionally high, and the petal-shaped feature enlarges significantly (see Figure 5b). With the roof subsidence displacement advancing to 1.5 m, the displacement at the shaft and roadway connection continues to dominate the model’s X-direction displacement field. Although the displacement pattern aligns with the 1.0 m subsidence displacement scenario, the maximum displacement further escalates by around 20 cm, underscoring a substantial intensification in deformation (see Figure 5c).
In the model’s Y-direction displacement field, for the MSD of 0.5 m at the horsehead roadway’s roof, the displacement is predominantly localized along the roadway’s axial position, peaking at 55 cm. Axial variations within this region are minimal. However, at the X–Y plane of the roadway’s roof, the Y-direction displacement diminishes with increasing lateral distance from the axis, and the contour lines correspondingly become less dense, as illustrated in Figure 5d. Beyond a 33 m vertical distance from the roadway’s roof, the horizontal displacement changes in both X and Y-directions are negligible. At a subsidence displacement of 1.0 m for the roadway’s roof, the Y-direction displacement remains concentrated along the axial position, with the maximum value surging to approximately 110 cm, double the displacement observed at 0.5 m. The pattern of negligible displacement changes horizontally beyond the 33 m vertical threshold persists at this increased subsidence level, as depicted in Figure 5e.
With the MSD of the horsehead roadway’s roof set at 1.5 m, the model’s Y-direction displacement is principally localized at the interface between the shaft and the horsehead roadway. The pattern of the Y-direction displacement field is analogous to that observed with a 1.0 m roof subsidence displacement; however, it is distinguished by an augmented maximum displacement, which escalates to approximately 180 cm, as evidenced in Figure 5f.

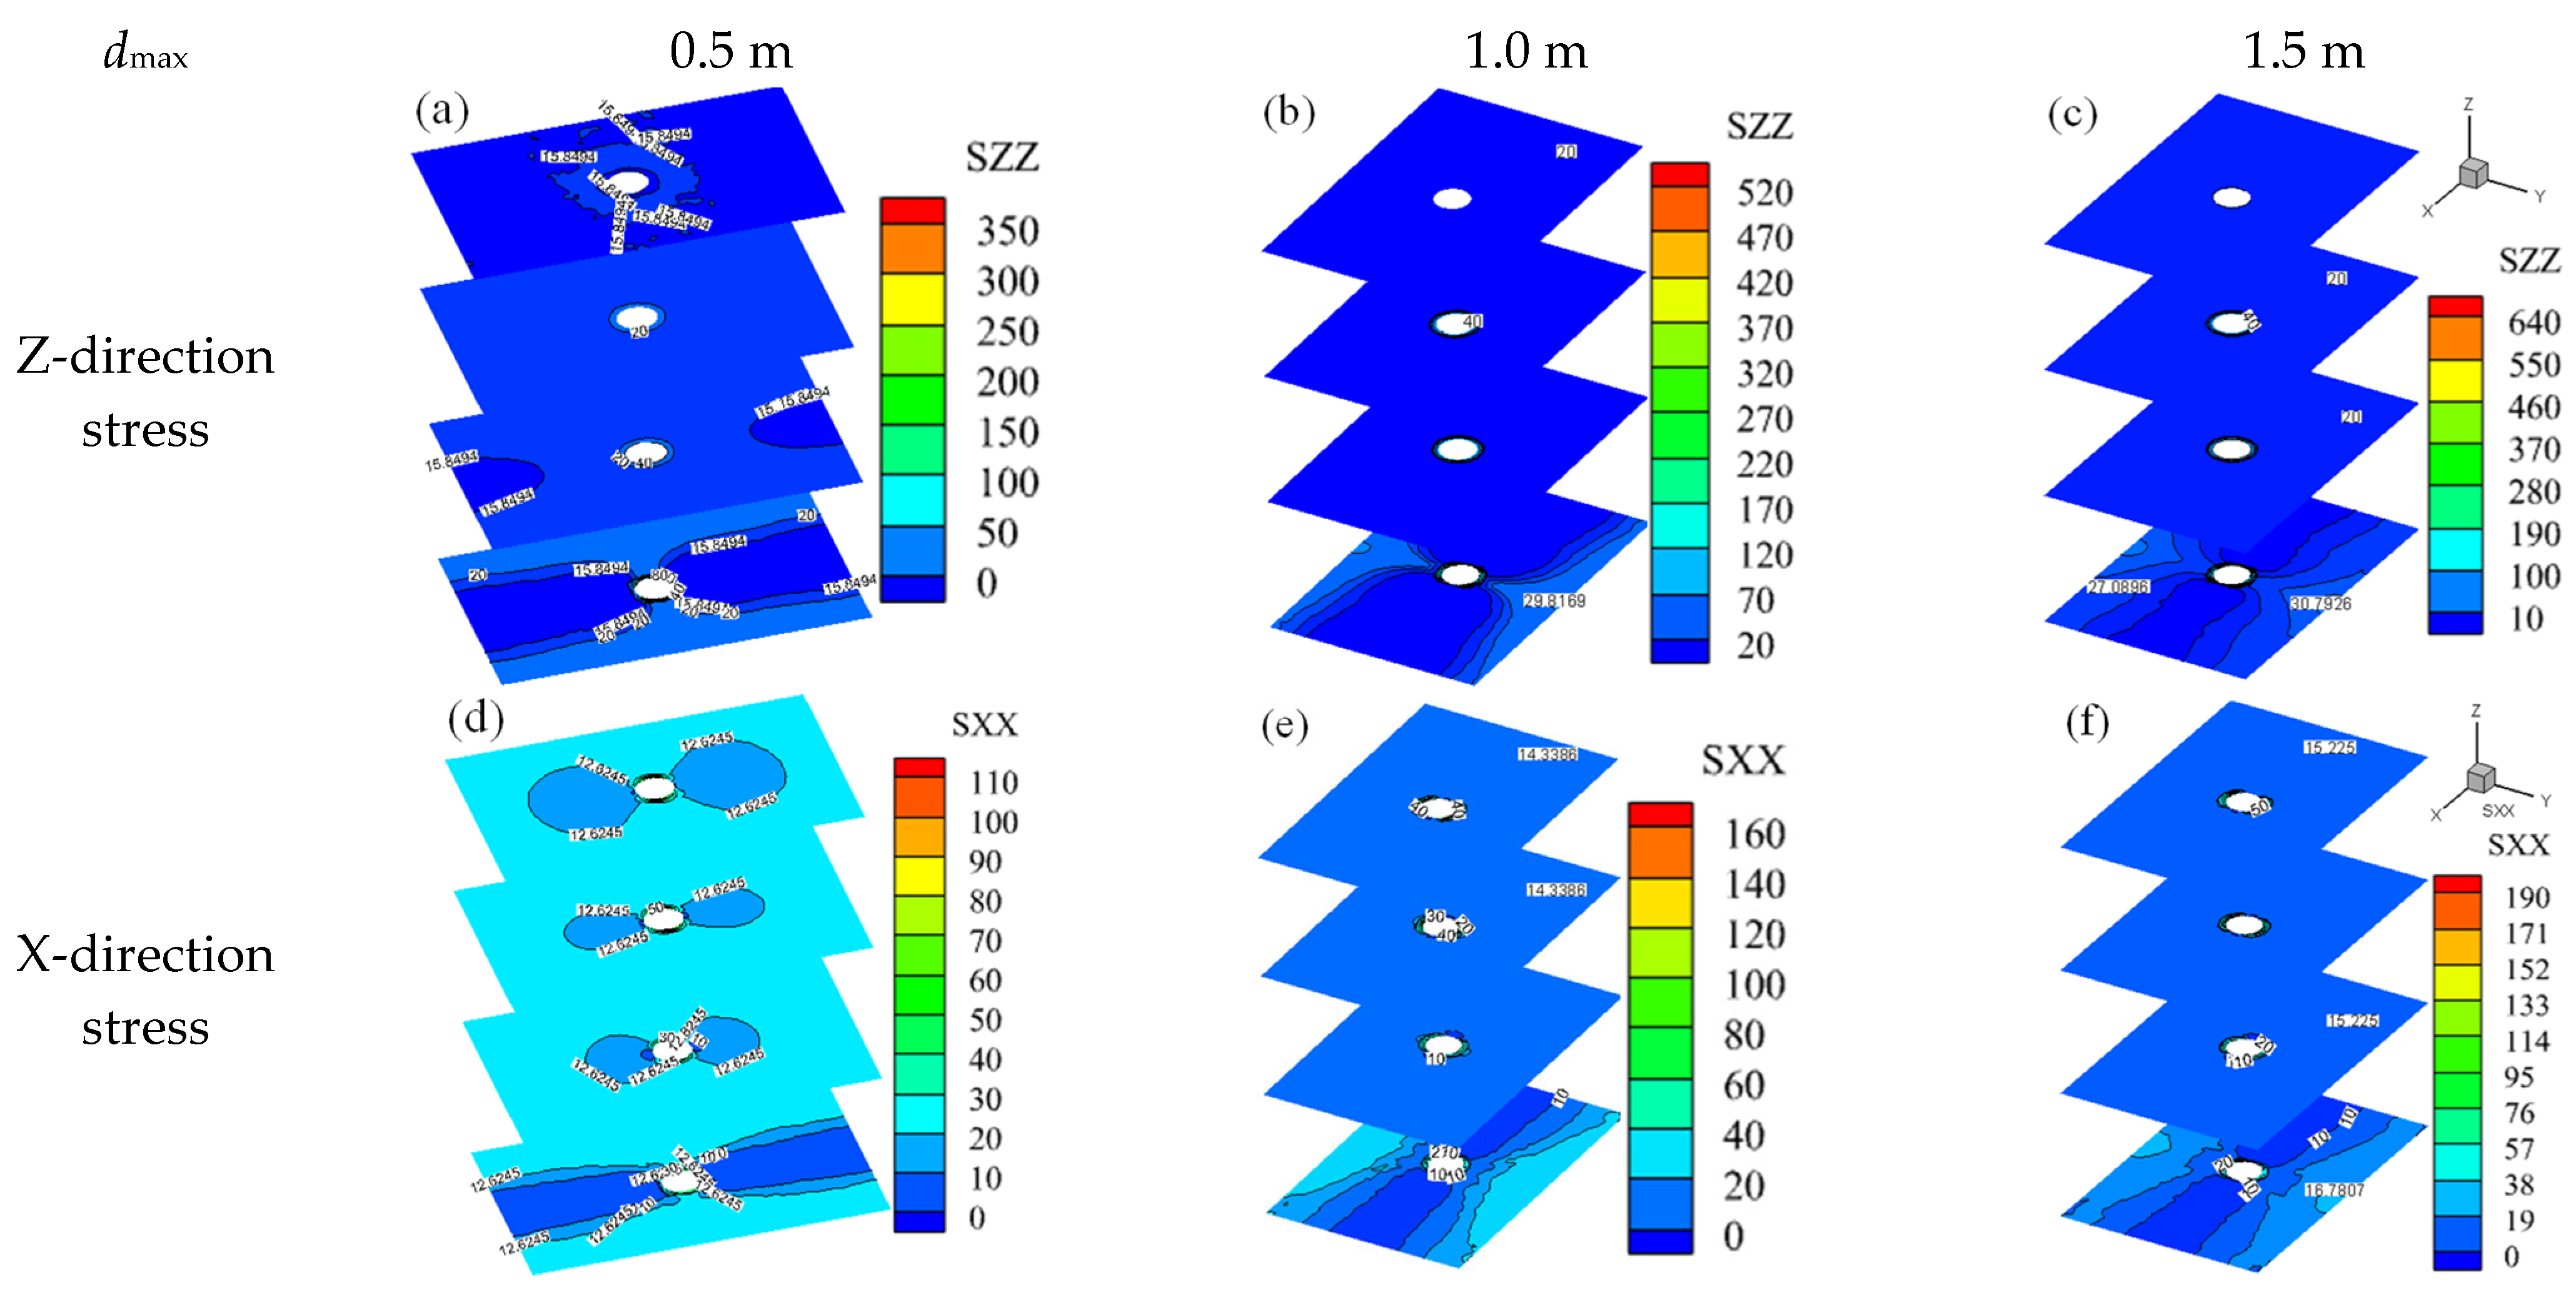
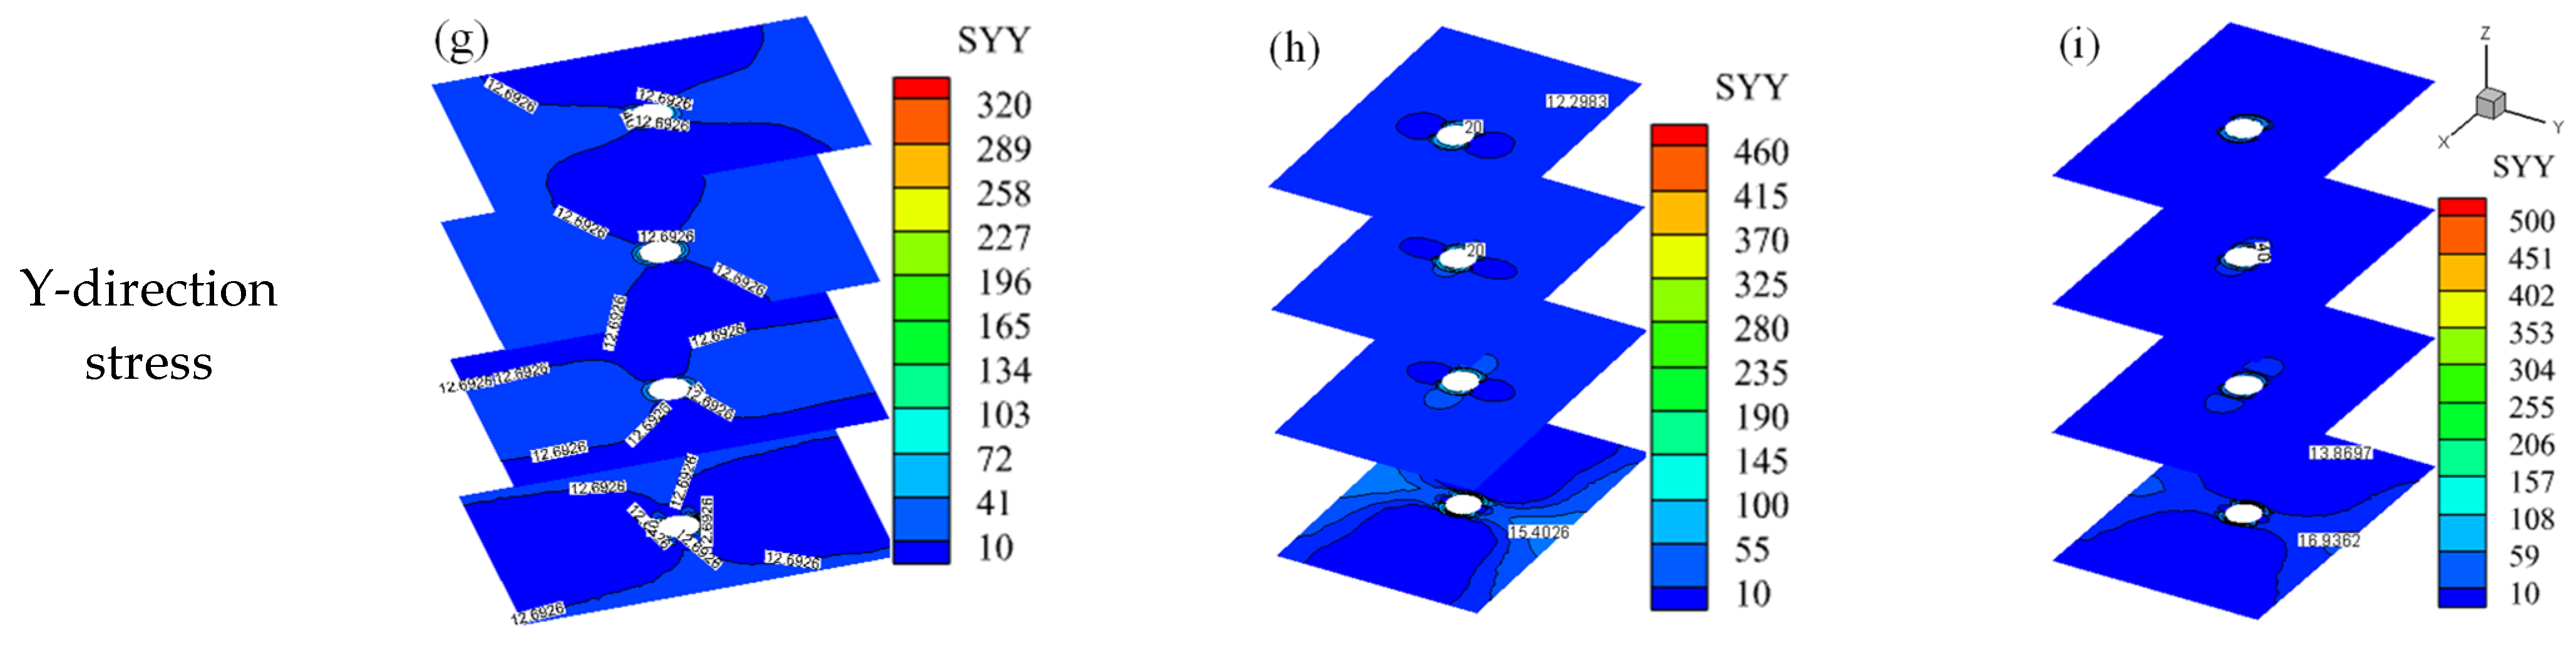
3.2. Overall Three-Dimensional Stress Field of the Model

The three-dimensional stress field of the model exhibits significant directional variations in distribution, yet the magnitudes and forms of this distribution remain essentially consistent. In all three dimensions, the stress concentrations are notably higher in the vicinity of the shaft. Proximity to the horsehead roadway correlates with an increased density in the contour distribution and elevated stress values, as demonstrated in Figure 6.
In the Z-direction stress field of the model, the MSD of 0.5 m at the horsehead roadway’s roof manifests a stress concentration around the shaft, with contour density and magnitude increasing nearer to the roadway. Here, the peak stress approaches 200 MPa at the shaft–roof interface. The stress contours diverge horizontally and align with the roadway’s orientation. Beyond this focal area, the Z-direction stress within the rock mass stabilizes between 15 MPa and 20 MPa, akin to the gravitational load (15.8 MPa) applied at the model’s summit, suggesting minimal influence from the roadway’s roof subsidence at these locations (see Figure 6a). With a subsidence displacement of 1.0 m at the roadway’s roof, the stress field pattern resembles that observed at 0.5 m subsidence, but the maximum stress at the shaft–roof junction escalates to approximately 240 MPa. Beyond a 33 m radial distance from the roadway, the stress imparted on the shaft diminishes to below 60 MPa. Within the rock mass, Z-direction stress levels range from 20 MPa to 30 MPa, representing a marked increase from the 0.5 m subsidence scenario (see Figure 6b). At a subsidence level of 1.5 m for the roadway’s roof, the peak Z-direction stress intensifies to nearly 280 MPa. However, similar to previous observations, the stress on the shaft beyond 33 m remains under 60 MPa, and within the rock mass, stress persists within the range of 20 MPa to 30 MPa (see Figure 6c).
In the model’s X and Y-direction stress fields, significant differentiation is evident only in the directional distribution, whereas the magnitudes and structural patterns of these distributions generally concur. With the horsehead roadway’s roof subsidence displacement at 0.5 m, the X and Y-direction stress distributions mirror those in the Z-direction; stress intensifies in proximity to the shaft and escalates closer to the roadway interface. The peak stress magnitudes at the shaft–roof juncture reach approximately 110 MPa in the X-direction and 320 MPa in the Y-direction. As the subsidence displacement increases to 1.0 m, the X and Y-direction stress distributions retain the pattern observed at the 0.5 m level, yet the maximum stress values rise to nearly 160 MPa and 460 MPa, respectively, as depicted in Figure 6e,h. At a subsidence displacement of 1.5 m for the roadway’s roof, the stress values augment to about 190 MPa in the X-direction and 500 MPa in the Y-direction, as shown in Figure 6f,i.

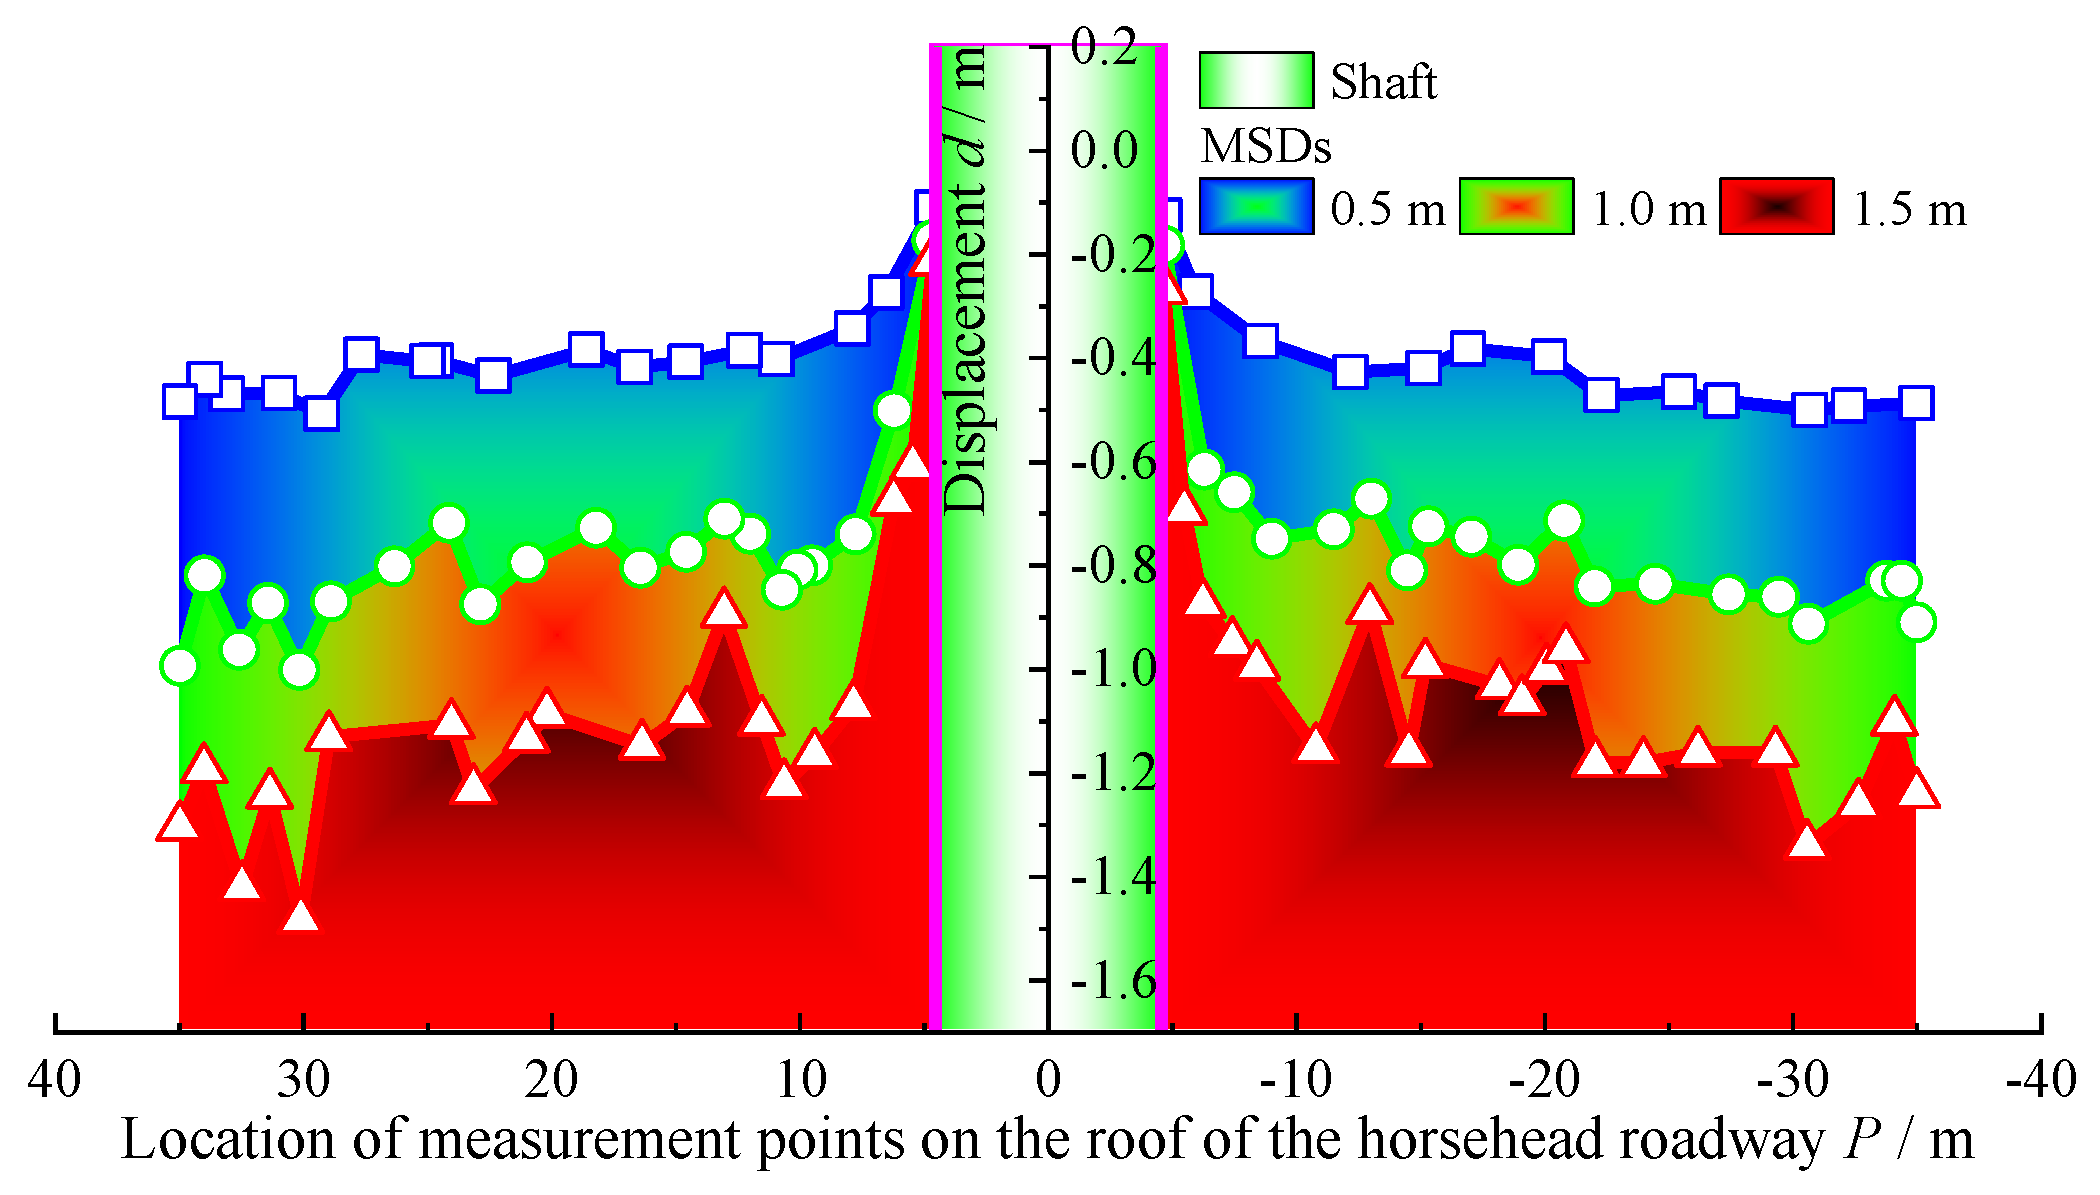
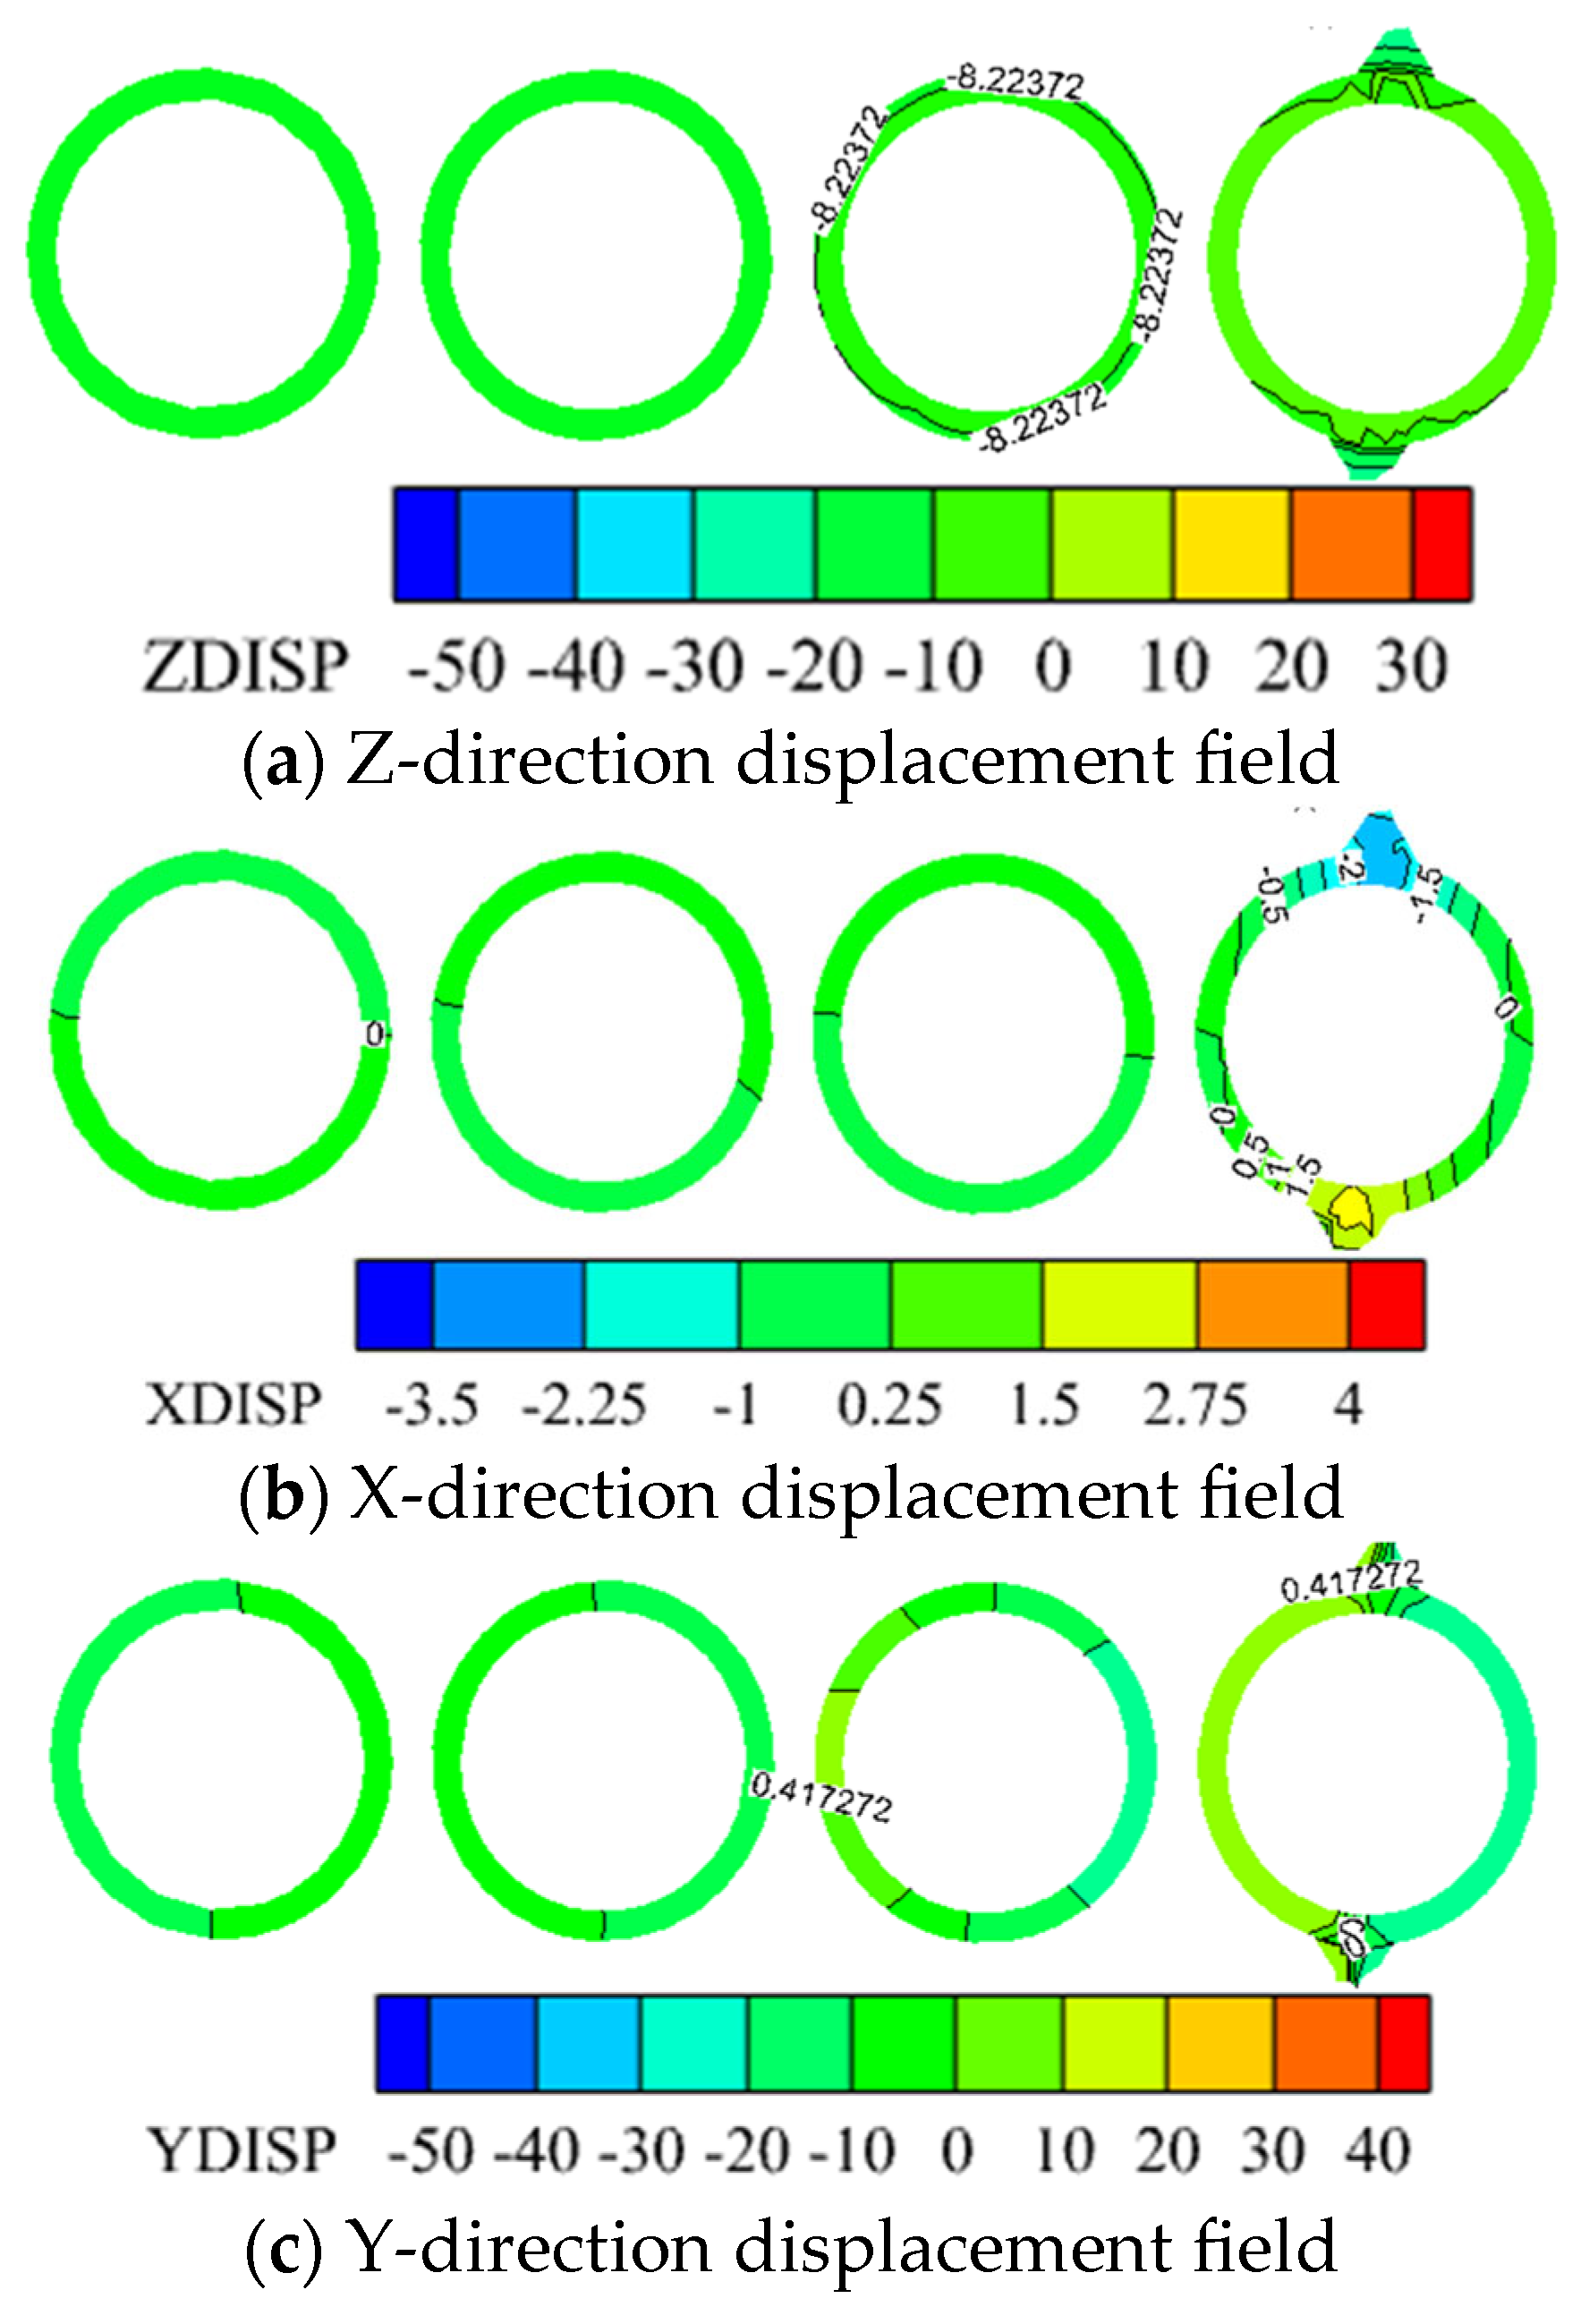
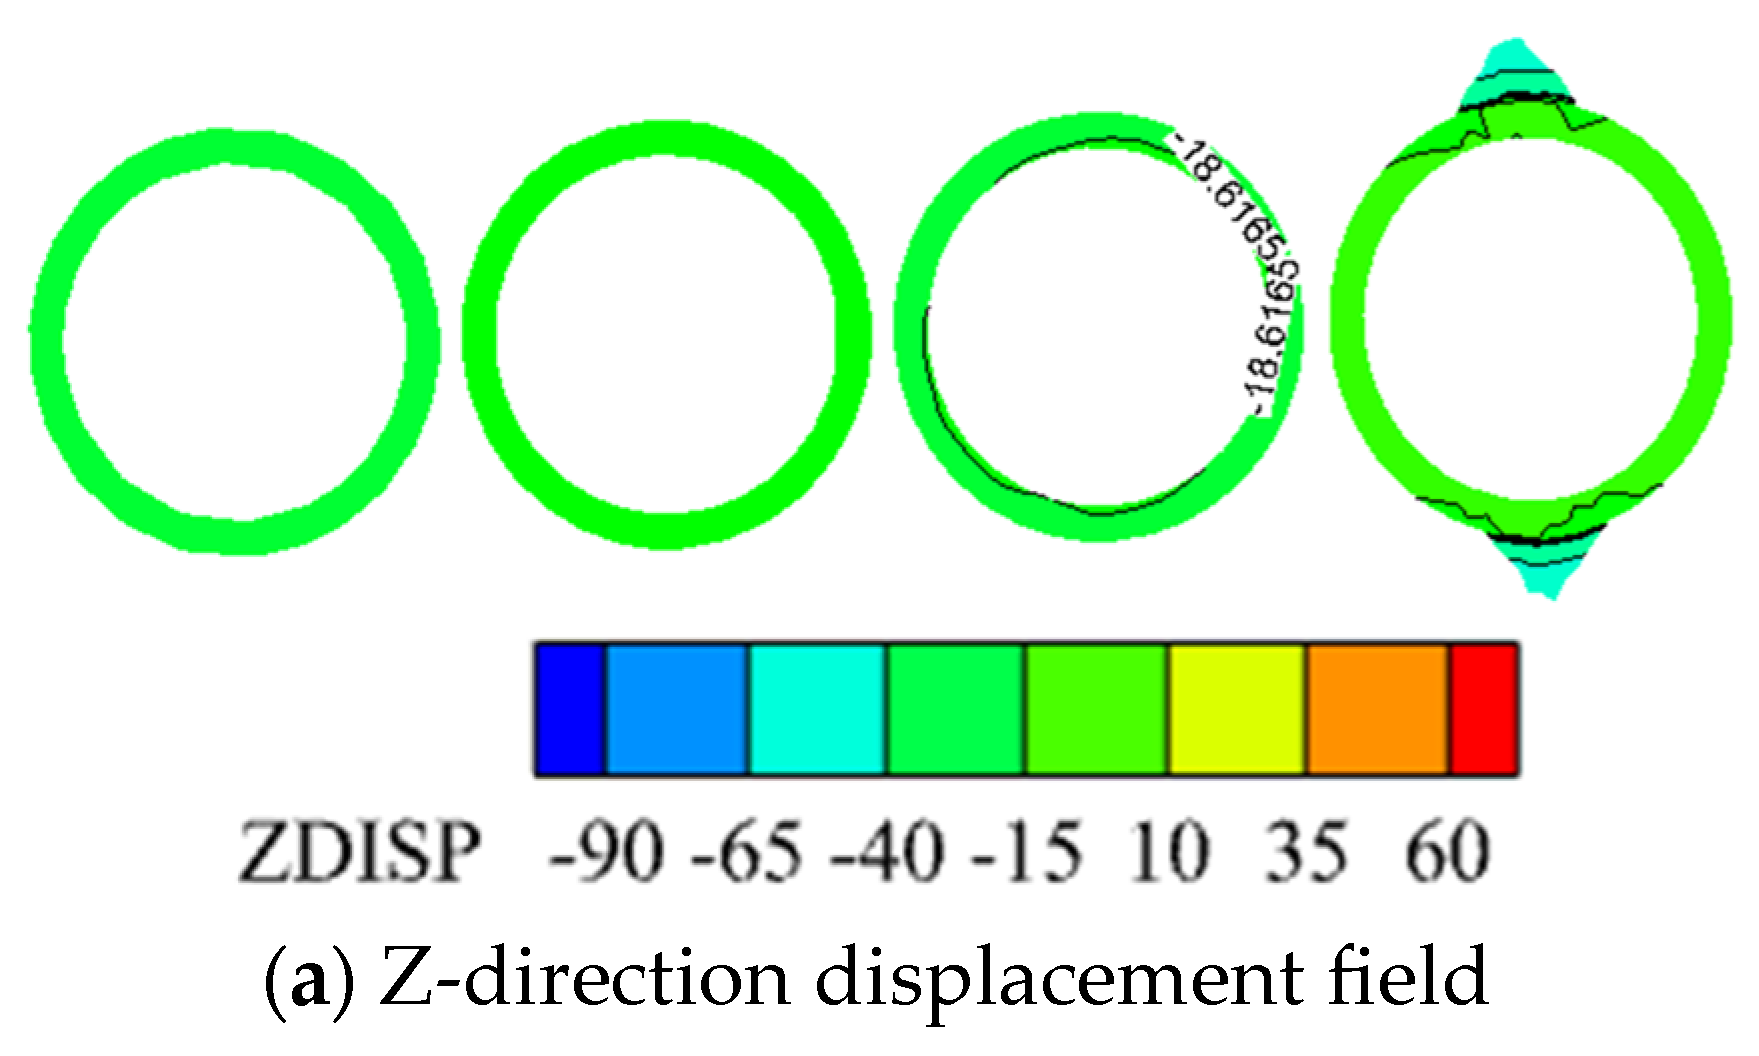
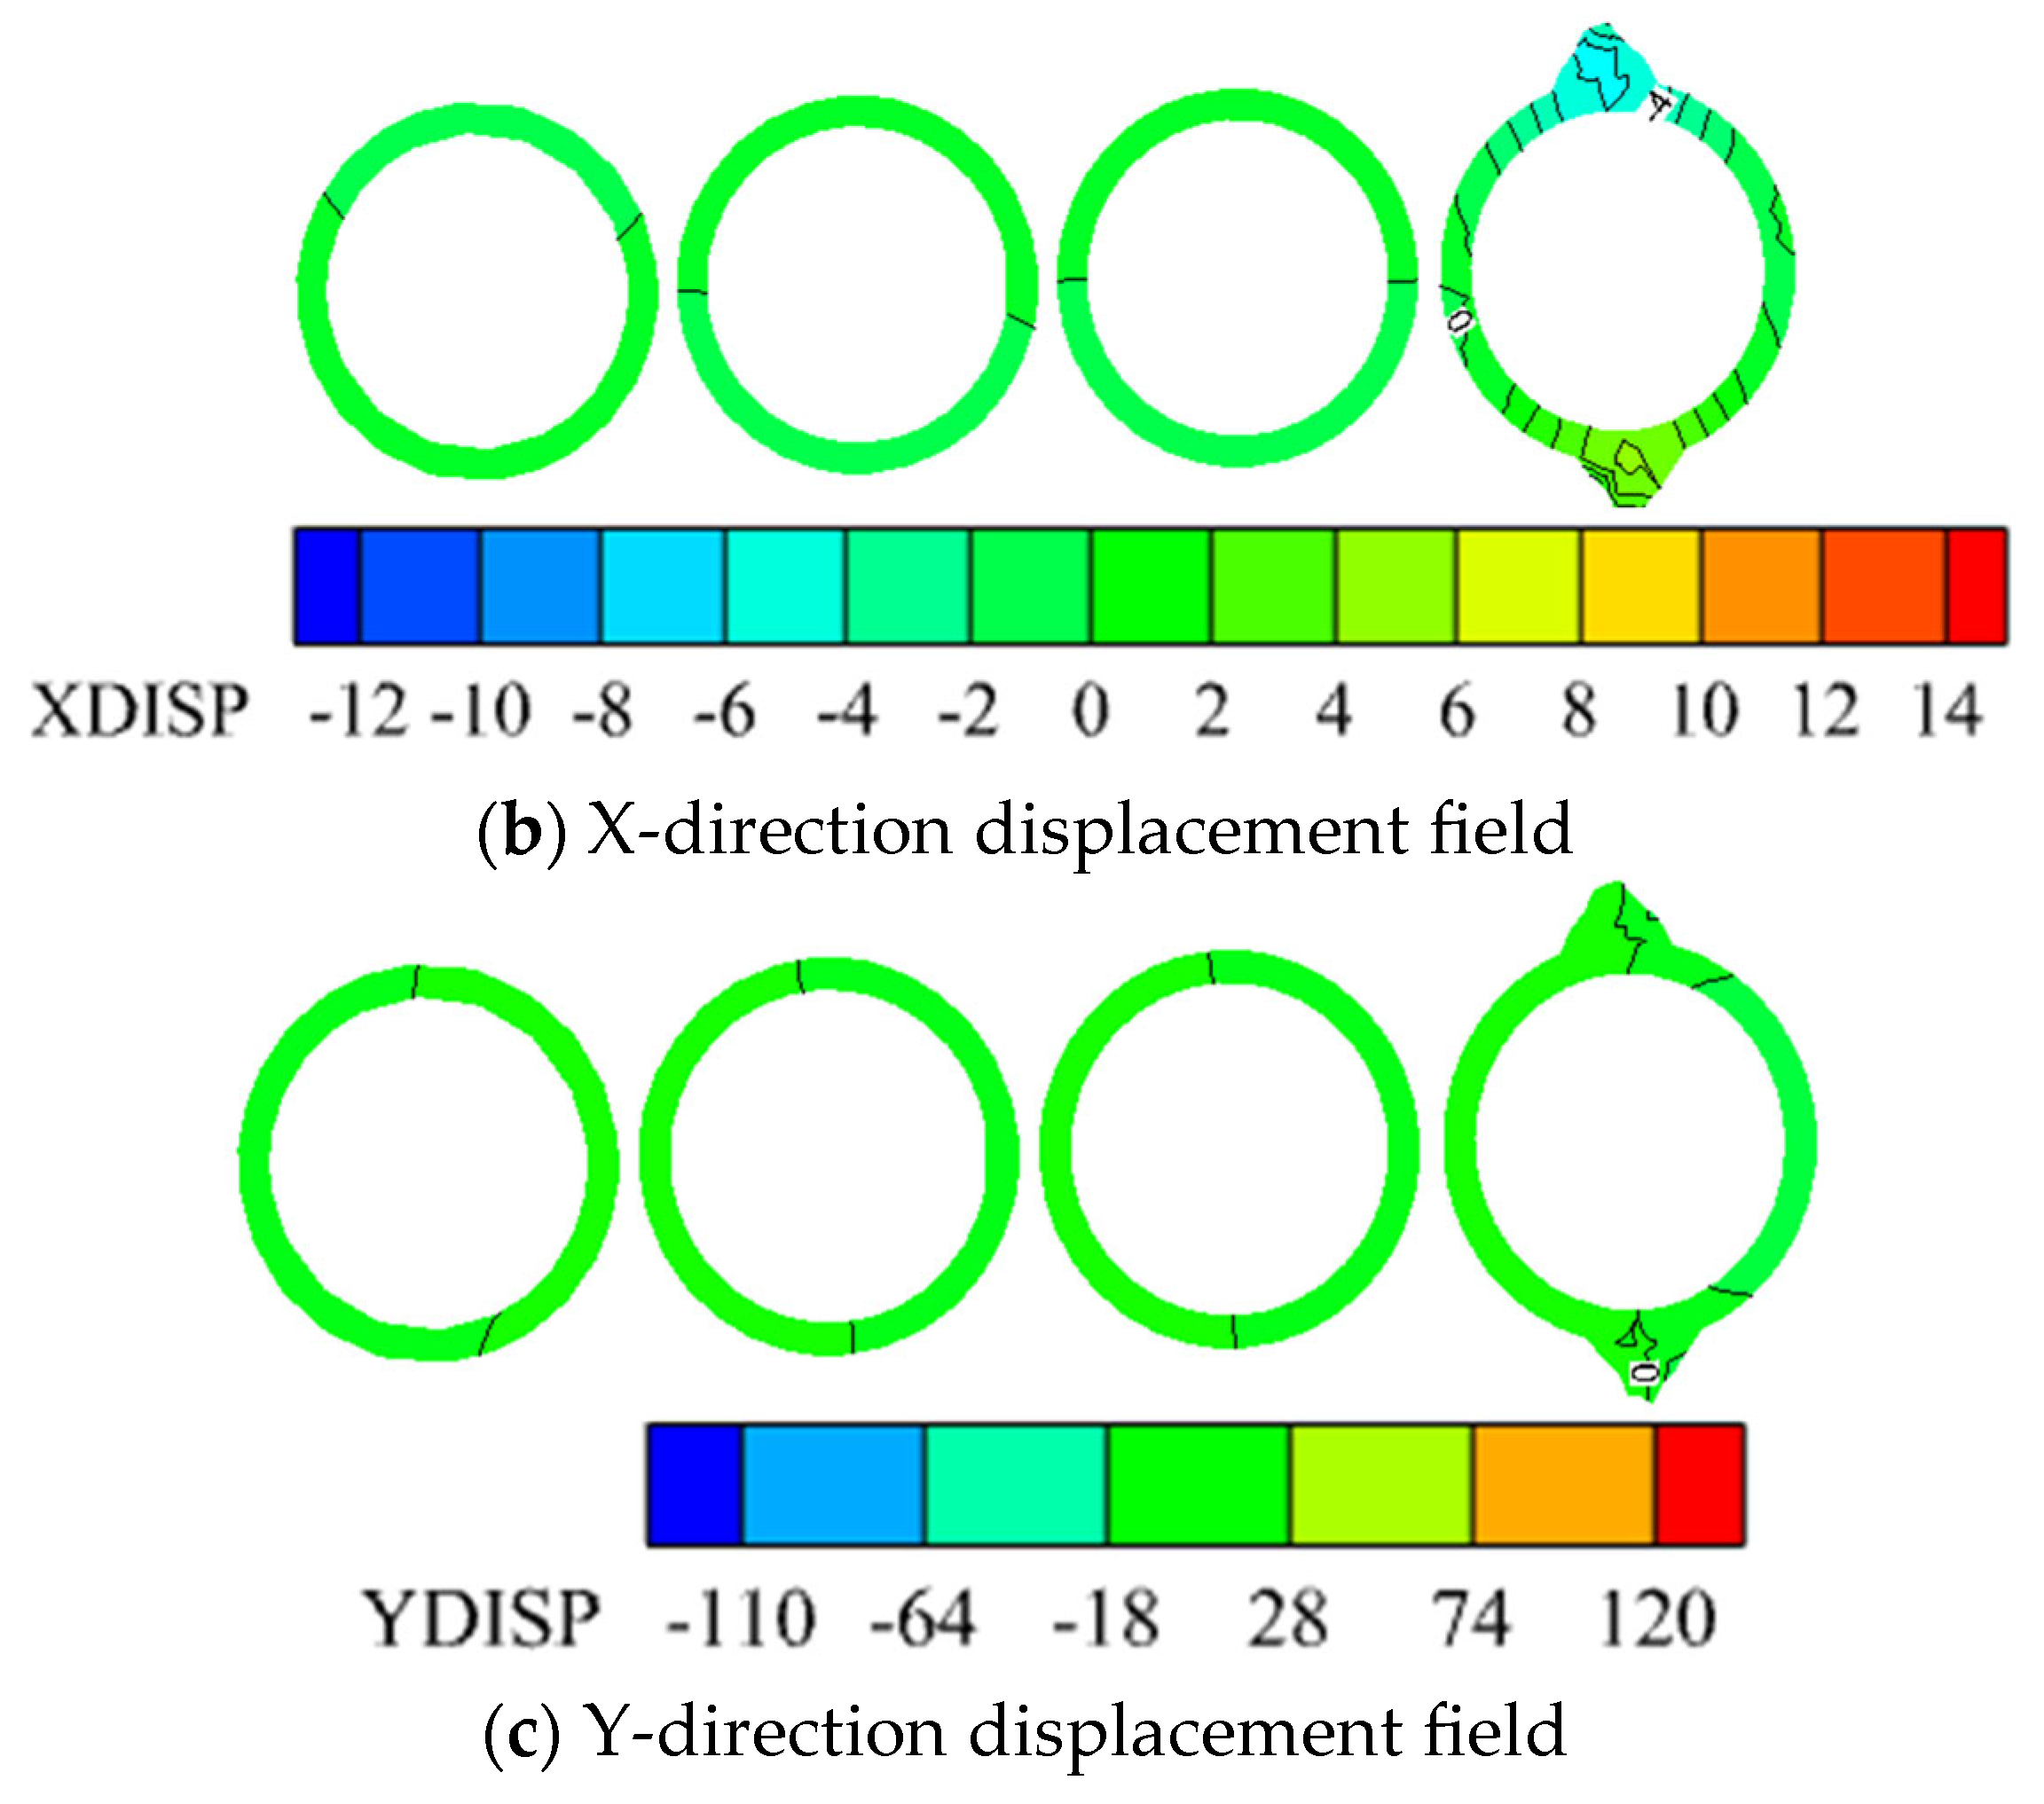
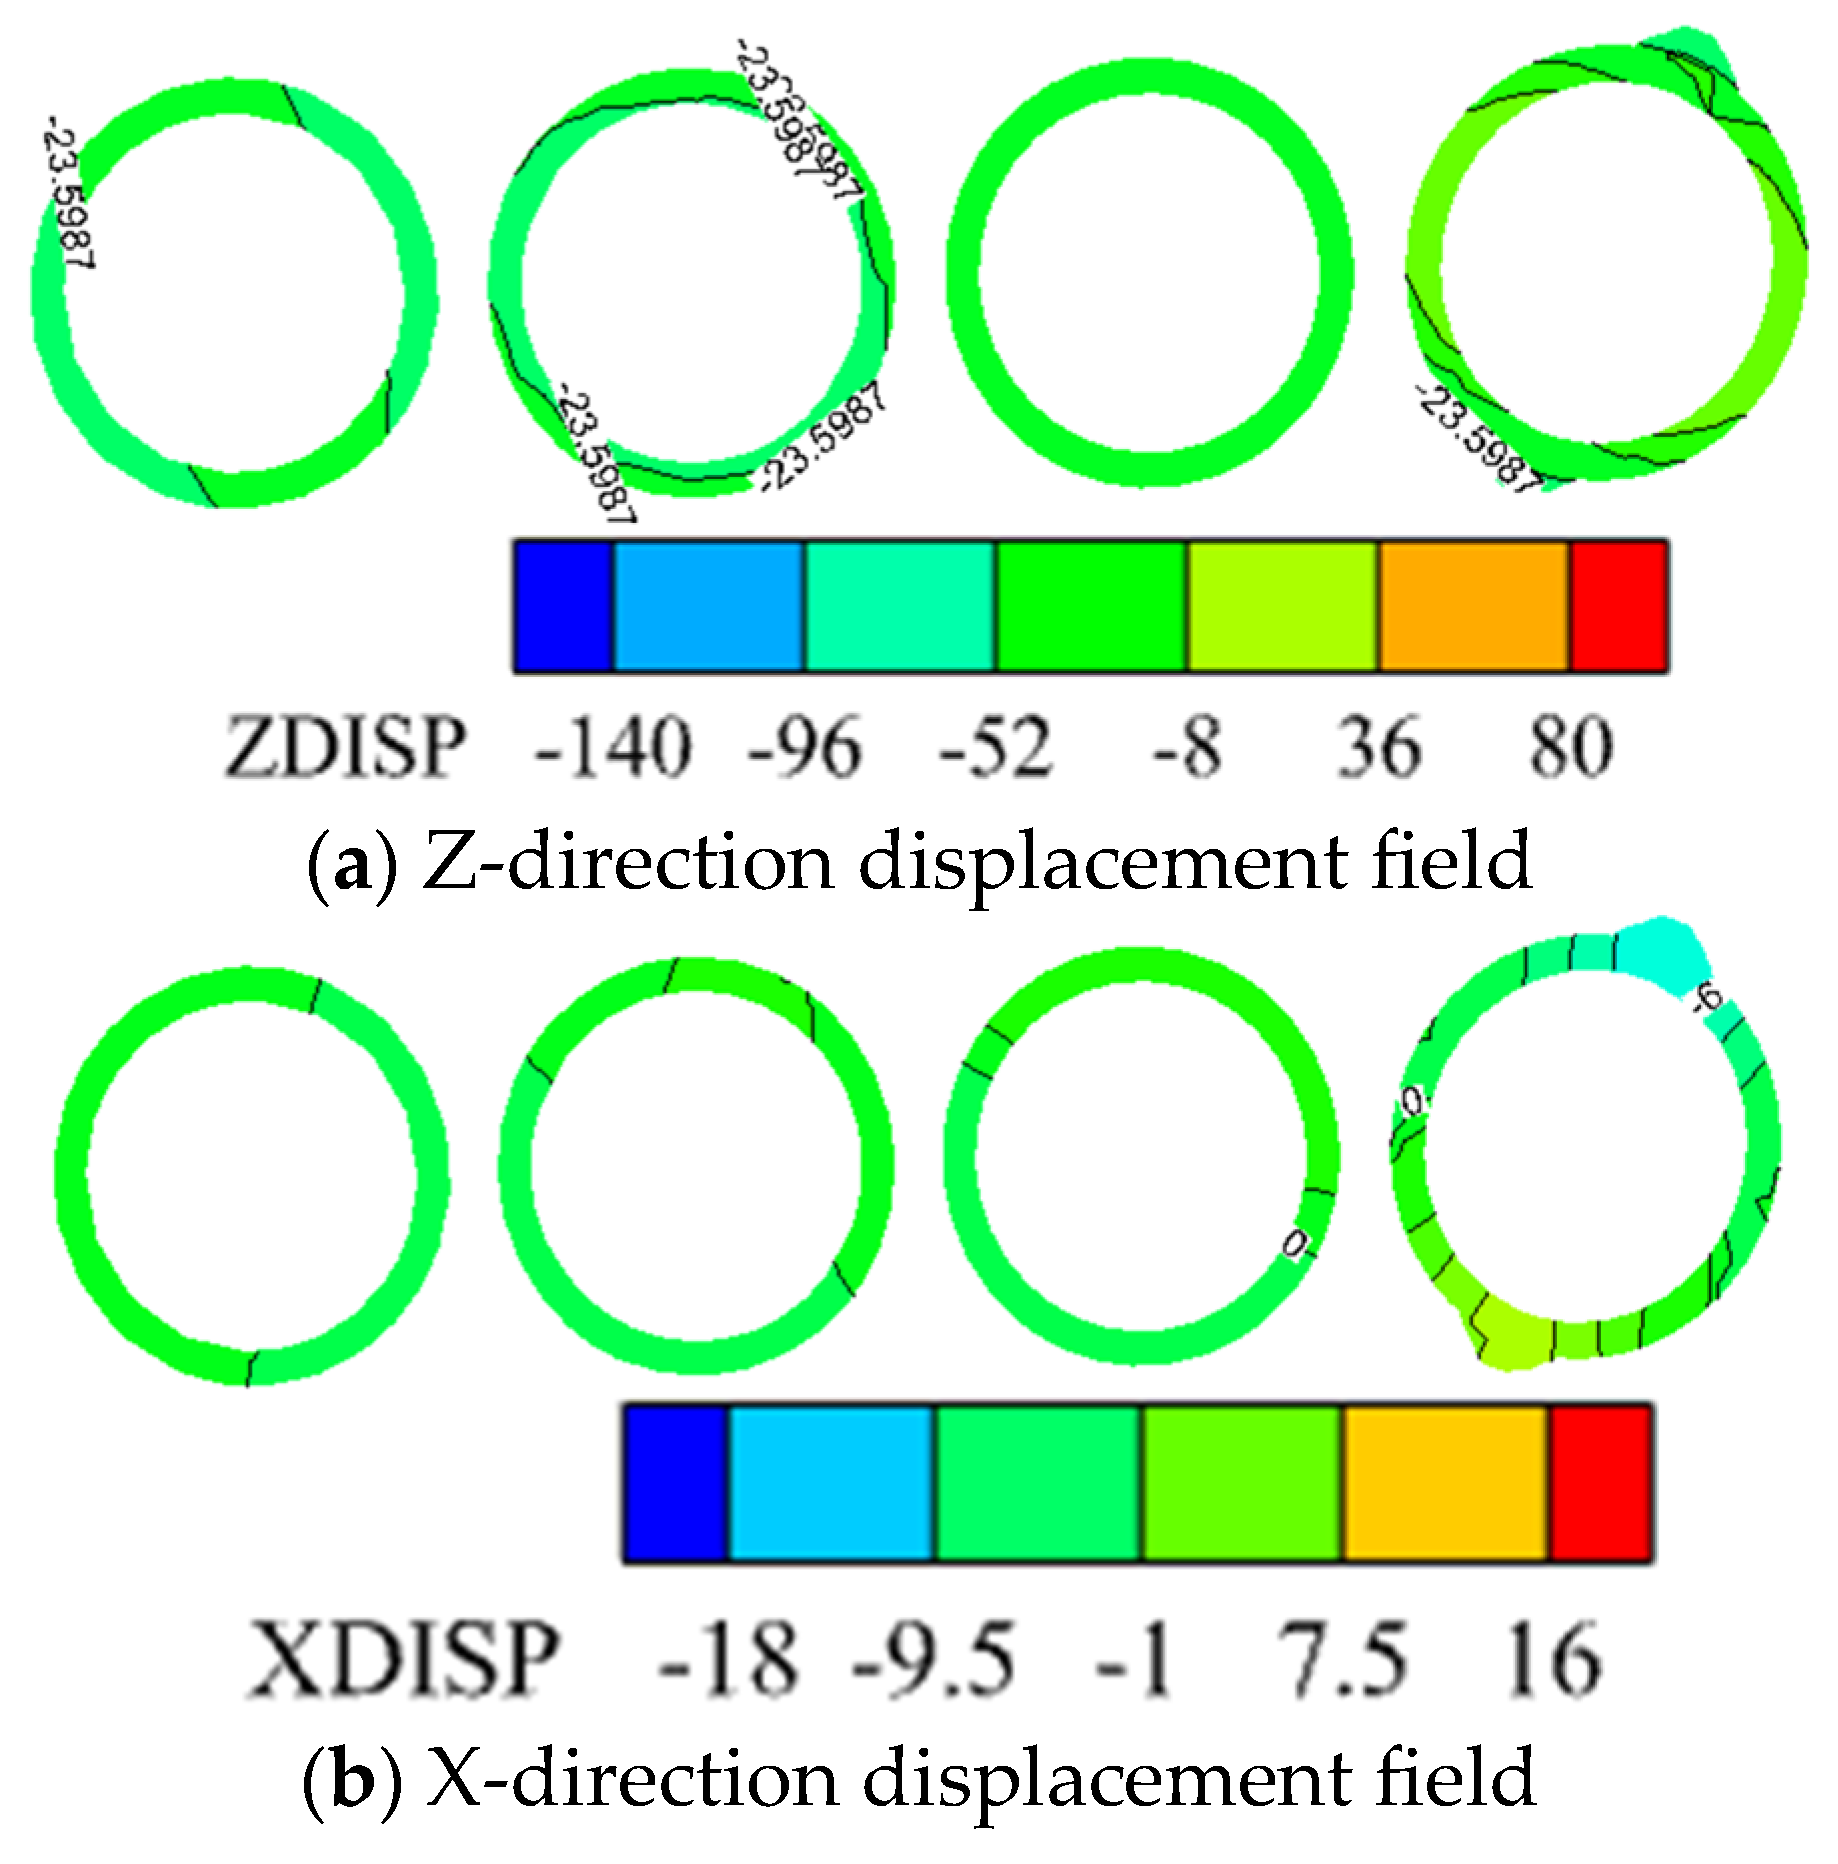
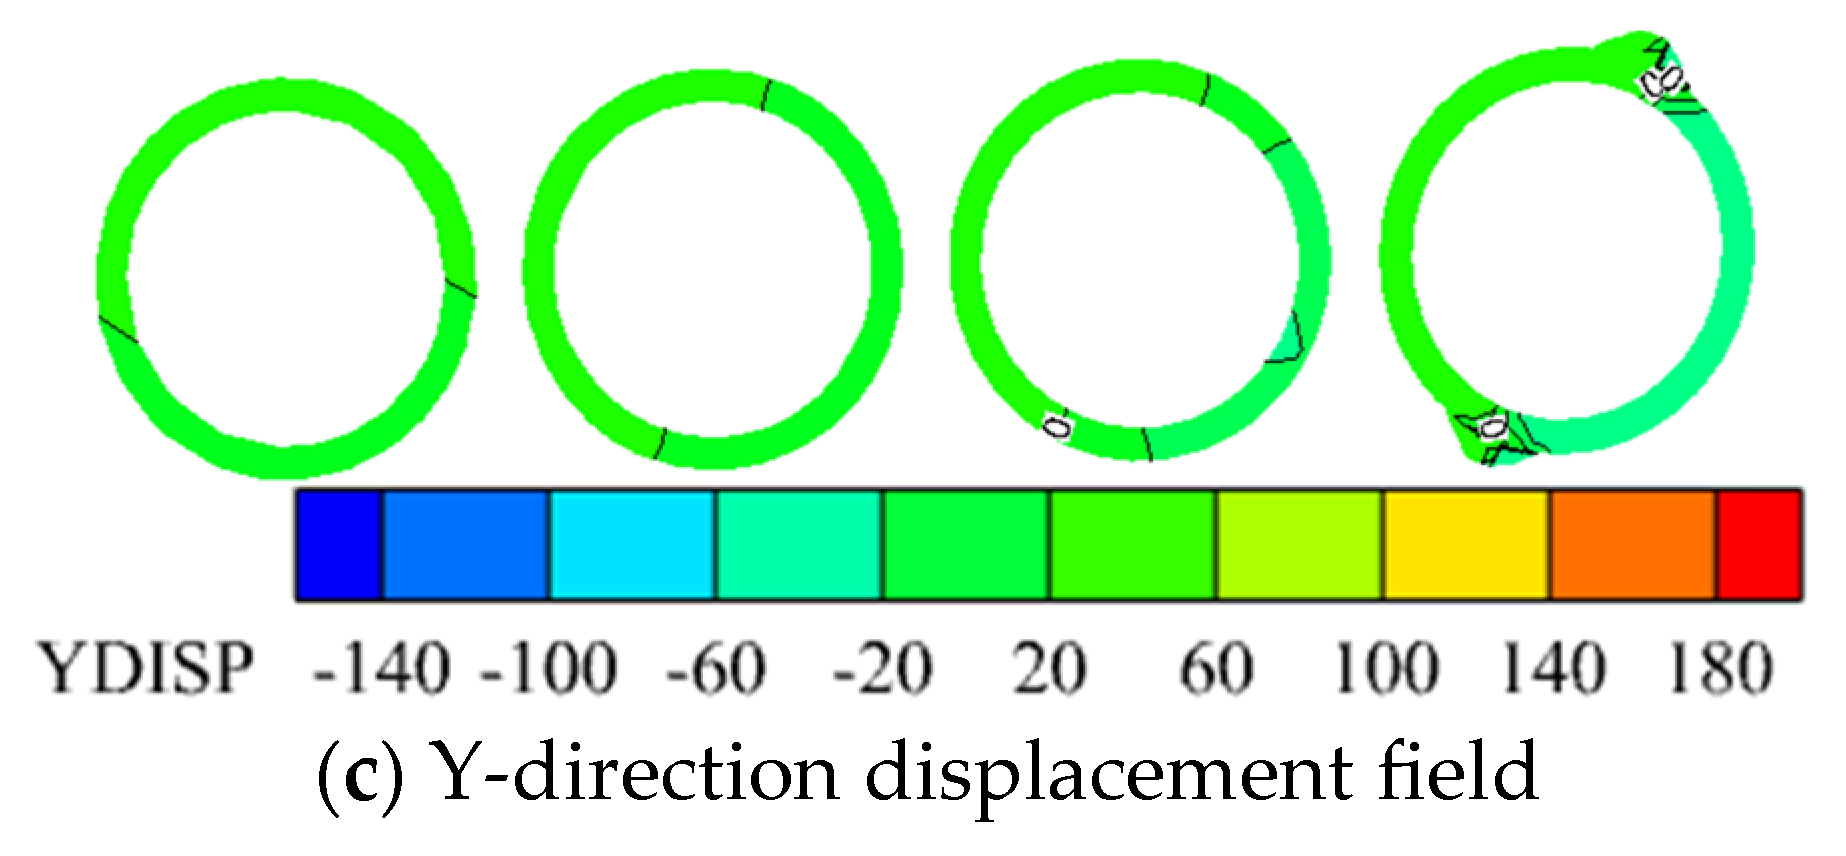
3.3. Three Directional Displacement Field of the Shaft

Upon a 0.5 m MSD of the horsehead roadway’s roof, Figure 7 illustrates the computed three-dimensional displacement field of the shaft. It is pertinent to note that the four Z-axis cross-sections, ordered from left to right with respect to the roadway’s roof, are situated at distances of approximately 100 m (representing the model’s top surface), 66 m, 33 m, and 0 m (corresponding to the location of the roadway’s roof), consistent with the configurations described subsequently. Analysis reveals minimal variance in shaft displacement across different elevations, with the Z-direction displacement nearing 8 cm (refer to Figure 7a). In the X and Y directions, the shaft’s MSD is observed at the junction with the horsehead roadway, registering modest values of roughly 1.5 cm and 0.5 cm, respectively (see Figure 7b,c). Synthesizing insights from the three-dimensional displacement field indicates that the shaft undergoes overall cohesive deformation, exhibiting no notable anomalies. Any potential fracturing or separation is most plausible at the interface between the shaft and the horsehead roadway.
When the MSD of the horsehead roadway’s roof reaches 1.0 m, Figure 8 presents the associated three-dimensional displacement field of the shaft. A pronounced discrepancy is observed in the shaft’s displacement at varying elevations in the Z-direction, with the peak displacement in this direction approximating 25 cm—an increment of 17 cm from the 0.5 m subsidence scenario. In the X and Y directions, the shaft’s MSD is once again noted at its junction with the horsehead roadway, registering modest values of approximately 4 cm and 0.5 cm, respectively. Analysis of the three-dimensional displacement field suggests a deviation from the previously observed collective deformation pattern of the shaft, with significant tensile fracturing in the Z-direction occurring within the upper 33 m of the horsehead roadway.
Upon further elevation of the horsehead roadway’s roof subsidence displacement to 1.5 m, the resulting three-dimensional displacement field of the shaft is depicted in Figure 9. The displacement across various elevations of the shaft shows negligible variance, with Z-direction displacement nearing 20 cm. Displacements in the X and Y directions are minimal, with the exception of the area where the shaft intersects the horsehead roadway. The substantial settling of the rock stratum at the roadway’s roof has induced a general subsidence of the shaft within the model’s confines. Owing to the structural symmetry between the horsehead roadway and the shaft, the shaft has not exhibited significant lateral deviation, as confirmed by the research of Shi et al. [39].

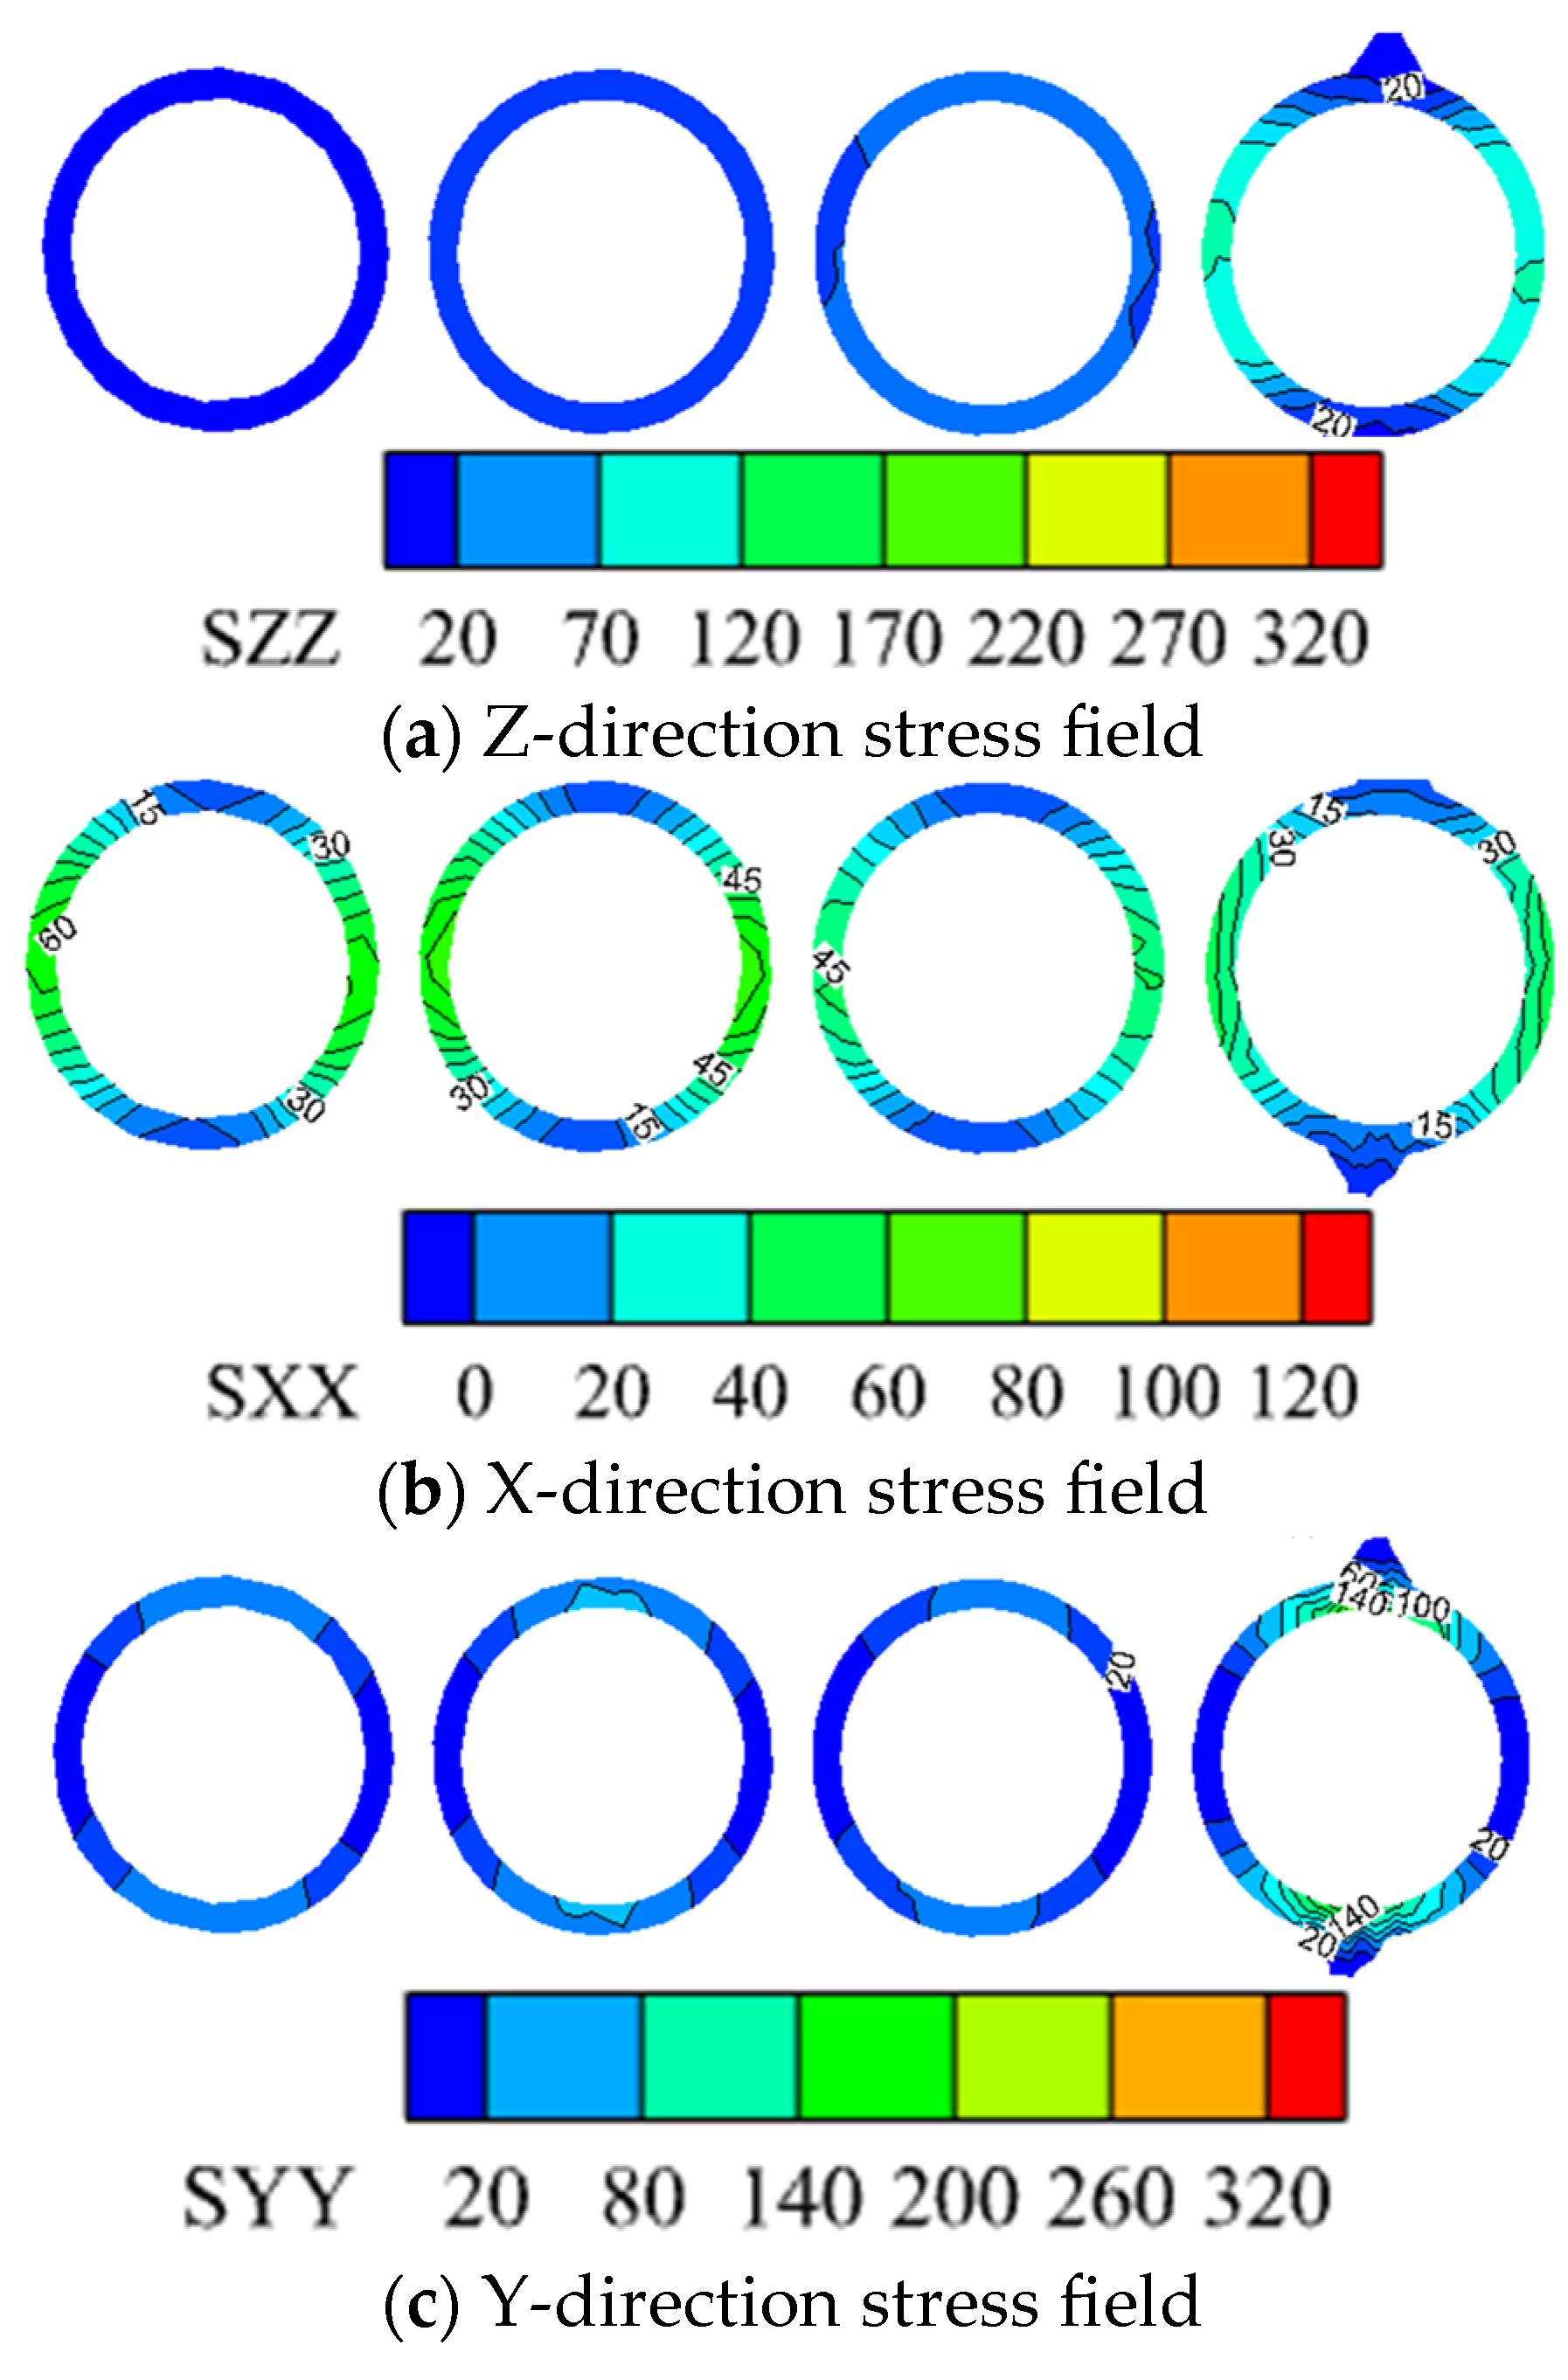
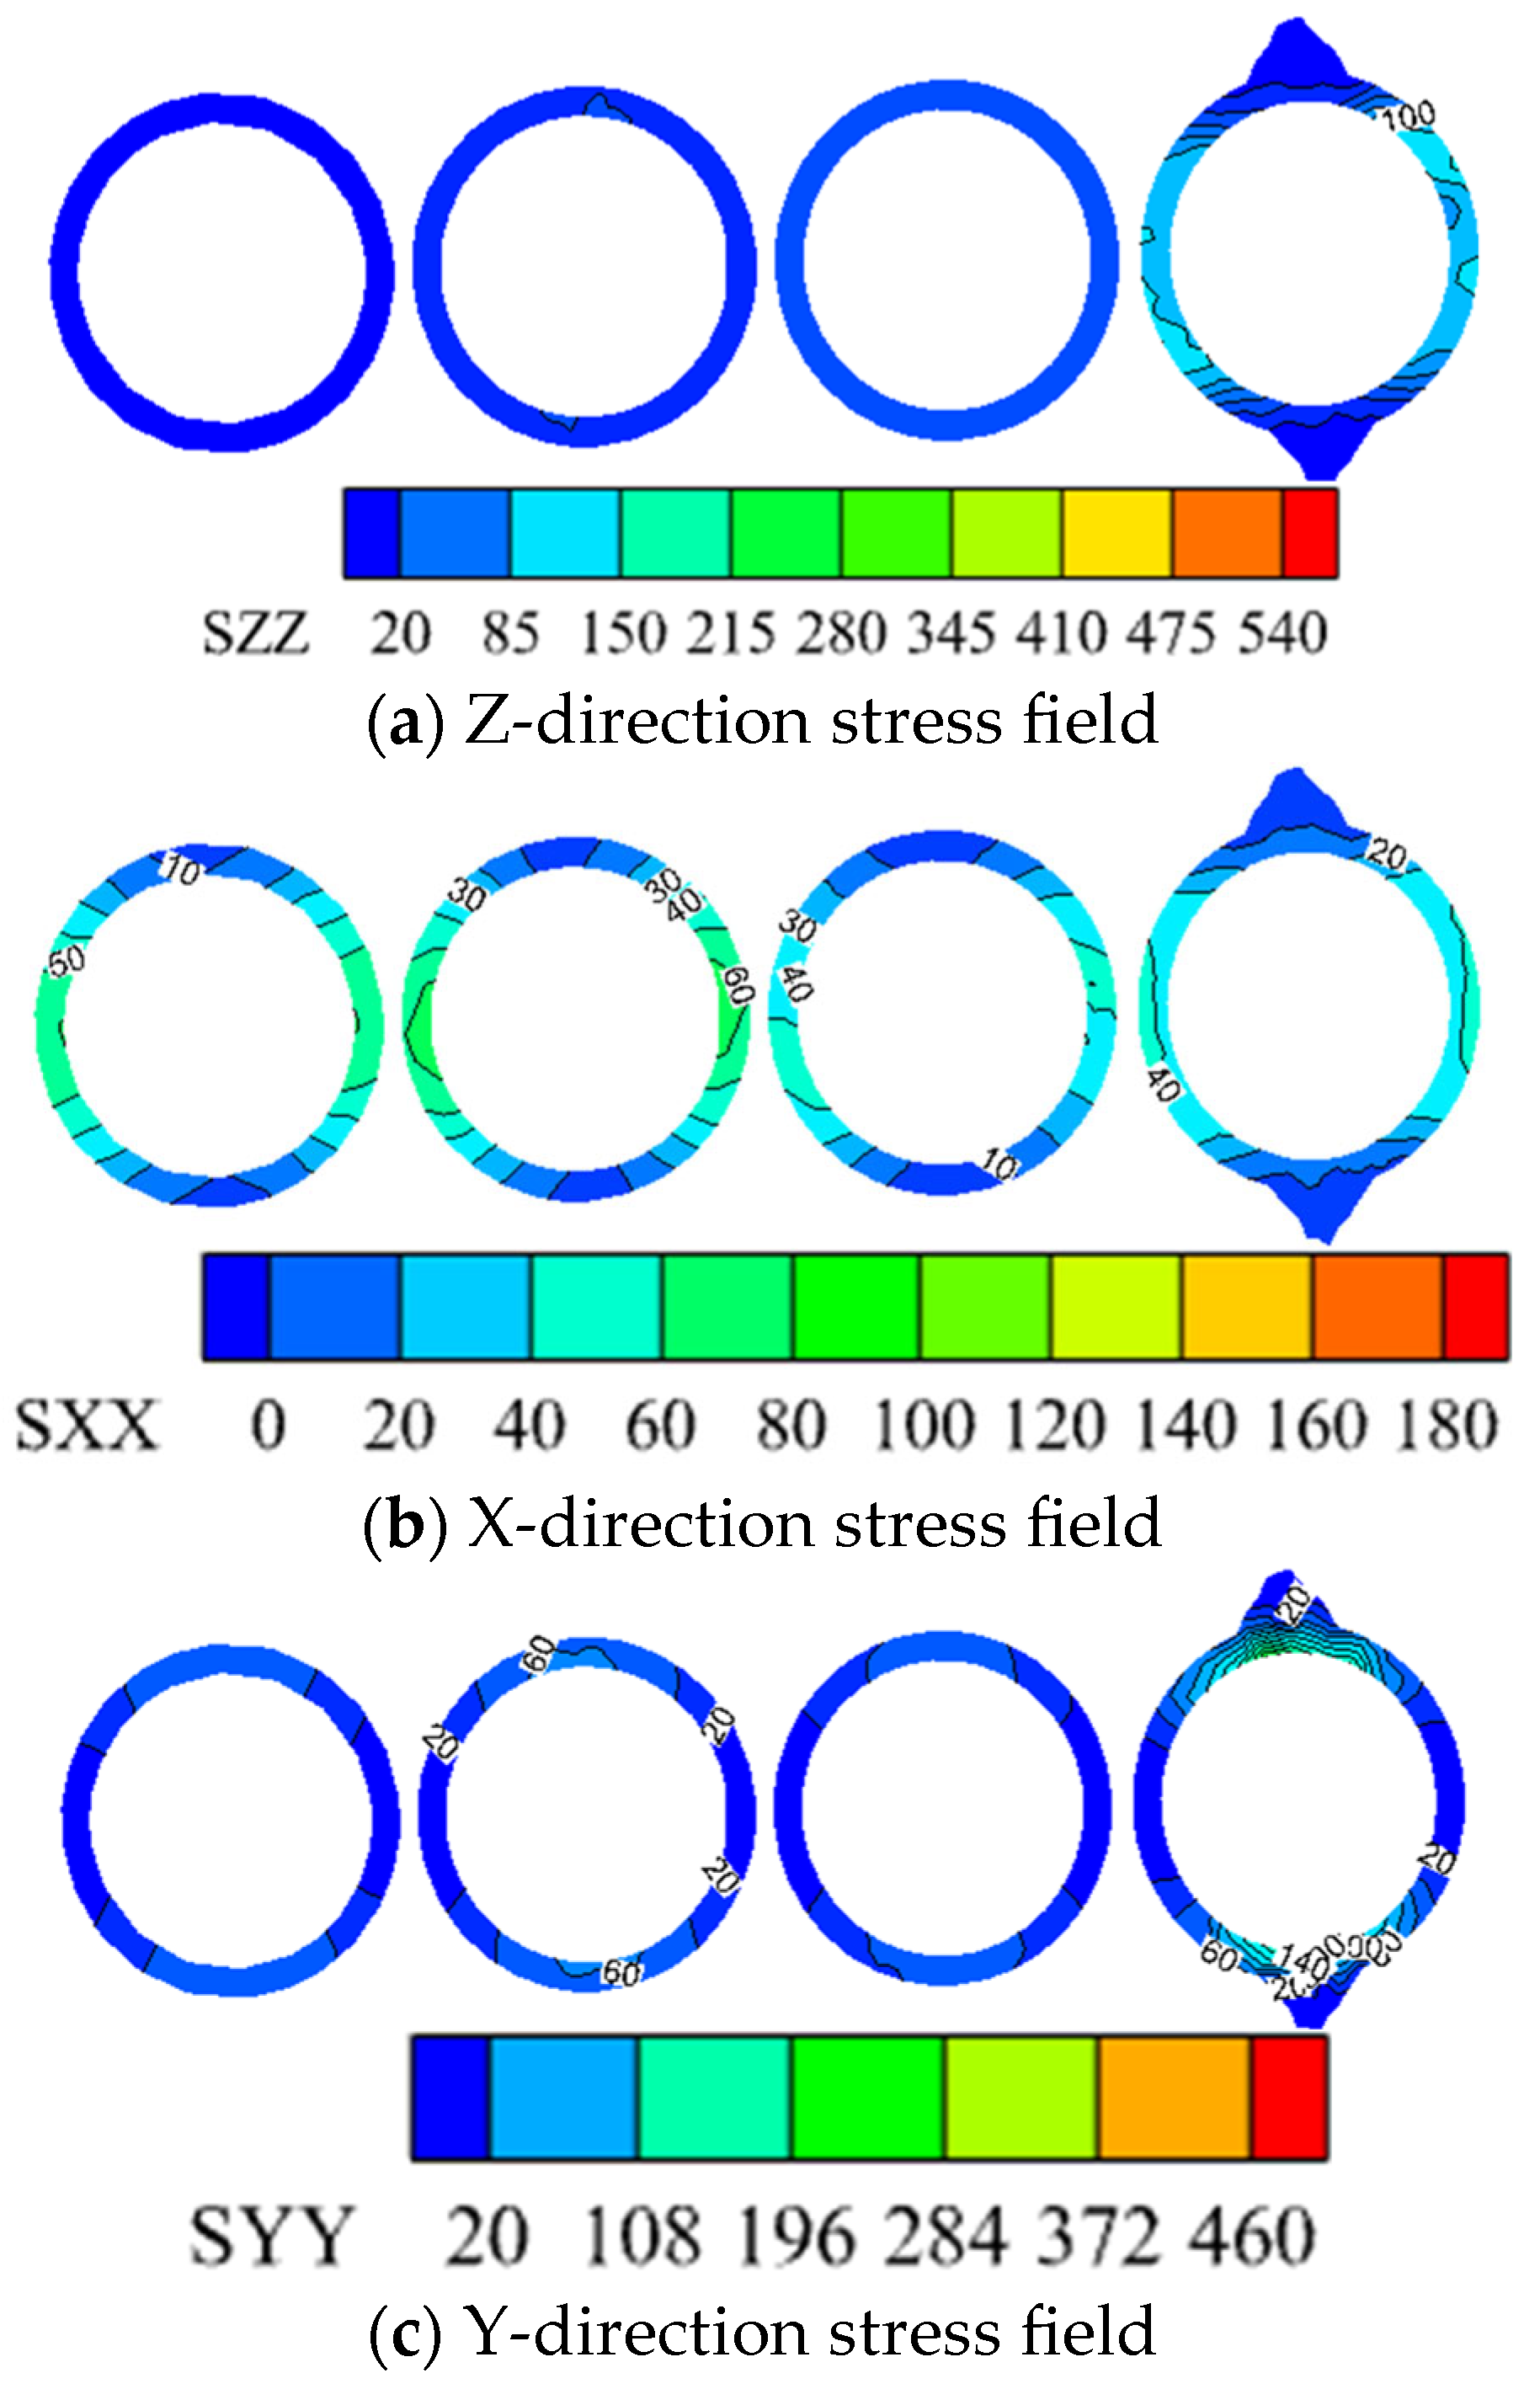
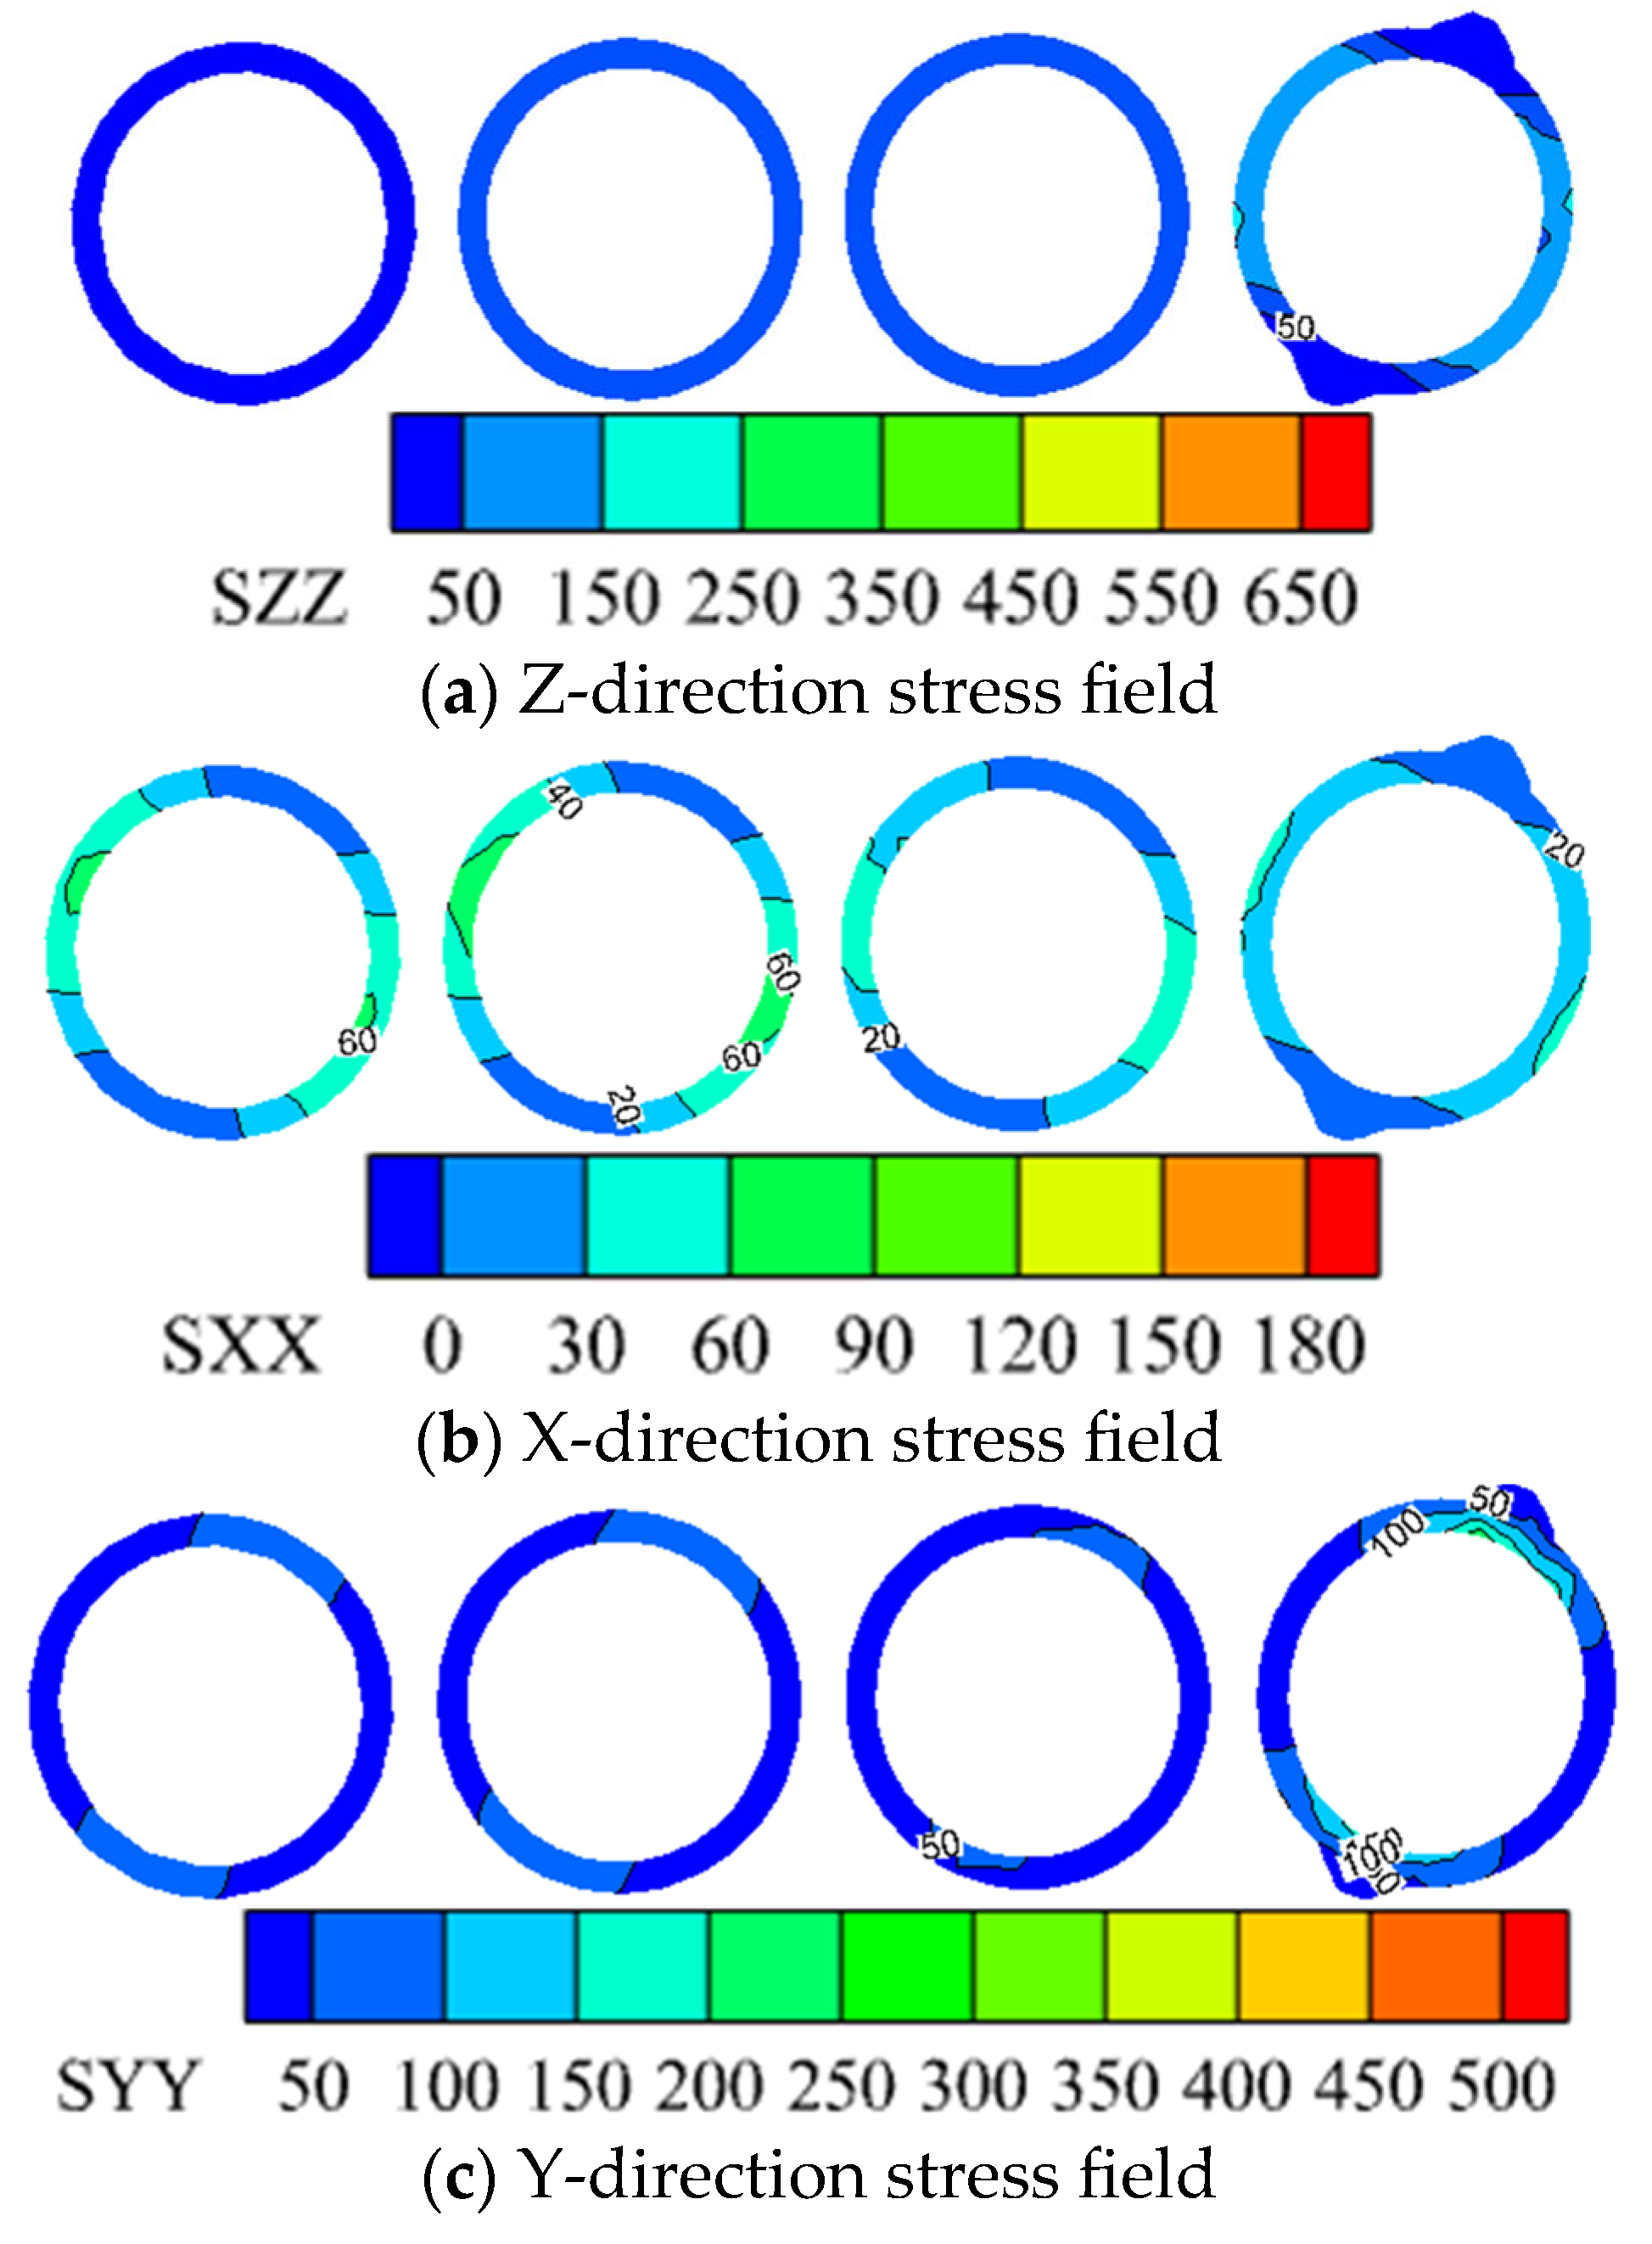
3.4. Three Directional Stress Fields of the Shaft

With the MSD of 0.5 m at the horsehead roadway’s roof, the derived three-dimensional stress field of the shaft is depicted in Figure 10. In the Z-plane, the distribution of stress in the Z-direction exhibits minor variations; however, there are pronounced disparities in this stress component at different shaft elevations (see Figure 10a). At the model’s apex, Z-direction stress registers approximately 20 MPa, markedly increasing to about 160 MPa at the interface of the shaft and the horsehead roadway, where it is oriented perpendicularly to the roadway’s axis. Lateral pressure coefficients predominantly influence the X-direction stress, which fluctuates within the Z-plane between 0 and 60 MPa, displaying relatively uniform distribution across elevations (see Figure 10b). The stress in the Y-direction not only exhibits significant variability within the Z-plane but also intensifies in proximity to the horsehead roadway, peaking at the shaft–roadway nexus with an estimated value of around 140 MPa (see Figure 10c).
With the MSD of the horsehead roadway’s roof escalating to 1.0 m, Figure 11 delineates the resultant three-dimensional stress field of the shaft. While the variability in Z-direction stress within distinct Z-planes remains minor, notable disparities emerge at the interface of the shaft and the roadway’s roof. This contrast is particularly significant at different shaft elevations (see Figure 11a). For example, the stress in the Z-direction at the model’s summit is approximately 20 MPa, yet it surges to 180 MPa at the shaft–roadway junction. Influenced by the lateral pressure coefficient, the stress in the X-direction predominantly varies within the Z-plane, exhibiting a range from 0 to 70 MPa (see Figure 11b). The stress in the Y-direction not only increases proximal to the horsehead roadway but also peaks at the shaft–roadway connection, where the maximum stress escalates to 180 MPa (see Figure 11c).
Upon the maximum subsidence displacement of the horsehead roadway’s roof escalating to 1.5 m, the resulting three-dimensional stress field of the shaft is depicted in Figure 12. The comparative distribution pattern of the stress remains relatively stable, yet the stress magnitudes exhibit substantial elevation. Specifically, the Z-direction stress at the model’s apex approximates 20 MPa, in stark contrast to the stress at the shaft–roadway junction, which intensifies to approximately 200 MPa (see Figure 12a). Within the Z-plane, the X-direction stress undergoes minimal fluctuations, with values spanning from 0 to 70 MPa (see Figure 12b). Meanwhile, the stress in the Y-direction witnesses its maximum magnitude rising to an estimated 200 MPa (see Figure 12c).

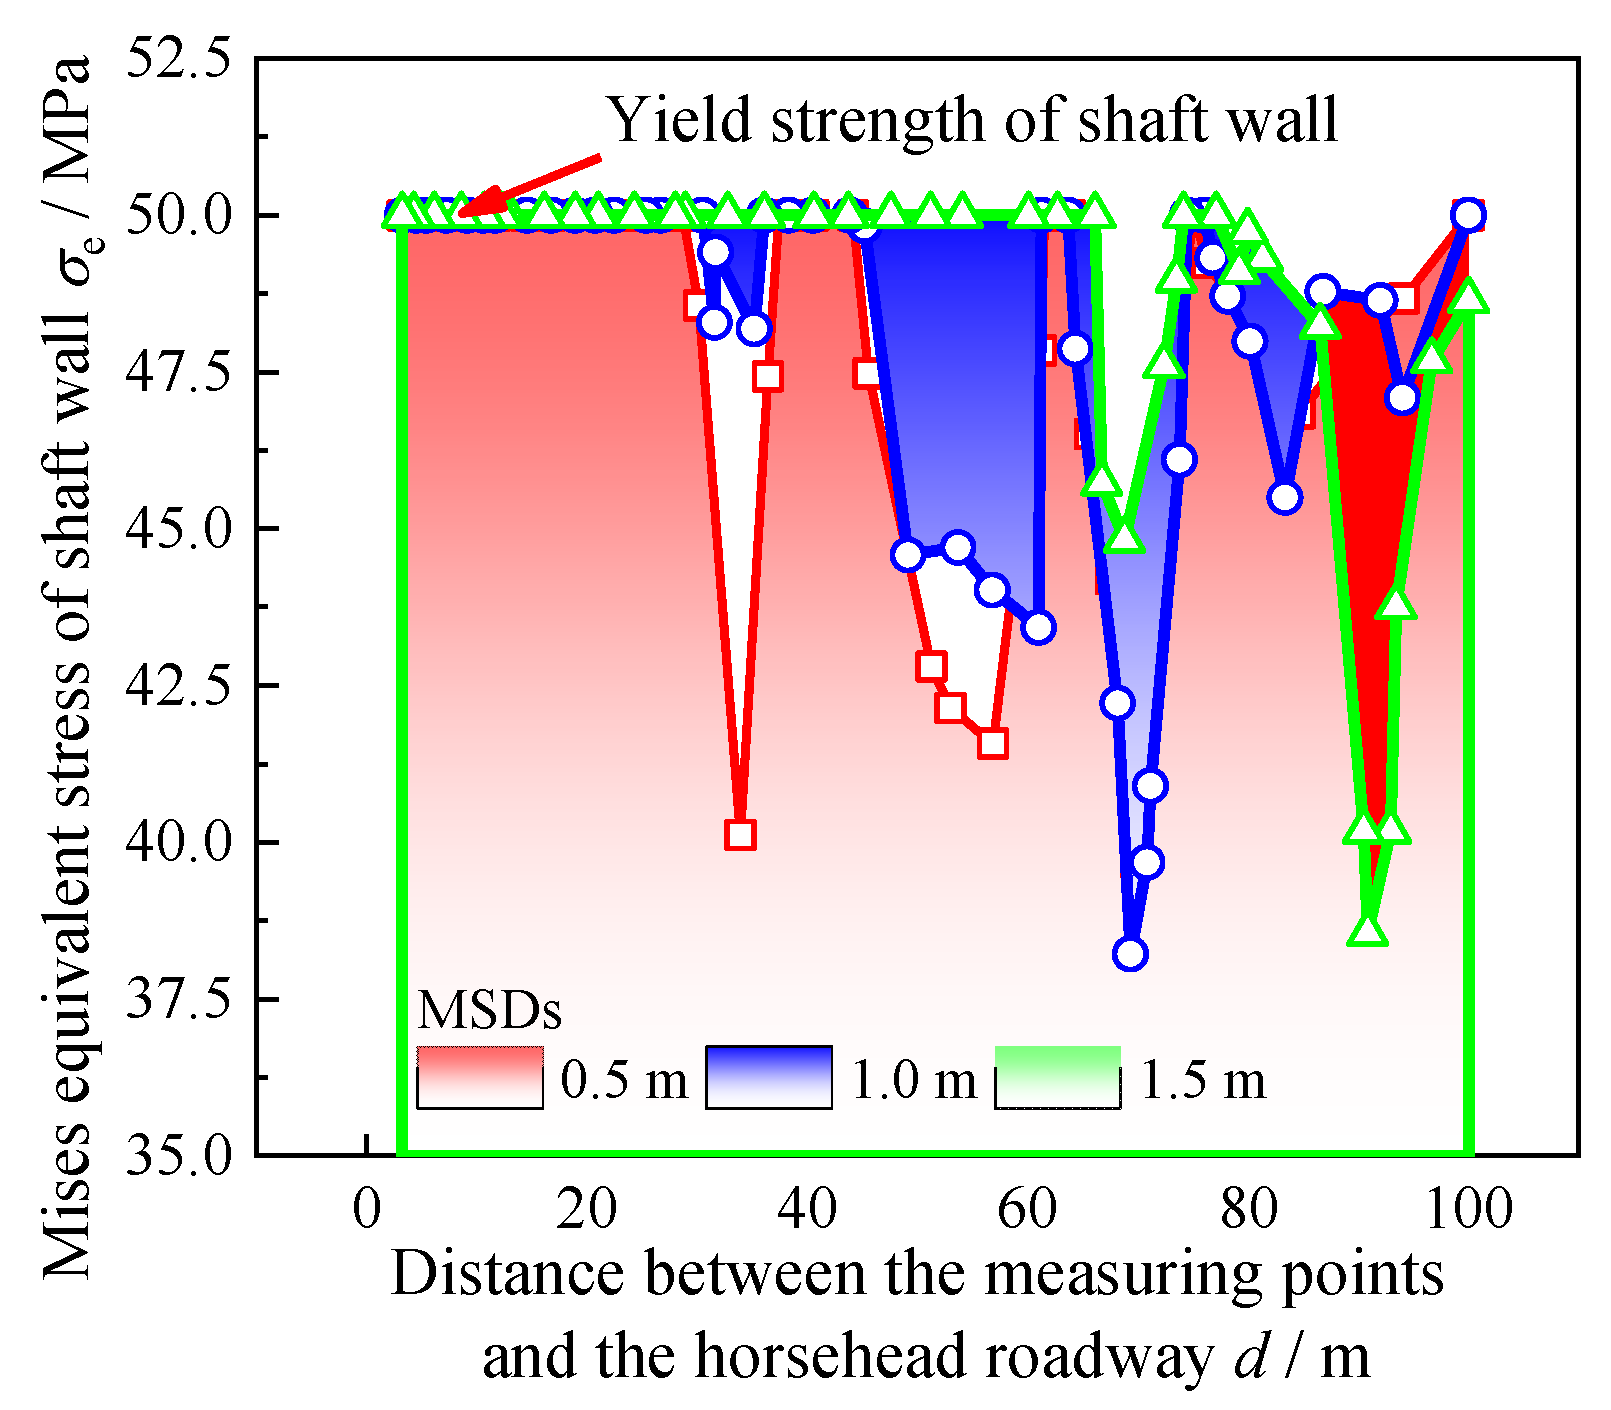
3.5. Distribution of Mises Equivalent Stress for Shaft

As depicted in Figure 13, the distribution of Mises equivalent stress along the shaft wall was analyzed for MSDs of the horsehead roadway’s roof at 0.5 m, 1.0 m, and 1.5 m. The results show that the Mises equivalent stress on the shaft wall does not exceed 50 MPa, regardless of the subsidence displacement magnitude. This observation correlates with the material properties of the C50 concrete lining employed in the shaft wall construction, which has an approximate strength of 50 MPa (refer to Section 2.2). Hence, when the Mises stress reaches the threshold of 50 MPa, it signifies the onset of plastic deformation and potential failure at that location of the shaft wall [12,39,42]. Consequently, the analysis indicates that the widest yield range in the shaft wall corresponds to a subsidence displacement of 1.5 m, with a plastic yield state extending up to 63 m above the horsehead roadway.
Upon reaching subsidence displacements of 1.0 m and 1.5 m in the horsehead roadway, a more pronounced intermittent pattern of plastic yield emerges along the upper portion of the shaft wall, with exceptions noted in the intervals at 35–40 m, 45–62 m, and above 65 m from the roadway’s roof, where no plastic failure is observed. Conversely, plastic failure is evident at 40–45 m and 62–65 m from the horsehead way, which, as per Table 1, corresponds to mudstone strata (highlighted in bold in the table). This suggests that the weaker mechanical properties and lower load-bearing capacity of these mudstone layers contribute to significant deformation, heightening the risk of shaft wall damage. Notably, the extent of the plastic yield intervals is reduced when the subsidence displacement reaches 1.5 m compared to 1.0 m. This observation substantiates the premise that greater subsidence displacement of the horsehead roadway’s roof correlates with an expanded damage zone within the shaft.

4. Discussion

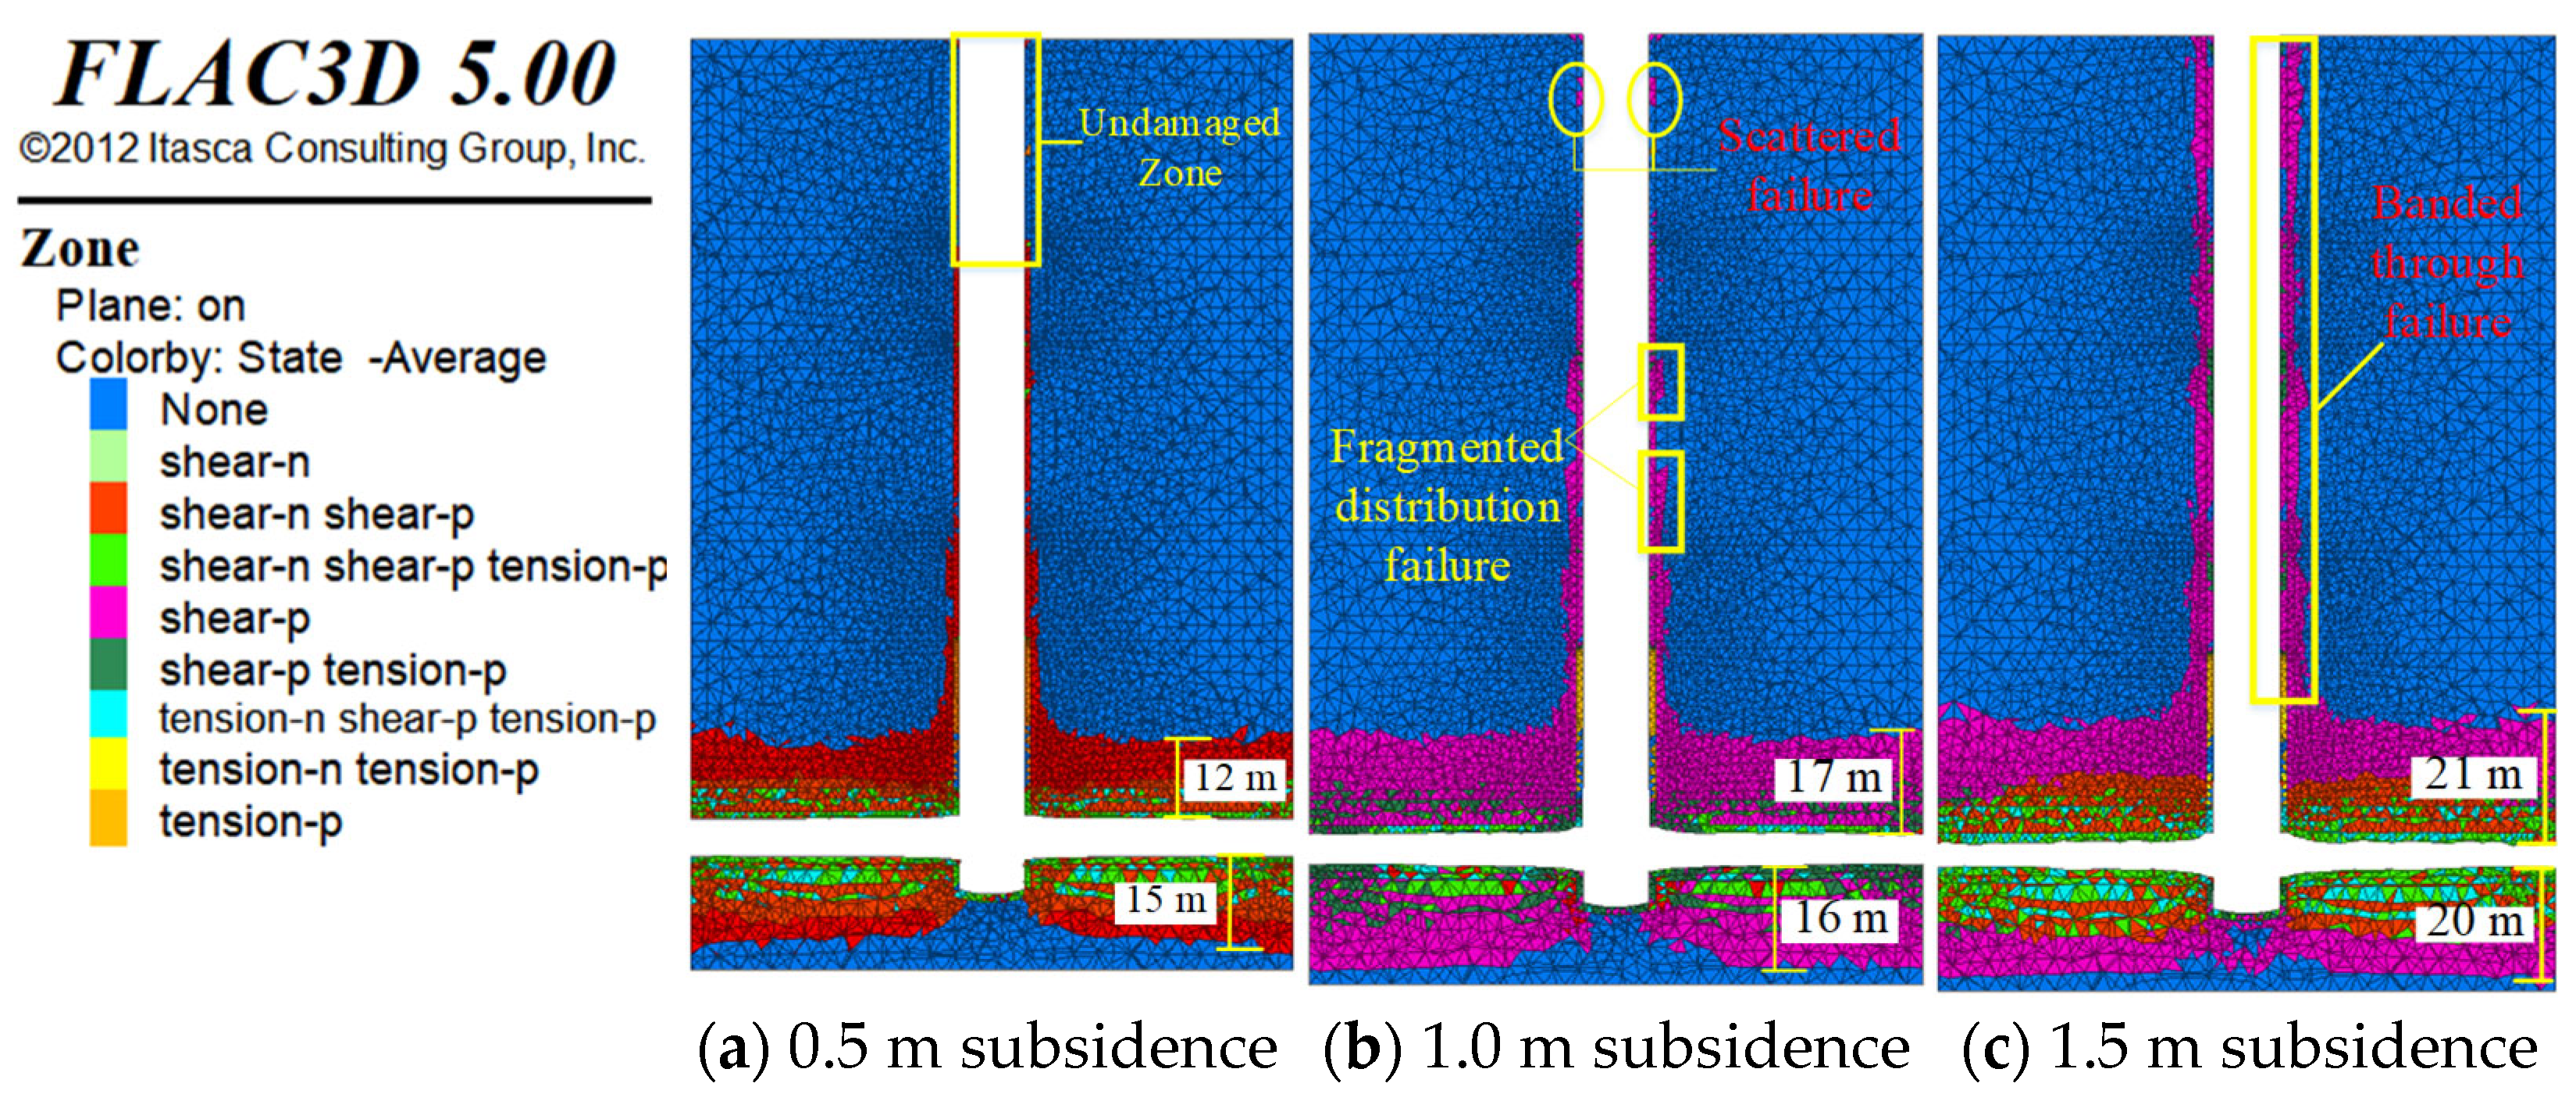
4.1. Overall Failure Mode of the Model

The failure patterns of the model corresponding to MSDs of 0.5 m, 1.0 m, and 1.5 m in the horsehead roadway’s roof are depicted in Figure 14. The model reveals that element failure predominately occurs within the rock mass located both above and below the horsehead roadway and at the shaft’s vicinity [43,44,45]. For instance, at a subsidence displacement of 0.5 m, the extent of rock damage above the horsehead roadway extends approximately 12 m, with the damage below reaching about 15 m. Damage diminishes with increasing distance from the horsehead roadway; notably, shaft elements situated over 75 m away exhibit no damage, as indicated by the yellow rectangular box in Figure 14a. When subsidence displacement increases to 1.0 m, the damaged rock area above the horsehead roadway expands to roughly 17 m, and the lower portion to about 16 m. In this scenario, the shaft elements beyond 75 m from the roadway show isolated instances of damage, as highlighted by the yellow elliptical box in Figure 14b. Additionally, a significant escalation in the damage range of the surrounding rock is observed at mid-shaft levels, as demarcated by the yellow rectangular box in Figure 14b.
With the horsehead roadway’s roof subsidence displacement reaching 1.5 m, the damage extent in the rock above the roadway further extends to approximately 21 m, while below it increases to about 20 m. There is a discernible pattern where increased distance from the horsehead roadway correlates with a reduced damage range in the shaft and adjacent rock. At this 1.5 m subsidence displacement, a notable aggregation of damage occurs in shaft elements exceeding 75 m from the horsehead roadway—a contrast to the conditions observed at displacements of 0.5 m and 1.0 m. Moreover, the rock in direct contact with the entire length of the shaft is affected, manifesting as a continuous band—with a width ranging from 2 to 5 m under two-dimensional visualization (indicated by the yellow rectangular box). This pattern underscores the simultaneous presence of shear and tensile failures in the rock mass surrounding the horsehead roadway. At a displacement of 0.5 m, tensile failures are primarily near the free surface, while shear failures are more distant. In the case of the shaft, shear failures predominate, with tensile failures sparsely scattered in the upper sections. When the subsidence displacement increases to 1.0 m, shear failures continue to dominate the shaft wall failure, but tensile failures become more pronounced in the upper regions. As the subsidence displacement escalates further to 1.5 m, the character of the shaft wall failure alters significantly; shear and tensile failures exist in roughly equal measure, unlike the primarily shear failure observed at the lower displacement levels of 0.5 m and 1.0 m.

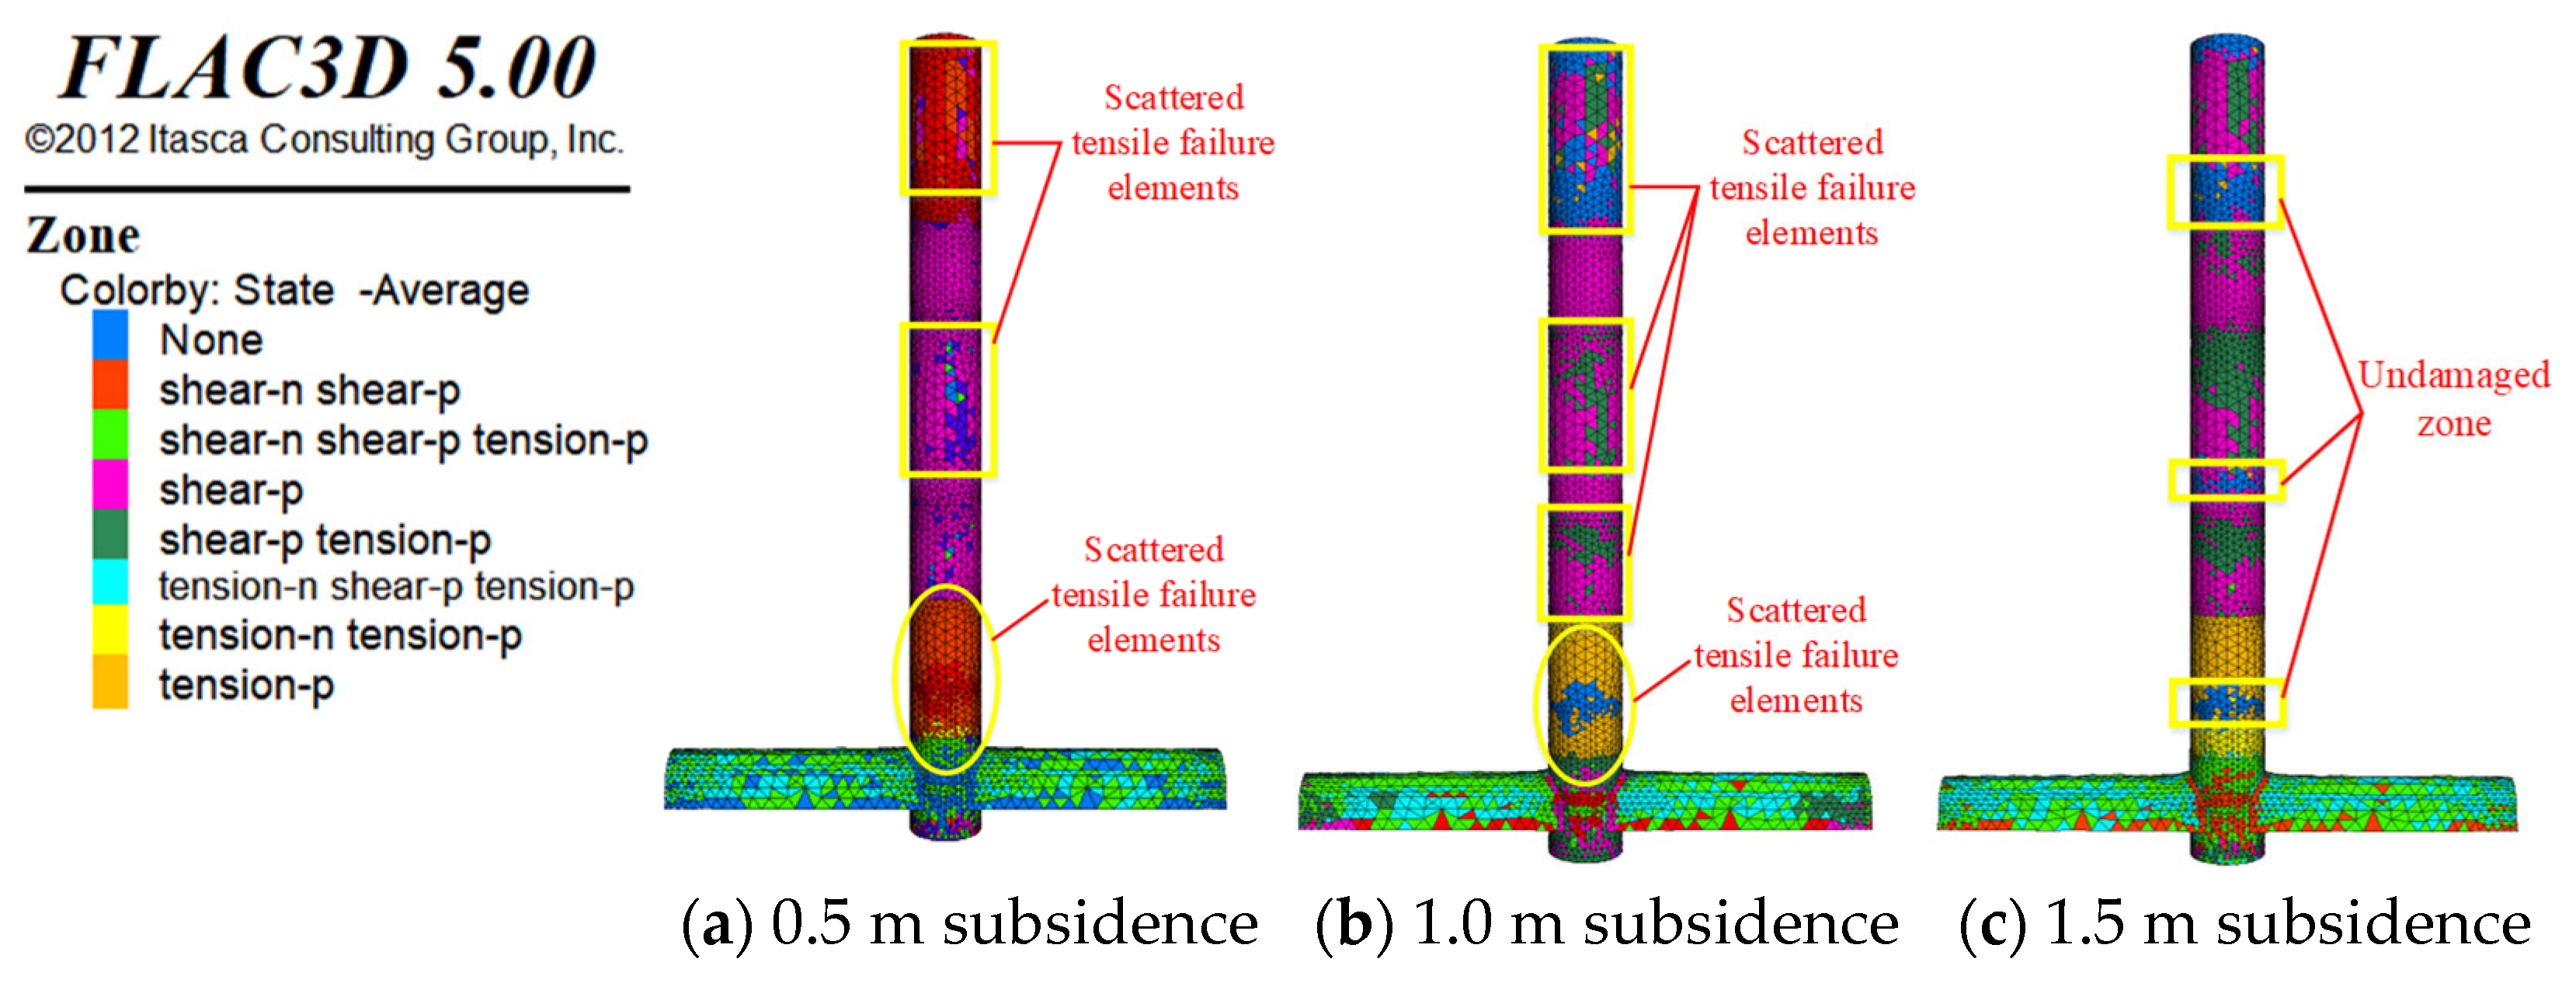
4.2. Failure Mode of the Shaft Wall

Element extraction from the model, as illustrated in Figure 14, facilitated the visualization of the shaft’s three-dimensional failure mode depicted in Figure 15. At a 0.5 m subsidence displacement of the horsehead roadway’s roof, tensile failure within the shaft wall occurs sporadically across the upper and middle sections of the shaft, as indicated by the rectangular box in Figure 15a, and exhibits a concentrated pattern near the junction with the horsehead doorway (elliptical box in Figure 15a). When subsidence displacement increases to 1.0 m, the tensile failure assumes a stratified configuration in these same areas of the shaft (rectangular box in Figure 15b), transitioning from the previously observed sporadic pattern. Notably, the shaft–wall junction with the horsehead roadway experiences extensive tensile failure (elliptical box in Figure 15b), a marked contrast to the conditions at the 0.5 m displacement level. At the 1.5 m subsidence displacement, tensile failure extends to the lower sections of the shaft as well, manifesting in a stratified distribution throughout the upper, middle, and lower regions (rectangular box in Figure 15c) and intersecting with shear failure zones. Furthermore, the shaft exhibits widespread plastic deformation, with the exception of the area enclosed by the rectangular box (refer to Figure 15c).

4.3. Failure Mechanism of the Shaft Wall

Shaft failure results from the combined effects of instability and deformation in the horsehead roadway and its connecting roadways, compounded by geological structural conditions. As an example, Figure 16 presents the vertical displacement of the Z-section of the rock layer along the height direction, based on model calculations corresponding to the MSD of 1.5 m. The contour distribution indicates that within the range of 0–40 m above the horsehead way, the deformation area of the rock layer gradually shifts from the direction along the axis of the horsehead roadway to its vertical direction. This area of the rock layer will inevitably experience torsional deformation, affecting the shaft and causing tensile and compressive damage. Additionally, based on the numerical model discussed in Section 2.2, it can be inferred that the thick loose layer and thin bedrock shaft are situated within soft rock or fractured coal-bearing strata featuring complex geological structures. Disturbances resulting from excavation and construction activities related to the horsehead roadway and its connecting roadways lead to instabilities and damage, such as arch sinking, floor bulging, and lateral deformation. These conditions induce bending deformations in the overlying thin bedrock and impact the interface between the bedrock and the loose layer, ultimately causing ruptures in the shaft walls of both the thin bedrock and thick loose layer sections.

5. Conclusions

Incorporating the stratigraphic formation and structural configuration of the shaft and roadway, this study utilized FLAC3D to construct a mechanical coupling model integrating geological strata, the shaft, and the horsehead roadway. Roof subsidence displacement of the horsehead roadway was systematically set at 0.5 m, 1.0 m, and 1.5 m to assess stress response and failure dynamics. The analysis, based on Mises stress and plastic zone distribution, elucidated stress behavior and failure characteristics of the shaft structure. Examination of stress and displacement fields revealed mechanisms driving shaft instability. The findings indicate:
(1)
The pulling effect on the overlying rock mass and shaft increases with greater roof subsidence displacement. Vertical displacement diminishes from the junction with the horsehead roadway to the model’s apex, with Z-direction displacement at 100 m above the roadway being about one-fifth of the roof’s MSD.
(2)
As roof subsidence displacement increases, the disturbance range of the overlying rock, shaft failure extent, and tensile failure units rise. With MSD transitions from 0.5 m to 1.5 m, the shaft failure range characterized by Mises equivalent stress expands. Tensile failure evolves from scattered occurrences to large-scale uniform distributions.
(3)
Shaft failure results from instability and deformation in the horsehead and connecting roadways, compounded by geological conditions. Situated in soft rock or fractured coal-bearing strata, excavation-induced disturbances lead to bending and deformation of thin bedrock, affecting the interface with loose layers and resulting in shaft rupture.
(4)
To prevent shaft damage from mining subsidence and water drainage, establishing protective coal pillars around the shaft and enhancing support strength at the base of the shaft parking area is recommended.

Author Contributions

J.R.: investigation, conceptualization, writing—review and editing, supervision, data curation, writing—original draft. B.W.: software, funding acquisition, formal analysis, data curation, writing—review and editing. All authors have read and agreed to the published version of the manuscript.

Funding

Financial support for this work, provided by the National Natural Science Foundation of China (No. 52404108), the Engineering Research Center of the Ministryof Education for Underground Mining Engineering (No. JYBGCZX2022103), the State key Laboratory of Mining Disaster Prevention and Control (Shandong University of Science and Technology), Ministry of Education (No. JMDPC202403) and the Research Activity Funding Project for Postdoctoral Researchers in Anhui Province (No. 2023B726), is gratefully acknowledged.

Institutional Review Board Statement

Not applicable.

Informed Consent Statement

Not applicable.

Data Availability Statement

The original contributions presented in the study are included in the article. Further inquiries can be directed to the corresponding author.

Conflicts of Interest

The authors declare that they have no known competing financial interests or personal relationships that could have appeared to influence the work reported in this paper.

References

  1. Han, J.H.; Zou, J.Q.; Hu, C.C.; Yang, W.H. Deflection mechanism and safety analysis of coal mine shaft in deep soil Strata. Math. Probl. Eng. 2019, 2019, 9461742. [Google Scholar] [CrossRef]
  2. Liu, S.Q.; Jie, Y.X.; Xu, Y.C. Prevention of mine-shaft failure by aquifer replenishment. J. Test. Eval. 2017, 45, 890–903. [Google Scholar] [CrossRef]
  3. Yan, H.; Zhang, J.X.; Zhou, N.; Zhang, S.; Dong, X.J. Shaft failure characteristics and the control effects of backfill body compression ratio at ultra-contiguous coal seams mining. Environ. Earth Sci. 2018, 77, 458. [Google Scholar] [CrossRef]
  4. Zhang, W.; He, Z.M.; Zhang, D.S.; Qi, D.H.; Zhang, W.S. Surrounding rock deformation control of asymmetrical roadway in deep three-soft coal seam: A case study. J. Geophys. Eng. 2018, 15, 1917–1928. [Google Scholar] [CrossRef]
  5. Bukowski, P. Water hazard assessment in active shafts in upper silesian coal basin mines. Mine. Water. Environ. 2011, 30, 302–311. [Google Scholar] [CrossRef]
  6. Shi, H.; Zhang, H.Q.; Chen, W.L.; Song, L.; Li, M. Pull-out debonding characteristics of bolt with prefabricated cracks in rock: A numerical study based on Particle Flow Code. Comput. Part. Mech. 2024, 11, 29–53. [Google Scholar] [CrossRef]
  7. Zhang, W.Q.; Wang, Z.Y.; Shao, J.L.; Zhu, X.X.; Li, W.; Wu, X.T. Evaluation on the stability of vertical mine shafts below thick loose strata based on the comprehensive weight method and a fuzzy matter-element analysis model. Geofluids 2019, 2019, 3543957. [Google Scholar] [CrossRef]
  8. Shi, H.; Chen, W.L.; Zhang, H.Q.; Song, L.; Li, M.; Wang, M.J.; Lu, P.J. Dynamic strength characteristics of fractured rock mass. Eng. Fract. Mech. 2023, 292, 109678. [Google Scholar] [CrossRef]
  9. Abdulridha, H.L.; Abdulaziz, A.M.; Khalil, A.A.; Alhussainy, S.; Abd Askar, A.S.; Dahab, A.S.A.; Alfarge, D. Study on uncertainty analysis for drilling engineering applications: Wellbore stability assessments. Arab. J. Sci. Eng. 2022, 47, 11687–11698. [Google Scholar] [CrossRef]
  10. Han, J.H.; Zou, J.Q.; Hu, C.C.; Yang, W.H. Study on size design of shaft protection rock/coal pillars in thick soil and thin rock strata. Energies 2019, 12, 2553. [Google Scholar] [CrossRef]
  11. Sun, X.M.; Zhu, M.Q.; Zhang, Y.; Zhao, C.W.; Miao, C.Y.; Zhang, S.K. Highly prestressed NPR cable coupling support technology and its application in the deep roadway. Eng. Fail. Anal. 2022, 142, 106707. [Google Scholar] [CrossRef]
  12. Wu, J.Y.; Wong, H.S.; Zhang, H.; Yin, Q.; Jing, H.; Ma, D. Improvement of cemented rockfill by premixing low-alkalinity activator and fly ash for recycling gangue and partially replacing cement. Cem. Concr. Comp. 2024, 145, 105345. [Google Scholar] [CrossRef]
  13. Dobson, J.A.; Riddiford-Harland, D.L.; Bell, A.F.; Wegener, C.; Steele, J.R. Effect of work boot shaft stiffness and sole flexibility on lower limb muscle activity and ankle alignment at initial foot-ground contact when walking on simulated coal mining surfaces: Implications for reducing slip risk. Appl. Ergon. 2019, 81, 102903. [Google Scholar] [CrossRef]
  14. Li, P.X.; Zhu, X.Y.; Ding, X.C.; Zhang, T. An experimental study of industrial site and shaft pillar mining at Jinggezhuang coal mine. Appl. Sci. 2023, 13, 2340. [Google Scholar] [CrossRef]
  15. Szlązak, N.; Korzec, M. Conditions that determine changing the function of mine shafts in a gassy coal mine—A case study. Energies 2024, 17, 1379. [Google Scholar] [CrossRef]
  16. Wang, L.; Cheng, Y.P.; Ge, C.G.; Chen, J.X.; Wang, H.F. Safety technologies for the excavation of coal and gas outburst-prone coal seams in deep shafts. Int. J. Rock Mech. Min. 2013, 57, 24–33. [Google Scholar] [CrossRef]
  17. Cheng, H.; Su, J.; Tang, R.S. Fuzzy inversion of negative friction on shafts through de-watered subsiding grounds. J. Xi’an Inst. Min. Technol. 1999, 4, 309–312. (In Chinese) [Google Scholar]
  18. Lou, G.D.; Su, L.F. Analysis of loading on shaft lining subjected to alluvium settlement due to water drainage. J. China Coal Soc. 1991, 16, 54–62. (In Chinese) [Google Scholar]
  19. Yan, H.; Zhang, J.X.; Zhang, S.; Zhou, N. Physical modeling of the controlled shaft deformation law during the solid backfill mining of ultra-close coal seams. Bull. Eng. Geol. Environ. 2019, 78, 3741–3754. [Google Scholar] [CrossRef]
  20. Lu, Y.H.; Chen, M.; Jin, Y.; Ge, W.F.; An, S.; Zhou, Z. Influence of porous flow on wellbore stability for an inclined well with weak plane formation. Petrol. Sci. Technol. 2013, 31, 616–624. [Google Scholar] [CrossRef]
  21. Ma, T.S.; Chen, P. New method for calculating wellbore collapse pressure in shale formations. Chem. Tech. Fuels Oil. 2016, 52, 451–461. [Google Scholar] [CrossRef]
  22. Zhang, L.S.; Jiang, M.G.; Li, W.J.; Bian, Y.H. A new analytical model of wellbore collapse pressure based on stability theory. J. Petrol. Sci. Eng. 2020, 188, 106928. [Google Scholar] [CrossRef]
  23. Ma, Y.F.; Yu, R.G. New analytical methods to evaluate uncertainty of wellbore stability. J. Petrol. Sci. Eng. 2019, 180, 268–277. [Google Scholar] [CrossRef]
  24. Mu, K.H. Stress Mechanism Analysis and Safety Monitoring Research on Simultaneous Water Loss Shaft Wall of Upper and Lower Aquifers in Alluvium. Master’s Thesis, Anhui University of Science and Technology, Huainan, China, 2020. (In Chinese). [Google Scholar] [CrossRef]
  25. Wu, F.; Qin, Y.P.; Xu, H.; Zhang, F.J.; Chu, X.Y. Numerical simulation of deformation and failure mechanism of main inclined shaft in Yuxi coal mine, China. Appl. Sci. 2022, 12, 5531. [Google Scholar] [CrossRef]
  26. Yao, Z.S.; Yu, G.H.; Cheng, H.; Rong, C.X. Research on vertical bearing capacity of shaft lining structure of high strength concrete and double steel cylinders in super-thick alluvium. Rock Soil Mech. 2010, 31, 1687–1691. (In Chinese) [Google Scholar]
  27. Cui, S.; Liu, H.B.; Meng, Y.F.; Zhang, Y.N.; Tao, Y.; Zhang, X.N. Study on fracture occurrence characteristics and wellbore stability of limestone formation. J. Petrol. Sci. Eng. 2021, 204, 108783. [Google Scholar] [CrossRef]
  28. Gao, H.D.; An, B.F.; Han, Z.; Guo, Y.C.; Guo, Y.C.; Ruan, Z.Y.; Li, W.; Zayzay, S. The sustainable development of aged coal mine achieved by recovering pillar-blocked coal resources. Energies 2020, 13, 3912. [Google Scholar] [CrossRef]
  29. Hendel, J.; Lukanko, L.; Macuda, J.; Kosakowski, P.; Loboziak, K. Surface geochemical survey in the vicinity of decommissioned coal mine shafts. Sci. Total Environ. 2021, 779, 146385. [Google Scholar] [CrossRef]
  30. Zhang, J.P.; Li, K.S.; Li, Y.; Liu, C.X.; Xu, J.H.; He, J.P. Applying novel micro–Nano-Siliceous grouting material improves mechanical behaviors of fractured rock masses and microscopic characteristics of slurry–rock interface: Experimental and numerical simulation investigations. Rock Mech. Rock Eng. 2024, 57, 8297–8321. [Google Scholar] [CrossRef]
  31. Cui, J.F.; Wang, W.J.; Yuan, C. Application of stability analysis in surrounding rock control and support model of deep roadway. Int. J. Oil. Gas Coal T. 2022, 29, 180–192. [Google Scholar] [CrossRef]
  32. Gao, M.Z.; Zhou, X.M.; Wang, X.; Xie, J.; Wang, C.; Zhang, Q.; Lv, H.Q.; Guo, C.C. Mechanical behavior of coal under true triaxial loading test connecting the effect of excavation- and mining-induced disturbances. Geomech. Geophys. Geo-Energy Geo-Resour. 2023, 9, 34. [Google Scholar] [CrossRef]
  33. Wang, X.S.; Cheng, H.; Wu, T.L.; Yao, Z.S.; Huang, X.W. Numerical analysis of a novel shaft lining structure in coal mines consisting of hybrid-fiber-reinforced concrete. Crystals 2020, 10, 928. [Google Scholar] [CrossRef]
  34. Chen, S.M.; Wu, A.X.; Wang, Y.M.; Chen, X.; Yan, R.F.; Ma, H.J. Study on repair control technology of soft surrounding rock roadway and its application. Eng. Fail. Anal. 2018, 92, 443–455. [Google Scholar] [CrossRef]
  35. Emad, M.Z.; Mitri, H.; Kelly, C. Dynamic model validation using blast vibration monitoring in mine backfill. Int. J. Rock Mech. Min. 2018, 107, 48–54. [Google Scholar] [CrossRef]
  36. Lin, H.; Liu, T.Y.; Li, J.T.; Cao, P. A simple generation technique of complex geotechnical computational model. Math. Probl. Eng. 2013, 2013, 863104. [Google Scholar] [CrossRef]
  37. Wang, X.D.; Yu, Z.R.; Zhang, J.K.; Guo, Q.L.; Yang, S.L.; Sun, M.L. Numerical simulation of the behaviors of test square for prehistoric earthen sites during archaeological excavation. J. Rock Mech. Geotech. 2018, 10, 567–578. [Google Scholar] [CrossRef]
  38. Yang, R.S.; Li, Y.L.; Guo, D.M.; Yao, L.; Yang, T.M.; Li, T.T. Failure mechanism and control technology of water-immersed roadway in high-stress and soft rock in a deep mine. Int. J. Min. Sci. Technol. 2017, 27, 245–252. [Google Scholar] [CrossRef]
  39. Shi, H.; Zhang, H.Q.; Song, L.; Wu, Y. Variation of strata pressure and axial bolt load at a coal mine face under the effect of a fault. Arch. Min. Sci. 2019, 64, 351. [Google Scholar]
  40. Shi, H.; Song, L.; Zhang, H.Q.; Chen, W.L.; Lin, H.S.; Li, D.Q.; Wang, G.Z.; Zhao, H.Y. Experimental and numerical studies on progressive debonding of grouted rock bolts. Int. J. Min. Sci. Technol. 2021, 32, 63–74. [Google Scholar] [CrossRef]
  41. Wang, Y.; Song, L.; He, Y.S.; Wang, G.Z.; Wang, Q.R.; He, Y.M.; Li, S.D.; Xu, Q.G.; Zhu, R.; Zhang, W.Q.; et al. Similar simulation test study on the influence of mining on shaft deflection of deep soil based on hydraulic permeability model. Energy Explor. Exploit. 2023, 41, 19–43. [Google Scholar] [CrossRef]
  42. Deng, Z.; Zhu, Z.M.; Zhou, L.; Zhang, Y.; Zhang, H.D.; Nie, F.K.; Liu, B. Study on fracture characteristics of surrounding rock of twin tunnels under various crack inclination and location conditions. Int. J. Impact Eng. 2024, 194, 105084. [Google Scholar] [CrossRef]
  43. Zhao, J.J.; Zhu, Z.H.; Zhang, D.X.; Wang, H.; Li, X. Assessment of fabric characteristics with the development of sand liquefaction in cyclic triaxial tests: A DEM study. Soil Dyn. Earthq. Eng. 2023, 176, 108343. [Google Scholar] [CrossRef]
  44. Fan, L.; Wang, W.J.; Yuan, C.; Ma, Y.J. Research on the differentiated support technology for roadways based on the mechanical response of the plastic zone. Energy Sci. Eng. 2023, 12, 670–683. [Google Scholar] [CrossRef]
  45. Ma, Y.J.; Wang, W.J.; Fan, L.; Yuan, C.; Tian, X.Y.; Shu, S.H. Research on crack distribution characteristics and control technology of surrounding rock in soft rock roadway under different lateral pressure coefficients. Energy Sci. Eng. 2024, 12, 3852–3868. [Google Scholar] [CrossRef]
Figure 1. Numerical calculation model.
Applsci 15 00163 g001
Figure 2. Calculation process of the model: (a) model establishment; (b) shaft excavation; (c) lining support of shaft; (d) excavation of horsehead roadway; (e) bolt and cable support; (f) lining support of horsehead roadway.
Applsci 15 00163 g002
Figure 3. Spatial distribution of subsidence displacement of the roof of the horsehead roadway.
Applsci 15 00163 g003
Figure 4. Z-direction displacement field of the model (cm).
Applsci 15 00163 g004aApplsci 15 00163 g004b
Figure 5. X and Z-direction displacement fields of the model (cm).
Applsci 15 00163 g005
Figure 6. Three directional stress field of the model (MPa).
Applsci 15 00163 g006aApplsci 15 00163 g006b
Figure 7. Three directional displacement fields of the shaft (cm) (dmax = 0.5 m).
Applsci 15 00163 g007
Figure 8. Three directional displacement fields of the shaft (cm) (dmax = 1.0 m).
Applsci 15 00163 g008aApplsci 15 00163 g008b
Figure 9. Three directional displacement fields of the shaft (cm) (dmax = 1.5 m).
Applsci 15 00163 g009aApplsci 15 00163 g009b
Figure 10. Three directional stress fields of the shaft (MPa) (dmax = 0.5 m).
Applsci 15 00163 g010
Figure 11. Three directional stress fields of the shaft (MPa) (dmax = 1.0 m).
Applsci 15 00163 g011
Figure 12. Three directional stress field of shaft (MPa) (dmax = 1.5 m).
Applsci 15 00163 g012
Figure 13. Distribution of Mises equivalent stress along the shaft wall.
Applsci 15 00163 g013
Figure 14. Overall failure mode of the model under the roof subsidence influence of the horsehead roadway.
Applsci 15 00163 g014
Figure 15. Failure mode of the shaft wall under the roof subsidence influence of the horsehead roadway.
Applsci 15 00163 g015
Figure 16. Torsional deformation of rock layers along the height direction (cm).
Applsci 15 00163 g016
Table 1. Strata and thickness of each rock layer in the numerical model.
Rock LayerNumberStrata l/mThickness t/m
Weathering zone1#40743
Sandy mudstone2#4509
Mudstone3#45918
Siltstone4#47730
Mudstone5#5077
Siltstone6#51418
Sandy mudstone7#53211
Mudstone8#5439
Siltstone9#5529
Mudstone10#5614
Sandy mudstone11#56512
Mudstone12#5777
Sandy mudstone13#58418
Mudstone14#6025
Siltstone15#6077
Medium-grained sandstone16#61413
Mudstone17#62710
Coal18#6376
Sandy mudstone19#6435
Mudstone20#6483
Coal21#6512
Sandy mudstone22#6598
Mudstone23#66910
Siltstone24#67910
Table 2. Mechanical parameters for numerical calculation of strata and shaft [8].
LayersDensity ρ/kg/m3Elastic Modulus E/GPaPoisson’s RatioCohesion c/MPaInternal Friction Angle φTensile Strength σt/MPa
Siltstone28009.950.243.8310.34
Fine sandstone275010.170.253.5320.43
Mudstone17801.70.351.2330.20
Coal23501.70.212.3250.28
Medium-grained sandstone2900160.305.3280.58
Shaft240035.20.248.652.04.10
Disclaimer/Publisher’s Note: The statements, opinions and data contained in all publications are solely those of the individual author(s) and contributor(s) and not of MDPI and/or the editor(s). MDPI and/or the editor(s) disclaim responsibility for any injury to people or property resulting from any ideas, methods, instructions or products referred to in the content.

