3.1. The Mathematical Framework
In terms of wave surface elevation, the most common statistical models are formed by years of measurement, represented by a distribution such as JONSWAP [
25]. While this approach describes the system’s overall behaviors, the average quantity fails to provide deterministic insights or, more precisely, reliable insights within short observation windows. This fact basically stems from the lack of temporal labels used in statistical distribution, or, in other words, the statistical distribution is essentially set up by spectral information. Therefore, the studies carried out until recently rest upon these fundamental properties, such as [
26,
27,
28]. Considering all this, the new approach can be conceptually simplified in the flow diagram in
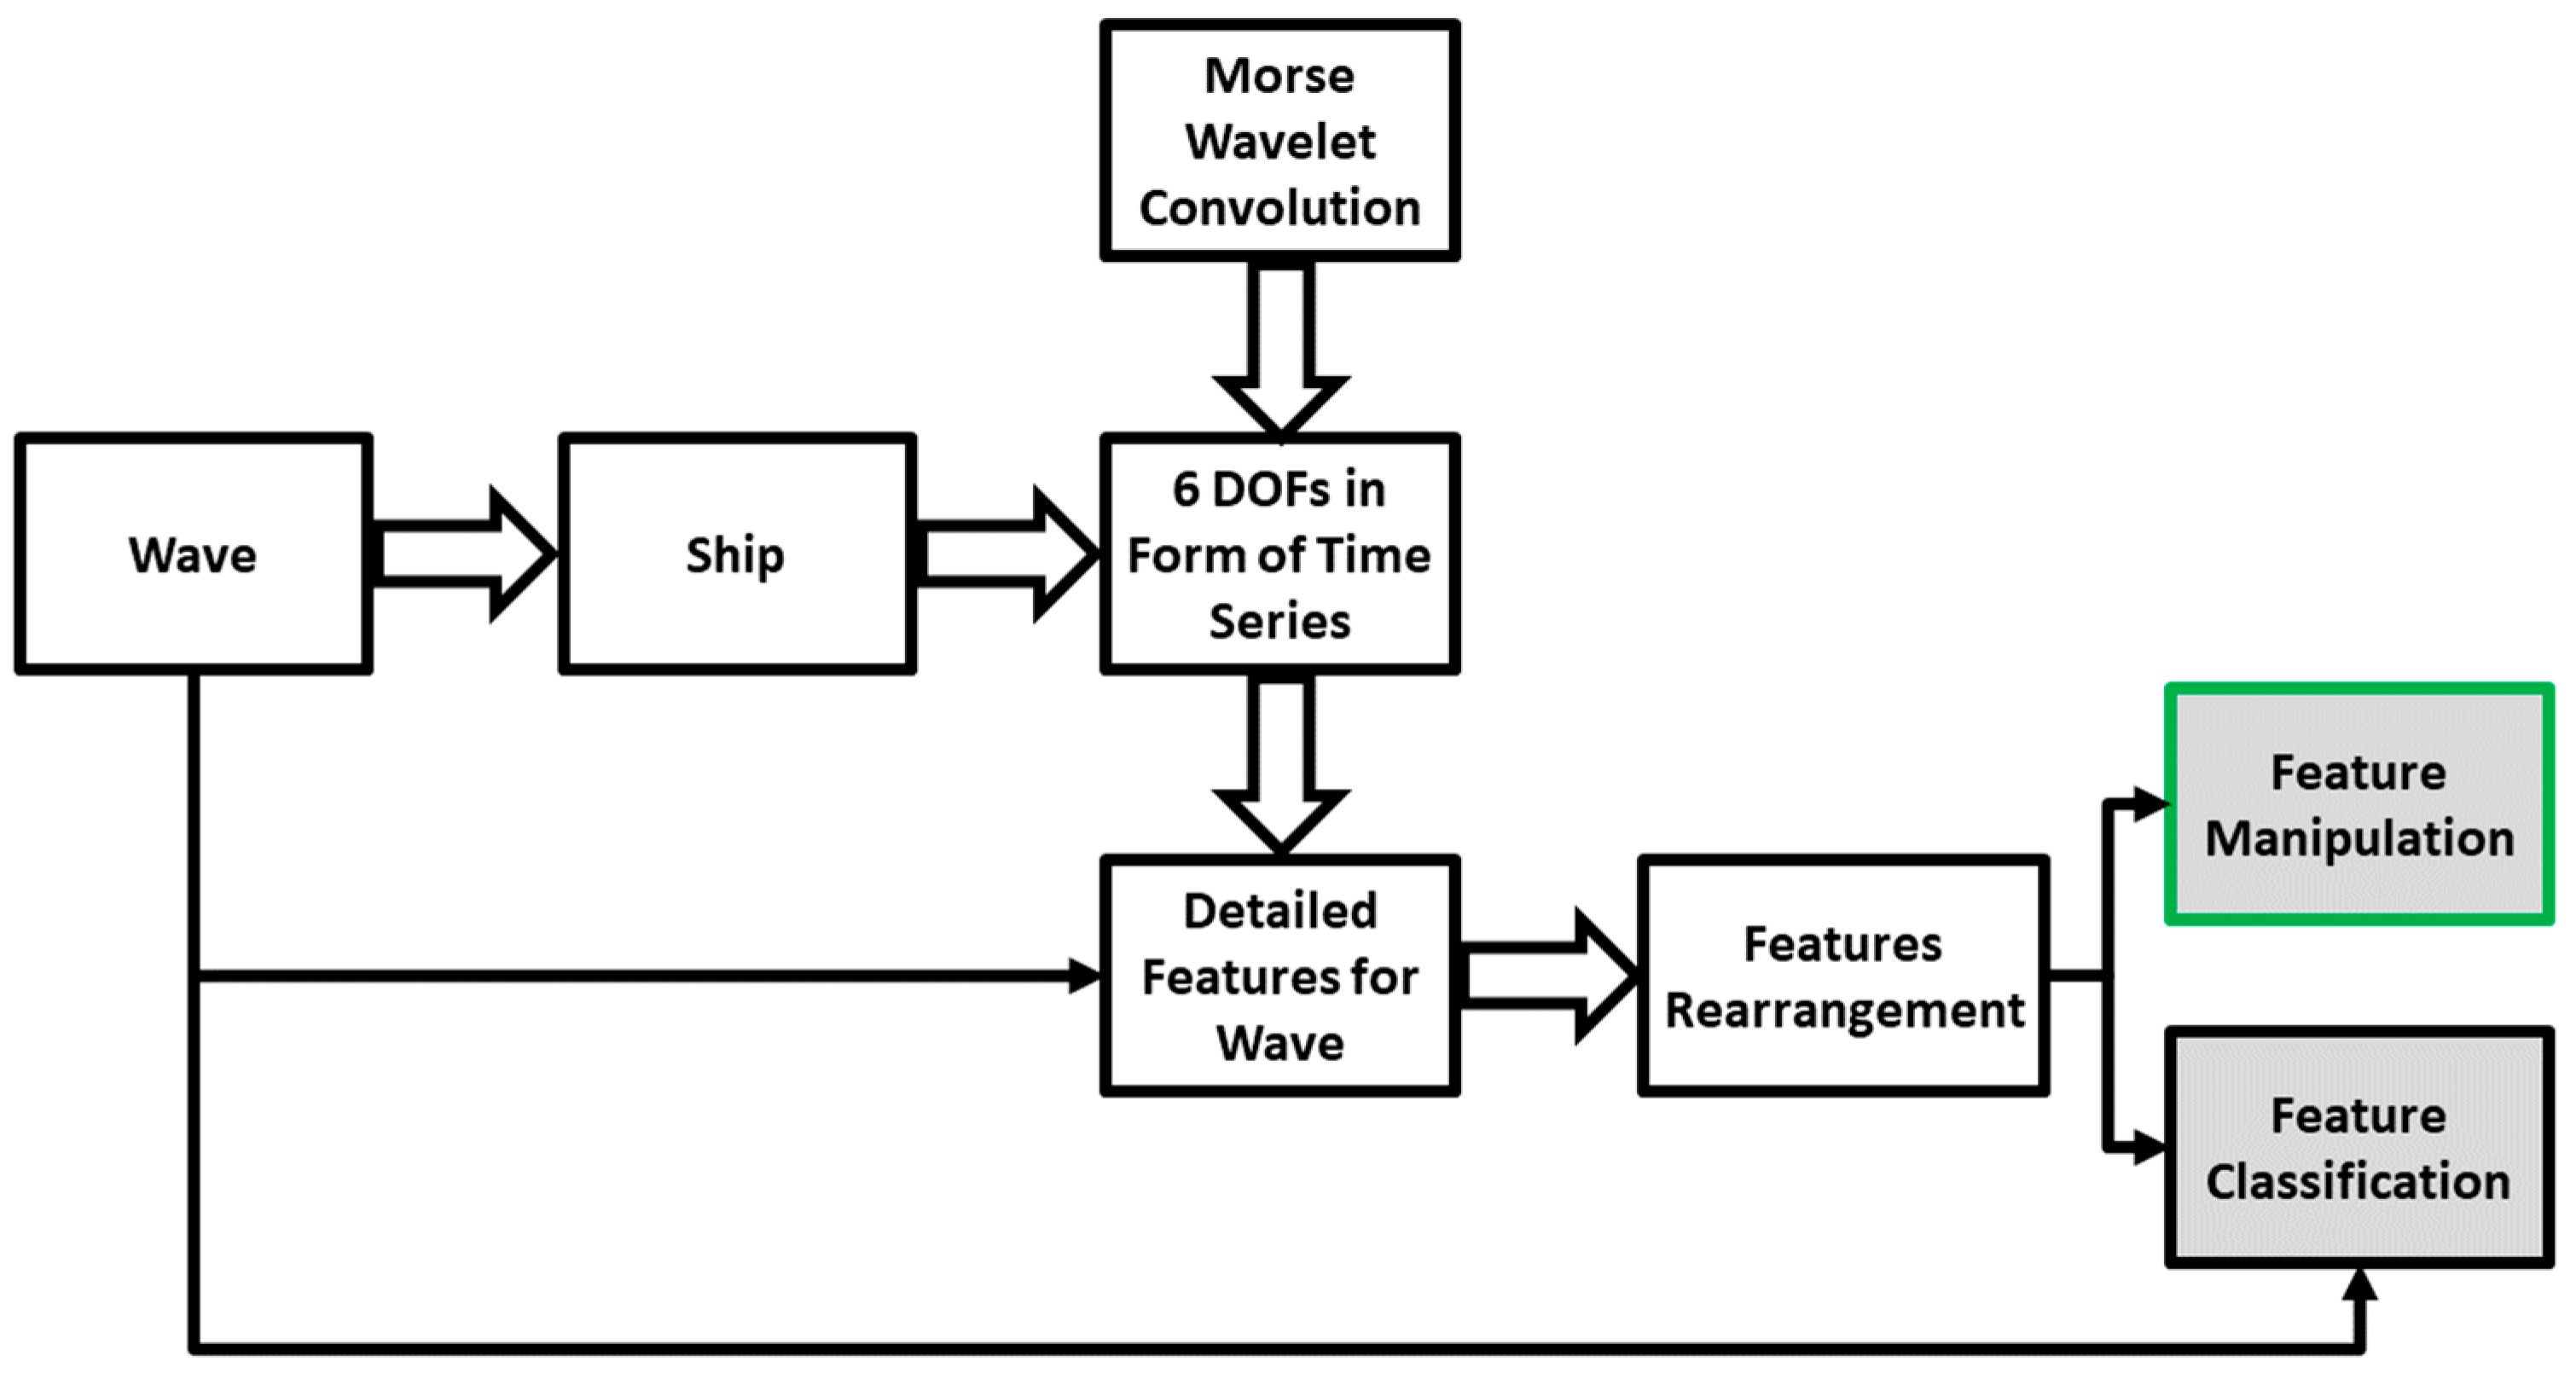
Figure 6.
Starting from the left side of the diagram, wave as the input excites the ship as the system, resulting in six DOF responses in the form of time series, the system output. The purpose of applying wavelet on the short pieces of time series is to extract as much information as possible from time series data in the form of detailed features representation. Further, these features are reorganized through numerical operation to facilitate eventual manipulation and classification based on the categorical wave classes. The final grey blocks indicated the outcomes of feature reorganization that could facilitate feature manipulation, or, in other words, direct control over the densified features. Additionally, feature classification can lighten the training cost, which is aimed at being the focus of part B of the current issue.
The data generation process up to the output has been explained in
Section 2. Nevertheless, six DOFS must be represented as a specific form for further mathematical operation. To include all features in the data, an additive approach has been adopted according to [
15], representing every three DOFs of translational
and angular motions
to a condensed vector resulting from the summation of DOFs. The pertinent reason is simply due to the complex interaction of the mooring system’s impact on floating object responses and the mutual effects of responses. The vectors obtained from the summation of each three DOFs are normalized between (0,1) and represent a unique vector of
by summation of
where
denoting each group of normalized DOFs. The matrix given in Equation (3), indicating summation of the six DOFs. For a vector
representing the sphere/ship response,
denotes the discrete sample instant, and
the length of the vector, taken in this study as 40 s, corresponding to 8000 samples. However, noting that for the first part of the study addressing the deterministic input–output, only heave response is considered.
To capture detailed spectral-temporal features from sphere responses corresponding to various waves, we employed the Morse wavelet. This wavelet, formed by combining complex exponential and Gaussian windows, offers distinct advantages as outlined in [
29]. Specifically, the generalized Morse wavelet is utilized with parameters, such as symmetry (
), set to be 3, and time-bandwidth
set to 60. This analytical wavelet, characterized by a scaling factor, acts as a filter bank, allowing to systematically extract detailed spectral-temporal features, convolving over the observation window. The benefits of representing these features via a scalogram, discussed extensively in [
24], surpass alternative Fourier and wavelet-based methods. Equation (4) illustrates the wavelet function, where
represents the unit step,
is a normalizing constant, and
denotes frequency, with
and
determining the matrix arguments, resulting in
as a wavelet.
The 2D matrix of
as the result of wavelet coefficients can be represented by an image, which helps for better visual perception of the spectral constitution of a signal and features amplitude over a fixed temporal direction (40 s). The image can be formed in the RGB channel; however, it has turned into grayscale with a normalized value between 0 and 1 for all pixels due to computational efficiency and less sensitivity to noise [
24]. The corresponding 2D matrix,
can be transformed into a [256 × 256] grayscale image using a linear conversion described in Equations (5) and (6). Here, the pixel value is determined by
, which serves as a scale factor adjusting the pixel intensity between 0 and 255, and
, the shift parameter, represents a constant that can be adjusted to control brightness, which is taken as 0 here.
Therefore, through sliding Equation (6) to all
and
values of
results in matrix
, where
represents the pixel intensity values ranging between 0 and 255, and m and n are both 256. Subsequently, the pixel values are normalized to a range between 0 and 1 using Equation (7), resulting in the vector
, where
equals 256 and
equals 1, turning the matrix into a column vector. To have a better visual representation,
Figure 7a indicates the cumulative scalogram of
and subsequent transformation of vector
on a diagonal plane within the new space in
Figure 7b. This depicts the result of six DOFs accumulation for a single observation of 40 s. As can be witnessed, the features stand out differently for each image, corresponding to different time stamps of the sphere’s response to the wave.
In
Figure 7a (left image), the scalogram is depicted in grayscale, overlaid with white Gaussian noise with a variance of
, corresponding to a signal-to-noise ratio (SNR) of 8.99. This noise is visually represented as a scattered pattern of white pixels across the scalogram. As can be seen in
Figure 7a, the noise manifested within new feature space in higher variation and feature spread for the range of pixel intensity below 0.5. Apart from that, the pixels shifted in the range below 0.5 due to the higher average value of the vector. Thus, the noise variance can be correlated with the features spread in new space qualitatively and quantitatively. Zooming in on the primary low-frequency components of
Figure 7a, prominently visible as a broad white region in
Figure 7a (left image) and (right image), reveals their consistent influence across the diagonal spread in
Figure 7b above 0.5, akin to the significant features. Acknowledging the reverse spectral direction in the new feature space, noting that upper regions in image height direction attribute to lower frequency constitution, while lower regions represent higher frequencies. As such, the lower spectral elements, white pixels in the bottom of the left image in
Figure 7a, show up at the higher height of
Figure 7b.
By and large, the new operation compressed the features in the temporal direction while preserving the spectral constitution through normalized wavelet coefficients not only in the temporal direction but also given the intensity of pixels amplitude in the spectral direction. This densifies the nuanced information within the 40 s of the time series, shrunk into a vector as a single information packet, either for further classification or regression purposes. Data transformation in this way gives a new insight into features spread and constitution, where they can be worked out, i.e., reorganized, sorted, etc., and finally linked with the inputs. To elaborate further, while the direct noise observed in the accelerometer of the inertia measurement unit (IMU) exhibits a random walk behavior [
30] and can be effectively filtered in the time series data collected from sensors, its influence on feature distribution remains uncertain. This influence becomes more pronounced, especially in the context of feature clustering concerning the classification of wave classes (labels), and the limitation of current work can be the scope of further studies.
The transformation reorganizes new features, presenting different approaches with unique benefits and challenges. This will be explored in the next paper, part B, focusing on how feature reorganization impacts computational efficiency and classification. For the current analysis, features on the diagonal plane have been projected into two planes based on the pixel’s intensity stratification. Using Equations (5) and (6), higher amplitudes in the sequence of
correspond to higher pixel intensities, approaching white (or 1) in the scalogram. A threshold value of 0.5 splits the features for projection: those below 0.5 are projected onto the plane called “black”, while those above are projected onto the “white” plane. This sieving not only provides insight into the spectral elements but also their contribution within the vector. More accurately, vector
is reconstructed in two vectors of the same size
, where the vectors
and
are composed of dummy values of 0.5 in arguments and
for
and
for
.
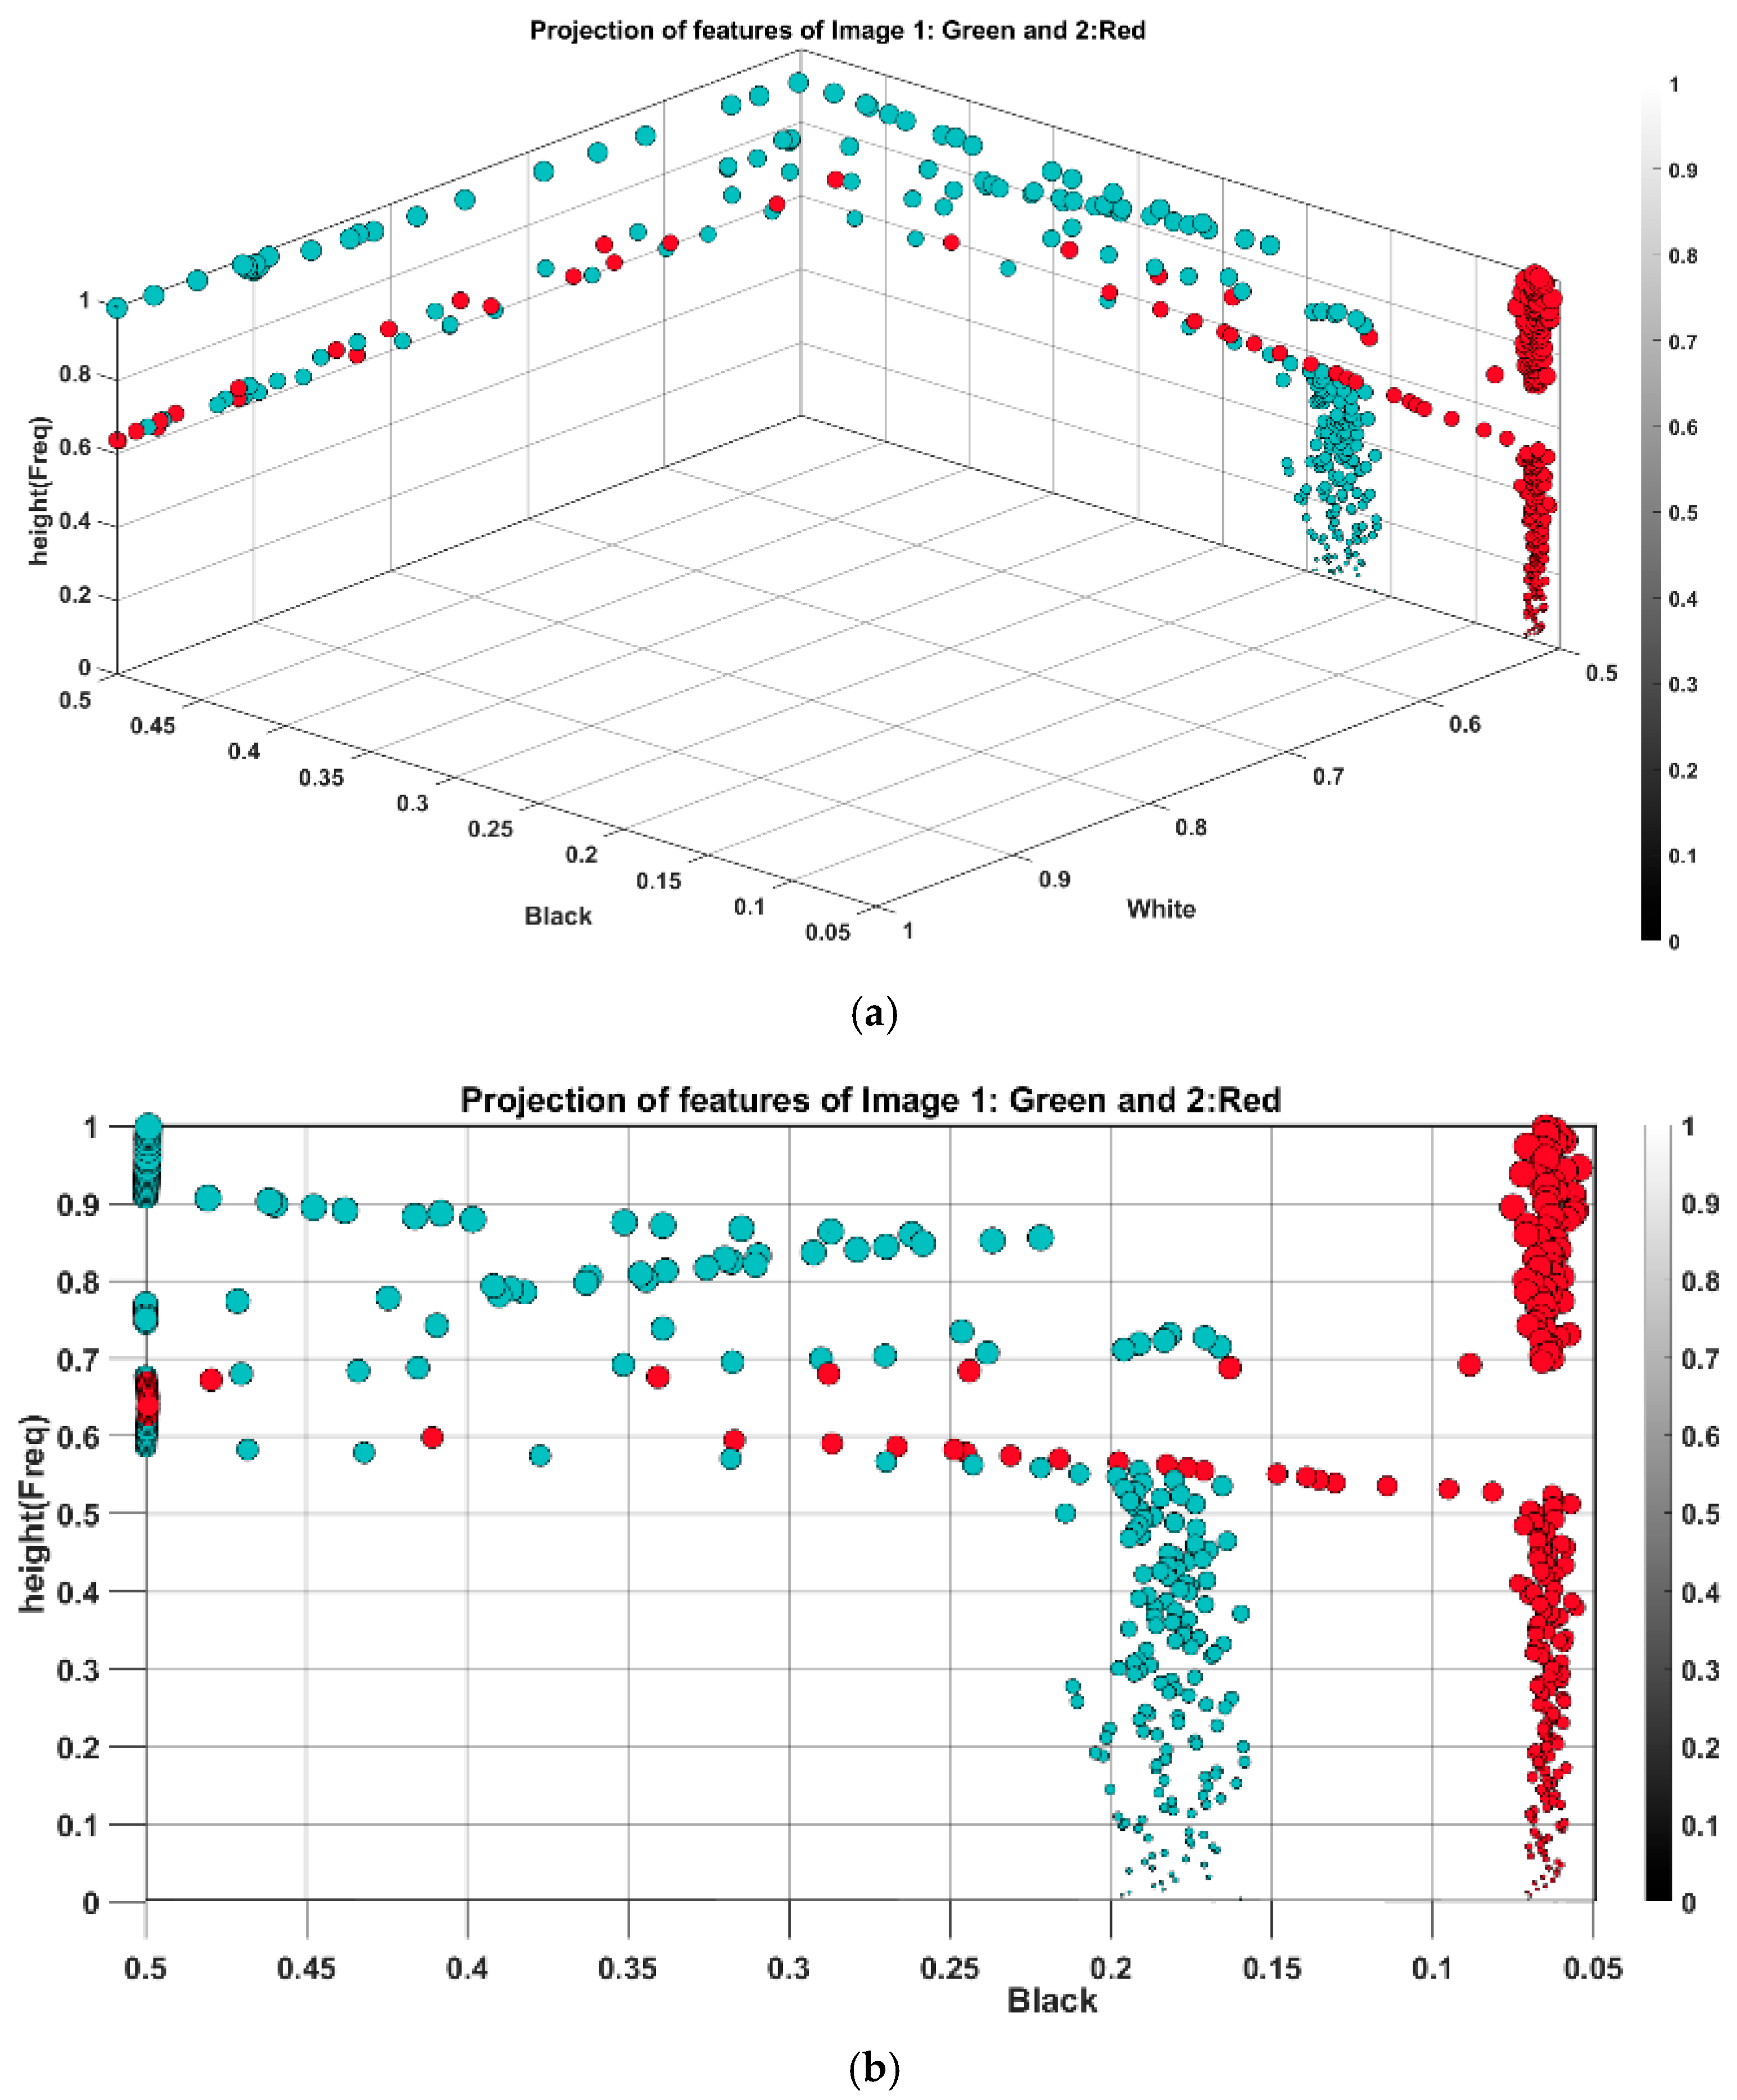
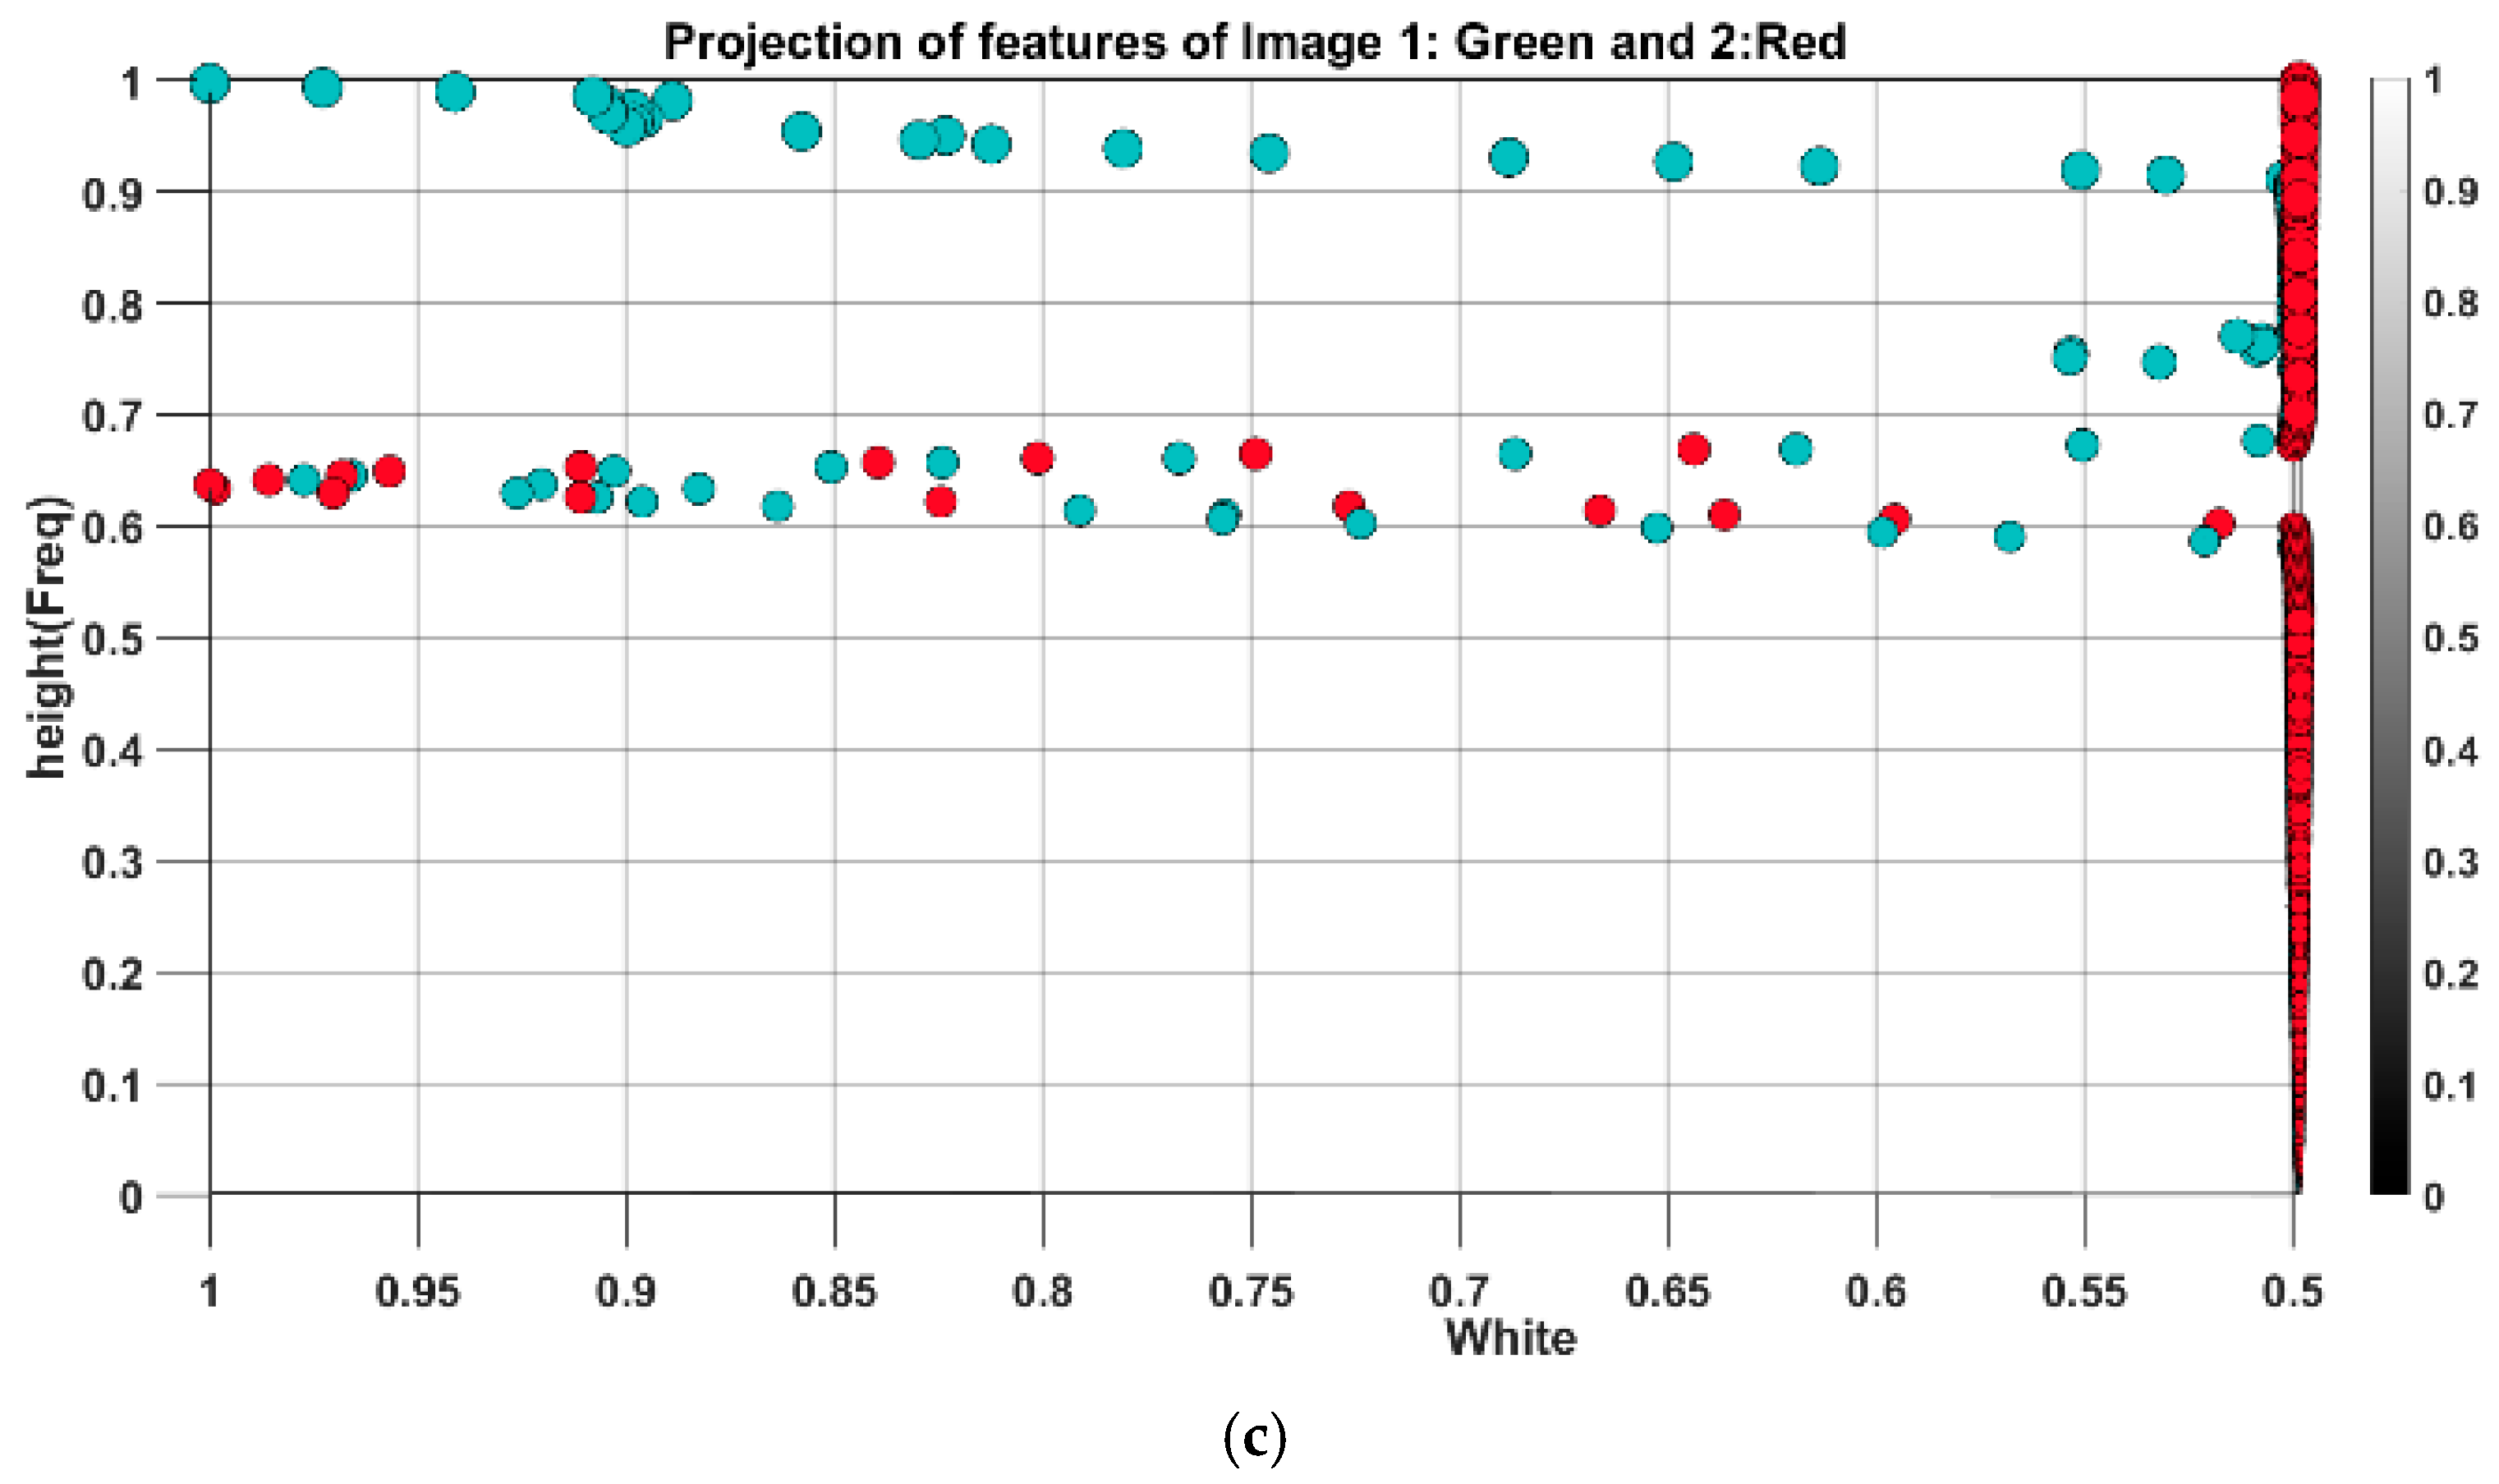
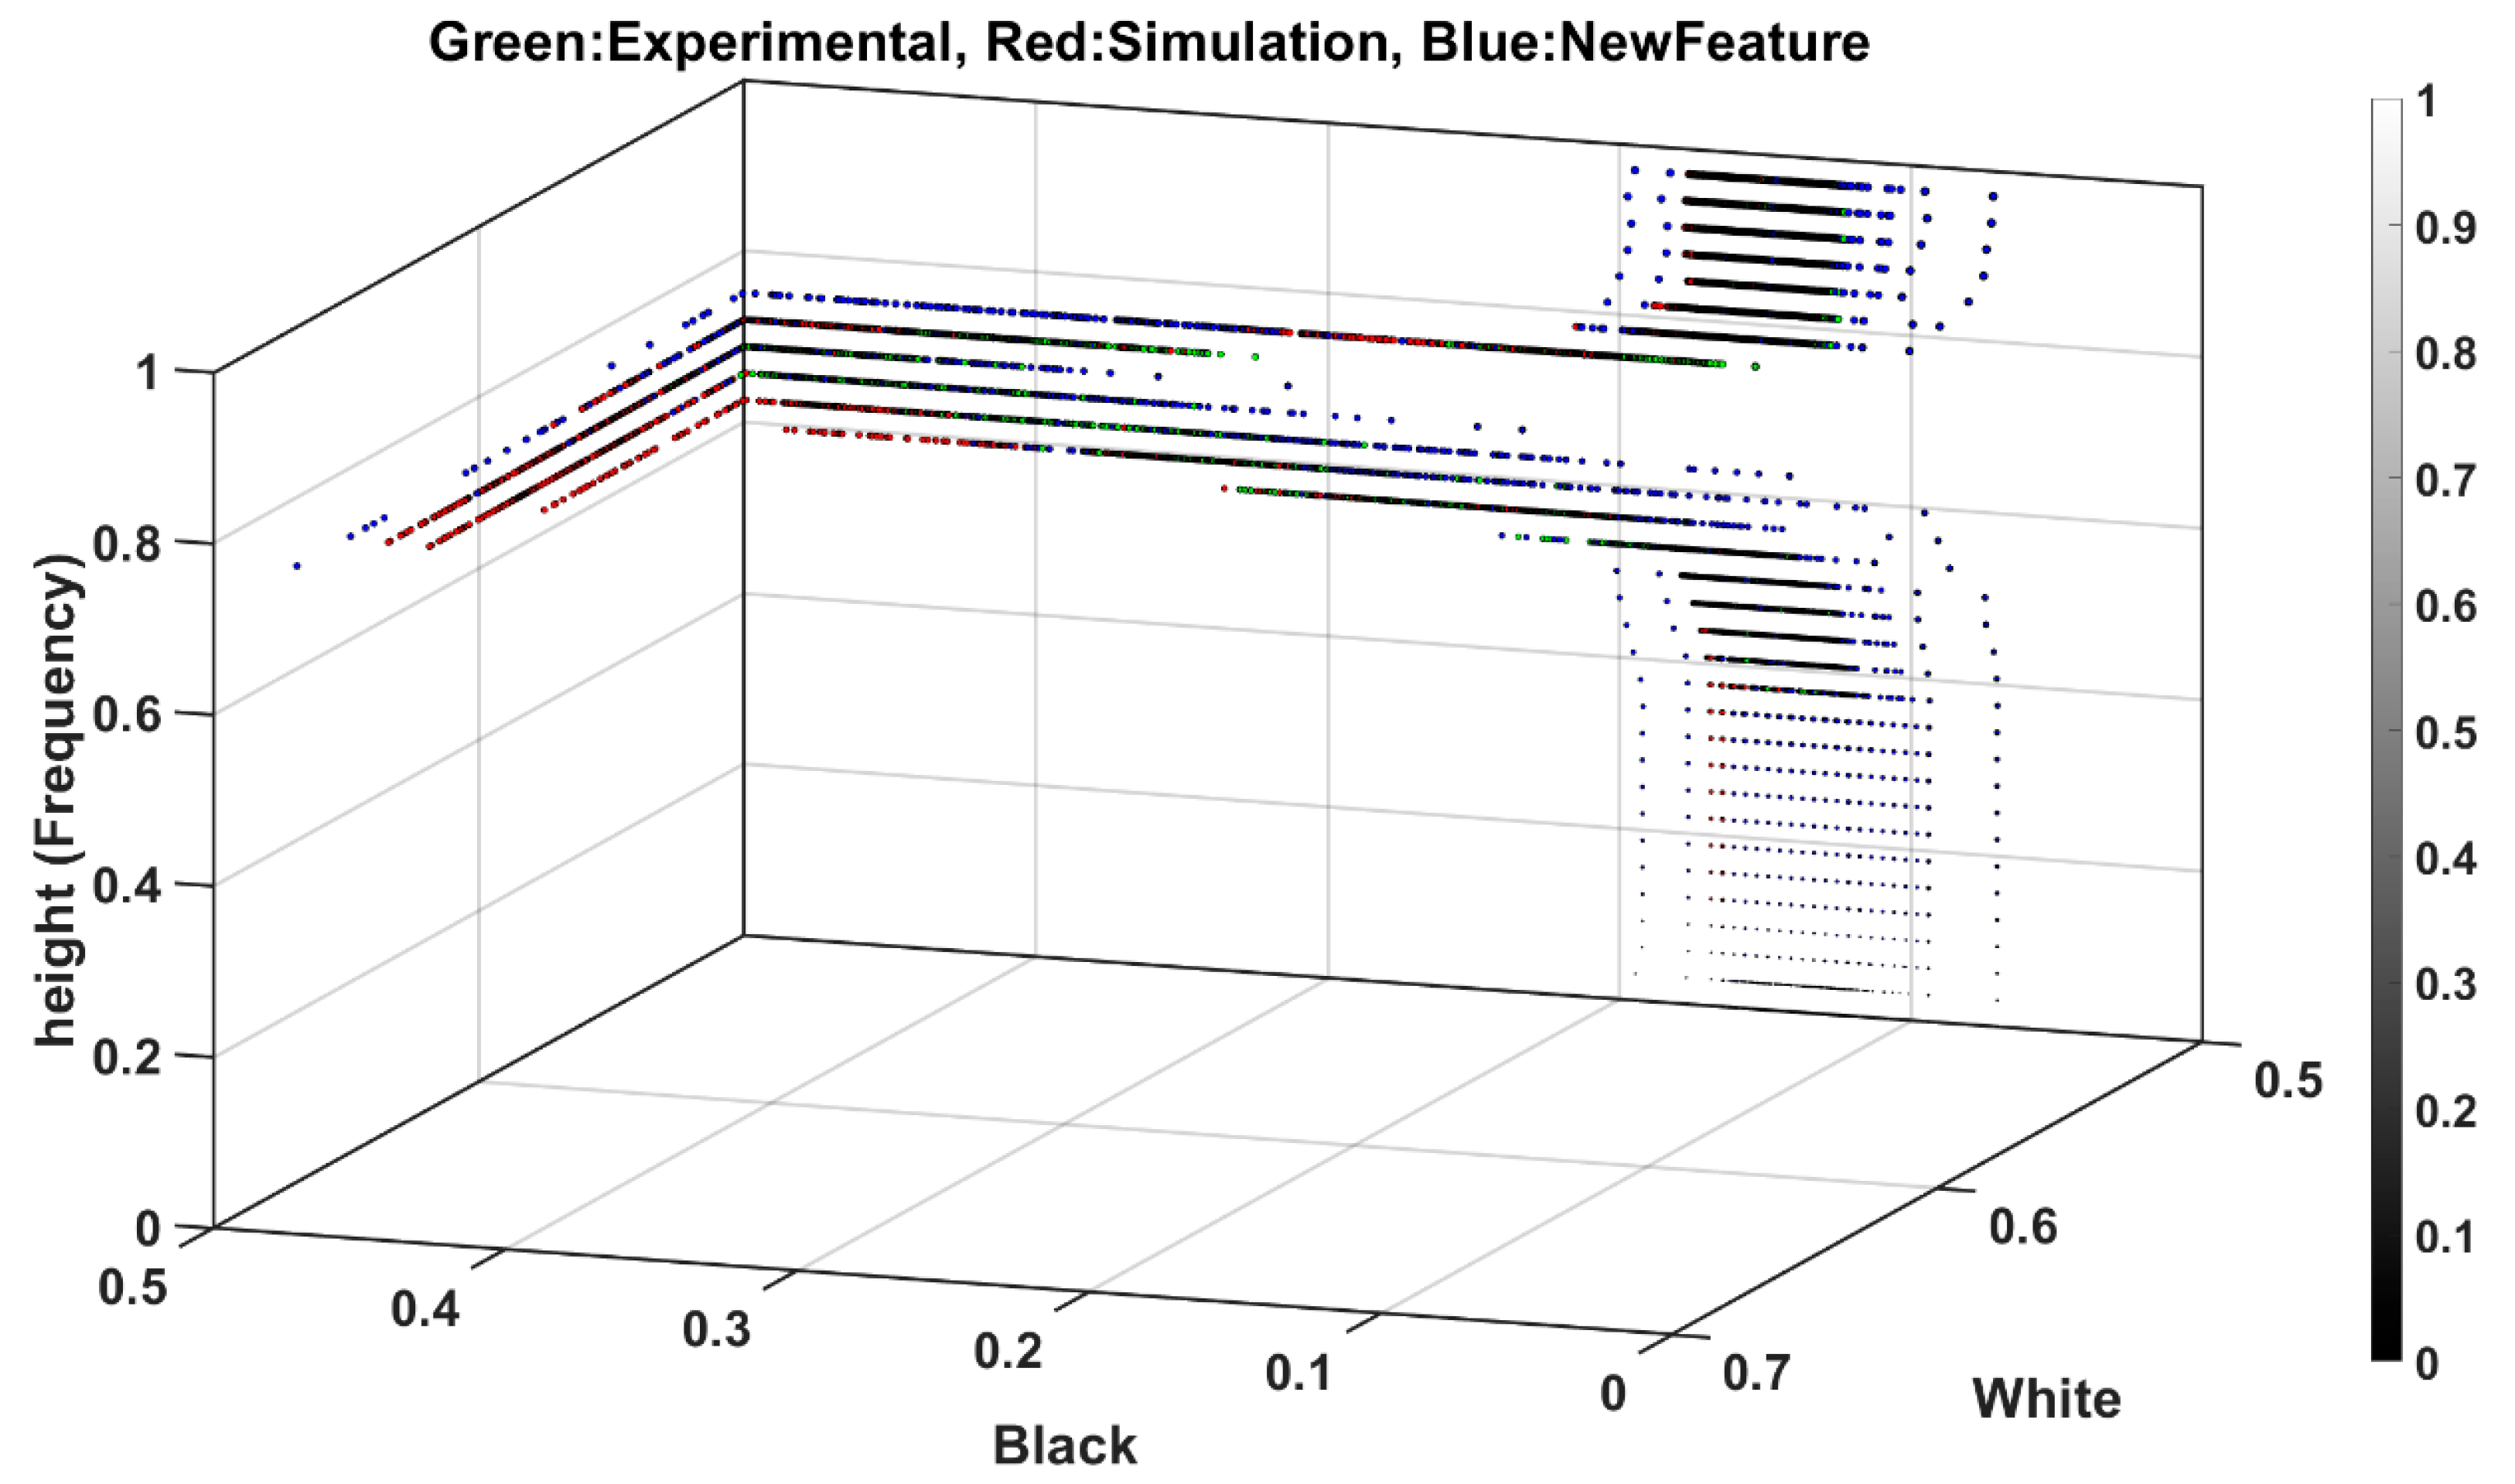
Figure 8 shows the projection of features into black and white planes with the color bar representing pixel intensity.
Engineered data possess twofold advantages: Firstly, this facilitates monitoring features spread not only from different exciting forces but also different data generation processes. For example, it shows how the features from the model test and synthesized data differ in distribution, and this insight can be further utilized for feature transformation between different fidelity level modeling that is the focal point of the present study. Secondly, engineered features can be reorganized as new unique attributes, ranging between 0 and 1, which can positively enhance classification and reduce training costs, as the second outcome of feature engineering in
Figure 6, which will be discussed in part B of the current issue.
3.2. Evaluation for Deterministic Inputs (Regular Waves)
Although wave elevation patterns possess random characteristics, they can be broken down to the superposition of many numbers of deterministic sinusoidal waves [
31,
32]. Unlike free response, which reflects the system characteristics (sphere), the deterministic input determines the forced response of the system excited by inputs [
9]. As mentioned, the new space projection enables monitoring and investigating features produced by different data generation processes. To examine this, the test ran first with a deterministic input–output relationship known as regular waves based on one DOF, heave (
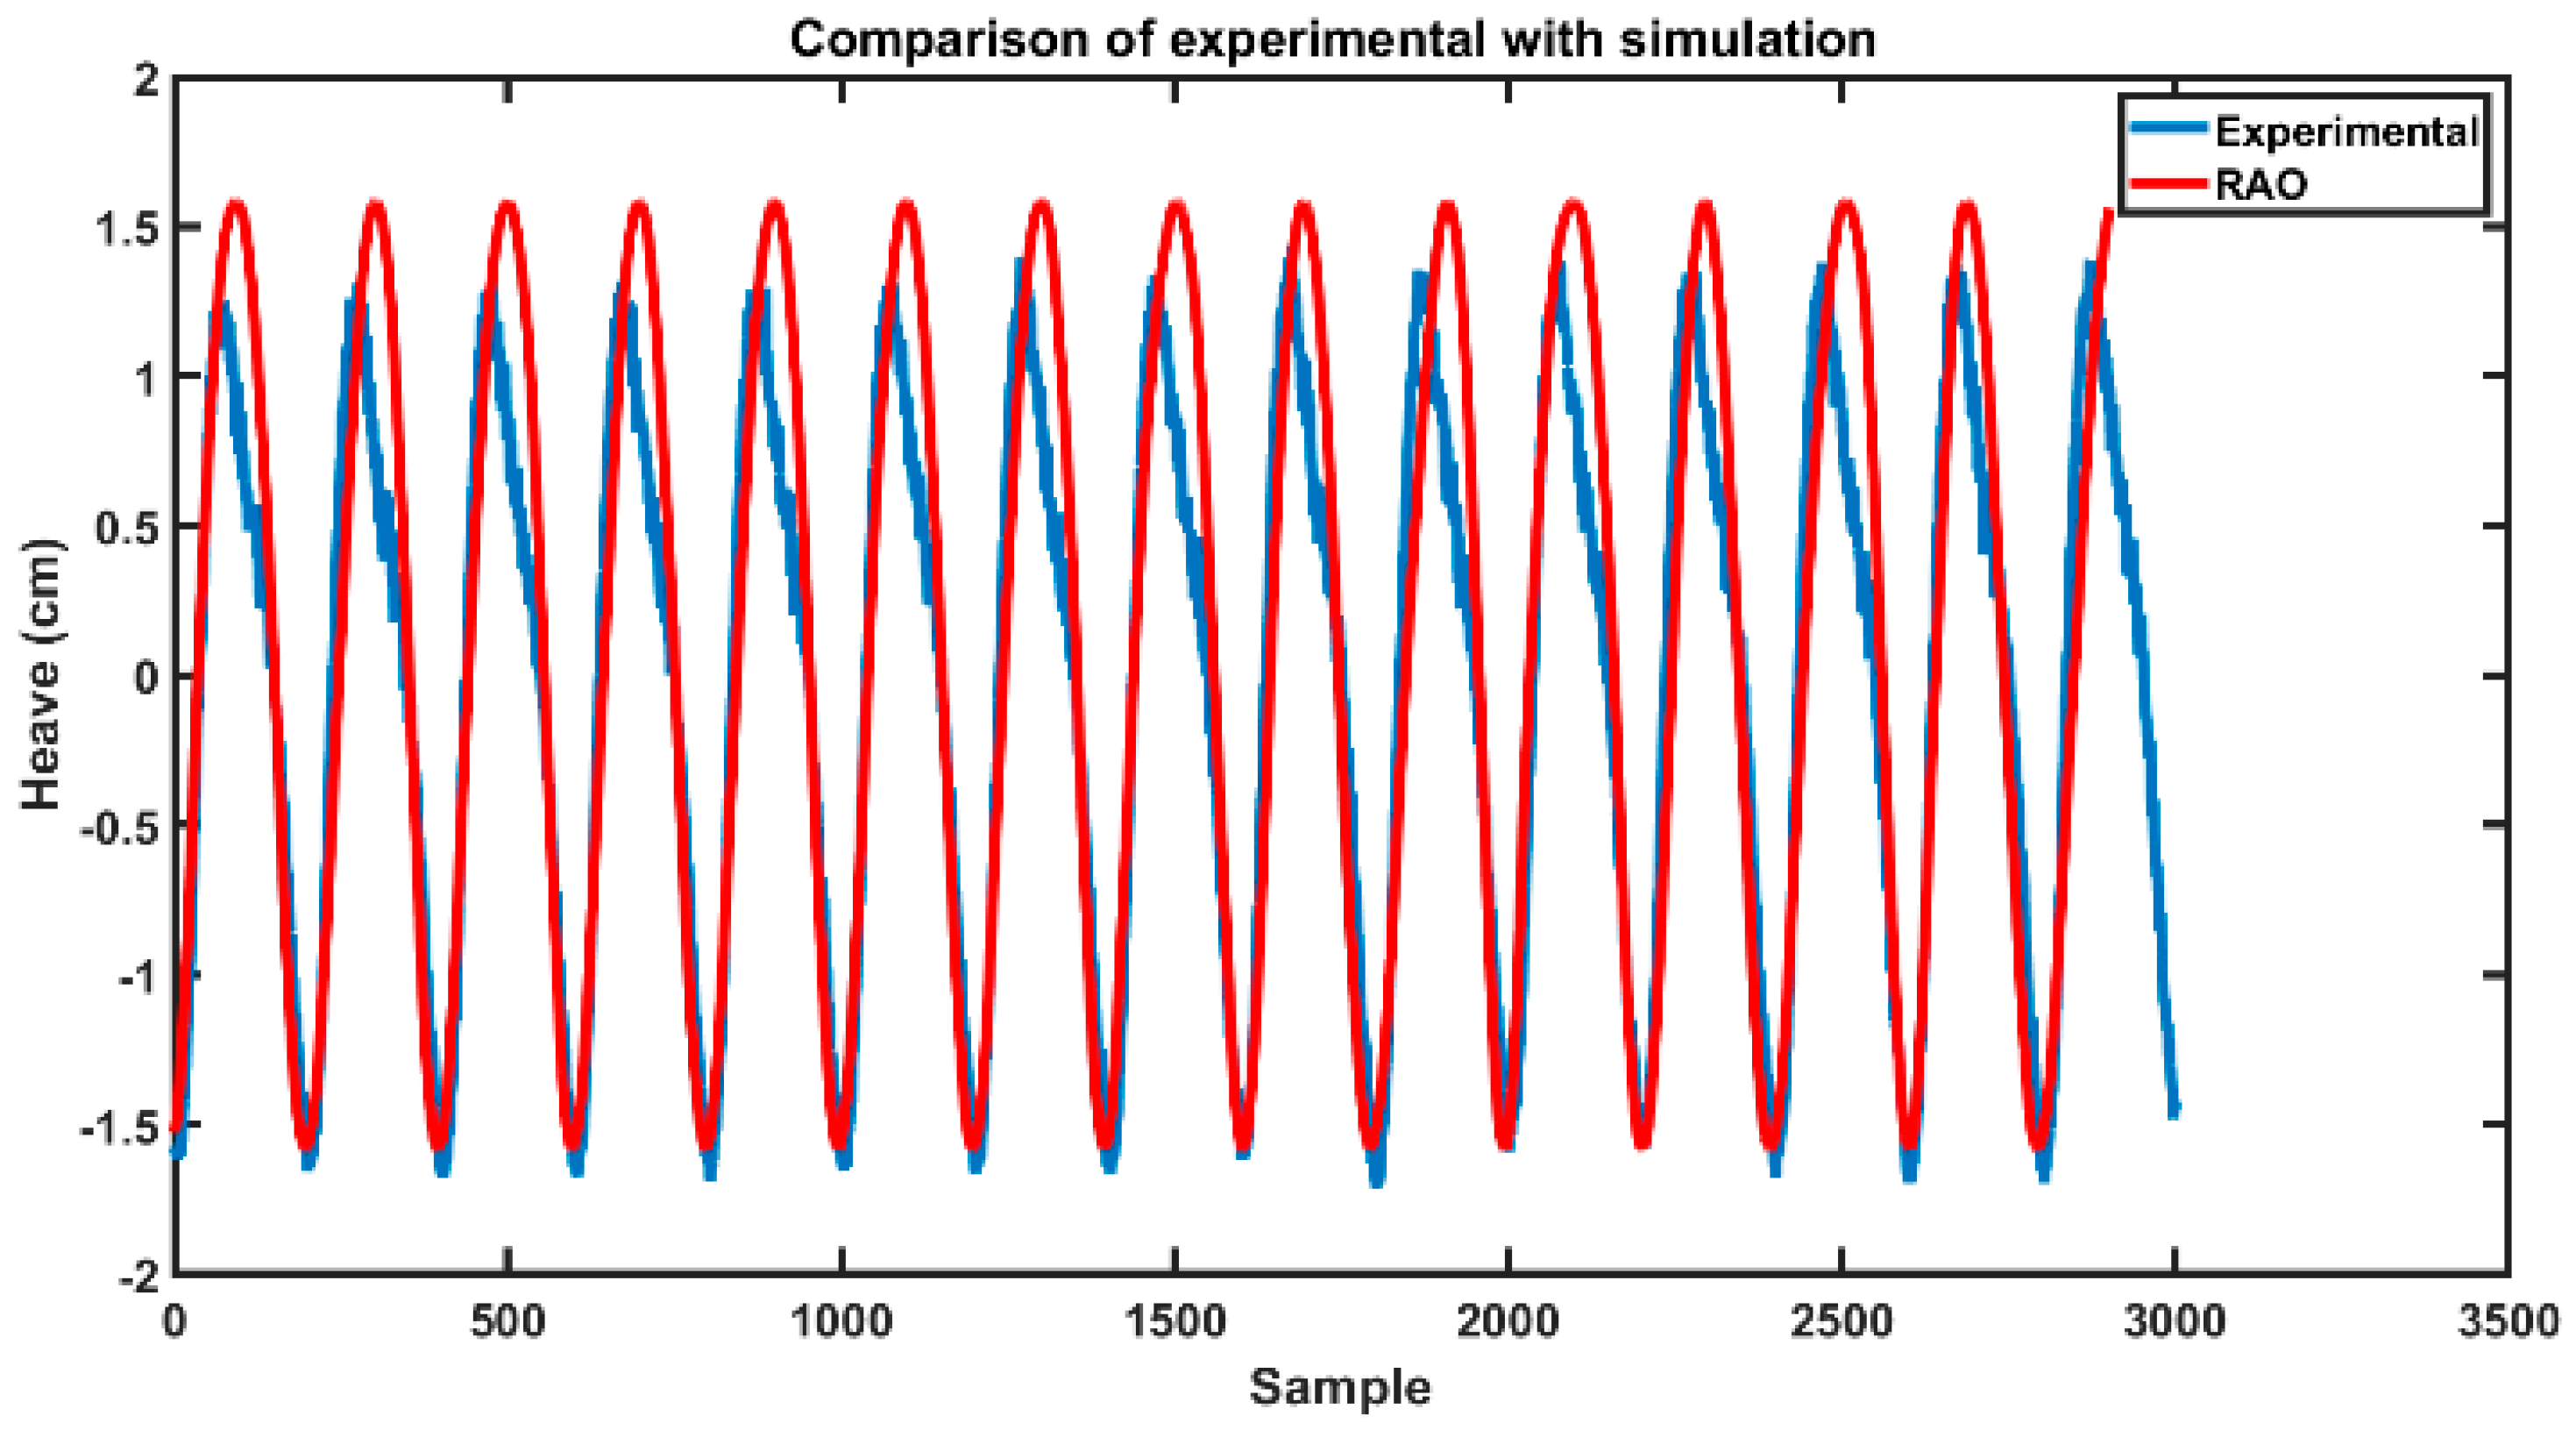
). It basically contains an exciting sphere in the wave basin; further, the simulation in ANSYS AQWA using a sinusoidal wave and (response amplitude operator) RAO-based response. The test was carried out on the heave response in a range of wave periods, starting with close periods of 1.1 and 1.0 s.
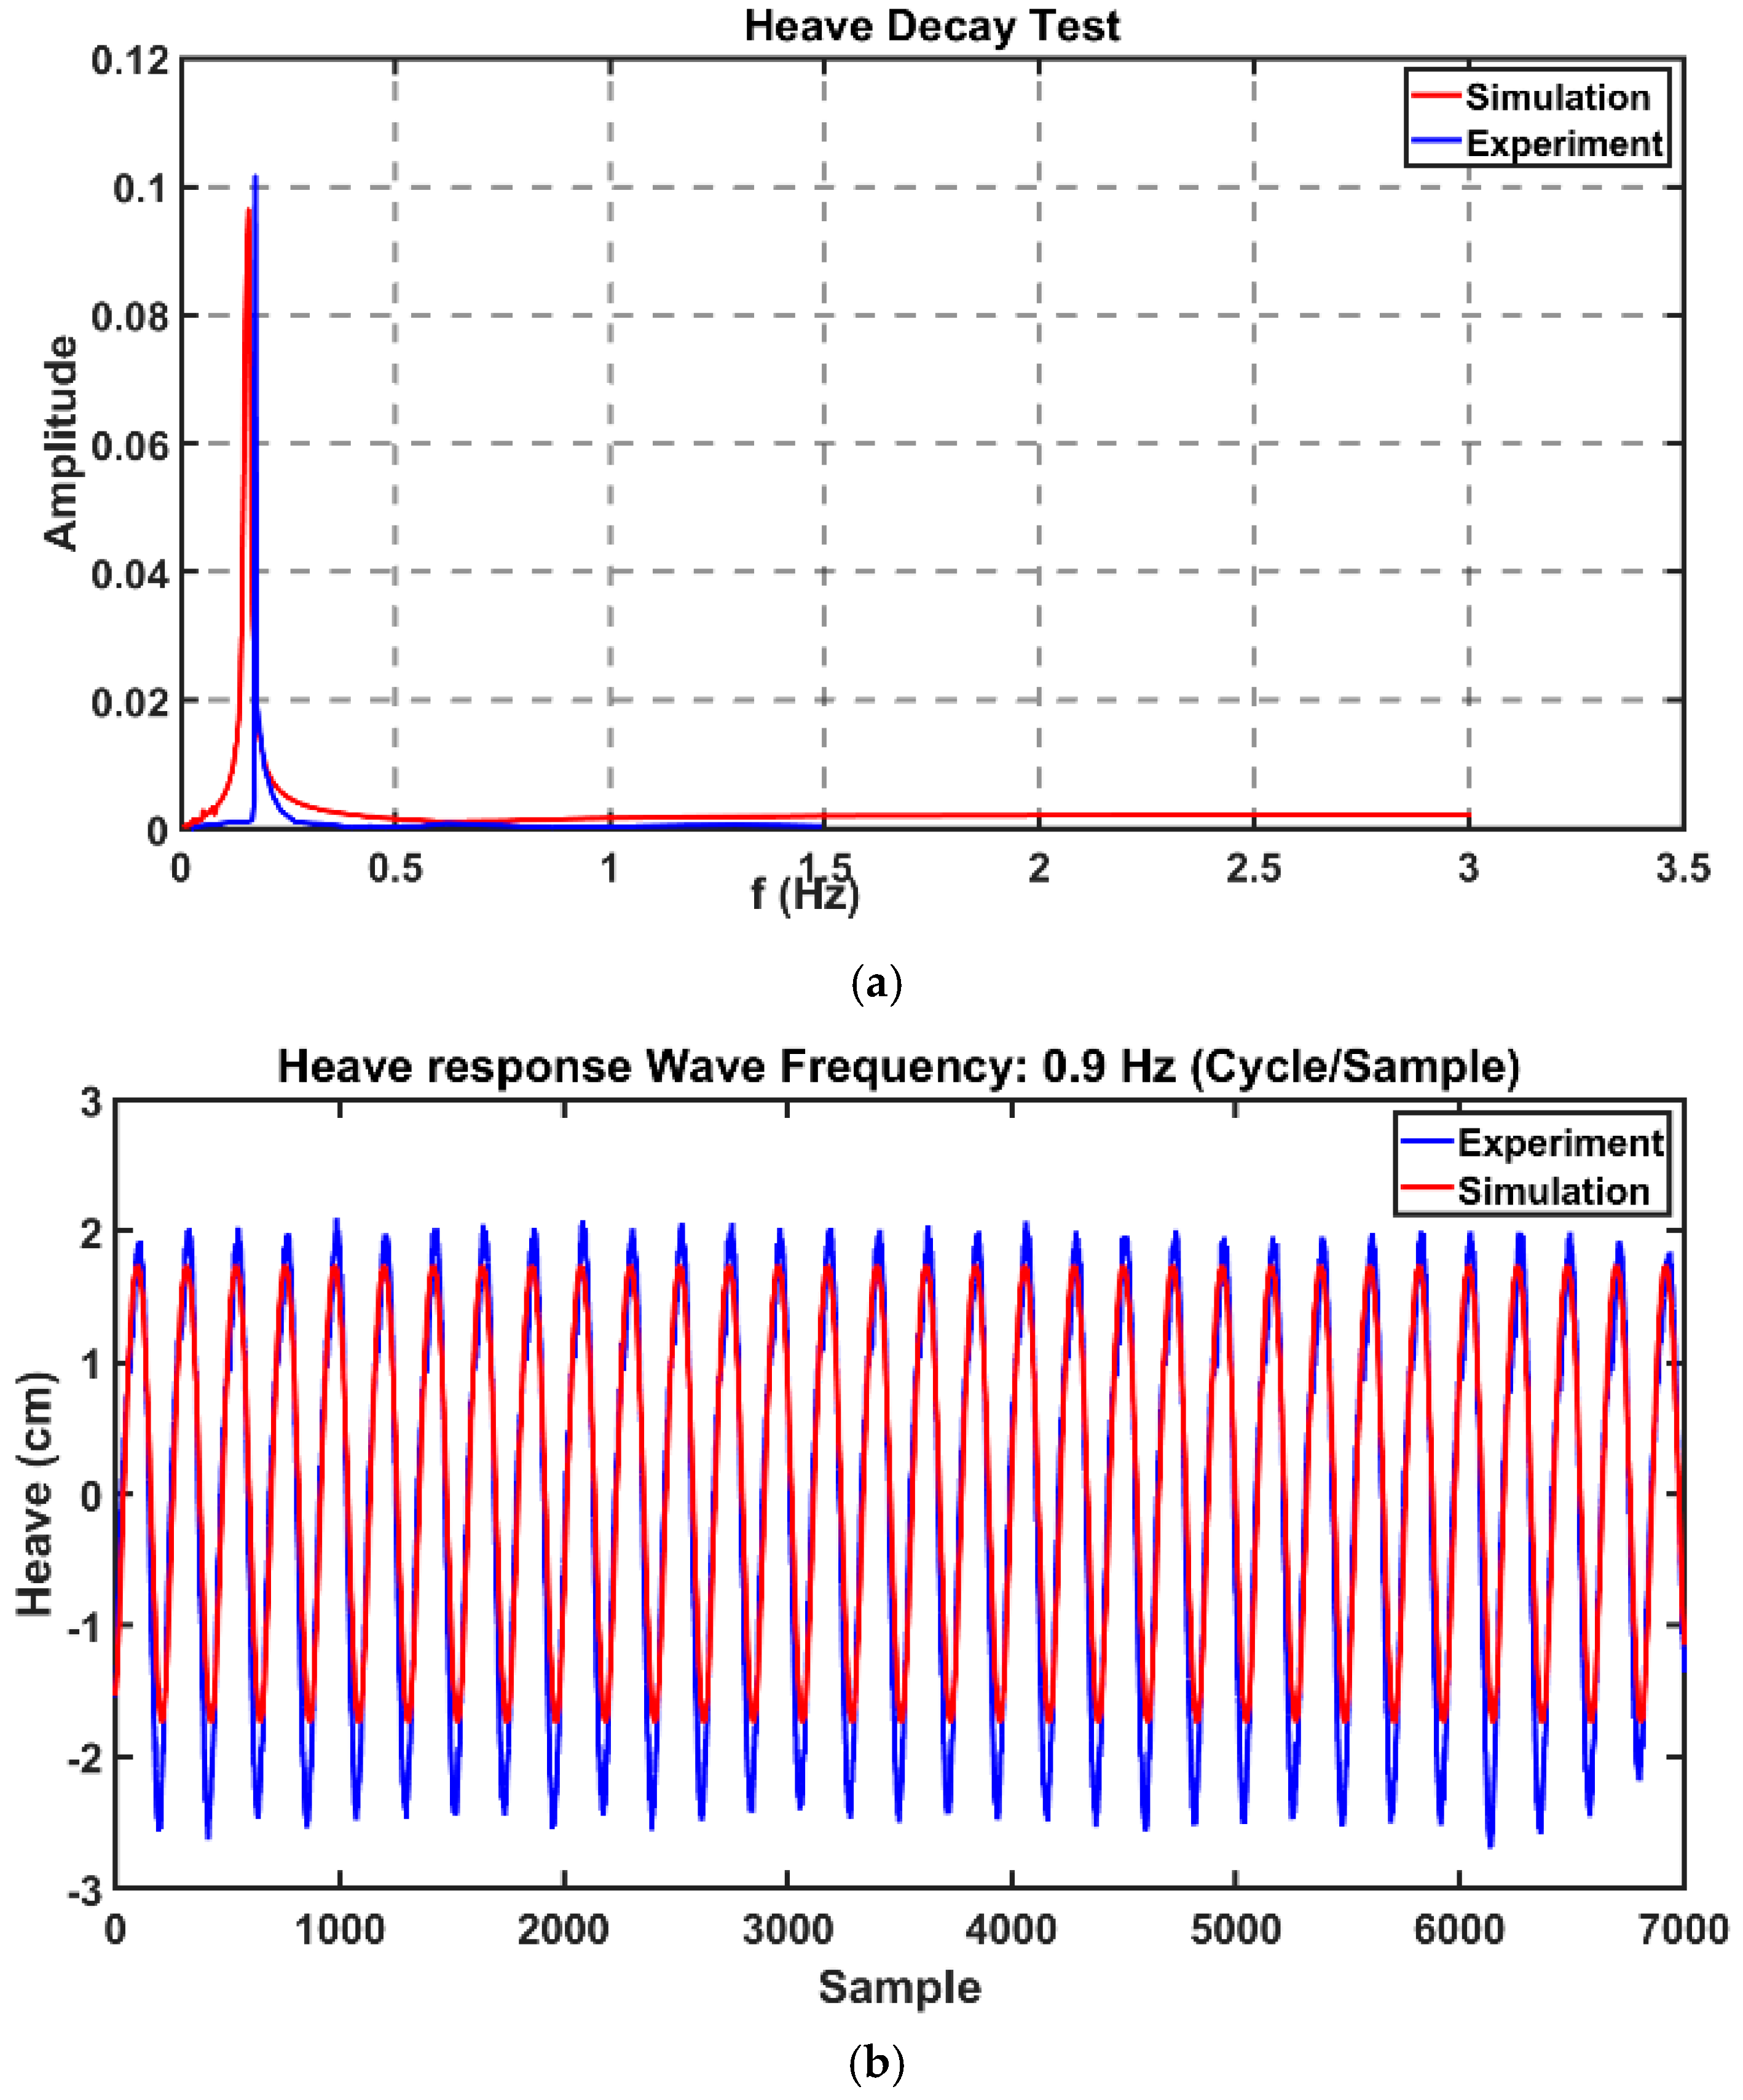
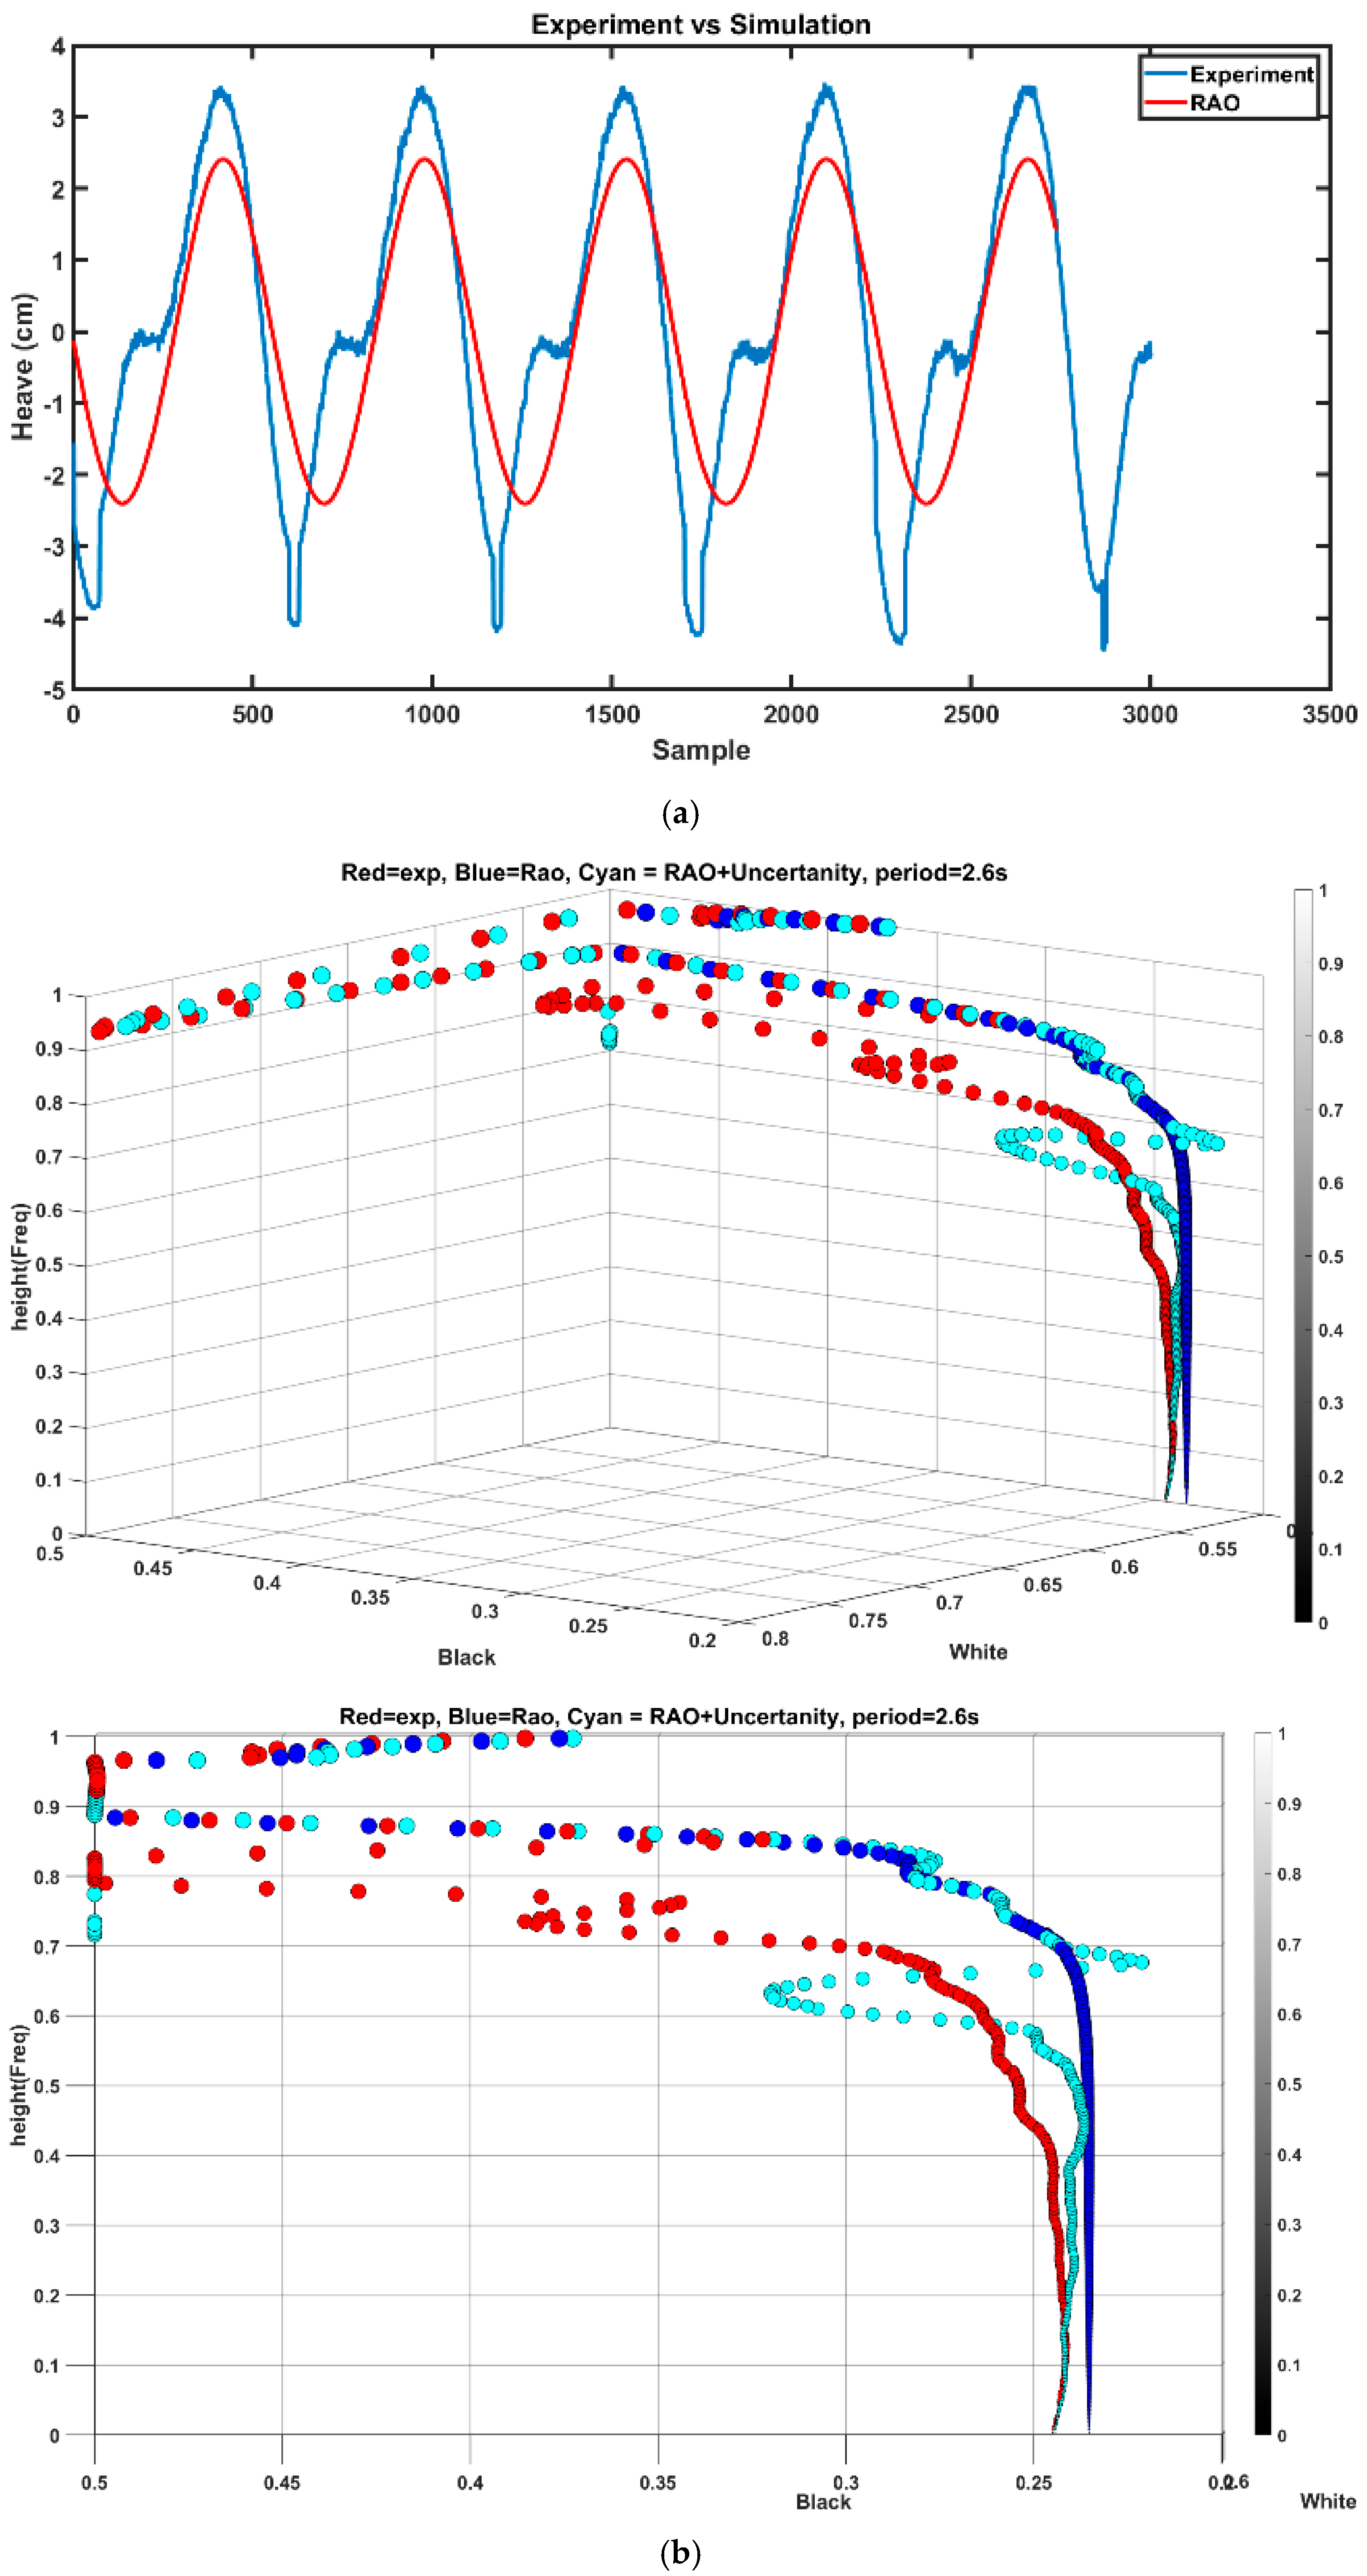
Figure 9 pictures the comparison of experimental and simulation results for sphere heave response for the respective waves. As can be observed, the simulation well met the experimental results apart from minor discrepancies.
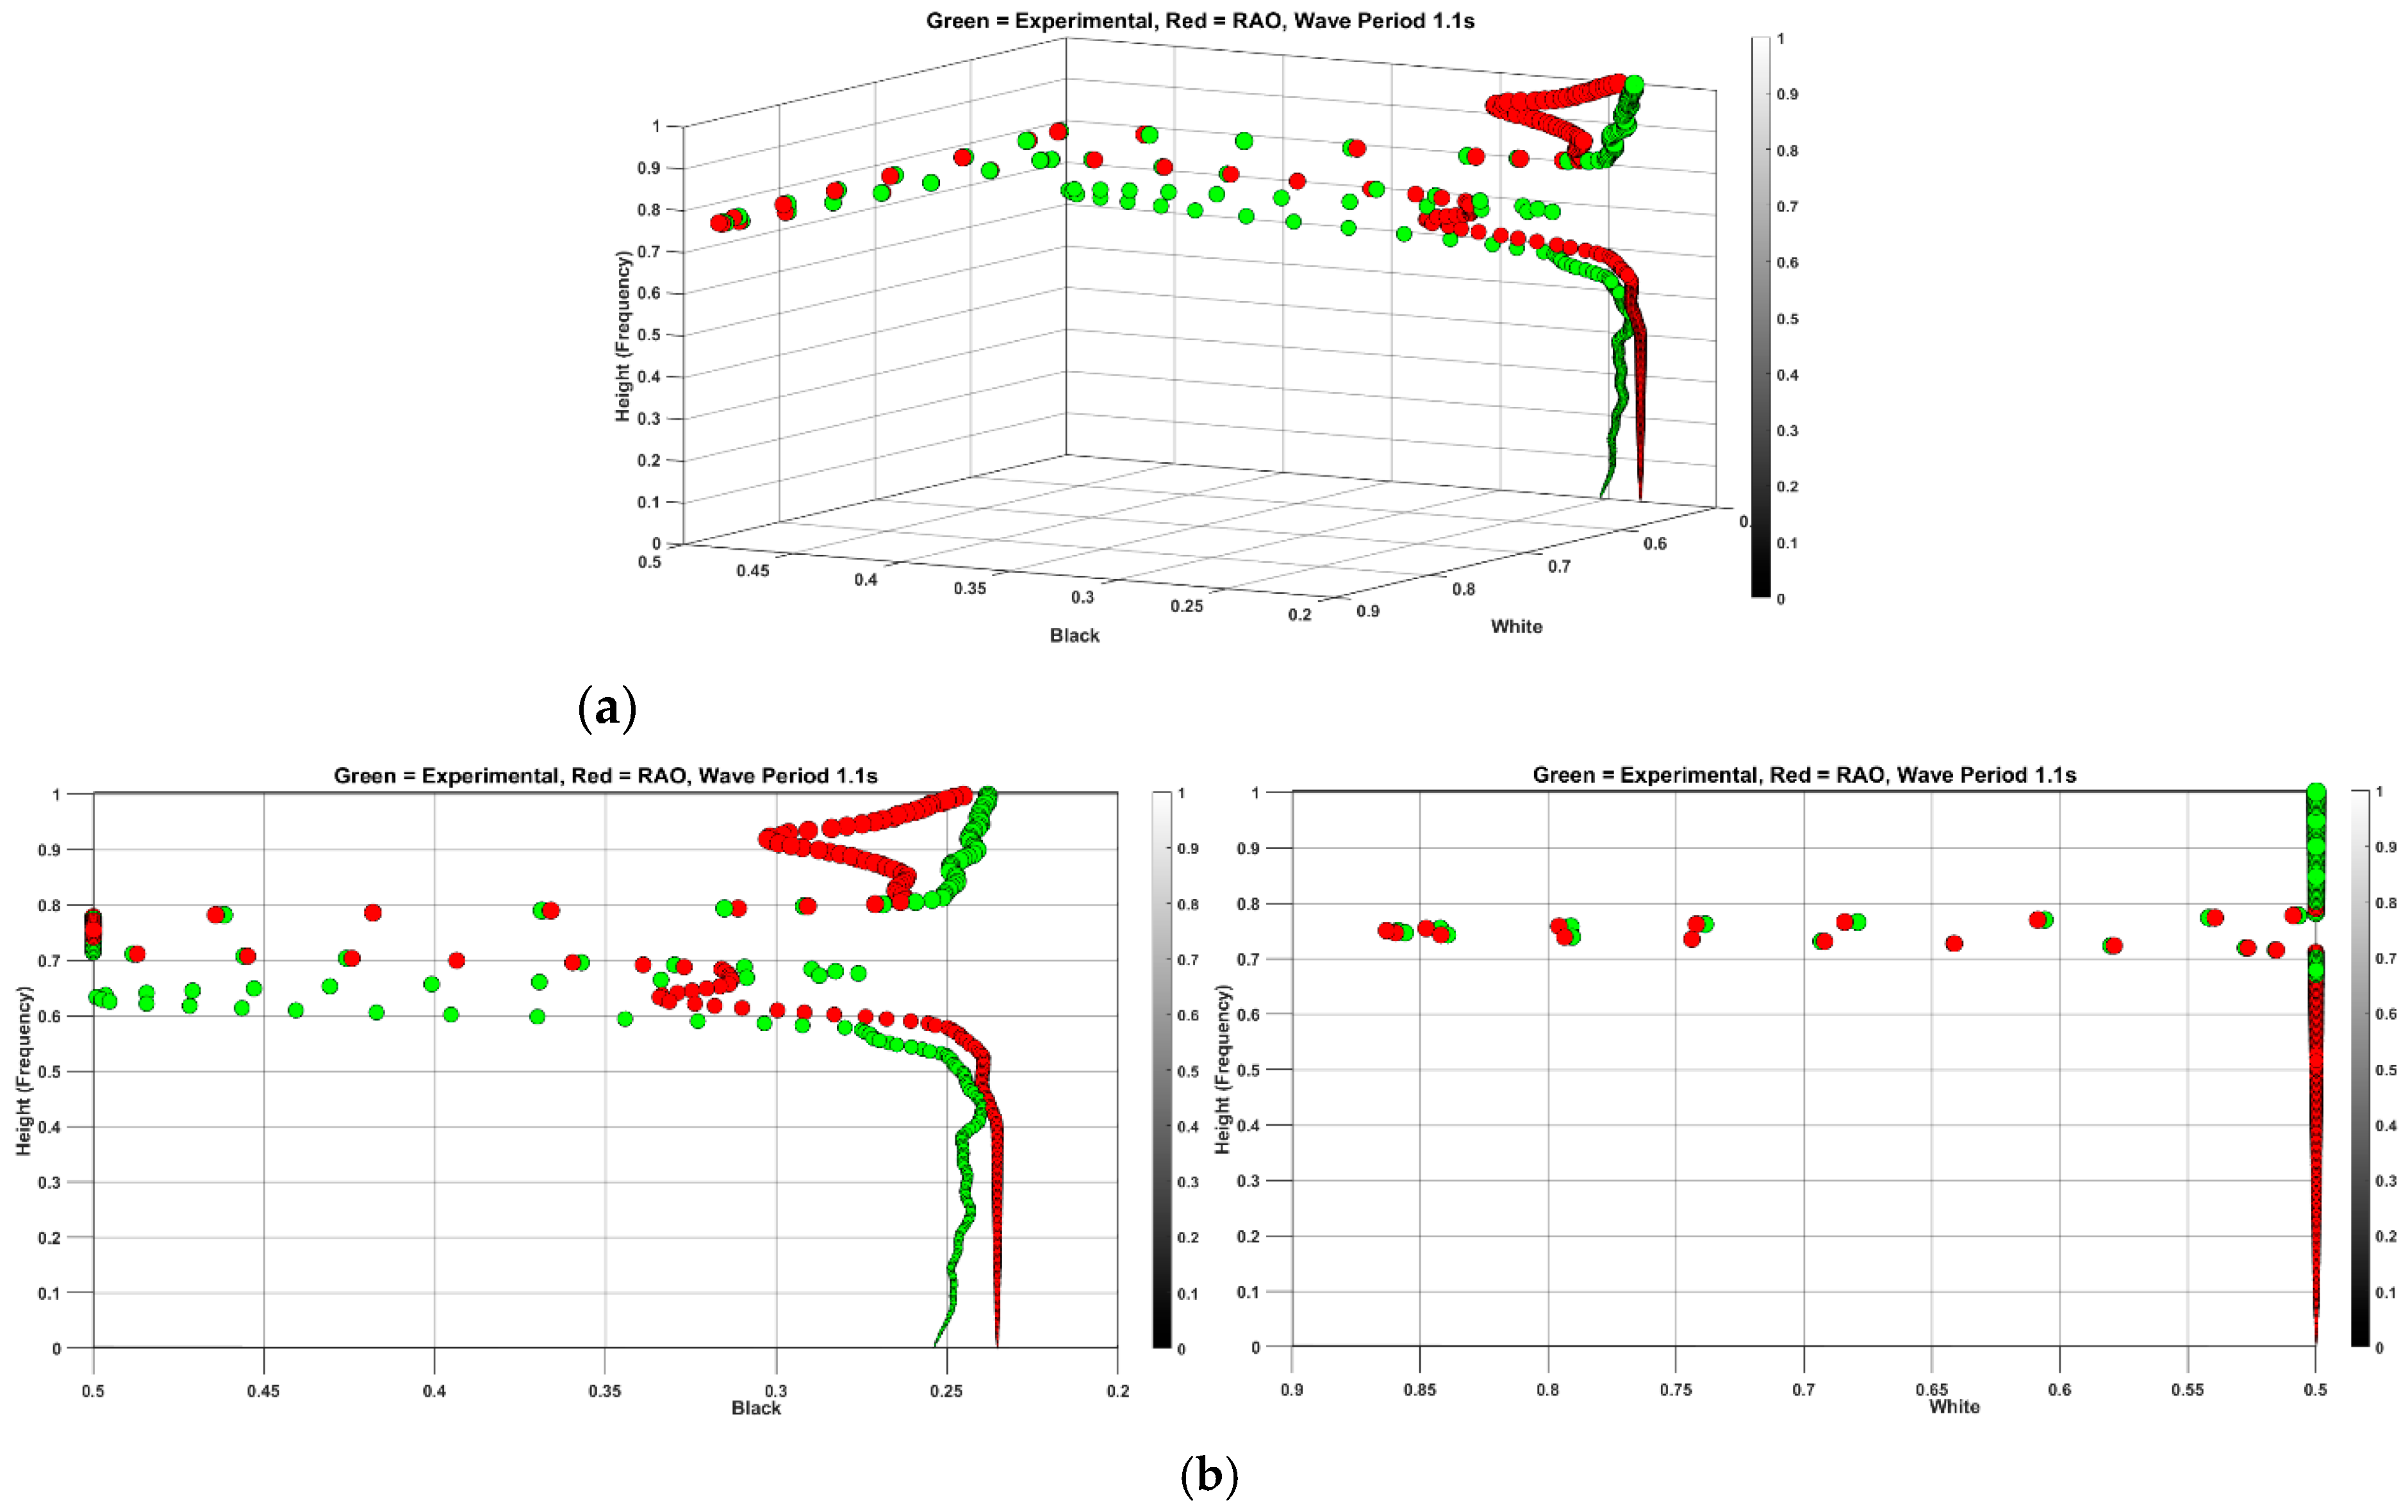
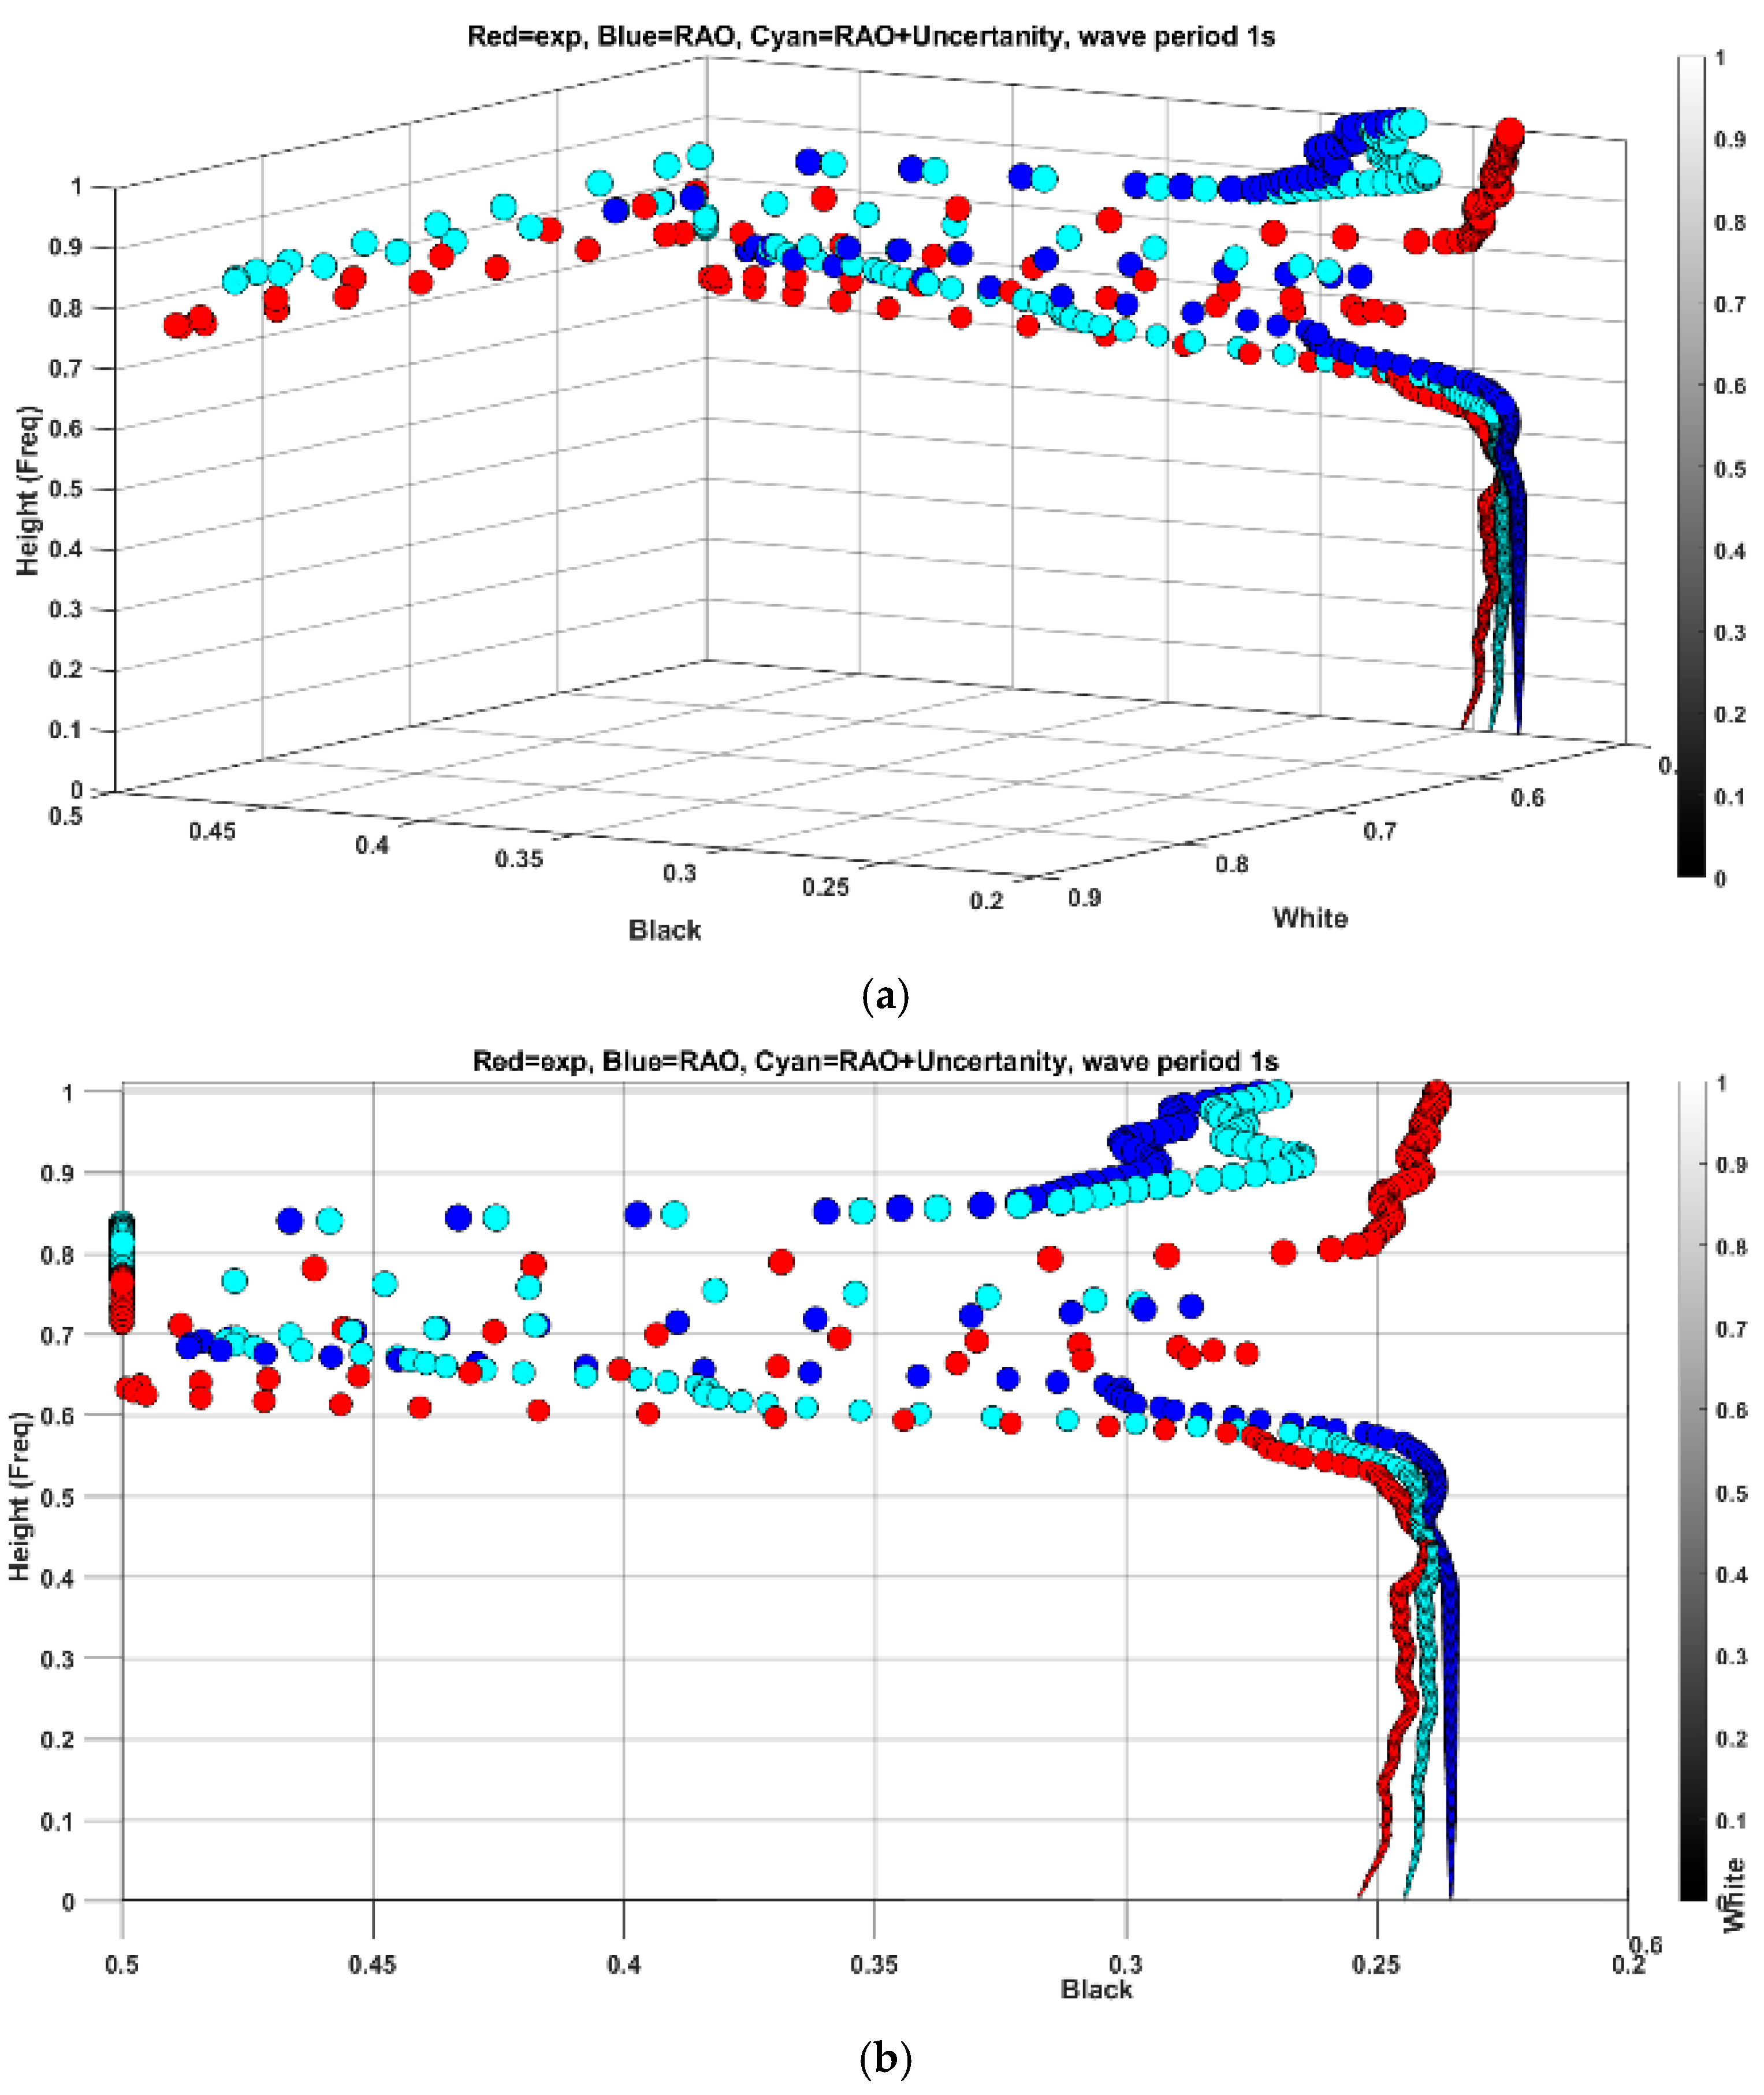
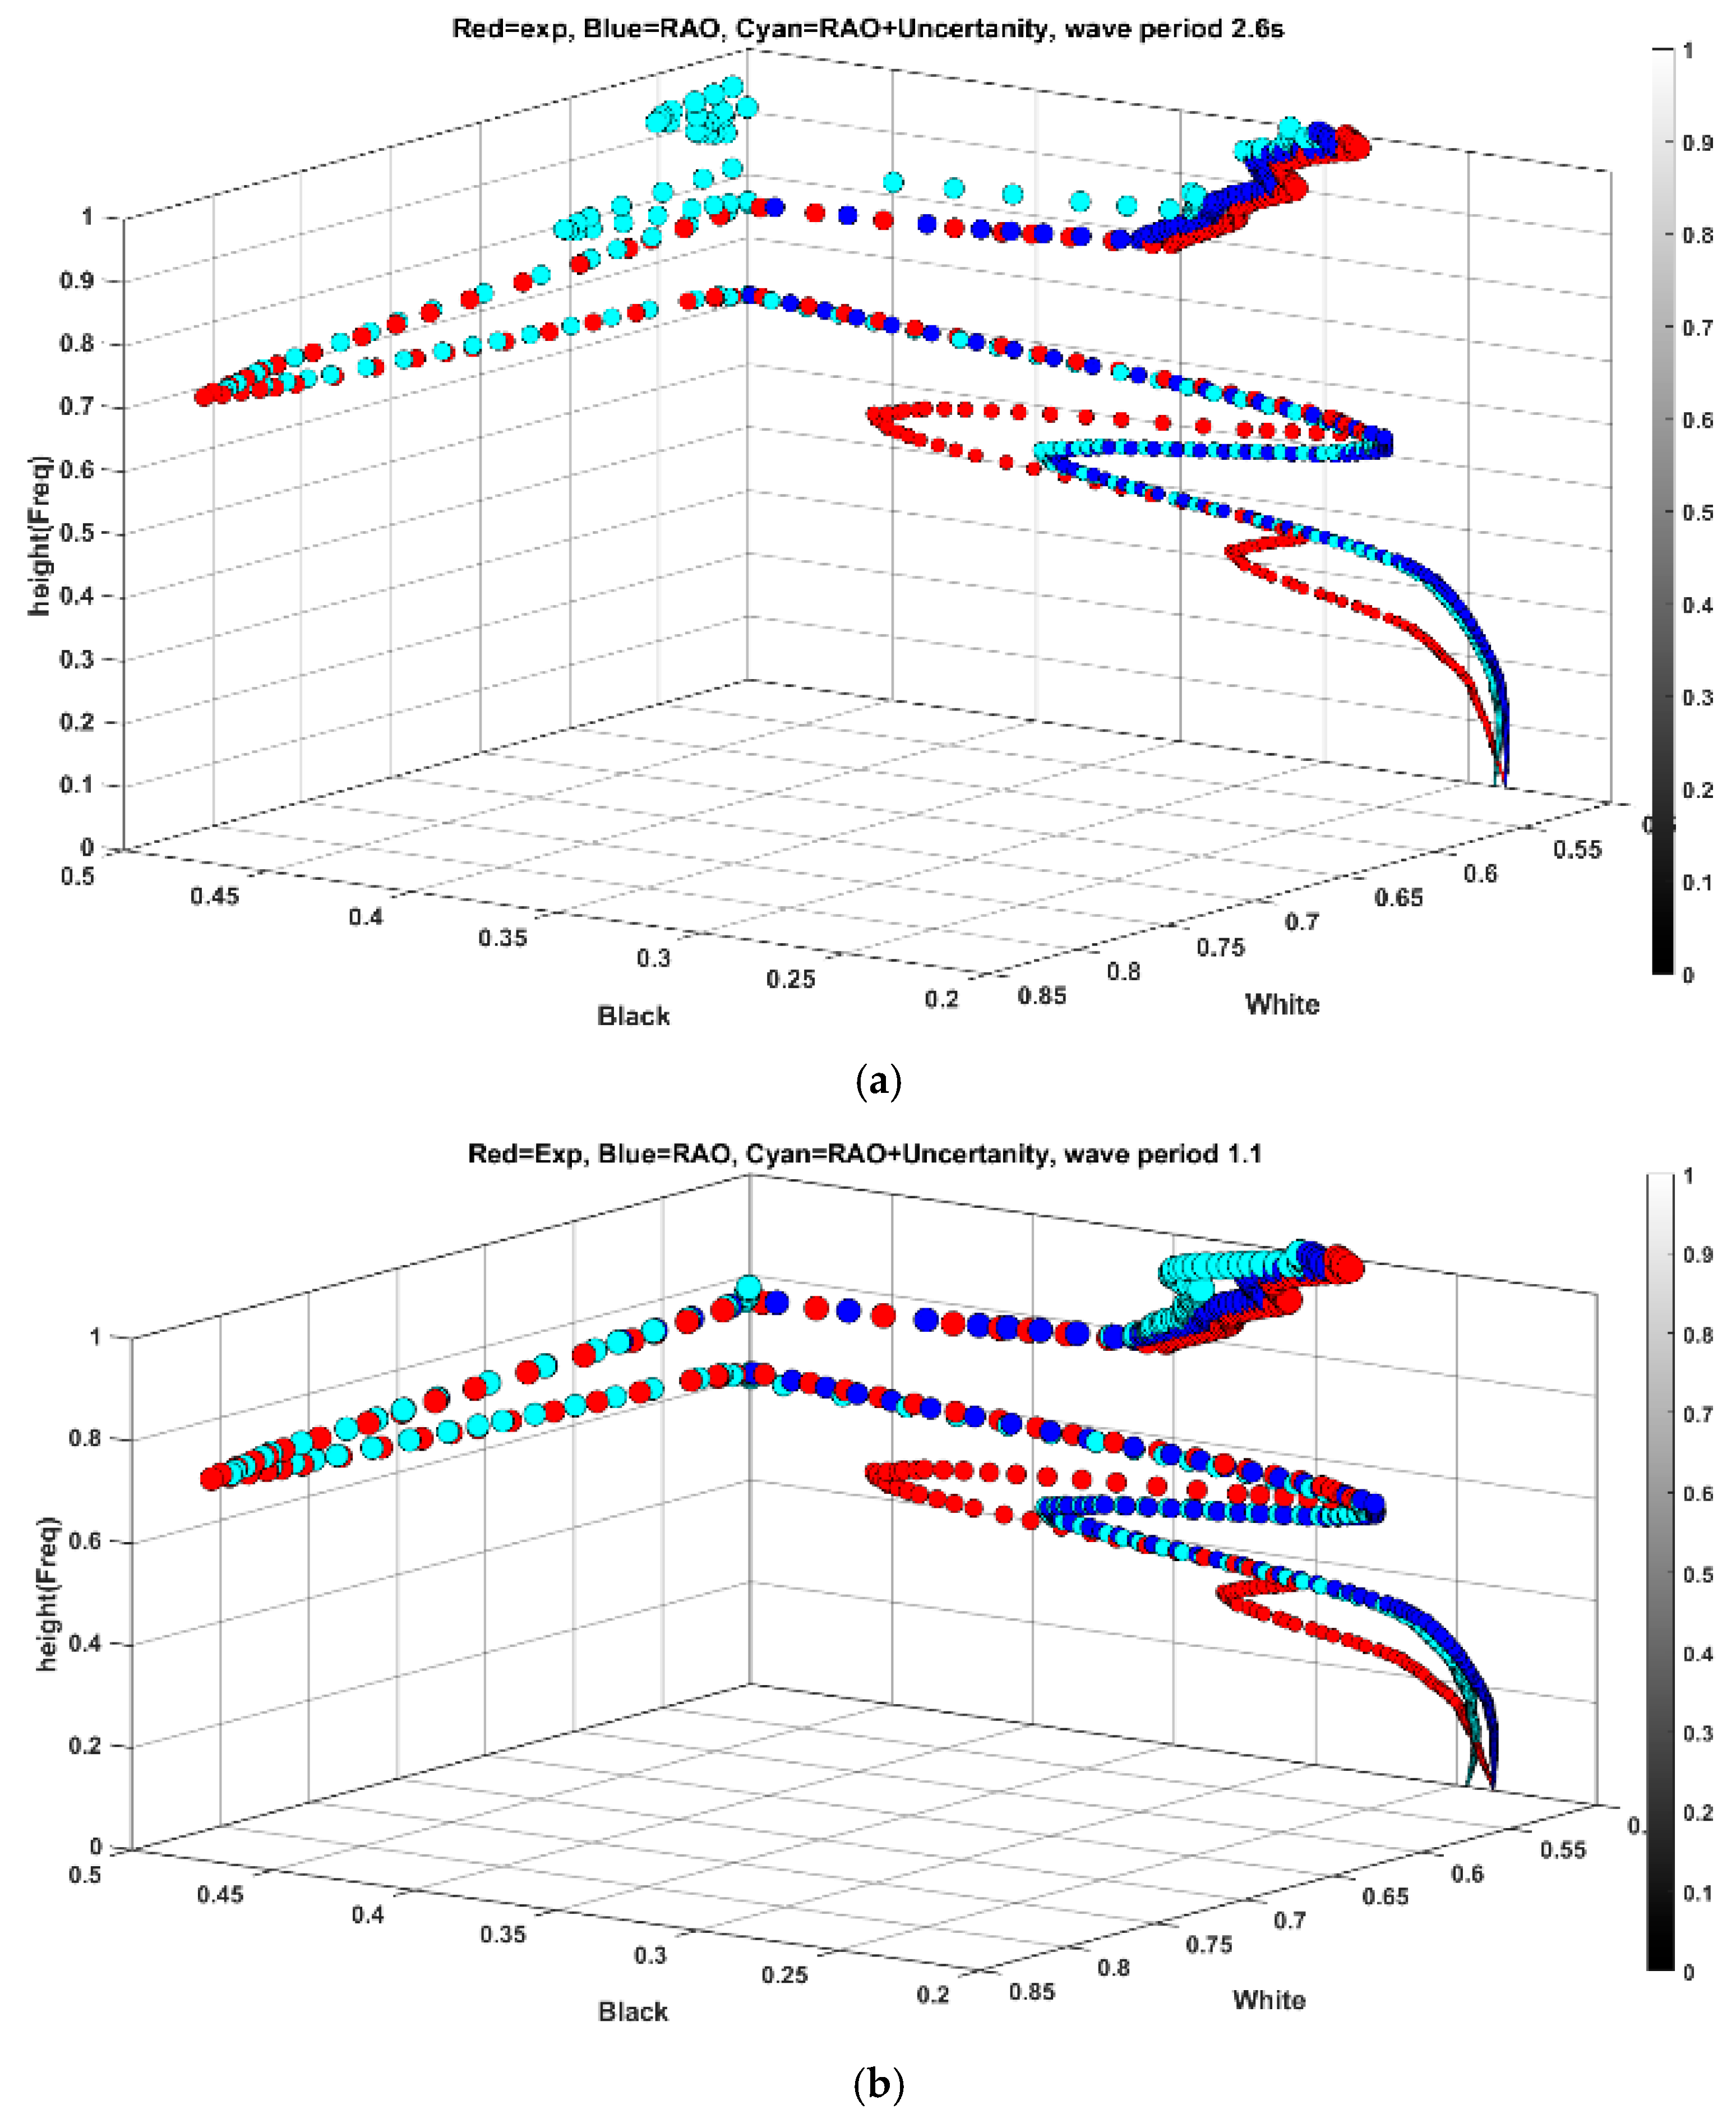
Figure 10 indicates the results of feature spread projection for a heave period of 1.1 s.
Figure 10a indicates the projection of features from experimental tests and simulations in 3D space, and
Figure 10b shows the projection of vectors in white and black planes. According to
Figure 10b, the difference between features accumulated more in high-frequency regions with less signal amplitude (blackish pixels), whereas the difference in low-frequency regions with higher amplitude is less pronounced with quite a similar pattern.
Examining the planes in
Figure 10b, it is evident that the low-frequency traits, depicted in the white plane, remain consistent and nearly identical between experiment and simulation. However, notable disparities emerge in the projection onto the black plane, despite overall spread similarities. As noted earlier, the presence of noise amplifies the variance in feature distribution, a trend also observed in black plane values below 0.5, mirroring the behavior seen in
Figure 7. This discrepancy can be attributed to inherent uncertainties in the experiment, which are challenging to replicate in numerical simulations.
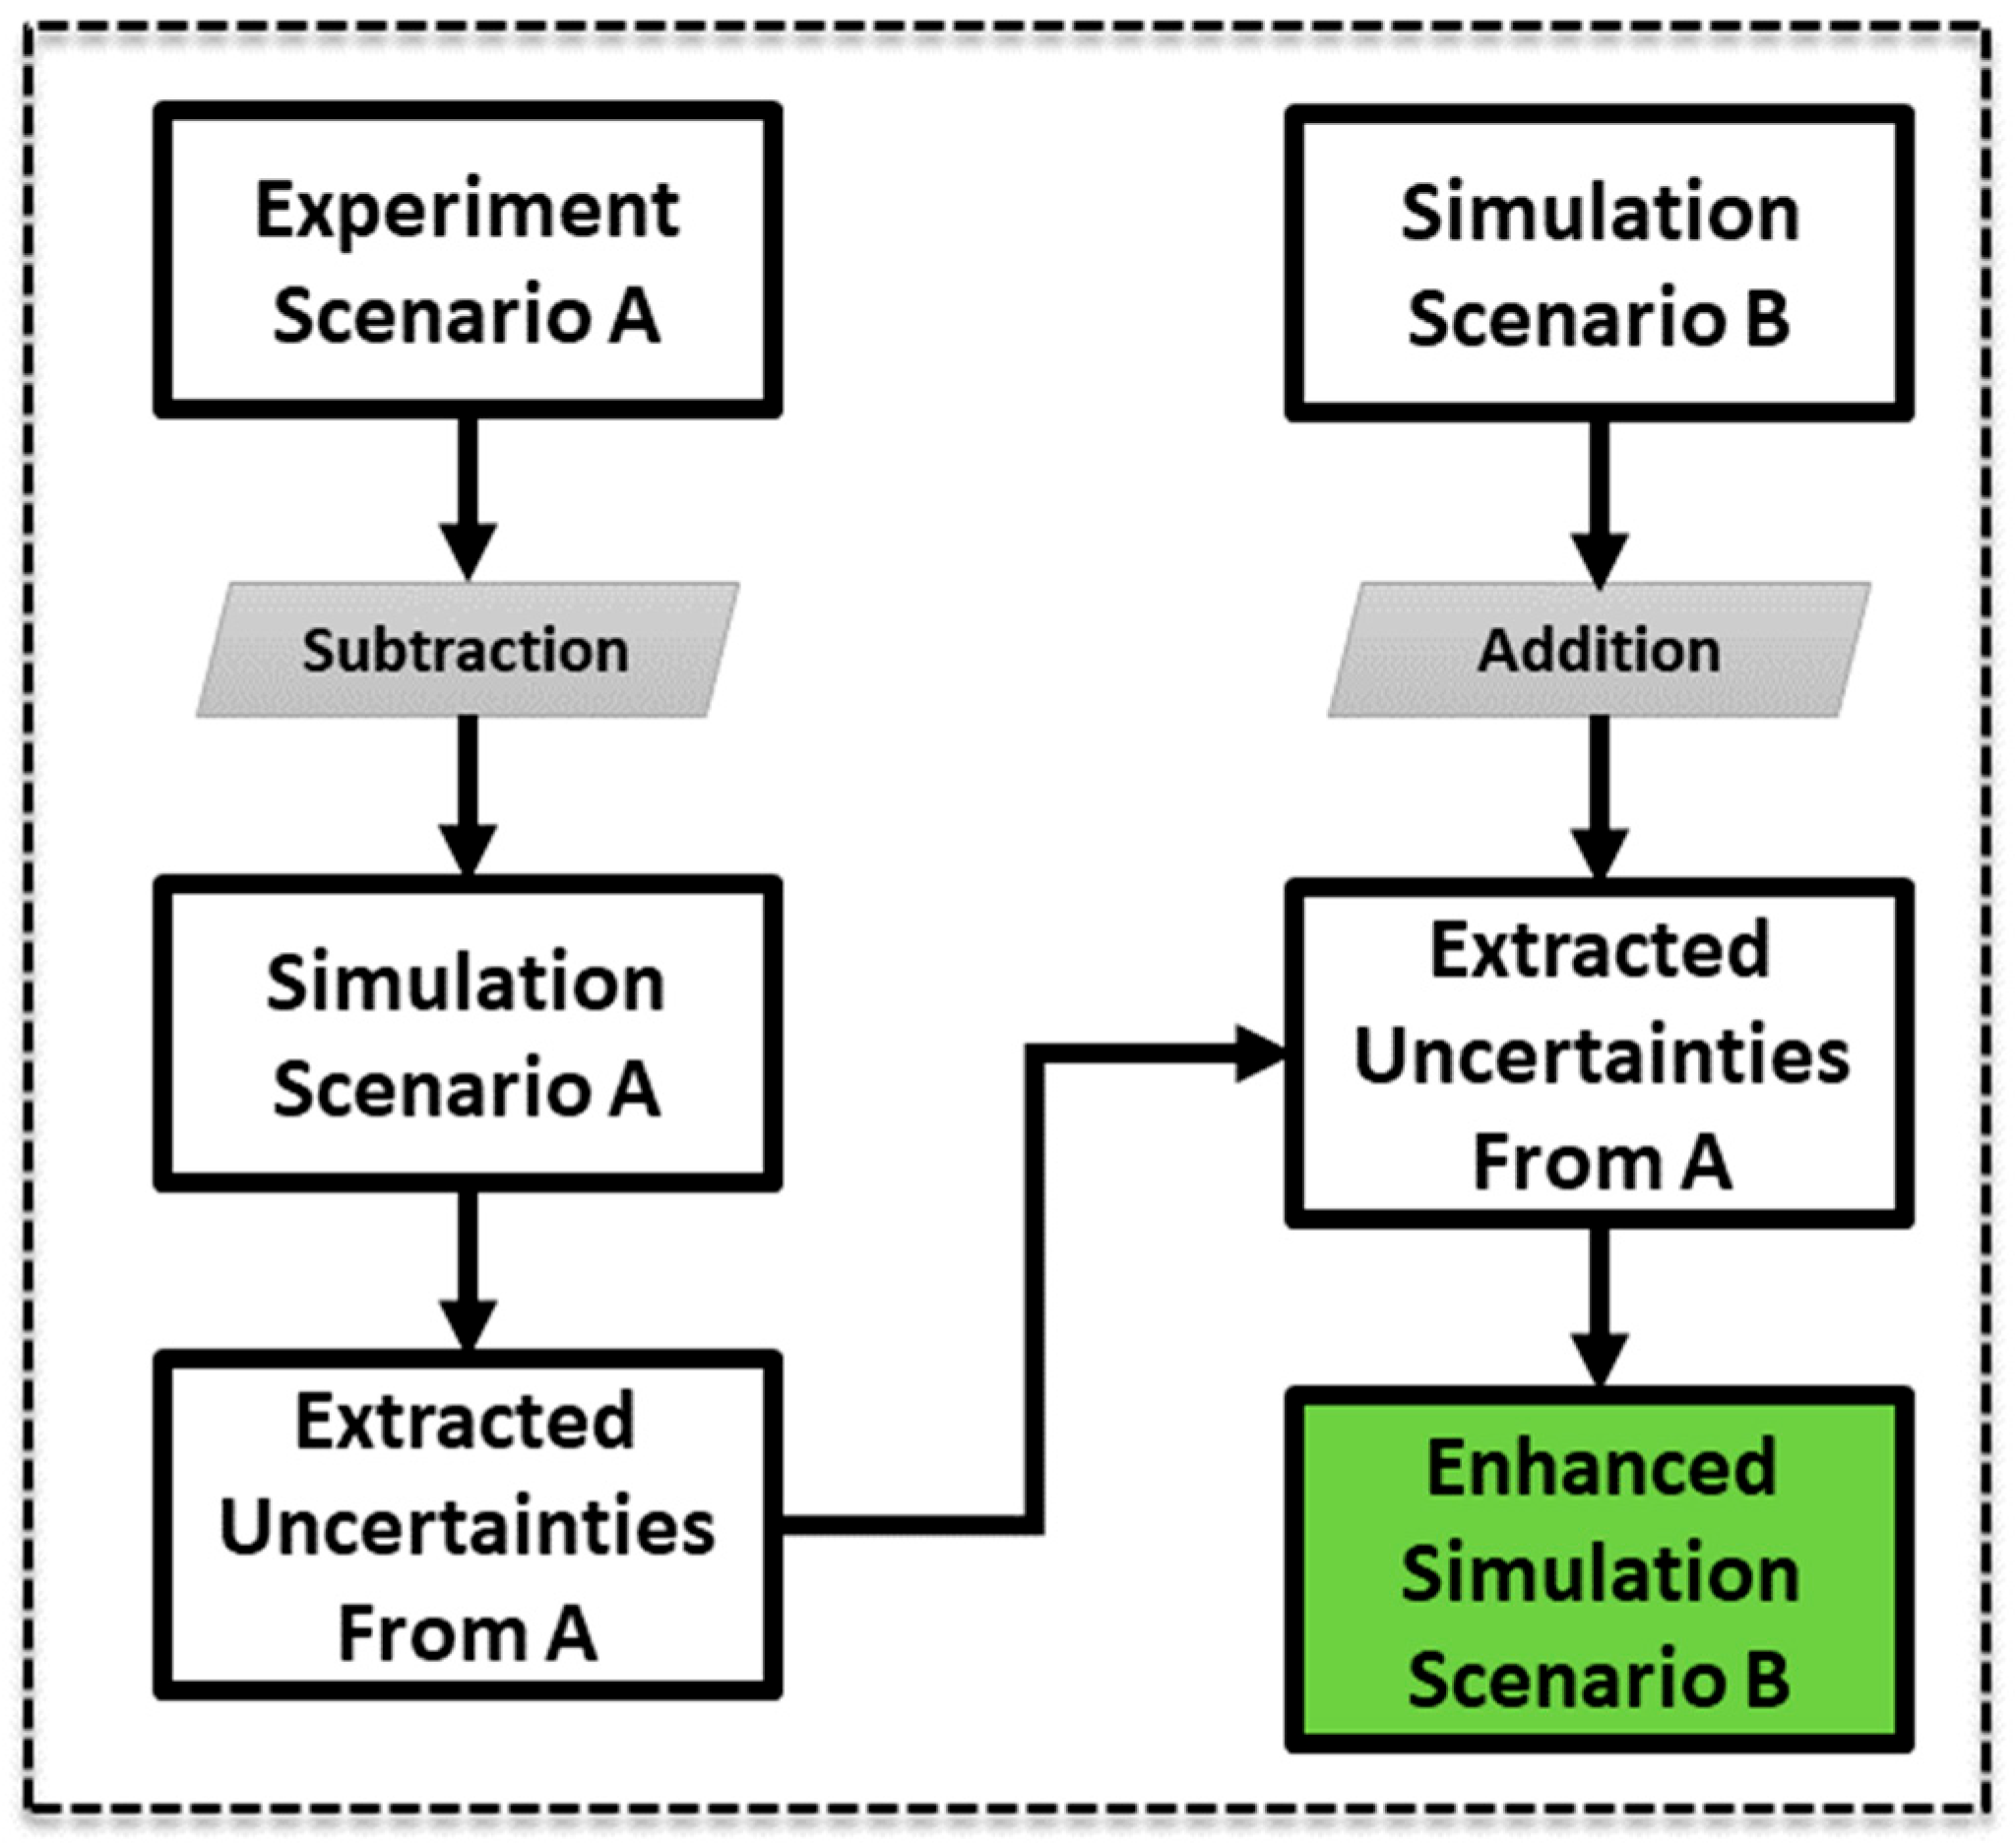
Revisiting primary objectives, integrating entropy is vital for ML applications, as demonstrated in
Figure 11, showcasing the proposed method for enhancing simulation outcomes through uncertainty integration. In essence, the features of simulation data with a period of 1.1 s are subtracted from the experimental data in each plane, and the residual features are combined with those obtained from simulation with (another period) a period of 1.0 s. To this end, the vector
as the sphere response from the experiment, which includes only
for heave, is reconstructed in two vectors of
and
, where
and
, and they are projected on white and black planes, respectively. The same operation has been carried out for vector
as the result of simulation as well as projection vectors
and
. Equation (8) shows the simple algebraic subtraction that yields the residual features
and
.
Considering the same operation for scenario B with
, the vector of response simulation for period 1.0 s and
and
, the projection vectors, the new vectors that will be compared with scenario B (experimental data) can be obtained from Equation (9).
denotes the enhanced features on white planes and
on black planes.
As it had been surmised, the new feature spread in the resulted vectors must show a closer distribution to the experimental data of new period 1.0 s in comparison with the simulation.
Figure 12 indicates the features spread for vectors on the black plane for wave period 1.0, scenario B. As can be seen visually, the cyan color data represent the new spread that is qualitatively closer to experimental data. Regardless, the result must be evaluated quantitatively, so the root mean square error (RMSE) value between features has been adopted to quantify the overall magnitude of error. In the black projection plane, the RMSE between new features and experimental data was found to be 0.0738, whereas the RMSE between RAO-based simulation and experimental data is 0.0872. However, cyan and blue points matched for the white plane, and the RMSE for both is 0.792. To conclude, the proposed feature space framework has improved the simulation data in a higher frequency range, even though further investigation is necessary to check the functionality of a broader spectral range.
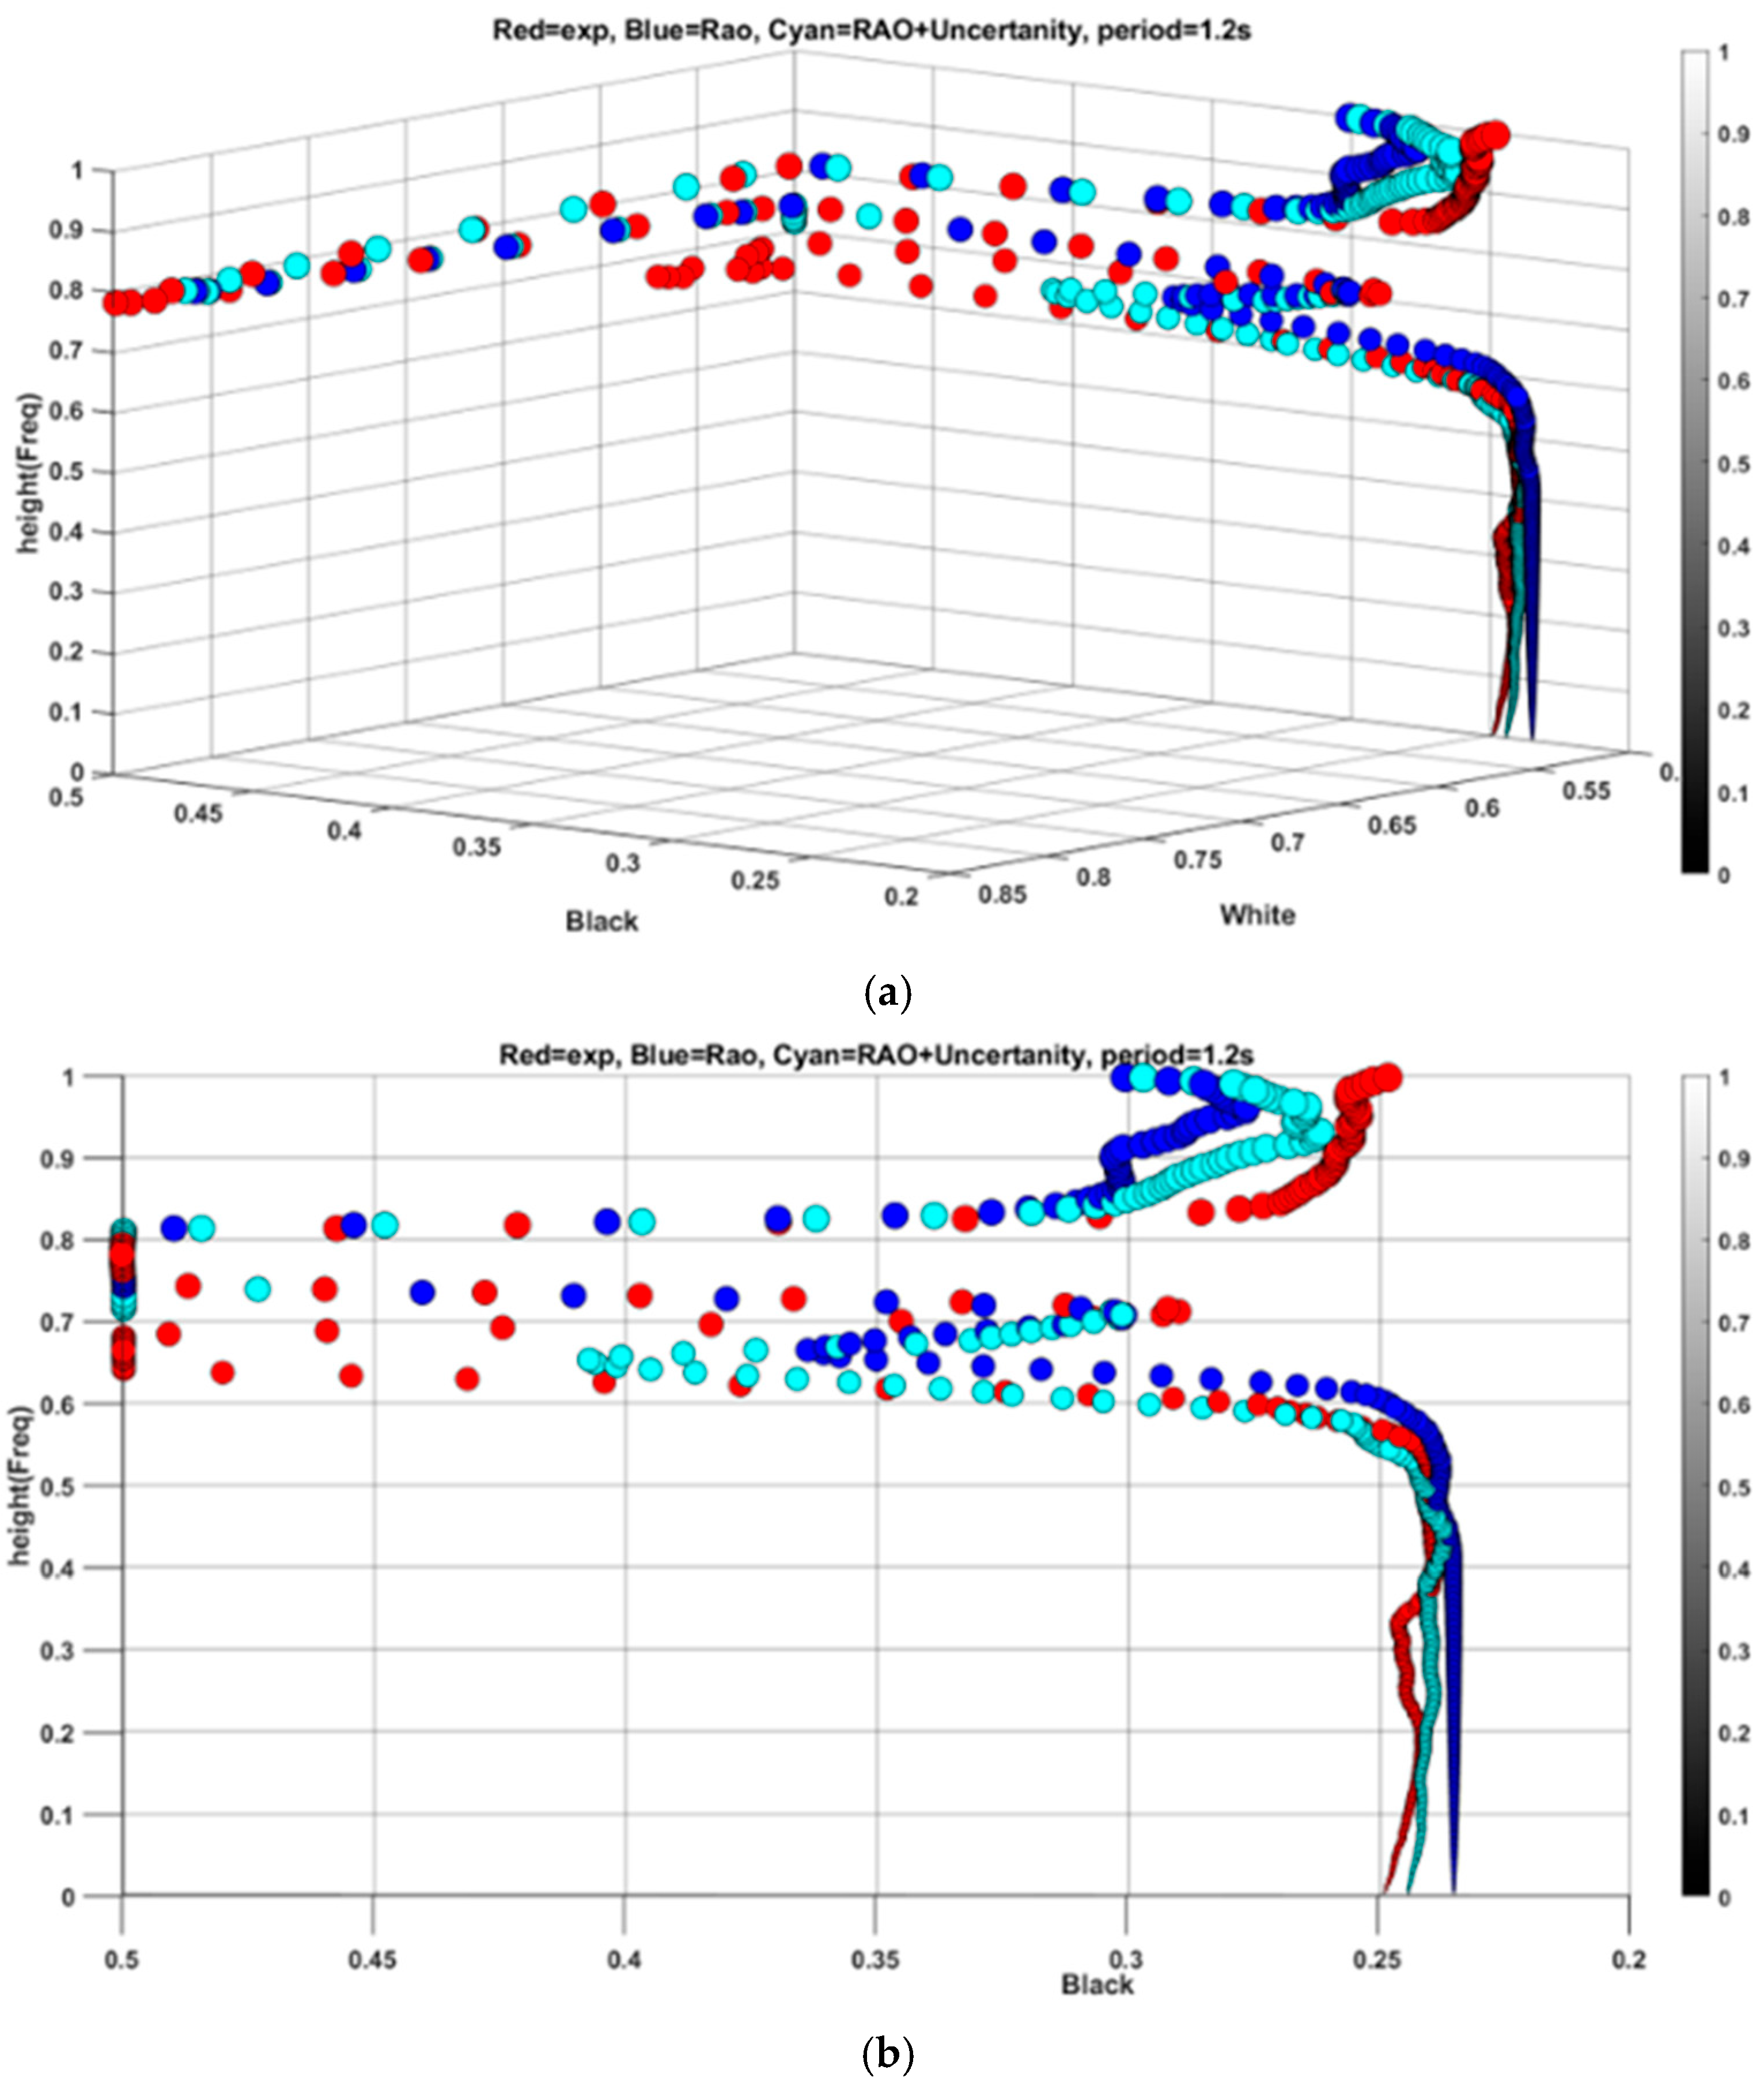
While the proposed method has shown effectiveness for frequencies in a narrow range, it is essential to explore a broader spectrum. To achieve this, periods of 1.2 s, 2.6 s, 2.8 s, and 1.8 s have been selected for analysis. Beginning with a period of 1.2 s, which is close to the base period of 1.1 s, the residual features are combined with simulation data based on RAO with a period of 1.2 s as indicated in
Figure 13.
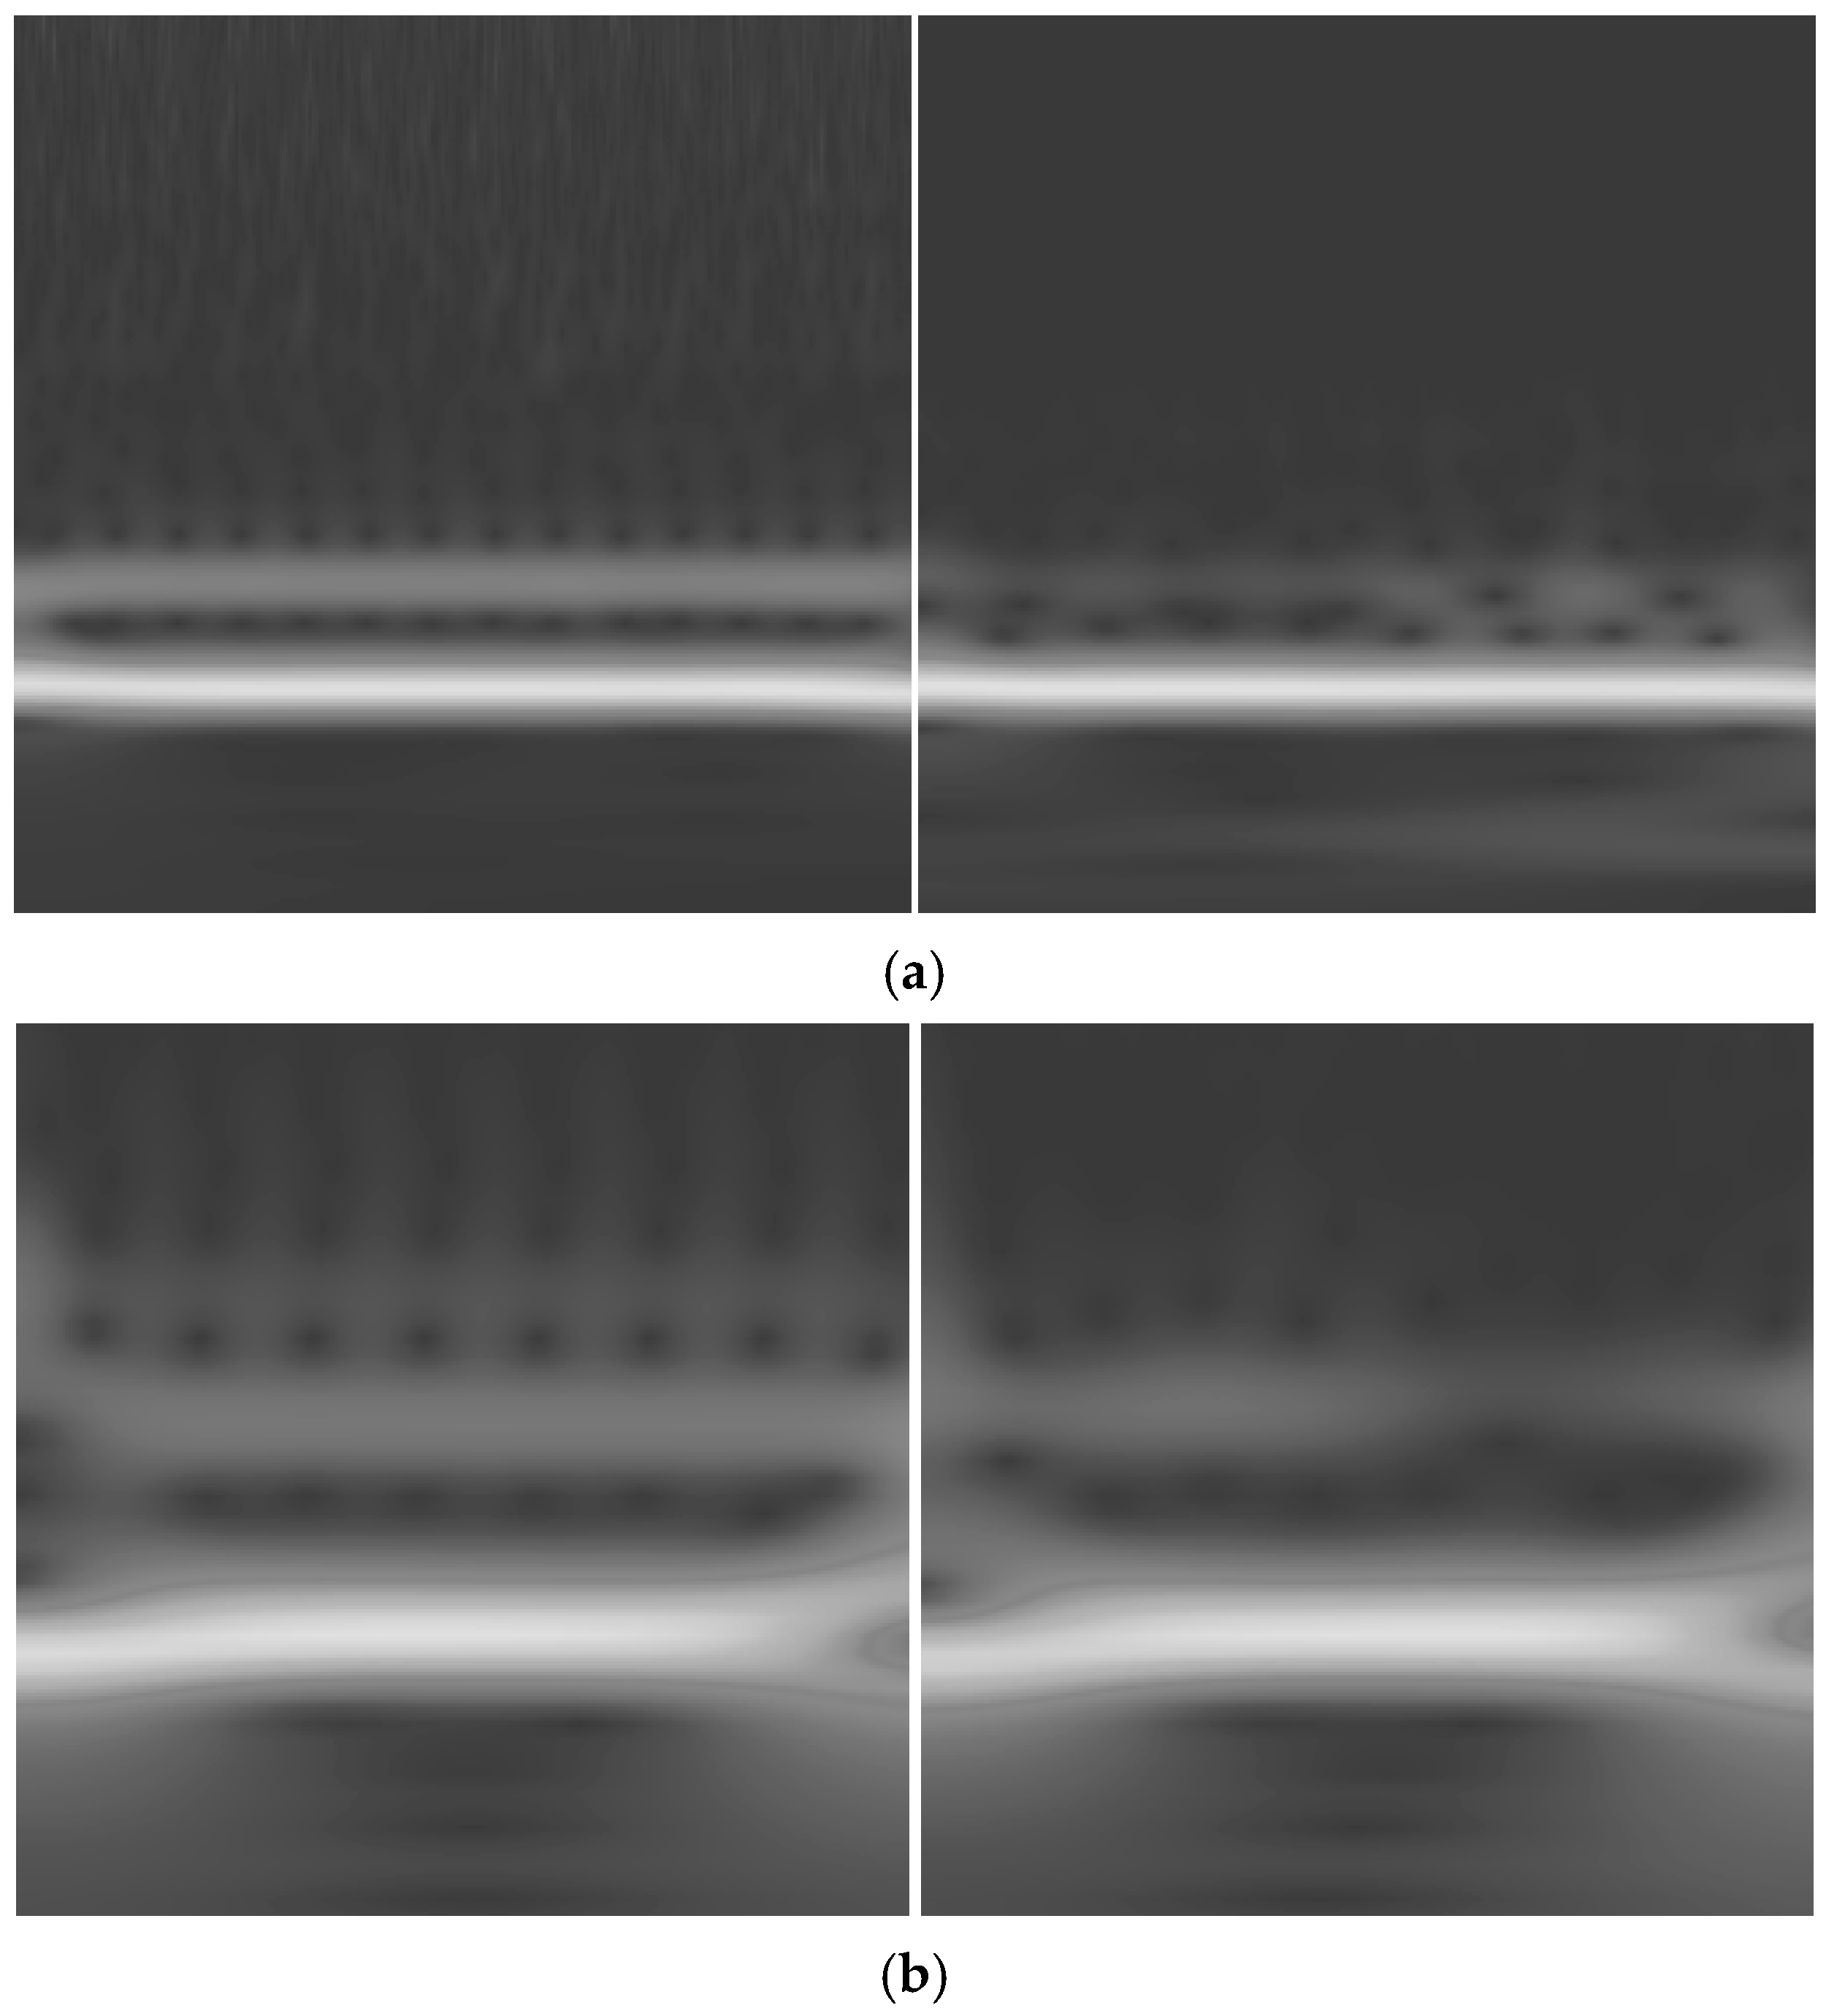
Figure 14a displays the time series of the heave responses for both experimental and simulated data. In
Figure 13, the RMSE values for the black plane are determined to be 0.0415 for the new feature and 0.0450 for the RAO-based simulation. Meanwhile, the RMSE difference for the white plane is negligible, both at 0.0099. Upon observing the spread in both
Figure 12 and
Figure 13, it becomes apparent that the enhancement in features is predominantly concentrated in the lower height range below 0.5 on the color bar. By calculating the RMSE within this range, the new feature exhibits a significant decrease from 0.0084 to 0.0034. This improvement is attributed to the scaling property of the wavelet, which offers fine temporal resolution for high-frequency ranges and superior spectral resolution for low-frequency ranges.
The deducted features obtained from period 1.1 s (
has been utilized to low-frequency wave with a period of 2.8 s.
Figure 14a illustrates the time series of heave response for both experiment and simulation (simulation is subscripted RAO), while
Figure 14b displays the feature distribution. In this scenario, the RMSE value for the white plane is as expected, but it is lower for RAO-based simulation. However, for the high-frequency range of wavelet coefficients, less than 0.5 on the color bar, the RMSE for the new feature is 0.0062 compared to 0.0096 for the simulation. This indicates that the uncertainty in the test, regardless of the exciting force, remains relatively identical, which could be utilized for a specific range between different frequencies. This characteristic arises from the wavelet’s ability to extract nuanced temporal features in the high-frequency components of the data.
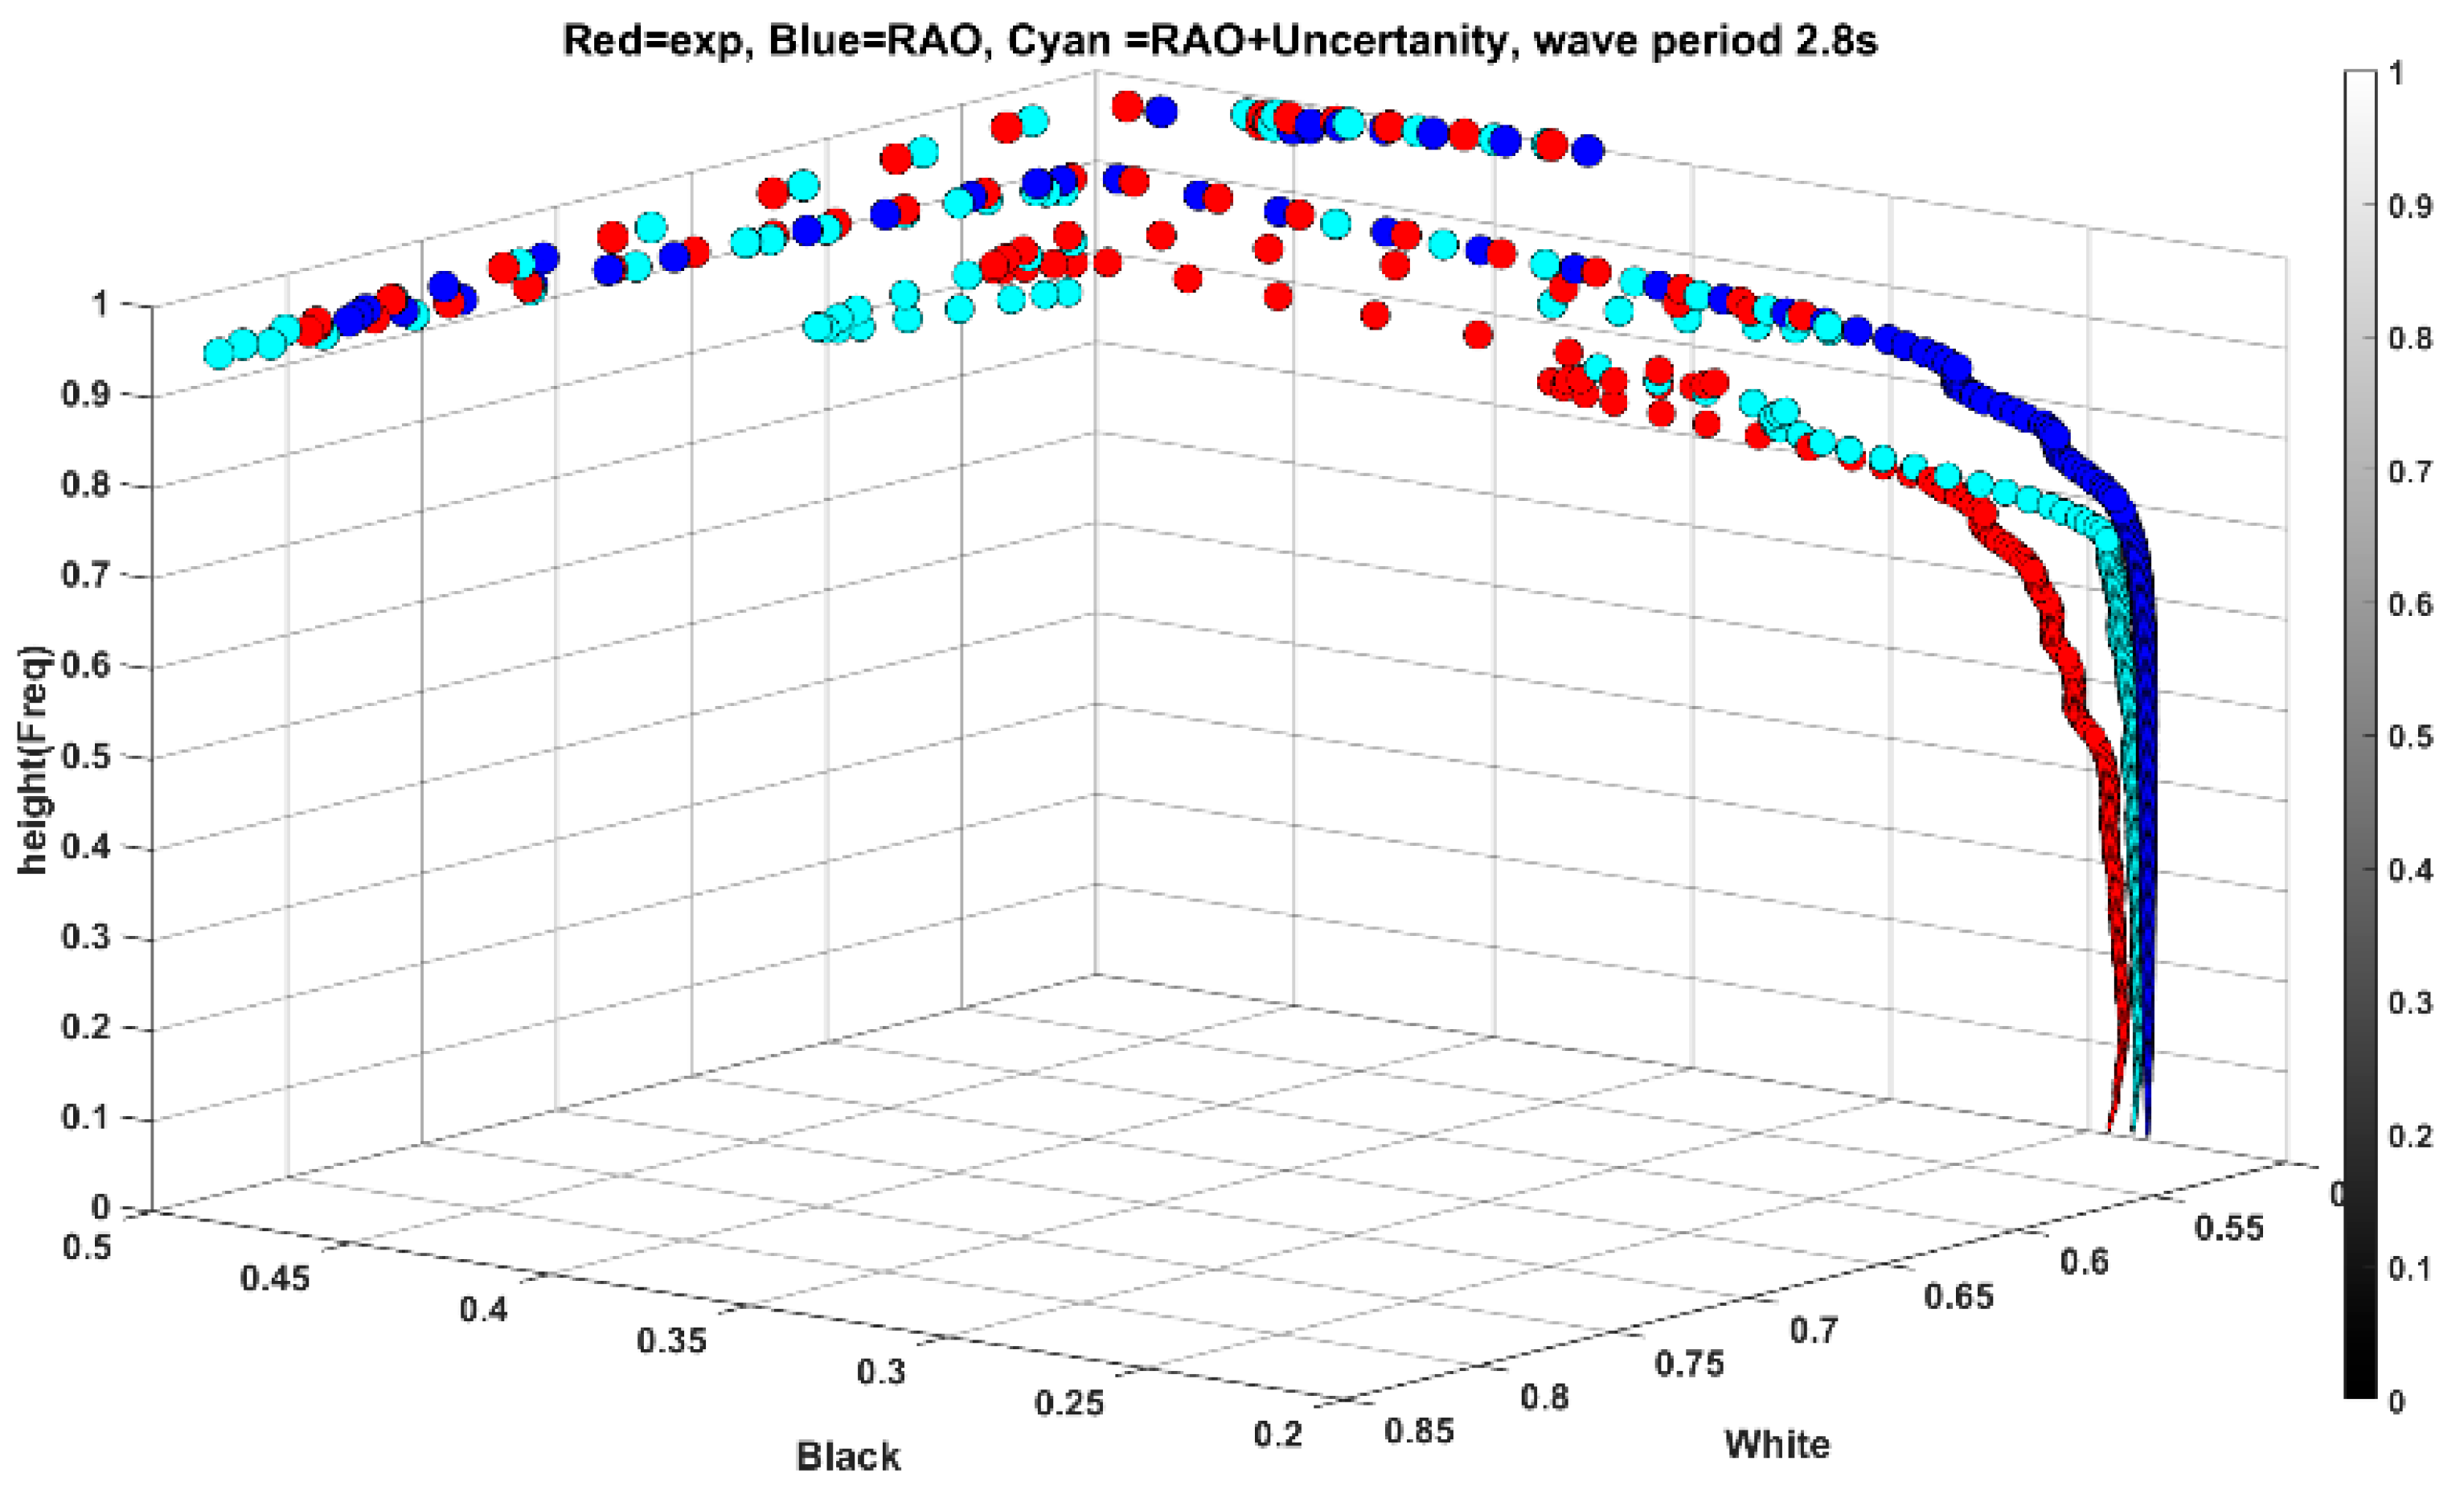
To further analyze the behavior of features within a close spectral range, the obtained features from a period of 2.6 s (as new scenario A) were utilized for simulations with a period of 2.8 s (as scenario B). This involved subtracting the features obtained from the experiment for the heave response of 2.6 s from the simulation features and adding the residuals
to the simulation features of a period of 2.8 s
. As per
Figure 15, the features’ spread shows a significant improvement compared to
Figure 14b. Quantitatively, the RMSE for the black plane is 0.0611 for simulation and 0.0287 for the new features. In conclusion, it can be inferred that the technique performs effectively within a narrow frequency range and is functional for high-frequency components of distant frequencies.
At this juncture, the features obtained from high and low frequencies are compared with a frequency range close to the natural frequency of the heave response in the sphere, which is found to be a period of 1.8 s. Thus, the features obtained from a period of 2.6 s are tested.
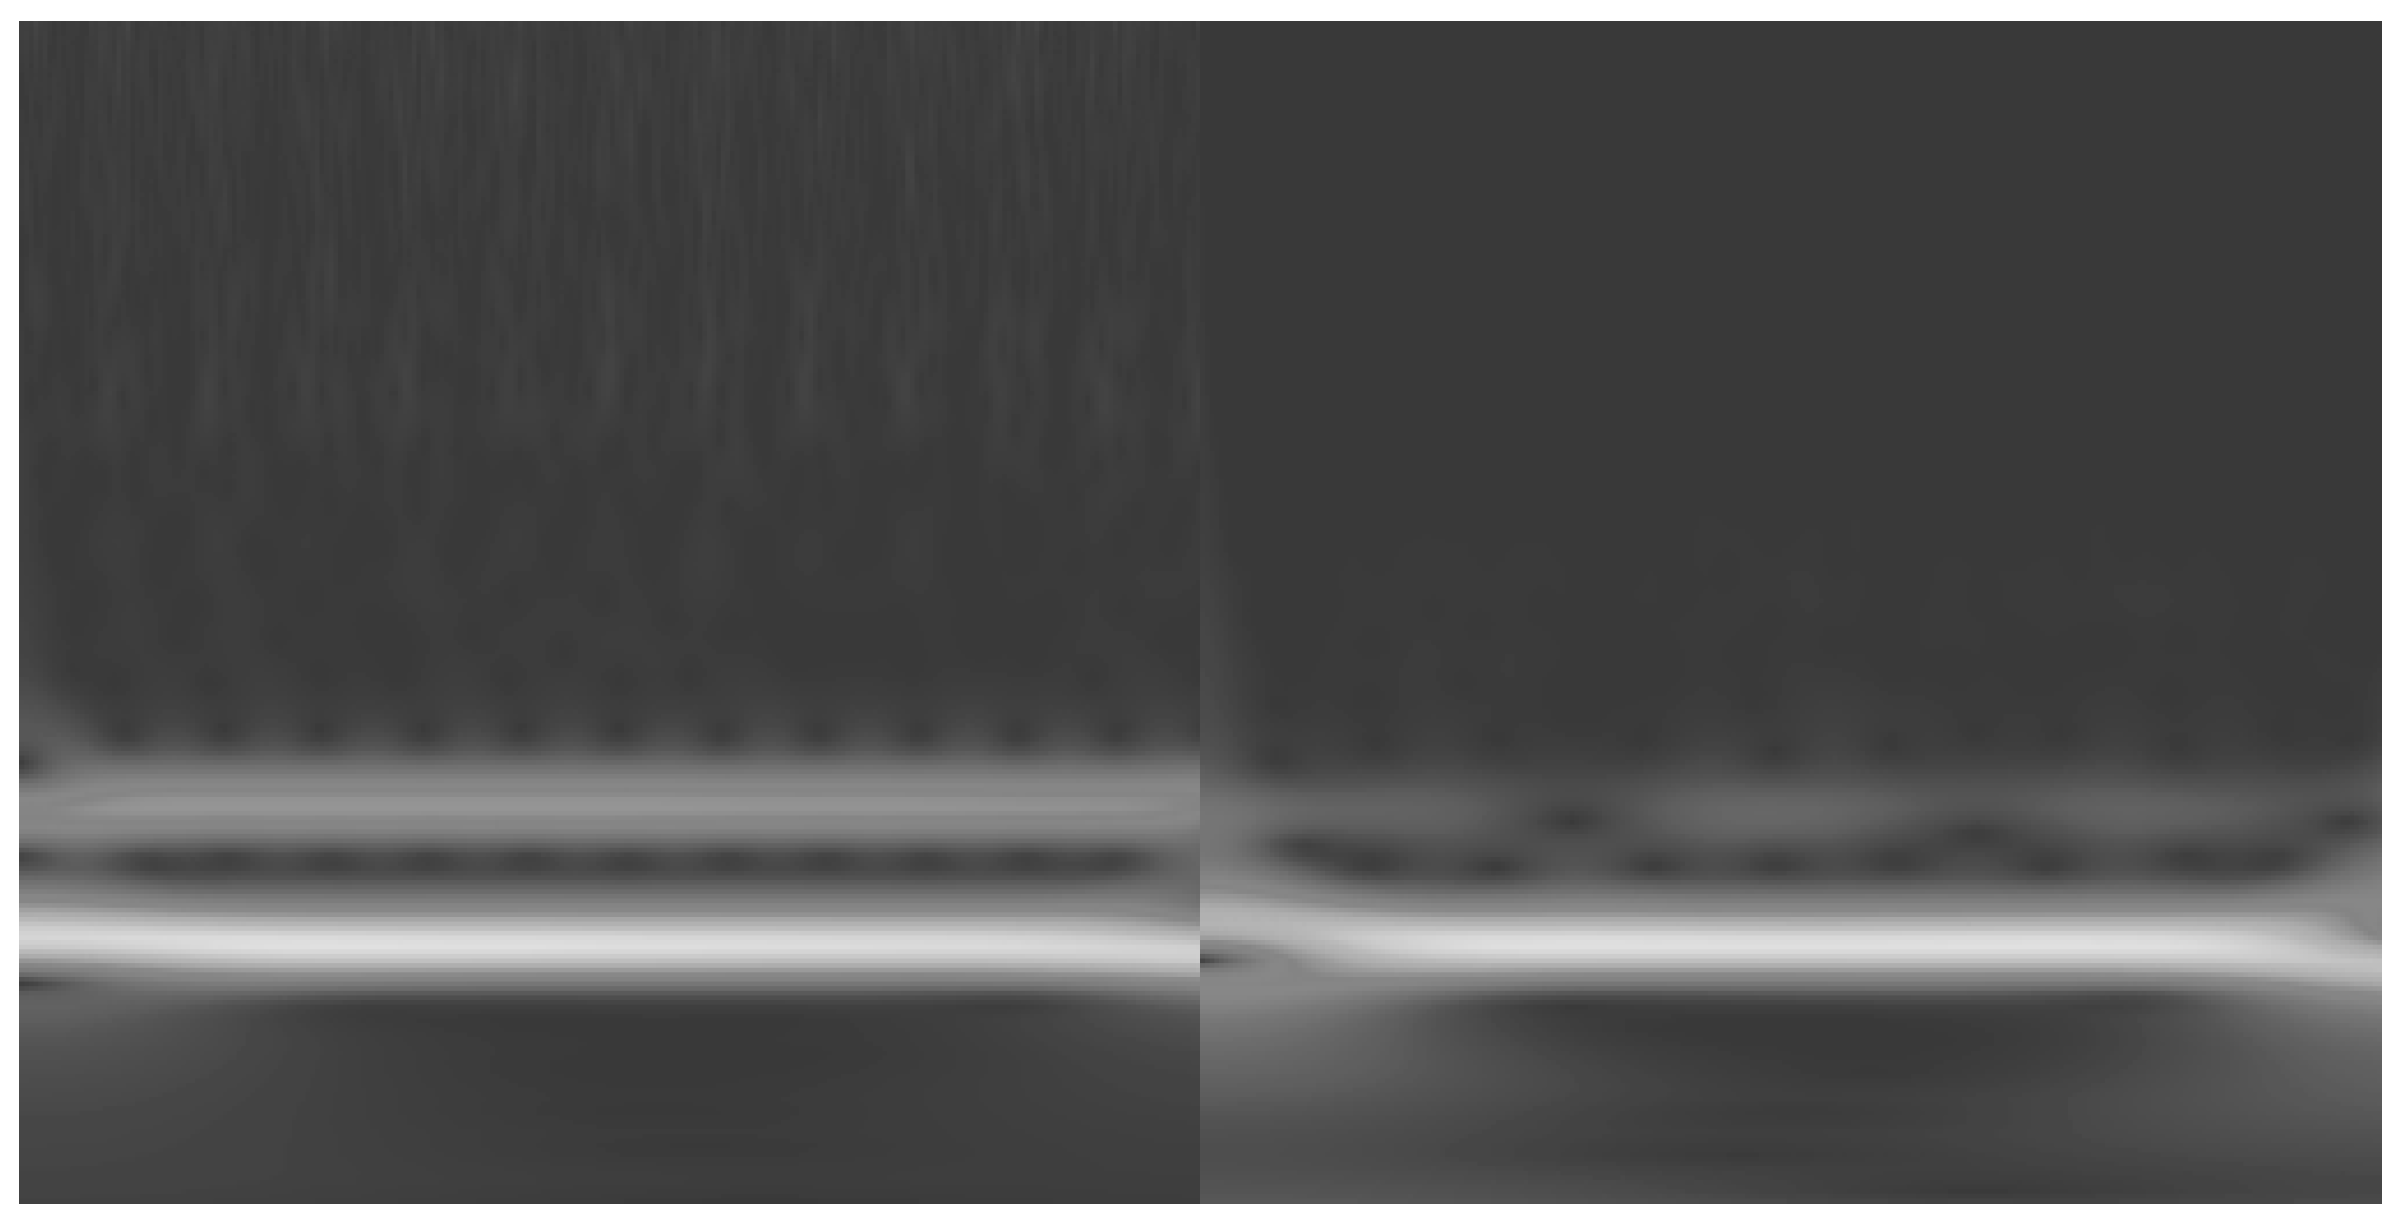
Figure 16a displays the results of applying the residuals from the period of 2.6 s to 1.8 s. Visually, it is apparent that apart from regions below 0.5 in the color bar, the rest of the data spread deviates from the experiment. However, the RMSE for the region below 0.5 has improved by 0.0493 and 0.0404 for simulation and new features, even though the overall RMSE is 0.0479 and 0.0598 for simulation and new features, respectively. To further explore this observation, another higher frequency wave with a period of 1.1 s is utilized. As depicted in
Figure 16b, despite improvements in spread, the new feature slightly deviates in the low-frequency region with a higher intensity of black pixels. For the region below 0.5, the RMSE of the new feature is 0.0404 versus 0.0447 for simulation. These findings necessitate a more direct examination of the wavelet coefficients in the form of black and white pixel scalogram images as presented in
Figure 17.
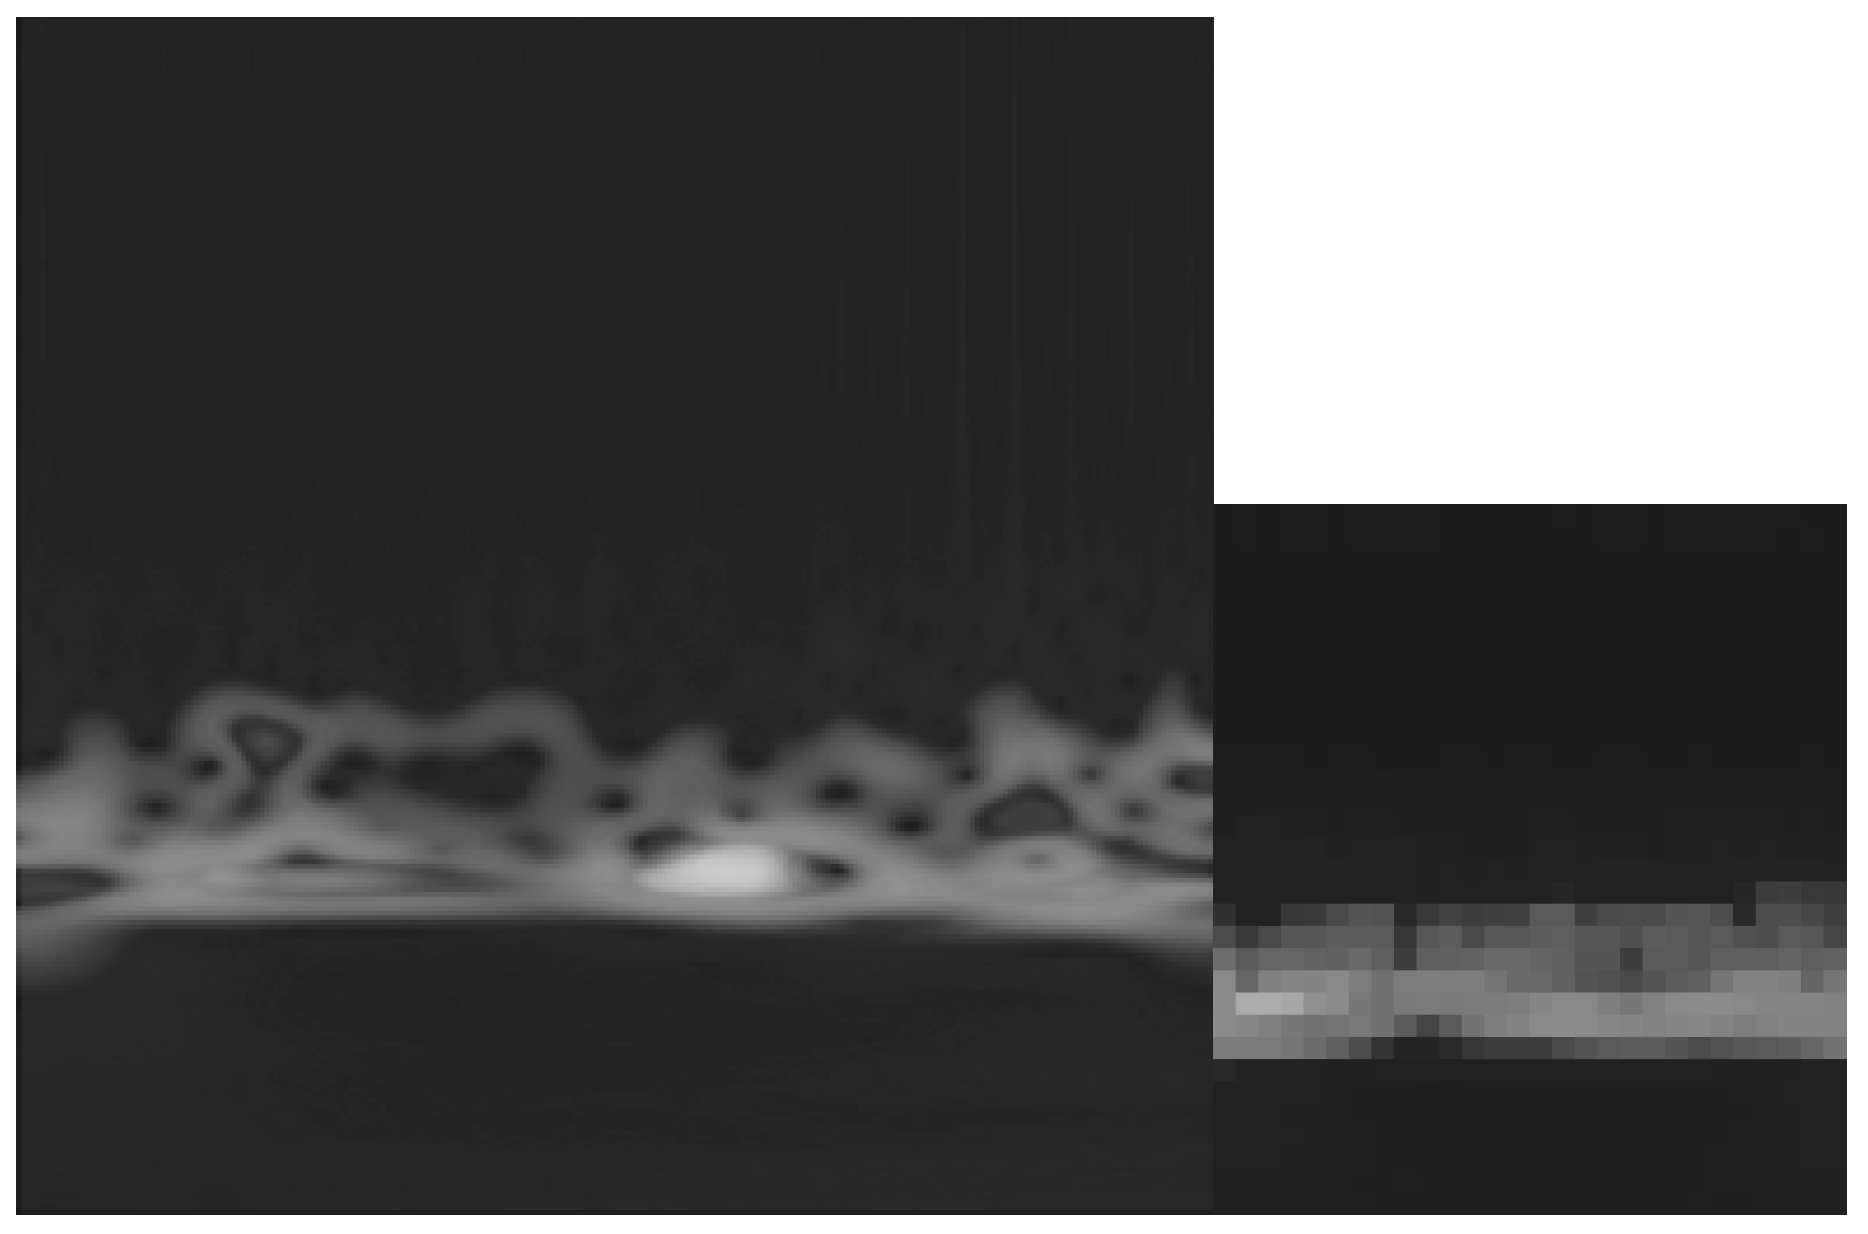
Based on
Figure 17a, the upper half of the image displays arbitrary spectral components represented as jagged white lines, which are absent in the corresponding simulated data image with a period of 1.1 s. Similarly, this is also evident in
Figure 17b for a period of 1.8 s. Upon closer inspection of the lower half, the experimental and simulation data appear nearly identical in low-frequency contribution. It was anticipated that close frequencies would exhibit similar shapes in the lower region, given that the RMSE values remained consistent.
To this end,
Figure 18 presents images of experimental and simulation data for a period of 1.2 s. Notably, aside from the upper half, both exhibit remarkable similarity. Moreover, the images from periods 1.1 s (
Figure 17a) and 1.2 s appear similar in the lower half as well. These observations underscore the efficiency of the new feature spread mechanism for close frequency ranges. For instance, using one scenario in a test can replicate several close frequencies with minimal computational costs. However, when dealing with distant frequencies, the high spectral content can be effectively extracted from one experimental scenario and added to the simulation data. Consequently, the new approach can significantly enhance the accuracy, diversity, and entropy of simulation data for more real-world cases with minimal computational resources, achievable within seconds. This provides a better framework for designing experimental tests that can be directly or indirectly applied to generate more realistic and representative data for ML models.


