Article

Research on Orbital Angular Momentum Mode Detection in an Atmospheric Environment with Fusion Transfer Learning

1
Schoolof Information Engineering, Xi’an University, Xi’an 710065, China
2
Schoolof Automation andInformation Engineering, Xi’an University of Technology, Xi’an 710048, China
*
Author to whom correspondence should be addressed.
Appl. Sci. 2025, 15(1), 15; https://doi.org/10.3390/app15010015
Submission received: 12 November 2024 / Revised: 18 December 2024 / Accepted: 22 December 2024 / Published: 24 December 2024

Abstract

:
The vortex beam carrying Orbital Angular Momentum (OAM) has infinite orthogonal characteristic states, which theoretically can infinitely increase the communication transmission capacity, thus attracting much attention in the field of optical communication. Due to the large amount of data required for training each OAM mode, the increase in channel capacity leads to an exponential growth in the required data volume. At the same time, the phase wavefront distortion caused by atmospheric turbulence (AT) further increases the difficulty of OAM pattern recognition. This article introduces transfer learning into the field of OAM modal detection and establishes an OAM modal classifier for detecting the topological charge of distorted vortex beams. The influence of different data volumes, turbulence intensities, and propagation distances on the accuracy of OAM modal detection during the transmission of Laguerre Gaussian beams in atmospheric turbulent channels is studied, and the generalization ability of the model is analyzed. The results show that compared with traditional convolutional neural networks, the modal classifier proposed in this paper reduces the dataset size to 1/10 of the original and successfully improves the OAM detection accuracy by 15.84%. It also exhibits good generalization under unknown atmospheric turbulence strengths, providing a new approach for identifying OAM modes.

1. Introduction

Since Allen et al. discovered in 1992 that beams with spiral structures carry OAM, it has sparked a research boom in optical OAM [1]. The mode with OAM theoretically has an infinite number of orthogonal bases, and utilizing its orthogonality as a multiplexing mechanism has great potential in expanding channel capacity. The optical field carrying OAM, a special structure, has also been widely used in scientific fields such as ultra-large capacity optical communication [2], optical imaging [3], and micromanipulation [4]. At the same time, accurately identifying orbital angular momentum states is also an important challenge facing optical communication.
The effective identification of orbital angular momentum modes is key to ensuring the reliability of OAM communication systems. At present, there are two methods for identifying OAM vortex beams, namely physical optical methods and machine learning methods. In physical optics research, OAM modal detection research mainly includes diffraction methods using apertures and gratings for detection [5,6,7] and interference methods based on the orientation and number of interference fringes [8,9,10]. Both methods distinguish different topological charges by judging the stripes and orientation of the light spot. In addition, there is also the OAM shorter technique, the astigmatic mode converter, and fiber coupling methods, among which Kotlyar et al. used the cylindrical lens method to introduce an astigmatic transformation for detecting vortex beams with a maximum detectable topological charge of 100 [6]. At the same time, with the continuous development of deep learning, it has also received widespread attention and application in this field due to its ability to extract intrinsic features of light intensity distribution images. In 2014, M. Krenn et al. first used Convolutional Neural Networks (CNN) to detect OAM modes, demonstrating the feasibility of deep learning frameworks in OAM recognition [11]. In 2016, Knutson et al. proposed an improved deep neural network with an accuracy rate of 74% for topological load detection [12]. In 2019, Cui X et al. proposed a 7-layer CNN model suitable for ocean turbulent channels, which showed good tolerance to weak turbulence in turbid waters but was prone to errors in identifying larger OAM patterns [13]. In the same year, Wang Z et al. constructed a six-layer CNN for detecting Laguerre-Gaussian (LG) beams carrying a single OAM mode, taking into account computational complexity and detection effectiveness. The number of detected OAM modes can reach 10 [14]. The scheme proposed by Maxime Irene Dedo et al. in 2020, which combines the Gerchberg-Saxton Algorithm (GS) and CNN, achieves an OAM mode detection accuracy of about 95% in weak and moderate turbulence, but the recognition accuracy in strong turbulence is less than 2/3 of that in weak turbulence [15]. Hao Y et al. proposed a six-layer CNN model for identifying 10 types of unimodal topological loads, requiring a total of 15,000 data sets. The model’s recognition accuracy can reach 80% under strong turbulence [16]. The 7-layer convolutional neural network proposed by Wenyi Liu et al. in 2021 for ocean turbulent channels showed good recognition performance in weak turbulence, but the accuracy was less than 60% in strong turbulence strengths [17]. In 2022, Qian Y. F. et al. proposed using densely connected convolutional networks to identify OAM unimodal and superposition states under thick smoke conditions. This approach can improve recognition accuracy under low-visibility smoke conditions, but the accuracy decreases linearly with increasing transmission distance [18]. In 2023, Yang L et al. proposed a residual network model that can detect turbulence strengths and OAM modes but only achieved detection of four OAM modes with topological charges of 2, 4, 6, and 8 [19]. In 2024, Wang J et al. used modified Hill spectra to simulate turbulent phase screens and proposed an OAM mode CNN-OAM mode classifier for detecting high-order and zero-order distorted vortex beams after atmospheric turbulence. However, the model’s generalization is relatively poor [20]. In the same year, Kholoud Elmabruk et al. proposed an improved MobileNetV2 model with fewer parameters and higher accuracy for detecting distortion levels caused by turbulence in FSO communication links. The improved method achieved an average accuracy of 89.19% [21].
The performance of deep learning models often relies on a large amount of annotated data, especially in the case of limited training data, which often limits the model’s generalization ability and accuracy. With the continuous increase in data volume, it brings certain difficulties to data collection and training. Transfer learning, as an effective method to solve the problem of data scarcity, has been widely applied in various tasks, especially in situations where data are limited. By utilizing pre-trained models on large datasets, transfer learning can transfer existing knowledge to new tasks, thereby improving the performance of the model on small datasets. In 2020, Chen J et al. used a pre-trained VGG model on ImageNet and transferred its parameters to their own network, successfully completing the recognition task of 8 diseases with only 500 rice images and 466 corn images [22]. In 2024, Mathivanan et al. applied transfer learning to brain tumor detection tasks and combined it with the ResNet152 model, achieving an accuracy of 98.5% with only 7023 annotated data [23]. Through transfer learning, they avoided the difficulty of training models from scratch and fully utilized the features learned from pre-trained models, thus achieving high recognition accuracy even with limited data. This result demonstrates the effectiveness and advantages of transfer learning in dealing with small sample learning tasks.
The main problem with existing methods is that they require a large dataset for training and have low model detection accuracy. This paper introduces the transfer learning method and constructs an orbital angular momentum modal classifier based on transfer learning (Transfer-OAM). It systematically studies the impact of the amount of data, turbulence strengths, and transmission distance on the detection accuracy of distorted vortex beams. Meanwhile, it also analyzes the generalization ability performance of the models obtained under the conditions of single training sets and mixed training sets. The Transfer-OAM model classifier proposed in this article can achieve high-precision detection of 15 OAM states, accumulating a new method for the detection of vortex beams and helping to realize future high-capacity optical communication technologies based on OAM.

2. Theoretical Framework and Network

The schematic diagram of the OAM transmission system shown in Figure 1 mainly includes three parts: the generation of LG beams, the propagation of beams under atmospheric turbulence, and the detection of modes at the receiving end. At the transmitting end, the laser generates a Gaussian beam first. This Gaussian beam is then converted into Laguerre-Gaussian (LG) beams carrying different single orbital angular momentum (OAM) modes through a spatial light modulator (Spatial Light Modulator, SLM) loaded with a phase mask. In this process, each OAM state is regarded as a data symbol, and the corresponding information is modulated into different modes. At the receiving end, charge-coupled devices (Charge Coupled Devices, CCD) are utilized to capture the intensity images of the distorted LG beams after being transmitted through the turbulent channel. Finally, they are sent to the modal classifier to output the category of OAM state, thereby achieving encoding and decoding of the optical signal.

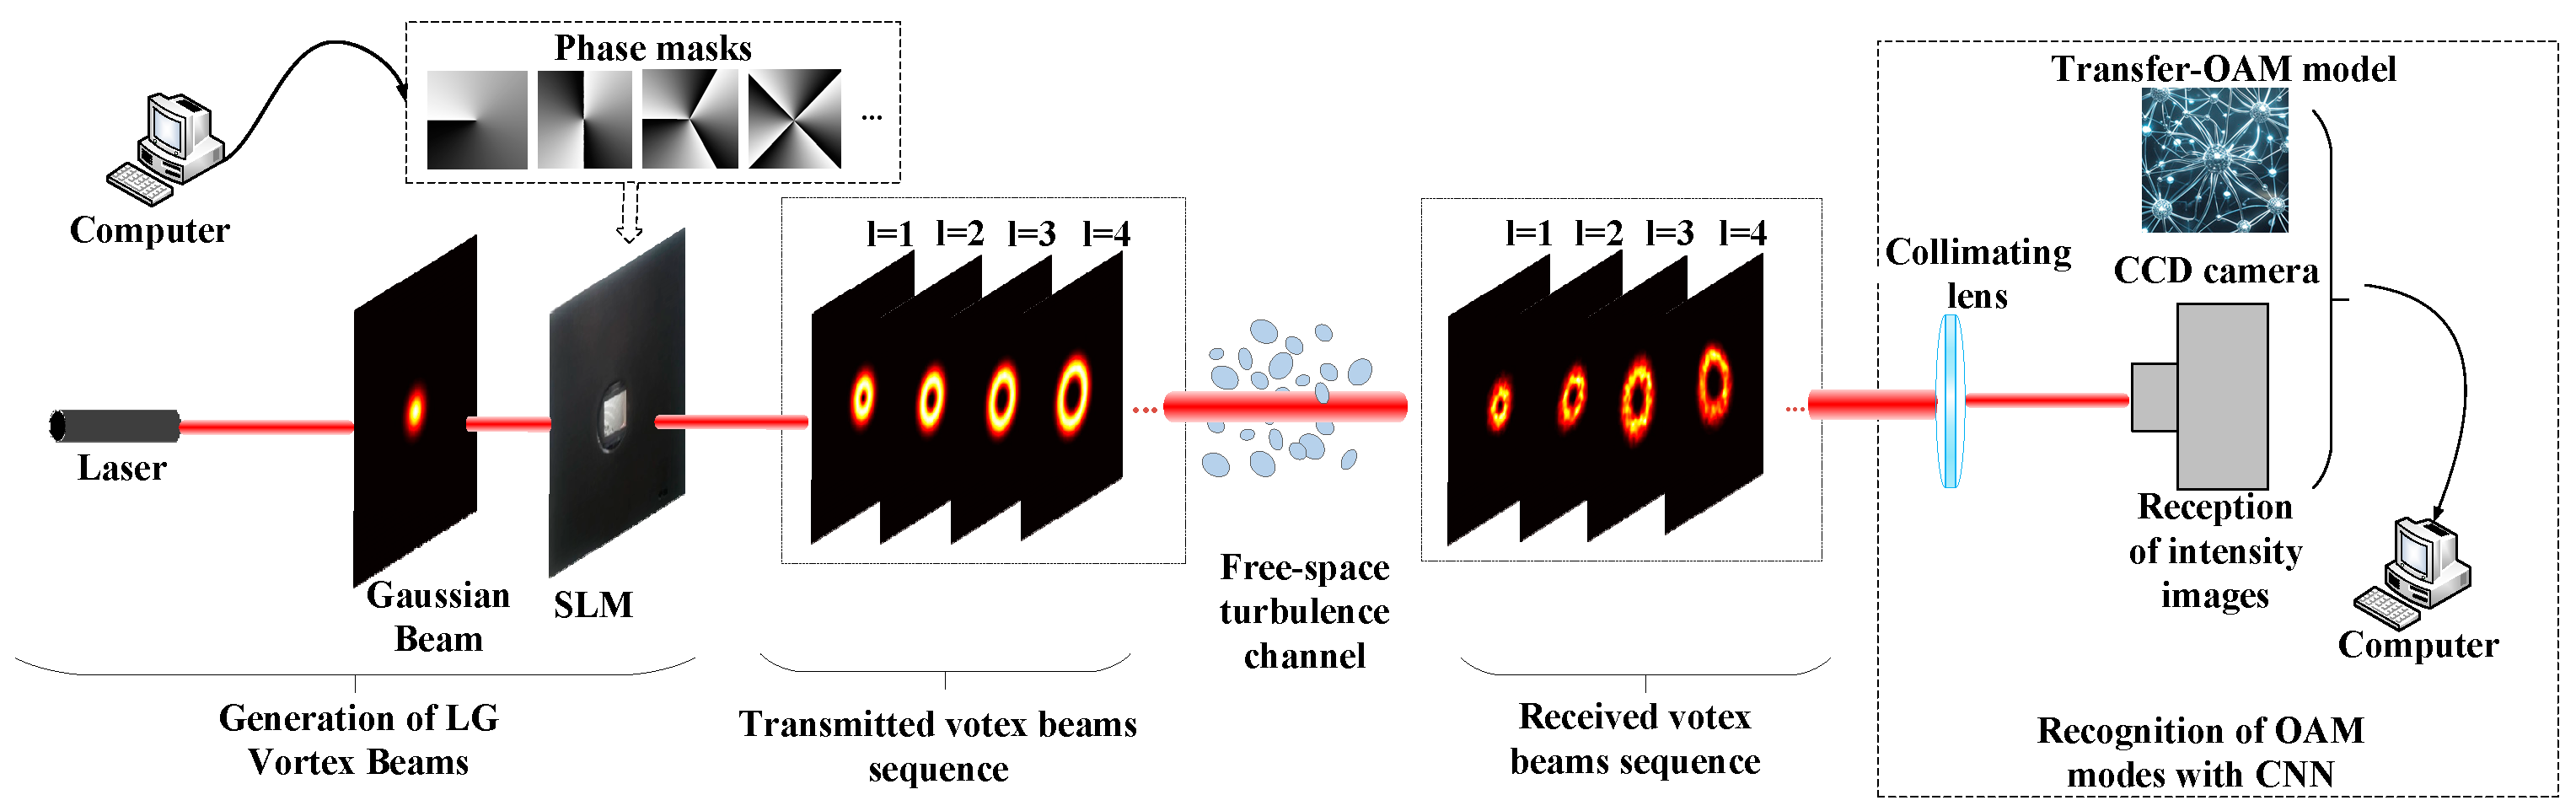
2.1. Laguerre Gaussian Beam with Orbital Angular Momentum

Beams carrying orbital angular momentum are called vortex beams, and Laguerre-Gaussian (LG) beams are one of the most common types of vortex beams. The expression of the light field of LG beams propagating along the z-axis in the source plane is [1]:
U p l r , θ , z = 2 p ! π p + l ! 1 w z r 2 w z l L p | l | 2 r 2 w 2 z exp r 2 w 2 z exp [ i κ r 2 z 2 z 2 + z R 2 ] × exp i ( 2 p + l + 1 ) arctan z z R exp ( i l θ )
L p | l | ( x ) = m = 0 p ( 1 ) m l + p ! p m ! ( l + m ) ! m ! x m
where l represents the topological charge, p denotes the radial index of the LG beam, r is the distance from a point in space to the central axis, θ is the azimuthal angle, is the transmission distance, κ = 2 π / λ is the wave number, z R = π w 0 2 / λ is the Rayleigh range, λ is the wavelength, w 0 is the initial beam waist radius, w z = w 0 1 + z / z R 2 is spot size, L p | l | represents the associated Laguerre polynomial.

2.2. Atmospheric Turbulent Channel Model

Atmospheric turbulence can cause irregular changes in atmospheric refractive index with space and time. When LG beams carrying OAM propagate through free space, the phase and intensity of the beam will be distorted. In this paper, the power spectrum inversion method is used to simulate the influence of AT on the transmission process of LG beams. The modified Hill power spectrum proposed by Andrews LC is used to characterize atmospheric turbulence [24], and its expression is
Φ n κ = 0.033 C n 2 1 + 1.802 κ κ l 0.254 κ κ l 7 6 exp κ 2 κ l 2 κ 0 2 + κ 2 11 6 , 0 κ <
where C n 2 is the refractive index structure constant, L 0 ,   l 0 are the outer and inner scales of turbulence, respectively. κ l = 3.3 / l 0 ,   κ 0 = 2 π / L 0 , κ 0 represents the wave number corresponding to the outer scale of turbulence, used to describe the characteristics of large-scale structures in turbulence, while κ l represents the wave number corresponding to the inner scale of turbulence, used to describe the characteristics of small-scale structures in turbulence. The wavefront phase disturbance caused by atmospheric refractive index is simulated using Φ φ ( κ ) , and the relationship between refractive index spectral density function and phase power spectrum can be expressed as
Φ φ ( κ ) = 2 π κ 2 Δ z Φ n ( κ ) ,
The phase perturbation in the frequency domain is expressed through the inverse Fourier transform as follows:
φ ( x , y ) = IFFT ( C N × N 2 π N Δ x Φ φ ( κ ) ) ,
where 2 π / N Δ x is the wave number increment, N and Δ x represent respectively the size of the phase mask and the spacing between grid points, C N × N is a complex random array with a mean of 0 and a variance of 1, Δ z represents the interval between phase masks, Δ z Indicate the interval between phase screens.
According to Equations (1) and (5), the light field beam passing through the random phase screen is
U p 1 + l r , θ , z = U p l r , θ , z exp [ i φ ( x , y ) ]
where U p 1 + l r , θ , z represents the light field passing through the first phase screen. If it reaches the second phase screen, this process will be repeated until it reaches the receiving end. The turbulence model parameters for this study are set as shown in Table 1.

2.3. Mode Classifier

In response to the problems of large sample size, low detection accuracy, and weak model generalization ability in OAM modal detection datasets, this paper designs a Transfer OAM modal classifier. Figure 2 shows the scale variation of distorted beam images in the network.
The network consists of sixteen layers, as shown in Table 2. The network structure is divided into two main modules: feature extraction module and OAM modal detection module. The feature extraction module is used to learn multi-level feature representations and extract complexity and abstract features of input data. The module consists of seven similar convolution blocks, represented as Conv1 to Conv7, each consisting of a convolutional layer (Conv), a maximum pooling layer (MP), an activation function, or a combination of convolutional and activation functions. Due to its faster convergence speed in solving gradient vanishing problems compared to traditional nonlinear functions such as Sigmoid and Tanh, Rectified Linear Unit (ReLU) is chosen as the nonlinear activation function to improve detection performance. The OAM modal detection module maps the high-dimensional features learned by the feature extraction module to a low-dimensional space and outputs the predicted distribution of category labels. This module consists of three similar classification blocks, represented as FC1 to FC3, each consisting of a fully connected layer (FC), a dropout layer (Dropout), an activation function, or a combination of a fully connected layer and an activation function. This module introduces a dropout layer that randomly removes some neurons with a probability of 0.5 during forward propagation to prevent the network from overly relying on local features, thereby forcing the network to learn multiple different sub-networks and improving its generalization ability.
Our distortion intensity image detection method is summarized in Figure 3. Firstly, the distorted LG beam intensity images of different modalities are labeled and used as network inputs; Secondly, in order to prevent overfitting, data augmentation methods such as ToTensor, Normalize, Resize_224, RandomHorizontalFlip, and RandomVerticalFlip are used to perform data augmentation operations on the training and testing sets. These operations help the model adapt to the distribution of the dataset, increase the diversity of the training data, and better adapt to vortex light mode detection tasks in more turbulent environments; Subsequently, due to the fact that datasets with stronger turbulence strengths typically contain more complex and diverse features, AlexNet models trained on 15,000 large-scale datasets under strong turbulence strengths were selected as pre-training models, and their convolutional layer weights and parameters were loaded into Transfer OAM as the initialization weight parameters of the model. It is worth noting that the pre-trained dataset of 15,000 images does not overlap with the target dataset. By continuously iterating and updating the network, the features learned from the source domain are gradually transferred and adapted to the target domain, thereby preserving the common features in the pre-trained model and improving the training speed and generalization ability of the model. The loss function adopts the Cross Entropy Loss function, and the model adjusts the weight parameters through backpropagation of the loss function, calculates the gradient values of each layer of the network, and uses the Adam optimizer with small batch gradient descent to regularize the parameters. Through multiple iterations and updates to weights and biases, the parameters of the model are gradually optimized, resulting in a decrease in the value of the cost function and helping the model converge better to the global optimum. Finally, the established OAM detection model is used to complete the modal detection task of distorted vortex beams.
In addition, detection accuracy is defined as the ratio of the number of correctly detected samples to the total number of detected samples to measure system performance [25], expressed as
A c c u r a c y = m = 1 M f ( m ) M × 100 %
f ( m ) = 1 l q = l q 0 l q l q
where M is the total number of samples, l q is the true label of the distorted vortex beam, and l q is the predicted label by the model.

3. Results and Discussion

The experimental operating platform is a Windows system, using an Intel (R) Core (TM) i7-10700F CPU, an NVIDIA Quadro P4000 GPU, and 16 GB of memory. The network model is implemented using the Pytorch 2.1.0 deep learning framework, and the raw dataset is constructed using the Matlab R2016a simulation program. In order to more accurately characterize the impact of phase disturbances caused by atmospheric turbulence on OAM beams, this study uses power spectrum inversion to simulate atmospheric turbulence and compensates for its low-frequency deficiency using the subharmonic method [26]. Under three turbulence intensities of weak, medium, and strong ( C n 2 = 1 × 10 16   m 2 / 3 ,   C n 2 = 1 × 10 15   m 2 / 3 ,   C n 2 = 1 × 10 14   m 2 / 3 ), 1000 images of 15 OAM modes with topological charges l = 1–15 were simulated as datasets, totaling 15,000 images. Figure 4 shows partial dataset images of LG beam transmitted through a 1000 m turbulent channel. The dataset was divided into a training set and a validation set in an 8:2 ratio and then input into the Transfer OAM modal classifier designed in this paper for training. After extensive training and adjustment, appropriate hyperparameters were selected: batch size of 16, iteration times of 200, and learning rate of 0.0002.

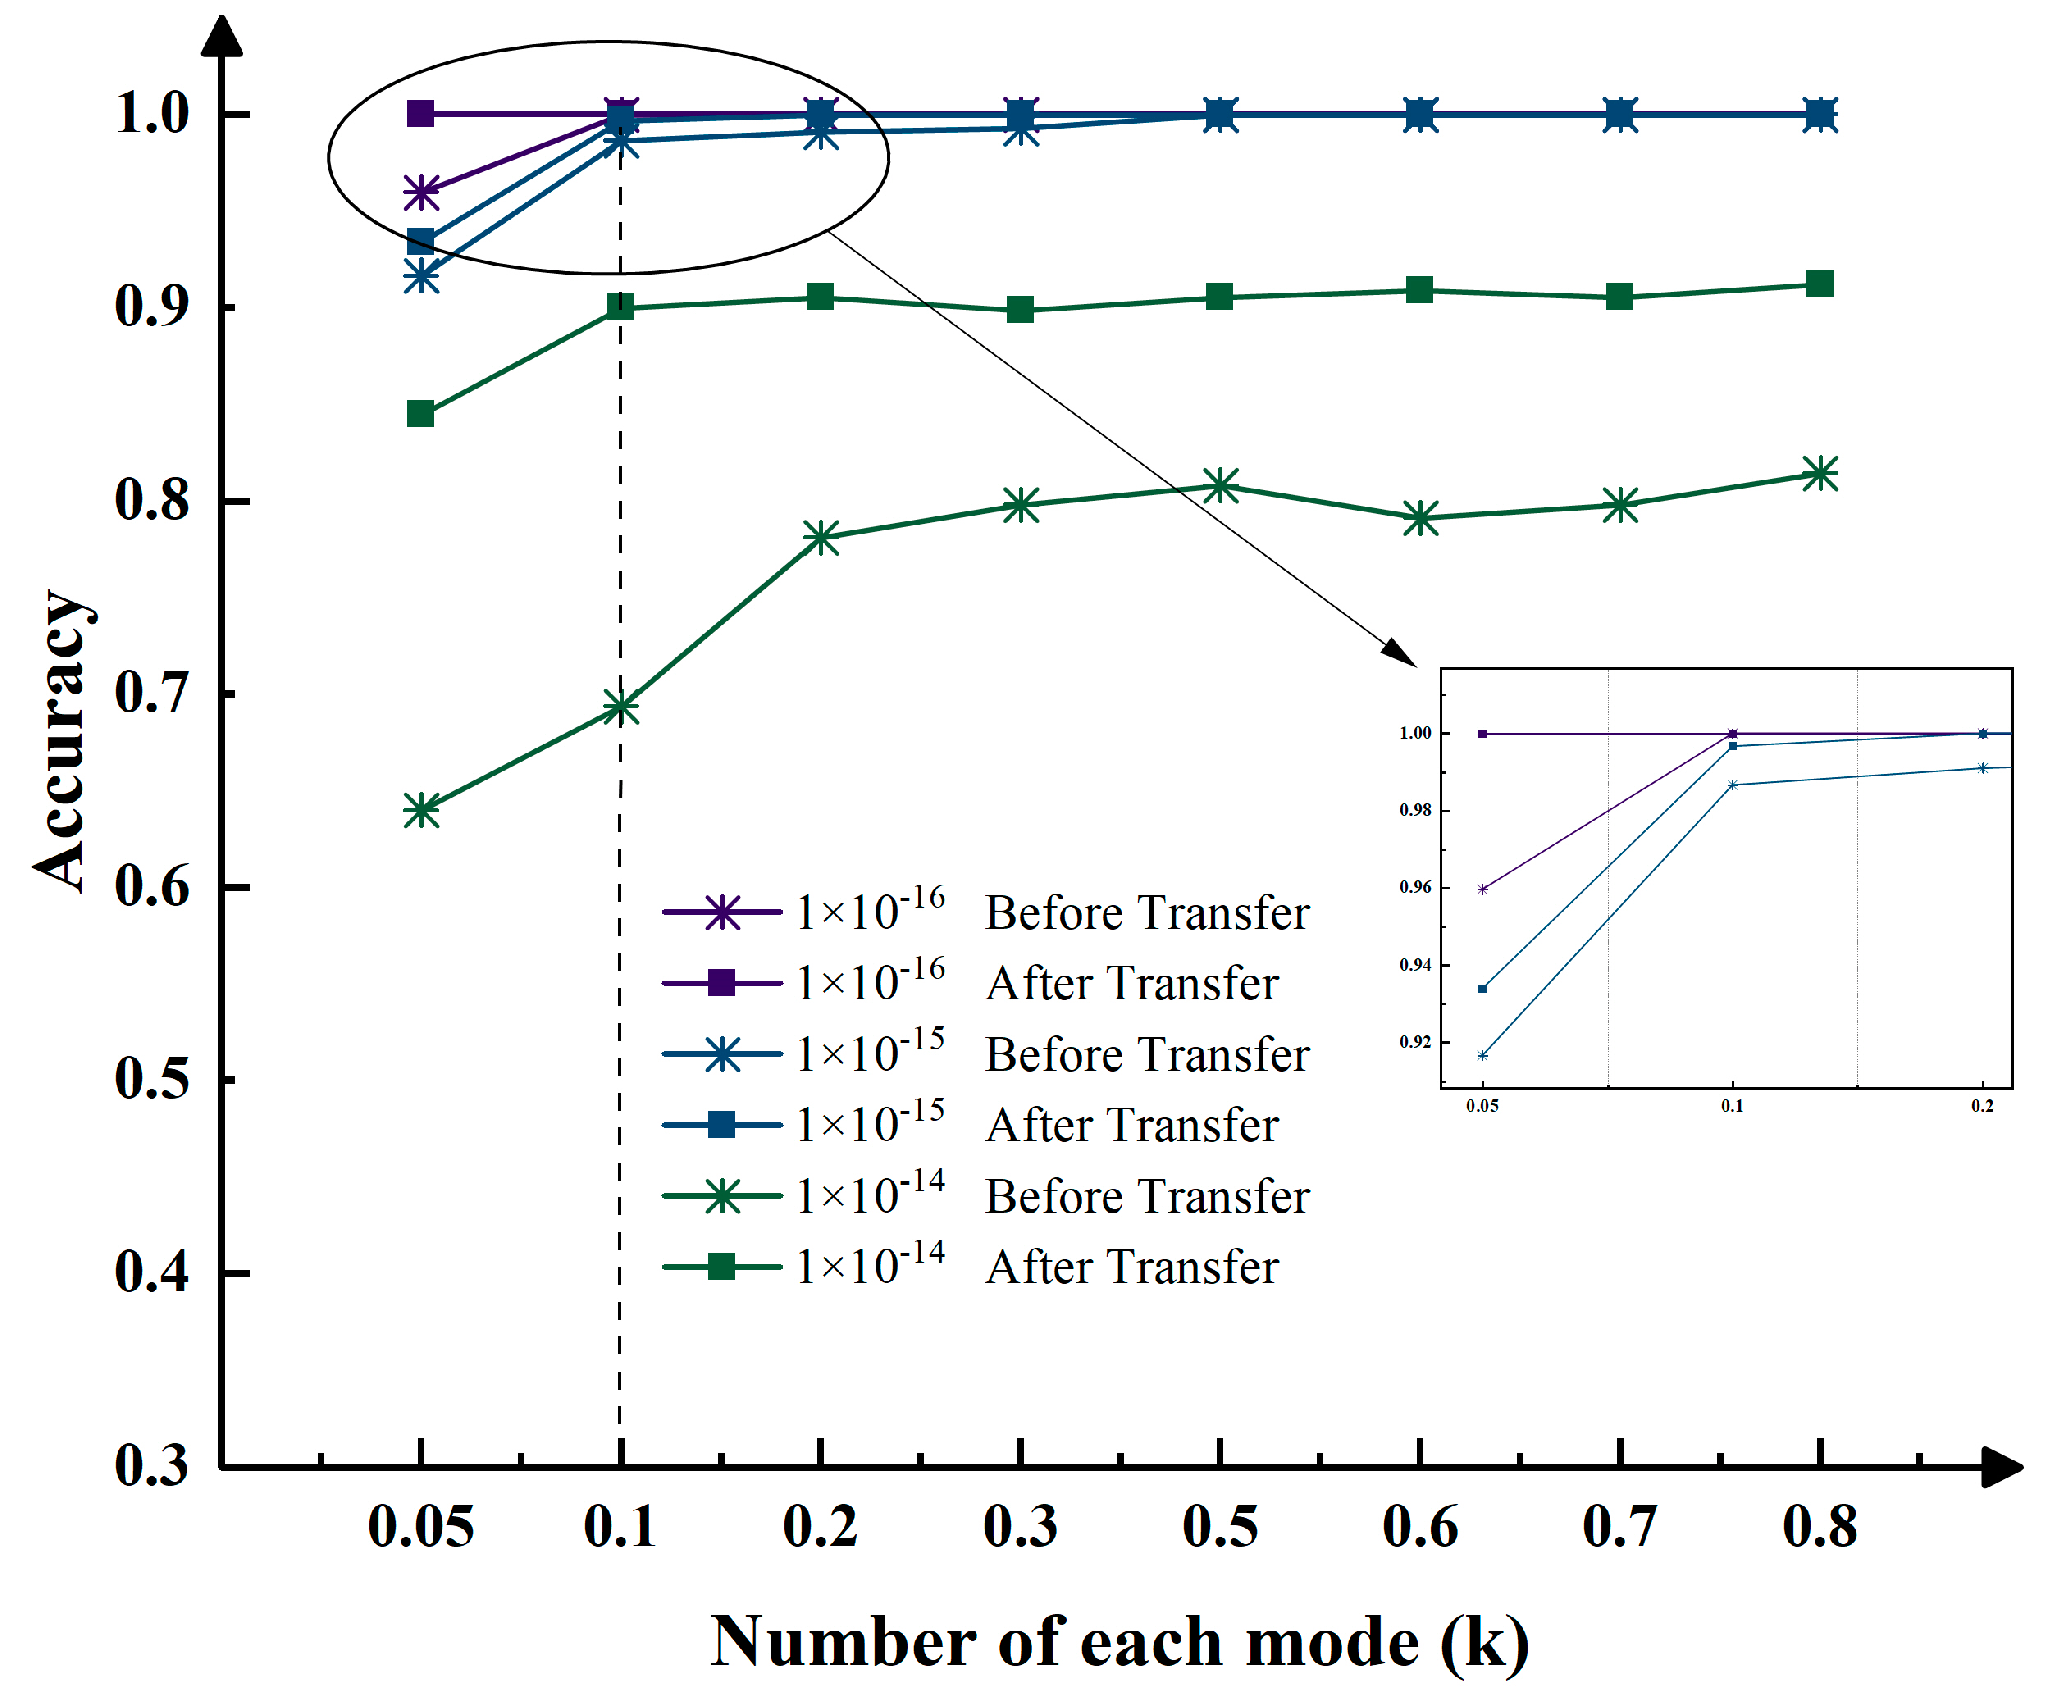
3.1. OAM Detection Under Different Data Volumes

The recognition ability of the network for distorted images before and after transfer learning under different datasets is shown in Figure 5. Figure 5 indicates that the accuracy of OAM modal detection increases with the increase in dataset sample size. When each OAM modality contains 100 image data and the total dataset reaches 1500, the classification performance of the modality classifier for distorted LG beams is close to saturation. In the case of C n 2 = 1 × 10 16   m 2 / 3 and C n 2 = 1 × 10 15   m 2 / 3 , the detection accuracy can reach 100%. When the turbulence strength reaches C n 2 = 1 × 10 14   m 2 / 3 , the detection accuracy before and after transfer learning is 78.11% and 90.73%, respectively, which is 12.62% higher than the network detection accuracy before transfer. In addition, the performance of the Transfer OAM mode classifier does not significantly improve with the increase in training data size, indicating that the classifier requires 100 OAM mode images for each class. Therefore, in the following discussion, 100 intensity images with different OAM modes are selected for each class as training data.

3.2. OAM Detection Under Different Turbulence Intensities

Figure 6 shows the confusion matrix detected by the Transfer OAM classifier for 15 modalities (each containing 500 data points) under different AT intensities. The diagonal elements in the confusion matrix represent the number of correctly detected elements, and the number of diagonal elements is directly proportional to the accuracy of model detection. It can be clearly seen from the figure that each mode tends to disperse to adjacent modes under the action of turbulence, mainly due to the high similarity between the intensity images of adjacent OAM modes. Under weak turbulence, the accuracy of detecting 15 OAM modes is as high as 100%; 99.81% accuracy can also be achieved under moderate turbulence. As the turbulence strengths increase to strong turbulence, the intensity distribution of the vortex beam is severely disrupted, resulting in a decrease in detection accuracy. However, even so, under our designed Transfer OAM model, the accuracy can still reach 90.73%. The analysis of the confusion matrix confirms that the Transfer OAM model can still effectively identify complex OAM patterns under different turbulence intensities.

3.3. OAM Detection at Different Transmission Distances

In free-space optical communication systems, the intensity distortion of vortex beams at the receiving end is affected by the transmission distance. The longer the transmission distance, the more severe the intensity attenuation, and the more difficult it is to extract features from the intensity map. In order to verify the effect of the detection model in the case of different transmission distances, this paper studies different transmission distances. As shown in Figure 7, the influence of Transfer OAM mode classifier on the detection accuracy of 15 distorted OAM modes at different transmission distances (500 m, 1000 m, 1500 m, 2000 m). When the transmission distance is 500 m, even if the turbulence strengths reach strong turbulence, the detection accuracy is still close to 100%. When the transmission distance is 1000 m, the detection accuracy is close to 100% when the turbulence strengths are between weak turbulence and moderate turbulence. However, as the turbulence strengths increase, the accuracy begins to decrease, but it can still remain above 90%. When the transmission distance is 1500 m, the accuracy decreases significantly with the increase in turbulence strengths, especially in strong turbulence where the detection accuracy drops to 86.73%. The performance is most obvious when the transmission distance reaches 2000 m, and the turbulence strengths have the greatest impact on the detection accuracy. Under strong turbulence, the detection accuracy significantly decreases, indicating that turbulence has a significant impact on OAM mode transmission during long-distance transmission, and the classifier performance is significantly limited. However, the detection accuracy can still reach around 75%. The results show that the accuracy of OAM mode detection decreases with the increase in transmission distance, but the Transfer OAM mode classifier designed in this paper can achieve high detection accuracy in long-distance transmission, which is of great significance for reducing the number of relays, reducing costs, and improving the accuracy of beam mode detection in practical applications.

3.4. Comparison of Different Networks

In order to verify the performance of the proposed classifier, we further compared the Transfer OAM network designed in this paper with traditional CNN networks and the network in reference [14] and named them Net1 and Net2 for convenience. Table 3 shows the detection accuracy under different turbulence intensities and the required number of datasets for each mode. From Table 3, it can be seen that the detection accuracy of the three networks remains at 100% under weak turbulence; Under moderate turbulence, the detection accuracy of Net2 and Transfer OAM networks can maintain 100%, while the accuracy of Net1 drops to 95.62%; When the turbulence strengths further increase to strong turbulence, the detection accuracies of Net1, Net2, and Transfer OAM are 74.89%, 81.34%, and 90.74%, respectively, with Transfer OAM performing the best. In addition, compared with the other two networks, the Transfer OAM modal classifier reduces the number of datasets required for each modality by 10 times. This indicates that the Transfer OAM modal classifier proposed in this paper significantly reduces the required dataset size while improving detection accuracy.

3.5. Analysis of Model Generalization Ability

To investigate the impact of training set selection on detection accuracy and test the generalization of the Transfer OAM pattern classifier, we selected 500 test samples for each class under C n 2 = 1 × 10 16   m 2 / 3 ,   5 × 10 16   m 2 / 3 ,   1 × 10 15   m 2 / 3 ,   5 × 10 15   m 2 / 3 ,   1 × 10 14   m 2 / 3 . Train using a training set under a certain turbulence condition to test the recognition accuracy of OAM patterns under different turbulence conditions. The detection capability of the model under different turbulence intensities is shown in Figure 8. It can be clearly seen that the values in the main diagonal and adjacent areas are greater than those in the edge areas. This indicates that the classifier model trained on the dataset obtained under a certain AT can accurately detect modalities with small differences in intensity compared to that. In other words, the classifier model trained at a specific AT intensity has good generalization ability for situations where turbulence strengths are close, but there is still room for improvement for situations where turbulence strength differences are significant. It is worth mentioning that the classifier model trained with turbulence strengths C n 2 = 1 × 10 15   m 2 / 3 can achieve an average detection accuracy of 93.3% for these five types of ATs, proving that the model has good generalization ability.
The following discusses the impact of mixed training sets on detection accuracy. Randomly select 20 training sets for each of these five different turbulence intensities of C n 2 = 1 × 10 16   m 2 / 3 ,   5 × 10 16   m 2 / 3 ,   1 × 10 15   m 2 / 3 ,   5 × 10 15   m 2 / 3 , and 1 × 10 14   m 2 / 3 to create five AT mixed training sets, and train based on this 5AT mixed training set. When the turbulence strength is within the range of C n 2 = 1 × 10 16   m 2 / 3 to C n 2 = 3 × 10 14   m 2 / 3 , the detection accuracy is shown in Figure 9. It is evident that the Transfer OAM pattern classifier trained on a mixed training set has a stronger generalization ability than the Transfer OAM pattern classifier obtained on a single AT training set. The model can maintain high accuracy detection even when encountering turbulence strengths images that have not been seen before. This method can achieve OAM mode detection tasks for any AT intensity within turbulence strength in the range of C n 2 = 1 × 10 16   m 2 / 3 to C n 2 = 3 × 10 14   m 2 / 3 , with an average detection accuracy of 97.36%. Compared with a single training set, the detection accuracy of the model obtained from the mixed training set is higher. This is because the intensity of atmospheric turbulence varies randomly, and the Transfer OAM mode classifier can learn more diverse features when trained on the mixed training set, thereby improving its performance on unknown turbulence data.

4. Conclusions

This article proposes a Transfer OAM mode classifier for detecting distorted LG beams. By introducing transfer learning to find the connections between existing and new features, the network can quickly learn new knowledge, avoiding the process of randomly initializing weights during training from scratch and achieving high-precision detection of 15 OAM modes. Compared to traditional convolutional neural networks, the Transfer OAM mode classifier proposed in this paper not only reduces the dataset size to 1/10 of its original size but also successfully improves the OAM detection accuracy by 15.84%. We first studied the amount of data required for the model. Secondly, the model accuracy was analyzed under different turbulence intensities and transmission distances; Finally, the generalization ability of the model on training sets with different AT intensities was explored. In addition, the model obtained on the mixed training set can achieve an average detection accuracy of 97.36% for any AT intensity with turbulence intensity ranging from C n 2 = 1 × 10 16   m 2 / 3 to C n 2 = 3 × 10 14   m 2 / 3 . This model exhibits good robustness under unknown atmospheric turbulence strengths, providing a new approach for the identification and detection of vortex optical OAM modes.

Author Contributions

Conceptualization, C.K. and Y.C.; Data curation, C.K. and Y.C.; Formal analysis, X.K.; Funding acquisition, C.K. and X.K.; Investigation, C.K.; Methodology, C.K. and Y.C.; Project administration, Y.C.; Resources, Y.C.; Software, Y.C.; Supervision, X.K.; Validation, C.K., Y.C. and X.K.; Writing—original draft, Y.C.; Writing—review and editing, C.K., Y.C. and X.K. All authors have read and agreed to the published version of the manuscript.

Funding

The National Natural Science Foundation of China [No.61377080]; Special Research Program of Shaanxi Provincial Department of Education [22JK0530]; Xi’an Science and Technology Plan Project [No.23KGDW0018-2023]; Natural Science Basic Research Program of Shaanxi [Program No.2024JC-YBMS-557, 2024JC-YBMS-562]; Shaanxi Fundamental Science Research Project for Mathematics and Physics [Grant No.23JSQ024]; Key Industrial Innovation Projects in Shaanxi Province [No.2017ZDCXL-GY-06-01]; the Xi’an Science and Technology Plan [22GXFW0115]; the Scientific Research Team of Xi’an University [D202309].

Institutional Review Board Statement

Not applicable.

Informed Consent Statement

Not applicable.

Data Availability Statement

The data that support the findings of this study are available from the corresponding author upon reasonable request.

Conflicts of Interest

The authors declare no conflicts of interest.

References

  1. Allen, L.; Beijersbergen, M.W.; Spreeuw, R.J.; Woerdman, J.P. Orbital angular momentum of light and the transformation of Laguerre-Gaussian laser modes. Phys. Rev. A 1992, 45, 8185–8189. [Google Scholar] [CrossRef]
  2. Bozinovic, N.; Yue, Y.; Ren, Y.X.; Tur, M.; Kristensen, P.; Huang, H.; Willner, A.E.; Ramachandran, S. Terabit-scale orbital angular momentum mode division multiplexing in fibers. Science 2013, 340, 1545–1548. [Google Scholar] [CrossRef] [PubMed]
  3. Li, X. Digital speckle correlation method based on phase vortices. Opt. Eng. 2012, 51, 077004. [Google Scholar] [CrossRef]
  4. Otte, E.; Denz, C. Optical trapping gets structure: Structured light for advanced optical manipulation. Appl. Phys. Rev. 2020, 7, 041308. [Google Scholar] [CrossRef]
  5. Li, Y.X.; Han, Y.P.; Cui, Z.W. Measuring the topological charge of vortex beams with gradually changing-period spiral spoke grating. IEEE Photonics Technol. Lett. 2020, 32, 101–104. [Google Scholar] [CrossRef]
  6. Kotlyar, V.V.; Kovalev, A.A.; Porfirev, A.P. Astigmatic transforms of an optical vortex for measurement of its topological charge. Appl. Opt. 2017, 56, 4095–4104. [Google Scholar] [CrossRef]
  7. Taira, Y.; Zhang, S.K. Split in phase singularities of an optical vortex by off-axis diffraction through a simple circular aperture. Opt. Lett. 2017, 42, 13731376. [Google Scholar] [CrossRef] [PubMed]
  8. Emile, O.; Emile, J. Young’s double-slit interference pattern from a twisted beam. Appl. Phys. B 2014, 117, 487–491. [Google Scholar] [CrossRef]
  9. Zhou, H.L.; Shi, L.; Zhang, X.L.; Dong, J. Dynamic interferometry measurement of orbital angular momentum of light. Opt. Lett. 2014, 39, 6058–6061. [Google Scholar] [CrossRef] [PubMed]
  10. Leach, J.; Padgett, M.J.; Barnett, S.M.; Franke-Arnold, S.; Courtial, J. Measuring the orbital angular momentum of a single photon. Phys. Rev. Lett. 2002, 88, 257901. [Google Scholar] [CrossRef] [PubMed]
  11. Krenn, M.; Fickler, R.; Fink, M.; Handsteiner, J.; Malik, M.; Scheidl, T.; Ursin, R.; Zeilinger, A. Communication with spatially modulated light through turbulent air across Vienna. New J. Phys. 2014, 16, 113028. [Google Scholar] [CrossRef]
  12. Knutson, E.; Lohani, S.; Danaci, O.; Huver, S.D.; Glasser, R.T. Deep learning as a tool to distinguish between high orbital angular momentum optical modes. Opt. Photonics Inf. Process. X 2016, 9970, 997013–997020. [Google Scholar]
  13. Cui, X.; Yin, X.; Chang, H.; Liao, H.; Chen, X.; Xin, X.; Wang, Y. Experimental study of machine learning based orbital angular momentum shift keying decoders in optical underwater channels. Opt. Commun. 2019, 452, 116–123. [Google Scholar] [CrossRef]
  14. Wang, Z.; Dedo, M.I.; Guo, K.; Zhou, K.; Shen, F.; Sun, Y.; Liu, S.; Guo, Z. Efficient Recognition of the Propagated Orbital Angular Momentum Modes in Turbulences With the Convolutional Neural Network. IEEE Photonics J. 2019, 11, 236–237. [Google Scholar] [CrossRef]
  15. Dedo, K.G.Z. OAM mode recognition based on joint scheme of combining the Gerchberg–Saxton (GS) algorithm and convolutional neural network (CNN). Opt. Commun. 2020, 456, 124696. [Google Scholar] [CrossRef]
  16. Hao, Y.; Zhao, L.; Huang, T.; Wu, Y.; Jiang, T.; Wei, Z.; Deng, D.; Luo, A.P.; Liu, H. High-Accuracy Recognition of Orbital Angular Momentum Modes Propagated in Atmospheric Turbulences Based on Deep Learning. IEEE Access 2020, 8, 159542–159551. [Google Scholar] [CrossRef]
  17. Liu, W.; Jin, M.; Hao, Y.; Deng, D.; Wu, R.; Wei, Z.; Liu, H. Efficient identification of orbital angular momentum modes carried by Bessel Gaussian beams in oceanic turbulence channels using convolutional neural network. Opt. Commun. 2021, 498, 127251–127252. [Google Scholar] [CrossRef]
  18. Qian, Y.; Chen, H.; Huo, P.; Wang, X.; Gao, S.; Zhang, P.; Gao, H.; Liu, R.; Li, F. Towards fine recognition of orbital angular momentum modes through smoke. Opt. Express 2022, 30, 15172–15183. [Google Scholar] [CrossRef]
  19. Yang, L.; Huang, S.; Zhu, G. Jointly Detecting Atmospheric Turbulence and Recognizing OAM Modes Via a Residual Network. Wirel. Pers. Commun. 2023, 131, 187–196. [Google Scholar] [CrossRef]
  20. Wang, J.; Wang, C.; Tan, Z.; Wang, X.; Lei, S.; Wu, P.; Yang, C. Detection of orbital angular momentum carried high-order radial vortex beams using CNN-OAM mode classifier. Opt. Laser Technol. 2024, 169, 110027. [Google Scholar] [CrossRef]
  21. Elmabruk, K.; Kemal, A.; Serhat, K. Atmospheric turbulence recognition with deep learning models for sinusoidal hyperbolic hollow Gaussian beams-based free-space optical communication links. Phys. Scr. 2024, 99, 075404. [Google Scholar] [CrossRef]
  22. Chen, J.; Zhang, D.; Sun, Y.; Nanehkaran, Y.A. Using deep transfer learning for image-based plant disease identification. Comput. Electron. Agric. 2020, 173, 105393. [Google Scholar] [CrossRef]
  23. Mathivanan, S.K.; Sonaimuthu, S.; Murugesan, S.; Rajadurai, H.; Shivahare, B.D.; Shah, M.A. Employing deep learning and transfer learning for accurate brain tumor detection. Sci. Rep. 2024, 14, 7232. [Google Scholar] [CrossRef] [PubMed]
  24. Andrews, L.C. An analytical model for the refractive index power spectrum and its application to optical scintillations in the atmosphere. J. Mod. Opt. 1992, 39, 1849–1853. [Google Scholar] [CrossRef]
  25. Berkhout, G.; Lavery, R.; Courtial, R.; Beijersbergen, M.W.; Padgett, M.J. Efficient sorting of orbital angular momentum states of light. Phys. Rev. Lett. 2010, 105, 153601. [Google Scholar] [CrossRef]
  26. Lane, R.G.; Glindemann, A.; Dainty, J.C. Simulation of a Kolmogorov phase screen. Waves Random Media 1992, 2, 209. [Google Scholar] [CrossRef]
Figure 1. Schematic diagram of OAM transmission system.
Applsci 15 00015 g001
Figure 2. Schematic diagram of Transfer OAM classifier. where * represents multiplication sign, and * 2 represents repeating the module twice.
Applsci 15 00015 g002
Figure 3. The overall process of OAM modal detection.
Applsci 15 00015 g003
Figure 4. Partial light intensity distribution images of LG beams with different topological charges transmitted through different ATs, with a transmission distance of z = 1000 m.
Applsci 15 00015 g004
Figure 5. Shows the influence of data volume on detection accuracy under different turbulence intensities before and after using the Transfer OAM mode classifier, with a transmission distance of z = 1000 m.
Applsci 15 00015 g005
Figure 6. The confusion matrix of the Transfer OAM model under three types of ATs, with a transmission distance of z = 1000 m.
Applsci 15 00015 g006
Figure 7. Detection accuracy of classifier for 15 OAM states at different transmission distances.
Applsci 15 00015 g007
Figure 8. Cross-test results of five types of AT.
Applsci 15 00015 g008
Figure 9. Detection accuracy of Transfer OAM pattern classifier on specific and mixed datasets.
Applsci 15 00015 g009
Table 1. Simulation Parameters.
ParameterSpecification
λ 632.8 nm
w 0 0.05 m
N 512
Δ z 200 m
l 0 0.005 m
L 0 3 m
C n 2 C n 2 = 1 × 10 16   m 2 / 3 C n 2 = 1 × 10 14   m 2 / 3
Table 2. Structure of the Transfer-OAM Classifier.
LayerKernel NumbersKernel SizeStridePaddingActivation Function
Conv14811 × 1142MP (3 × 3) + ReLU
Conv21283 × 312MP (3 × 3) + ReLU
Conv31923 × 311ReLU
Conv41923 × 311ReLU
Conv51283 × 311MP (3 × 3) + ReLU
Conv61283 × 311MP (3 × 3) + ReLU
Conv71283 × 311ReLU
FC12048---Dropout(0.5) + ReLU
FC22048---Dropout(0.5) + ReLU
FC315---ReLU
Table 3. Recognition performance of different networks and required dataset quantity.
TypesATNet1Net2Transfer-OAM
Recognition accuracyWeak1.00001.00001.0000
Medium0.95621.00001.0000
Strong0.74890.81340.9073
Number of datasets per model/piece/10001000100
Disclaimer/Publisher’s Note: The statements, opinions and data contained in all publications are solely those of the individual author(s) and contributor(s) and not of MDPI and/or the editor(s). MDPI and/or the editor(s) disclaim responsibility for any injury to people or property resulting from any ideas, methods, instructions or products referred to in the content.

