Article

Natural Ventilation to Manage Ammonia Concentration and Temperature in a Rabbit Barn in Central Mexico

by
David Vargas Cano
1,
Jorge Flores-Velazquez
1,2,* and
Agustín Ruiz Garcia
1
1
Water Integral Use and Agriculture Engineering, University of Chapingo, Texcoco 56230, Mexico
2
Hydro Sciences, Colleges de Postgraduates, Montecillo 56264, Mexico
*
Author to whom correspondence should be addressed.
Appl. Sci. 2024, 14(9), 3767; https://doi.org/10.3390/app14093767
Submission received: 5 March 2024 / Revised: 2 April 2024 / Accepted: 25 April 2024 / Published: 28 April 2024
(This article belongs to the Topic Advanced Heat and Mass Transfer Technologies)

Abstract

:
The concentration of ammonia (NH3) and the temperature of the air surrounding the rabbit habitat in the farm condition basic health processes such as breathing and feeding. The indoor climate in a rabbit farm is largely conditioned by the ventilation system (air conditioning). The objective of this study was to build a numerical model based on computational fluid dynamics (CFD) in order to evaluate, by numerical simulations, the air dynamics of a rustic farm. After the validation of the computational model, the thermal gradient and ammonia concentration were analyzed under three wind incidence angles (0°, 45°, and 90° with respect to the horizontal Z axis of the facility). The results of the simulations showed that, in the area occupied by the rabbits (AOR), the concentration of ammonia with respect to the source was reduced by 37.3% in the most favorable case (wind direction at 45°), and 21.2% in the least favorable case (wind direction at 0°), and the indoor temperature presented a maximum difference of 2 °C with respect to the outside temperature. Climate control is a more expensive cost in rabbit farm exploitation; dynamics modulation can serve as an auxiliary tool for reducing health risks in rabbits. The use of models based on fluid dynamics allowed us to understand the efficiency of the ventilation system, which must be increased to reduce the found temperature gradient. Through numerical simulation it will be possible to find alternatives to increase the ventilation rate.

1. Introduction

The air quality inside facilities dedicated to animal production is an essential factor to guarantee the health and comfort of the animals and producers [1,2,3]. In modular facilities for rabbit production, the most important environmental variables are temperature, humidity, and emissions of harmful gases [4]. A temperature between 25 and 30 °C increases the heat load on rabbits; above 30 °C the effects are a decrease in food consumption and fertility rate, affecting the production yield [5]. Rabbits are susceptible to heat stress given that the number of functional sweat glands they have is not sufficient to eliminate excess body heat [5]. Heat stress is a combination of an increase in temperature and the consequent decrease in humidity. The temperature–humidity index indicator has been used, whose parameter has been modified and used in rabbits [5,6]. Ammonia (NH3) has an effect on soil acidification, along with the emission of particulate matter and nitrous oxide [2,7]. The emission of gases from livestock and agricultural activities contributes to the greenhouse effect, since they are the main source of NH3 emission and, especially in rabbits, it is the cause of respiratory diseases [4,8]. There is a correlation between the indoor climate of a farm and the comfort of the inhabitants, which is why it is necessary to expand the analysis of the climate dynamics within the area occupied by the animals as a response to the ventilation system [9].
The ventilation of a livestock facility is a phenomenon that allows for the management of variables such as temperature, humidity, and gas concentrations. Research has been carried out on the ventilation system of a livestock facility, using methods such as direct measurements, the application of Bernoulli’s theorem, sum of volume flow rates, tracer gas, and computational fluid dynamics (CFD) techniques [10]. Computational fluid dynamics is a tool used for modeling livestock facilities; it includes potential possibilities to simulate important conditions that can influence the indoor climate in a livestock facility [11].
Among the research studies that have been carried out using computational fluid dynamics are the following: in pig farms, air velocity analysis [11,12], temperature and heat stress studies [13,14], studies of ammonia emissions [15,16], and those focused on dust generation within the installations [3]; in cattle facilities, studies of heat transfer [17,18], ventilation rate [19], and extensive studies on air velocity and its influence on temperature, humidity, and heat transfer [20], as well as studies on the emissions of gases such as methane and ammonia, as well as CO2 and N2O [1,7]; in bird houses, there have been studies that model the indoor climate and heat emissions [21,22,23] and simulations on air flow, temperature, humidity, and ammonia emissions [24,25,26]. However, in rabbit farms there have been few studies: one study performing simulations to determine the temperature gradient and ammonia concentration [27], and a study on the distribution of the air flow of the indoor environment in a rabbit facility [28].
A critical factor in rabbit farm operation is climate control. The particularity of this species is that their own feces contain bacteria that, when breathed, produce methane, a toxic gas even for the rabbit. Methane production occurs “per ze” and increases mainly depending on temperature and humidity. When the methane reaches the level of the cages, the rabbit breathes this gas causing cyanosis, fever, lack of appetite, and sometimes death. Natural ventilation is the minimum strategy to maintain temperature, humidity, and toxic gases at levels suitable for the rabbits. Using numerical simulations based on computational fluid dynamics allows, in the first instance, the identification of the situation that prevails in the farm environment. Once the model is validated, hypotheses for improvement can be proposed, such as relocating window openings, changing the density of rabbits in the cage, or the use of mechanical ventilation systems.
The objective of this work was to build and evaluate a CFD-based model to simulate and analyze the distribution of temperature and ammonia concentration in a rabbit farm with natural ventilation.

2. Materials and Methods

2.1. Experiment Description

The experimental phase was carried out in a farm measuring 24 m long, 4 m wide, and 2.4 to 3.3 m high (Figure 1), belonging to the Applied Research Unit in Rabbit Production at the University of Chapingo, Mexico, located at 19°29′ N, 98°53′ W, at an altitude of 2250 m.
The facility had a total of 10 cages, each measuring 2 m × 2.4 m × 0.35 m, housing an average of 96 rabbits of a Californian breed in each cage for the purpose of meat production, maintaining a density of 20 rabbits mb−2 per cage (Figure 1).
The climate of the region, according to the Koeppen classification, is temperate humid or subhumid, subhumid prevailing, Cwb [29], with a mean annual temperature and humidity of 15.9 °C and 63.2%, respectively [30]. The hottest months are April, May, and June, with mean temperatures and relative humidity of 18.4 °C, 19.4 °C, 18.9 °C and 50.6%, 60.0%, 73.9%, respectively [27].
Outside the farm, a climate station was installed at a height of 6 m. The following data were recorded: temperature and relative humidity (S-TBH-M002, Onset Computer Co., Bourne, MA, USA; ±0.2 °C, ±2.5%), radiation (S-LIA-M003, Onset Computer Co., Bourne, MA, USA; 0 to 2500 μmol m−2 s−1, ± 5 μmol m−2 s−1), wind speed (S-WSB-M003, Onset Computer Co., Bourne, MA, USA; ±1.1 m s−1), and wind direction (S-WDA-M003, Onset Computer Co., Bourne, MA, USA; ±5°). Inside the farm, an Arduino-based monitoring system was used to record information from 13 sensors that measure temperature (DHT22 AM2302, Guangzhou Aosong Electronics Co., Ltd., Guangzhou, China; ±0.5 °C) and 6 sensors that measure ammonia (MQ-137, Hanwei Electronics Co., Ltd., Zhengzhou, China; 5 to 200 ppm). Additionally, six thermocouples were installed (TC6, Type T, Onset Computer Co., Bourne, MA, USA; ±0.6 °C) that were located inside the installation, 4 on the ceiling and 2 on the floor. The position of the sensors (Table 1) was designed to measure spatial dynamics on a horizontal plane at a height of 1.3 m, above the rabbit cages, and on a vertical plane with two sensors placed at heights of 0.1 m and 2.3 m in the center of the farm. Of the total number of sensors, measurements were taken every 10 s and a datum was recorded every 5 min with the mean of this interval.

2.2. Geometry and Computational Domain

A 3-D computational model was built based on the dimensions and characteristics of the prototype model (Figure 1). A computational domain of 70.2 m × 50.2 m × 26.4 m was built, whose sizing was based on similar research criteria [22,31]. The total volume of the domain was 93,034.656 m3.
A mesh was prepared with hexahedral elements, which has the advantage that the elements can be repeatedly subdivided anisotropically, without the deterioration of the quality of the element, and which uses computational resources efficiently [32]. To analyze the quality of the mesh, temperature sampling was carried out on the z axis inside the facility, and the values were compared with the RMSE statistic.
The boundary conditions (Table 2) were established based on previous work carried out in the same facility [27]. The values of temperature and wind speed and direction recorded by the climatic station outside the farm were used. Also used were ammonia data in rabbit facilities, according to research carried out in 2011 [33] where concentrations of 0.78 to 6.1 mg m−3 were obtained, and from 10.9 to 14.3 mg m−3 during winter. Similar results were obtained in 2004, with concentrations of 8.5 to 10 mg m−3 [34]. In this study, the average of the maximum values of both works was used, being 10.93 mg m−3, equivalent to 15.43 ppm. The atmospheric pressure in the domain was set at 98.1 kPa (corresponding to 2250 m above sea level).

2.3. Fundamental Equations for the Simulation of the Numerical Model

Computational fluid dynamics is governed by the Navier–Stokes equations, expressed in a group of partial derivatives as shown in Equation (1) [27,35].
( ρ φ ) t + ρ u φ = Γ φ + S φ
where: ∂ = derivative; ρ = density (kg m−3); t = time (s); ∇ = divergence; φ = state variable (e.g., air temperature and ammonia); u = wind speed (m s−1); Γ = diffusion coefficient (m2 s−1); and S = source term.
In the numerical procedure, the SIMPLE algorithm solution method was used with second-order spatial discretizations and values of the residuals established for convergence of the numerical solution in 1 × 10⁻⁶ for energy and ammonia, while in 1 × 10⁻³ for continuity, velocity, κ, and epsilon.

3. Results and Discussion

3.1. Evaluation of the Numerical Model

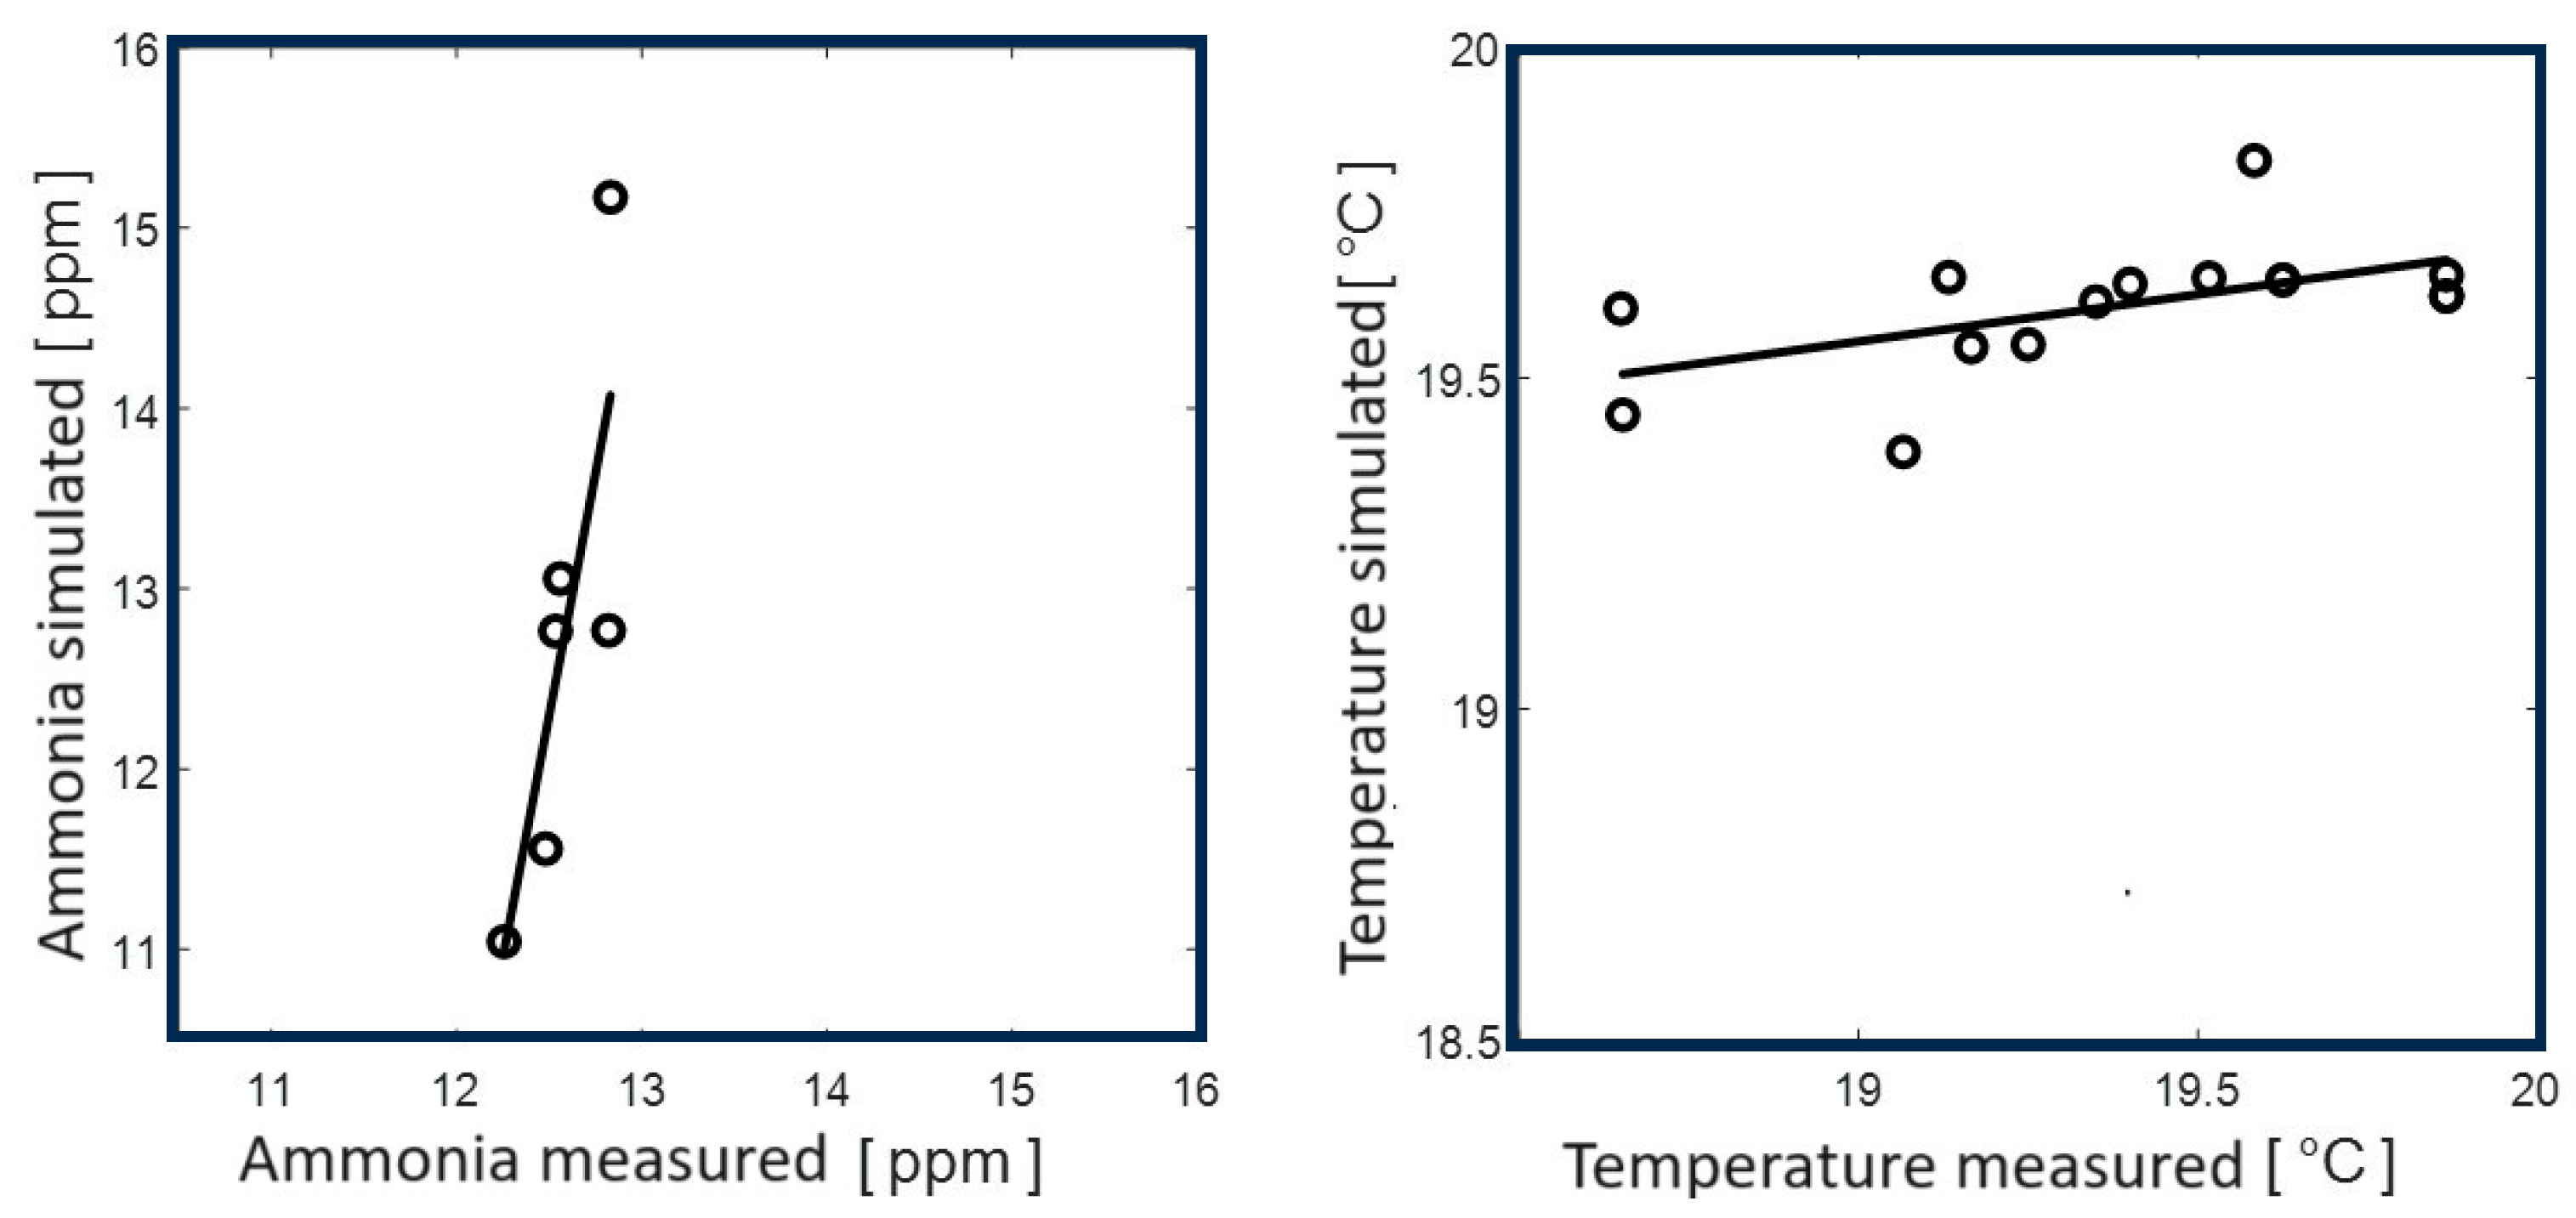
The model evaluation was carried out through statistical analysis (mean, standard deviation, and RMSE), between the simulation results and the experimental data of six ammonia points and 13 temperature points (Figure 2). Data were collected during the study period and point averages were estimated, both for the boundary conditions and the points to validate the model.
The results show a mean ammonia concentration in the measured and simulated data of 12.58 ± 0.22 ppm and 12.73 ± 1.43 ppm, respectively. Regarding the air temperature variable, the obtained mean was 19.37 ± 0.39 °C for the measured data and 19.61 ± 0.1 °C for the simulated data. The calculated percentage error of the six points in ammonia ranged between 0.4 and 18.2%, and the 13 points in temperature ranged between 0.12 and 4.25%.
The comparison between the measured and simulated data (Figure 2) showed an RMSE of 1.16 and 0.41 for ammonia and temperature, respectively.
To validate the model, experimentally measured data were used. For the boundary conditions, wind speed and temperature were used. Ammonium concentrations and heat flux were used as initial conditions. The simulation was carried out in a steady state at midday with average values at solar noon. With the experimental and simulated results at the same point, statistical indicators were applied to assess the agreement between this series of values. Figure 2 shows in a discrete way the experimental values and the fit line with the simulated values of temperature and ammonia in the same points of the farm.
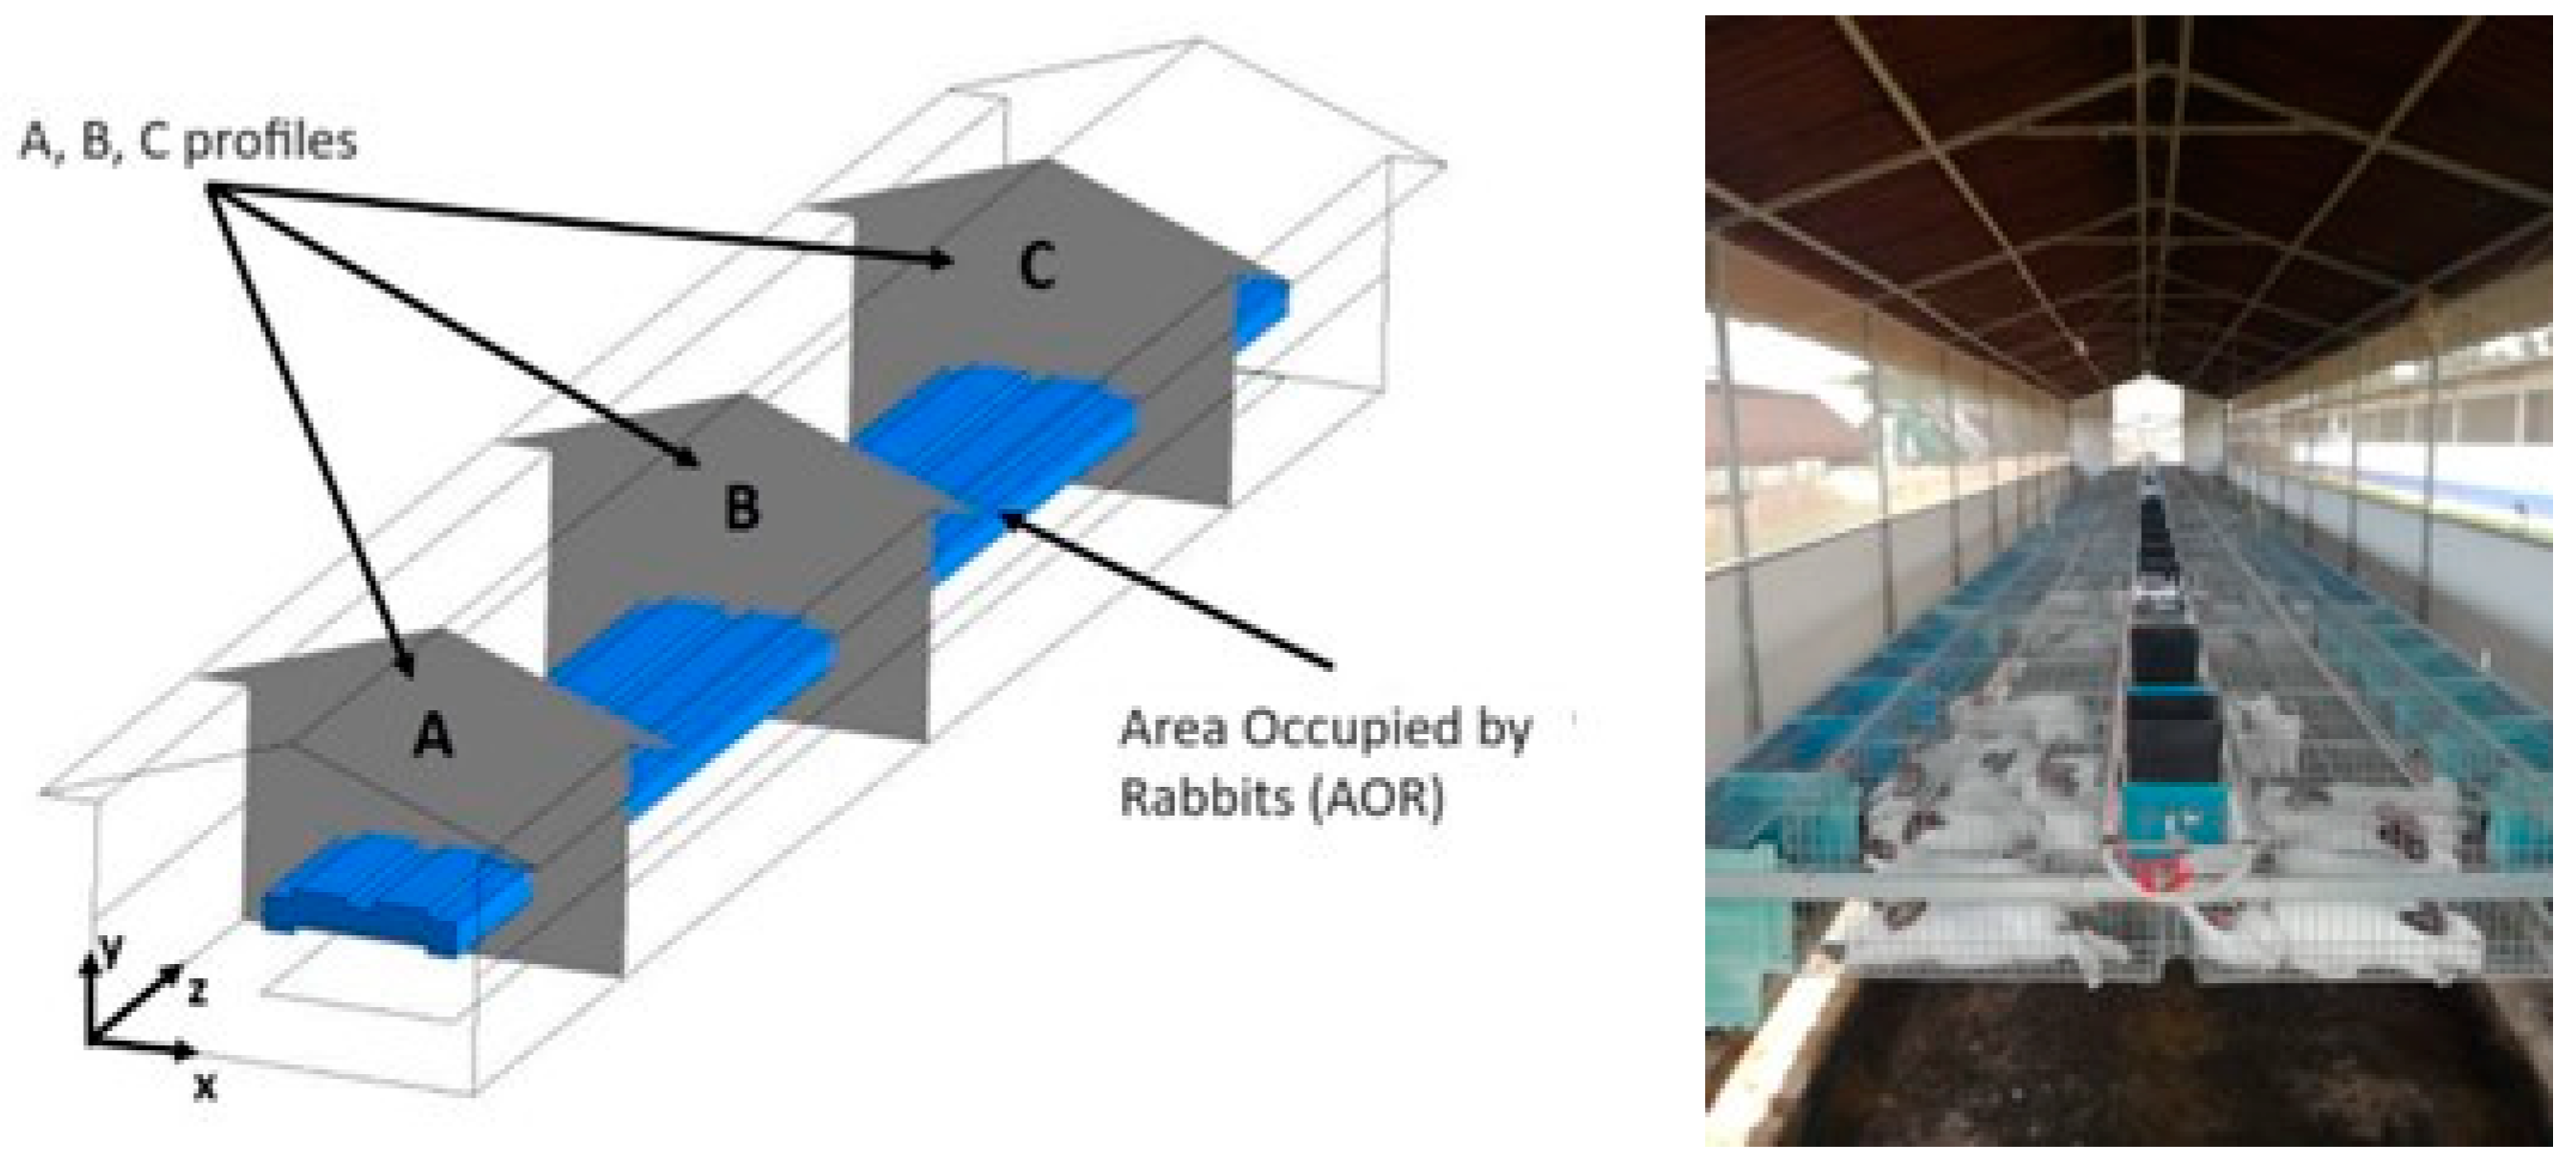
The results of the evaluation between the measured and simulated data graphically show that under the simulated conditions, the data adjust to the measured values, which provides numerical confidence for the use of the model to be able to infer the dynamics of the air inside the farm. Consequently, the model was used to predict the variations of ammonia concentration in the AOR and the vertical variation of ammonia concentration and air temperature within the farm in three cross sections A, B, and C, located at 4, 12, and 20 m respectively, in the direction of the z axis (Figure 3). Air temperature data of 22 °C, an outdoor wind speed of 2.5 m s−1, and three wind incidence directions 0°, 45°, and 90° with respect to the z axis were used as boundary conditions.

3.2. Variation of Air Speed and Ammonia Concentration in the AOR

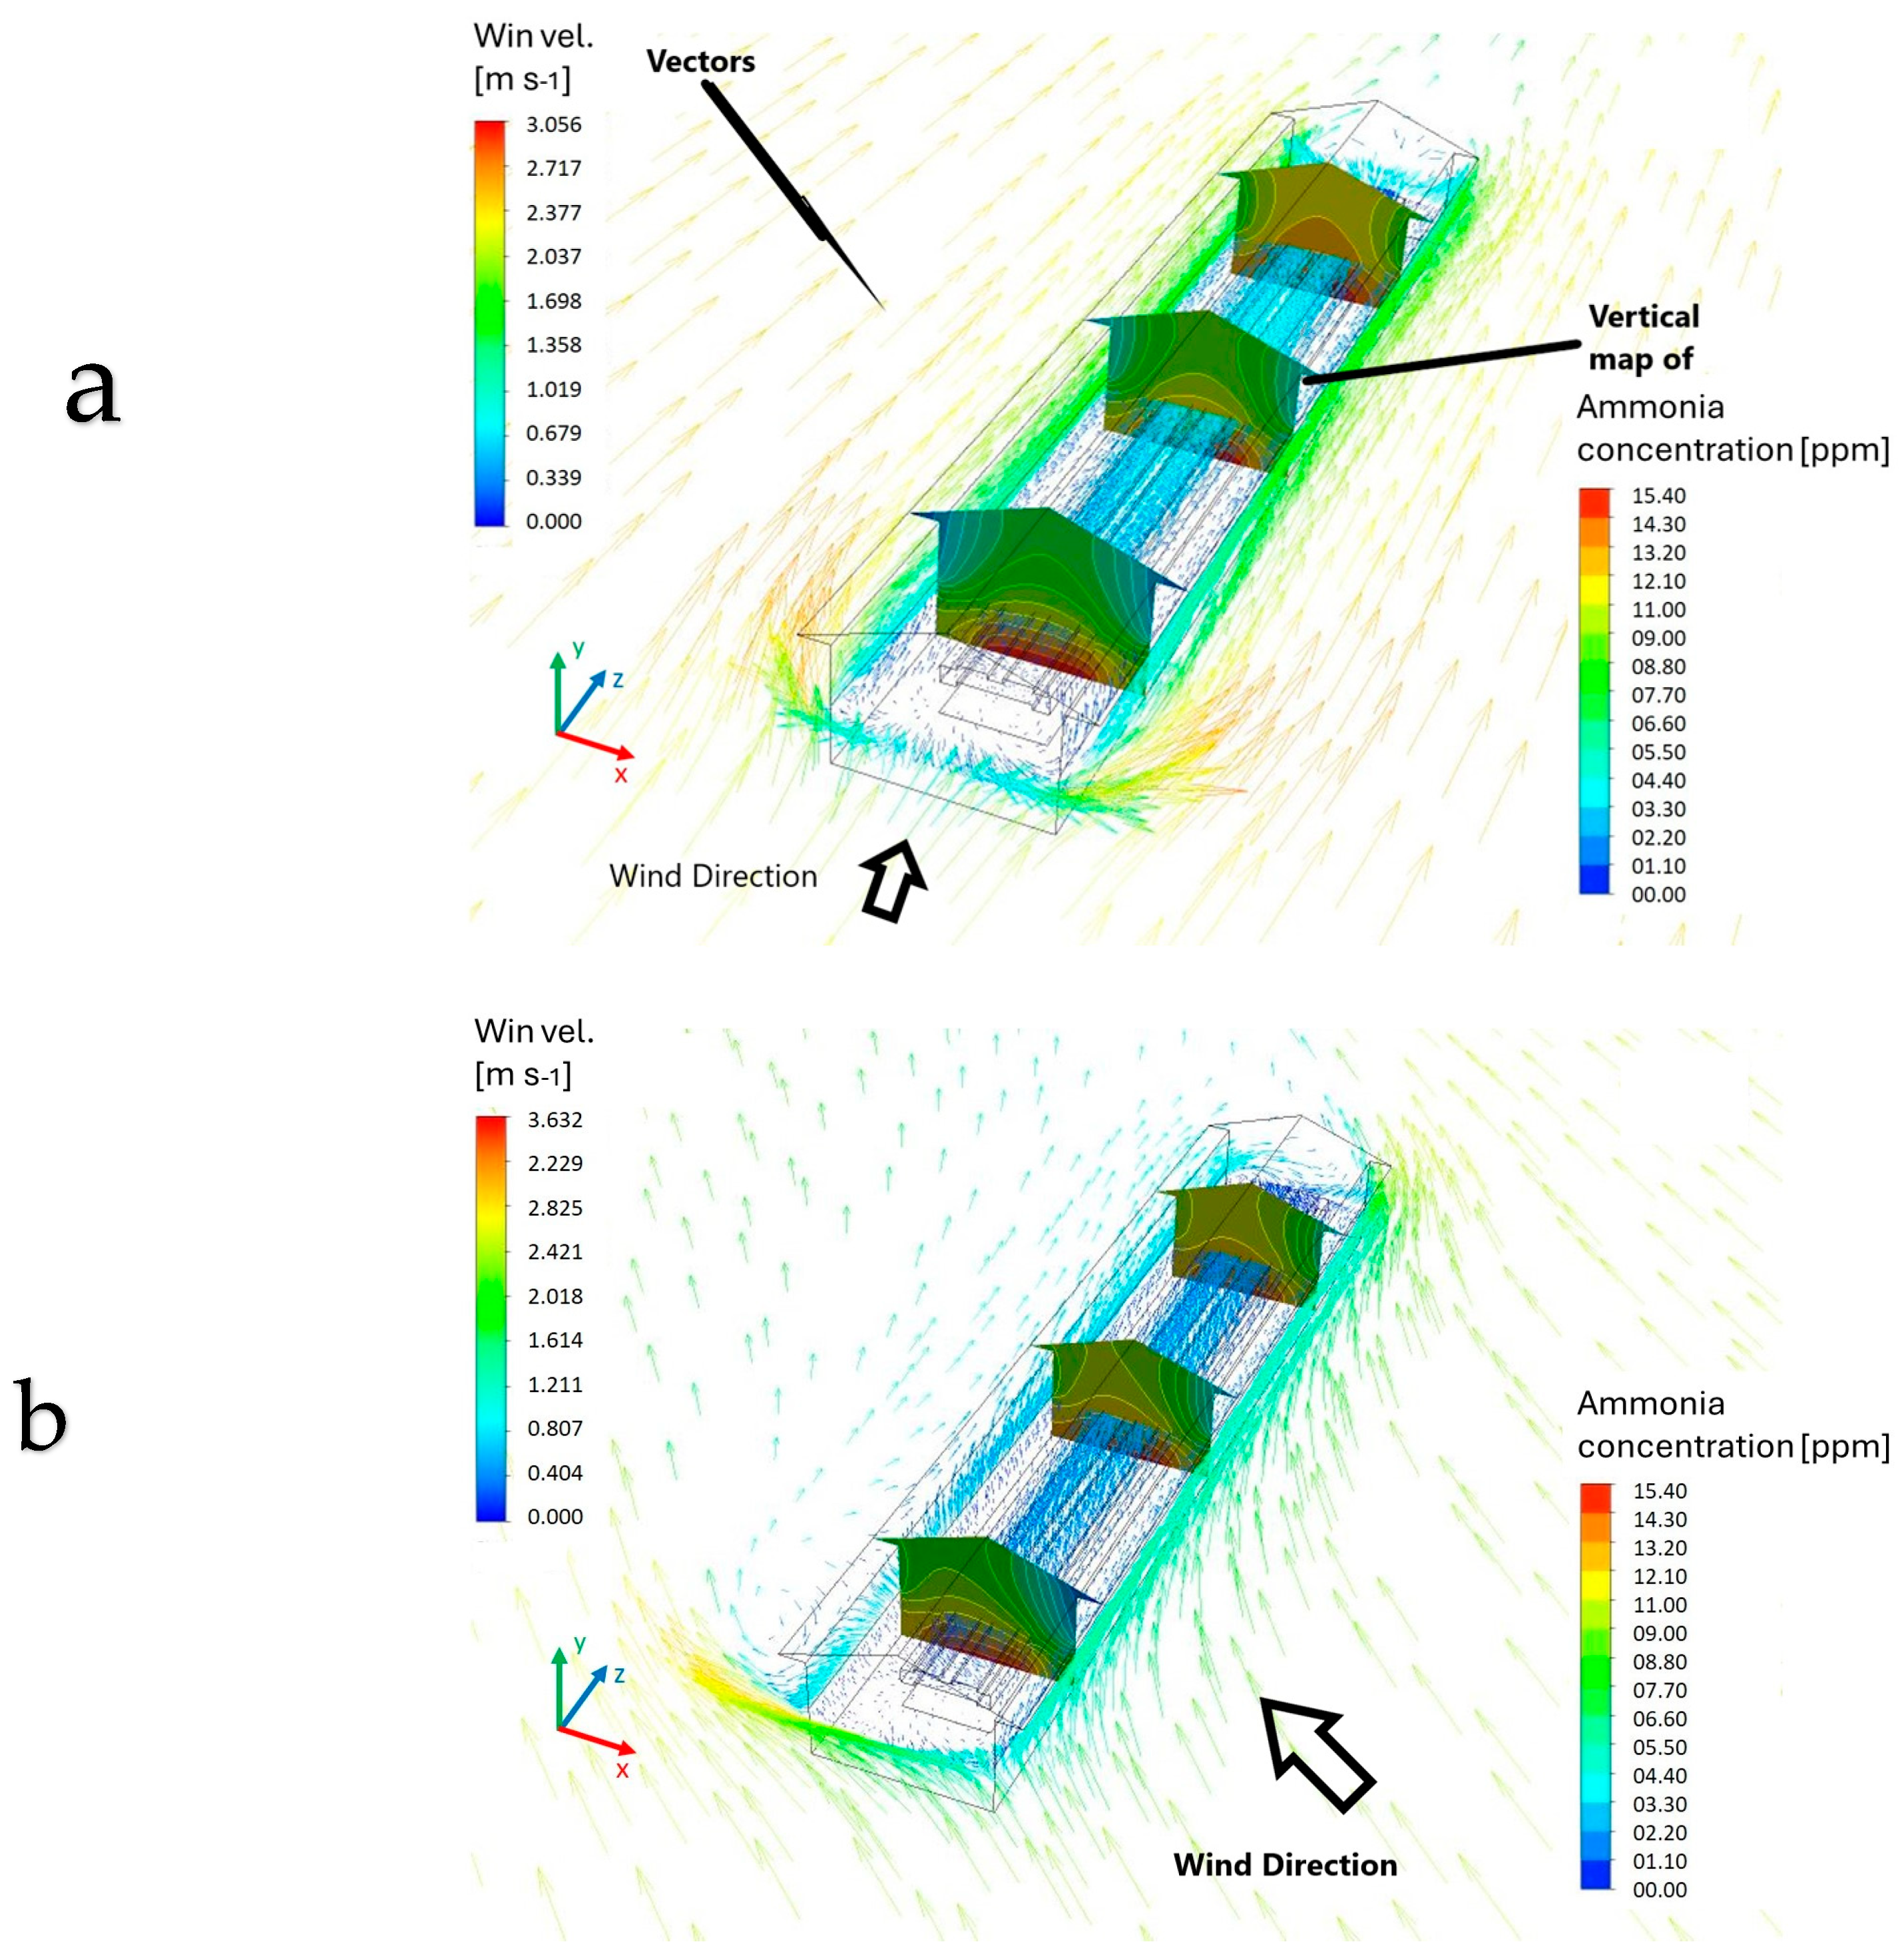
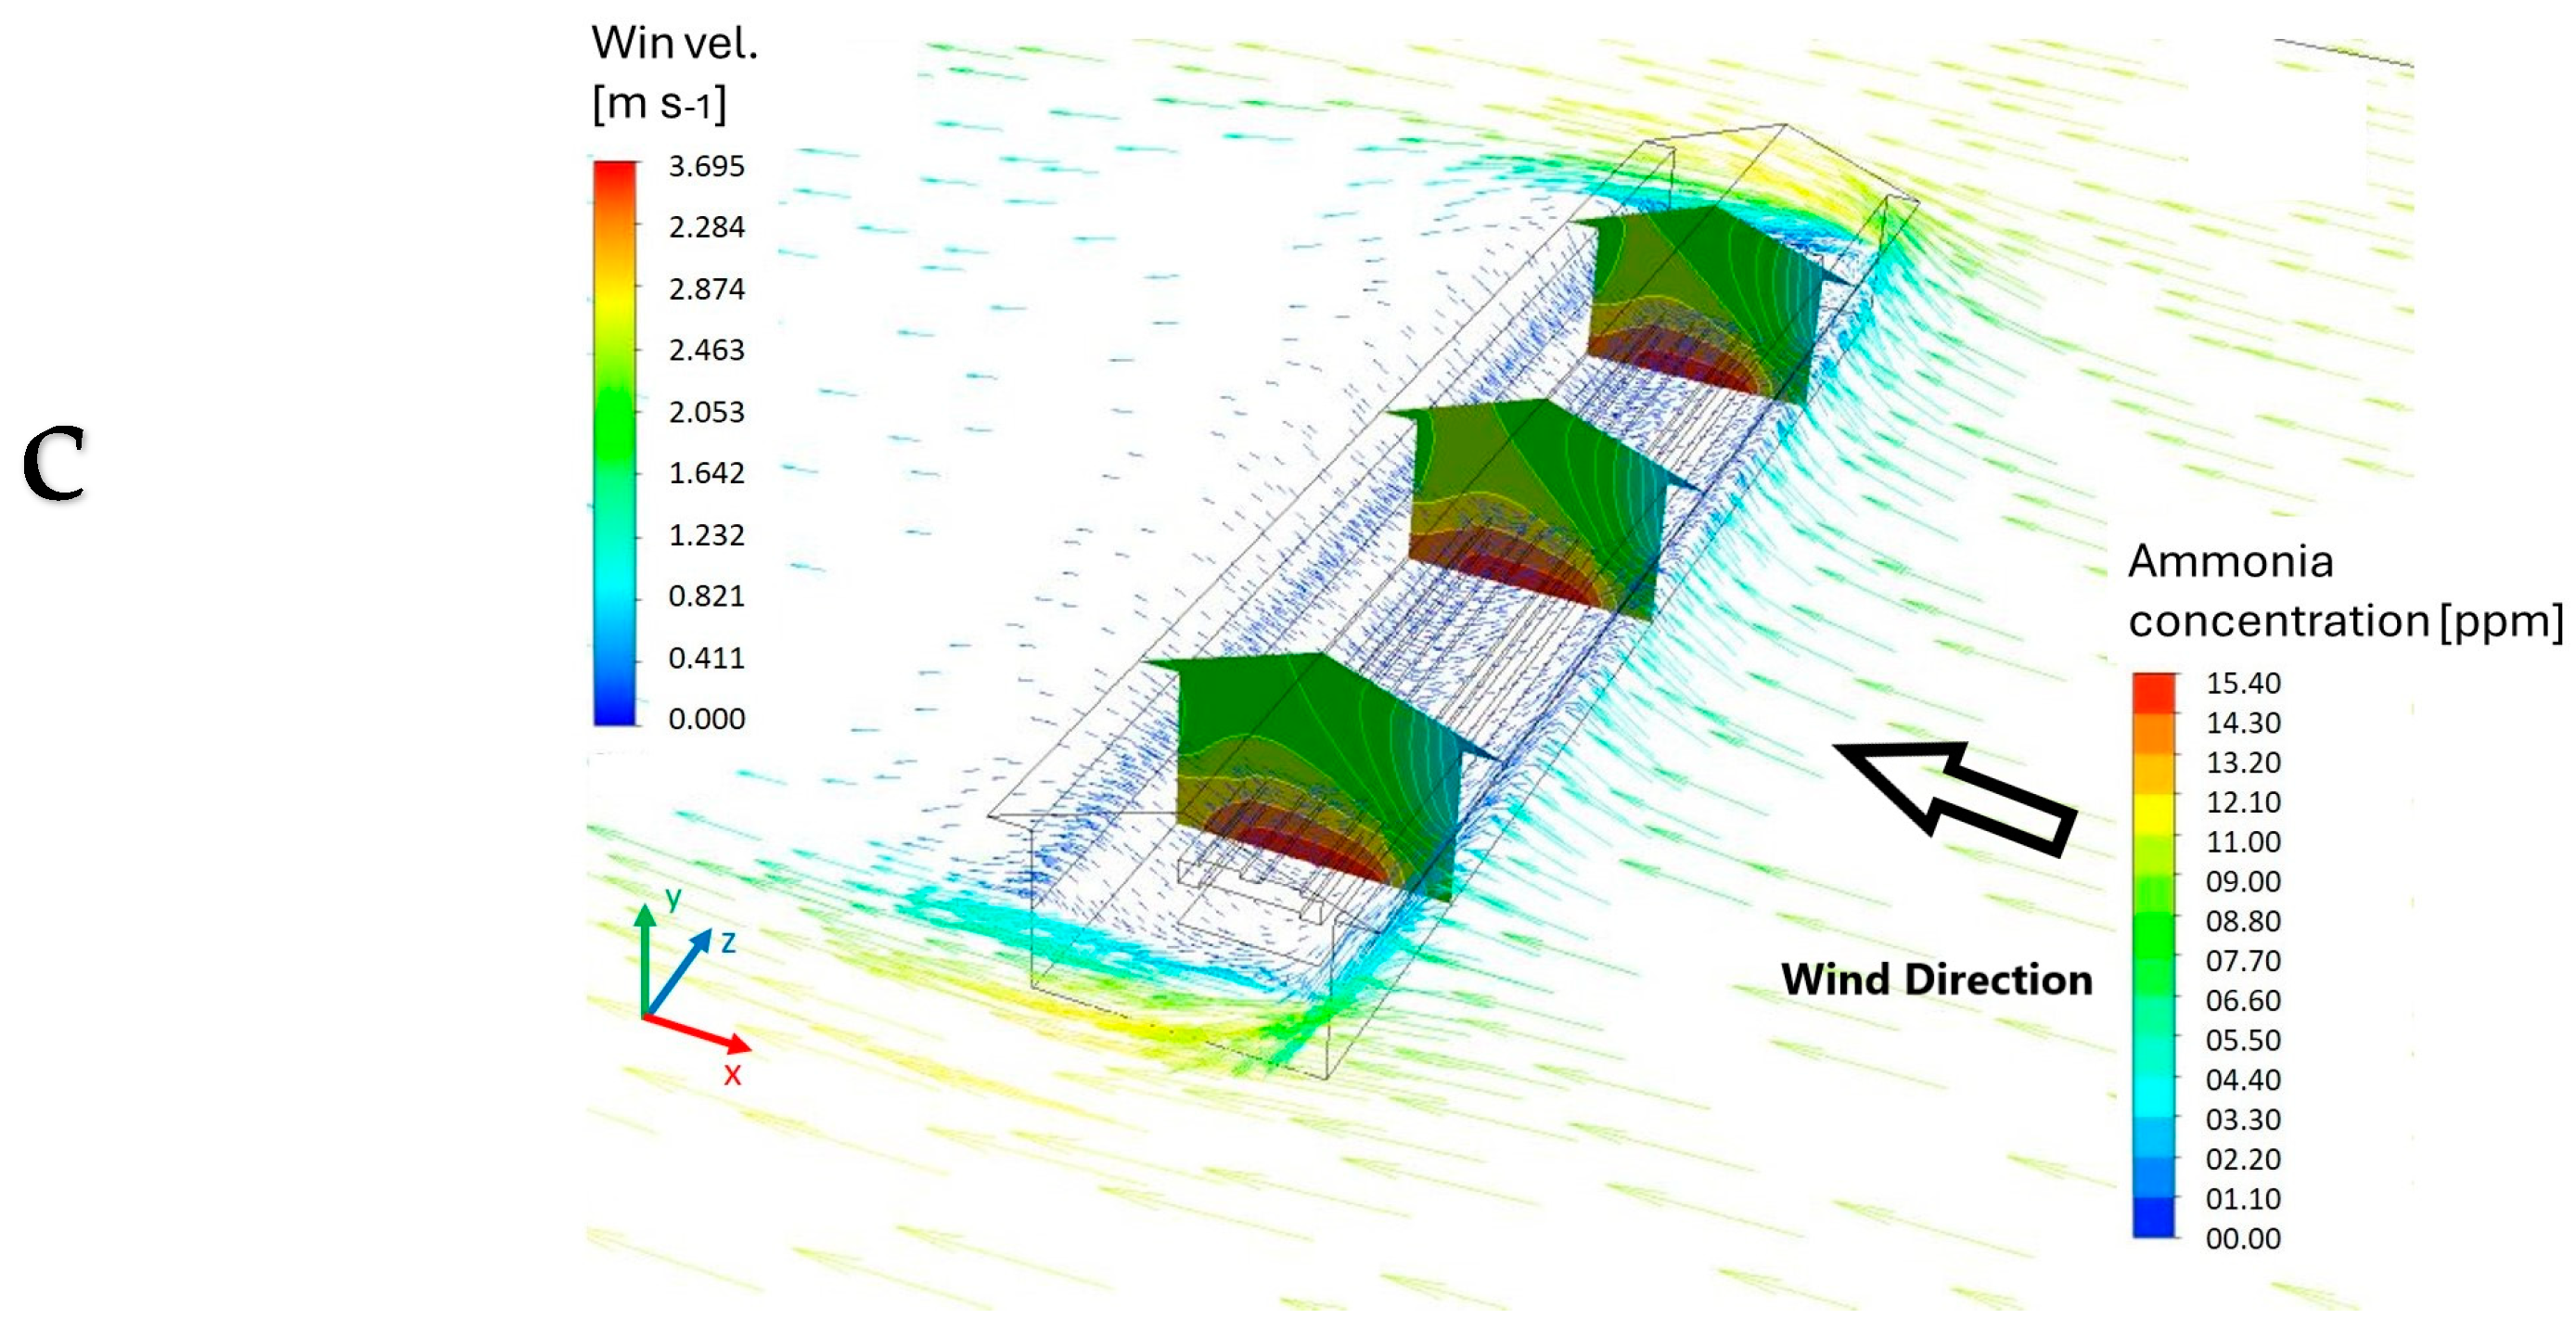
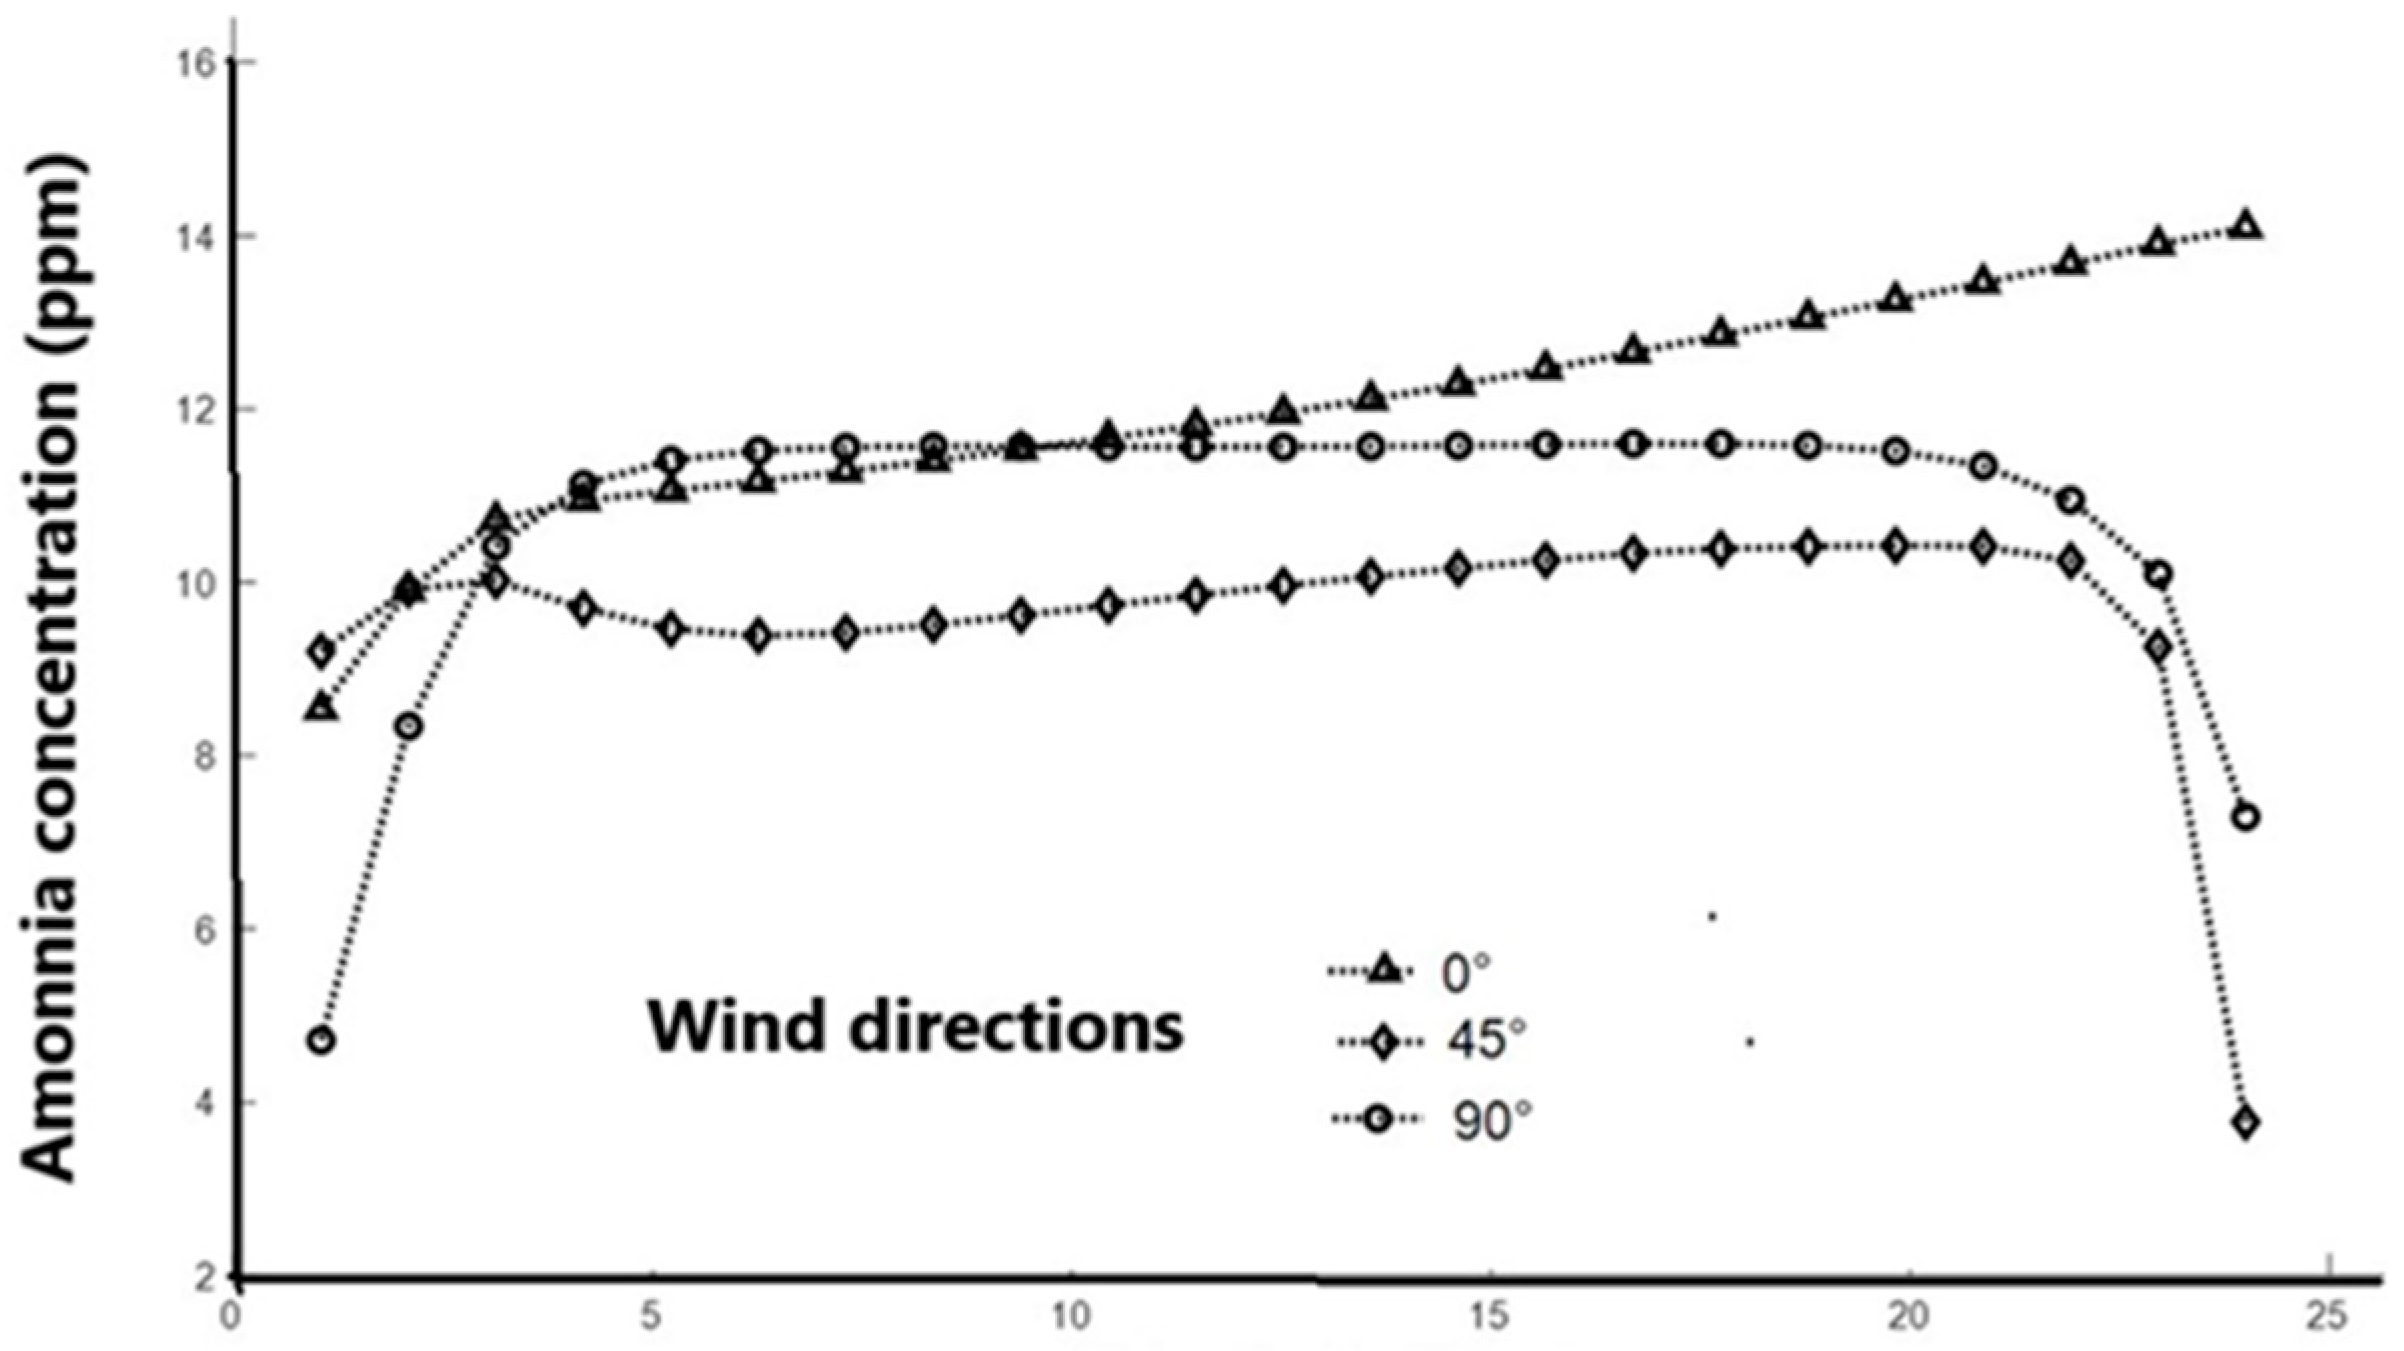
The simulation results at different wind incidence angles show that the ammonia concentration in the AOR with respect to the z axis is not homogeneous (Figure 4). It can be observed that with the wind direction at 0°, air speed vectors of magnitude range between 0.3 to 0.5 m s−1, and ammonia shows an increase from 8.5 to 14 ppm throughout the farm, presenting gas accumulation in the rear area of the farm due to the direction of the air flow. When the wind direction is at 45°, the air speed is less than 0.4 m s−1, and the ammonia concentration ranges between 9.3 and 10.5 ppm; however, in the rear area of the farm a decrease of 5.5 ppm is seen. With the wind direction at 90°, the speed is less than 0.3 m s−1, because the upper limit of the AOR is 10 cm below the height at which the farm windows are located, causing the air flow to pass through the installation without being hindered by the AOR. The ammonia concentration has a symmetrical behavior with respect to the center of the farm: in the frontal zone from 0 m to 5 m the ammonia increases from 5 to 11 ppm, in the central zone from 5 m to 20 m, the variation is from 11 to 11.6 ppm, and in the rear zone the ammonia decreases from 11 to 7 ppm.
The mean ammonia concentrations in the AOR are 12.14 ppm, 9.65 ppm, and 11.04 ppm with wind directions at 0°, 45°, and 90°, respectively. This means that ammonia concentrations represent decreases with respect to the emission source of 21.2% when the wind direction is at 0°, 37.3% at 45°, and 28.3% at 90°. It is observed that, of the three different directions studied, the most favorable case is when the wind hits with a direction of 45°, as the ammonia concentration in the AOR is reduced by a greater percentage.

3.3. Vertical Variation of Ammonia Concentration and Air Temperature

The results show that the variation of ammonia concentration and air temperature with respect to height presents a positive temperature gradient and a decrease in ammonia concentration. However, the most visible result is the variation of ammonia concentration as a function of the wind velocity angle, which caused the reduction in the concentration in the cages area. The rise in temperature also contributed to generate ammonia production in the floor zone; however, if the wind incidence is at a 45° angle of direction, this concentration can be reduced, above all in the zone of the rabbits.

3.3.1. Ammonia and Temperature in Cross Section A

In this section, the maximum variation of ammonia is 10 ppm; from a concentration of 15.4 ppm emitted by the source, it decreases to 5 ppm at the top of the farm and occurs when the wind direction is at 45°. Nevertheless, in this wind direction, the lowest ammonia concentration is presented compared to the concentration found in the other wind directions, with a decrease from 15.4 ppm to only 7 ppm. Regarding the air temperature, when the wind direction is at 45°, it presents greater variation and a higher temperature compared to the other two cases: the temperature ranges between 19.8 and 21.6 °C with the wind direction at 0°, and with the wind direction at 90°, the temperature reaches a maximum of 21.3 °C (Figure 6A).

3.3.2. Ammonia and Temperature in Cross Section B

In this section located in the center of the farm, ammonia behaves in a similar way to that seen in section A when the wind direction is at 45° and 90°, where it decreases from the 15.4 ppm emitted by the source to 5 and 7.3 ppm, respectively. When the wind direction is at 0°, the decrease in ammonia concentration is from 15.4 to 9.2 ppm, which, compared to section A, presents a concentration that is 2 ppm higher. The air temperature increases from 19.8 °C to a maximum of 21, 21.7, and 21.3 °C when the wind direction is at 0°, 45°, and 90°, respectively (Figure 5B and Figure 6B).

3.3.3. Ammonia and Temperature in Cross Section C

With the wind direction at 90°, the ammonia concentration is similar to the previous sections. That is, the decrease in concentration is from 15.4 to 7.5 ppm, only 0.5 and 0.2 ppm higher than in sections A and B, respectively. With the wind direction at 45°, the ammonia concentration in this section decreases from 15.4 to 5.8 ppm. When the wind direction is at 0°, the ammonia concentration decreases from 15.4 to 12 ppm, which is equivalent to the smallest ammonia variation of the three sections analyzed. The temperature in this section ranges from 19.8 °C to 20.6, 21.5, and 21.3 °C for the wind direction at 0°, 45°, and 90°, respectively (Figure 5C and Figure 6C).
Managing the environment inside the farm passively presents specific difficulties among the variables analyzed: wind speed, temperature, and gas concentration (ammonium). For temperature and humidity control, a critical aspect is the orientation of the windows in relation to the wind direction, as described by Bjerg et al. [11], Rojano et al. [23], and Flores-Velázquez [27]. Previous results indicate that even when the ventilation rate in different facilities is the same, the critical factor to consider is the position of the windows that can help remove the gas concentration that originates in the manure area.
By managing the ventilation rate, temperature control is achieved in the cage area and in the three simulated wind directions. When the wind direction angle is 0°, it is feasible to efficiently remove the volume of air, and consequently, temperatures ranging from 21 °C with a longitudinal gradient of ±1 °C are obtained. However, the maximum reduction in the concentration of gases, in this case ammonium, occurs when the wind direction is simulated with an angle of 45° with respect to the z axis. The difficulty in managing ammonium gas does not depend only on the ventilation rate but also on the generation rate in the floor area (source) due to temperature levels, as reported by Rong et al. [15] and Rong et al. [16].
Due to the interaction of factors that determine the farm environment, it is necessary to integrate other climatic variables, such as relative humidity and the concentration of gases such as CO2, for better control of the rabbits’ health. However, according to the objective set in this work, ammonium levels have been observed distributed mainly in the cage area as a function of the wind direction with respect to the farm. It stands out that although it is true that a difference is observed with respect to the simulated wind direction, the difference in ammonium concentration ranges from 2 ppm (Figure 7), so there is a relationship with the results found by Ngwabie et al. [1], Mondaca et al. [19], Flores-Velázquez et al. [27], and Jin et al. [28] regarding the variables that influence the concentration of gases and their interaction with the ventilation rate and temperature.
Figure 7 show the dynamics of the ammonia concentration in the rabbit zone along the cages.
Computational fluid dynamics modeling is a robust tool for prediction and design in physical processes involving fluids. In rabbit farming facilities, climate control is a critical activity due to the production of ammonia by the rabbits themselves. As an example, the quality of semen for insemination depends on climatic control, which consequently implies the health of the rabbit.
The contribution of this research is the construction and validation of a model capable of predicting the environmental dynamics on the farm as well as knowing the levels of ammonium and temperature at the level of the rabbit cage. With these results it is feasible, in a first contribution, to operate the ventilation according to the direction of the wind in order to obtain the highest rate of ventilation, as well as temperature and ammonium levels in the range that does not affect the health of the rabbit. And secondly, we propose design hypotheses to improve the ventilation system such as the use of deflectors or the modification the window levels.
Finally, with the validated model, it will be possible to diversify the variables to be analyzed on the farm and in part in the cage area, such as relative humidity, and other gases such as carbon dioxide, oxygen, water vapor, among others.

4. Conclusions

The objective of this work was to build and evaluate a CFD-based model to simulate and analyze the distribution of temperature and ammonia concentration of a rabbit farm with natural ventilation. According to the objective, a computational model of a typical barn was built, which was validated under the environmental conditions of central Mexico. Environment dynamics inner the rabbit barn indicate a slow efficiency in the climate conditions for the good health of the rabbits. The CFD model evaluated with the experimental data showed a better prediction in temperature than in ammonia, due to the considerations of a constant ammonia emission source throughout the collector.
The effects of wind incidence on the rabbit barn in three directions (0°, 45°, and 90° with respect to the z axis) on the ammonia concentration and air temperature inside the farm were studied, where it was found that the most favorable wind direction is at 45°, with concentrations of 9 to 11 ppm in the area occupied by rabbits (AOR).
With a wind direction at 0° with respect to the z axis, lower air temperatures were obtained in the vertical profiles than with the other wind directions; however, ammonia accumulated in the rear area of the installation (20 to 24 m on the z axis of the farm).
With a wind direction at 90° with respect to the z axis, a homogeneous distribution in temperature and ammonia concentration was obtained in the area occupied by rabbits (AOR).

Author Contributions

D.V.C.: methodology, software, validation, and writing—original draft preparation. J.F.-V.: conceptualization, formal analysis, and writing—review and editing. A.R.G.: methodology, investigation, and formal analysis. All authors have read and agreed to the published version of the manuscript.

Funding

This research received no external funding.

Institutional Review Board Statement

Not applicable.

Informed Consent Statement

Not applicable.

Data Availability Statement

The data presented in this study are available on request from the corresponding author.

Acknowledgments

At CONAHCYT for scholarship of the master student.

Conflicts of Interest

The authors declare no conflicts of interest.

References

  1. Ngwabie, N.M.; Jeppsson, K.-H.; Nimmermark, S.; Swensson, C.; Gustafsson, G. Multi-location measurements of greenhouse gases and emission rates of methane and ammonia from a naturally-ventilated barn for dairy cows. Biosyst. Eng. 2009, 103, 68–77. [Google Scholar] [CrossRef]
  2. Calvet, S.; Campelo, J.C.; Estellés, F.; Perles, A.; Mercado, R.; Serrano, J.J. Suitability evaluation of multipoint simultaneous CO2 sampling wireless sensors for livestock buildings. Sensors 2014, 14, 10479–10496. [Google Scholar] [CrossRef] [PubMed]
  3. Kwon, K.S.; Lee, I.B.; Ha, T. Identification of key factors for dust generation in a nursery pig house and evaluation of dust reduction efficiency using a CFD technique. Biosyst. Eng. 2016, 151, 28–52. [Google Scholar] [CrossRef]
  4. Bodnar, K.; Makra, L.; Bodnar, G.; Privoczki, Z.I. A review on environmental management of rabbit production. Agricultural Management/Lucrari Stiintifice Seria I. Manag. Agricol. 2019, XXI, 5–12. [Google Scholar]
  5. Marai, I.F.; Habeeb, A.A.; Gad, A. Rabbits’ productive, reproductive and physiological performance traits as affected by heat stress: A review. Livest. Prod. Sci. 2002, 78, 71–90. [Google Scholar] [CrossRef]
  6. Marai, I.F.M.; Ayyat, M.S.; Abd El-Monem, U.M. Growth performance and reproductive traits at first parity of New Zealand White female rabbits as affected by heat stress and its alleviation under Egyptian conditions. Trop. Anim. Health Prod. 2001, 33, 451–462. [Google Scholar] [CrossRef] [PubMed]
  7. Drewry, J.L.; Choi, C.Y.; Powell, J.M.; Luck, B.D. Computational model of methane and ammonia emissions from dairy barns: Development and validation. Comput. Electron. Agric. 2018, 149, 80–89. [Google Scholar] [CrossRef]
  8. Krupa, S. Effects of atmospheric ammonia (NH3) on terrestrial vegetation: A review. Environ. Pollut. 2003, 124, 179–221. [Google Scholar] [CrossRef] [PubMed]
  9. Norton, T.; Grant, J.; Fallon, R.; Sun, D.W. Assessing the ventilation effectiveness of naturally ventilated livestock buildings under wind dominated conditions using computational fluid dynamics. Biosyst. Eng. 2009, 103, 78–99. [Google Scholar] [CrossRef]
  10. Wu, W.; Zhai, J.; Zhang, G.; Nielsen, P.V. Evaluation of methods for determining air exchange rate in a naturally ventilated dairy cattle building with large openings using computational fluid dynamics (CFD). Atmos. Environ. 2012, 63, 179–188. [Google Scholar] [CrossRef]
  11. Bjerg, B.; Svidt, K.; Zhang, G.; Morsing, S. SE–Structures and Environment: The Effects of Pen Partitions and Thermal Pig Simulators on Airflow in a Livestock Test Room. J. Agric. Eng. Res. 2000, 77, 317–326. [Google Scholar] [CrossRef]
  12. Li, H.; Rong, L.; Zong, C.; Zhang, G. Assessing response surface methodology for modelling air distribution in an experimental pig room to improve air inlet design based on computational fluid dynamics. Comput. Electron. Agric. 2017, 141, 292–301. [Google Scholar] [CrossRef]
  13. Bjerg, B.; Rong, L.; Zhang, G. Computational prediction of the effective temperature in the lying area of pig pens. Comput. Electron. Agric. 2018, 149, 71–79. [Google Scholar] [CrossRef]
  14. Li, H.; Rong, L.; Zhang, G. Numerical study on the convective heat transfer of fattening pig in groups in a mechanical ventilated pig house. Comput. Electron. Agric. 2018, 149, 90–100. [Google Scholar] [CrossRef]
  15. Rong, L.; Bjerg, B.; Zhang, G. Assessment of modeling slatted floor as porous medium for prediction of ammonia emissions—Scaled pig barns. Comput. Electron. Agric. 2015, 117, 234–244. [Google Scholar] [CrossRef]
  16. Rong, L.; Aarnink, A.J.A. Development of ammonia mass transfer coefficient models for the atmosphere above two types of the slatted floors in a pig house using computational fluid dynamics. Biosyst. Eng. 2019, 183, 13–25. [Google Scholar] [CrossRef]
  17. Norton, T.; Grant, J.; Fallon, R.; Sun, D.W. Improving the representation of thermal boundary conditions of livestock during CFD modelling of the indoor environment. Comput. Electron. Agric. 2010, 73, 17–36. [Google Scholar] [CrossRef]
  18. Rojano, F.; Mondaca, M.; Choi, C.Y. Feasibility of a dual cooling system for dairy cows in arizona. In Proceedings of the ASABE Meeting, Louisville, KY, USA, 7–10 August 2011. [Google Scholar] [CrossRef]
  19. Mondaca, M.R.; Choi, C.Y.; Cook, N.B. Understanding microenvironments within tunnel-ventilated dairy cow freestall facilities: Examination using computational fluid dynamics and experimental validation. Biosyst. Eng. 2019, 183, 70–84. [Google Scholar] [CrossRef]
  20. Gebremedhin, K.G.; Wu, B.; Perano, K. Modeling conductive cooling for thermally stressed dairy cows. J. Therm. Biol. 2016, 56, 91–99. [Google Scholar] [CrossRef]
  21. Fidaros, D.; Baxevanou, C.; Bartzanas, T.; Kittas, C. Numerical study of mechanically ventilated broiler house equipped with evaporative pads. Comput. Electron. Agric. 2018, 149, 101–109. [Google Scholar] [CrossRef]
  22. Rojano, F.; Bournet, P.E.; Hassouna, M.; Robin, P.; Kacira, M.; Choi, C.Y. Computational modelling of thermal and humidity gradients for a naturally ventilated poultry house. Biosyst. Eng. 2016, 151, 273–285. [Google Scholar] [CrossRef]
  23. Rojano, F.; Bournet, P.E.; Hassouna, M.; Robin, P.; Kacira, M.; Choi, C.Y. Modelling the impact of air discharges caused by natural ventilation in a poultry house. Biosyst. Eng. 2019, 180, 168–181. [Google Scholar] [CrossRef]
  24. Blanes-Vidal, V.; Guijarro, E.; Balasch, S.; Torres, A.G. Application of computational fluid dynamics to the prediction of airflow in a mechanically ventilated commercial poultry building. Biosyst. Eng. 2008, 100, 105–116. [Google Scholar] [CrossRef]
  25. Du, L.; Yang, C.; Dominy, R.; Yang, L.; Hu, C.; Du, H.; Li, Q.; Yu, C.; Xie, L.; Jiang, X. Computational Fluid Dynamics aided investigation and optimization of a tunnel-ventilated poultry house in China. Comput. Electron. Agric. 2019, 159, 1–15. [Google Scholar] [CrossRef]
  26. Tong, X.; Hong, S.W.; Zhao, L. CFD modeling of airflow, thermal environment, and ammonia concentration distribution in a commercial manure-belt layer house with mixed ventilation systems. Comput. Electron. Agric. 2019, 162, 281–299. [Google Scholar] [CrossRef]
  27. Flores-Velázquez, J.; Villarreal-Guerrero, F.; Ojeda, W.; Ruíz-García, A. Thermal and ammonia concentration gradients in a rabbit barn with two ventilation system designs. Rev. Bras.Eng. Agric. Ambirnt. 2017, 21, 134–140. [Google Scholar] [CrossRef]
  28. Jin, N.; Zheng, M.; Chen, J.; Duan, E.; Kong, D.; Wang, H.; Fang, P. Study on the indoor environmental simulation and optimal design of rabbit houses in winter based on CFD. In Proceedings of the 2018 ASABE Annual International Meeting, Detroit, MI, USA, 29 July–1 August 2018; p. 1. [Google Scholar] [CrossRef]
  29. Jáuregui Ostos, E.; Vidal Bello, J. Investigaciones geográficas: Boletín del Instituto de Geografía. En Investigaciones geográficas. 1990. Available online: http://www.scielo.org.mx/scielo.php?script=sci_arttext&pid=S0188-46111981000100002 (accessed on 16 November 2023).
  30. COLPOS. Normales Climatológicas. 2019. Available online: http://www.cm.colpos.mx/meteoro/repor2/nrm15c.htm (accessed on 12 February 2019).
  31. Rojano, F.; Bournet, P.E.; Hassouna, M.; Robin, P.; Kacira, M.; Choi, C.Y. Modelling heat and mass transfer of a broiler house using computational fluid dynamics. Biosyst. Eng. 2015, 136, 25–38. [Google Scholar] [CrossRef]
  32. Biswas, R.; Strawn, R.C. Tetrahedral and hexahedral mesh adaptation for CFD problems. Appl. Numer. Math. 1998, 26, 135–151. [Google Scholar] [CrossRef]
  33. Calvet, S.; Cambra-López, M.; Estellés Barber, F.; Torres, A.G. Characterization of the indoor environment and gas emissions in rabbit farms. World Rabbit Sci. 2011, 19, 49–61. [Google Scholar] [CrossRef]
  34. Beurskens, A.G.C.; Hol, J.M.G. Onderzoek naar de ammoniak- en geuremissie van stallen LXI: Stal voor vleeskalveren (witvlees productie). In Agrotechnology & Food Innovations B.V.; Agrotechnology & Food Sciences Group: Wageningen, The Netherlands, 2004. [Google Scholar]
  35. Versteeg, H.K.; Malalasekera, W. An Introduction to Computational Fluid Dynamics: The Finite Volume Method; Pearson Education Ltd.: Edinburgh, UK, 2007. [Google Scholar]
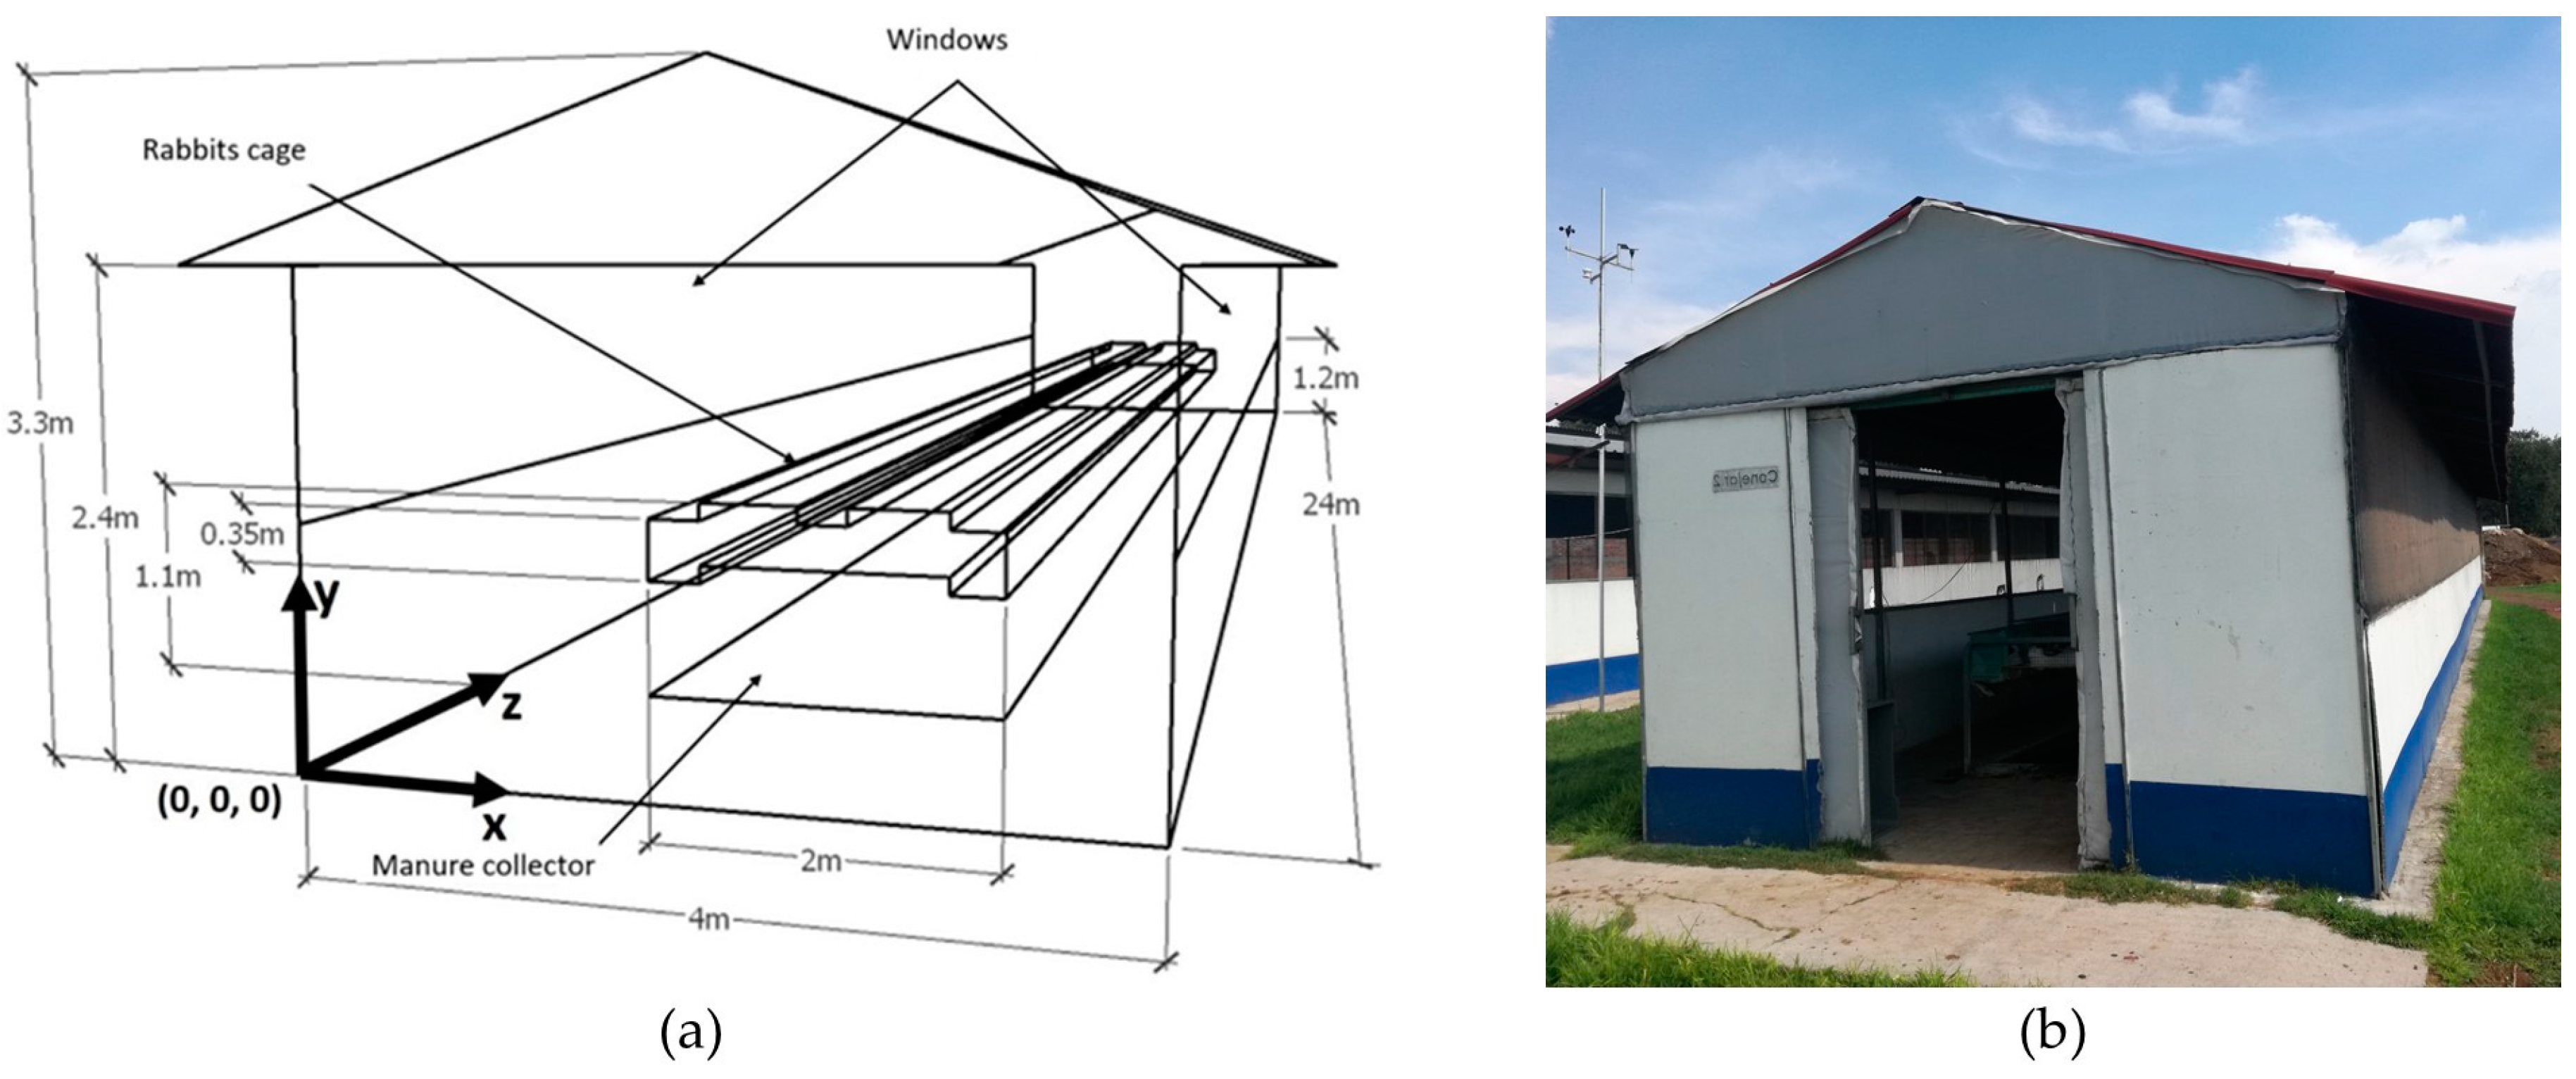
Figure 1. Characteristics of the experimental rabbit barn (a) Geometry dimensions and (b) Prototype model.
Applsci 14 03767 g001
Figure 2. Comparison between measured and simulated data for ammonia and temperature.
Applsci 14 03767 g002
Figure 3. Area occupied by rabbits (AOR) and cross-sectional planes created for thermal gradient and ammonia concentration analysis.
Applsci 14 03767 g003
Figure 4. Air speed and ammonia concentration: (a) wind direction at 0°, (b) wind direction at 45°, and (c) wind direction at 90°.
Applsci 14 03767 g004aApplsci 14 03767 g004b
Figure 5. Ammonia concentration and air temperature in section A, B and C.
Applsci 14 03767 g005
Figure 6. Air temperature in cross sections A, B, and C.
Applsci 14 03767 g006
Figure 7. Ammonia concentration in the cages zone along the barn.
Applsci 14 03767 g007
Table 1. Location of the sensors inside the rabbit farm, in Cartesian coordinates with respect to the origin observed in Figure 1.
SensorCoordinate (x, y, z) in Meters
DHT221.—(2.0, 1.1, 2.0)2.—(2.0, 1.1, 4.5)3.—(3.0, 1.1, 7.0)4.—(2.0, 1.1, 7.0)
5.—(1.0, 1.1, 7.0)6.—(2.0, 1.1, 9.5)7.—(2.0, 2.1, 12.0)8.—(2.0, 1.1, 12.0)
9.—(2.0, 0.1, 12.0)10.—(2.0, 1.1, 14.5)11.—(2.0, 1.1, 17.0)12.—(2.0, 1.1, 19.5)
13.—(2.0, 1.1, 22.0)
MQ-1371.—(2.0, 1.1, 2.0)2.—(2.0, 1.1, 7.0)3.—(2.0, 2.1, 12.0)4.—(2.0, 0.1, 12.0)
5.—(2.0, 1.1, 17.0)6.—(2.0, 1.1, 22.0)
Table 2. Summary of the boundary conditions used during the simulation.
BoundaryTypeCondition
Entry Velocity inletTemperature: 17 °C; wind speed: 0.25 m s−1
Wind direction: 161° components (x = −0.87, y = 0, z = −0.48)
Exit Pressure outletPressure: 0 Pa
Outside airinteriorAir
Outside soilWallSoil
FloorWallConcrete; temperature: 19.8 °C
CollectorWallTemperature: 34.8 °C; ammonia: 15.4 ppm = 0.0154 g kg−1
Indoor airInteriorAir
CeilingWallWood; thickness: 0.5 cm; temperature: 23.8 °C
WallsWallWood; thickness: 1 cm
WindowsPorous jumpMesh; permeability: 3.98 × 10⁻⁹ (m2); thickness: 0.0032 (m)
Drag coefficient: 19,185.7 (m−1)
Disclaimer/Publisher’s Note: The statements, opinions and data contained in all publications are solely those of the individual author(s) and contributor(s) and not of MDPI and/or the editor(s). MDPI and/or the editor(s) disclaim responsibility for any injury to people or property resulting from any ideas, methods, instructions or products referred to in the content.