Article

Comparative Analysis of the Stability of Overlying Rock Mass for Two Types of Lined Rock Caverns Based on Rock Mass Classification

1
State Key Laboratory of Geomechanics and Geotechnical Engineering, Institute of Rock and Soil Mechanics, Chinese Academy of Sciences, Wuhan 430071, China
2
University of Chinese Academy of Sciences, Beijing 100049, China
3
Department of Energy and Power Engineering, Tsinghua University, Beijing 100084, China
4
China Dating Corporation Ltd. Ningxia Branch, Yinchuan 750002, China
5
Key Laboratory of Urban Security and Disaster Engineering, Ministry of Education, Beijing University of Technology, Beijing 100124, China
*
Author to whom correspondence should be addressed.
Appl. Sci. 2024, 14(8), 3525; https://doi.org/10.3390/app14083525
Submission received: 5 March 2024 / Revised: 15 April 2024 / Accepted: 19 April 2024 / Published: 22 April 2024
(This article belongs to the Special Issue Advances and Challenges in Rock Mechanics and Rock Engineering)

Abstract

:
Lined rock caverns (LRCs) are becoming the preferred option for air storage at sites where there are no natural cavities, such as salt caverns, and this storage technology is being developed and utilized in markets around the world. The stability of the overlying rock mass is one of the key factors to ensure the successful operation of LRCs. In this paper, a stability assessment method is presented that first calculates the potential fracture surfaces of the surrounding rock based on the limiting stress field and the Mohr–Coulomb damage criterion, and then, based on these fracture surfaces, solves for the factor of safety defined on the basis of the concept of strength reserve. Using this method, this study evaluates the stability of two types of LRCs, tunnel- and silo-type, under three different geological conditions. The results of the analysis show that the silo-type LRCs are more economical for engineering purposes. Also, this paper provides some guidance for engineers in site selection and preliminary design.

1. Introduction

In response to the call for carbon reduction, many countries have begun to vigorously develop new energy constructions. Renewable and clean energy sources, represented by solar and wind power, will occupy a dominant position in the future energy supply. Due to the significant variability of wind and solar energy, there is a substantial amount of energy waste. Large-scale energy storage technology can enhance the grid’s peak-shaving capability, offering a solution to the issue of extensive energy discarding. Among these technologies, compressed air energy storage (CAES), with its large capacity, small footprint, and long lifespan, has become one of the mainstream energy storage technologies. The working principle involves using surplus electricity during low-demand periods to compress air and store it in storage facilities. During peak electricity demand, the compressed air is released to drive turbine generators. For large-scale compressed air storage systems, considering cost-effectiveness, underground storage caverns are generally chosen as the storage solution. The working principle of the system is illustrated in Figure 1. Based on the currently available surface process parameters, the typical maximum storage pressure for lined rock caverns used in compressed air energy storage is generally between 10 MPa to 18 MPa or higher.
Underground air storage reservoirs can generally utilize geological cavities such as salt caverns, lined rock caverns (LRCs), abandoned mines, depleted oil and gas reservoirs, and aquifers [1,2,3]. Generally speaking, salt caverns are the best option for gas storage due to their excellent natural self-sealing properties [4,5,6]. However, not all locations requiring the construction of compressed air energy storage facilities have salt caverns. An LRC is a type of cavern that is artificially excavated in hard rock. Except for the LRC, geological limitations affect all other chambers, meaning that the proposed CAES site cannot guarantee a distribution of these geological formations. Therefore, LRCs stand out as the optimal choice for air storage. The main structural components of LRCs are as follows: sealing layer, concrete liner, and surrounding rock. The core concepts of the engineering design are (1) the sealing layer deforms flexibly in the annular direction and has only a sealing function; (2) the concrete liner is used to smooth the pressure and transfer the load to the surrounding rock; and (3) the surrounding rock restrains the deformation of the structure with its strength and stiffness and absorbs the internal pressure load. Therefore, the air pressure is completely transferred to the surrounding rock in a flexible form. Thus, the main air pressure is borne by the surrounding rock, while the lining and sealing layers are subjected to only negligible pressure. The LRC is usually subjected to high internal pressures, and thus also poses several geotechnical problems, the core of which are the overlying rock stability problem and the sealing structure stress problem [7], as shown in Figure 2. There are two main types of LRCs, the silo type and the tunnel type (Figure 3).
The minimum “distance” between the actual working state (or designed working state) and the damage state of a building is defined as the degree of safety, and the factor of safety is a numerical value that expresses this “distance”. The depth of burial is an important parameter in the design of shallow LRCs and is directly related to the factor of safety. In general, the larger the safety factor, the safer and more reliable the design is. However, too large a safety factor corresponds to too deep a burial depth, which can lead to an increase in the cost and difficulty of the project, so it is important to analyze the stability of the overlying rock mass for the design of the project. In 1989, Barton et al. [8] used continuous and discontinuous models to analyze the deformation of LRC buried at a depth of 50–100 m. They verified the feasibility of the LRC concept and suggested that good geological conditions and sufficient burial depth are the key factors for LRC. In 2001, Brandshaug et al. [9] introduced two limit equilibrium models, the rigid cone model, and the log spiral model, as evaluation criteria for stability in assessing the safety of silo-type LRCs against ground uplift. The rigid cone model assumes that the failure surface is an inclined straight line with a vertical inclination of 30° to 45°, the lower cone angle is suitable for loose or weathered rock mass, and the strength of the rock mass is not taken into account. The log spiral model is based on the ultimate pullout resistance of single vertical anchors, presented by Ghaly et al. [10] in 1994, which takes into account the friction at the failure surface of the rock mass, and the failure surface shape is a logarithmic spiral function with respect to the internal friction angle; however, Mandl [11], in 1988, found that the shape of the spiral is also sensitive to the horizontal geopathic stress and that lower horizontal geopathic stresses produce a narrower and steeper spiral curve. In 2012, Kim et al. [12] proposed a model in which the cracking surface is a vertical surface and gave a calculation method for the safety factor of two types of LRCs, which considered parameters such as ground stress coefficient and rock strength, etc. The advantage is that the calculation is simple, but the results of their calculations are on the conservative and safe side, and the assumed cracking surface is not reasonable. These three models can be seen in Figure 4. Regarding the issue of uncertainty in fracture surfaces, various scholars have initiated research into the morphology of fracture surfaces in overlying rock masses. Tunsakul and Jongpradist et al. [13,14,15,16] combined numerical methods and physical model experiments to study the cracking patterns of overlying rock masses in tunnel and large cavern LRCs, providing the crack initiation pressure, the location of crack initiation points, and the morphology of the failure surface under different geostress coefficients, offering significant references for engineering design. Thongraksa et al. [17], based on physical model tests and numerical analyses, primarily focused on the impact of the strength characteristics of the rock on the mode of failure. Their analysis indicated that the failure mode of silo-type LRCs strongly depends on the strength properties of the rock, independent of the initial geostress conditions; the initiation location of fractures, on the other hand, was influenced by both the rock strength and the initial geostress. Perazzelli [18] used the upper bound theorem of limit analysis to assess the geometry of the failure surface. The effects of geometrical and geotechnical parameters on uplift pressure are analyzed systematically. Wang et al. [19] proposed a failure mechanism for tunnel-type LRCs overlying a single rock layer and multiple rock layers, considered the effects of ground loads and arbitrary tunnel profiles and derived an analytical solution for the critical uplift pressure and the corresponding failure surfaces based on the limit analysis and the variational principle. Perazzelli et al. [20] investigated, by stress analyses performed on a continuum model as well as by comparative limit equilibrium computations, the uplift failure of sealed CAES tunnels crossing weak rock at relatively small depths of cover.
Currently, most scholars are less likely to compare the analysis of the two types of LRCs. For the silo-type LRC, studies usually focus on the crack morphology and damage modes, while there is a relative lack of exploration of its ultimate pressure and stability. In contrast, studies on tunnel-type LRCs are more comprehensive. The authors established an analytical method based on the ultimate stress field and the M-C criterion and determined the potential rupture surfaces by solving the initial value problem of the ordinary differential equations and then constructing the equilibrium equations using the stress integrals, which are used to compute the factor of safety and perform the stability analysis. The aim of this paper is to synthesize the existing studies with the authors’ proposed method to compare and analyze the stability of the two types of LRCs under different geological conditions.

2. Rock Mass Classification

Rock mass classification plays a pivotal role in the realm of geotechnical engineering design, serving as a foundational tool for projects involving tunnels, slopes, and various other geotechnical structures. The classification system empowers engineers to swiftly ascertain the physical and mechanical parameters of the rock mass, which can be used for survey and preliminary design. It can enhance the efficiency of construction projects. This article aims to provide intuitive site selection and design parameters for LRCs of CAES projects, which will have significant implications for engineering practice.
Numerous rock mass classification systems exist, such as the Rock Mass Rating (RMR) system [21], the Q-system [22], and the Geological Strength Index (GSI) [23], among others. Through these rock mass classification methods, rock masses are typically divided into five categories. This article assumes the physical and mechanical parameters of rock masses of different grades, as shown in Table 1, in accordance with the Chinese National Standard “Standard for classification of engineering rock mass” [24]. The data in the table represent the basic quality of the rock mass, which is determined by the hardness of the rock and the integrity of the rock mass. The hardness of the rock and the integrity of the rock mass are determined by both qualitative division and quantitative indicators. Its inclusion in this paper serves merely as a general reference. In the calculation example, the minimum values of the parameters are adopted.

3. Analysis Method and Assumptions

In engineering design, for issues such as gravity dams and slope stability, the limit equilibrium method (LEM) is widely adopted due to its clear and straightforward mechanical concept. This article also employs the limit equilibrium method (LEM), which is valued for its utility in preliminary design and rapid evaluation. LEMs are usually established based on hypothetical potential rupture surfaces. According to the previous discussion, the existing limit equilibrium methods have their own limitations. Therefore, in this paper, we first analyze the morphology pattern of the potential rupture surface, and based on this, the calculation of the safety factor is carried out. This analysis is carried out only under the isotropic condition of the rock and focuses mainly on the uplift failure due to the macroscopic fracture behavior of the rock while ignoring the effect of the microscopic cracking behavior. From the LRC design concept, it can be assumed that the internal pressure loads sustained by the lining are negligible, and therefore, the effect of the lining is not considered in the computational model. Additionally, considering that the operational process of the gas storage involves multiple inflation and deflation cycles, meaning the cavern is subjected to a cyclic load, this study sets the gas pressure parameter to the maximum operational pressure and does not account for the mechanical responses to cyclic loading and temperature effects. For the tunnel-type LRC, a two-dimensional model consistent with plane strain conditions is developed. Meanwhile, a three-dimensional model is formulated for the silo-type LRC, without taking the second principal stress into account.

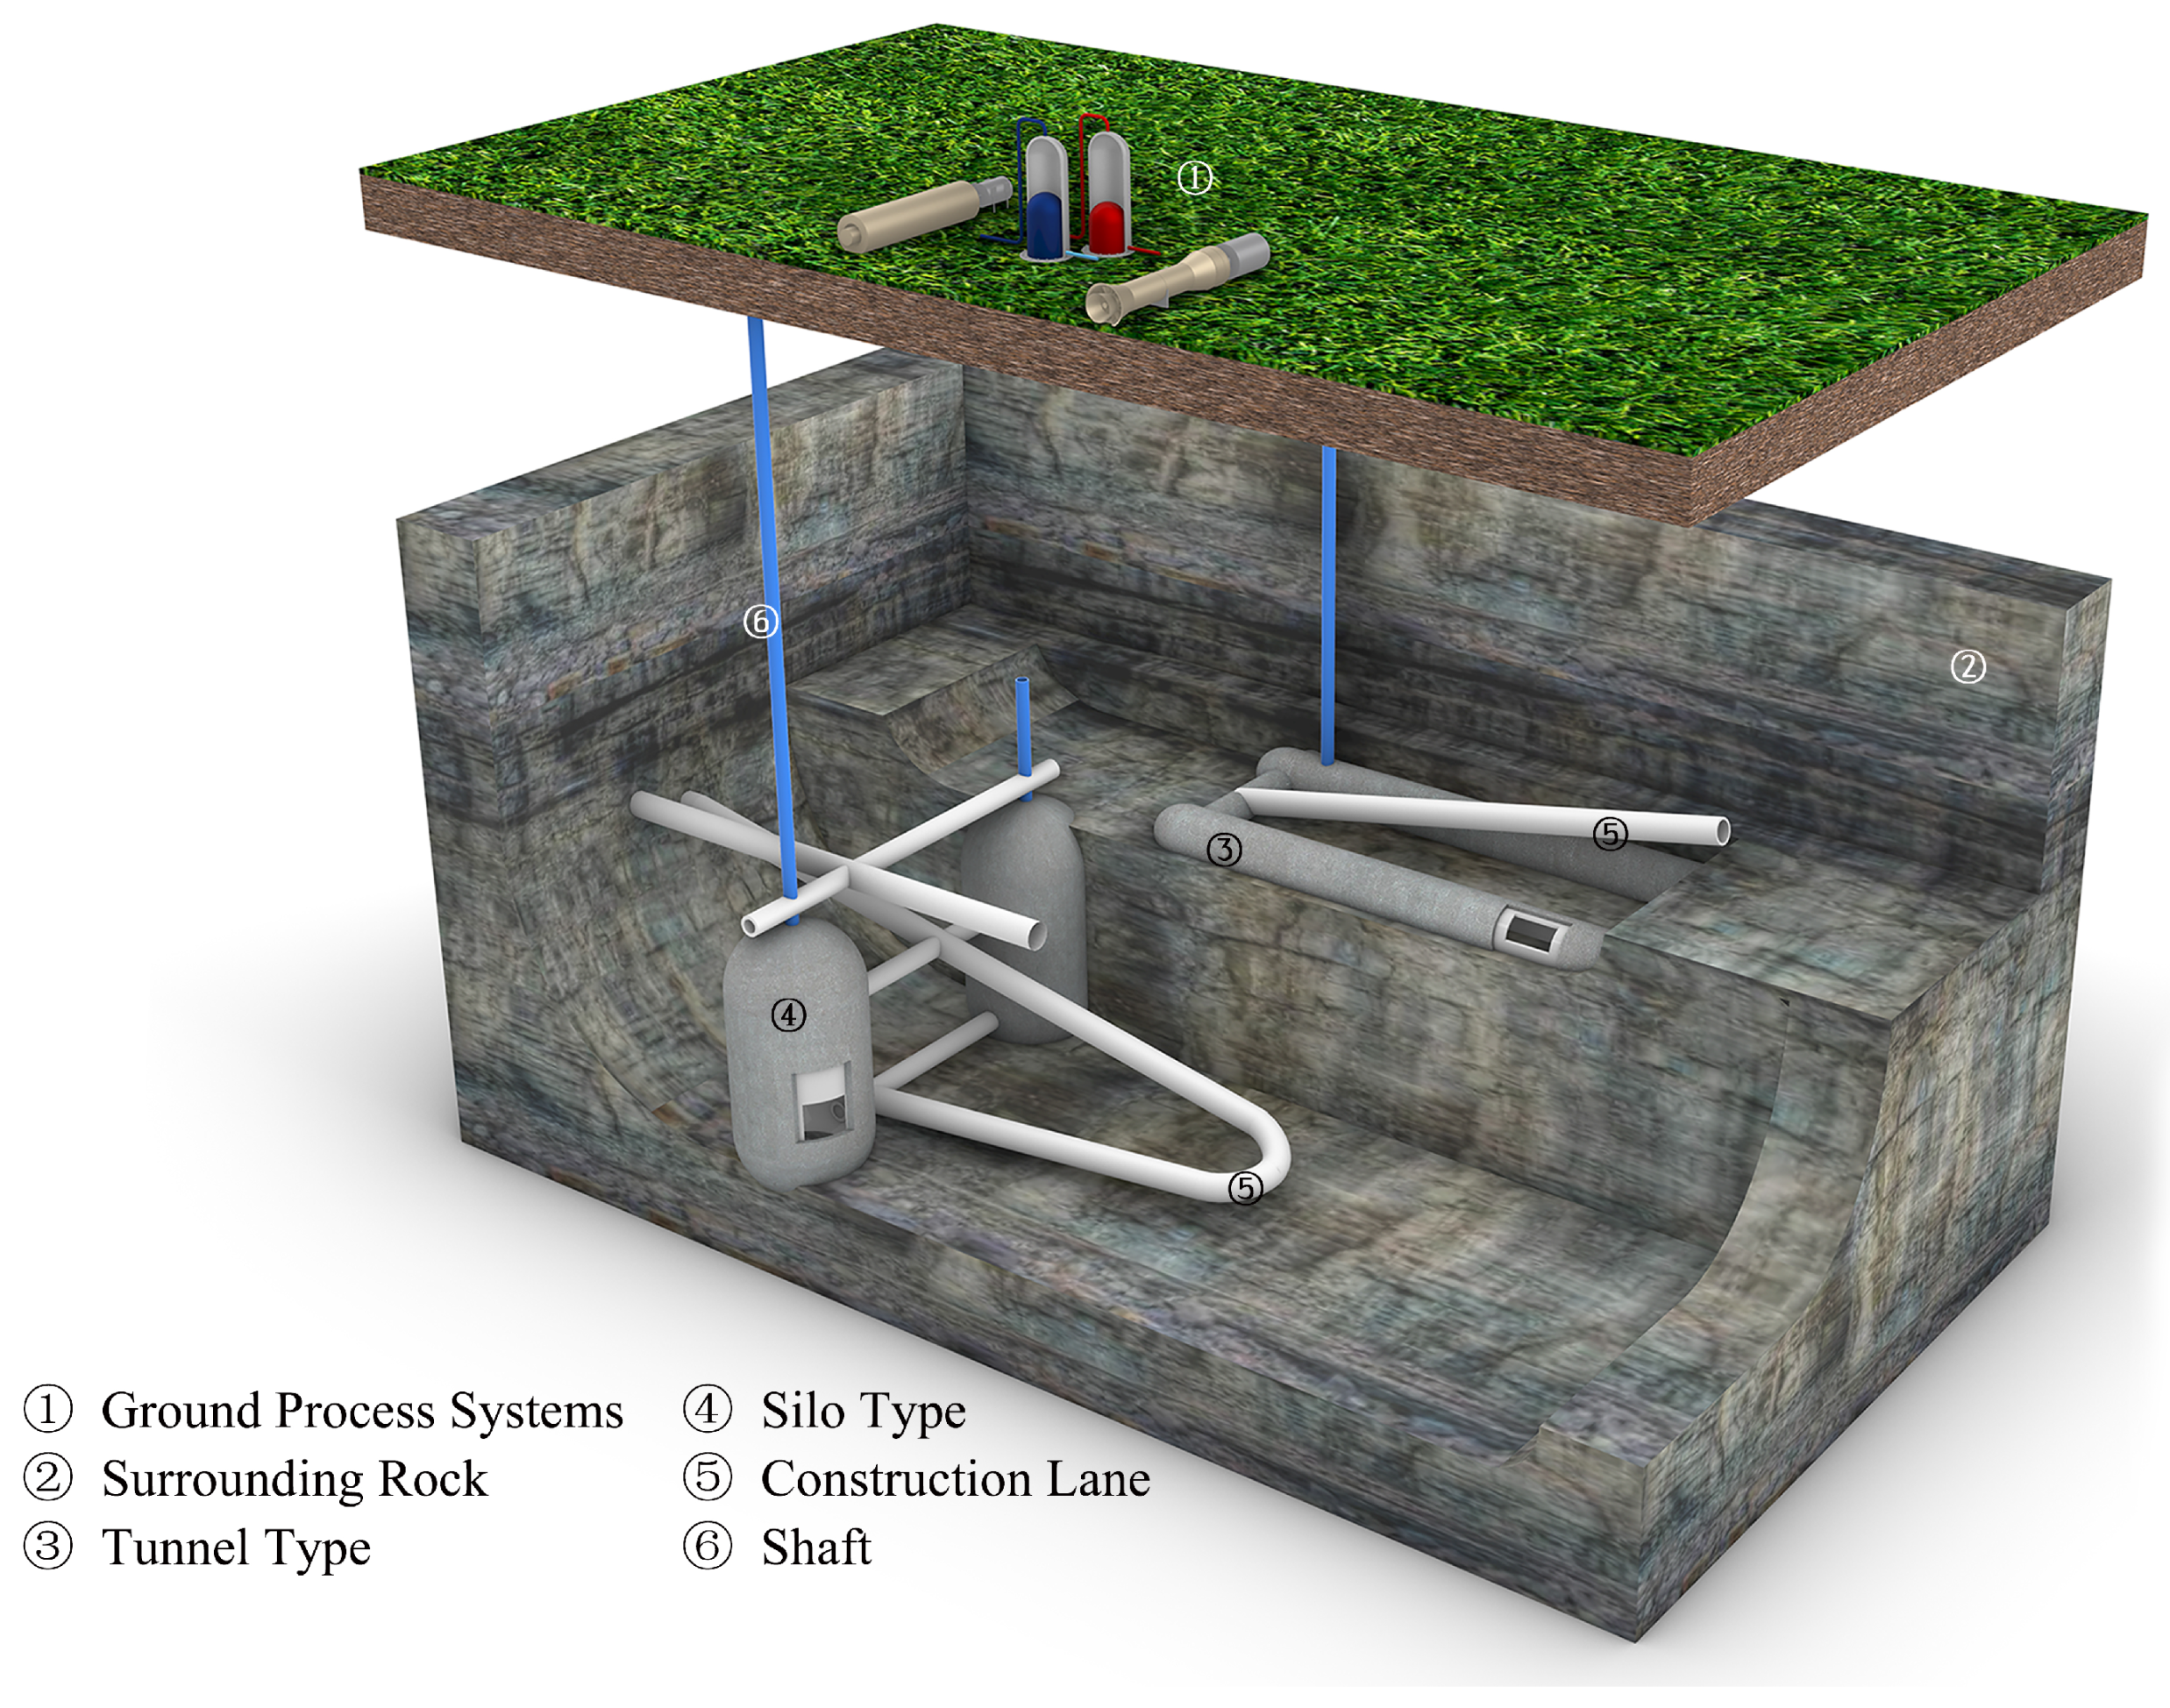
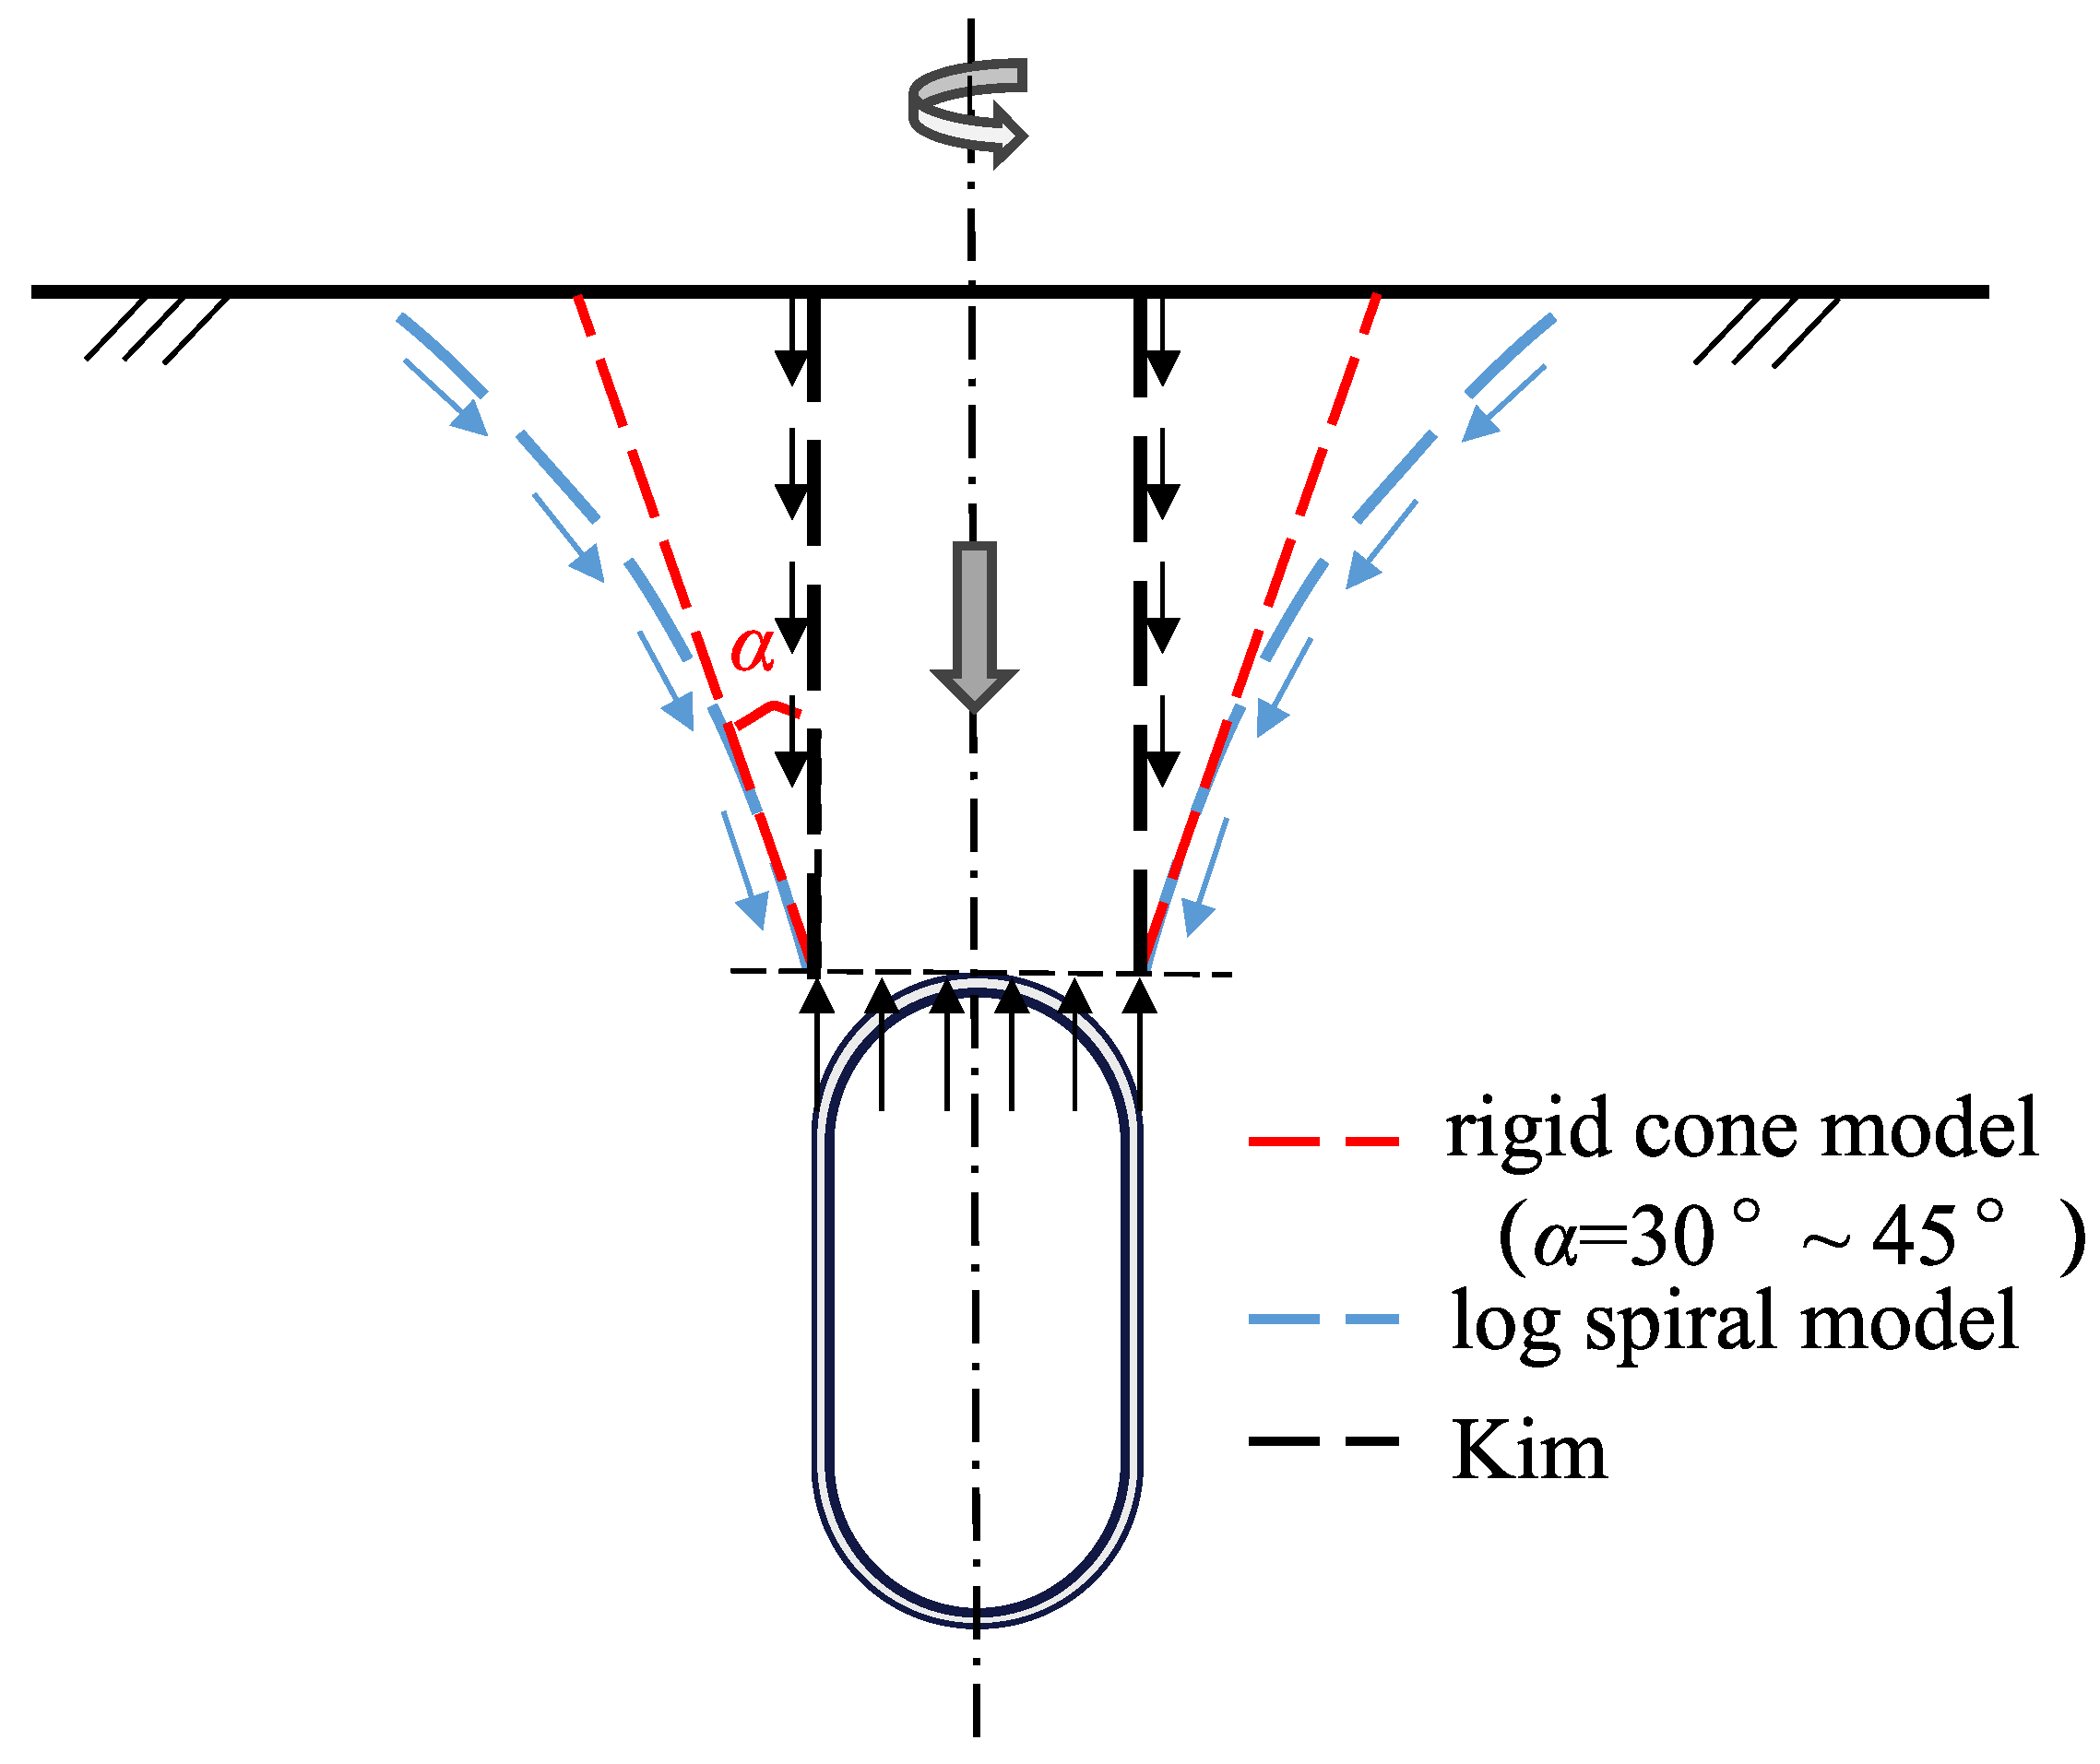
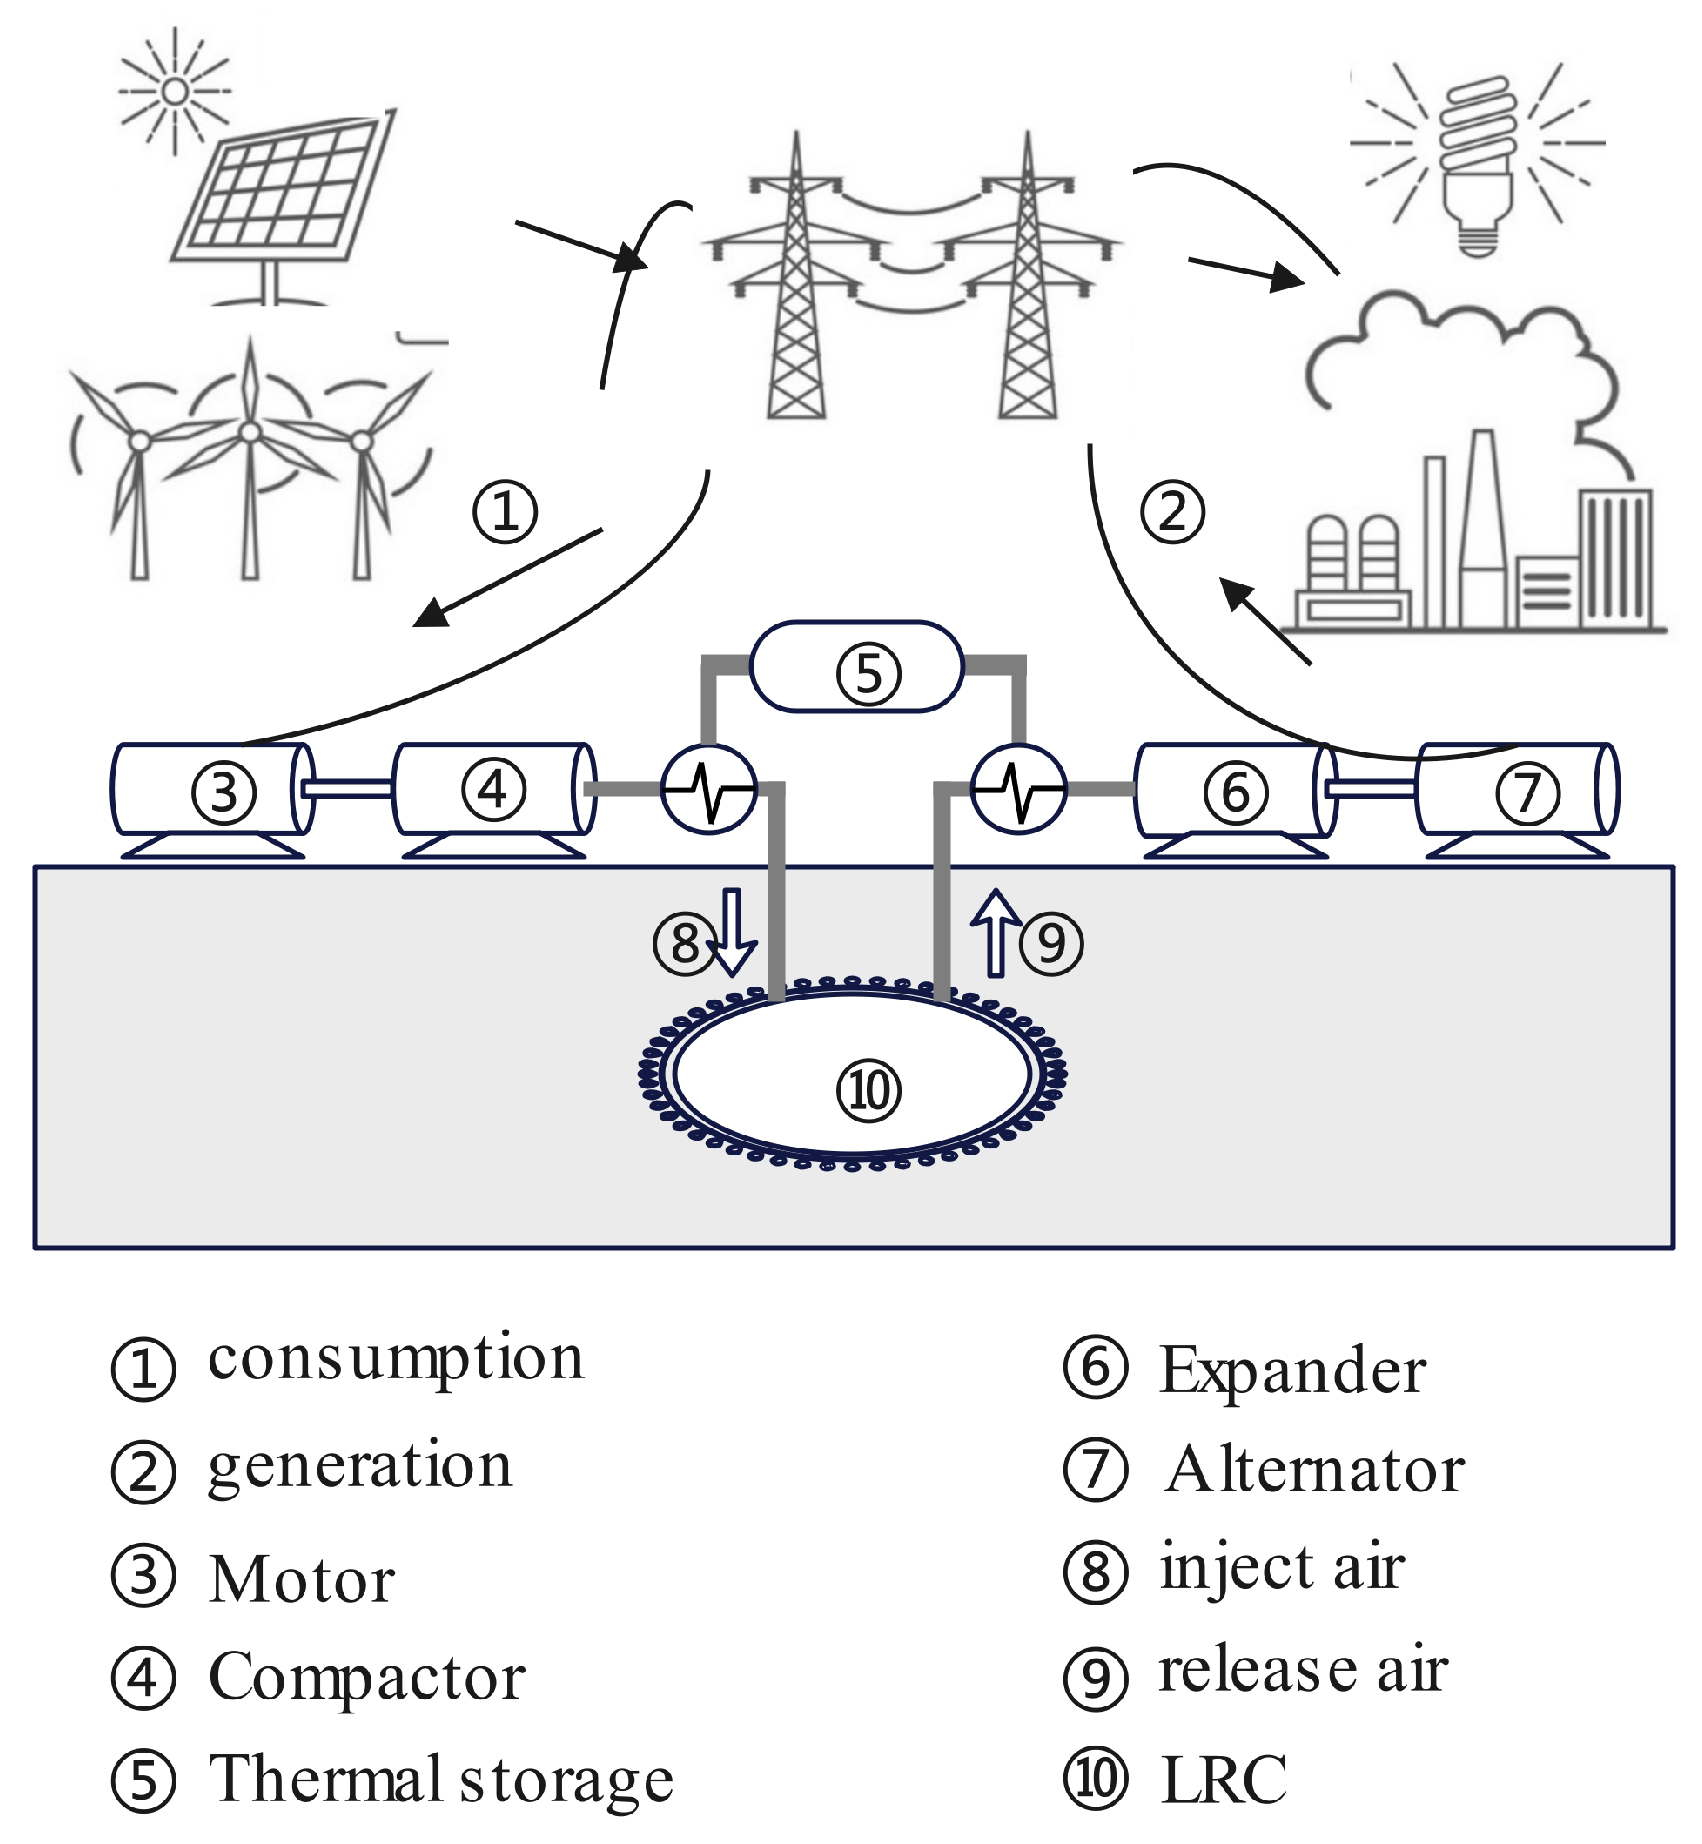
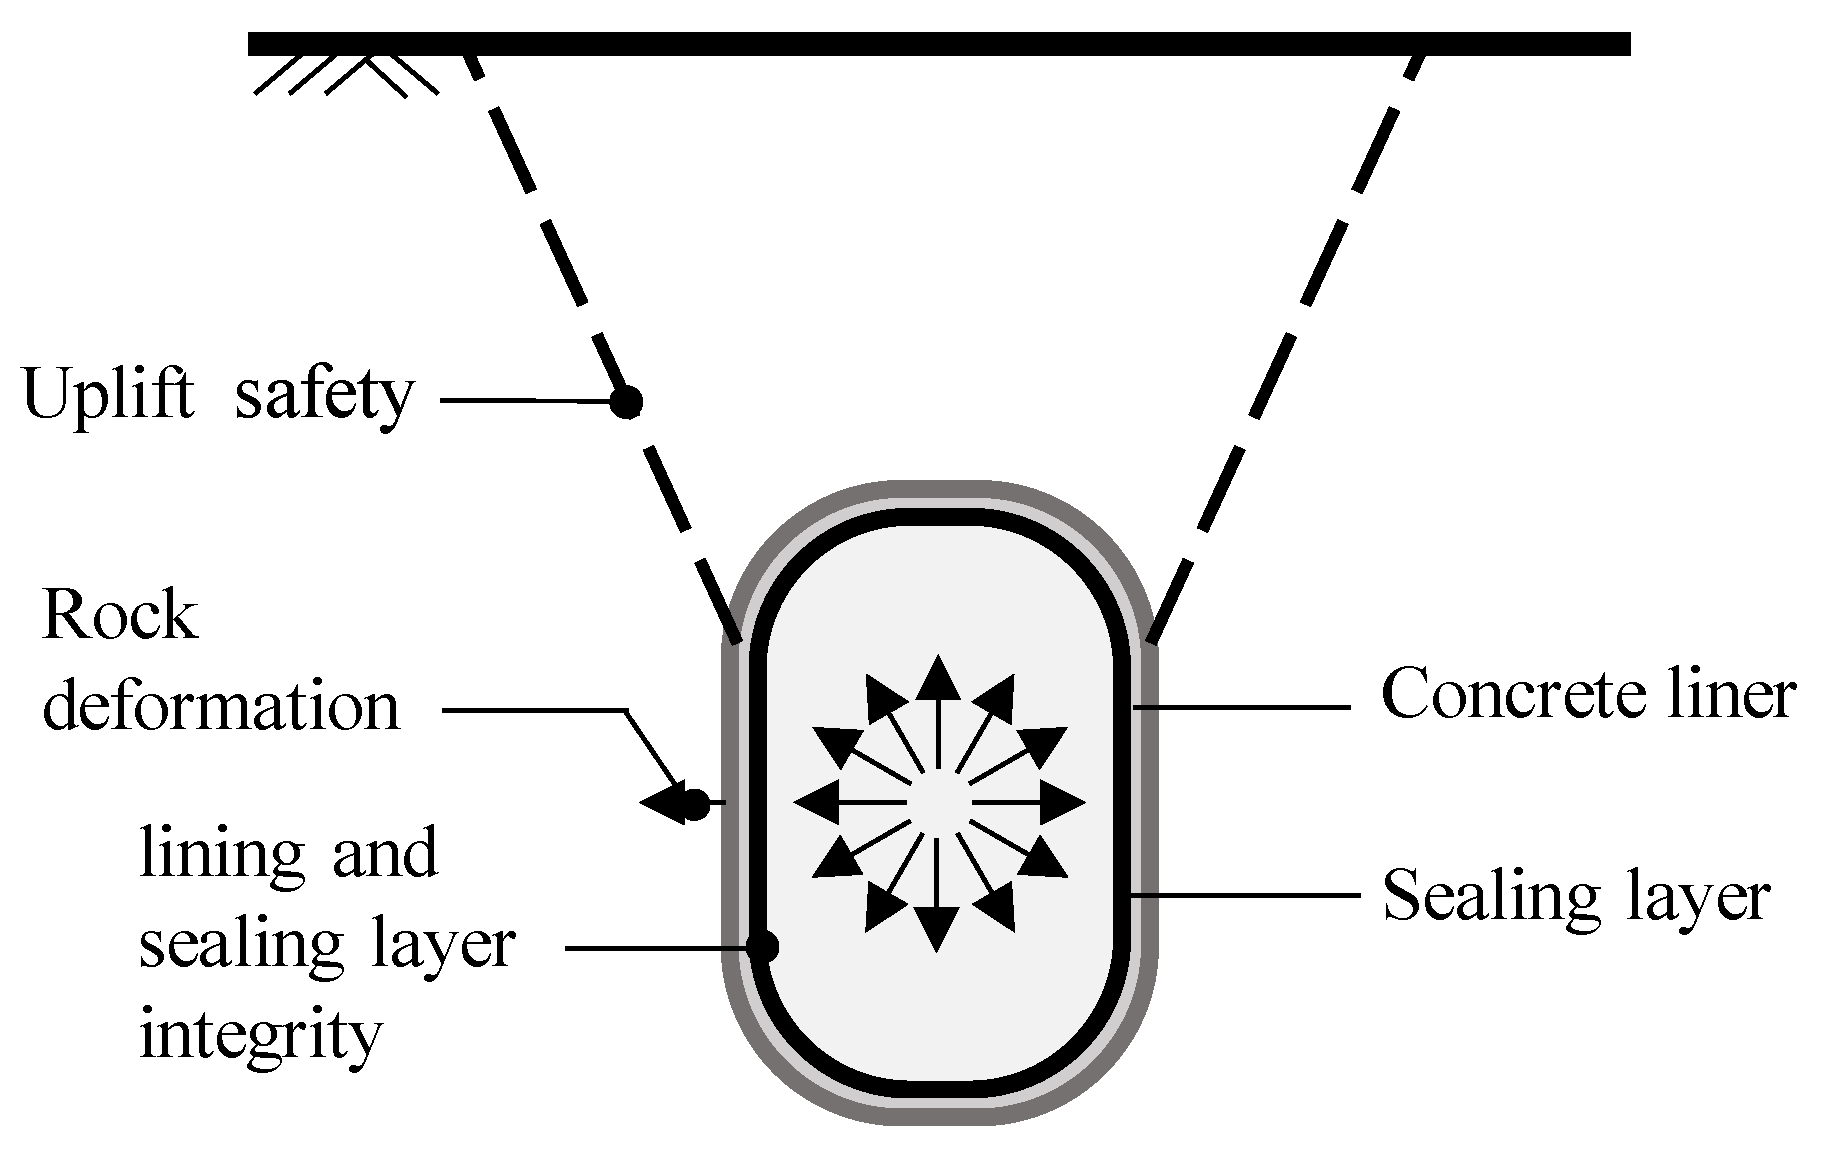
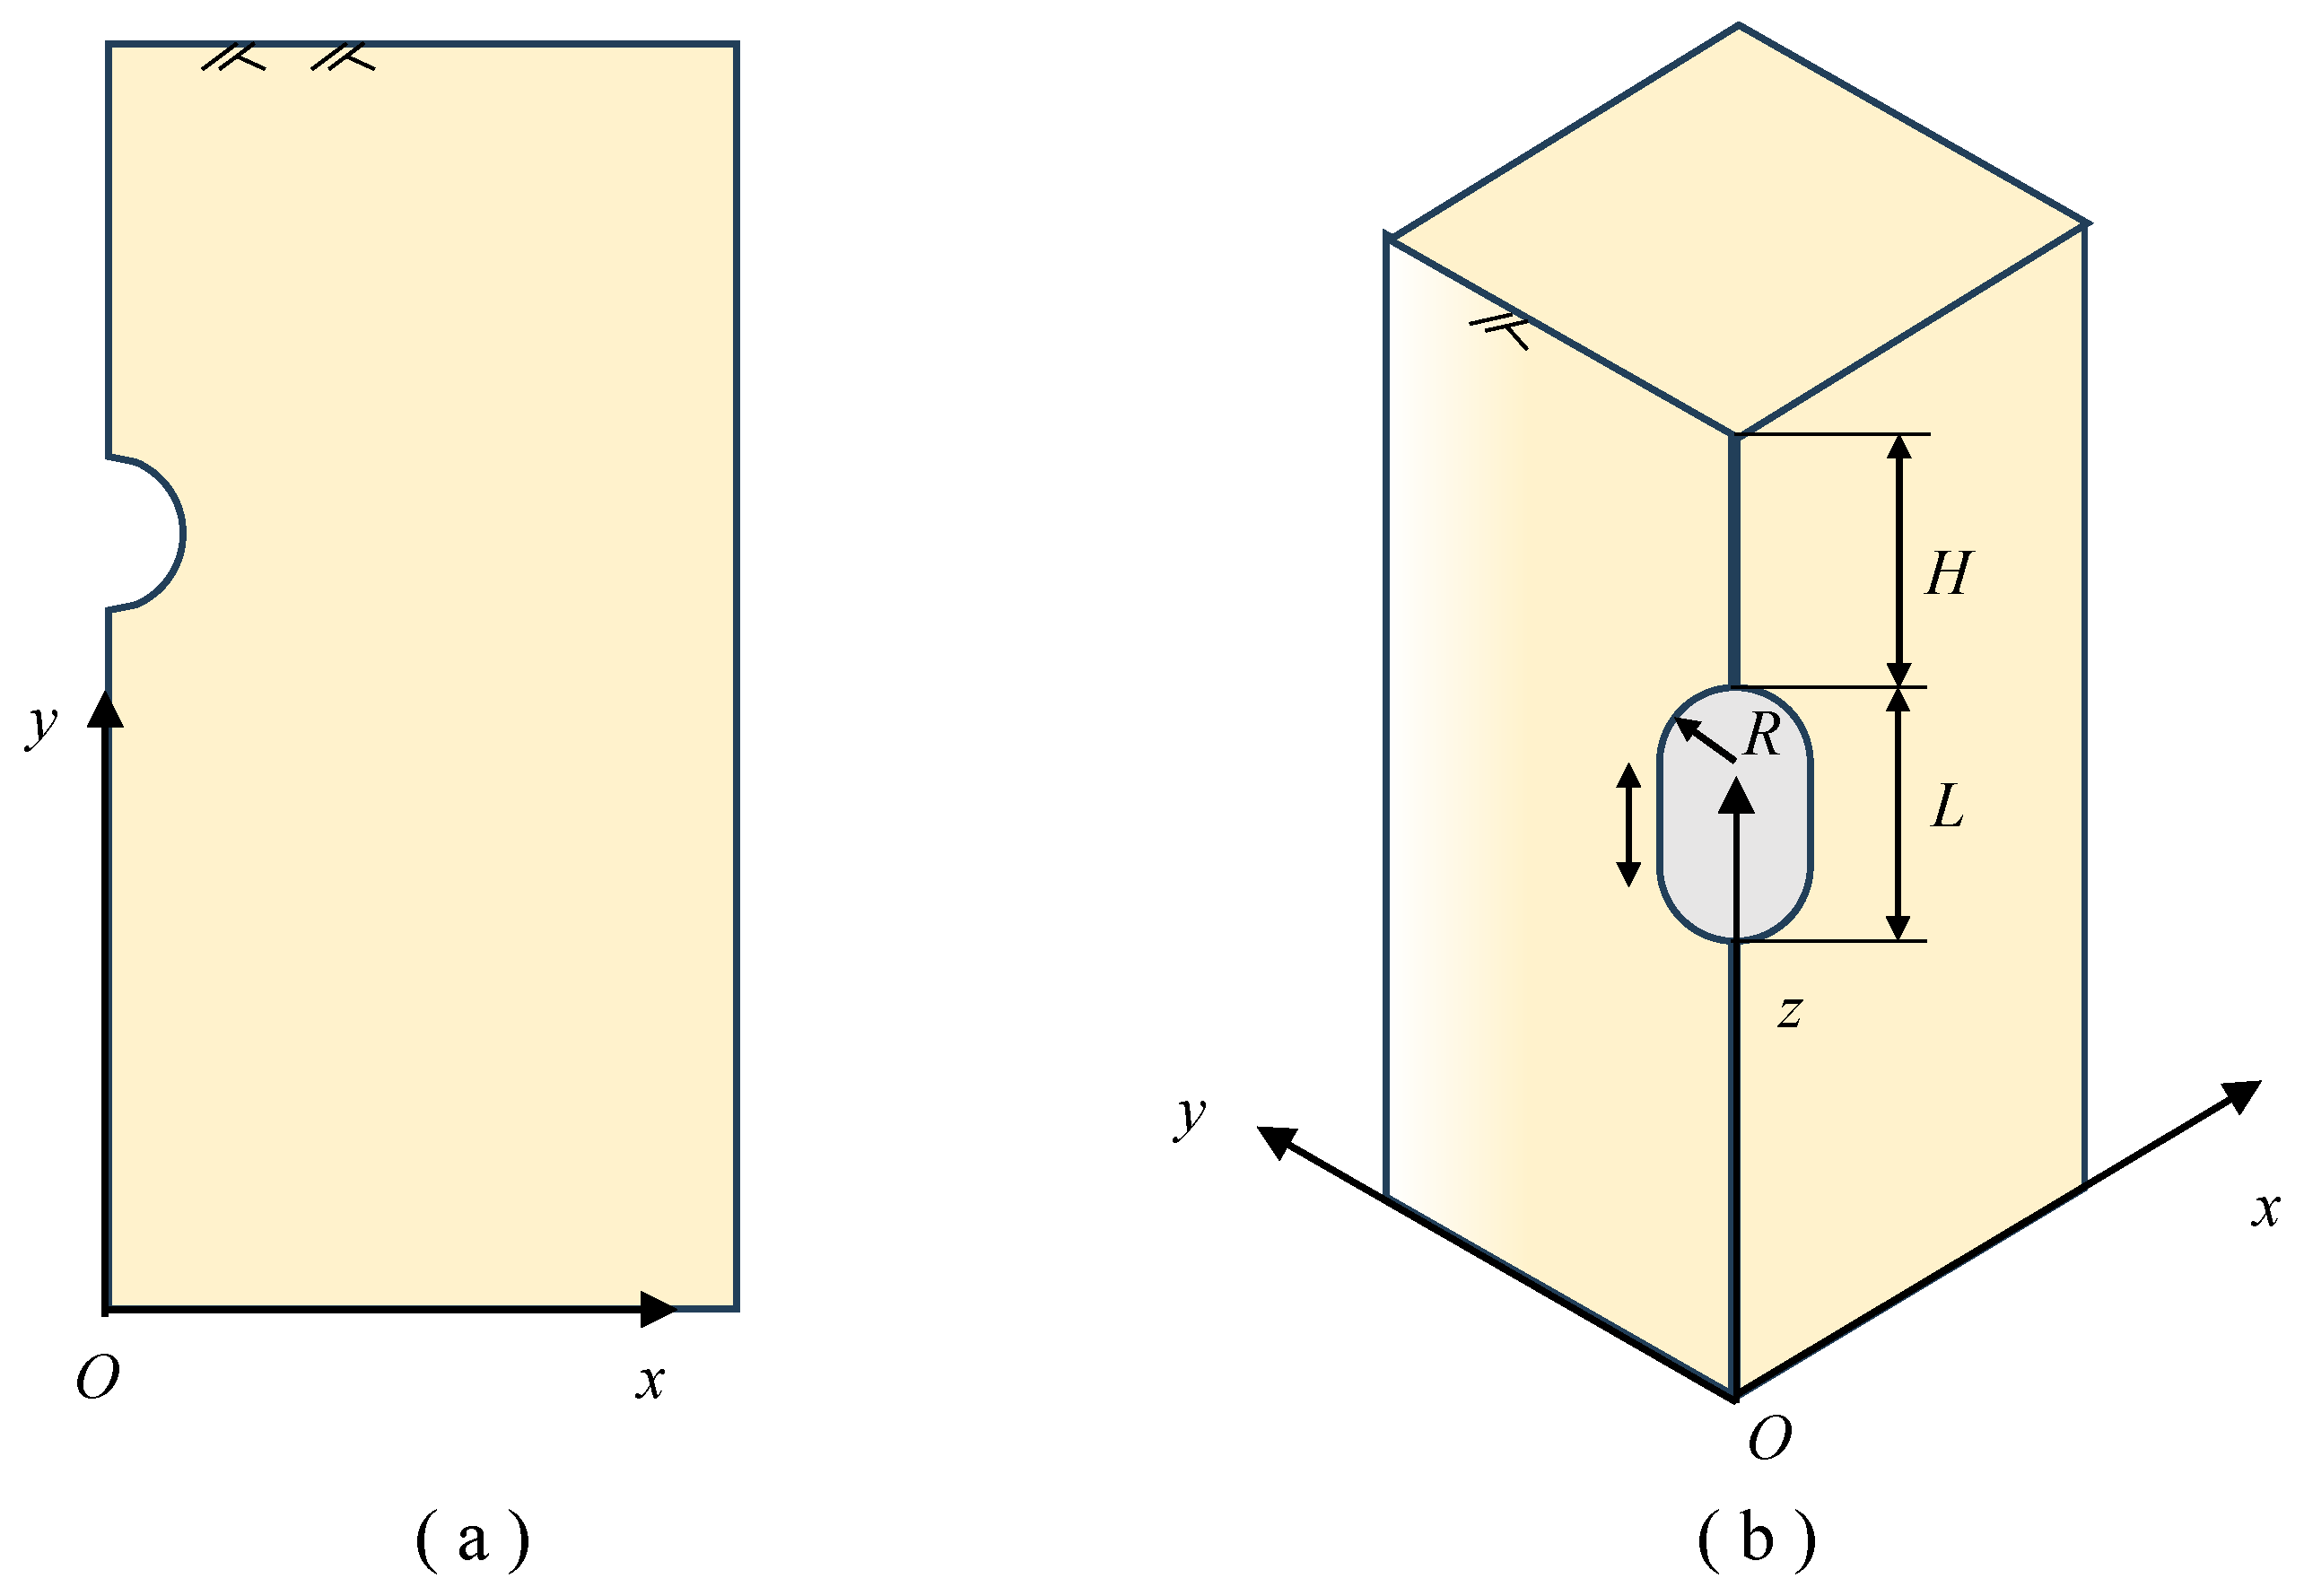
3.1. Computational Model

As shown in Figure 5, for tunnel-type lined rock caverns, an axisymmetric 2D model of the plane strain problem is used, while for silo-type lined rock caverns, a 3D model that is symmetric about the x o z and y o z planes is adopted.

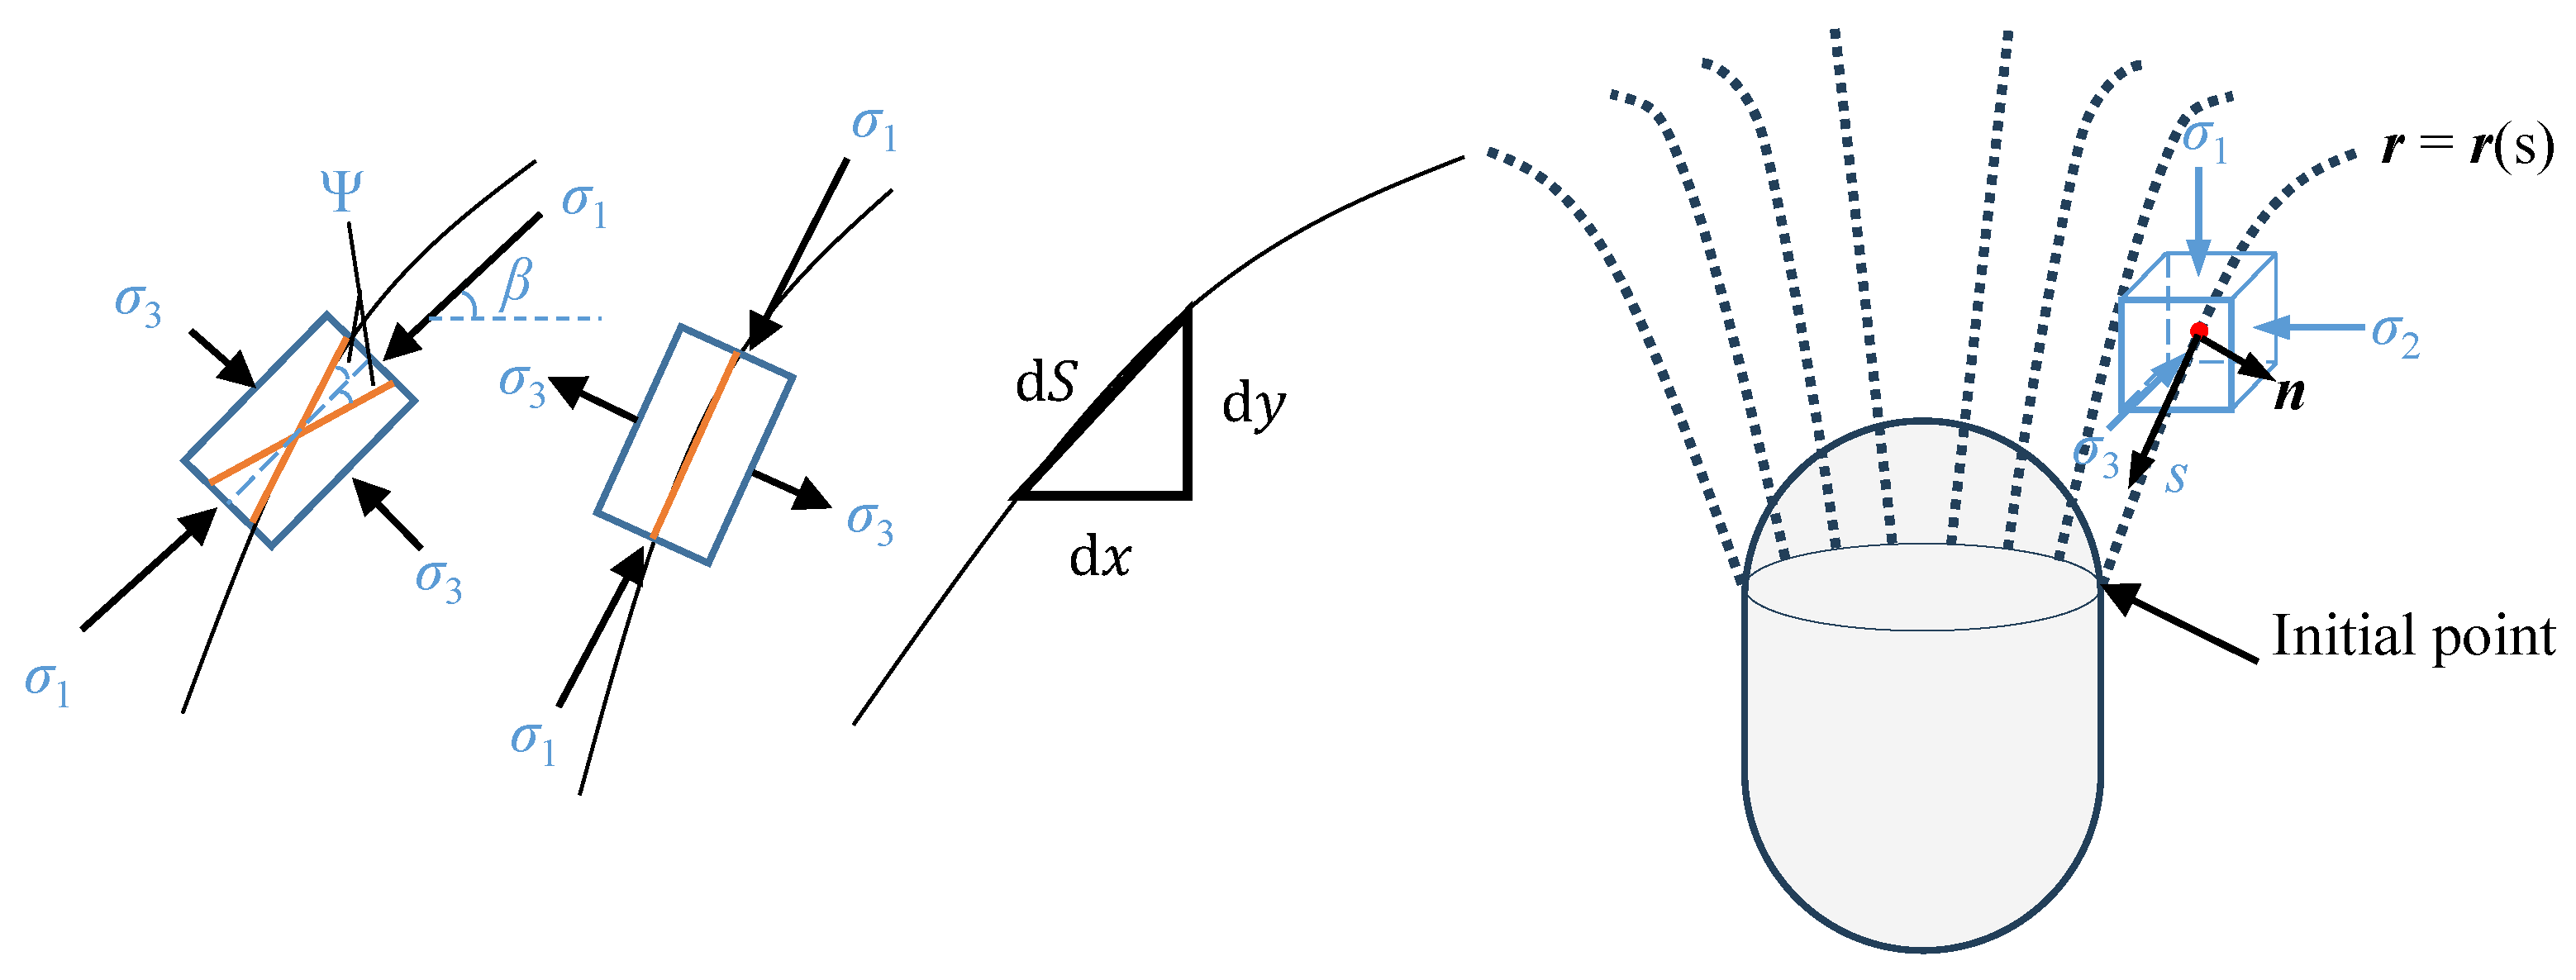
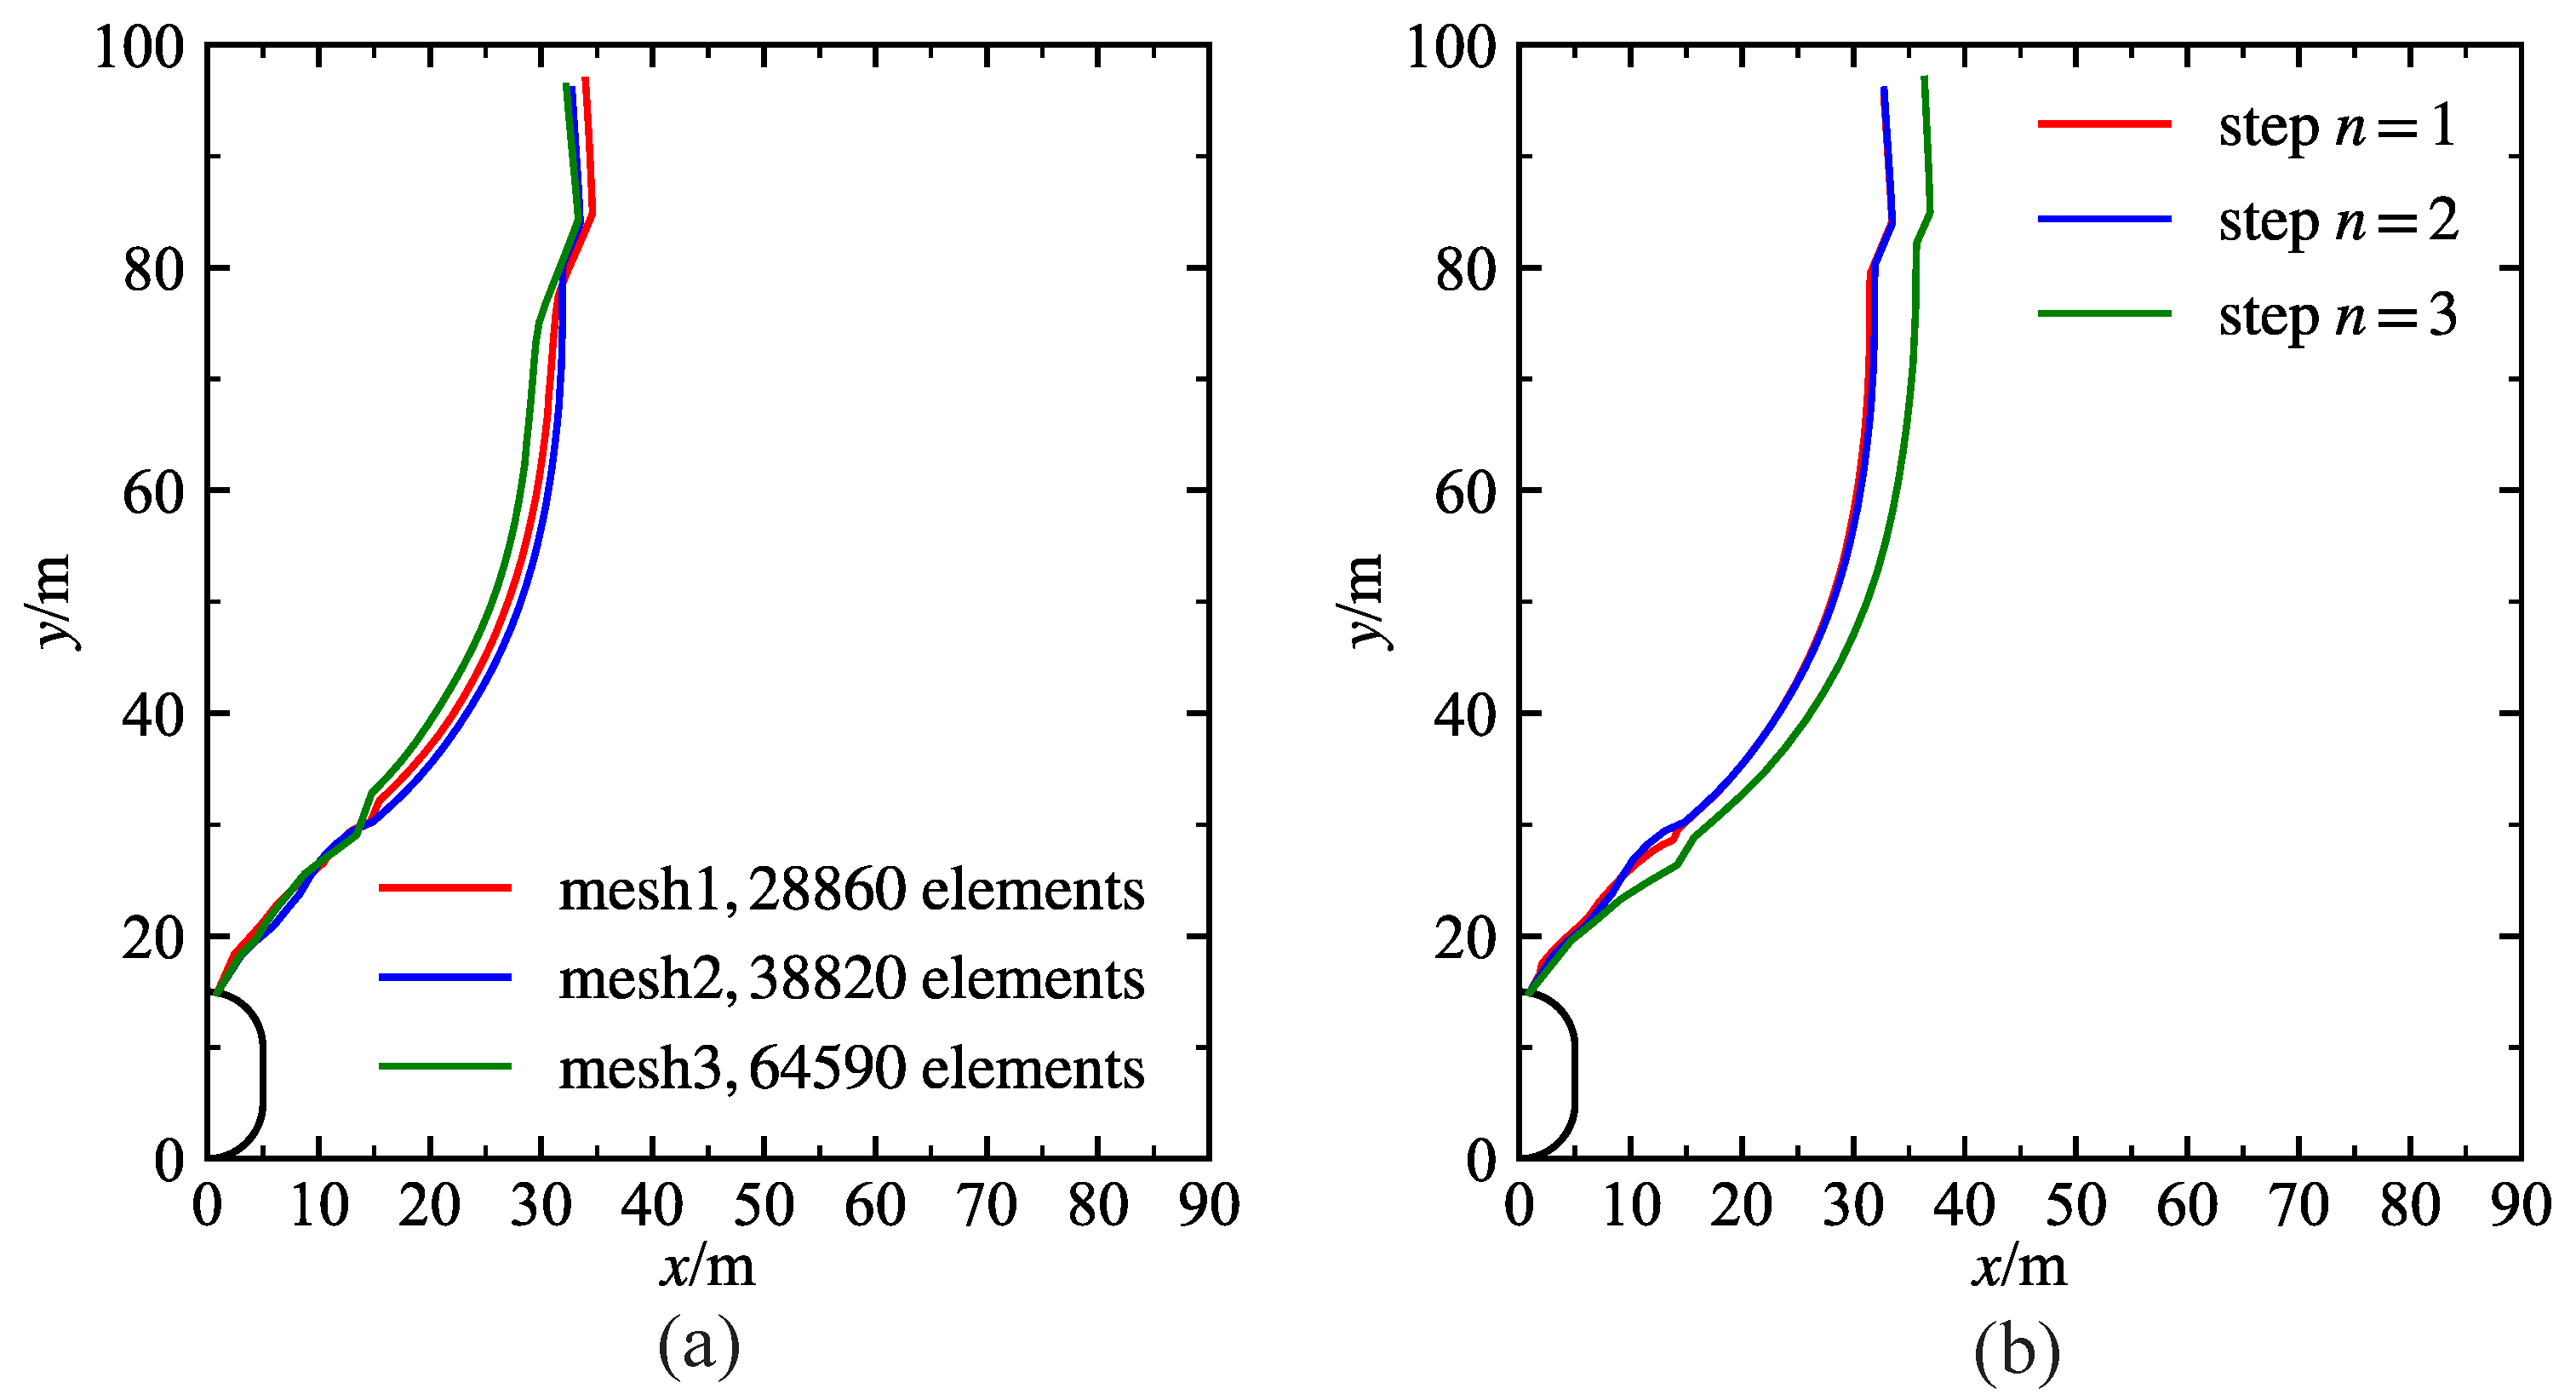
3.2. Method for Solving Potential Failure Surfaces

When the rock mass is in a state of limit stress and meets the Mohr–Coulomb strength criterion, if a point within the rock mass is under compression, it will exhibit the weakest resistance to sliding in two symmetrical directions, indicating potential fracture planes. The angle formed by the fracture plane and the direction of the first principal stress is ψ = π / 4 ϕ / 2 ( o r ϕ / 2 π / 4 ) , where ϕ is the internal angle of friction. When the point is under tensile stress and the minimum principal stress reaches the tensile strength of the rock–soil mass, the fracture plane will be parallel to the plane of tensile stress application. Taking a two-dimensional model as an example, the potential fracture surface can be represented as a curve. Assuming this curve, S, is parameterized by the arc length s, the expressions for the curve can be written as
x = x ( s ) y = y ( s ) ,
Then, S is one of the integral curves of the following system of ordinary differential equations:
d x d s = cos ( β + Ψ ) d y d s = sin ( β + Ψ ) ,
where β is the is the direction angle of the first principal stress. Write the above equation in vector form as
d r d S = f ( r ) r ( s 0 ) = r 0 ,
where r = ( x , y ) T , and  f ( r ) = { cos ( β + Ψ ) ,   sin ( β + Ψ ) } T . Equation (3) represents an initial value problem (IVP) for an ordinary differential equation (ODE), which can be solved using methods such as Euler’s method, among others. Euler’s method provides a straightforward numerical approach to approximate the solution of the ODE by incrementally advancing along the curve, using the derivative information at each step to estimate the curve’s future values. Therefore, by inputting the starting point of the fracture surface, the entire potential fracture curve can be determined. For three-dimensional models, by inputting a series of starting points of fracture surfaces, the entire potential fracture surface can be spanned. The solution schematic is shown in Figure 6. The algorithm can be found in Algorithm A1.

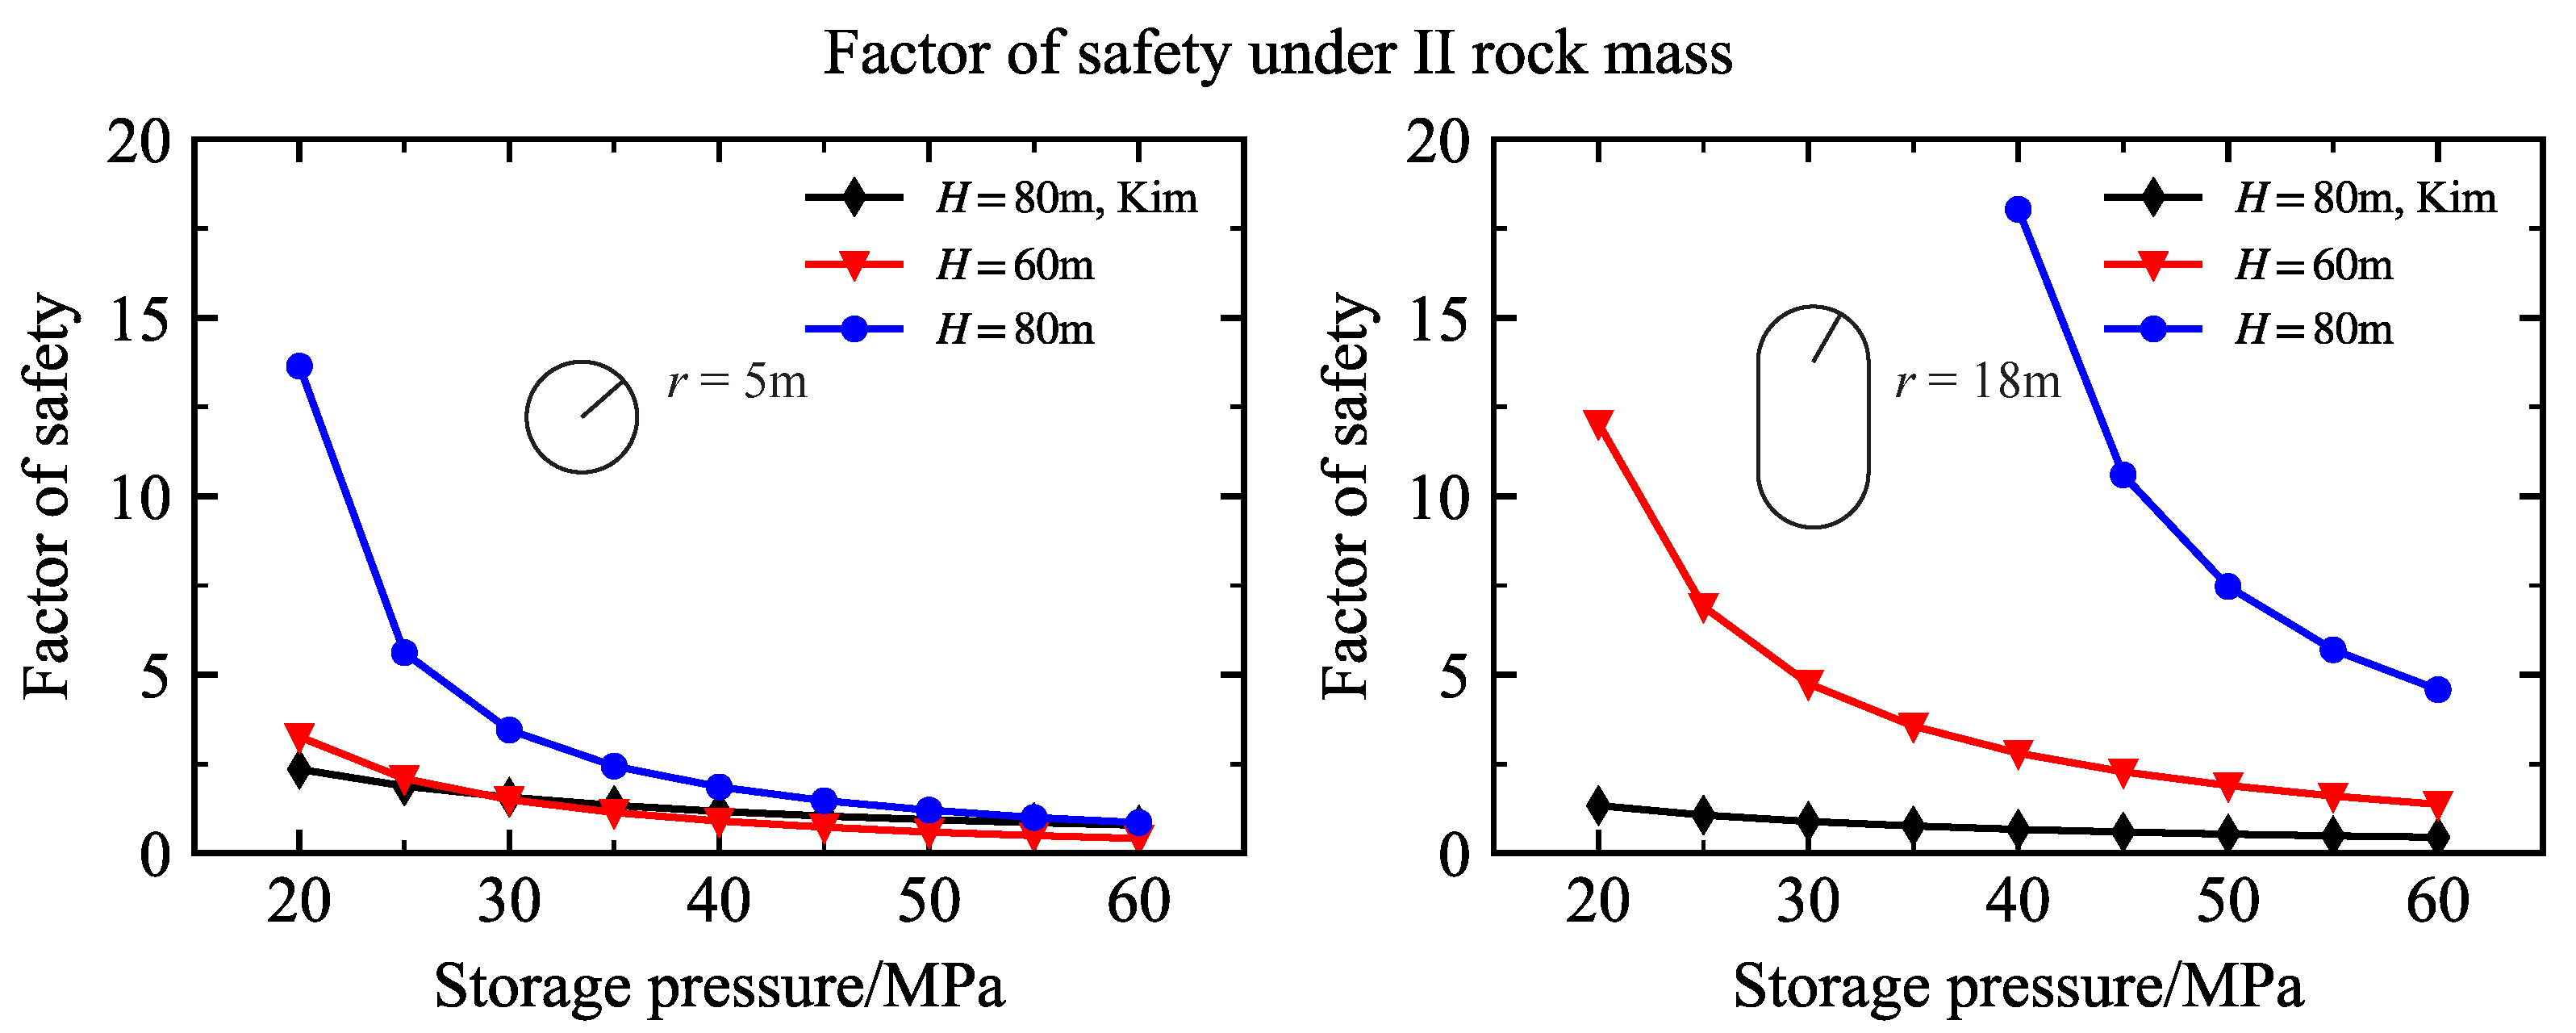
3.3. Method for Solving the Factor of Safety

In general, different contexts employ various definitions of the factor of safety. The limit equilibrium method mentioned in the introduction defines the factor of safety as the ratio of the resisting force to the uplifting force, with differences lying in the components of the resisting force. These differences arise from the shape of the overlying rock mass affected by uplift, leading to variations in the rock mass’s weight or whether the rock mass’s strength is considered. Once the accurate fracture surface is determined, the weight of the overlying rock mass can be ascertained. However, the strength of the rock mass resisting uplift remains an uncertain factor. Therefore, this paper adopts the concept of strength reserve and defines the safety factor, F S , as
τ = 1 F S ( c + σ tan φ ) ,
where σ is the positive stress on the crack surface, and  τ is the shear stress. The normal stress on a differential unit on the crack surface is σ n d S , and the shear stress is σ S d S , where n and s are, respectively, the unit normal vector on the differential unit (pointing inside the block) and the direction of slip resistance. Then, the reaction force of the differential unit d S is
d f = ( σ n + τ s ) d S ,
the torques is
d m = r × d f ,
Then, the overall equilibrium equation is organized as
S ( F S n + tan φ s ) σ d S + F S f m + S c s d S = 0
where
n = n r × n s = s r × n f m = f a m a
where f a and m a are the active force moment, respectively. The active force includes the self-weight of the rock mass, the surface load, and the air internal pressure.
The equilibrium equation for a differential element taken from the fracture surface to the ground using a plumb line is
σ n d S + τ s d S + d w + d h = 0
where d w is the computable active force on the element, including self-weight, ground load, air pressure, et al., and h is the force between the elements that is not directly calculable. Multiplying the terms in Equation (9) by the vector n yields
σ = σ 0 + σ h
where σ 0 is computable, while σ h is not directly computable. Equation (10) can be approximated by the following equation:
σ = σ 0 + f ( x ; a )
where f ( x ; a ) is a function of x containing a coefficient to be determined a . x is the horizontal coordinates, and the number of coefficients a depends on the number of equation sets. f ( x ; a ) is usually constructed as an interpolating function.
f ( x ; a ) = l T a
where l = ( l 1 , l 2 , , l 5 ) satisfies the normalization condition. By substituting Equation (11) into Equation (7), a six-variable nonlinear equation system g ( F S , a ) can be obtained.
g ( F S , a ) = 0
The unknown can then be solved for by Newton’s iterative method.

4. Computational Analysis and Discussion

In view of the engineering construction site selection generally choose the site with better geological conditions, the research object of this paper is only for the rock masses of Class I to III, and the lowest value of the physical and mechanical parameters in Table 1 is selected.

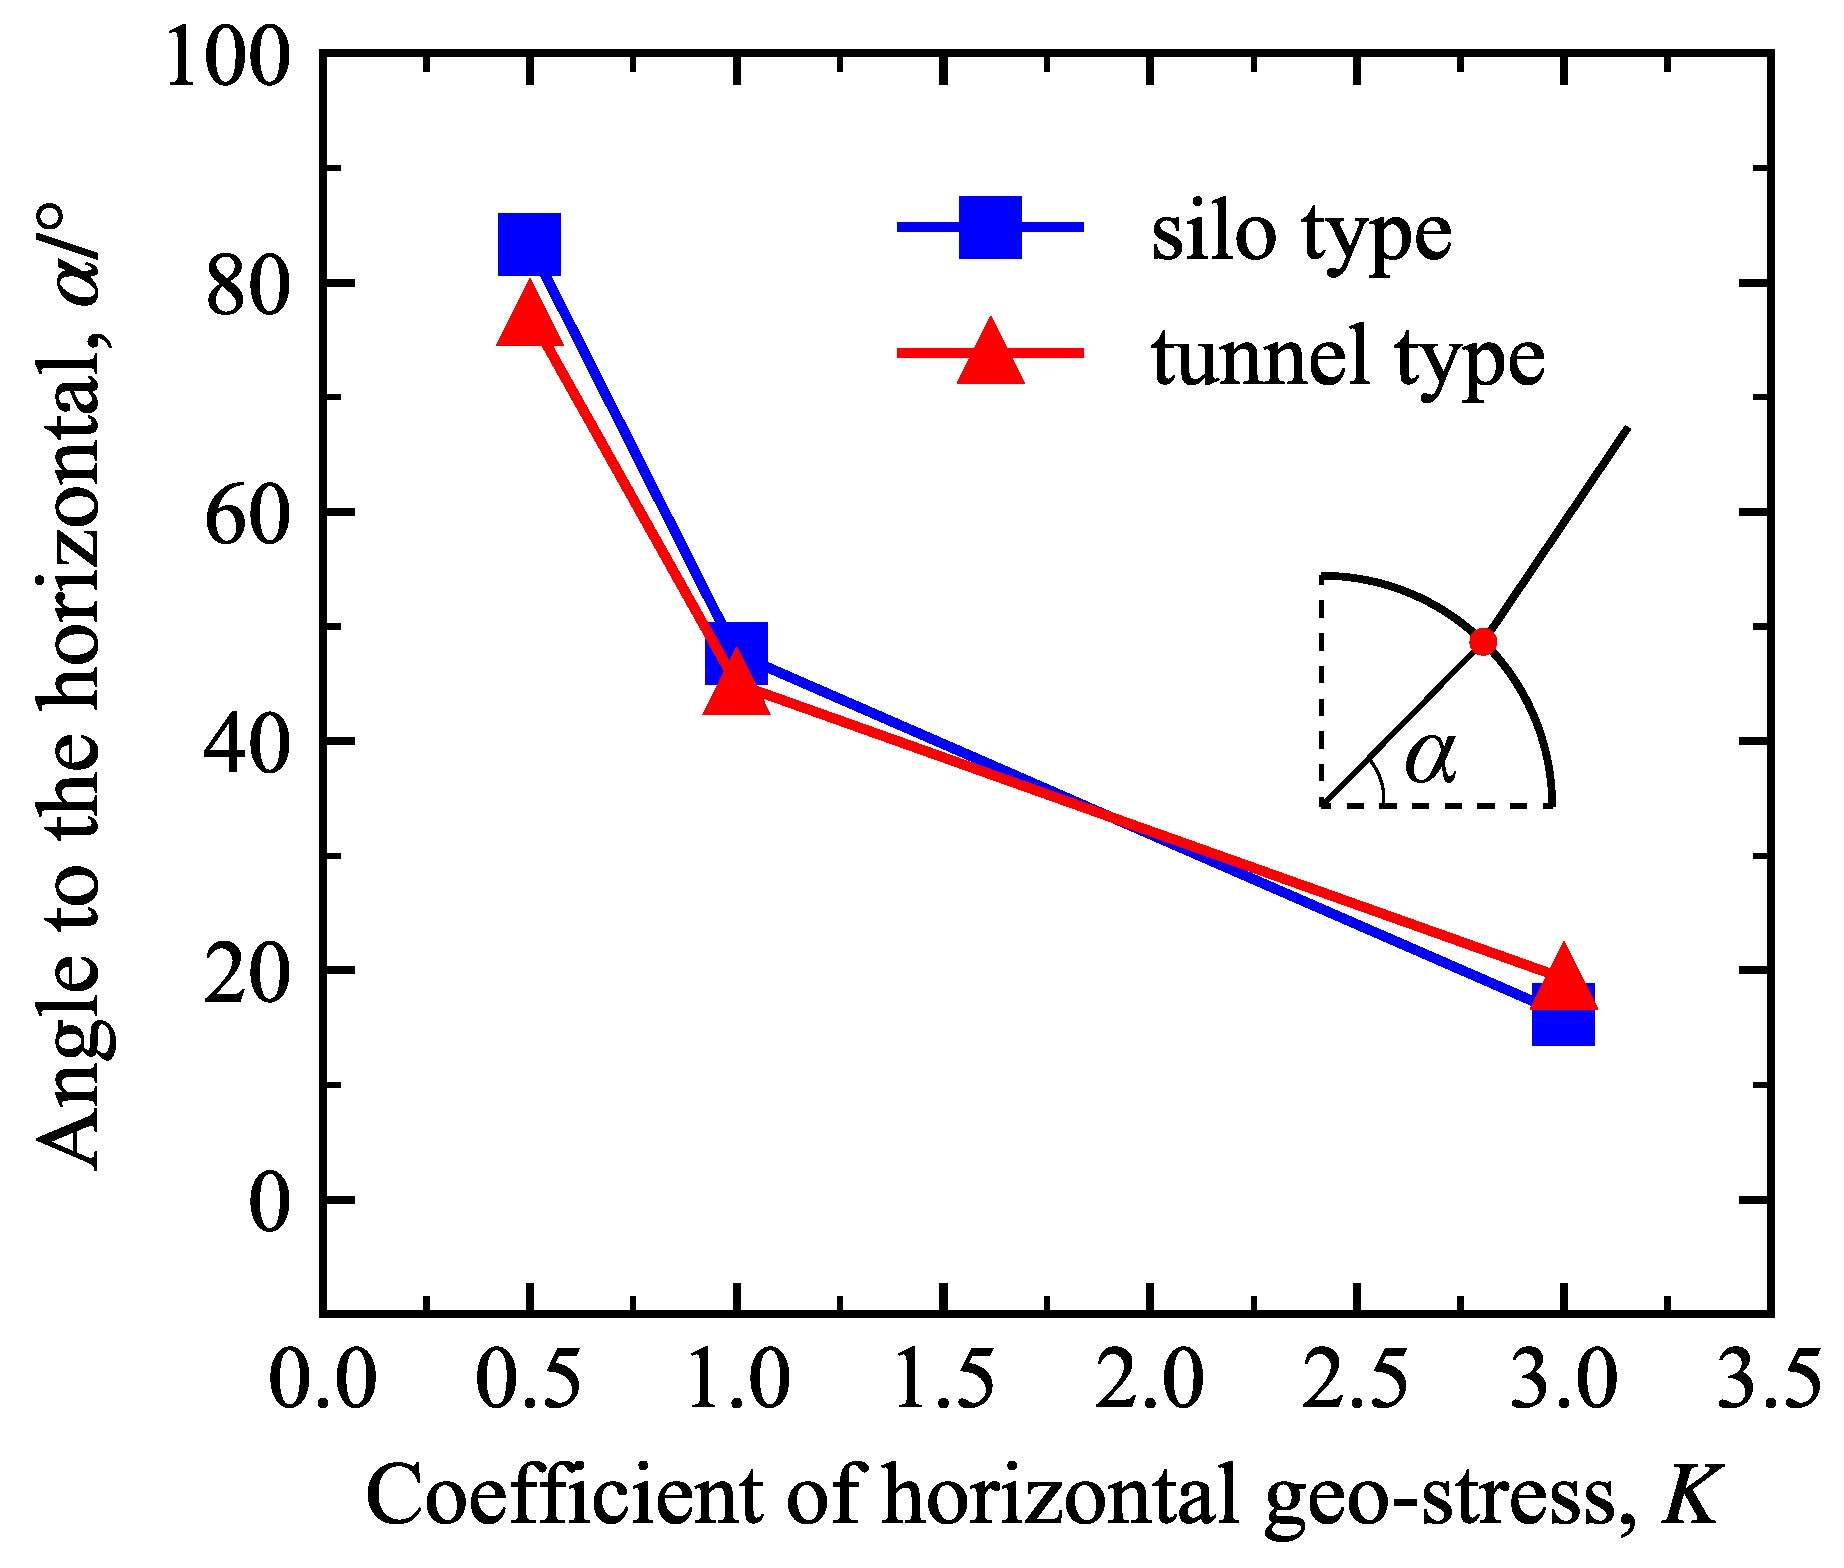
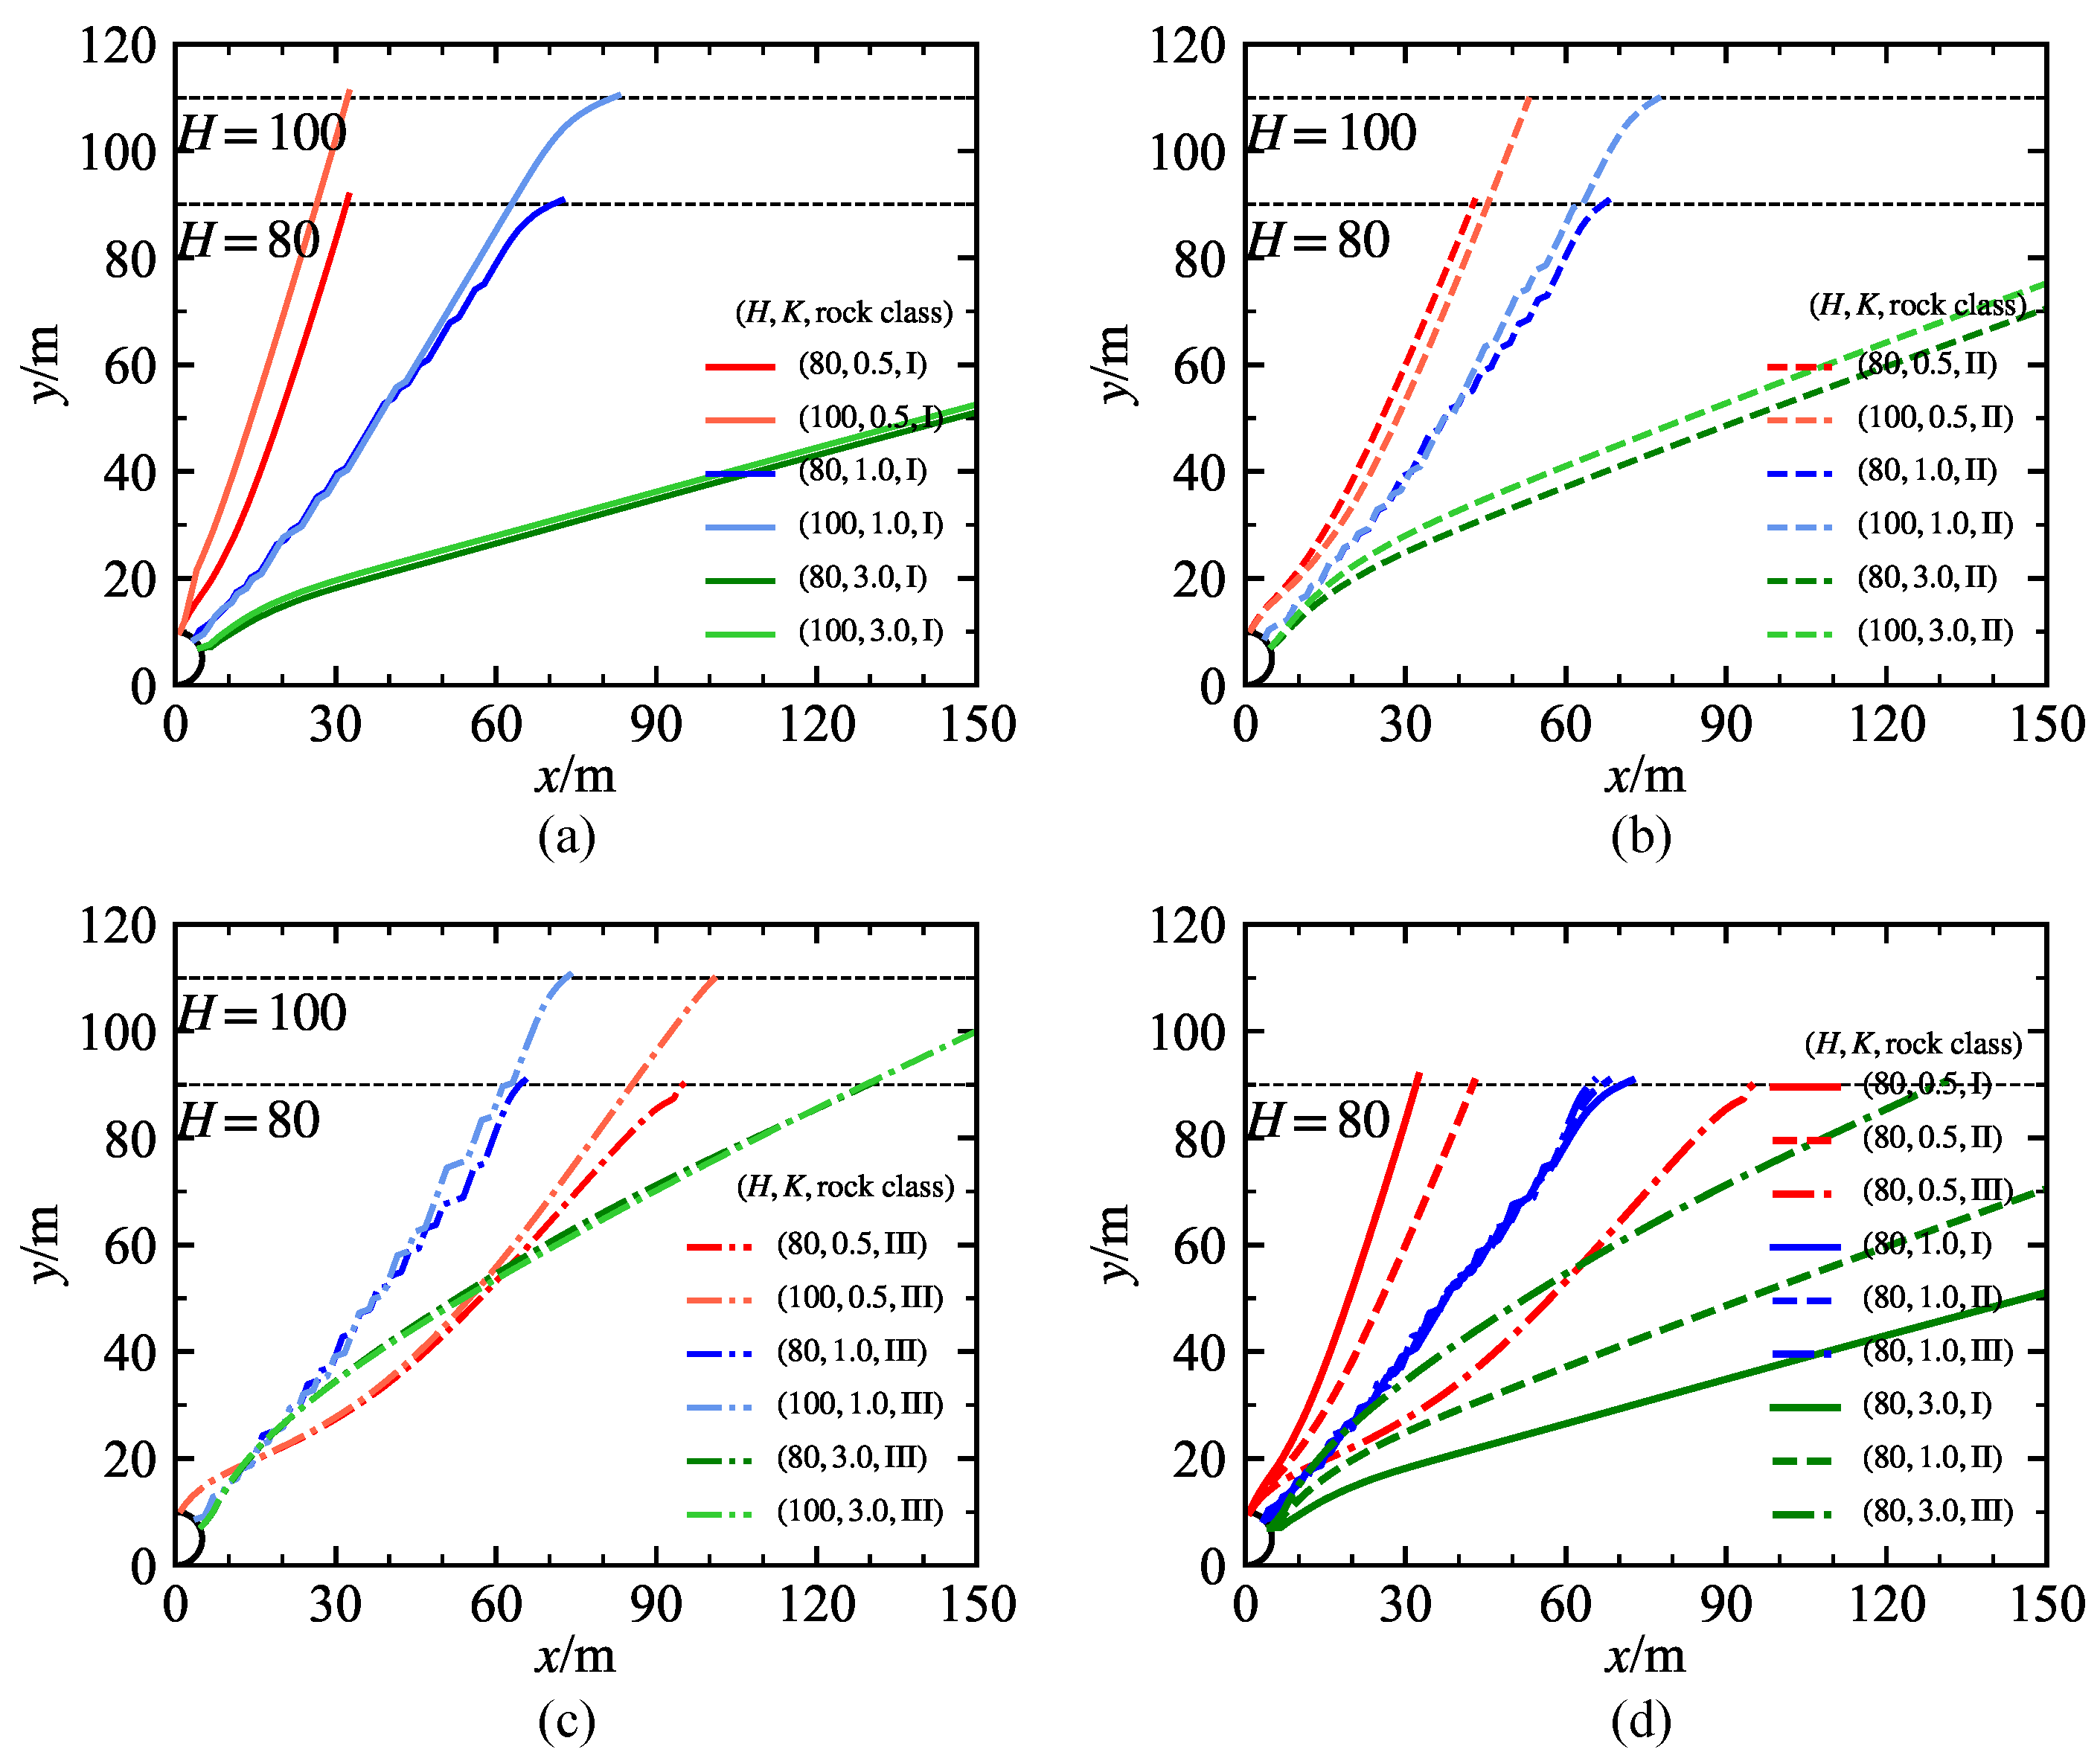
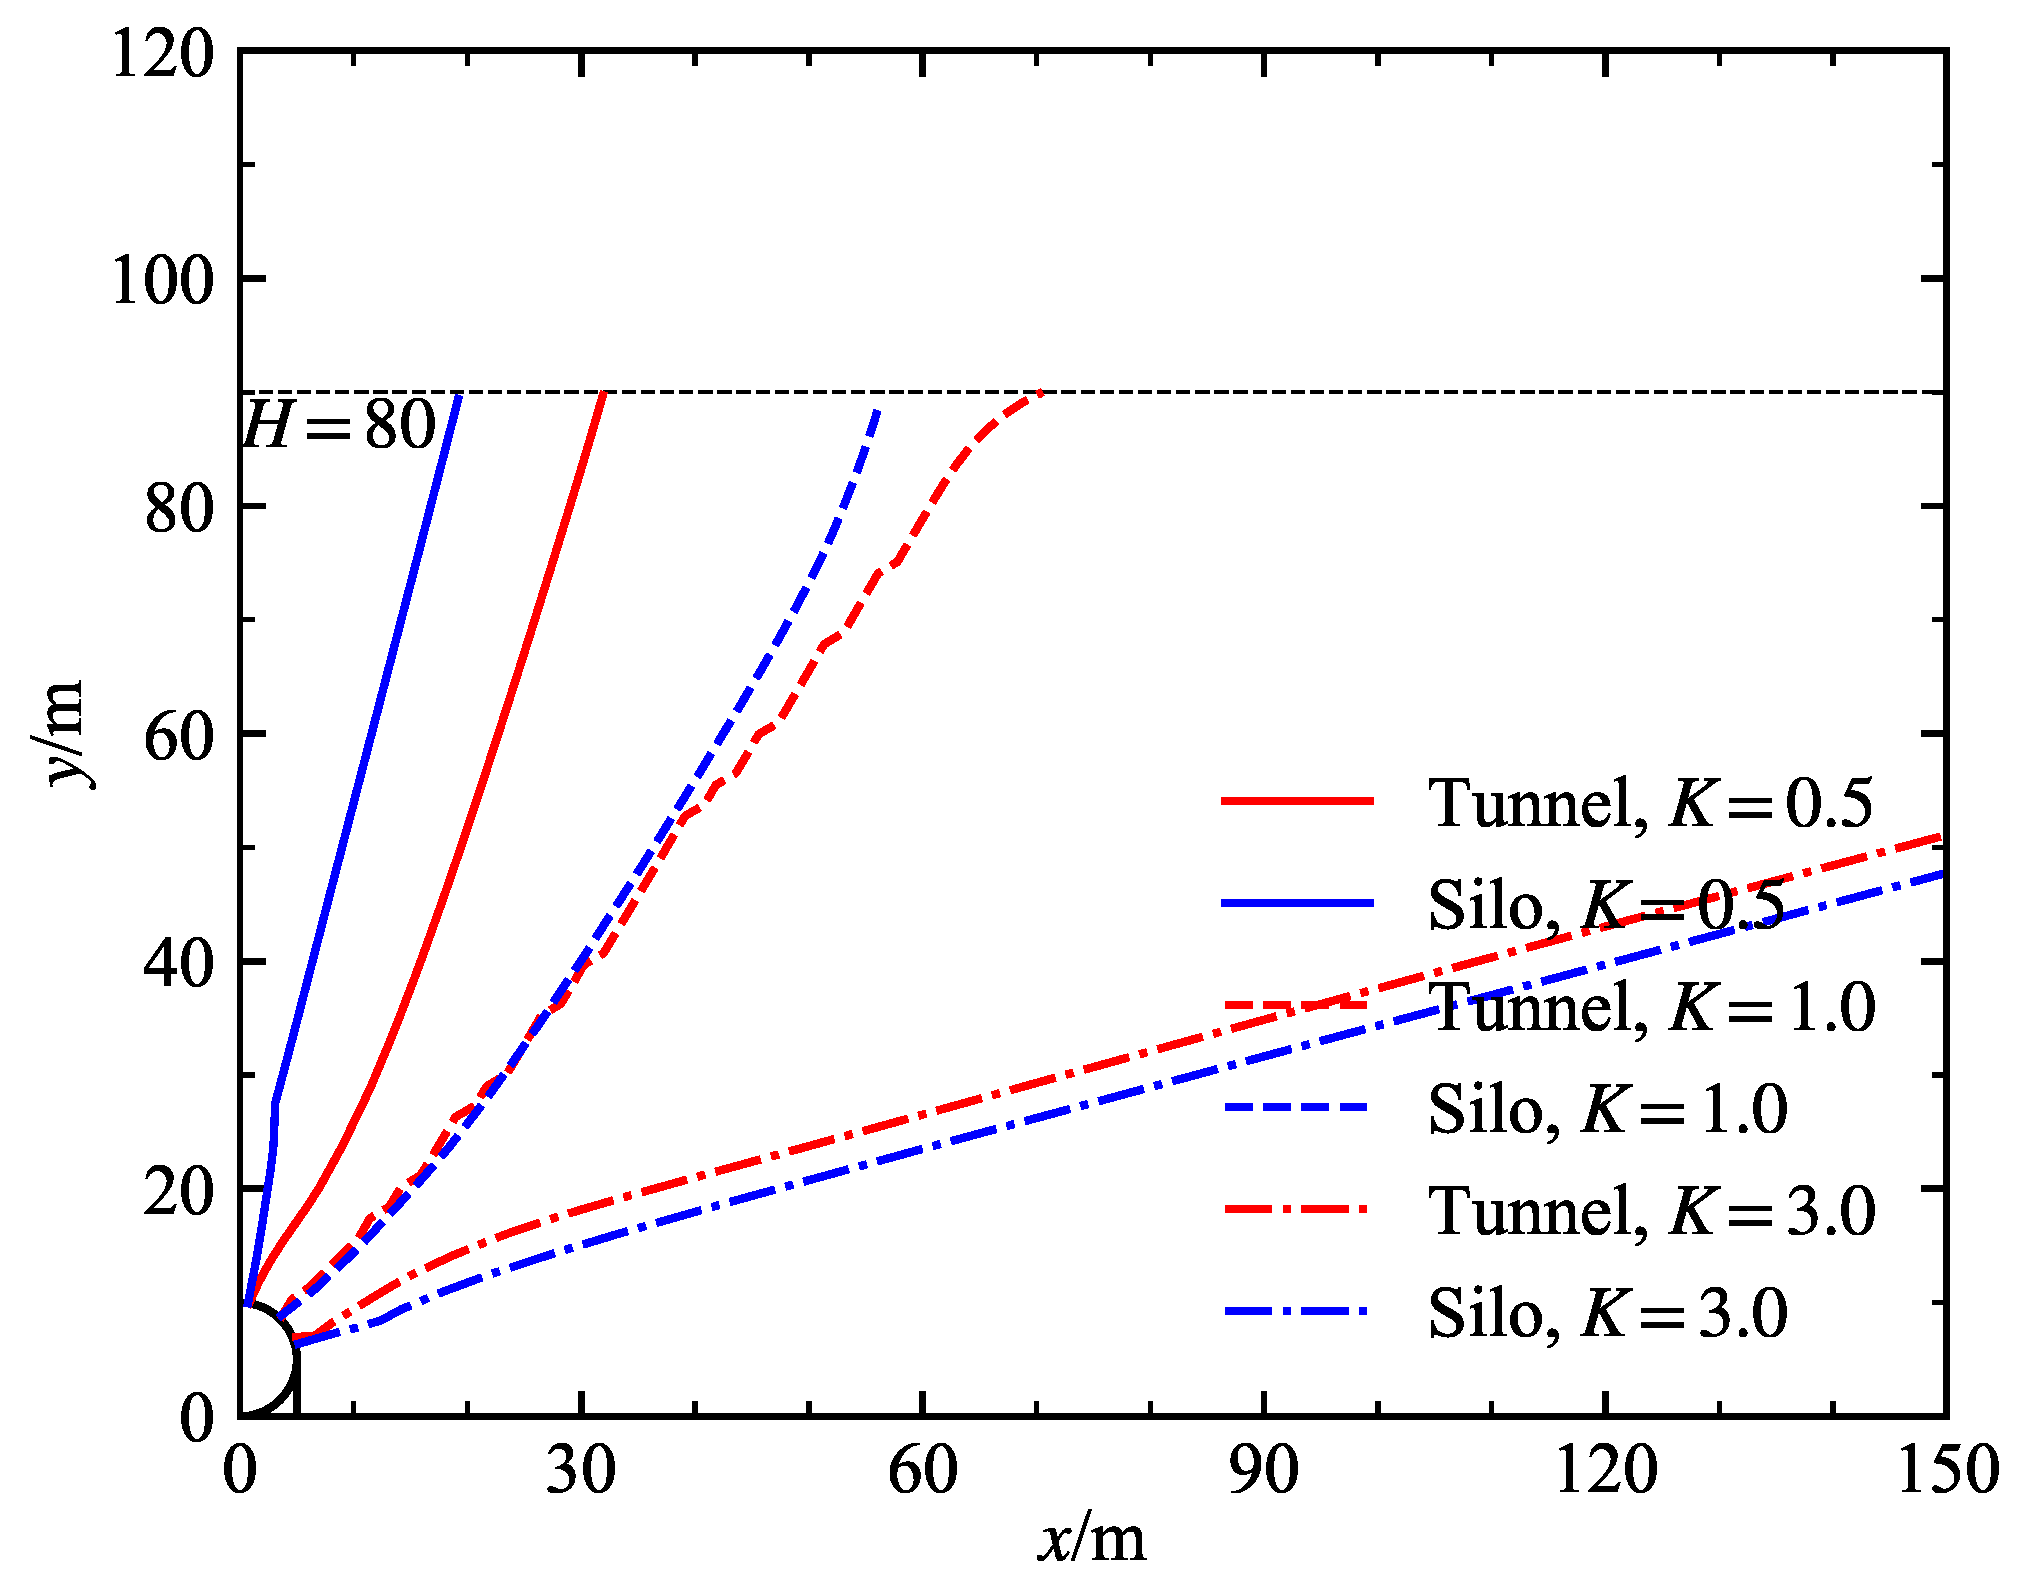
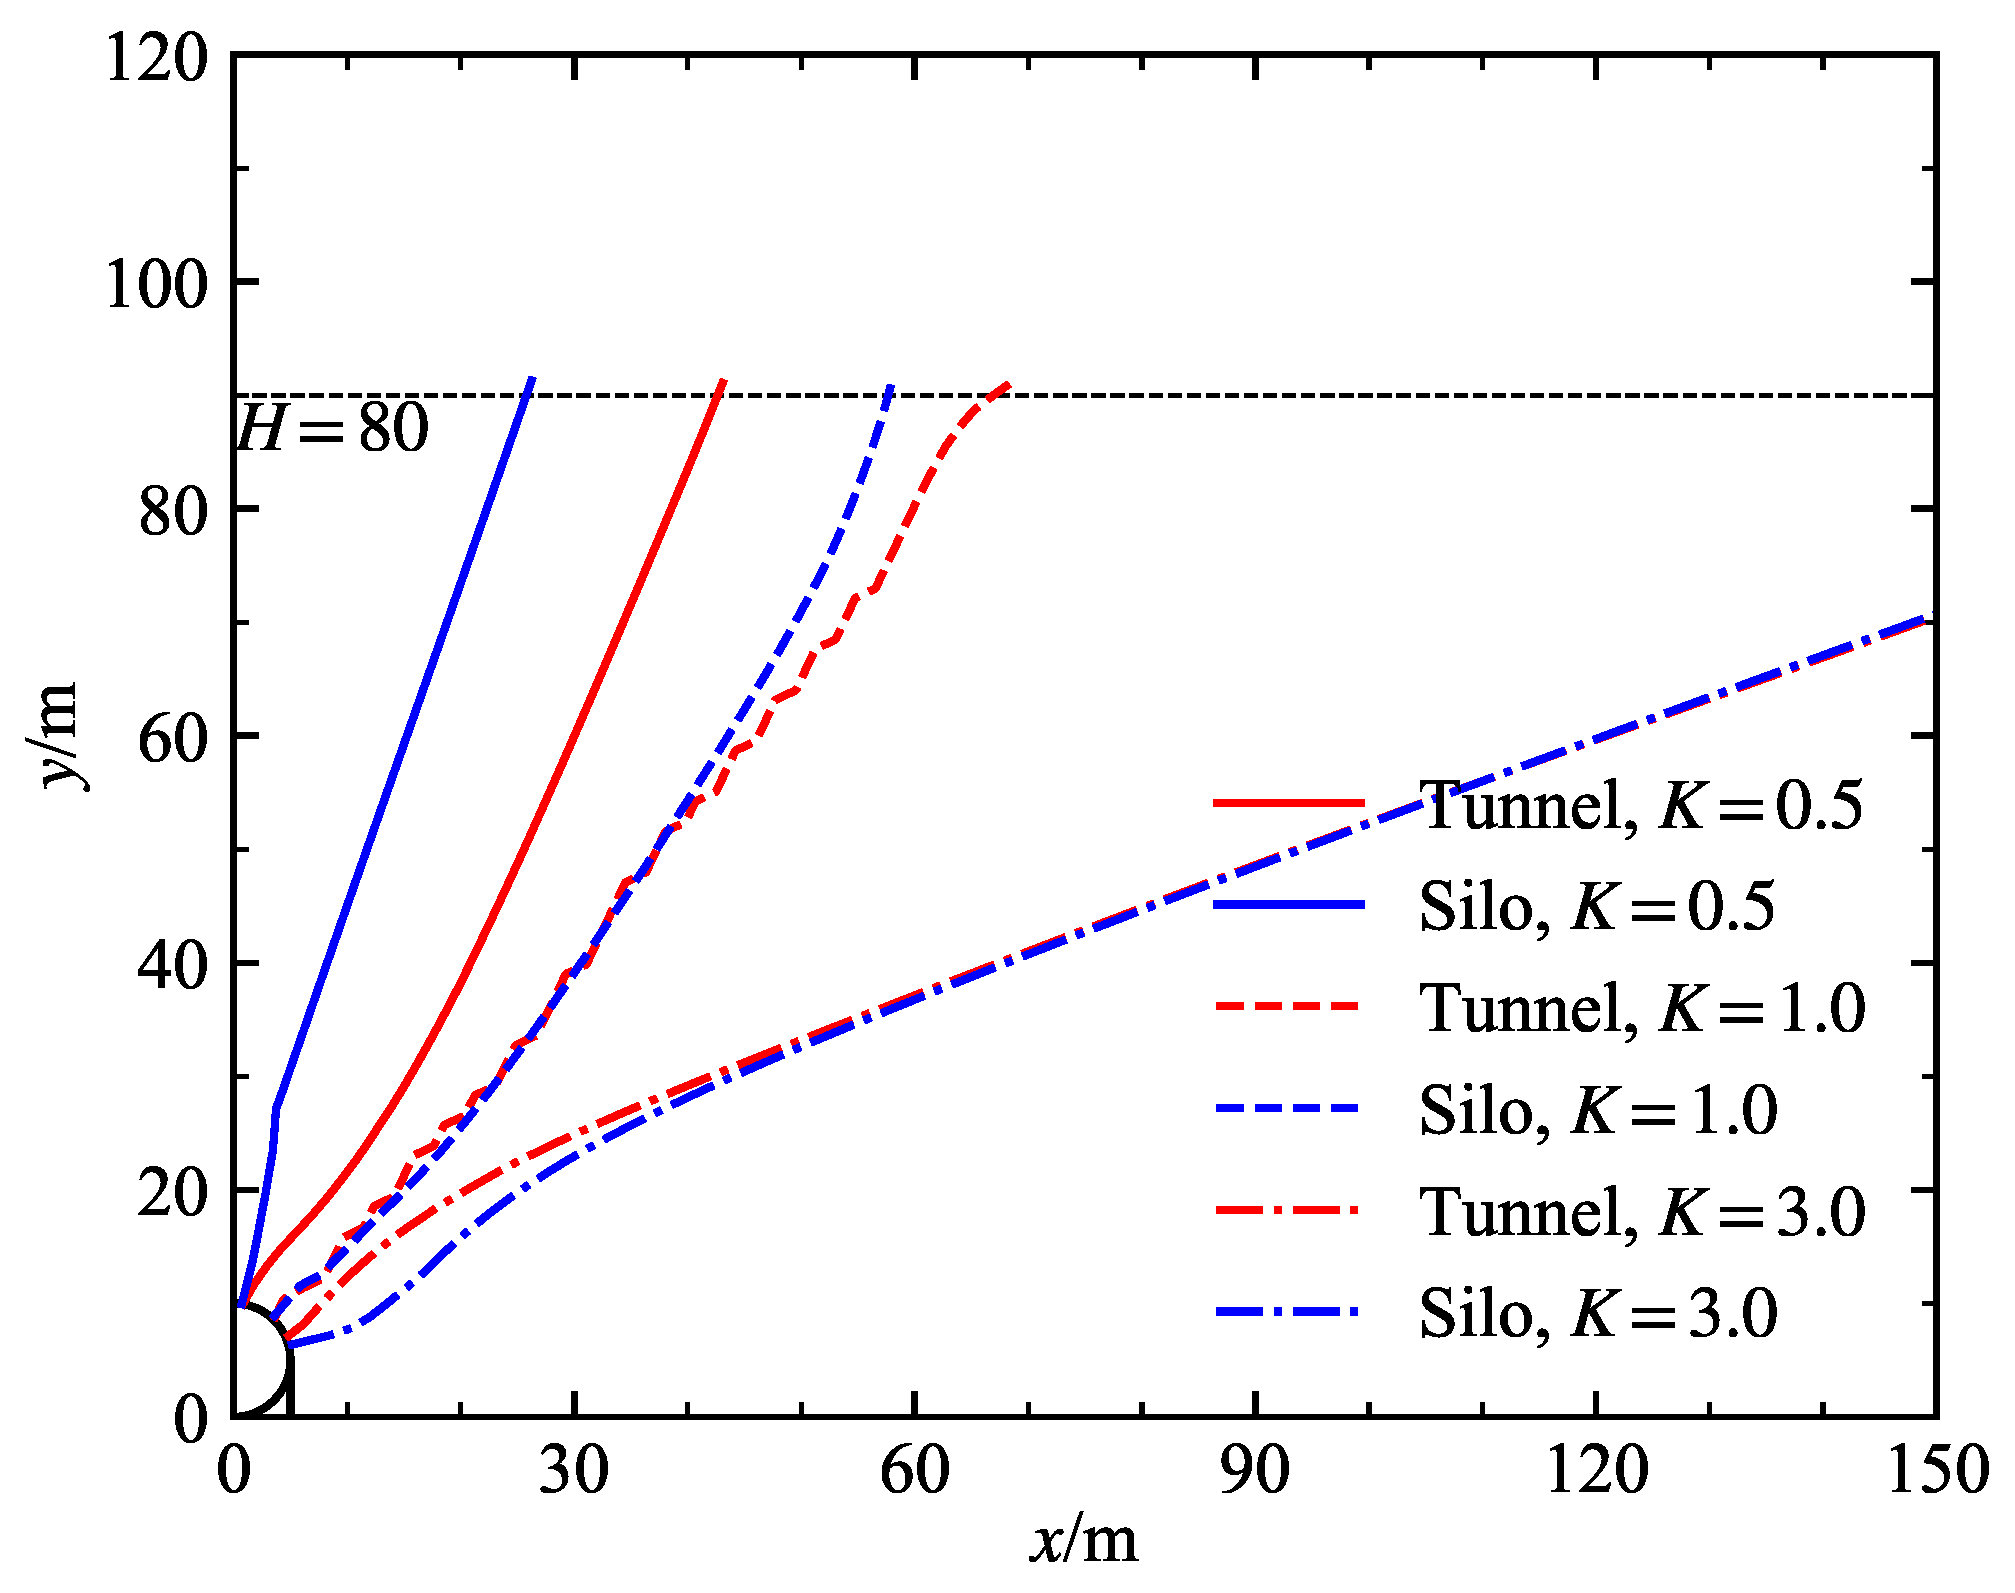
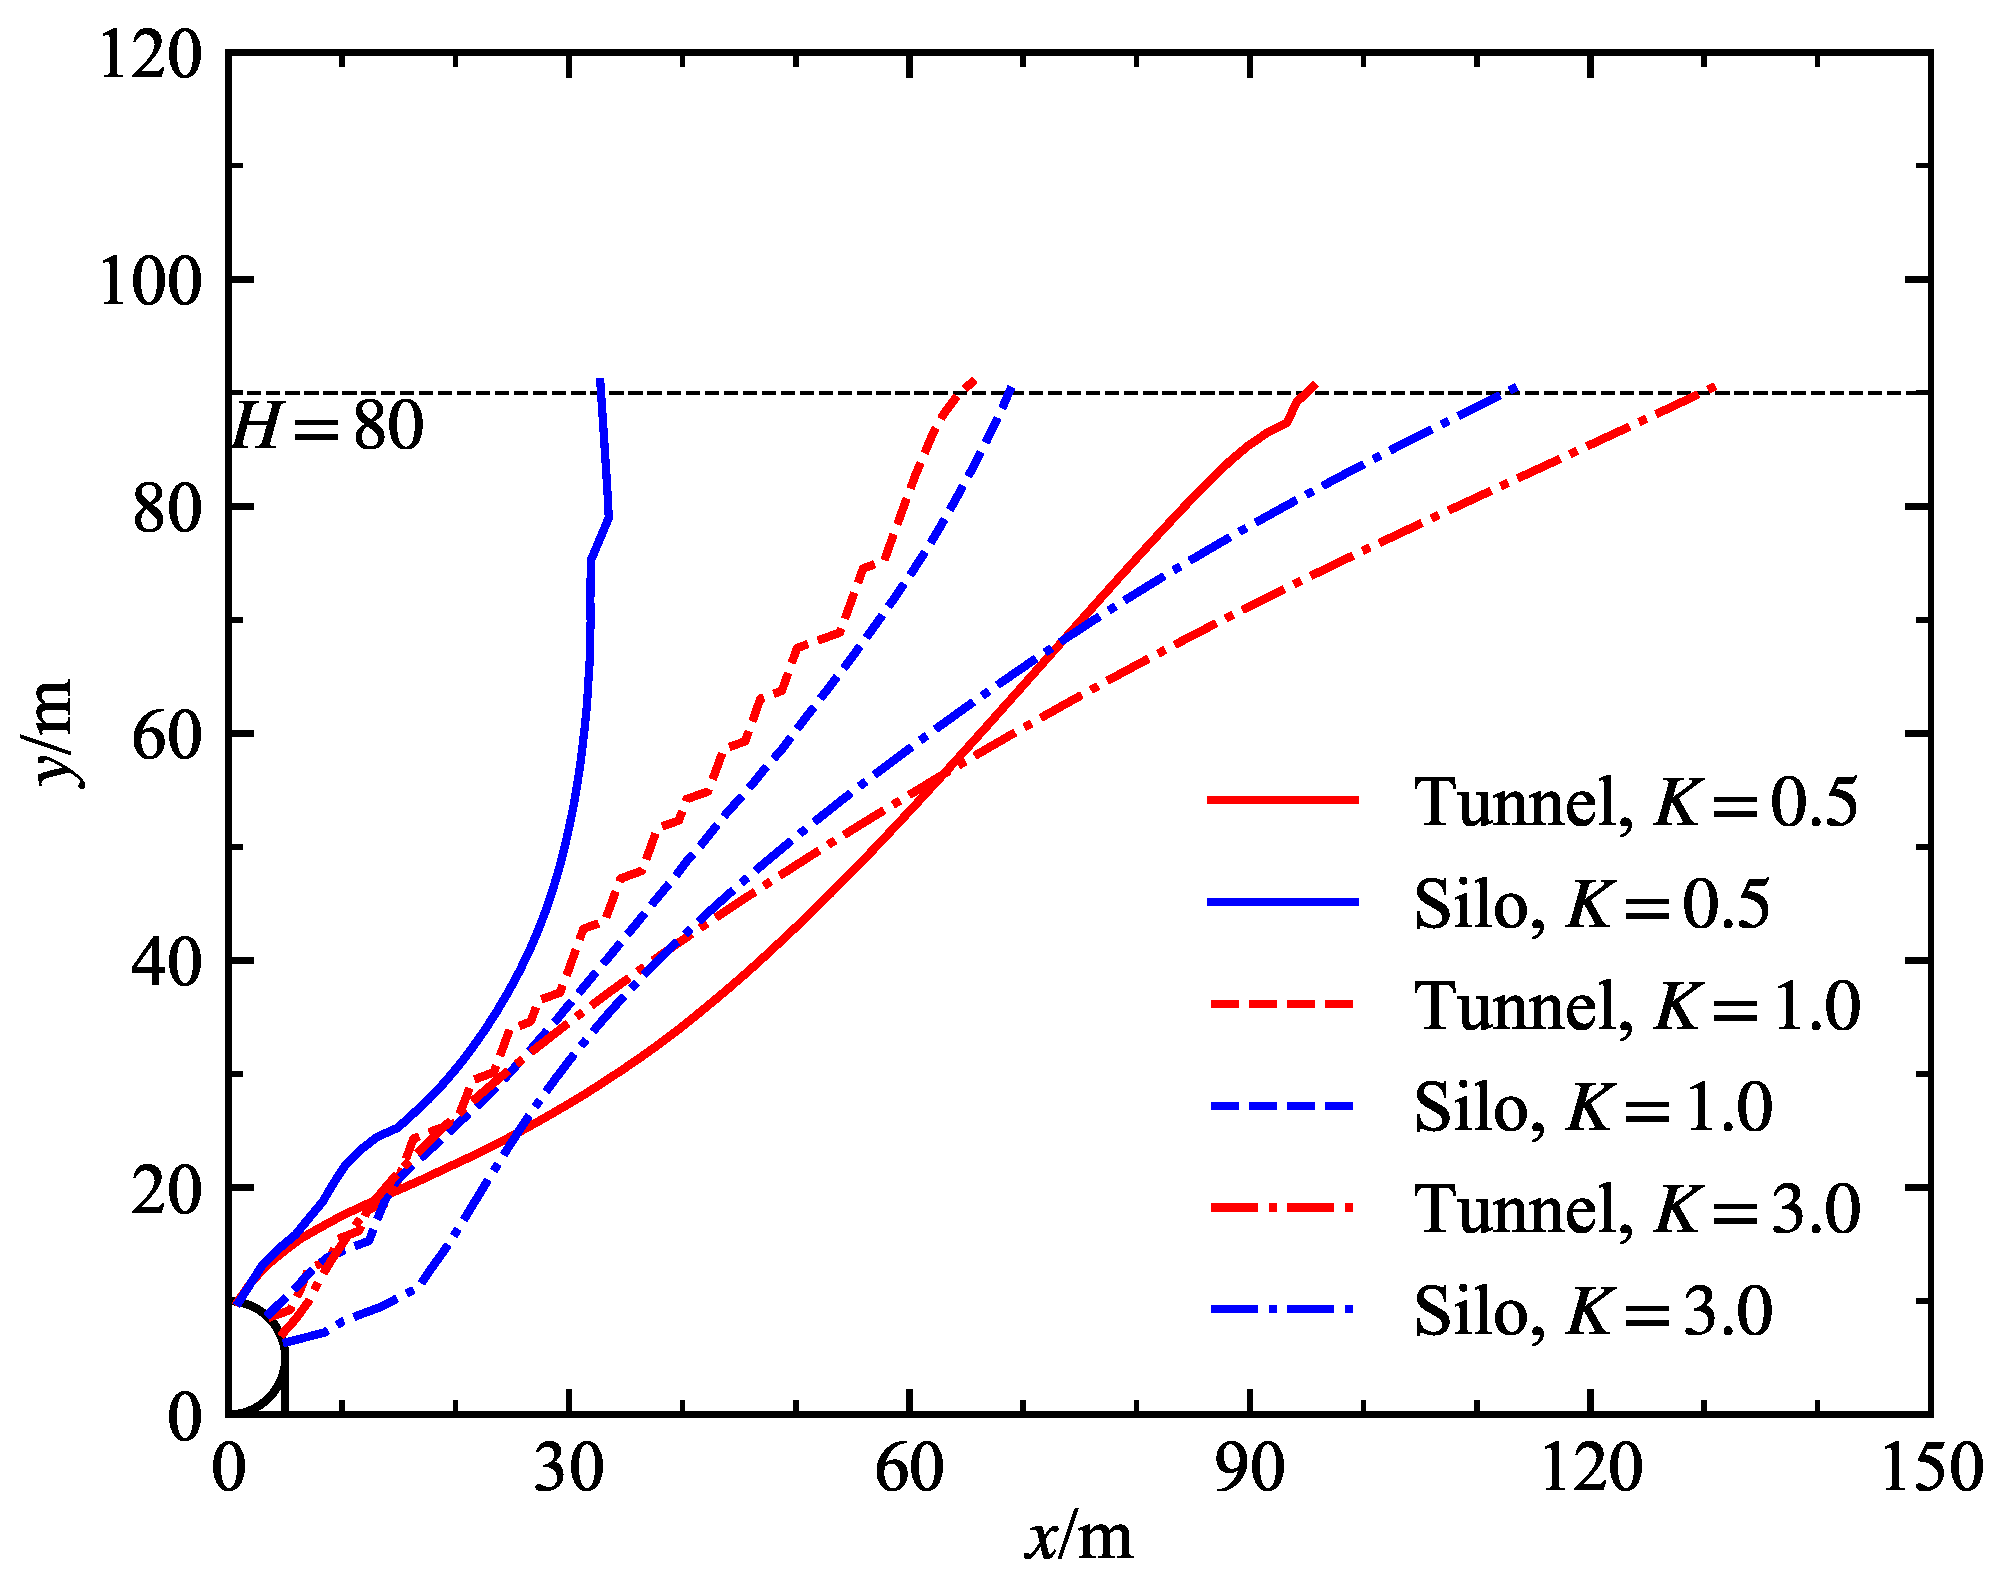
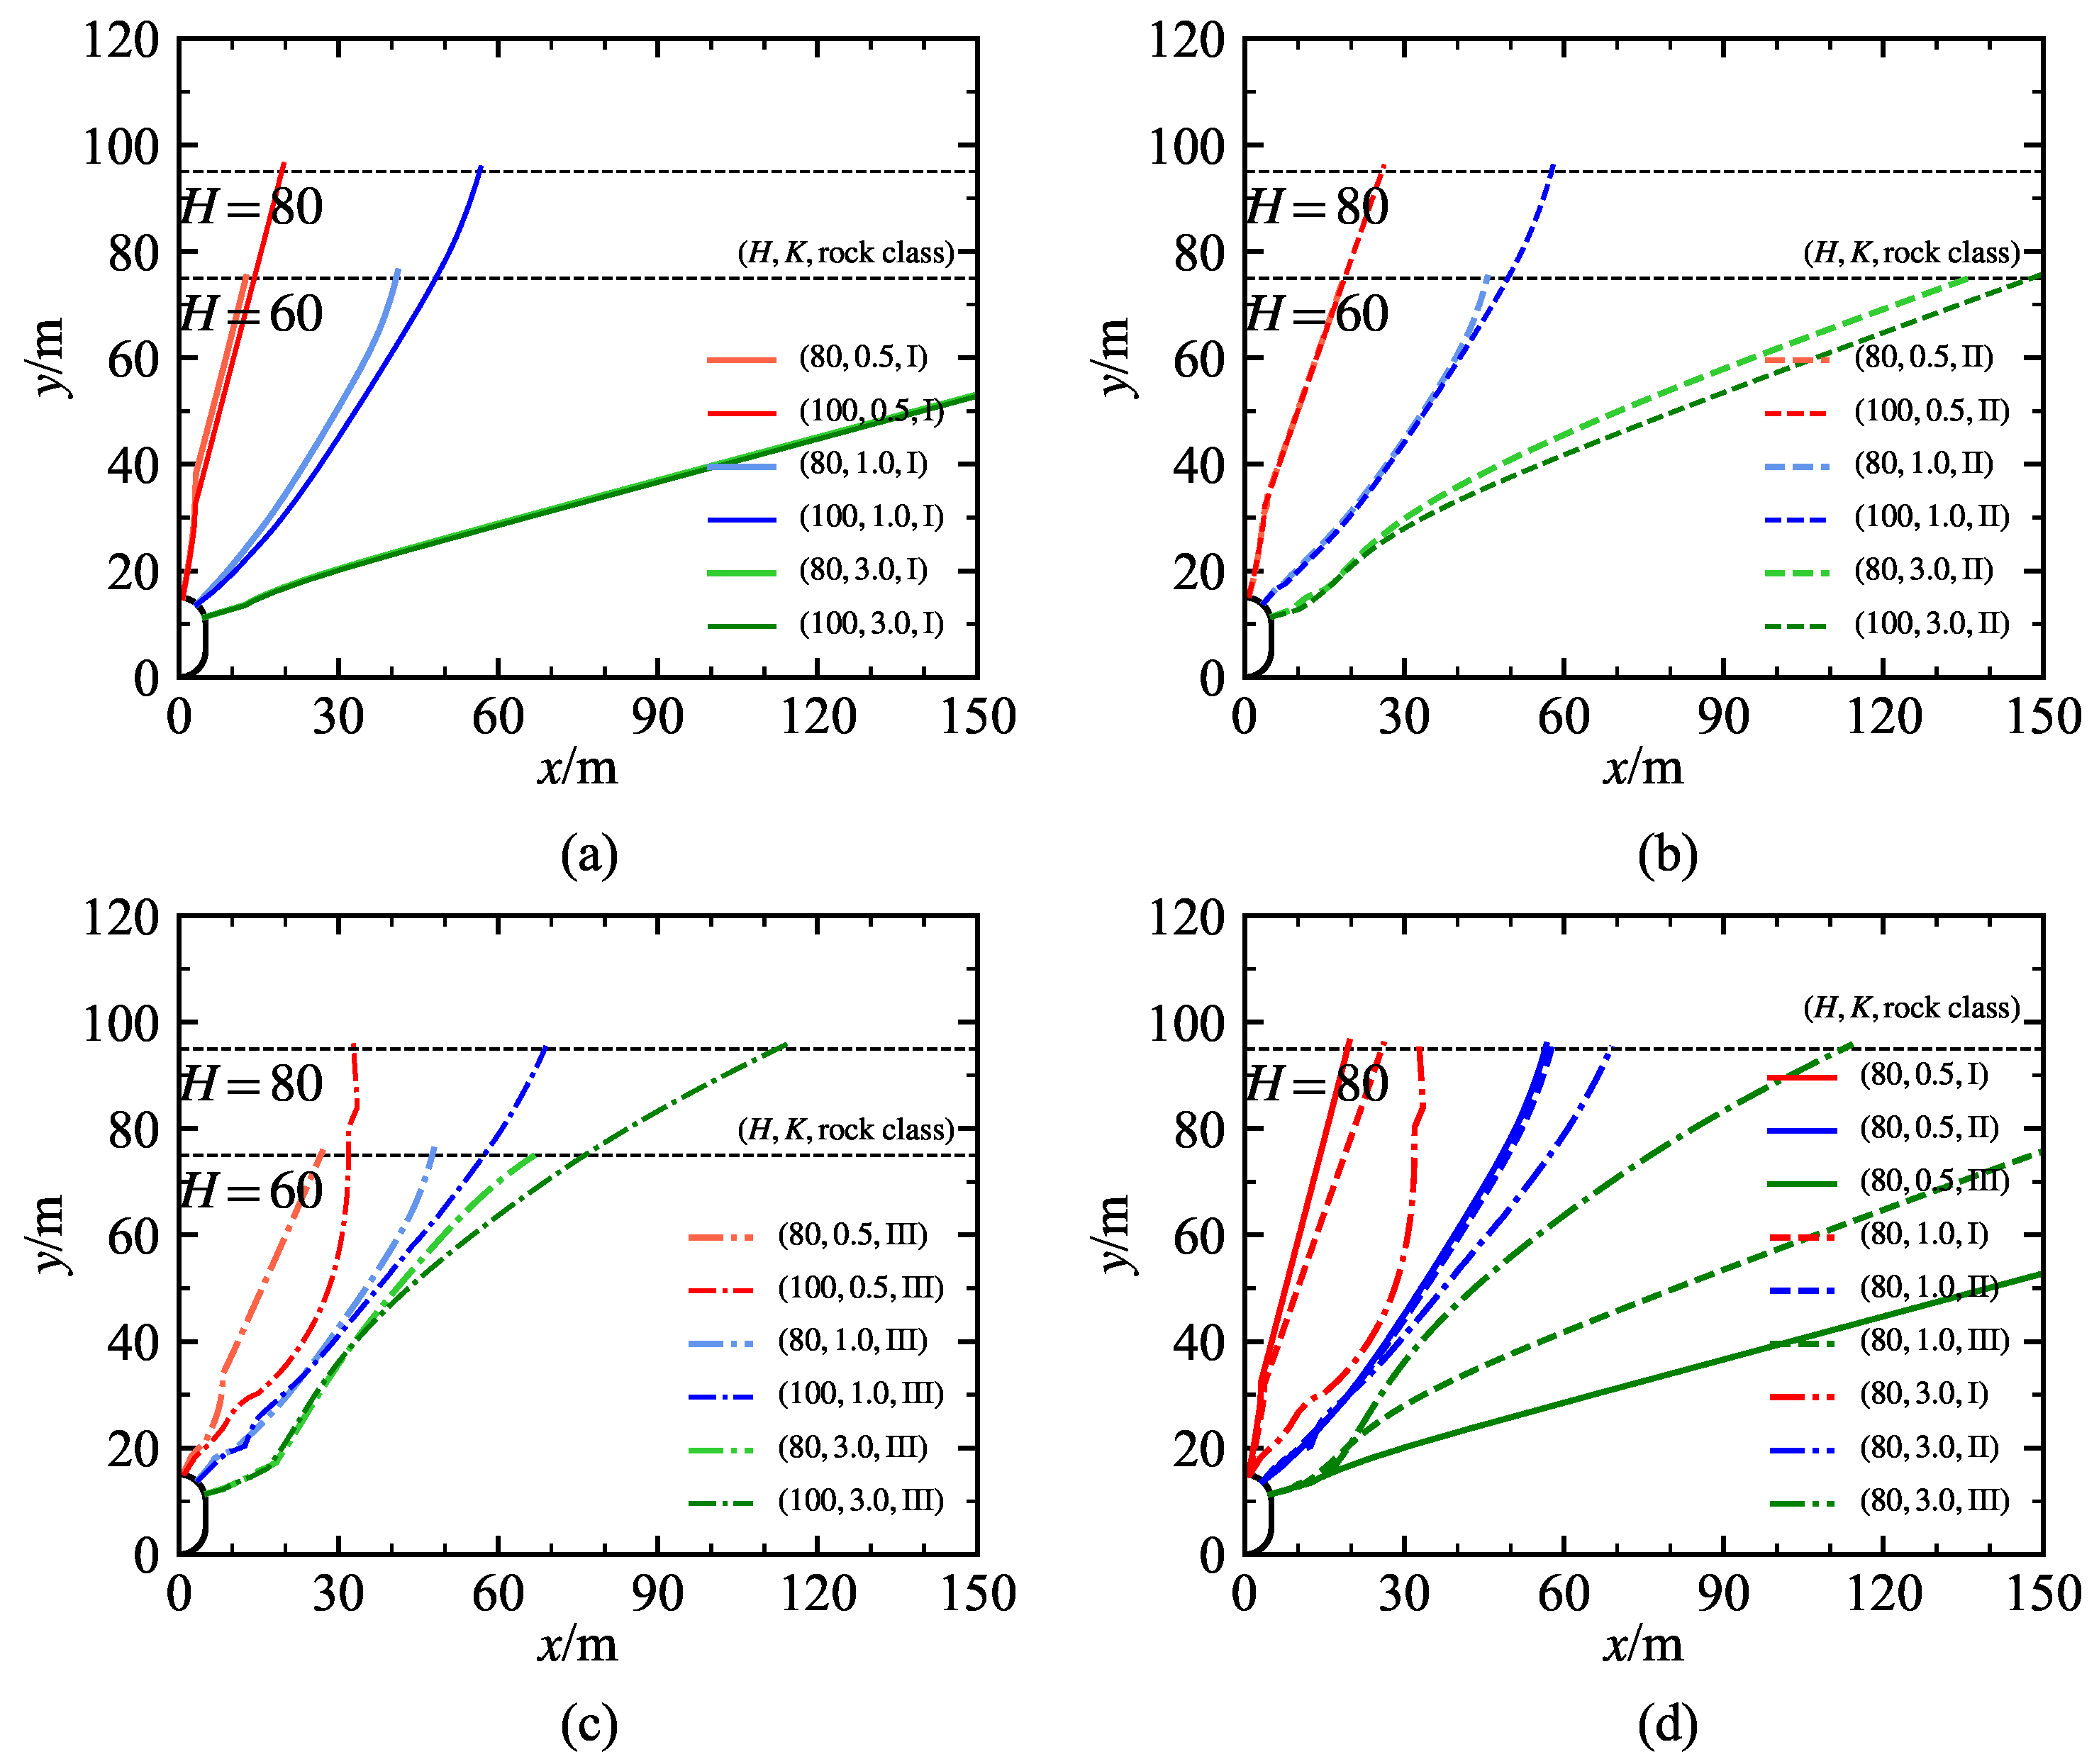
4.1. Potential Failure Surfaces

From the previous section, to solve the potential rupture surface, it is necessary to obtain the fracture initiation point first. In this paper, the fracture initiation point refers to the research results of Tunsakul et al. [13,15]. The research results show that the location of the fracture initiation point is strongly affected by the horizontal geostress, so the selection of the crack initiation point is referred to in Figure 7.
Figure 8 shows the potential fracture surfaces of tunnel-type LRCs at depths of 80 m and 100 m under geostress coefficients of K = 0.5 , K = 1.0 , and  K = 3.0 . Figure 8a–c correspond to rock mass conditions of Grades I to III, respectively, while Figure 8d presents a comparison of different rock mass grades at a depth of 80 m. The results show that the extension direction of the potential fracture surface is strongly influenced by the horizontal geostress coefficient and has little relation to the burial depth. As the geostress coefficient increases, the direction of fracture surface extension tends to be horizontal. However, this effect varies depending on the rock mass class, as shown in Figure 8c, the fracture surfaces are more concentrated in Grade III rock masses. Interestingly, it can be observed from Figure 8d that the fracture surface tends to be more horizontal in the case of poorer rock mass when the horizontal geostress coefficient K = 0.5 , while the fracture surface also tends to be horizontal in the case of better rock mass when K = 3.0 , and the direction of expansion of fracture surfaces is almost the same in the different rock mass classes for the case of K = 1.0 . This suggests that the extension direction of the fracture surface of the rock mass is not only affected by the geostress coefficient but may also be related to the internal friction angle, which can be explained in the Mohr–Coulomb criterion: the inclination angle of the fracture surface is related to the internal friction angle. When the geostress coefficient is less than 1, the direction of maximum principal stress is vertical; on the contrary, when the geostress coefficient is greater than 1, the direction of maximum principal stress is horizontal. Figure 9 shows the potential fracture surfaces of silo-type LRCs at depths of 60 m and 80 m under geostress coefficients of K = 0.5 , K = 1.0 , and  K = 3.0 Figure 9 demonstrates a similar regularity to that of Figure 8 and is not repeated here. In order to visually compare the potential fracture surfaces of different types of LRCs (tunnel vs. silo), a burial depth of 80 m was selected as an example in this study, and the fracture surfaces of tunnel-type and silo-type LRCs are shown in Figure 10, Figure 11 and Figure 12, respectively, under different rock quality classes. From the results shown in the figure, it is evident that when the horizontal ground stress coefficient K = 0.5 , the two types of fracture surfaces differ significantly, with the tunnel-type fracture surface being more inclined to be horizontal. However, at  K = 1.0 and K = 3.0 , there is almost no difference between them. It is noteworthy that in Class III rock masses, the potential fracture surface of the silo type exhibits local abrupt changes, which may be related to the number of mesh elements, calculation steps, or other factors. Figure 13 illustrates the potential fracture surfaces for the silo-type cavern overlying rock masses at different numbers of mesh elements and computational steps. As can be seen from the figure, although increasing the number of mesh elements and decreasing the computational step length caused a tendency for the fracture surface to be inwardly inclined, the overall effect was not significant, and thus, these two factors can be ruled out. Considering that this occurs only in the Class III rock mass, the current speculation is that the cause of this phenomenon is a complex internal stress field due to the poor strength of the rock mass.

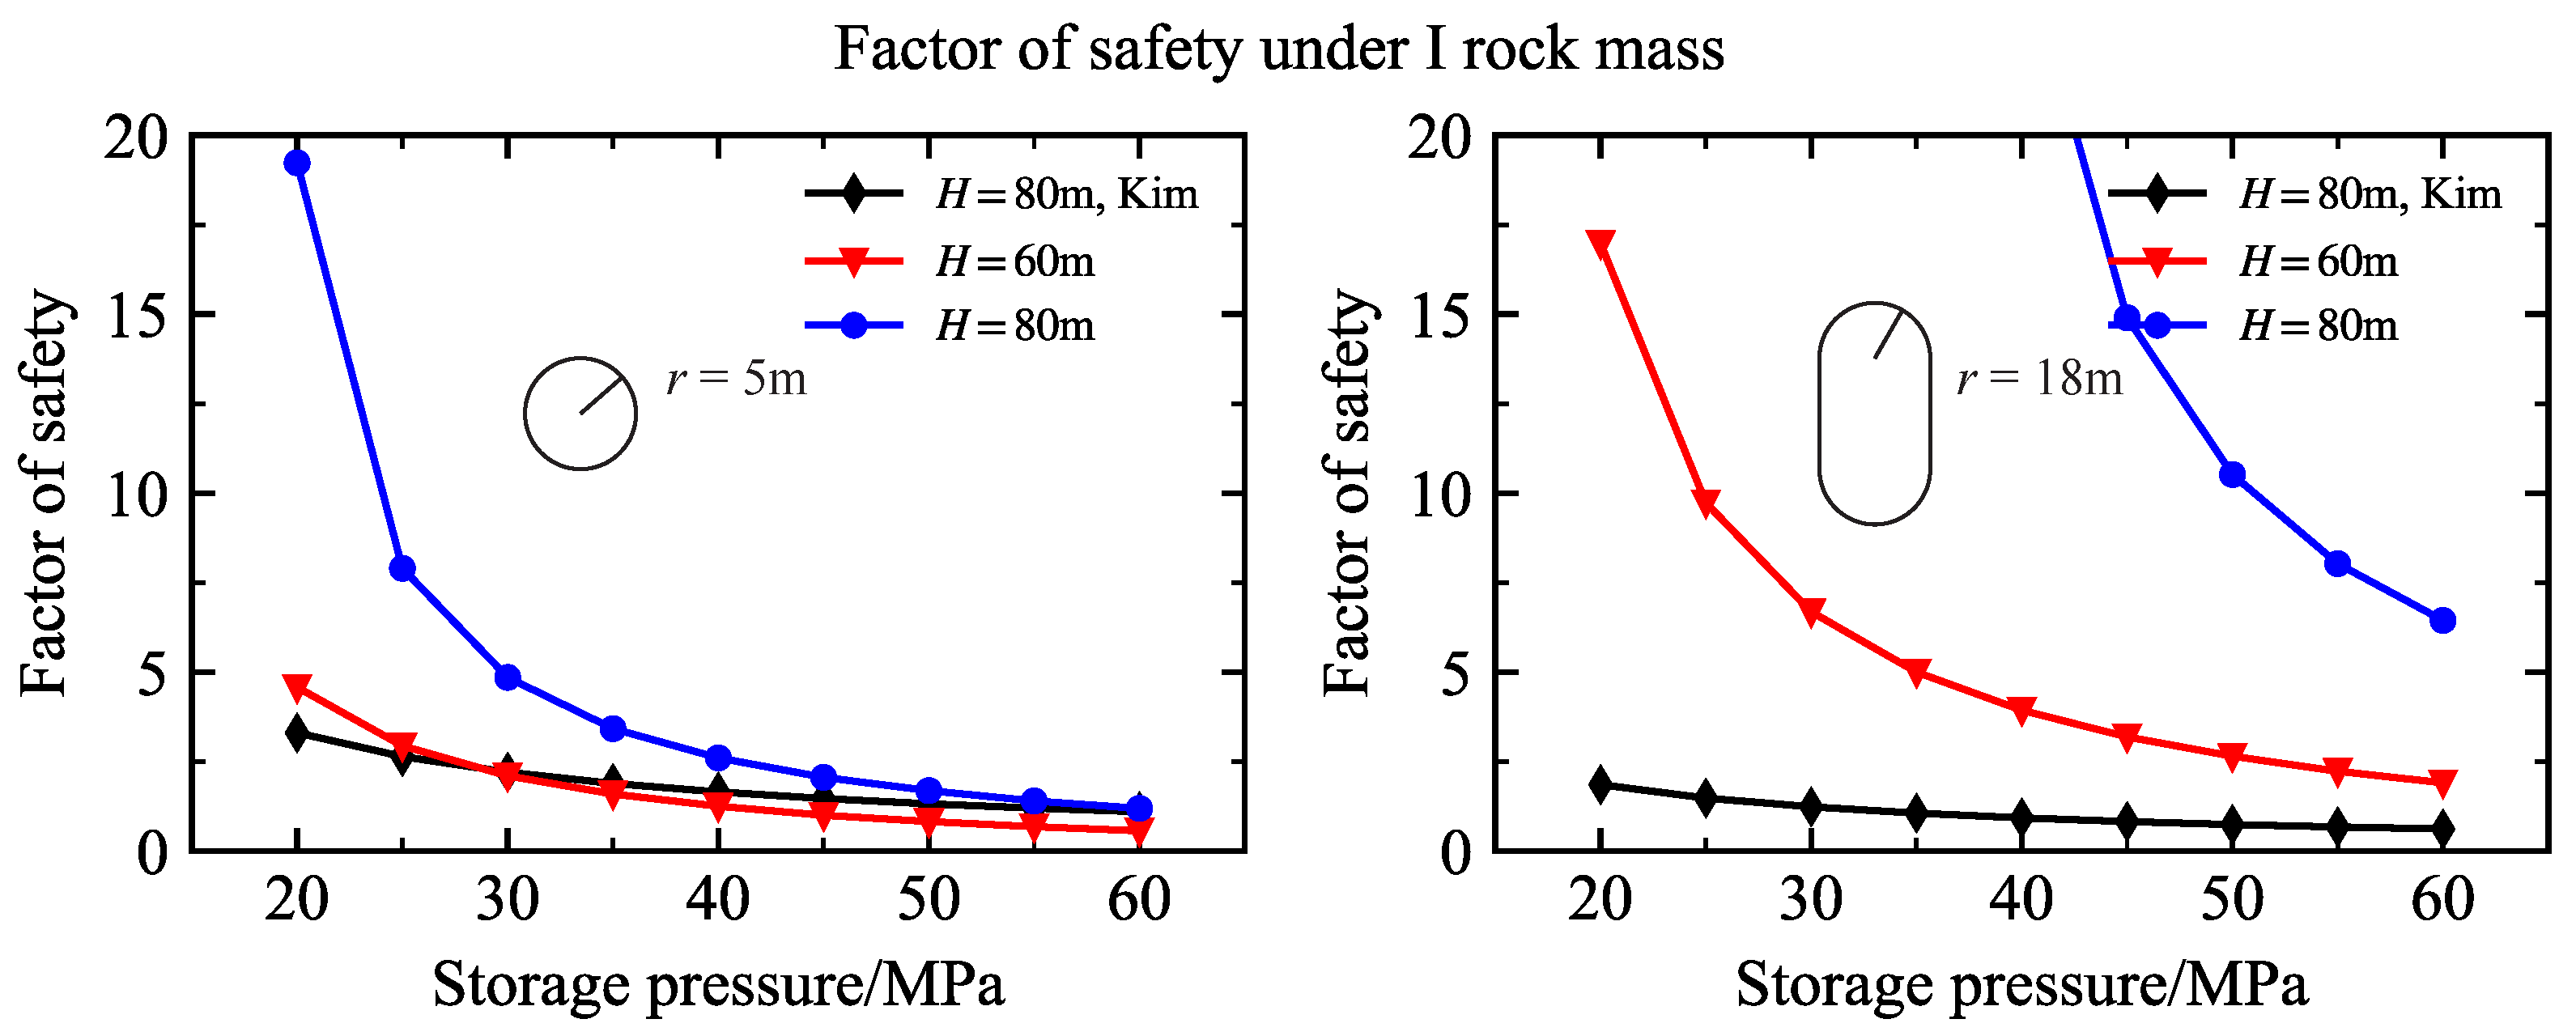
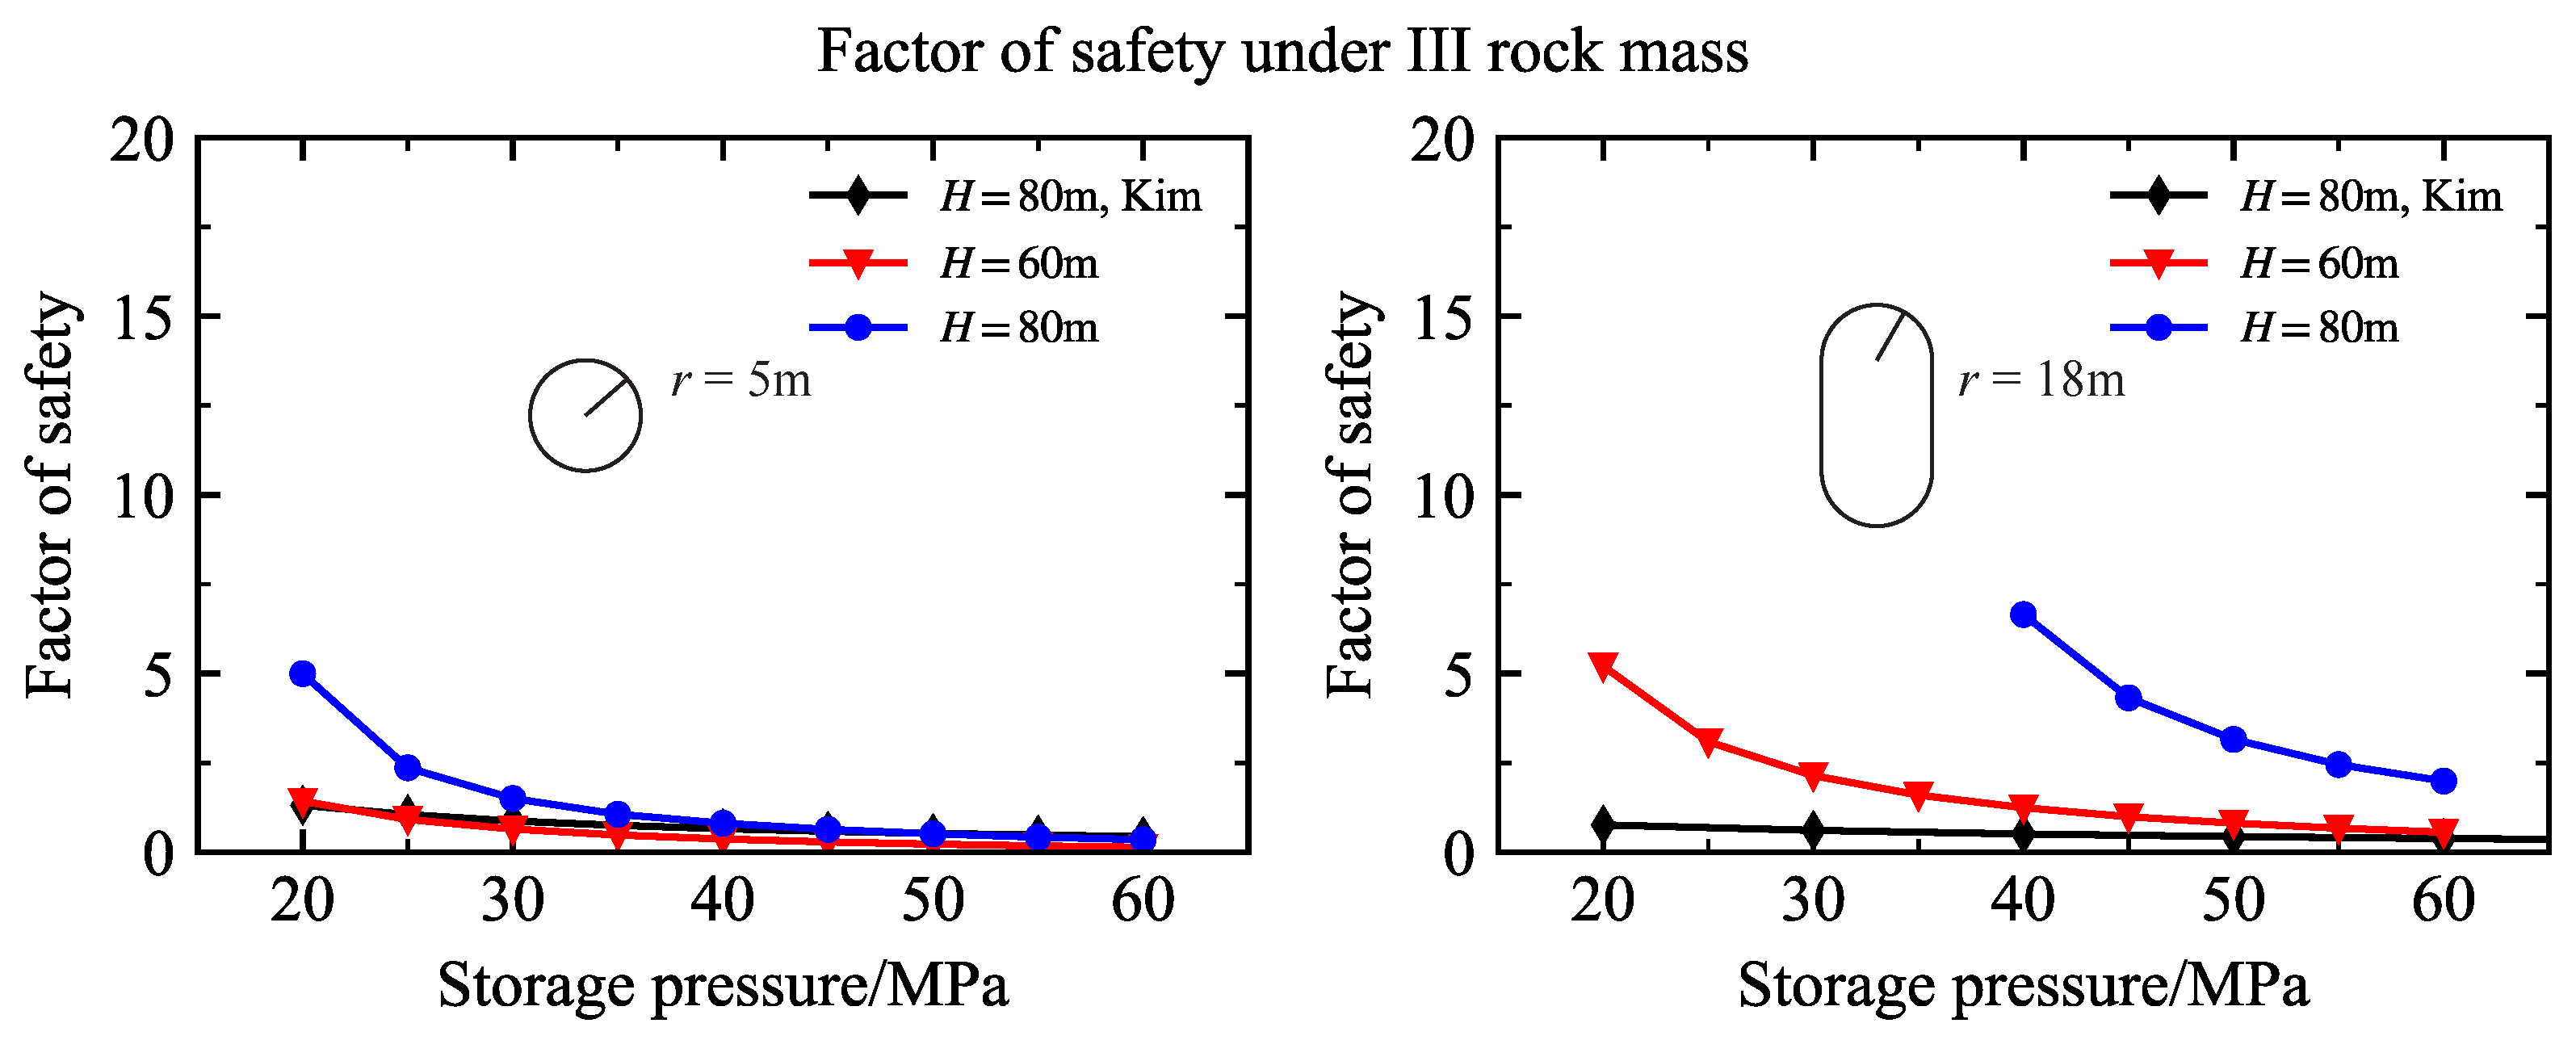
4.2. Factor of Safety

From the analysis in Section 4.1, it is understood that the morphology of the fracture surface is mainly influenced by the horizontal geostress coefficient and the internal friction angle. When the depth is sufficiently deep, the volume of the overlying rock mass uplift will rise significantly with the increase in burial depth, leading to an increase in the factor of safety with depth. At higher geostress coefficients, the fracture surface tends to extend in a nearly horizontal direction, in which case the fracture surface is unlikely to extend to the surface, and the volume of the overlying rock mass is relatively large, making the construction of LRCs more appropriate for sites with geostress coefficients greater than one. When the geostress coefficient is low, the starting point of the fracture surface is closer to the top of the cavern, leading to a smaller area of the potential uplifted rock mass affected by internal pressure, which may result in an overestimation of the safety factor. Given the analysis above, this study focuses on calculating and analyzing the safety factor in situations where the horizontal geostress coefficient is equal to 1. Tunnel-type LRCs can be designed with longer horizontal lengths depending on the required volume; however, silo-type LRCs cannot have larger lengths in the vertical direction, so it is not practical to directly use the same radius when comparing safety factors. In this paper, assuming that the required volume of the air storage chamber is 40,000 m3, the tunnel radius is the common 5 m, and assuming that the waist length of the silo type is equal to the radius, the radius is about 18 m.
Figure 14, Figure 15 and Figure 16 illustrate the factor of safety for the two types of LRC under Class I, II, and III rock, respectively. Additionally, the figures also show the factor of safety calculated using Kim’s method [12] at a burial depth of 80 m. Kim’s method is also a limit equilibrium approach, which assumes the slip surface extends vertically from the cavern side wall to the surface. However, this paper indicates that the slip surface extends obliquely to the surface, which aligns more closely with reality. This suggests that the volume of the overlying block poised to uplift and the area of the slip surface in this method will be significantly larger than the rock mass assumed by Kim’s method, implying that the component of uplift resistance due to the rock mass’s own weight and the shear resistance along the slip surface will be greater, especially in silo-type caverns. In terms of the definition of the factor of safety, Kim’s method defines it as the ratio of resistance forces to acting forces, whereas the factor of safety in this paper is defined based on the concept of strength reserve on the slip surface, without any reduction in the rock mass’s own weight. Thus, Kim’s method may be overly conservative. Regarding applicability, this method offers better flexibility. For example, if other researchers determine more precise but geometrically irregular potential slip surfaces using different methods, this method can still be applied to calculate the factor of safety. The results from the diagrams show that at the same burial depth of 80 m, the factor of safety calculated by Kim’s method is significantly lower than that calculated in this paper, particularly evident in silo-type caverns, which corroborates analysis. Interestingly, the factor of safety for a 60 m tunnel depth calculated by Kim’s method is very close to that for an 80 m depth calculated in this paper, suggesting that there is about a 20 m discrepancy between the two methods when calculating tunnel depths. Overall, the factor of safety decreases with increasing internal pressure, and this rate of decrease also slows down with increasing internal pressure. From the figures, it is evident that with an increase of 20 m in burial depth, the factor of safety for silo-type caverns significantly improves. This suggests that burial depth has a more significant impact on the stability of silo-type caverns, which is attributed to the substantial increase in the volume of the three-dimensional overlying conical rock mass as the burial depth increases. Assuming that the standard safety factor is set to 2.0 and the burial depth is 60 m, the ultimate pressures of tunnel type and silo type corresponding to the rock mass of Class I are roughly 30 MPa and 60 MPa, respectively; the ultimate pressures corresponding to the rock mass of Class II are 26 MPa and 49 MPa; and the ultimate pressures corresponding to the rock mass of Class III are 13 MPa and 30 MPa. It can be seen that the decrease in the ultimate pressure of the rock body of Class III is larger, which is due to the greatly decreased heaviness of Class III rock mass. In terms of burial depth, the silo LRC is a better choice. This can also be explained from a geometrical point of view. For the same depth of burial, the ratio of the volume and the surface area of the fracture surface to the area of the internal pressure acting on it are greater in the three-dimensional cone model than in the two-dimensional tunnel model. Therefore, it is more effective in resisting uplift forces.

5. Conclusions

This paper presents a method for assessing the stability of the overlying uplifted rock mass of lined rock caverns (LRCs). This method initially transforms the problem of finding potential fracture surfaces into an initial value problem of ordinary differential equations, based on the limit stress field and the Mohr–Coulomb failure criterion. Following this, a mechanical analysis is conducted on the uplifted rock mass using the identified fracture surfaces, converting the equilibrium equations into a form of stress integration. By introducing interpolation equations containing unknown coefficients, the number of equations is made equal to the number of unknowns, allowing for a solution. This method is applicable to both two-dimensional and three-dimensional problems, corresponding to tunnel-type plane strain issues and silo-type three-dimensional issues, respectively.
Using this method, potential fracture surfaces were solved for both tunnel-type and silo-type LRCs under three rock mass quality grades. The analysis indicates that the orientation of the fracture surfaces is significantly influenced by the horizontal geostress coefficient; the greater the horizontal geostress coefficient, the more the fracture surfaces tend to be horizontal. This implies that sites with a geostress coefficient greater than 1 should be prioritized when selecting locations for LRCs. The fracture surfaces are also affected by the internal friction angle, and this effect is related to the geostress coefficient. When the horizontal geostress coefficient is less than 1, a smaller internal friction angle causes the fracture surfaces to be more horizontal, while the opposite is true when the horizontal geostress coefficient is greater than 1. The impact of depth and cavern type on the fracture surfaces is relatively minor. When the horizontal geostress coefficient equals 1, the fracture surfaces of silo-type LRCs are nearly 45 degrees from the horizontal direction, while for tunnel-type LRCs, they are close to 52 degrees.
Based on the analysis of the fracture surface and assuming that the geostress coefficient is 1, the factor of safety of two types of LRCs with the same volume is calculated and analyzed for different depths of burial and different rock quality grades. The results show that the rate of increase in the safety factor increases with the increase in burial depth, and this phenomenon is more obvious in the silo-type LRC. For the same burial depth, the silo LRC is able to provide a greater ultimate pressure, so the silo LRC is more economical in terms of burial depth. The calculation results also provide some guidance for engineers to make quick decisions in site selection and preliminary design.
Based on the stress characteristics of lined rock caverns, the surrounding rock mass may experience tensile failure [25], which is not considered in this paper. Additionally, the failure of the sealing structure is closely related to the response of the surrounding rock, such as excessive deformation of the surrounding rock, which may not be related to the depth of burial. Although this paper does not consider the effects of cyclic loading, their impact objectively exists. Zhou [26] investigated the long-term stability of lined rock caverns and found that long-term failures occurred only within a 1-m radius from the cavern’s perimeter. This suggests that the impact of cyclic loading on the stability of the overlying rock mass is limited. Neglecting the effect of cyclic loading would cause this paper to overestimate the stability of the overlying rock mass. To compensate for the aforementioned unconsidered factor, it is possible to reserve a certain margin of safety by establishing appropriate safety factor control standards.

Author Contributions

Conceptualization, G.S.; methodology, Q.Y. and G.S.; software, Q.Y.; validation, Z.S., S.L. and H.L.; formal analysis, Q.Y.; investigation, Z.S.; resources, Z.S.; data curation, Q.Y.; writing—original draft preparation, Q.Y.; writing—review and editing, S.L. and H.L.; visualization, Q.Y.; supervision, G.S.; project administration, G.S.; funding acquisition, G.S. All authors have read and agreed to the published version of the manuscript.

Funding

This research was funded by the Natural Science Foundation of Hubei Province (Three Gorges Innovation Development Joint Fund) (Grant No. 2022CFD031).

Data Availability Statement

The original contributions presented in the study are included in the article, further inquiries can be directed to the corresponding author/s.

Conflicts of Interest

Author Zhen Shen was employed by the company China Dating Corporation Ltd. Ningxia Branch. The remaining authors declare that the research was conducted in the absence of any commercial or financial relationships that could be construed as a potential conflict of interest.

Abbreviations

    The following abbreviations are used in this manuscript:
CAEScompressed air energy storage
LRClined rock cavern

Appendix A

Algorithm A1 Solving for potential fracture surfaces (taking two dimensions as an example)
Require: mesh information mesh, stress field stress, initial crack point r 0 , step n
Ensure: potential fracture surface r 0 , r 1 , , r n
 1: p = r 0 // Current loop point
 2: i = 0
 3: while p in model do // The point is within the model boundary
 4:   i + = 1
 5:  Calculate the principal stress direction β at point p;
 6: // It can be calculated through the known stress field and mesh node information.
 7:  Calculate the crack direction s = [ cos β + Ψ ,   sin β + Ψ ]
 8:    p = p = n · s
 9:   r i = p
10: end while

References

  1. Kim, H.M.; Rutqvist, J.; Ryu, D.W.; Choi, B.H.; Sunwoo, C.; Song, W.K. Exploring the Concept of Compressed Air Energy Storage (CAES) in Lined Rock Caverns at Shallow Depth: A Modeling Study of Air Tightness and Energy Balance. Appl. Energy 2012, 92, 653–667. [Google Scholar] [CrossRef]
  2. Kushnir, R.; Ullmann, A.; Dayan, A. Compressed Air Flow within Aquifer Reservoirs of CAES Plants. Transp. Porous Media 2010, 81, 219–240. [Google Scholar] [CrossRef]
  3. Lutyński, M.; Bartela, L.; Smolnik, G.; Waniczek, S. Underground Coal Mine Workings as Potential Places for Compressed Air Energy Storage. IOP Conf. Ser. Mater. Sci. Eng. 2019, 545, 012014. [Google Scholar] [CrossRef]
  4. Zhang, Q.; Duan, K.; Jiao, Y.; Xiang, W. Physical Model Test and Numerical Simulation for the Stability Analysis of Deep Gas Storage Cavern Group Located in Bedded Rock Salt Formation. Int. J. Rock Mech. Min. Sci. 2017, 94, 43–54. [Google Scholar] [CrossRef]
  5. Zhang, G.; Zhang, H.; Liu, Y.; Wang, T.; Wang, Z. Surrounding Rock Stability of Horizontal Cavern Reconstructed for Gas Storage. J. Energy Storage 2023, 59, 106534. [Google Scholar] [CrossRef]
  6. Li, H.; Ma, H.; Zhang, H.; Shi, X. A New Evaluation System for Feasibility and Stability Analyses of Ultra-Large Salt Caverns Gas Storage. Rock Mech. Rock Eng. 2024, 1–17. [Google Scholar] [CrossRef]
  7. Perazzelli, P.; Anagnostou, G. Design Issues for Compressed Air Energy Storage in Sealed Underground Cavities. Rock Mech. Rock Eng. 2016, 8, 314–328. [Google Scholar] [CrossRef]
  8. Barton, N.; Monsen, K.; Chryssanthakis, P.; Norheim, Ø. Rock mechanics design for high pressure gas storage in shallow lined caverns. In Storage of Gases in Rock Caverns, Proceedings of the International Conference on Storage of Gases in Rock Caverns, Trondheim, Norway, 26–28 June 1989; Routledge: London, UK, 2022; pp. 159–165. [Google Scholar]
  9. Brandshaug, T.; Christianson, M.; Damjanac, B.P. Technical Review of the Lined Rock Cavern Concept and Design Methodology: Mechanical Response of Rock Mass; Itasca Consulting Group, Inc.: Minneapolis, MN, USA, 2001. [Google Scholar]
  10. Ghaly, A.; Hanna, A. Ultimate Pullout Resistance of Single Vertical Anchors. Can. Geotech. J. 1994, 31, 661–672. [Google Scholar] [CrossRef]
  11. Mandl, G. Mechanics of Tectonic Faulting: Models and Basic Concepts; Elsevier: Amsterdam, The Netherlands, 1988; pp. 391–401. [Google Scholar]
  12. Kim, H.M.; Park, D.; Ryu, D.W.; Song, W.K. Parametric Sensitivity Analysis of Ground Uplift above Pressurized Underground Rock Caverns. Eng. Geol. 2012, 135–136, 60–65. [Google Scholar] [CrossRef]
  13. Tunsakul, J.; Jongpradist, P.; Soparat, P.; Kongkitkul, W.; Nanakorn, P. Analysis of Fracture Propagation in a Rock Mass Surrounding a Tunnel under High Internal Pressure by the Element-Free Galerkin Method. Comput. Geotech. 2014, 55, 78–90. [Google Scholar] [CrossRef]
  14. Tunsakul, J.; Jongpradist, P.; Kim, H.M.; Nanakorn, P. Evaluation of Rock Fracture Patterns Based on the Element-Free Galerkin Method for Stability Assessment of a Highly Pressurized Gas Storage Cavern. Acta Geotech. 2018, 13, 817–832. [Google Scholar] [CrossRef]
  15. Tunsakul, J.; Jongpradist, P.; Kongkitkul, W.; Wonglert, A.; Youwai, S. Investigation of Failure Behavior of Continuous Rock Mass around Cavern under High Internal Pressure. Tunn. Undergr. Space Technol. 2013, 34, 110–123. [Google Scholar] [CrossRef]
  16. Jongpradist, P.; Tunsakul, J.; Kongkitkul, W.; Fadsiri, N.; Arangelovski, G.; Youwai, S. High Internal Pressure Induced Fracture Patterns in Rock Masses Surrounding Caverns: Experimental Study Using Physical Model Tests. Eng. Geol. 2015, 197, 158–171. [Google Scholar] [CrossRef]
  17. Thongraksa, A.; Punya-in, Y.; Jongpradist, P.; Kim, H.M.; Jamsawang, P. Failure Behaviors of Rock Masses around Highly Pressurized Cavern: Initiation and Modes of Failure. Tunn. Undergr. Space Technol. 2021, 115, 104058. [Google Scholar] [CrossRef]
  18. Perazzelli, P.; Anagnostou, G. Upper Bound Limit Analysis of Uplift Failure in Pressurized Sealed Rock Tunnels. Int. J. Numer. Anal. Methods Geomech. 2018, 42, 719–735. [Google Scholar] [CrossRef]
  19. Wang, H.T.; Liu, P.; Li, S.C.; Li, X.J.; Zhang, X. Limit Analysis of Uplift Failure Mechanisms for a High-Pressure Gas Storage Tunnel in Layered Hoek-Brown Rock Masses. Eng. Fail. Anal. 2022, 138, 106274. [Google Scholar] [CrossRef]
  20. Perazzelli, P.; Anagnostou, G.; Amberg, J. Uplift Analysis for CAES Tunnels. In Computer Methods and Recent Advances in Geomechanics; Oka, F., Murakami, A., Uzuoka, R., Kimoto, S., Eds.; CRC Press: Boca Raton, FL, USA, 2014; pp. 1691–1696. [Google Scholar]
  21. Bieniawski, Z.T. Engineering Classification of Jointed Rock Masses. Civ. Eng. 1973, 15, 335–344. [Google Scholar]
  22. Button, E.; Riedmüller, G.; Schubert, W.; Klima, K.; Medley, E. Tunnelling in Tectonic Melanges—Accommodating the Impacts of Geomechanical Complexities and Anisotropic Rock Mass Fabrics. Bull. Eng. Geol. Environ. 2004, 63, 109–117. [Google Scholar] [CrossRef]
  23. Hoek, E.; Brown, E.T. Practical Estimates of Rock Mass Strength. Int. J. Rock Mech. Min. Sci. 1997, 34, 1165–1186. [Google Scholar] [CrossRef]
  24. GB/T 50218-2014; Standard for Engineering Classification of Rock Mass. National Standard of the People’s Republic of China, Ministry of Water Resources of the People’s Republic of China: Beijing, China, 2014.
  25. Damasceno, D.R.; Spross, J.; Johansson, F. Rock Mass Response for Lined Rock Caverns Subjected to High Internal Gas Pressure. J. Rock Mech. Geotech. Eng. 2023, 15, 119–129. [Google Scholar] [CrossRef]
  26. Zhou, S.; Xia, C.; Zhou, Y. Long-term stability of a lined rock cavern for compressed air energy storage: Thermo-mechanical damage modeling. Eur. J. Environ. Civ. Eng. 2020, 24, 2070–2093. [Google Scholar] [CrossRef]
Figure 1. The working principle of CAES.
Applsci 14 03525 g001
Figure 2. The key problems and main structure of an LRC.
Applsci 14 03525 g002
Figure 3. The key problems and main structure of an LRC.
Applsci 14 03525 g003
Figure 4. The key problems and main structure of an LRC.
Applsci 14 03525 g004
Figure 5. Schematic diagram of the computational model: (a) tunnel-type; (b) silo-type.
Applsci 14 03525 g005
Figure 6. Schematic diagram of potential fracture surface solution.
Applsci 14 03525 g006
Figure 7. Influence of the coefficient of horizontal geostress on fracture initiation point [13,15].
Applsci 14 03525 g007
Figure 8. Potential fracture surfaces in different rock grades of tunnel-type LRCs: (a) Class I rock mass; (b) Class II rock mass; (c) Class III rock mass; (d) comparison of different rock grades (burial depth of 80 m).
Applsci 14 03525 g008
Figure 9. Potential fracture surfaces in different rock grades of silo-type LRCs: (a) Class I rock mass; (b) Class II rock mass; (c) Class III rock mass; (d) comparison of different rock grades (burial depth of 80 m).
Applsci 14 03525 g009
Figure 10. Potential fracture surfaces for different types of LRCs in the Class I rock mass (burial depth of 80 m).
Applsci 14 03525 g010
Figure 11. Potential fracture surfaces for different types of LRCs in the Class II rock mass (burial depth of 80 m).
Applsci 14 03525 g011
Figure 12. Potential fracture surfaces for different types of LRCs in the Class III rock mass (burial depth of 80 m).
Applsci 14 03525 g012
Figure 13. Variationin potential fracture surfaces with mesh and computational step for silo-type caverns overlying rock masses under Class III rock mass ( K = 0.5 ): (a) the number of mesh elements; (b) the computational step length.
Applsci 14 03525 g013
Figure 14. Factors of safety for tunnel- and silo-type LRCs under Class I rock at different burial depths.
Applsci 14 03525 g014
Figure 15. Factors of safety for tunnel- and silo-type LRCs under Class II rock at different burial depths.
Applsci 14 03525 g015
Figure 16. Factors of safety for tunnel- and silo-type LRCs under Class III rock at different burial depths.
Applsci 14 03525 g016
Table 1. The physical and mechanical parameters of different class rock masses.
ClassUnit Weight γ (kN/m3)Internal Friction Angel ϕ (°)Cohesion c (MPa)Deformation Modulus E (GPa)Poisson’s Ratio (-)
I>26.5>60>2.1>33<0.20
II>26.560~502.1~1.533~160.20~0.25
III26.5~24.550~391.5~0.716~ 6<0.25~0.30
IV24.5~22.539~270.7~0.26~ 1.3<0.30~0.35
V<22.5<27<0.2<1.3>0.35
Disclaimer/Publisher’s Note: The statements, opinions and data contained in all publications are solely those of the individual author(s) and contributor(s) and not of MDPI and/or the editor(s). MDPI and/or the editor(s) disclaim responsibility for any injury to people or property resulting from any ideas, methods, instructions or products referred to in the content.

