Abstract
Currently, the transmission system operators (TSOs) from Portugal and Spain do not procure a frequency containment reserve (FCR) through market mechanisms. In this context, a virtual power plant (VPP) that aggregates sources, such as wind and solar power and hydrogen electrolyzers (HEs), would benefit from future participation in this ancillary service market. The methodology proposed in this paper allows for quantifying the revenues of a VPP that aggregates wind and solar power and HEs, considering the opportunity costs of these units when reserving power for FCR participation. The results were produced using real data from past FCR market sessions. Using market data from 2022, a VPP that aggregates half of the HEs and is expected to be connected in the country by 2025 will have revenues over EUR 800k, of which EUR 90k will be HEs revenues.
1. Introduction
Although the European Commission approved guidelines in 2017 that aimed at the creation of balancing markets [1], in 2023, Portugal and Spain did not yet have a functioning FCR market [2]. The existing situation and a possible alternative can be described according to Figure 1, as follows.

Figure 1.
Problem formulation.
The non-existence of an FCR market in these countries implies that the costs that consumers pay regarding this service are not transparent and are probably inefficient due to the lack of competition. The only allowed balancing service providers (BSPs) of FCR in Portugal and Spain are conventional power plants (e.g., hydro, coal, natural gas). Besides not being a market subject to open competition, the BSPs are providing an FCR as a mandatory and non-remunerated service. On the other hand, as renewable energy generators, hydrogen electrolyzers (HEs) could become BSPs and generate additional revenues in the FCR market that would complement their main sources of revenues (by selling energy and hydrogen, respectively). While these actors might be interested in providing an FCR, they are naturally against providing this service if they cannot profit from it. They end up not constituting the critical mass that is needed for opening up a new FCR market. It is up to regulators of both countries to either keep this situation or to open up this sector to transparent market mechanisms. There are at least three ways for the regulator to ensure the existence of an FCR market: either a national market is created in each country, an international market with these two countries is created (like the present-day energy market), or these countries integrate an existing and wider international market. This study explored the latter option.
1.1. FCR Cooperation
The FCR Cooperation is an international market that is presently open to nine European countries [3]. In general, it is expected that such a market integration is a benefit for the participants, which can share resources in a wider market, leading to market efficiency. Since Spain’s bordering country (France) already participates in this market, Portugal and Spain may aspire to integrate it in the near future. Spain and Portugal’s transmission grids are operated by different TSOs; therefore, each of them would join the FCR Cooperation as a separate entity. BSPs from the participating countries provide supply bids to the FCR Cooperation, whereas TSOs demand them to ensure that the system frequency stability is kept close to 50 Hz. The product traded in this day-ahead market is valid for 4 hours; therefore, there are six daily market sessions.
According to the market rules [3], in this market, there is an international price, called the “cross-border marginal price” (CBMP), and in each country, there is a “national” local marginal price (LMP), which may or may not differ from the CBMP, as follows. For each country participating, there is a minimum and maximum aggregated volume [MW] of bids from BSPs that can be accepted in the process of market clearing. These are known as the “core” and “export limit” constraints, respectively: the maximum is due to the interconnection capacity and the minimum ensures that all countries participate to solve the frequency deviations (which affect all of the interconnected area).
If the aggregated volume of accepted bids from BSPs from a country is not hitting any constraint (“hitting a constraint” means that the aggregated volume of BSPs from a country is exactly equal to the “core” or “export limit” of that country [3]), the LMP in this country equals the CBMP. In case the sum of the accepted bids from the BSPs of a given country hits the “core” constraint, the local marginal price (LMP) in that country will be the price of the last bid, which will be higher than the CBMP; conversely, if the “export limit” constraint is hit, the LMP in that country is lower than the CBMP. The CBMP is the most expensive bid accepted in the session in a country where no constraints are hit.
1.2. FCR Activation and VPP Participation
The units participating in the FCR have a local controller that, according to the frequency of the grid, increase or decrease the output of the controlled unit. The basics behind an FCR can be explained using Figure 2 as an example.

Figure 2.
Example of a frequency variation and the need for FCR upward and downward activations.
When the frequency falls below 50 Hz (underfrequency), this means that the load in the system is greater than the generation, hence upward reserve activation (i.e., increase in generation) is required. The opposite is also true and results in downward reserve activation. According to [4], the FCR reserve activation is proportional if the frequency deviation is ±200 mHz; when the frequency deviation from 50 Hz is higher than ±200 mHz, the full reserve should be activated. Taking this into consideration and using the frequency variation presented in Figure 2, the output of a BSP unit (e.g., a combined cycle gas turbine power plant) reserving 5 MW for an FCR would be the one presented in Figure 3. Since the plant in the example has a maximum capacity of 100 MW, in order to provide 5 MW of upward reserve, this means that at the nominal frequency, the plant can provide a maximum of 95 MW for the energy market, thus reserving 5 MW of headroom for the FCR market. In this case, reserving this headroom for the FCR market means that the plant is permanently missing the opportunity to sell these 5 MW to the energy market. This missed opportunity represents an opportunity cost.

Figure 3.
Active power response to frequency variation and concept of headroom.
Currently, in the FCR Cooperation, only symmetric bids are accepted, meaning that when a bid of, e.g., 5 MW is accepted, the BSP must guarantee that when the FCR is activated, it can provide up to 5 MW downward and upward depending on the frequency value. The FCR Cooperation does not remunerate the activated energy; only the accepted power is remunerated.
The VPP envisioned in this paper has three components: solar units, wind units, and HEs. The first hybrid power plant in Europe that includes solar and wind farms and will include HEs in the future is presented in [5]. Technically, if the resources are available, it is possible to control the output of all of these units to allow for FCR provision, as shown for wind farms [6], solar units [7], and HEs [8].
Each component of the VPP is capable of both upward and downward reserve provision. The real-world demonstration of both upward and downward FCR provision of a 300 MW solar unit is presented in [9]; instead of operating at an estimated available peak power, the plant reserves 30 MW headroom, like the previous comments about Figure 3 emphasize. Of course, with no headroom, only downward provision will be possible for wind and solar units; on the other hand, with no headroom, an HE can provide only upward reserve.
As shown in Figure 3, reserving headroom leads to opportunity costs. The contradiction is the following: reserving headroom allows for FCR provision but also diminishes the potential revenues of a solar unit on the energy market. It should be taken into account that the main purpose of a solar unit is to deliver energy to the grid on the energy market; similarly the HEs take energy from the grid mainly to produce hydrogen that is sold on the hydrogen market. FCR provision should be seen as an additional revenue for these units. The fact that FCR needs to be delivered as a symmetric product encourages the aggregation of solar and wind units that are solely downward providers with HEs that are only upward providers because the headroom is avoided completely for each of the components when they are aggregated. This is the aggregation proposed in this paper, which is done through a virtual power plant (VPP).
The concept of the VPP downward reserve provision is illustrated in Figure 4, still using the frequency evolution presented in Figure 2.

Figure 4.
VPP downward reserve provision and associated opportunity costs.
Likewise, the HE upward reserve provision is illustrated in Figure 5.
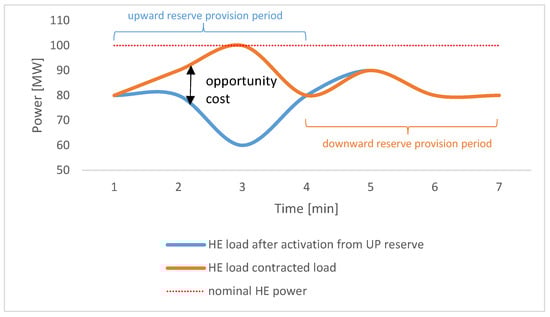
Figure 5.
VPP upward reserve provision and associated opportunity costs.
From these examples it can be concluded that opportunity costs may be occurring in every instant for the VPP as a whole, but only half of the time for each of its participants, allowing them to operate with no headroom. It must be taken into account that this example has extreme variations in the frequency for demonstration purposes, but in reality, the frequency is closer to 50 Hz most of the time, allowing the VPP participants to dedicate their units to the energy market in normal conditions and only incur opportunity costs when contingencies happen. One relevant question that arises is, thus, what is the volume of opportunity costs in this case? To answer this question, it is necessary to assess the usage of upward and downward reserves in existing grids. For instance, the data from three years of market sessions in France spanning data from mid-2020 to the end of 2022 [10] is organized from the highest to lowest percentage of reserves activated in Figure 6. The value read on the y-axis is the ratio between the activated energy (MWh) to the contracted power (MW) of the upward/downward reserve. This plot shows that the maximum value of either upward and downward reserves that were measured was around 40% and the minimum was close to 0%. The average and mean values were around 10%. Whether this small percentage translates into low or high opportunity costs for participants in a VPP was one of the motivations behind this study.

Figure 6.
Percentage of upward and downward reserves used in France.
1.3. Motivation, Literature Review, and Paper Organization
As previously mentioned, eventually Portugal and Spain may consider joining the FCR Cooperation. The present study was motivated by the following:
- Potential BSPs are interested in assessing the order of magnitude of revenues. This is currently not known because the FCR in Portugal and Spain is mandatory and not remunerated. BSPs will be able to assess how much this market is potentially worth.
- A VPP including HEs and wind and solar plants is a particular case of the previous point and this study adopted this point of view.
- Assessment of opportunity costs of the VPP have to be taken into account.
The identified literature gap is now briefly outlined. From the broader to the most concrete, the main topics of interest for the present study were (1) the economic analysis of ancillary services provision by DERs; (2) the context of the FCR Cooperation; (3) focusing aggregation via VPPs; and, especially, (4) the participation of HEs. Although all these topics were previously addressed separately, it was found that no study covered them all.
Topic (1) consists of a vast and growing body of work: the interested reader is directed to the review presented in [11], which classified over 60,000 works about ancillary services provision by DERs, and concluded that around one fifth of the recent studies addressed scheduling, particularly bidding strategies on balancing markets. However, the particular market of topic (2) is much less covered; an example would be [12], where electric vehicles FCR provision is analyzed from a policy-making perspective; this paper also covers topic (3) as it deals with aggregation. Still on topic (3) but from a more technical perspective, [2] addressed the prequalification process of aggregation. The participation of VPPs in the FCR Cooperation is already a reality: NextKraftwerke claims to be the largest VPP operating in Europe and participates in this market [13].
Covering topics (1) and (4), [8] proposed a techno-economic analysis for FCR provision in Belgium using a 25 MW HE. Regarding these topics, this paper is the literature case that comes closer to the aims of the present paper. The authors [8] used a dynamic model for the HE, where the HE power consumption depends on the grid frequency. However, the opportunity costs implied in the participation of HEs in the FCR market were not analyzed in this study since they are implicit in the results. Another difference between this and the present paper is the fact that in [8], the HEs consumed electricity procured in the energy market, whereas the present study assumed that power purchase agreements were used. Furthermore, [8] used the Belgian case with four distinct FCR products, whereas the present study proposed the context of FCR Cooperation, which is a simpler market with a single product. Finally, no aggregation via VPP was proposed in [8]. The present work expanded on a previous study of the authors [14], which covered topics (1) to (4), but did not include opportunity costs in the analysis.
2. Methodology
The methodology is represented Figure 7. The main aim was to compute the VPP revenues obtained by participating in the FCR Cooperation and taking into account the opportunity costs of solar, wind, and HEs. This was done by changing a set of user-defined variables. As earlier mentioned, the present study represents an expansion of a previous study [14], where only part 1 of the methodology was applied and opportunity costs were not included.

Figure 7.
Methodology.
The model presented in this section uses a set of parameters and user-defined variables outlined in Table 1. The model’s implementation is available in a downloadable spreadsheet on the Zenodo platform [15].

Table 1.
Model inputs, user-defined variables (udvs), and outputs.
The set t represents the tender (or market session) number, ranging from 1 to 5460, while set c refers to the country (Portugal, Spain). Although this study only focused on two countries, it could be readily extended to explore additional countries, offering a platform for investigating further integration within the FCR Cooperation. Each tender (t) in the FCR Cooperation spanned a duration of four hours, serving as the time-step for the model.
The approach can be outlined through the following parts and steps:
Part 1—Without opportunity costs: VPP potential revenues were computed in this first part. In [14], this part of the methodology was addressed in detail. The VPP potential revenues were computed by considering that the VPP operated at zero opportunity costs in order to assess what revenue the VPP would have in the tender, disregarding the costs it needs to pay in order to attract HE, wind, and solar plants in the FCR market participation.
- Wind and solar generation time series—The wind and solar production taking place in period t in country c, denoted as , was presumed to be known and is provided here as a parameter.
- HE demand—The demand of HEs () was likewise treated as a parameter that was dependent on the parameter . Specifically, it is zero when is below the user-defined variable . Subsequently, it increases linearly until it reaches the installed HE installed capacity () when surpasses the user-defined variable , as outlined in Equation (1). The intuition for and is the following: if in a given hour, the renewable energy generation is small, no hydrogen is generated, and if there is a high renewable energy generation, the hydrogen electrolyzers work at full capacity. This is in line with the strategic objectives of the European Commission in ensuring that the hydrogen generated with grid connected electrolyzers work more during hours with more renewable generation. As for the values of and , they were found after analyzing the time series for renewable energy generation in each country and adjusting Hmin and Hmax such that the capacity factors of HEs (Table A1 and Table A2) would be at least 50%.
- VPP downward capacity—The share of downward reserve that can be supplied by solar and wind power under the VPP, which is denoted as , was determined by the product of and two coefficients. The first coefficient, i.e., , signifies the proportion of solar and wind units contracted by the VPP (e.g., 1% of the total solar and wind units). The second coefficient, i.e., , represents the reserve margin for which these units are available for FCR provision (e.g., 5%, ensuring that a minimum of 95% of the generated power at any given moment is reserved for the energy market). This relationship is expressed in Equation (2).
- VPP upward capacity—The share of upward reserve that can be supplied by the HEs under contract with the VPP, which is denoted as , was determined by the product of and . Similar to , signifies the reserve margin, representing the availability of these units for FCR provision. This relationship is expressed in Equation (3).
- Symmetric price-taker bid—Given that the bids need to be “symmetric”, meaning that they have the same size of upward and downward capacity, the proposed bid size, which is denoted as , was determined as the minimum among the upward capacity, downward capacity, and the demand of the TSO (), as outlined in Equation (4). The term “price-taker” implies that is offered at a low price, ensuring its acceptance and payment at the international price .
- FCR Cooperation bids—It was assumed that the existing bids (both demand and supply) from actual market sessions were already known. The value of is the result of these market sessions, and the “price-taker” strategy of the VPP does not alter it. This is because, given the balanced state of the country, the international price (CBMP) is already established and known.
- Market outcome—The VPP potential revenues, i.e., , were computed according to Equation (5).
Part 2—Computing opportunity costs: These refer to the participation of HE, solar, and wind plants in the FCR.
- FCR downward/upward time series—The values of energy activated by the downward and upward FCRs in France in the period t, i.e., and , respectively, were retrieved from [10].
- Downward/upward energy—It was assumed that the values of the energy activated by the upward and downward FCR bids, i.e., and , respectively, were known and proportional to the ones in France and to the submitted VPP bid capacity , as per Equations (6) and (7). This means that these values were model inputs, which in reality, would be impossible to forecast, although Figure 6 gives us average and standard deviation values, which would be useful for the VPP bidding strategy.
- Energy market price—The average energy market price in the period t, i.e., , was assumed to be known and was retrieved from [16].
- Downward opportunity cost— represents the cost of , which is essentially wind and solar energy that is not sold in the energy market due to being reserved for FCR. This potential (“potential” because only when the VPP naturally participates in the tender (decided in part 3 of the methodology), does this opportunity cost exist) cost was computed using Equation (8).
- HE power purchase agreement (PPA) price ()—It was assumed that HEs will operate with electricity procured via the PPA instead of the energy market [17]. The levelized cost of energy was assumed to be the low end of values for solar and wind energy found in [18], and thus, the was assumed to be 27 EUR/MWh.
- Cost of avoided energy consumption by HE—The upward energy required by the FCR, i.e., , comes from energy not consumed by the HEs. Therefore, the cost of this avoided energy, i.e., , was computed according to Equation (9).
- Amount of non-produced H2— was computed according to Equation (10), where the parameter stands for the efficiency parameter assumed to be 50 kWh/kg [19].
- Upward opportunity cost— was computed according to Equation (11). The opportunity cost in this case is the missed opportunity of selling hydrogen that would have otherwise been produced if the HEs would consume , discounted by the price that the energy would have cost. here stands for the hydrogen remuneration, which was assumed to be 2.8 EUR/kWh. This value came from the European Commission assessment of the costs of blue hydrogen in 2021 [20]; therefore, here it was assumed that “green hydrogen” was remunerated exactly as “blue hydrogen” in the hydrogen market instead of somehow being subsidized.
- Sum of opportunity costs—Upward and downward costs were added, as per Equation (12).
Part 3—Decision: Here, the decision refers to the VPP participation or not in the FCR Cooperation tender t.
- Comparison of potential revenue and opportunity costs—Put simply, if the potential revenue is lower than the opportunity costs, this means that the VPP would be losing money in the market FCR session; therefore, the logical decision is not to participate, in which case, the binary decision variable would be 0, as per Equation (13). If the VPP participates in the market session, the potential revenue becomes a revenue, as per Equation (14).
- UPw revenue share—One assumption of this study was that the HE owner would be happy to earn at least as much in the FCR market as it would in the hydrogen market; therefore, according to Equation (15), the UPw reserve share equals the respective opportunity costs. Naturally, if the VPP does not participate in the market tender, , and the opportunity costs are null.
- DNw revenue share—Likewise, the solar and wind plants receive their revenue share , according to Equation (16).
- VPP revenue share—The VPP owner, after paying both the upward and downward providers, reserves the remaining revenue for itself, according to Equation (17). This value can be understood as a profit of the VPP.
The inputs, user-defined variables, and outputs are given in Table 1. “Inputs” refer to the given data, whereas “user-defined variables” can be changed in the spreadsheet to achieve different “outputs”. The results presented for the scenarios thus result from different values of “user-defined variables”.
All the variables from Table 1 were assumed to be static over the years.
was 380 MW in Spain and 50 MW in Portugal as in 2021 [21]. was obtained from Equation (1) and depended on the inputs and user-defined variables.
The information related to FCR Cooperation () spanning the period from 1 July 2020 to 31 December 2022 was acquired from [22]. Data preceding this date, which involved a single daily tender, was excluded, as it was deemed less suitable for a VPP. VPPs require greater granularity in bids due to the substantial variability in renewable energy generation throughout the day. The initial data cleansing step involved eliminating the second tender. The decision to remove these 121 data points was based on the consideration that only certain TSOs participate in such tenders.
Furthermore, data from certain instances where a TSO did not submit demand bids were excluded. Specifically, during the period from 27 June 2022 to 30 June 2022, discrepancies were observed in the data, as most countries seemed to be importing their entire demand without other countries compensating for this. Following the data-cleansing process, there remained 5455 data points.
The information pertaining to wind and solar generation () was acquired from [16]. The acquired values were provided at an hourly resolution. In order to align with the market data, it was imperative to resample the data to a 4 h time-step while preserving the lowest value in the series to ensure the activation of the bid in the worst-case scenario.
The progression of the monthly average CBMP is depicted in Figure 8. Notably, in the year 2021, the CBMP experienced a nearly tenfold increase. As the TSO demand is inelastic, this implies that the aggregated BSP revenues inevitably escalated in tandem with this proportion.

Figure 8.
Monthly average values of the CBMP.
2.1. Scenarios
The scenarios examined in this study were formulated by employing distinct values for user-defined variables outlined in Table 1, and they are detailed in Table 2.
Table 2.
Scenarios used in simulations.
The main difference between the scenarios was the installed capacity of HEs. Portugal has committed to installing 2 to 2.5 GW of HEs by 2030 [23], whereas Spain has committed to 4 GW [24]. This study investigated this scenario (Scenario 3 “pledged” 2030), as well as two scenarios (1 and 2), assuming that by mid-decade, only a small part (5–10%) of the 2030 targets were achieved. refers only to HEs producing electricity-based hydrogen: it was assumed that by 2030, 50% of the installed HEs were grid-connected. For scenario 3, the time series of wind and solar energy generation, i.e., , was increased proportionally to the expected increase in solar and wind power in both countries in 2030 [25,26]. The assumption was made that both and were set at 20%.
2.2. Assumptions and Limitations
An assumption was made that Portugal and Spain were in balance, with no imports or exports. Note that the remaining countries had imports and exports based on the available data, and the local marginal prices (LMPs) may differ from CBMP in these cases; however, such variations did not impact the calculations in this study.
Following the market rules outlined in Section 1.1, under these circumstances, either of these countries hit the core and export constraints, and their local marginal prices aligned with .
Naturally, if it was the case that Portugal and Spain were exporting and hitting the “export limit” constraint in a given period, LMPs would be lower than the assumed CBMPs and the TSO costs would also be lower. But since there are no FCR market data in the past for Portugal and Spain, making a different assumption from the one that was made is intrinsically difficult. Note that this also impacts BSPs: Equation (5) stated that BSPs profits are also proportional to the LMP; therefore, if the tendency would be that BSPs from Portugal and Spain to have consistent scarcity of bids, the VPP would have higher revenues than analyzed in the remainder of this study; conversely, if abundance was the rule, lower profits would be achieved. Another important limitation was the assumption that the CBMP is known in advance; naturally, the VPP would have to forecast it, compute opportunity costs based on forecasts, and decide to participate or not in the market sessions.
Further limitations existed relative to the VPP, as follows. The first one was related to the the assumption that in the day ahead, the energy that will be demanded by the HEs is known in advance. Note that this value is proportional to the generation from solar and wind at the national level, which nowadays can be predicted with somewhat good accuracy in the day ahead. The lowest value of the four hours (duration of FCR product) of renewable generation is chosen in the proposed methodology (see in the methodology); therefore, it could be said that the HE demand, and hence, the bid size, is conservative. Another limitation was that there was a single VPP operating in each country. It is well known that increasing market competition drives down profit margins, but the investigation of multiple VPPs lay outside the scope of this study.
It was also assumed that the FCR upward and downward energy activations ( and ) were known in advance; this directly influenced the computation of opportunity costs. Although, as stated, it is known that these values are, on average, 10% (Figure 6), the VPP would probably incur higher opportunity costs in some periods and less in others than what was computed, but this value cannot be accurately forecasted in the day ahead in any sense since this depends on imbalances occurring in real time. Also, the market price for hydrogen was assumed to be known and static.
All the presented limitations in this section would contribute, most likely, to the VPP bids being submitted more cautiously than anticipated in the remainder of the study.
3. Results
The results related to VPP participation in the market are presented in Table 3. Note that the results are split according to the intermediate steps corresponding to each part of the methodology (Section 2). For the disaggregated results per country and year, consult the tables in Appendix A. For the results of each day of the available data, refer to the provided tool at [15].
Table 3.
Results for the available data (mid-2020 to the end of 2022). Note that the results are divided in the three phases of the methodology (Section 2). For the disaggregated results by year, consult the tables in Appendix A.
A brief interpretation of Table 3 is now presented using the figures regarding Scenario 1—“pessimistic” 2025 in Portugal for illustration. Note that the results in Table 3 are aggregated for all the available data, comprising the period between mid-2020 and the end of 2022.
For this period, if the VPP was to participate in the market while disregarding the opportunity costs (part 1 of methodology), it would have participated (with at least a 1 MW bid) in 87% of the market sessions and would have covered 10% of the country’s FCR needs (in this case, the remaining 90% were necessarily covered by the competing “conventional” BSPs). The VPP potential revenue would have been over EUR 2M.
Regarding the second part of the methodology, the sum of the upward and downward opportunity costs were computed, and it was found that such costs would have represented about 80% of the VPP potential revenue, which, when aggregated, was a very large percentage.
The third part of the methodology was the decision taken by the VPP whether to participate in each particular market session, informed by the associated opportunity costs associated with participation for that tender: this naturally led to a decrease in the number of sessions that were participated in. Concretely for the illustrative case, the VPP ended up participating in 62% of the market sessions (instead of the 87% computed in part 1), covering 6% of the total country’s FCR needs (instead of 10%). The VPP revenue ended up being over EUR 1.5M, which was about 75% of the . Since the VPP did not participate in the sessions where the opportunity costs exceeded the potential revenue, the shares of the revenues of the upward and downward providers, i.e., and , respectively, were considerably smaller than the opportunity costs computed in part 2 of the methodology. As a result, the VPP revenue was distributed as follows: about 13% to the upward providers (HEs), 37% for the downward providers (wind and solar), and the remaining 50% for the VPP itself. Considering the particular year of 2022, in this scenario, the HEs would have an annual revenue of over EUR 91k, as shown in Appendix A.
As for other indicators, the capacity factor (the “capacity factor” is normally understood as a ratio, e.g., between the generation (or load) in relation to its nominal value: for instance if the average load of the HE in one year is 500 MW and the installed capacity is 1000 MW, then the capacity factor is 50%) of the hydrogen electrolyzers in this case would be 56%. It was previously said that is a user-defined variable that was also a result. In this case, the outcome was such that the VPP would need to control as little as 3% of the total installed solar and wind power in the country to assure the downward reserve provision. This is further discussed in Section 4.
One note regarding the differences between Portugal and Spain. Take into account that in scenario 1, the HE installed power was four times greater in Spain than in Portugal. For this case, the Portuguese VPP would cover more FCR share and participate in more market sessions than the Spanish one, but overall, the monetary values in Spain were close to five times higher than in Portugal.
The observation from Figure 9 suggests that the monthly aggregated revenues for the VPP were notably comparable between Portugal and Spain, differing primarily in magnitude with only a few months showing distinctions. However, Figure 10 illustrates that the distribution of bids per hour was not identical between the VPP in Portugal and the VPP in Spain. Upon examination, it was determined that, for example, in Portugal, there was a slightly higher proportion of bids in the 04-08 period ( is the designation for the product in the existing FCR Cooperation, representing the time from 4 to 8 AM). The average higher CBMP for the 04-08 product suggests that the revenues in Portugal were marginally greater than those in Spain during this time of day, as depicted in Figure 11. Figure 12 indicates that the monthly average market share of the VPP in Portugal and Spain exhibited only slight differences, except the scale.

Figure 9.
VPP monthly revenue in scenario 1. Used data from scenario 1.

Figure 10.
Distribution of VPP cleared volume per product. Used data from scenario 1.

Figure 11.
VPP revenues per product. Used data from scenario 1.

Figure 12.
VPP monthly market share. Used data from scenario 1.
The plot in Figure 13 shows the data aggregated per month regarding VPP non-participation in market sessions (due to opportunity costs being higher than VPP potential revenue), along with the energy market and FCR market prices. It can be concluded that energy prices increased more than the FCR market prices, but over time, there was no strong tendency of either more or less participation in the market due to higher opportunity costs.

Figure 13.
Number of market sessions each month in which VPP did not participate and its relation to energy and FCR prices. Used data from scenario 1.
Figure 14 shows the upward and downward bid components organized from the highest to the lowest for all the available data (From Figure 7, note that the bid size was the minimum value between the upward and downward components). It was clear that increasing the upward bid component (by increasing ) would push the blue curve to higher values but would result in the same bid size because, according to Equation (4), the bid size was limited by the lowest value of the two curves. The bid size, which was limited by its upward capacity, was equal to for around 20% of the tenders.

Figure 14.
VPP bid size components per hour (organized from highest to lowest in the series). Used data from scenario 1.
4. Discussion
In this study, it was assumed that Portugal and Spain joined the FCR Cooperation. Drawing upon a set of assumptions and historical FCR market data, we computed the revenues of a VPP that aggregated solar and wind generation with HE demand, along with the shares of revenues distributed among the VPP participants. Technical questions about the dispatch of existing sources within the VPP perimeter were left outside the scope of the study. For instance, suppose that in real time, it was required for the VPP to activate 1 MW of downward reserve; this leads to the question of where will this 1 MW come from. It is the VPP’s task to decide whether this 1 MW will imply the reduction of production from one single wind turbine or from a whole solar farm. Such a problem is already faced by VPPs, such as the one in [13]; therefore, it was assumed that VPPs already possessed knowledge about the best way to solve the real-time dispatch.
Note that in the present analysis, the hydrogen price was kept constant, but it was in itself a source of uncertainty. If the hydrogen price was very large, upward reserve reserve activation implies that the electrolyzers decreased their energy consumption and, therefore, hydrogen production; this led to high opportunity costs.
A critical assumption about the VPP was that it participated in the market sessions as a price-taker. This implies that when the VPP chose to submit a bid, it did so with a price below the CBMP so that the bid was accepted. This limitation is noteworthy, as the CBMP is not known in advance. A comprehensive assessment would necessitate access to the strategies employed by other BSPs. Understanding their bidding strategy, encompassing both prices and volumes, is essential for forecasting CBMPs and LMPs. As mentioned by [27] regarding energy markets, due to the simplicity of model implementation, the common assumption was that producers could not impact the market-clearing price with their bids. These market agents are “price takers”, like the VPP of the present paper, which bids at zero price to ensure it was cleared. However, if the VPP presents a large portion of the bids, it will have an impact in the market-clearing price [27]: the market-clearing price would be lower because some of the more expensive bids would not be accepted. In this case, the revenue of the VPP itself would be lower, as it is proportional to the market-clearing price, as per Equation (5).
Recognizing the limitation inherent in this approach, it is essential to emphasize that the obtained results are likely more realistic when the installed capacity of hybrid energies (HEs) is minimal, exerting minimal influence on the market dynamics. Specifically, in a pessimistic scenario where only 50 MW of HEs were installed in Portugal by 2025 (scenario 1), and if these were incorporated into a VPP contracting only 3% of the total installed wind and solar power (), considering a 20% share for both upward and downward reserves (), the anticipated revenue for an entire year (at 2022 prices) amounted to EUR 844k.
Figure 14 indicates that approximately 20% of the time, the bid size was constrained by . A larger value for would allow for a higher bid size, as there was ample wind and solar power available to support an increased bid (as noted by the blue curve being above the orange curve). This underscores the assertion made in Section 2 that is not just a parameter but also an outcome. In scenario 1 for Portugal, was set at 3%. Importantly, increasing the value of this parameter would not impact the VPP bid size since the constraint lay on the HE side, specifically in the upward reserve. Certainly, if exceeded 20%, the VPP could increase its revenues without a substantial increase in the contracted amount of downward reserve from solar and wind. The activation of reserves might potentially affect the longevity of HE stacks. Exploring this trade-off constituted a potential avenue for future research.
The results in Portugal and Spain naturally differed in magnitude because Spain has a significantly higher population; more renewable energy generation; and, in the future, more hydrogen electrolyzers are expected to be installed there. Therefore, the results reflect this magnitude difference. The shape of the revenue curve in Figure 9 resembles the CBMP in Figure 8. This serves as a reminder that if the input data included CBMPs from before 2019, the VPP revenues would probably be lower than those computed here due to the proportionality outlined in Equation (5). Similarly, to compute future CBMPs, it is necessary to evaluate the evolution of exogenous variables, like the price of natural gas, the changes in the EU Emissions Trading System, and other factors that render long-term forecasts unpredictable (such as current geopolitical events, like the war in Ukraine). An assumption made in this study was that the components of the VPP (wind, solar, and hybrid energies (HEs)) would be inclined to participate in the VPP if it precisely covered the opportunity costs. Therefore, the values of the revenue share for these components, namely, and , should be interpreted attentively. If these entities were to demand revenue from the VPP that surpassed the opportunity costs, the VPP would participate in fewer market sessions, resulting in lower revenue. Conversely, if the VPP was managed directly by the owners of hybrid energies (HEs) and wind/solar parks, the revenue share of the VPP, denoted as , would be distributed among these units and could be higher than the provided values of and .
5. Conclusions
This study investigated the integration of Portugal and Spain in the existing FCR cooperation and answered the following question: what would be the revenues of a VPP aggregating wind and solar units along with HEs in this market? In responding to this inquiry, the applied methodology facilitated the computation of the bid size of the VPP while accounting for opportunity costs. The VPP optimally reduced its opportunity costs by strategically combining units that provided downward reserve (wind, solar) with units that provide upward reserve (HEs), thus avoiding the need to reserve headroom. The results show that the opportunity costs were higher than possible revenues in some market sessions, and thus, the VPP refrained from participating in such sessions.
The model relied on actual market outcomes from the Frequency Containment Reserve (FCR) Cooperation and verified data on renewable energy generation during the period 2020–2022. In this study, it was assumed that each country was in a state of balance (not importing nor exporting), meaning it did not encounter constraints within the FCR Cooperation, and consequently, maintained the LMPs equal to the CBMPs.
A prior analysis of the evolution of CBMPs showed that prices have increased over the years. This means that over the years, the VPP would increase the revenues proportionally. Although, here it was assumed that the CBMPs were known in advance, in reality, they would need to be forecasted. A noteworthy conclusion was that exogenous variables, such as natural gas prices, carbon pricing, and even market strategies employed by BSPs, pose challenges in assessment, rendering the precise computation of future CBMPs complex. Note that the forecasting would take place in the day ahead; it is likely that the natural gas and carbon pricing would be easy to forecast because variations would tend to be minimal in this time frame. More complex would probably be the understanding of market competitors’ strategies. This is basically the same forecasting problem that market competitors face in the day-ahead energy market.
Three scenarios were formulated to calculate the VPP revenues. For example, even under conservative estimates for HE installation, a Portuguese VPP aggregating 50 MW of HEs and a mere 3% of the existing wind and solar generators, each operating with a 20% reserve margin, could potentially generate annual revenues exceeding EUR 800k (based on the assumed 2022 CBMPs). The work previously published, without opportunity cost consideration, would lead the VPP to participate in 87% of the market sessions [14], whereas its computation (the main gap covered by this study) resulted in market participation dropping to 64%. Taking opportunity costs into account, the HEs in this specific case would receive over EUR 90k.
In an alternative scenario, taking into account the projected HE installation targets set by Spain for 2030, along with the forecasted additions of new wind and solar power capacity, the VPP could cover 58% of Spain’s FCR requirements and generate revenues circa EUR 31M. This figure needs to be read carefully, as a limitation of this study arose from certain assumptions: the VPP was assumed to participate in the market as a price-taker, and we presumed that the CBMP was pre-determined and unaffected by the bid size of the VPP. In the event that the VPP was to encompass 60% of the FCR, it would transition to a price-maker role, potentially leading to a reduction in the LMP in Spain due to market splitting for a substantial portion of the year. Consequently, this could diminish the profits of the VPP.
It is acknowledged that the variables and utilized in this context can theoretically be elevated, leading to a potential increase in the virtual power plant (VPP) bid size, opportunity costs, and possible heightened degradation of the HE stack. Therefore, a subject for future investigation involves exploring the trade-off between the VPP bid size, revenues, opportunity costs, and the values associated with the variables and .
Author Contributions
F.J.R.: investigation, conceptualization, methodology, software, writing—original draft preparation, visualization, and funding acquisition. J.A.P.L.: validation, writing—review and editing, supervision, and funding acquisition. F.J.S.: validation, writing—review and editing, supervision, and funding acquisition. A.G.M.: validation, writing—review and editing, supervision, and funding acquisition. All authors read and agreed to the published version of the manuscript.
Funding
The work of Fernando Ribeiro was supported by FCT/MCTES/Portuguese Republic under the grant SFRH/BD/151414/2021, which was under the MIT Portugal Program. This article was co-financed by Component 5—Capitalization and Business Innovation, which was integrated in the Resilience Dimension of the Recovery and Resilience Plan within the scope of the Recovery and Resilience Mechanism (MRR) of the European Union (EU), framed in the Next Generation EU, for the period 2021–2026, within project ATE, with reference 56.
Data Availability Statement
As stated in Section 2, the model’s implementation is available in a downloadable spreadsheet on the Zenodo platform: [15].
Conflicts of Interest
The authors declare no conflicts of interest.
Appendix A
Table A1.
Results for Portugal, disaggregated by year.
Table A1.
Results for Portugal, disaggregated by year.
| Scenario | Scenario 1 “Pessimistic” 2025 | Scenario 2 “Expected” 2025 | Scenario 3 “Pledged” 2030 | ||||||
|---|---|---|---|---|---|---|---|---|---|
| Year | 2020 | 2021 | 2022 | 2020 | 2021 | 2022 | 2020 | 2021 | 2022 |
| Part 1: Without opportunity costs | |||||||||
| Market sessions VPP participated in | 87% | 88% | 87% | 91% | 91% | 99% | 92% | 92% | 91% |
| FCR covered by VPP | 10% | 10% | 11% | 20% | 21% | 22% | 75% | 77% | 76% |
| EUR 173.5k | EUR 805.1k | EUR 1.1M | EUR 357.6k | EUR 1.7M | EUR 2.3M | EUR 1.3M | EUR 5.9M | EUR 7.7M | |
| Part 2: Opportunity costs | |||||||||
| EUR 70.7k | EUR 144.8k | EUR 137.9k | EUR 144.5k | EUR 294.7k | EUR 283.7k | EUR 542.9k | EUR 1.1M | EUR 953.6k | |
| EUR 95.2k | EUR 498.9k | EUR 697.7k | EUR 193.4k | EUR 1.0M | EUR 1.4M | EUR 703.8k | EUR 3.6M | EUR 5.0M | |
| Part 3: Decision | |||||||||
| Market sessions VPP participated in | 57% | 63% | 64% | 55% | 61% | 63% | 55% | 61% | 63% |
| FCR covered by VPP | 5% | 6% | 7% | 10% | 13% | 14% | 39% | 46% | 47% |
| EUR 110.0k | EUR 621.0k | EUR 844.4k | EUR 228.4k | EUR 1.3M | EUR 1.7M | EUR 855.0k | EUR 4.6M | EUR 6.0M | |
| EUR 34.3k | EUR 85.1k | EUR 91.6k | EUR 71.3k | EUR 176.2k | EUR 188.0k | EUR 270.3k | EUR 647.0k | EUR 624.1k | |
| EUR 36.1k | EUR 242.2k | EUR 303.8k | EUR 75.2k | EUR 501.9k | EUR 627.0k | EUR 282.4k | EUR 1.8M | EUR 2.2M | |
| EUR 39.6k | EUR 293.7k | EUR 449.1k | EUR 81.9k | EUR 605.6k | EUR 923.1k | EUR 302.1k | EUR 2.1M | EUR 3.2M | |
| Other indicators | |||||||||
| Capacity factor of HEs | 53% | 56% | 57% | 53% | 56% | 57% | 46% | 50% | 52% |
| 3% | 3% | 3% | 6% | 6% | 6% | 12% | 12% | 12% | |
Table A2.
Results for Spain, disaggregated by year.
Table A2.
Results for Spain, disaggregated by year.
| Scenario | Scenario 1 “Pessimistic” 2025 | Scenario 2 “Expected” 2025 | Scenario 3 “Pledged” 2030 | ||||||
|---|---|---|---|---|---|---|---|---|---|
| Year | 2020 | 2021 | 2022 | 2020 | 2021 | 2022 | 2020 | 2021 | 2022 |
| Part 1: Without opportunity costs | |||||||||
| Market sessions VPP participated in | 99% | 99% | 100% | 99% | 99% | 100% | 99% | 99% | 99% |
| FCR covered by VPP | 3% | 4% | 5% | 5% | 5% | 5% | 34% | 40% | 32% |
| EUR 894.2k | EUR 4M | EUR 6.3M | EUR 1.2M | EUR 8.3M | EUR 14.1M | EUR 8.6M | EUR 38.0M | EUR 38.8M | |
| Part 2: Opportunity costs | |||||||||
| EUR 367.0k | EUR 751.6k | EUR 776.4k | EUR 416.3k | EUR 1.2M | EUR 1.5M | EUR 3.5M | EUR 7.2M | EUR 4.9M | |
| EUR 464.1k | EUR 2.4M | EUR 4.1M | EUR 545.0k | EUR 4.5M | EUR 8.3M | EUR 4.4M | EUR 22.7M | EUR 24.3M | |
| Part 3: Decision | |||||||||
| Market sessions VPP participated in | 52% | 58% | 58% | 51% | 58% | 58% | 51% | 58% | 58% |
| FCR covered by VPP | 3% | 4% | 5% | 5% | 8% | 11% | 34% | 40% | 32% |
| EUR 585.0k | EUR 3.1M | EUR 4.8M | EUR 854.7k | EUR 6.8M | EUR 11.3M | EUR 5.6M | EUR 29.5M | EUR 31.0M | |
| EUR 183.9k | EUR 432.4k | EUR 498.6k | EUR 253.0k | EUR 852.2k | EUR 1.1M | EUR 1.8M | EUR 4.2M | EUR 3.3M | |
| EUR 188.7k | EUR 1.2M | EUR 1.8M | EUR 270.6k | EUR 2.6M | EUR 4.1M | EUR 1.8M | EUR 11.4M | EUR 12M | |
| EUR 212.0k | EUR 1.4M | EUR 2.5M | EUR 331.0k | EUR 3.4M | EUR 6.1M | EUR 2.0M | EUR 13.9M | EUR 16.1M | |
| Other indicators | |||||||||
| Capacity factor of HEs | 64% | 68% | 78% | 64% | 68% | 78% | 62% | 66% | 48% |
| 2% | 2% | 5% | 5% | 5% | 5% | 10% | 10% | 10% | |
References
- Commission, E. COMMISSION REGULATION (EU) 2017/2195 of 23 November 2017 establishing a guideline on electricity balancing. Off. J. Eur. Union 2017, 312, 6–53. [Google Scholar]
- Pedro, A.; Krutnik, M.; Yadack, V.M.; Pereira, L.; Morais, H. Opportunities and challenges for small-scale flexibility in European electricity markets. Util. Policy 2023, 80, 101477. [Google Scholar] [CrossRef]
- FCR Cooperation. Explanatory Document to the Amendment to the TSOs’ Proposal for the Establishment of Common and Harmonised Rules and Processes for the Exchange and Procurement of Balancing Capacity for Frequency Containment Reserves (FCR). 2021. Available online: https://consultations.entsoe.eu/markets/amendment-to-the-tsos-proposal-fcr/supporting_documents/FCR%20Amendment%20Art%2033%20EB%20GL%20%20Explanatory%20Note%20.pdf (accessed on 10 February 2023).
- UCTE. Appendix 1: Load-Frequency-Control and Performance. 2004. Available online: https://eepublicdownloads.entsoe.eu/clean-documents/pre2015/publications/entsoe/Operation_Handbook/Policy_1_Appendix%20_final.pdf (accessed on 23 March 2022).
- Pombo, D.V.; Raducu, G.A.; Styliaras, N.; Sahin, O.; Thanopoulos, S.; Funkquist, J.; Shayesteh, E. The first utility scale hybrid plant in Europe: The case of Haringvliet. In International Hybrid Power Systems Workshop; Energynautics GmbH: Darmstadt, Germany, 2021. [Google Scholar]
- Aziz, A.; Oo, A.T.; Stojcevski, A. Frequency regulation capabilities in wind power plant. Sustain. Energy Technol. Assess. 2018, 26, 47–76. [Google Scholar] [CrossRef]
- Hernandez, J.; Sanchez-Sutil, F.; Bueno, P. Large photovoltaic systems providing frequency containment reserves. In Proceedings of the 2016 IEEE PES Asia-Pacific Power and Energy Engineering Conference (APPEEC), Xi’an, China, 25–28 October 2016; pp. 1589–1593. [Google Scholar]
- Samani, A.E.; D’Amicis, A.; De Kooning, J.D.; Bozalakov, D.; Silva, P.; Vandevelde, L. Grid balancing with a large-scale electrolyser providing primary reserve. IET Renew. Power Gener. 2020, 14, 3070–3078. [Google Scholar] [CrossRef]
- Loutan, C.; Klauer, P.; Chowdhury, S.; Hall, S.; Morjaria, M.; Chadliev, V.; Milam, N.; Milan, C.; Gevorgian, V. Demonstration of Essential Reliability Services by a 300-MW Solar Photovoltaic Power Plant; Technical Report; National Renewable Energy Lab: Golden, CO, USA, 2017. [Google Scholar]
- RTE. Download Data Published by RTE: Balancing Capacity-Procured Reserves-RTE’s Need. 2023. Available online: https://www.services-rte.com/en/download-data-published-by-rte.html?category=market&type=balancing_capacity&subType=tso_need_for_procured_reserves (accessed on 23 March 2023).
- Gulotta, F.; Daccò, E.; Bosisio, A.; Falabretti, D. Opening of Ancillary Service Markets to Distributed Energy Resources: A Review. Energies 2023, 16, 2814. [Google Scholar] [CrossRef]
- Borne, O.; Perez, Y.; Petit, M. Market integration or bids granularity to enhance flexibility provision by batteries of electric vehicles. Energy Policy 2018, 119, 140–148. [Google Scholar] [CrossRef]
- Sonnen and Next Kraftwerke Co-Operate to Supply Primary Control Reserve 2022. Available online: https://www.next-kraftwerke.com/news/sonnen-next-kraftwerke-co-operate-fcr-home-batteries (accessed on 23 October 2023).
- Ribeiro, F.J.; Lopes, J.A.P.; Soares, F.J.; Madureira, A.G. Assessing the Membership of Portugal and Spain in the FCR Cooperation: TSO Costs and VPP Revenues. In Proceedings of the 2023 International Conference on Smart Energy Systems and Technologies (SEST), Eindhoven, The Netherlands, 5–7 September 2022; pp. 1–6. [Google Scholar]
- Fernando Ribeiro. Opportunity Costs of Iberian VPP on Fcr Cooperation. 2023. Available online: https://zenodo.org/records/8392982 (accessed on 23 June 2023).
- ENTSO-E. ENTSO-E Transparency Platform. 2023. Available online: https://transparency.entsoe.eu (accessed on 10 February 2023).
- Furfari, S.; Clerici, A. Green hydrogen: The crucial performance of electrolysers fed by variable and intermittent renewable electricity. Eur. Phys. J. Plus 2021, 136, 509. [Google Scholar] [CrossRef]
- Lazard. Lazard’s Levelized Cost of Energy Analysis—Version 15.0; Technical Report; Lazard: New York, NY, USA, 2021; Available online: https://www.lazard.com/media/sptlfats/lazards-levelized-cost-of-energy-version-150-vf.pdf (accessed on 23 March 2023).
- van der Roest, E.; Bol, R.; Fens, T.; van Wijk, A. Utilisation of waste heat from PEM electrolysers–Unlocking local optimisation. Int. J. Hydrogen Energy 2023, 48, 27872–27891. [Google Scholar] [CrossRef]
- S&P Global. Experts Explain Why Green Hydrogen Costs Have Fallen and Will Keep Falling. 2021. Available online: https://www.spglobal.com/marketintelligence/en/news-insights/latest-news-headlines/experts-explain-why-green-hydrogen-costs-have-fallen-and-will-keep-falling-63037203 (accessed on 23 March 2023).
- ENTSO-E. Continental Europe Synchronous Area Separation on 24 July 2021—Technical Report. 2021. Available online: https://eepublicdownloads.azureedge.net/clean-documents/SOC%20documents/SOC%20Reports/entso-e_CESysSep_210724_211112.pdf (accessed on 4 April 2022).
- REGELLEISTUNG.NET. Regelleistung.Net—Data Center. 2022. Available online: https://www.regelleistung.net/apps/datacenter/tenders/ (accessed on 10 February 2023).
- República Portuguesa/Presidência do Conselho de Ministros. Plano Nacional Energia-Clima 2030. 2020. Available online: https://www.dgeg.gov.pt/media/5eac1vcd/resoluÃğÃčo-do-conselho-de-ministros-n-ž-632020.pdf (accessed on 2 November 2023).
- Vicepresidencia Cuarta del Gobierno de España/Ministerio para la Transición Ecológica y el Reto Demográfico. Hoja de Ruta del Hidrógeno: Una Apuesta Por el Hidrógeno Renovable. 2020. Available online: https://www.miteco.gob.es/content/dam/miteco/es/ministerio/planes-estrategias/hidrogeno/hojarutahidrogenorenovable_tcm30-525000.PDF (accessed on 2 November 2023).
- Vicepresidencia Tercera del Gobierno/Ministerio Para la Transición ecológica y el Reto Demografico. Plan Nacional Integrado de Energía y Clima (PNIEC) 2021–2030. 2020. Available online: https://www.miteco.gob.es/content/dam/miteco/es/ministerio/planes-estrategias/plan-nacional-integrado-energia-clima/plannacionalintegradodeenergiayclima2021-2030_tcm30-546623.pdf. (accessed on 4 April 2022).
- República Portuguesa/Ministério do Ambiente e Transição Energética. Plano Nacional Energia-Clima 2030. 2019. Available online: https://participa.pt/contents/consultationdocument/imported/2585/670002.pdf (accessed on 4 April 2022).
- Steeger, G.; Barroso, L.A.; Rebennack, S. Optimal bidding strategies for hydro-electric producers: A literature survey. IEEE Trans. Power Syst. 2014, 29, 1758–1766. [Google Scholar] [CrossRef]
Disclaimer/Publisher’s Note: The statements, opinions and data contained in all publications are solely those of the individual author(s) and contributor(s) and not of MDPI and/or the editor(s). MDPI and/or the editor(s) disclaim responsibility for any injury to people or property resulting from any ideas, methods, instructions or products referred to in the content. |
© 2024 by the authors. Licensee MDPI, Basel, Switzerland. This article is an open access article distributed under the terms and conditions of the Creative Commons Attribution (CC BY) license (https://creativecommons.org/licenses/by/4.0/).