Metal and Pesticide Assessments of Imported and Locally Cultivated Rice (Oryza sativa) in Senegal

 , ,
, ,
Abstract
1. Introduction
2. Materials and Methods
2.1. Local and Imported Rice Sampling
2.2. Preparation and Measurement of Toxic Metals
2.3. Preparation and Measurement of Pesticides
Preparation and Measurement of Protein, Lipids, Ash, Lipid, Humidity and Total Carbohydrate
3. Results
3.1. Local and Imported Rice
Acceptable Daily Intake (ADI) of Metals
3.2. Soil
3.3. Pesticide Contents
4. Discussion
5. Conclusions
Author Contributions
Funding
Data Availability Statement
Acknowledgments
Conflicts of Interest
References
- Naseri, M.; Vazirzadeh, A.; Kazemi, R.; Zaheri, F. Concentration of some heavy metals in rice types available in Shiraz market and human health risk assessment. Food Chem. 2015, 175, 243–248. [Google Scholar] [CrossRef] [PubMed]
- Lokeshwari, H.; Chandrappa, G.T. Impact of heavy metal contamination of Bellandur Lake on soil and cultivated vegetation. Curr. Sci. 2006, 91, 622–627. [Google Scholar]
- Khaniki, G.R.; Zozali, M.A. Cadmium and lead contents in rice (Oryza sativa) in the north of Iran. Int. J. Agric. Biol. 2005, 7, 1026–1029. [Google Scholar]
- Batista, B.L.; Nacano, L.R.; de Freitas, R.; de Oliveira-Souza, V.C.; Barbosa, F. Determination of Essential (Ca, Fe, I, K, Mo) and Toxic Elements (Hg, Pb) in Brazilian Rice Grains and Estimation of Reference Daily Intake. Food Nutr. Sci. 2012, 03, 129–134. [Google Scholar] [CrossRef]
- Lin, H.-T.; Wong, S.-S.; Li, G.-C. Heavy metal content of rice and shellfish in Taiwan. J. Food Drug Anal. 2004, 12, 5. [Google Scholar] [CrossRef]
- Shimbo, S.; Zhang, Z.-W.; Watanabe, T.; Nakatsuka, H.; Matsuda-Inoguchi, N.; Higashikawa, K.; Ikeda, M. Cadmium and lead contents in rice and other cereal products in Japan in 1998–2000. Sci. Total. Environ. 2001, 281, 165–175. [Google Scholar] [CrossRef]
- Zhang, Z.W.; Watanabe, T.; Shimbo, S.; Higashikawa, K.; Ikeda, M. Lead and cadmium contents in cereals and pulses in north-eastern China. Sci. Total. Environ. 1998, 220, 137–145. [Google Scholar] [CrossRef]
- Samal, P.; Babu, S.C.; Mondal, B.; Mishra, S.N. The global rice agriculture towards 2050: An inter-continental perspective. Outlook Agric. 2022, 51, 164–172. [Google Scholar] [CrossRef]
- FAO. Rice Market Monitor Trade and Markets Division; Food and Agriculture Organization of the United Nations: Rome, Italy, 2010. [Google Scholar]
- Zakir, H.M.; Islam, F.; Quadir, Q.F.; Rahman, A. Metallic Health Risk through Consumption of Different Rice Varieties Cultivated in Industrial Wastewater Irrigated Farmers’ Fields of Bhaluka Area, Bangladesh. Curr. J. Appl. Sci. Technol. 2020, 39, 76–91. [Google Scholar] [CrossRef]
- Tsukahara, T.; Ezaki, T.; Moriguchi, J.; Furuki, K.; Shimbo, S.; Matsuda-Inoguchi, N.; Ikeda, M. Rice as the most influential source of cadmium intake among general Japanese population. Sci. Total. Environ. 2003, 305, 41–51. [Google Scholar] [CrossRef]
- Ndong, M.; Mise, N.; Okunaga, M.; Kayama, F. Cadmium, arsenic and lead accumulation in rice grains produced in Senegal river valley. Fundam. Toxicol. Sci. 2018, 5, 87–91. [Google Scholar] [CrossRef]
- Sun, L.; Zheng, M.; Liu, H.; Peng, S.; Huang, J.; Cui, K.; Nie, L. Water management practices affect arsenic and cadmium accumulation in rice grains. Sci. World J. 2014, 2014, 596438. [Google Scholar]
- Li, H.; Luo, N.; Li, Y.W.; Cai, Q.Y.; Li, H.Y.; Mo, C.H.; Wong, M.H. Cadmium in rice: Transport mechanisms. Influencing factors and minimizing measures. Environ. Pollut. 2017, 224, 622–630. [Google Scholar] [CrossRef] [PubMed]
- Laperche, V.; Hammade, V. Diagnostic rapide sur site. Utilisation de méthodes d′évaluation de la teneur en métaux de sols pollués par mesure de leur susceptibilité magnétique et par fluorescence X. In Rap. CNRSSP/02/05; 2002; 16 p + ann. Available online: https://infoterre.brgm.fr/rapports (accessed on 25 February 2024).
- Sohn, E. Contamination: The toxic side of rice. Nature 2014, 514, S62–S63. [Google Scholar] [CrossRef]
- Williams, P.N.; Price, A.H.; Raab, A.; Hossain, S.A.; Feldmann, J.; Meharg, A.A. Variation in Arsenic Speciation and Concentration in Paddy Rice Related to Dietary Exposure. Environ. Sci. Technol. 2005, 39, 5531–5540. [Google Scholar] [CrossRef] [PubMed]
- Torres-Escribano, S.; Leal, M.; Vélez, D.; Montoro, R. Total and Inorganic Arsenic Concentrations in Rice Sold in Spain, Effect of Cooking, and Risk Assessments. Environ. Sci. Technol. 2008, 42, 3867–3872. [Google Scholar] [CrossRef] [PubMed]
- Garelick, H.; Jones, H.; Dybowska, A.; Valsami-Jones, E. Arsenic Pollution Sources. In Reviews of Environmental Contamination Volume 197. Reviews of Environmental Contamination and Toxicology; Springer: New York, NY, USA, 2009; Volume 197. [Google Scholar]
- Matthew, A.D.; Antonio, J.S.P.; Maria, A.; Francis, S.; Claire, P.; Tracy, P.; Anala, G.; Habibul, A.; Margaret, R.K. Assessment of human dietary exposure to arsenic through rice. Sci. Total Environ. 2017, 586, 1237–1244. [Google Scholar] [CrossRef]
- Meharg, A.A.; Rahman, M. Arsenic Contamination of Bangladesh Paddy Field Soils: Implications for Rice Contribution to Arsenic Consumption. Environ. Sci. Technol. 2002, 37, 229–234. [Google Scholar] [CrossRef]
- Britta, P.F.; Carolin, F.K.; Andrea, E.C.; Blanco, S.C. Dimethylated Thioarsenates: A Potentially Dangerous Blind Spot in Current Worldwide Regulatory Limits for Arsenic in Rice. J. Agric. Food Chem. 2022, 70, 9610–9618. [Google Scholar] [CrossRef]
- Bhattacharyya, P.; Chakrabarti, K.; Chakraborty, A. Residual effect of municipal solid waste compost on microbial biomass and activities in mustard growing soil: Restwirkung von müllkompost auf die mikrobielle biomasse und mikrobielle aktivitaten in boden mit senfbewuchs. Arch. Agron. Soil Sci. 2003, 49, 585–592. [Google Scholar] [CrossRef]
- Peng, S.; Tang, Q.; Zou, Y. Current Status and Challenges of Rice Production in China. Plant Prod. Sci. 2009, 12, 3–8. [Google Scholar] [CrossRef]
- NF EN 17053; Aliments des Animaux—Méthodes D’échantillonnage et D’analyse—Dosage par ICP-MS (Multi Méthode) des Éléments Traces, Métaux Lourds et Autres Éléments Inorganiques Présents dans les Aliments. European Committee for Standardisation: Paris, France, 2018.
- Ofoe, R.; Thomas, R.H.; Asiedu, S.K.; Wang-Pruski, G.; Fofana, B.; Abbey, L. Aluminum in plant: Benefits, toxicity and tolerance mechanisms. Front. Plant Sci. 2023, 13, 1085998. [Google Scholar] [CrossRef]
- AOAC. Official Methods of Analysis, 17th ed.; The Association of Official Analytical Chemists: Gaithersburg, MD, USA, 2000. [Google Scholar]
- Roy, B.; Bhadra, S. Effects of Toxic Levels of Aluminium on Seedling Parameters of Rice under Hydroponic Culture. Rice Sci. 2014, 21, 217–223. [Google Scholar] [CrossRef]
- FDA. Dietary Supplements Foods and Beverage; FDA: Silver Spring, MD, USA, 2023.
- Kheankhun, N.; Sringam, J.; Kumpunit, W.; Wattanakornsiri, A.; Phengphai, P. Contaminated heavy metal in rice of Surin province, Thailand. Naresuan Univ. J. Sci. Technol. 2020, 28, 55–64. [Google Scholar]
- Roya, A.Q.; Ali, M.S. Heavy metals in rice samples on the Torbat-Heidarieh market, Iran. Food Addit. Contam. Part B 2017, 10, 59–63. [Google Scholar] [CrossRef]
- Bundschuh, J.; Nath, B.; Bhattacharya, P.; Liu, C.-W.; Armienta, M.A.; López, M.V.M.; Lopez, D.L.; Jean, J.-S.; Cornejo, L.; Macedo, L.F.L.; et al. Arsenic in the human food chain: The Latin American perspective. Sci. Total. Environ. 2012, 429, 92–106. [Google Scholar] [CrossRef] [PubMed]
- Ahmed, M.K.; Shaheen, N.; Islam, M.S.; Habibullah-al-Mamun, M.; Islam, S.; Mohiduzzaman, M.; Bhattacharjee, L. Dietary intake of trace elements from highly consumed cultured fish (Labeo rohita. Pangasius pangasius and Oreochromis mossambicus) and human health risk implications in Bangladesh. Chemosphere 2015, 128, 284–292. [Google Scholar] [CrossRef]
- Siri-anusornsak, W.; Soiklom, S.; Thanaruksa, R. Determination of Heavy Metals (Cd, Cr and Pb) in Thai Rice; Kasetsart University: Bangkok, Thailand, 2017; pp. 65–71. [Google Scholar]
- Meharg, A.A.; Lombi, E.; Williams, P.N.; Scheckel, K.G.; Feldmann, J.; Raab, A.; Zhu, Y.; Islam, R. Speciation and Localization of Arsenic in White and Brown Rice Grains. Environ. Sci. Technol. 2008, 42, 1051–1057. [Google Scholar] [CrossRef] [PubMed]
- Nookabkaew, S.; Rangkadilok, N.; Mahidol, C.; Promsuk, G.; Satayavivad, J. Determination of arsenic species in rice from Thailand and other Asian countries using simple extraction and HPLC-ICP-MS analysis. J. Agric. Food Chem. 2013, 61, 6991–6998. [Google Scholar] [CrossRef] [PubMed]
- Maybury, R.B. Codex Alimentarius Approach to Pesticide Residue Standards. J. AOAC Int. 1989, 72, 538–541. [Google Scholar] [CrossRef]
- Anderson, L. National Food Safety Standards Maximum Residue Limits for Pesticides in Food; Gain Report Number CH17016; USDA: Beijing, China, 2017; p. 218.
- U.S. Food and Drugs. Arsenic in Food and Dietary Supplement. Contents 06-01-2023. Available online: https://www.fda.gov/food/environmental-contaminants-food/arsenic-food-and-dietary-supplements (accessed on 1 September 2022).
- Kabata-Pendias, A. Trace Elements in Soils and Plants, 4th ed.; CRC Press: Boca Raton, FL, USA, 2022; p. 105. [Google Scholar]
- Mania, M.; Rebeniak, M.; Szynal, T.; Starska, K.; Wojciechowska-Mazurek, M.; Postupolski, J. Exposure assessment of the population in Poland to the toxic effects of arsenic compounds present in rice and rice based products. Rocz. Państwowego Zakładu Hig. 2017, 68, 339–346. [Google Scholar]
- Ramírez-Zavala, B.; Reuß, O.; Park, Y.-N.; Ohlsen, K.; Morschhäuser, J. Environmental Induction of White–Opaque Switching in Candida albicans. PLoS Pathog. 2008, 4, e1000089. [Google Scholar] [CrossRef] [PubMed]
- Shindoh, K.; Yasui, A. Changes in Cadmium Concentration in Rice during Cooking. Food Sci. Technol. Res. 2003, 9, 193–196. [Google Scholar] [CrossRef]
- Jorhem, L.; Åstrand, C.; Sundström, B.; Baxter, M.; Stokes, P.; Lewis, J.; Grawé, K.P. Elements in rice from the Swedish market: 1. Cadmium, lead and arsenic (total and inorganic). Food Addit. Contam. Part A 2008, 25, 284–292. [Google Scholar] [CrossRef] [PubMed]
- Kitagishi, K.; Yamane, I. (Eds.) Heavy Metal Pollution in Soils of Japan; Japan Science Society Press: Tokyo, Japan, 1981; p. 302. [Google Scholar]
- Goldbach, H.E.; Wimmer, M.A.; Findeklee, P. Discussion paper: Boron—How can the critical level be defined? J. Plant Nutr. Soil Sci. 2000, 163, 115–121. [Google Scholar] [CrossRef]
- Oso, A.A.; Ashafa, A.O. Nutritional Composition of Grain and Seed Proteins. Grain Seed Proteins Funct. 2021, 31–50. [Google Scholar] [CrossRef]
- Shewry, P.R.; Napier, J.A.; Tatham, A.S. Seed Storage Proteins: Structures and Biosynthesis. Plant Cell Am. Soc. Plant Physiol. 1995, 7, 945–956. [Google Scholar]
- Anjum, F.M.; Pasha, I.; Bugti, M.A.; Batt, M.S. Mineral composition of different rice varieties and their milling fractions Pak. J. Agric. Sci. 2007, 44, 51–58. [Google Scholar]
- Rules on Sorting. In Packaging and Presentation of Rice Ministry of Agriculture; National Secretariat of Supply: Athens, Greece, 1988.
- Adair, C.R.; Bollich, C.N.; Bowman, D.H.; Joson, N.E.; Johnston, T.H.; Webb, B.D.; Atkins, J.G. Rice breeding and testing method in the United States. In Rice in the United States: Varieties and Production; Department of Agriculture of the United States: Washington, DC, USA, 1973; pp. 22–27. [Google Scholar]

| Rice Brand | Metal Contents | ||||
|---|---|---|---|---|---|
| As | Cd | Pb | Al | B | |
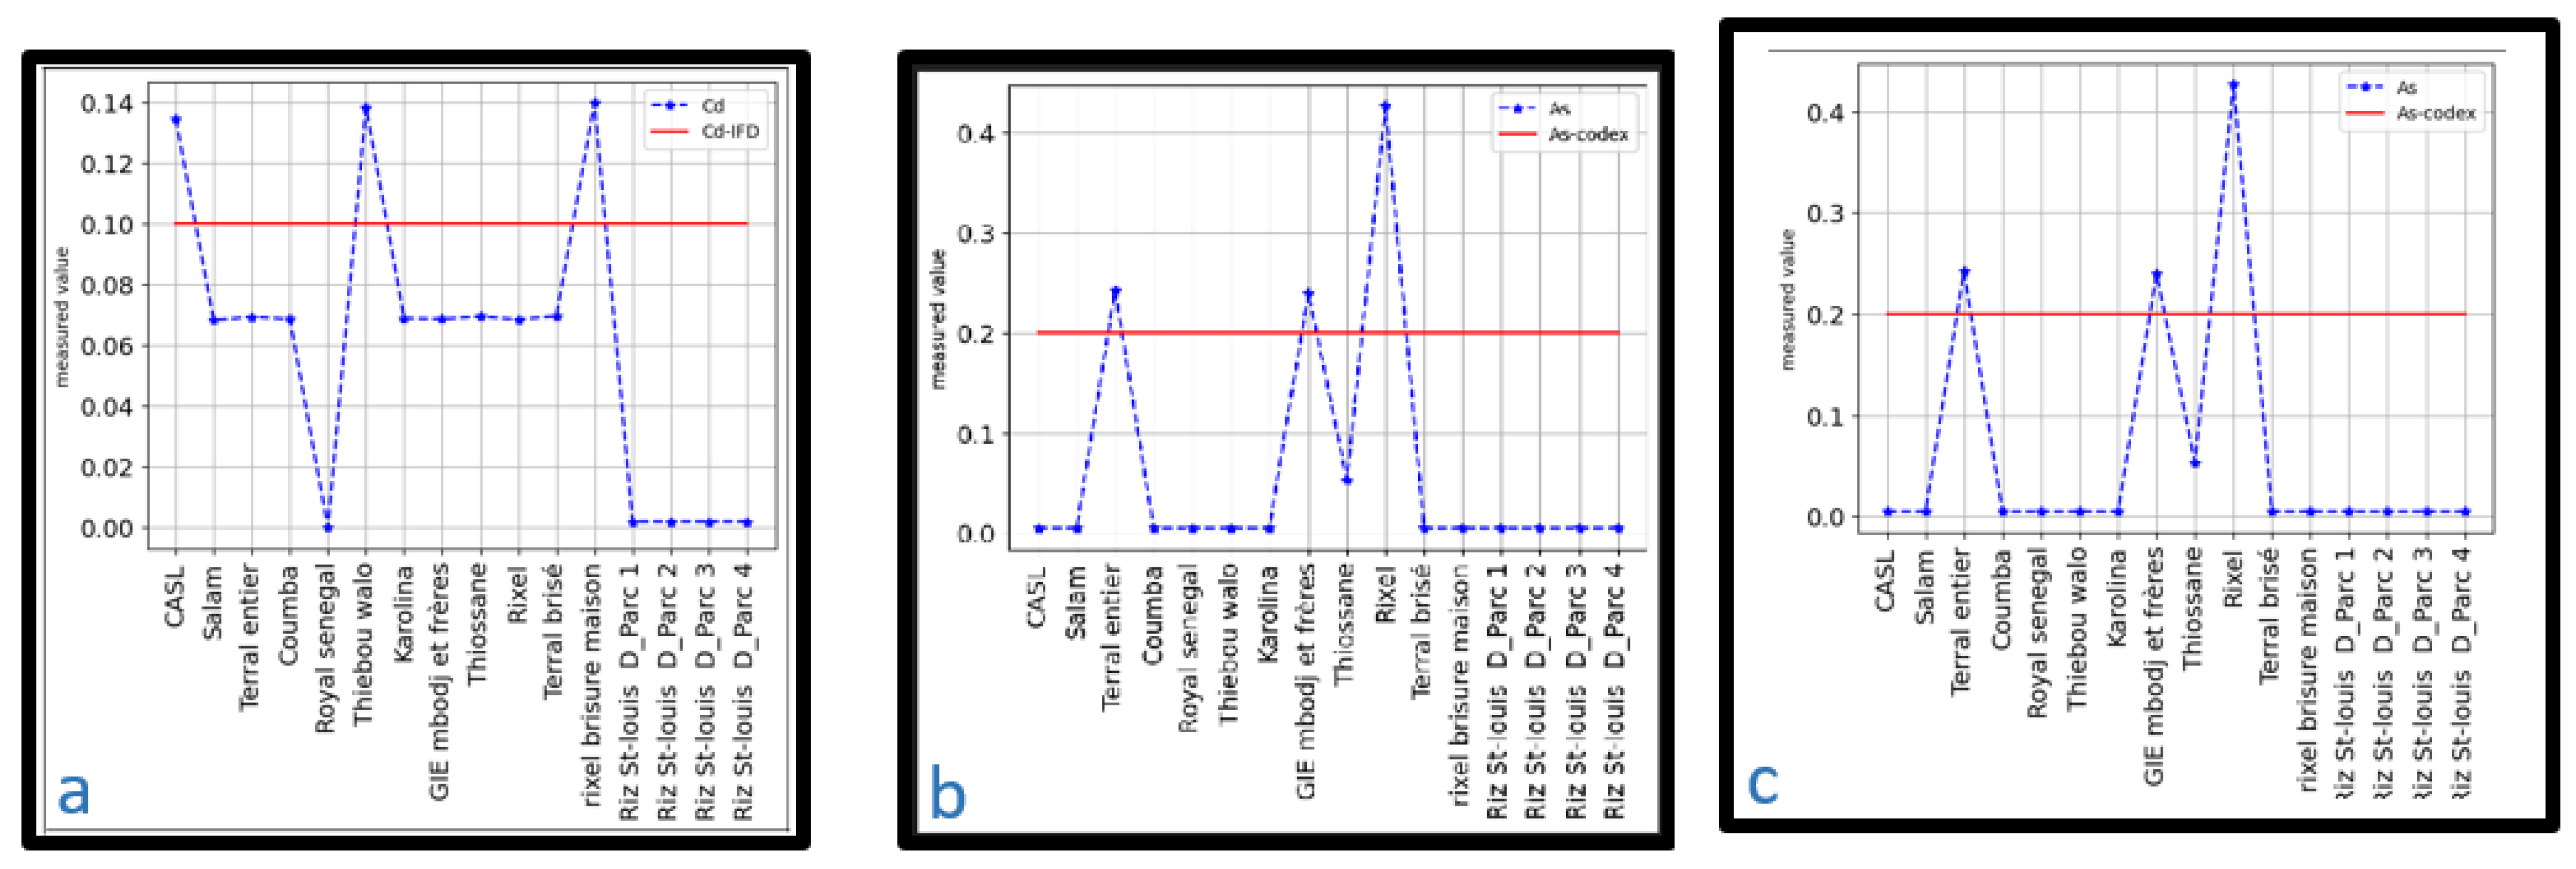
| CASL | <LoD * | 0.13 | 1.55 | 50.44 | 2.90 |
| Salam | <LoD * | 0.07 | 0.75 | 4.92 | 2.46 |
| Terral Entier | 0.24 | 0.07 | 2.01 | 9.44 | 1.94 |
| Coumba | <LoD * | 0.07 | <LoD *** | 7.01 | 1.31 |
| Royal Senegal | <LoD * | <LoD ** | 2.22 | 5.28 | 1.74 |
| Thiebou Walo | <LoD * | 0.14 | 1.11 | 2.43 | 0.35 |
| Karolina | <LoD * | 0.07 | 1.31 | 3.04 | <LoD **** |
| GIE Mbodj and Freres | 0.24 | 0.07 | 0.89 | 2.13 | <LoD **** |
| Thiossane | 0.05 | 0.07 | 0.63 | 1.18 | <LoD **** |
| Rixel | 0.43 | 0.07 | 0.14 | 7.14 | <LoD **** |
| Terral Brise | <LoD * | 0.07 | <LoD *** | 2.58 | <LoD **** |
| Royal Senegal Maison | <LoD * | 0.07 | <LoD *** | 4.74 | <LoD **** |
| Riz In Field #1 | <LoD * | <LoD ** | 0.28 | 17.84 | 2.20 |
| Riz In Field #2 | <LoD * | <LoD ** | 0.21 | 6.86 | <LoD **** |
| Riz In Field #3 | <LoD * | <LoD ** | 0.76 | 4.96 | 2.48 |
| Riz In Field #4 | <LoD * | <LoD ** | 1.68 | 3.57 | 3.36 |
| Average | 0.24 | 0.08 | 0.85 | 8.35 | 1.17 |
| Parameters | Senegal | India | China | South America | Vietnam | Thailand | Skewness | Kurtosis |
|---|---|---|---|---|---|---|---|---|
| Al | 8.351 | 95.541 | 5.411 | 6.441 | 2.222 | 2.673 | 3.347334 | 11.977796 |
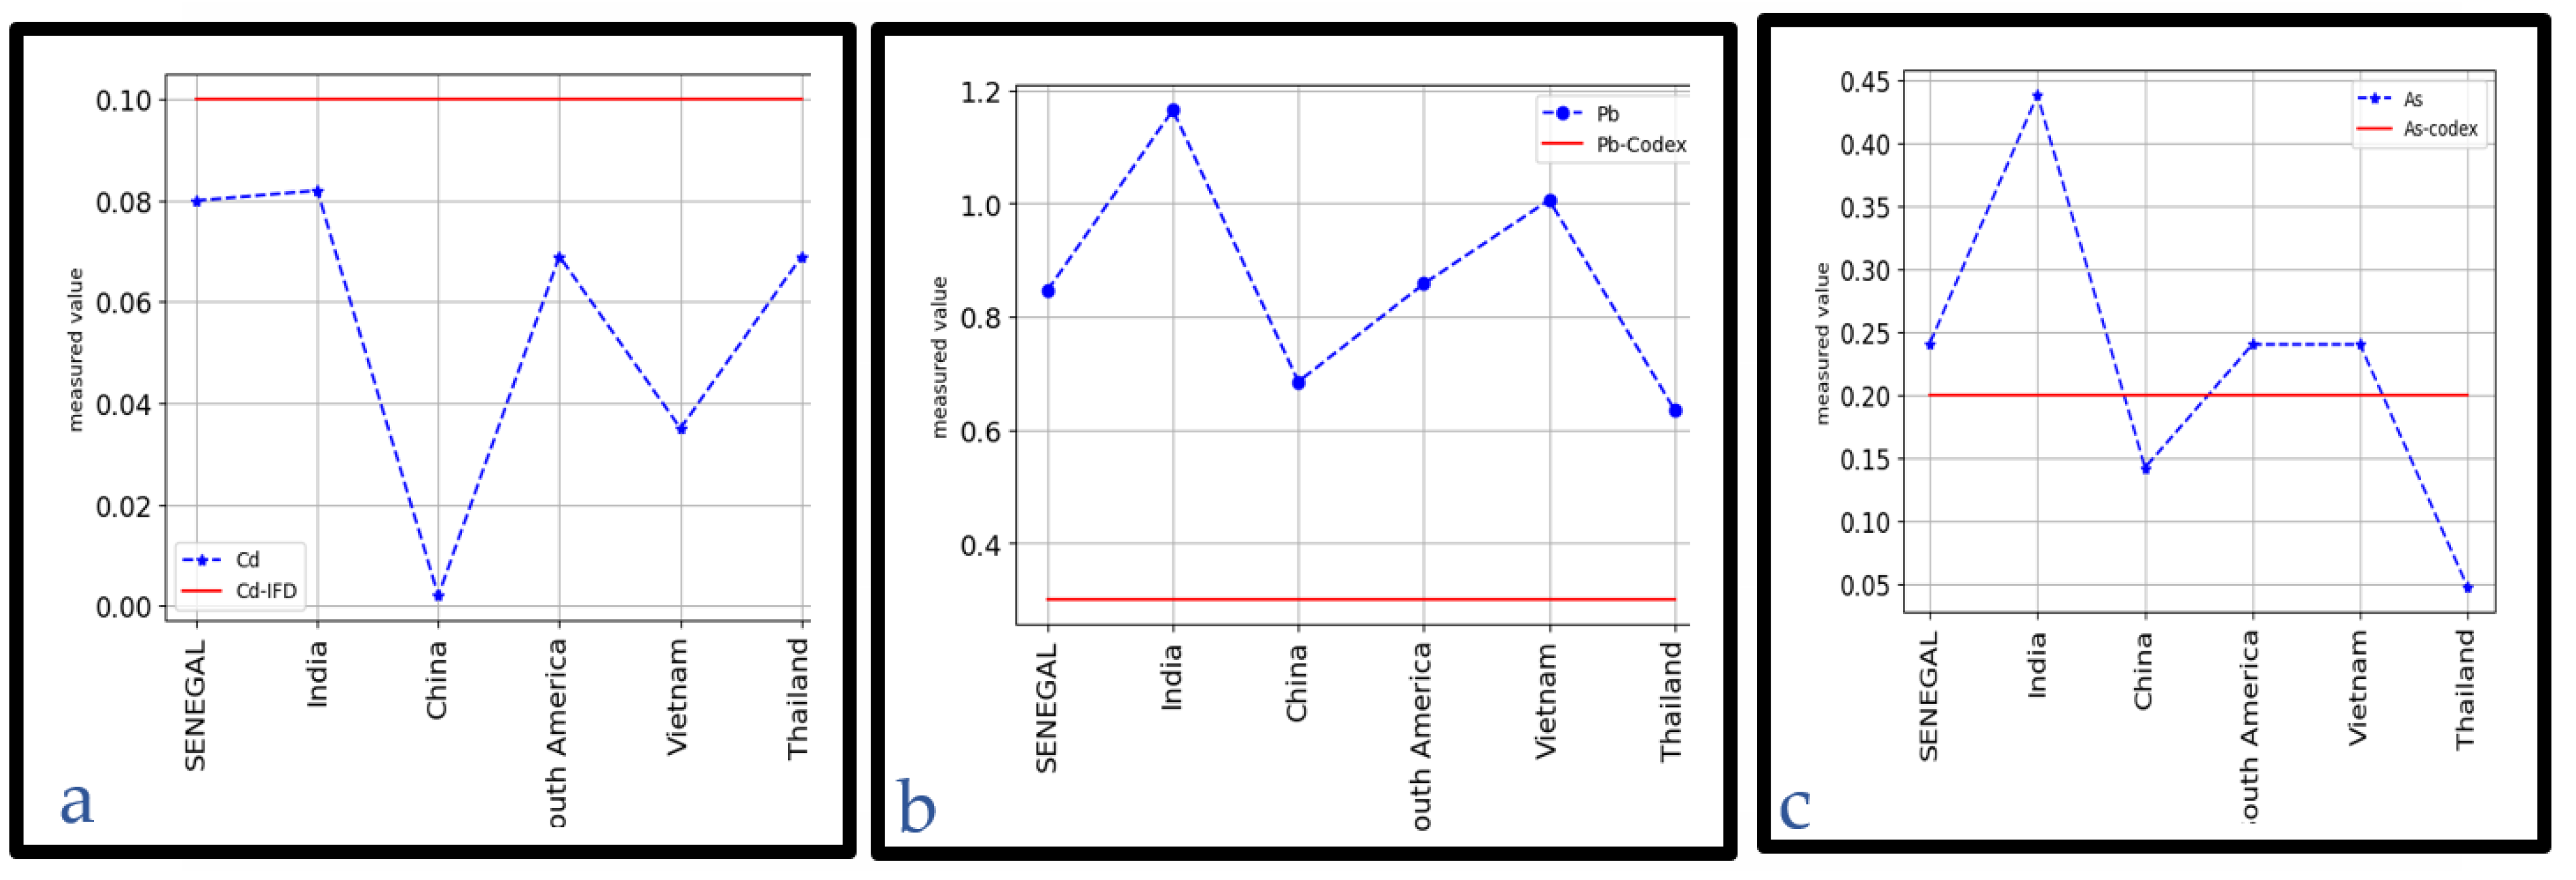
| Pb | 0.846 | 1.165 | 0.685 | 0.858 | 1.006 | 0.635 | 0.494440 | −0.934050 |
| Cd | 0.080 | 0.082 | 0.002 | 0.069 | 0.035 | 0.069 | 0.217715 | −0.792027 |
| As | 0.241 | 0.438 | 0.142 | 0.240 | 0.240 | 0.047 | 2.177704 | 4.112999 |
| B | 1.172 | 0.659 | 0.098 | 0.269 | 1.669 | 0.098 | 0.389291 | −1.554029 |
| K | 831.059 | 1012.069 | 957.799 | 910.409 | 560.039 | 655.898 | −1.814071 | 4.909083 |
| Protein (%) | 7.31 | 7.32 | 6.42 | 7.51 | 7.09 | 6.82 | 1.005622 | 2.311697 |
| Fat (%) | 0.60 | 0.59 | 0.45 | 0.3 | 0.22 | 0.67 | −0.130692 | −1.379063 |
| Humidity (%) | 12.76 | 12.26 | 12.73 | 11.12 | 12.95 | 11.36 | −0.590698 | 1.910566 |
| Ash (%) | 0.44 | 0.43 | 0.39 | 0.48 | 0.23 | 0.42 | −0.290591 | −0.532768 |
| Total Carbohydrate (%) | 79.12 | 79.35 | 79.97 | 80.23 | 79.50 | 80.82 | 0.038100 | 0.035373 |
| Al | Pb | Cd | As | B | |
|---|---|---|---|---|---|
| Senegal | 0.033 | 0.0034 | 0.0003 | 0.001 | 0.0047 |
| India | 0.382 | 0.0047 | 0.0003 | 0.0017 | 0.0026 |
| China | 0.0216 | 0.0027 | 0.00001 | 0.0006 | 0.00004 |
| South America | 0.0258 | 0.0034 | 0.0003 | 0.001 | 0.0011 |
| Vietnam | 0.0089 | 0.0040 | 0.0001 | 0.001 | 0.0067 |
| Thailand | 0.0107 | 0.0025 | 0.0003 | 0.0002 | 0.0004 |
| ADI (WHO,2011) | - | 0.025 | - | 0.0003 | - |
| ADI (USDA) | - | - | - | - | 0.1 |
| RFD (US-EPA) | - | 0.0005 | 0.001 | - |
| Samples | As | Cd | Co | Cr | Cu | Mo | Ni | Pb | Al |
|---|---|---|---|---|---|---|---|---|---|
| Soil | 3.46 | 0.69 | 10.67 | 34.51 | 15.66 | 17.88 | 14.00 | 9.50 | 6449 |
| No crop | 6.52 | 0.69 | 6.93 | 43.44 | 17.91 | 30.81 | 12.63 | 12.28 | 11,975 |
| Dry soil | 4.46 | 0.42 | 3.21 | 18.75 | 4.04 | 22.17 | 6.34 | 7.60 | 7460 |
| Salty soil | 3.90 | 0.56 | 6.89 | 34.93 | 16.77 | 22.61 | 11.13 | 9.39 | 8669 |
| Targeted Pesticides | Senegal | India | China | South America | Vietnam | Thailand |
|---|---|---|---|---|---|---|
| Pyrethrin I | 43.85 | 25.85 | 58.38 | 33.96 | 38.31 | 37.09 |
| Pyrethrin II | 1.48 | 1.09 | 1.05 | 1.43 | 1.71 | 1.19 |
| Propanil | 0.73 | 0.42 | 0.37 | 0.25 | 0.32 | 0.67 |
| 2,4D | 83.56 | 43.86 | 120.19 | 13.6 | 97.48 | 72.7 |
| Deltamethrin | <0.01 | <0.01 | <0.01 | <0.01 | <0.01 | <0.01 |
| Bensulfuron methyl | 0.65 | 0.54 | 1.05 | 0.61 | 0.67 | 0.85 |
Disclaimer/Publisher’s Note: The statements, opinions and data contained in all publications are solely those of the individual author(s) and contributor(s) and not of MDPI and/or the editor(s). MDPI and/or the editor(s) disclaim responsibility for any injury to people or property resulting from any ideas, methods, instructions or products referred to in the content. |
© 2024 by the authors. Licensee MDPI, Basel, Switzerland. This article is an open access article distributed under the terms and conditions of the Creative Commons Attribution (CC BY) license (https://creativecommons.org/licenses/by/4.0/).
Share and Cite
Ndiaye, A.; Traore, A.; Gueye, P.S.; Senwo, Z.; Ndiaye, M.; Diop, A. Metal and Pesticide Assessments of Imported and Locally Cultivated Rice (Oryza sativa) in Senegal. Appl. Sci. 2024, 14, 2876. https://doi.org/10.3390/app14072876
Ndiaye A, Traore A, Gueye PS, Senwo Z, Ndiaye M, Diop A. Metal and Pesticide Assessments of Imported and Locally Cultivated Rice (Oryza sativa) in Senegal. Applied Sciences. 2024; 14(7):2876. https://doi.org/10.3390/app14072876
Chicago/Turabian StyleNdiaye, Anna, Alassane Traore, Papa Sam Gueye, Zachary Senwo, Momar Ndiaye, and Abdoulaye Diop. 2024. "Metal and Pesticide Assessments of Imported and Locally Cultivated Rice (Oryza sativa) in Senegal" Applied Sciences 14, no. 7: 2876. https://doi.org/10.3390/app14072876
APA StyleNdiaye, A., Traore, A., Gueye, P. S., Senwo, Z., Ndiaye, M., & Diop, A. (2024). Metal and Pesticide Assessments of Imported and Locally Cultivated Rice (Oryza sativa) in Senegal. Applied Sciences, 14(7), 2876. https://doi.org/10.3390/app14072876