Article

Optimization Study of Water Interval Charge Structure Based on the Evaluation of Rock Damage Effect in Smooth Blasting

School of Civil and Resource Engineering, University of Science and Technology Beijing, Beijing 100083, China
*
Author to whom correspondence should be addressed.
Appl. Sci. 2024, 14(7), 2868; https://doi.org/10.3390/app14072868
Submission received: 3 March 2024 / Revised: 24 March 2024 / Accepted: 26 March 2024 / Published: 28 March 2024
(This article belongs to the Special Issue Smart Geotechnical Engineering)

Abstract

:
In tunnel smooth blasting, optimizing the water interval charging structure of peripheral holes is of great significance in improving the effect of smooth blasting and reducing the unit consumption of explosives. Addressing the issue of a single traditional evaluation standard, this paper proposes a composite index evaluation method for rock blasting damage in different zones, and the best charging structure is optimized according to the evaluation results. Taking Liyue Road Tunnel Light Smooth Blasting Project in Chongqing as the Research Background, the numeric models were established with ten kinds of charge structures, the charge structures and explosive quantity were optimized according to the evaluation results, and then the field tests were conducted. The results show that when the length of the water medium at the bottom of the hole is 20 cm, the damage range of the retained rock mass can be controlled while ensuring rock fragmentation. If the length of the water medium at the orifice and in the center of the hole is more than 30 cm, it will affect the superposition effect of the blast stress wave, resulting in under-excavation; in the preferred charge structure, the ratio of the length of the upper and lower explosives reaches 1:3, and the ratio of the length of the water medium is 2:2:1, which achieves a better rock-breaking effect in the field test.

1. Introduction

Smooth blasting technology can improve the quality of tunnel forming, reduce the preservation of rock damage, and lower the cost of the support costs, especially the use of air interval charge peripheral hole blasting, which can improve the distribution of explosive stress, improve the energy utilization rate of explosives, in the tunnel drilling and blasting construction is widely used [1,2,3]. However, in soft rock with fissures development, the rapid spillage of gas from the fissures results in a poor blasting effect. Therefore, the water interval charge structure is gradually applied to smooth blasting. Under the action of a blasting load, the incompressibility of water and its high flow viscosity characteristics create a water wedge effect that significantly improves the blasting effects and reduces the unit consumption of explosives [4,5].
To remedy the insufficiency of the traditional air medium, Kutter et al. [6] proposed water pressure blasting. Tae-Min Oh et al. [7] combined the conventional blasting process with the free surface on the perimeter of the tunnel face using waterjet cutting technology to minimize underbreak and overbreak and maximize excavation efficiency. Yan et al. [8] obtained the rock damage radius under water-coupled loading conditions through theoretical calculations and numerical simulation methods and proposed the calculation method of the uncoupling coefficient. Zong et al. [9] used the water deck uncoupled charge to improve the quality of roadway forming and blasting footage. Feng et al. [10] obtained the blasting vibration law under the axial uncoupled charge of the water medium using the vibration velocity superposition method to determine the number of explosives and the length of the water medium. Liu et al. [11] established calculation models under the conditions of different water positions and uncoupling coefficients, then determined the optimal position of the water medium based on the law of stress attenuation. In the above study, the optimization of the water interval charge structure is based on the standard of safe blasting velocity or rock damage range. Damage to the rock under blasting loads is adjusted by Mises’ damage criterion or the Mohr–Coulomb strength condition [12,13]. It has been concluded that crushed zones were formed closer to the source of the explosion, while fissure zones were formed slightly further away under compressive and tensile stresses, respectively. However, the boundaries of the crushing zone and fracture area cannot be accurately determined, making it difficult to determine the extent of rock damage [14]. In the numerical simulation, the Mises stresses are compared with the dynamic compressive and tensile strengths to determine the damaging effect of the rock mass in the crushed zone and fractured area [15]. In addition, different fracture sizes and orientations affect the strength of the rock mass [16]. Thus, using the classical strength theory to roughly assess the damaging effect of the rock mass and then optimize the charge structure may result in some deviation. Damage fracture mechanics, based on continuum mechanics, describes the fracturing of a rock body. The mechanism of rock damage is attributed to the dynamic evolution of cracks within the rock, and the damage variable indicates the extent of damage in the damage model [17,18]. With the development of damage models, damage variables provide reliable support for analyzing rock damage. It should be noted that material models each have flaws, such as the Holmquist–Johnson–Cook (HJC)model, which can capture the compressive damage behavior of brittle material under dynamic loads but cannot accurately describe the tensile damage behavior. However, the tensile damage behavior is the main cause of rock failure [19,20]. Therefore, it is necessary to propose a new composite evaluation criterion for rock damage based on classical theory to accurately determine the damage of the rock mass on the excavation profile surface in numerical simulations using the properties of the material model and thus optimize the loading structure.
This study to reduce the consumption of explosives while improving the blasting effect, the interval charge structure in the interval medium water instead of air, according to the different water interval charge structure of the rock-breaking effect of the preferred charge structure, gives full play to the energy utilization rate of the explosion to form a flat tunnel profile to ensure that the tunnel is safe and efficient construction. This paper proposes a new method for evaluating the rock-breaking effect of rock under the action of blasting. The damage area of the rock is divided into the tensile stress action partition near the free surface and the stress wave complex action partition in the charge section between holes. Dynamic tensile stresses and damage variables are used as combined criteria to evaluate the damage effects of rocks. Numerical models of 9 types of charge structures were constructed using fluid–solid coupling algorithms, and a new methodology was used to analyze the destructive effect of rock and the distribution of explosive energy in the model, optimize the charge structure and explosive quantity, and carry out field tests.

2. Establishment of a Method for Evaluating Rock Damage Effects

2.1. Basis of Evaluation

The process of rock blasting damage and fracture can be divided into two stages by the mesoscopic mechanism [21]: a. under the action of the explosion stress wave, in the crushing zone to produce macro-cracks, micro-cracks in the fracture area are activated and expanded; b. based on the damage caused by the stress wave, the macroscopic cracks in the crushing zone, driven by the explosive gas to further expand, while the micro-cracks in the fracture area, under the action of the expansion of the explosive gas to further expand.

2.1.1. Evaluation of Rock Damage Effects Based on Classical Strength Theory

For analysis of numerical simulation results based on classical strength theory, the main consideration is the damaging effect of stress wave on the rock, and the damage degree of the rock is evaluated by the Mises damage criterion according to the location of the study area, as in Equation (1):
σ v m σ c d ( Crushing   zone ) σ t d ( Fracture   area )
σ v m = ( 1 / 2 ) ( σ 1 σ 2 ) 2 + ( σ 2 σ 3 ) 2 + ( σ 3 σ 1 ) 2 1 / 2
where σvm is the Mises effective stress; σcd is the dynamic compressive strength of the rock; σtd is the dynamic tensile strength; and σ1, σ2, σ3 are the three principal stresses.
Following the detonation of the explosives, the stress wave reflects and stretches at the free surface, and the rock in this range mainly exhibits tensile damage. Mises damage criterion is adopted to evaluate the damaging effect of the rock. However, the hole spacing of the peripheral holes is small, the depth of the explosive buried is deep relative to its diameter, the explosive surroundings can be considered as an infinite rock body, and the location of the boundary between the crushing zone and the fissure area can not be accurately determined. Furthermore, in numerical simulation calculations, describe the process of detonation and expansion by combining high-energy explosives with the JWL state equation. However, in the fracture area, the tensile stress generated at the crack tip by the explosion gases is neglected, leading to the calculated stress values being lower than the actual stresses. Based on the above analysis, the evaluation of rock damage effects using the stress changes in the classical strength criterion will deviate from the actual damage of the rock mass. This situation is more prominent in models with a poor description of the stretching behavior [22]. Therefore, it is necessary to introduce reliable indicators based on classical strength theory to comprehensively evaluate rock damage effects.

2.1.2. Evaluation Method Based on Damage Fracture Theory

Based on damage fracture theory, various dynamic damage models have been developed to describe brittle materials. The damage variables are treated statistically by treating rock dynamic fracture as a damage accumulation process. The rock damage mechanism is attributed to the dynamic evolution of cracks within the rock. When the damage variable reaches a threshold value, it is implied that the cracks cross each other and the rock will fracture and destroy. Grady et al. [23] and Taylor et al. [24] established the expression form of damage variables, on which a variety of dynamic damage models were established [25,26,27,28]. The damage variables consider not only the strain generated by the internal stress of the rock but also other factors, such as the strain of the rock body. The accuracy of the damage variables has been improving, reflecting the distributional characteristics of rock damage in more detail, and damage variables are embedded in well-established commercial software, providing reliable support for the analysis of rock damage effects.
The HJC model can better describe the dynamic mechanical behavior of rock materials, such as nonlinear deformation and fracture characteristics under large strains, high hydrostatic pressures, and high strain rates, and has been widely used in the study of dynamic damage behavior of rocks under blasting [29]. In the HJC material model, rock damage is caused by the cumulative formation of equivalent plastic strain and plastic volumetric strain, and Equation (3) represents the damage variables:
D = ( Δ ε p + Δ μ p ) / ( ε p f + μ p f )
ε p f + μ p f = D 1 ( p + T ) D 2 E F min
where ∆εp, ∆μp are the equivalent plastic strain increment and equivalent plastic volume strain increment; εpf, μpf are the equivalent plastic strain and equivalent plastic volume strain at the current integration step; D1, D2 are material damage parameters; p* is the normalized pressure; T* is the maximum characteristic tensile stress; and EFmin is the minimum plastic strain at which the material breaks.
In plastic mechanics, the strain increment is linearly proportional to the corresponding stress bias when plastic deformation is present in a rock, as shown in Equation (5):
Δ ε i j = σ i j Δ λ
where ∆εij is the strain increment, σij′ is the stress bias, and ∆λ is the instantaneous constant.
The equivalent plastic strain increment is obtained by substituting the above equation into the Mises yield equation with the expression in Equation (6):
Δ ε p = ( 2 / 3 ) ( Δ ε 1 Δ ε 2 ) 2 + ( Δ ε 2 Δ ε 3 ) 2 + ( Δ ε 3 Δ ε 1 ) 2 1 / 2
where ∆ε1, ∆ε2, ∆ε3 is the plastic strain increment under the principal stress.
Equations (2) and (6) show that equivalent plastic stresses lead to equivalent plastic strain increments. Equation (3) reveals that the damage variable D in the HJC model incorporates not only the strain resulting from the equivalent stress but also includes the volume strain generated during plastic deformation. Utilizing the damage variable to assess the destructive impact of the rock aligns more closely with the real-world scenario.
The study shows that by combining compressive damage variable and tensile damage variable, the total damage variable D is defined as Equation (7) [30]:
D = max ( D c , D t )
where Dc is the compressive damage variable. Dt is the tensile damage variable.
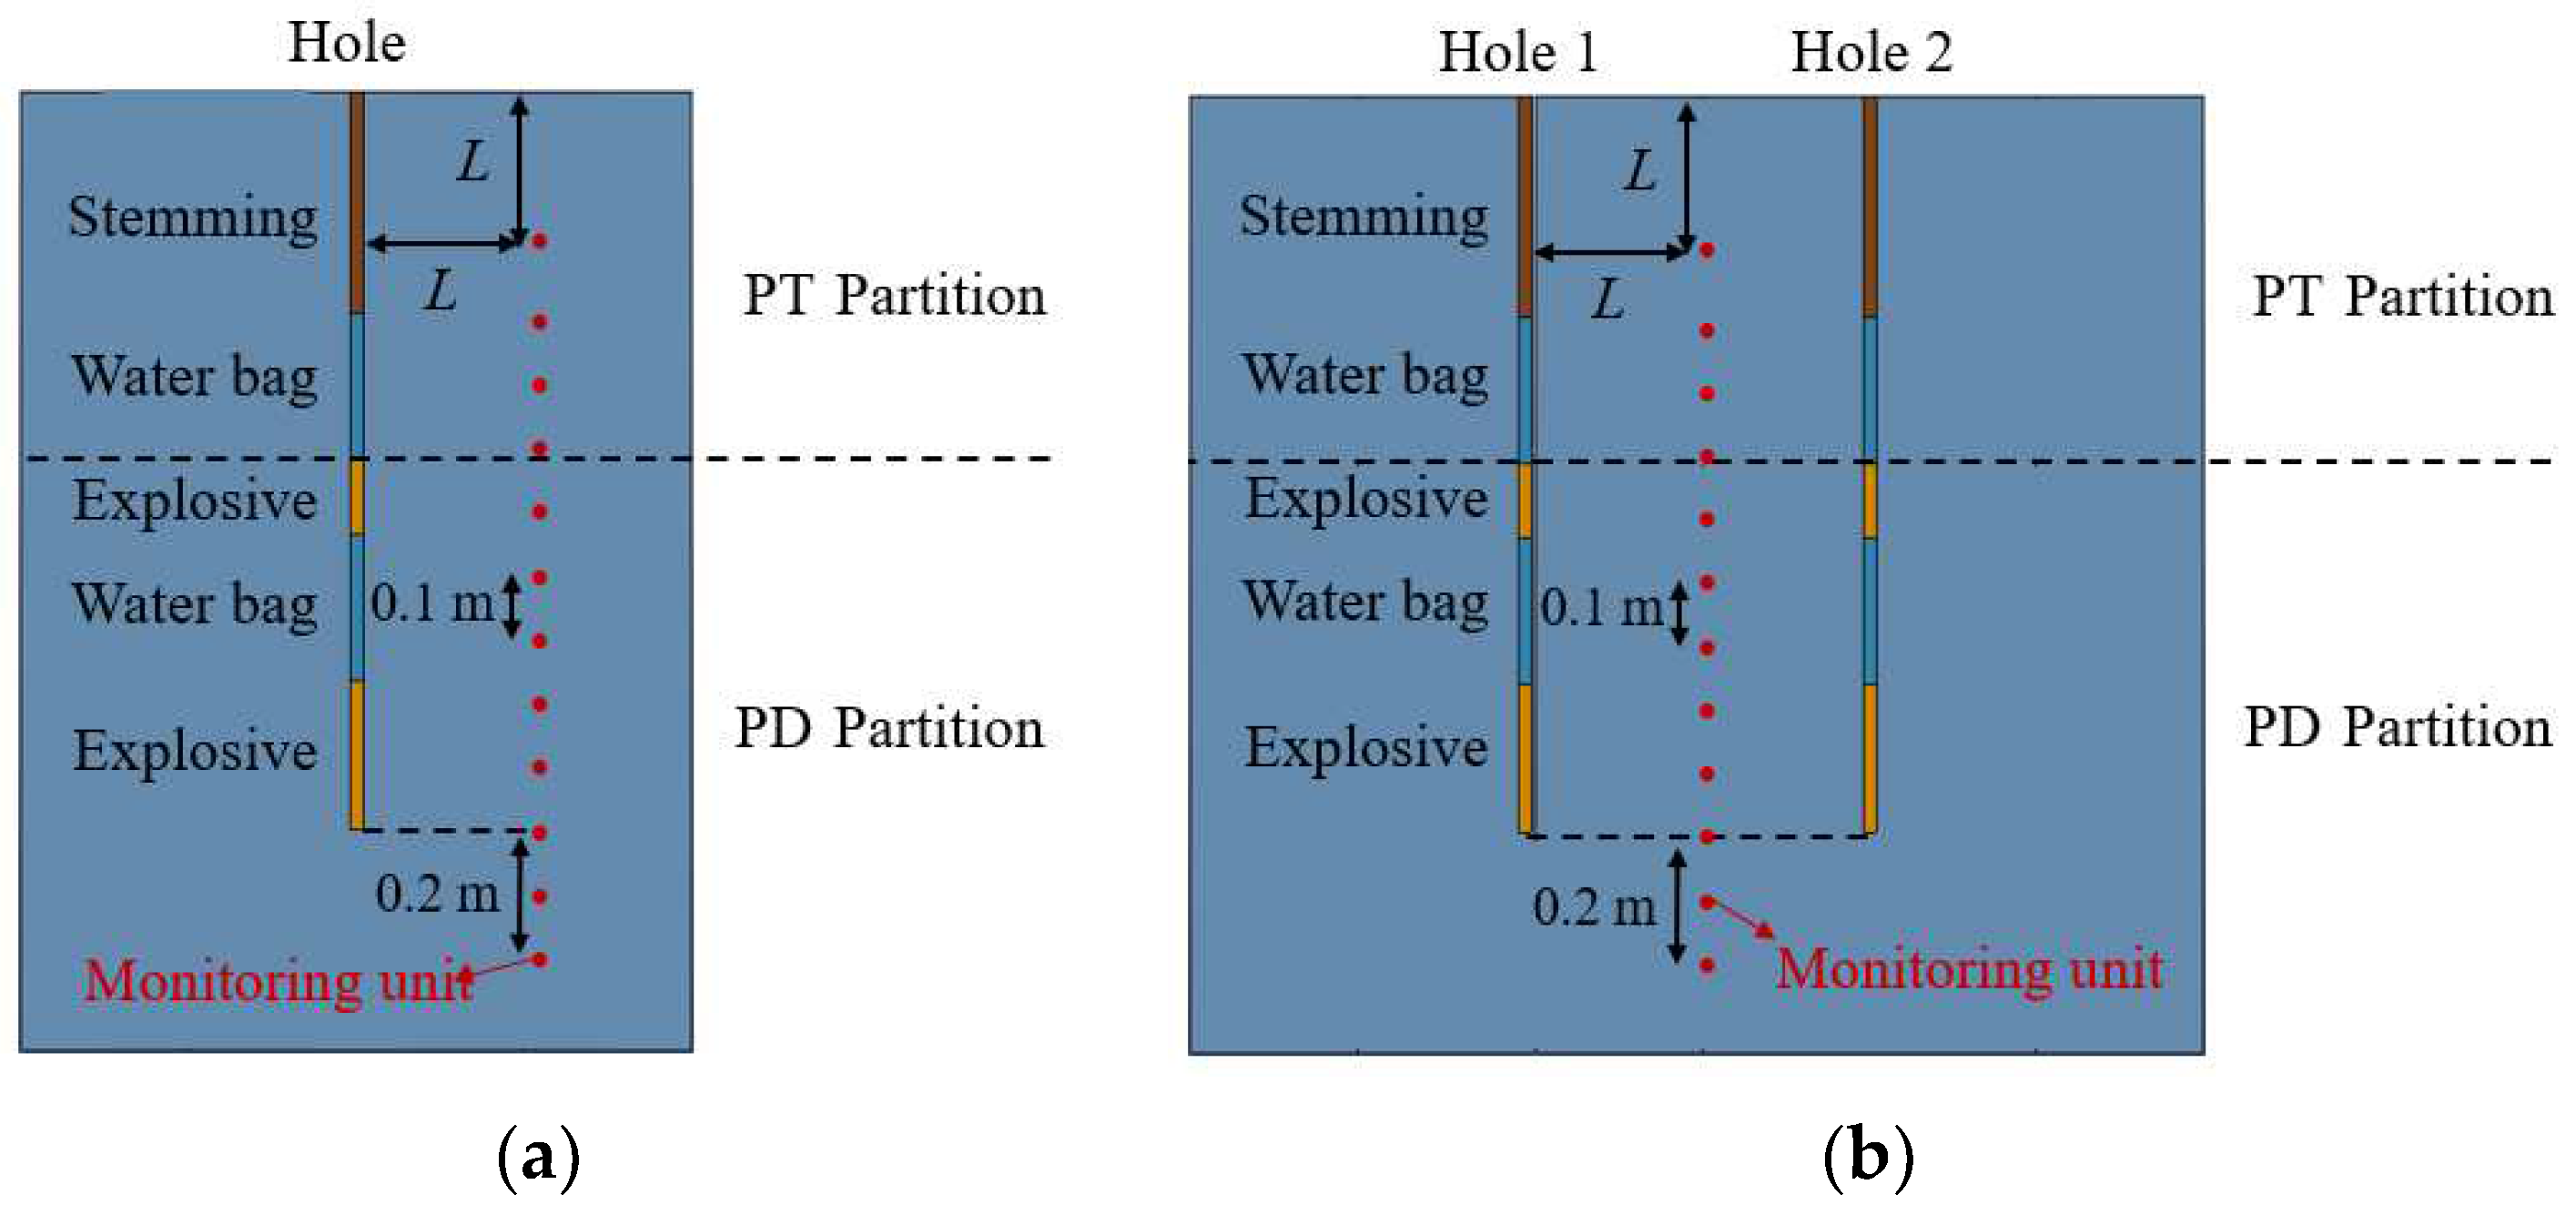
According to the above analysis, at the boundary of the crushing zone and the fracture area, as well as in the area near the free surface, to avoid the effect of compression damage, the combined index of the dynamic tensile stress strength and the damage variable is used to judge the damage of the rock. In the crushing zone, the damage by the damage variable. A plane perpendicular to the axis of the shell hole is made over the top of the upper explosive which serves as the dividing interface between the free surface tensile stress action zone (PT partition) and the complex action zone of the inter-hole charging section (PD partition). Figure 1. shows the location of the model and regional division of damage effect evaluation.

2.2. Determination of Evaluation Indicator Thresholds

2.2.1. Dynamic Tensile Strength Threshold

The stress wave produces a strongly reflected stretch at the free surface. Tensile damage is the main form of damage, and rock damage occurs when the tensile stress strength reaches the dynamic tensile stress limit of the rock. Equation (8) represents the calculation formula for the dynamic tensile strength of the rock mass under high strain rates [31]. In this study, the determined dynamic tensile strength threshold for the PT partition in this study is 7.63 MPa:
σ t > σ t d = σ s t ε ˙ 1 / 3
where σt is the tensile stress generated at any point in the rock mass under blast loading, σtd is the dynamic tensile strength of the rock mass, σst is the uniaxial static tensile strength of the rock mass, and ε ˙   is the loading rate.

2.2.2. Damage Factor Threshold

The damage effect of rock mass in PD partition is evaluated by the damage variable. Equations (9) and (10) represent the relationships between the damage variable, acoustic wave velocity, and elastic modulus:
D = 1 E / E 0
E = ρ v 2 ( 1 + μ ) ( 1 2 μ ) / 1 μ
where E0 is the original elastic modulus, E is the post-blast elastic modulus, and v represents the post-blast rock longitudinal wave velocity. After blasting rock wave velocity reduction rate η: η = 1 − v/v0, density and Poisson’s ratio before and after the blast is approximately equal. Equation (11) for the damage variable D is obtained from Equations (9) and (10).
D = 1 ( v / v 0 ) 2 = 1 ( 1 η ) 2
Using the acoustic testing method to measure the wave velocity of the rock mass before and after blasting, obtain the value of the damage variable D, and then determine the degree of deterioration of the rock mass under the action of blasting. By pertinent national regulations, when the damage variable η exceeds 10%, the rock mass initiates damage, with a corresponding threshold value of 0.19. Through statistical analysis of empirical data from domestic and international sources, researchers determined a damage threshold range between 0.75 and 0.85 for complete rock mass failure [32]. This study adopts a damage variable threshold of 0.75, even under adverse conditions.
Based on the above analyses, the tensile stress area (PT partition) and the complex action area of the hole loading section (PD partition) use different indicators to evaluate the blasting damage effect of the rock. The peak tensile stress σtmax of the monitored cell is output in the PT partition, and the peak damage variable Dmax is output in the PT and PD partitions. The relationship between the peak tensile stress σtmax of the monitoring unit and the peak damage variable Dmax with the depth of the blast hole are plotted separately to evaluate the damage effect of the rock at the monitoring unit. It is important to note that under the effect of blasting, rocks are damaged in block form. If the monitoring unit is located on a fractured rock block, the Dmax value may be less than the damage threshold of 0.75. To quantitatively describe the rock damage in the region, the ratio of the interval length with a damage variable greater than 0.75 to the total partition length was defined as CD, and the variance of the damage variable, D(CD), was used to comprehensively evaluate the effect of rock damage under different loading configurations in the case of similar CD values. The larger the CD value, the more energy the explosive allocates to destroy the rock; the smaller the D(CD) value, the more uniform the energy distribution. In the PT partition, due to the insensitivity of the HJC material model to the damage caused by tensile stress, it is necessary to combine Dmax with σtmax to make a comprehensive judgment on the damage to the rock. When σtmax is greater than the dynamic tensile strength of the rock, the rock damage can be judged visually. The composite index replaces the single damage evaluation index in the crushing zone and fracture area, and the damage of the rock at the fuzzy boundary of the two parts can be accurately judged.

2.3. Principles for Selecting Monitoring Locations

In smooth blasting operations, to achieve a uniform contour profile in tunnels, it is essential to create as many continuous fractures as possible between the peripheral holes along the axis of the boreholes. This objective is accomplished by rationally adjusting the explosive structure to control the distribution of explosive energy and enhance the rock damage effects between the boreholes. In order to accurately evaluate the damage to the rock around the peripheral holes, set monitoring units in the middle of the two holes. Taking half of the distance of the peripheral holes as the distance of the top monitoring unit from the free surface and every 10 cm along the axis of the holes set. Set the monitoring unit at 20 cm below the bottom of the hole to analyze the residual hole. Figure 2 shows the location of damage monitoring units in the partition of the method for evaluating the damage effect of rock blasting.

3. Numerical Models and Parameter Selection

3.1. Numerical Model

LS-DYNA 18.2 is a highly efficient non-linear dynamic analysis software that provides a high-energy explosive material model, is particularly well suited to handling high strain and high deformation problems. Due to these advantages, LS-DYNA has become an effective tool for researching and solving blasting-related problems, reproducing the explosive process while reducing experimental costs.
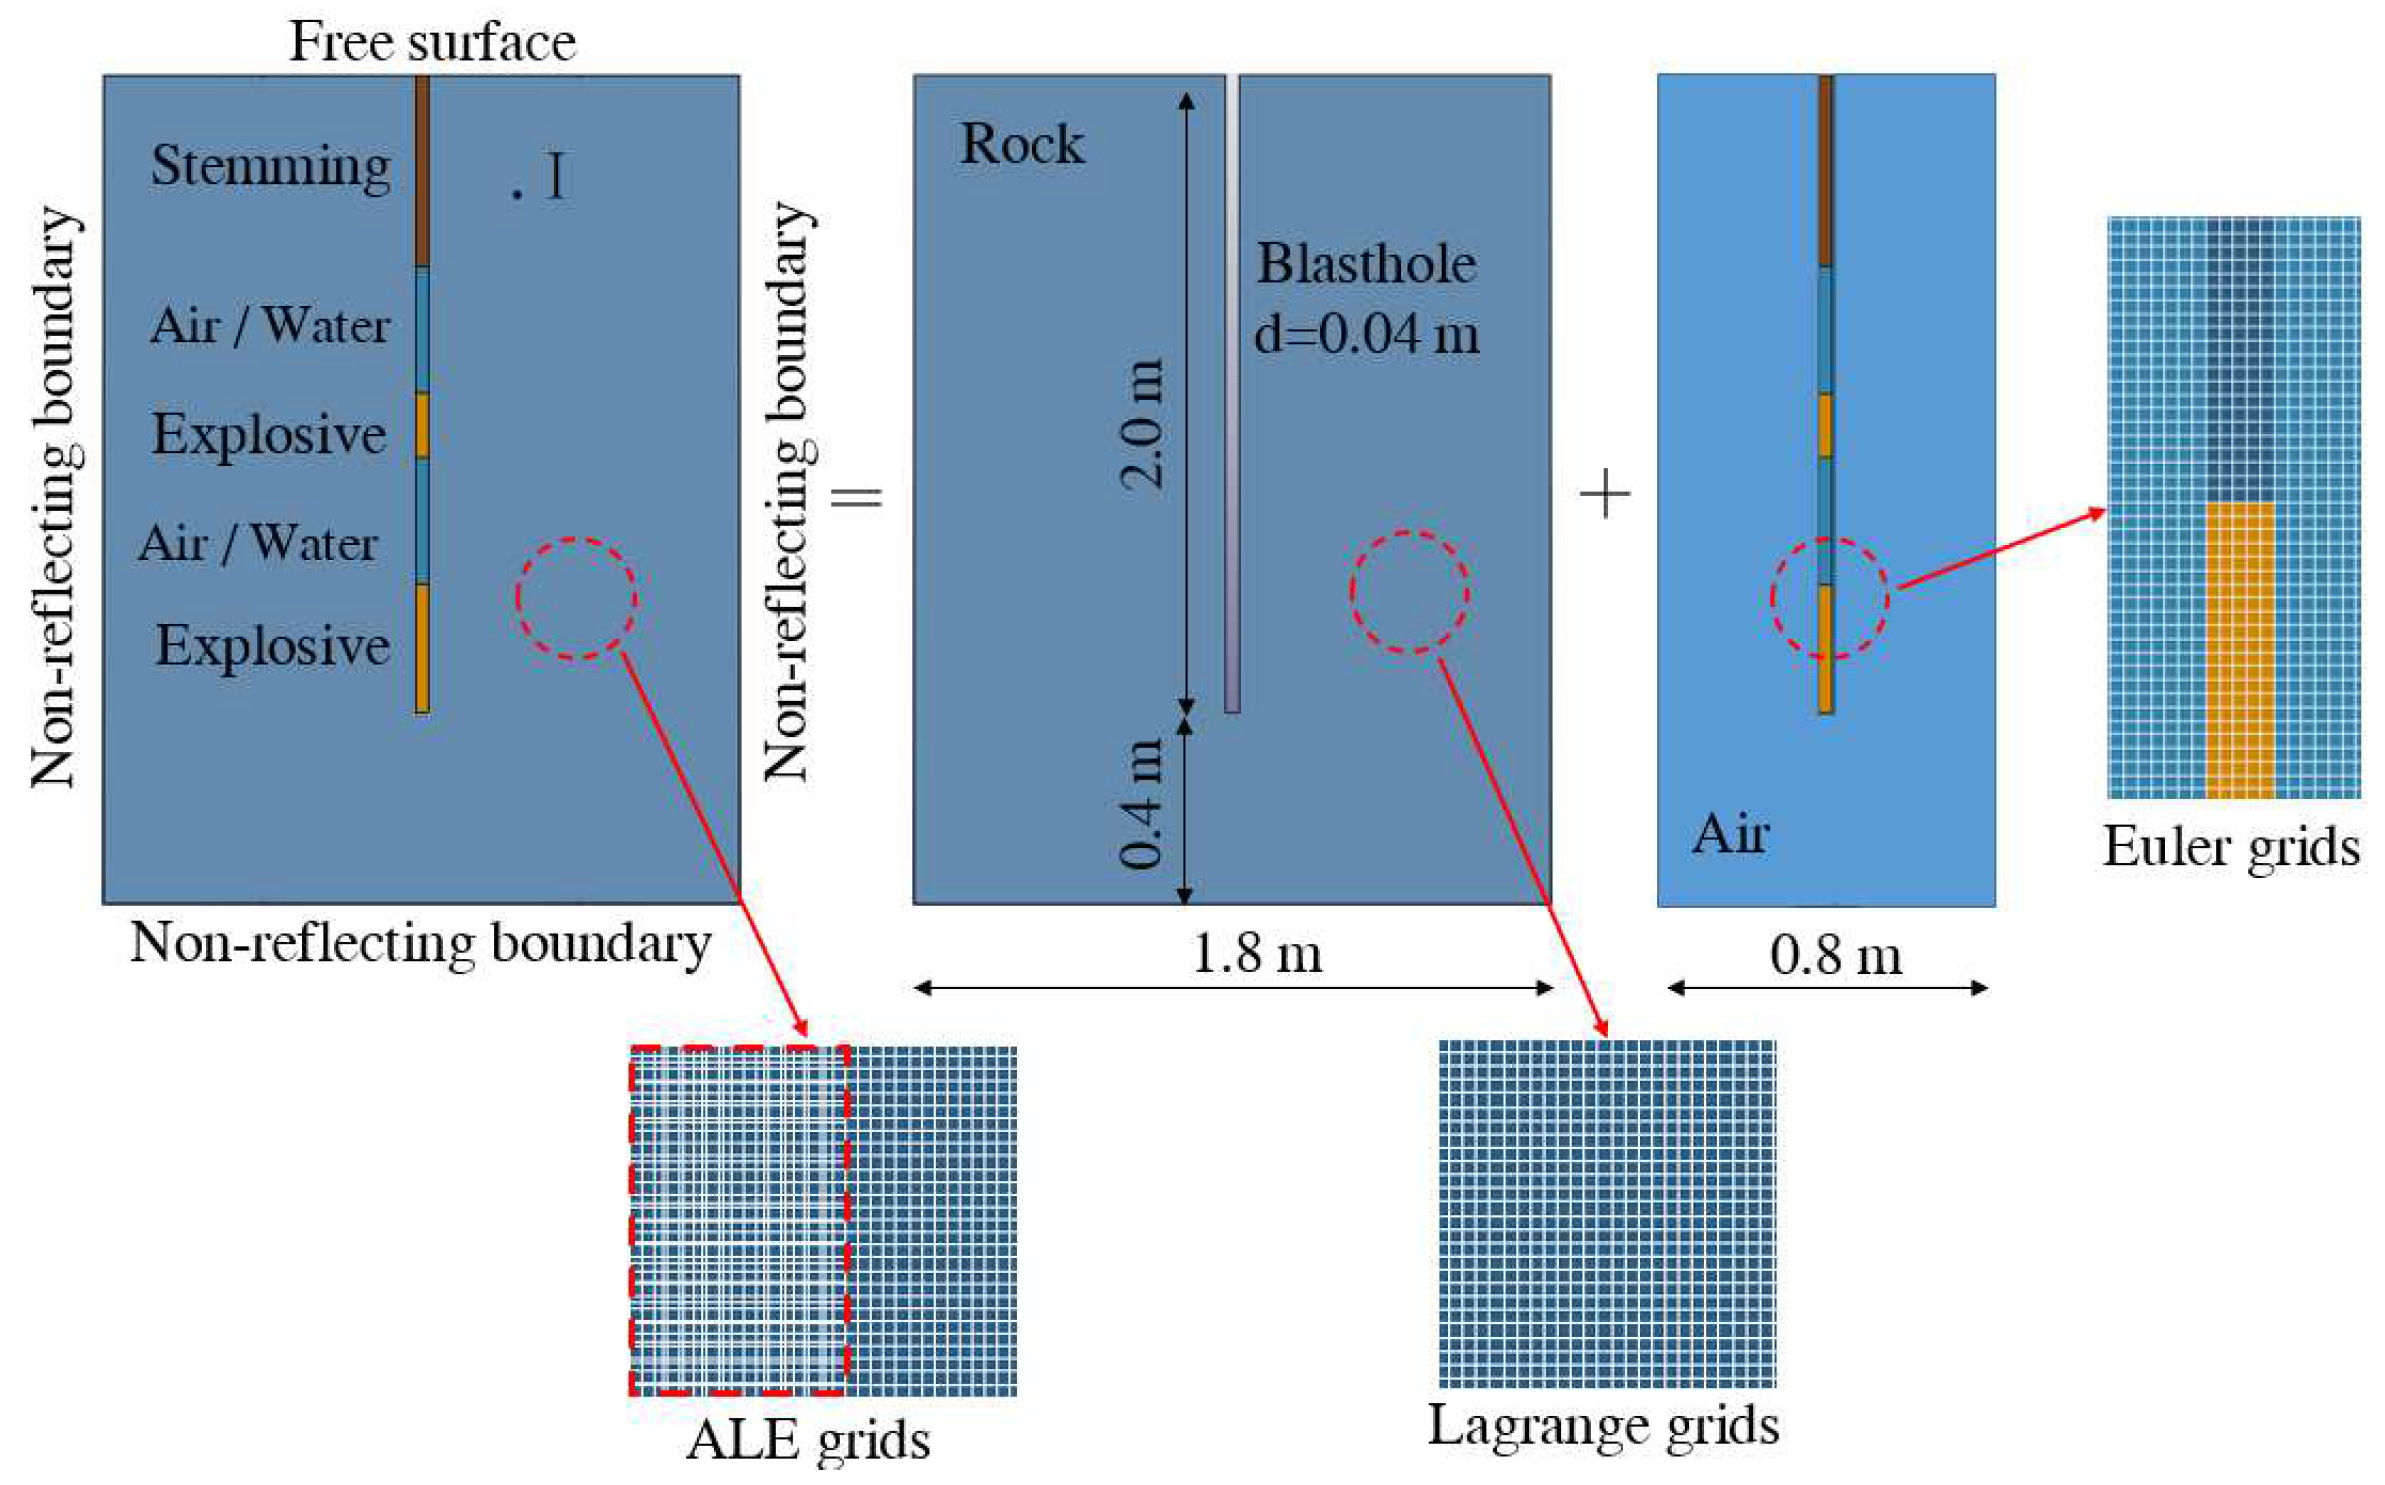
Taking the tunnel project of Liyue Road in Chongqing as an example, the Arbitrary Lagrangian–Eulerian (ALE) algorithm is used in the LS-DYNA program to establish a single-layer solid quasi-3D model to improve the computational efficiency. In the ALE algorithm model, the blasting load is transferred from the Euler grid to the Lagrange grid, which belongs to the unidirectional coupling layering method in the computational multiscale method, and more accurate calculation results can be obtained [33]. The rock serves as the solid material and the remaining material serves as the fluid material, with air as the coupling medium. In the modeling of air interval charge structures, air also serves as the interval medium. To ensure that the model boundary does not affect the calculation results, the distance from the boundary to the hole should be increased and the non-reflective boundary conditions added reasonably to achieve the purpose of no damage at the boundary. The model was 2.4 m high and 1.8 m wide, the diameter and length of the blast hole were 0.04 m and 2.0 m, the length of the stemming material was 0.6 m, the interval media was 0.4 m, and the length of the upper and lower sections of explosives were 0.2 m and 0.4 m. The upper boundary of the model was a free surface, and the rest of the boundaries were set with no-reflection boundary conditions by the keyword BOUNDARY_NON_REFLECTING. Describe the blasting process using the combined JWL equation of state with high explosives. The kg-m-s unit system was used. Figure 3 illustrates the established model and meshing. The distance between the peripheral holes in the project is 0.5 m. Therefore, unit I is placed at 0.25 m from the free surface as the monitoring reference unit for the damage effect evaluation.
Three types of grids are illustrated in Figure 3. The Euler grids are used to describe the motion of a continuous medium such as a fluid or gas by dividing the space into a fixed grid of cells and tracking the motion of the fluid through these grids. The Euler grids are suitable for dealing with macroscopic motions of continuous media such as fluids or gases. Unlike the Euler grids, the Lagrange grids are a kind of body-following grids, whose nodes move and deform during the motion. When the deformation is large, it often results in mesh distortion and fails to obtain accurate results. The ALE grids combine the advantages of the Lagrange and Euler methods, and their grids can move and deform with the motion of fluids and solids, which is suitable for dealing with fluid-solid coupling problems, such as deformation under the action of blast shock waves, fluid-structure interactions, and other complex cases. In the fluid-solid coupling region, a multi-matter unit group is created, and the coupling relationship is established by the keyword CONSTRAINED-LAGRANGE-IN-SOLID. In this study, the numerical model is divided into a square grid with grid sides of 0.5 cm. The coupling width is 20 times the diameter of the blasting hole to ensure the accuracy of the calculations.

3.2. Sandstone Material Parameters

The HJC model includes three aspects of the equations of state, the equivalent yield strength equations, and the damage evolution equations [34]. The equivalent yield strength is a function of pressure, strain rate, and damage, and pressure is a function of volume strain. Equation (11) is the equivalent yield strength equation:
σ * = A 1 D + B P * N 1 + C ln ε ˙ *
where σ* is the normalized equivalent force; P* is the normalized pressure; ε ˙ * is the dimensionless strain rate; D is the damage variable; and A, B, C, and N are the material constants.
In this study, the HJC model is used to investigate the dynamic response of rock under the action of explosion. The basic mechanical parameters were obtained experimentally from the rock samples collected in the field, and the rest of the parameters were referred to [35]. Table 1 shows the model parameters.

3.3. Material Parameters of ALE

3.3.1. Explosives Material

The keyword MAT-HIGH-EXPLOSIVE-BUEN joint JWL equations of state are used to describe the explosive reaction process [36]. The main parameters are explosive density ρ = 1090 kg/m3, detonation velocity is 3500 m/s, blast wave pressure PC-J = 3.34 Gpa, and initial specific internal energy E0 = 4.192 Gpa.

3.3.2. Water and Air Material

The empty matter material model MAT-NULL represents water and air and describes their state changes by the joint equations state Gruneisen and Liner, respectively [37]. The main parameters of water are the density of 1000 kg/m3, software parameters GAMAO = 0.5, Aw = 1.393, C = 1480, S1 = 2.56, S2 = −1.99, and S3 = 0.23. Air parameters are the density of 1.29 kg/m3, the initial internal energy is 2.5 × 10⁻⁴ Gpa, and constants C4 and C5 are 0.4.

3.3.3. Stemming Material

The material model MAT-SOIL-AND-FOAM is selected for the stemming material. And the key parameters are density 1800 kg/m3, shear modulus G = 0.02 Gpa, bulk modulus B = 0.035 Gpa, yield function constant A0 = 0.0161 Gpa, volume strain values EPS2 = 0.05, EPS3 = 0.09, EPS4 = 0.11, relative pressure P2 = 34 Gpa, P3 = 45 Gpa, P4 = 66 Gpa [11].

4. Results and Discussion

4.1. Rock-Damaging Effects of Different Interval Medium

Conventional faceted blasting uses air as the interval medium. In soft rock tunnel blasting with developed joints and fissures, the explosive gas will leak quickly, resulting in poor blasting results. To address this issue, we maintain the interval charge structure by replacing air with water as the medium. Leveraging the incompressibility of water and its high flow viscosity, we aim to enhance the blasting effect. Figure 4 shows the charging structure.
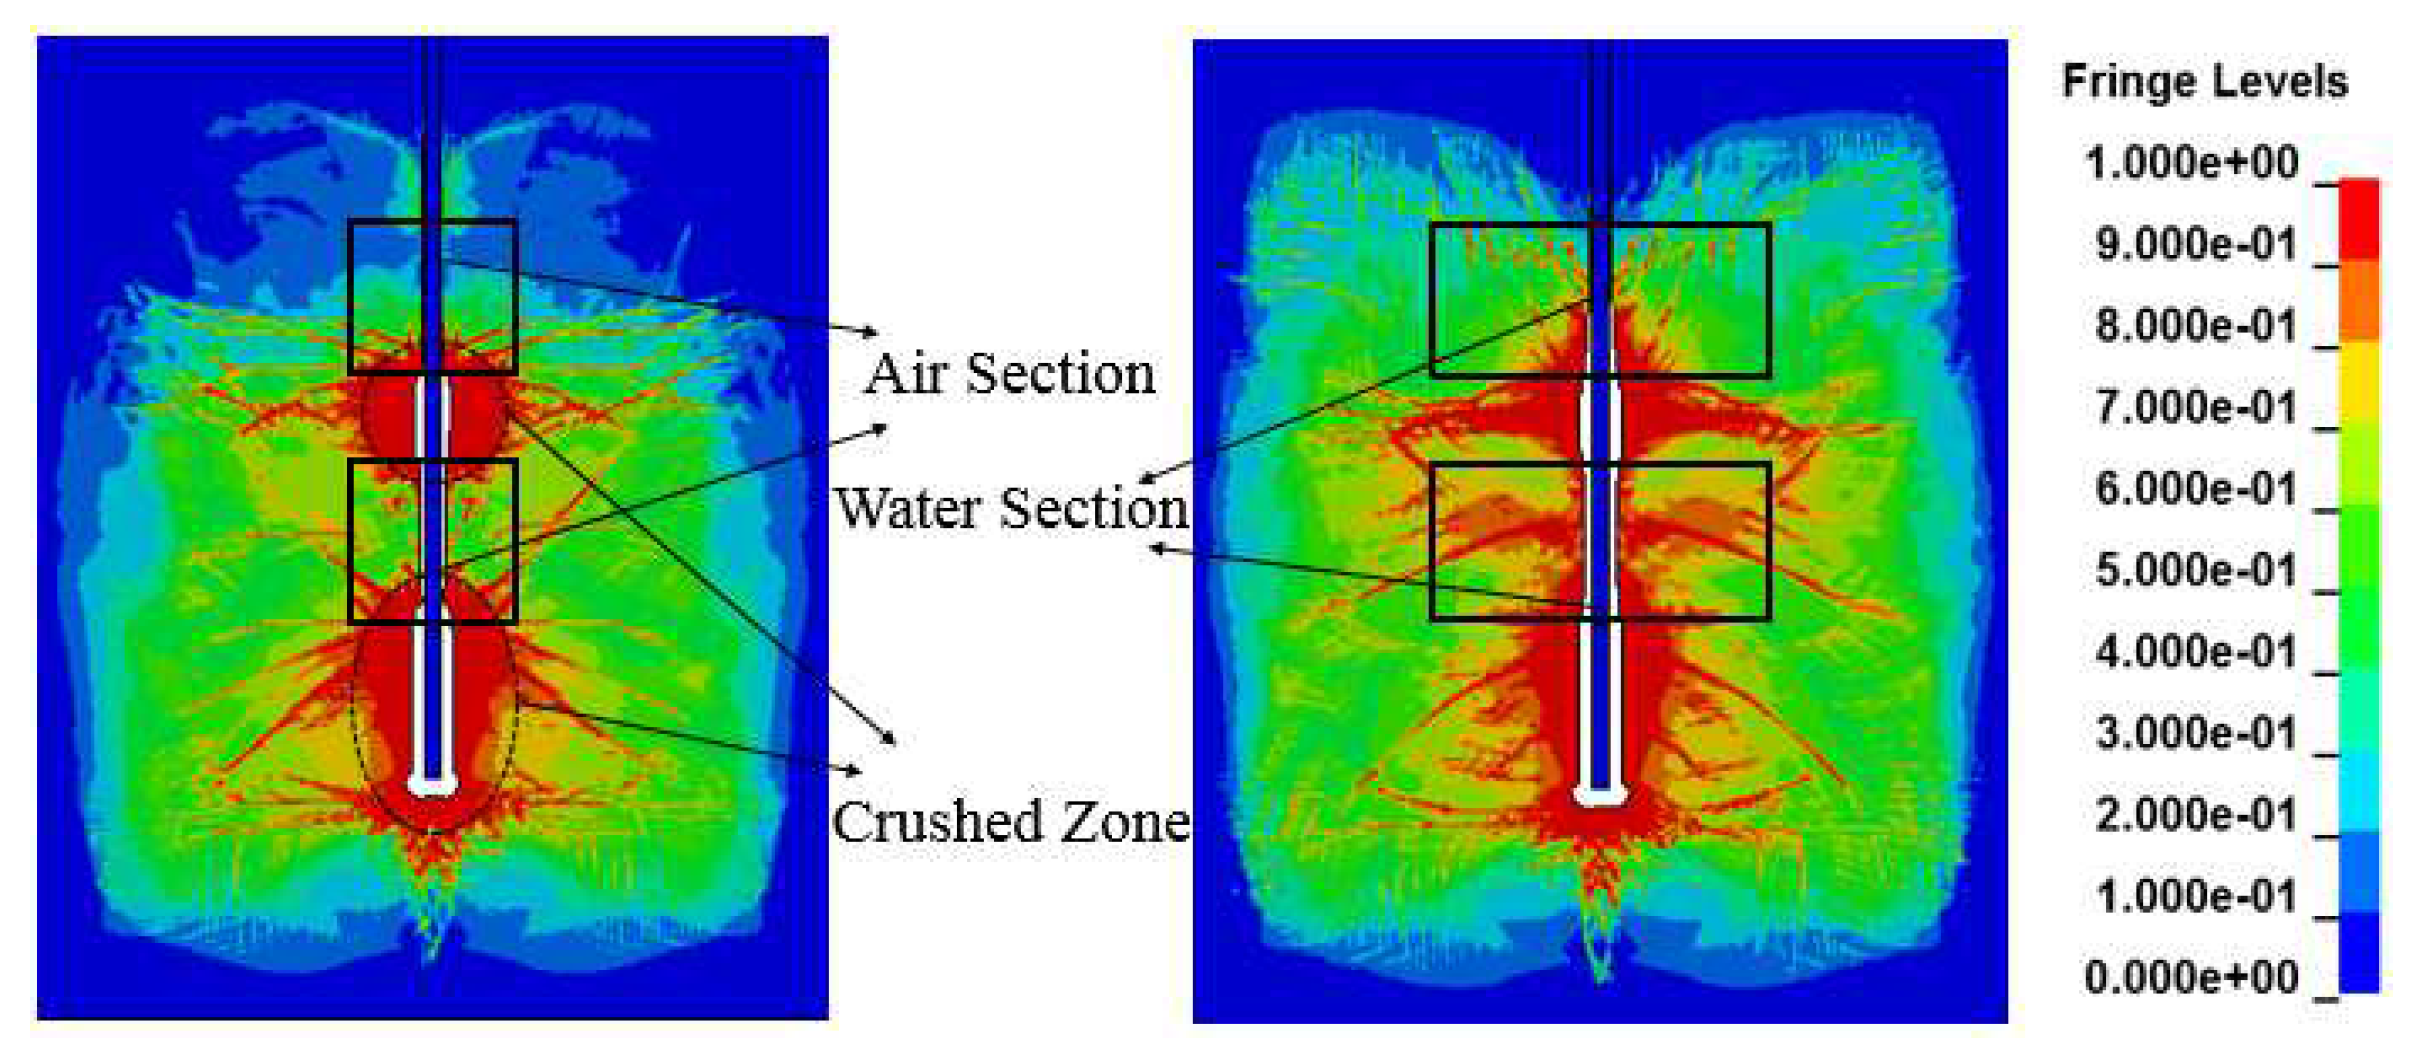
The detonation position was at the bottom of the lower explosive, and 0 ms detonation time was set by the keyword *INITIAL-DETOTION. The blast stress wave propagates from the bottom of the hole to the free surface in about 0.6 ms. Figure 5 shows the damaged cloud at that moment; rocks fracture at damage factors more than 0.75 and appear orange and red on the damage cloud map. While the precise location of the boundary between the crushing zone and the fracture area remains uncertain, a reasonable range can be identified. In this simulation, the ratio of the width of the crushing zone to the radius of the explosives is approximately 6, aligning with the findings of the experimental study conducted by HAGAN et al. [38]. This consistency lends credibility to the reliability of the simulation results. As can be seen from Figure 5, under the air interval charge condition, the damage to the surrounding rock caused by the stress wave in the air section is rapidly reduced. The damage variable in the central air section is about 0.5, with a length of about 26 cm, and the rock is in a fractured but not peeling state. Under the water interval charge condition, the uniformity of damage distribution is greatly improved with the water-spaced charge. The position of the water interval still shows a significant range of damage, with an overall increase in damage area of approximately 25.6 percent and a notable increase in energy utilization.
To analyze the damage of the rock around the borehole, Unit I was taken as the monitoring reference unit, and one monitoring unit was taken every 10 cm down the axis of the borehole, with a total of 20 units. Extract the peak tensile stress σtmax for 8 units in the PT partition. To study the variation relationship between σtmax and Dmax in PT partition and to assess the reasonableness of partition boundary delineation, this paper extracts the peak value of the damage variable Dmax values for all the monitoring units. Figure 6 shows the variation of σtmax and Dmax with the depth of the borehole.
From Figure 6, it can be seen that the stresses applied to the rocks in the PT partition all exceed the dynamic tensile strength σtd. Dmax is below 0.75, which is because the HJC model considers the tensile limit with the maximum tensile stress, which simplifies the expression of the tensile damage behavior of brittle materials under dynamic loading. Therefore, PT partition has tensile damage as the main form of damage, so the damaging effect of the rock cannot be judged only based on Dmax values. In the range of 0.5 m~1 m, σtmax and Dmax values under water interval conditions both show a double-peak trend of increasing and then decreasing, and there is an obvious correlation, indicating that the region is dominated by tensile damage while other forms of damage exist. There is no correlation in the case of air interval charges, which is due to the compressibility and fluidity of the air, which exacerbates the complexity of stress propagation and the irregularity of rock failure. The incompressibility of water and the high flow viscosity enhances the destructive effect of explosive energy on rocks. At the interface of the sub-division, the damage variable jumps from 0.5 to more than 0.75 at the hole depth of 1 m ± 5 cm, indicating that other forms of damage other than tensile damage have occurred at this location, and the rock damage is no longer dominated by tensile damage. The change of damage forms shows that this place is reasonable as a sub-interface.
Figure 6b shows that the CD values of PD partition is about 30% and 42% under air interval and water medium interval conditions, while the average increase of Dmax is about 12.6% under the water medium interval conditions. Water medium has some advantages in improving the energy utilization of explosives and distributing the energy of explosives uniformly.

4.2. Damage Effects of Rocks under Different Water Interval Charge Configurations

In Section 4.1, the results of the study confirm the validity of the evaluation method and show that the water interval charge structure is more effective for smooth surface blasting. On this basis, this section optimizes the water interval charge structure and carries out field trials.

4.2.1. Length of Water Interval at the Bottom of the Blast Hole

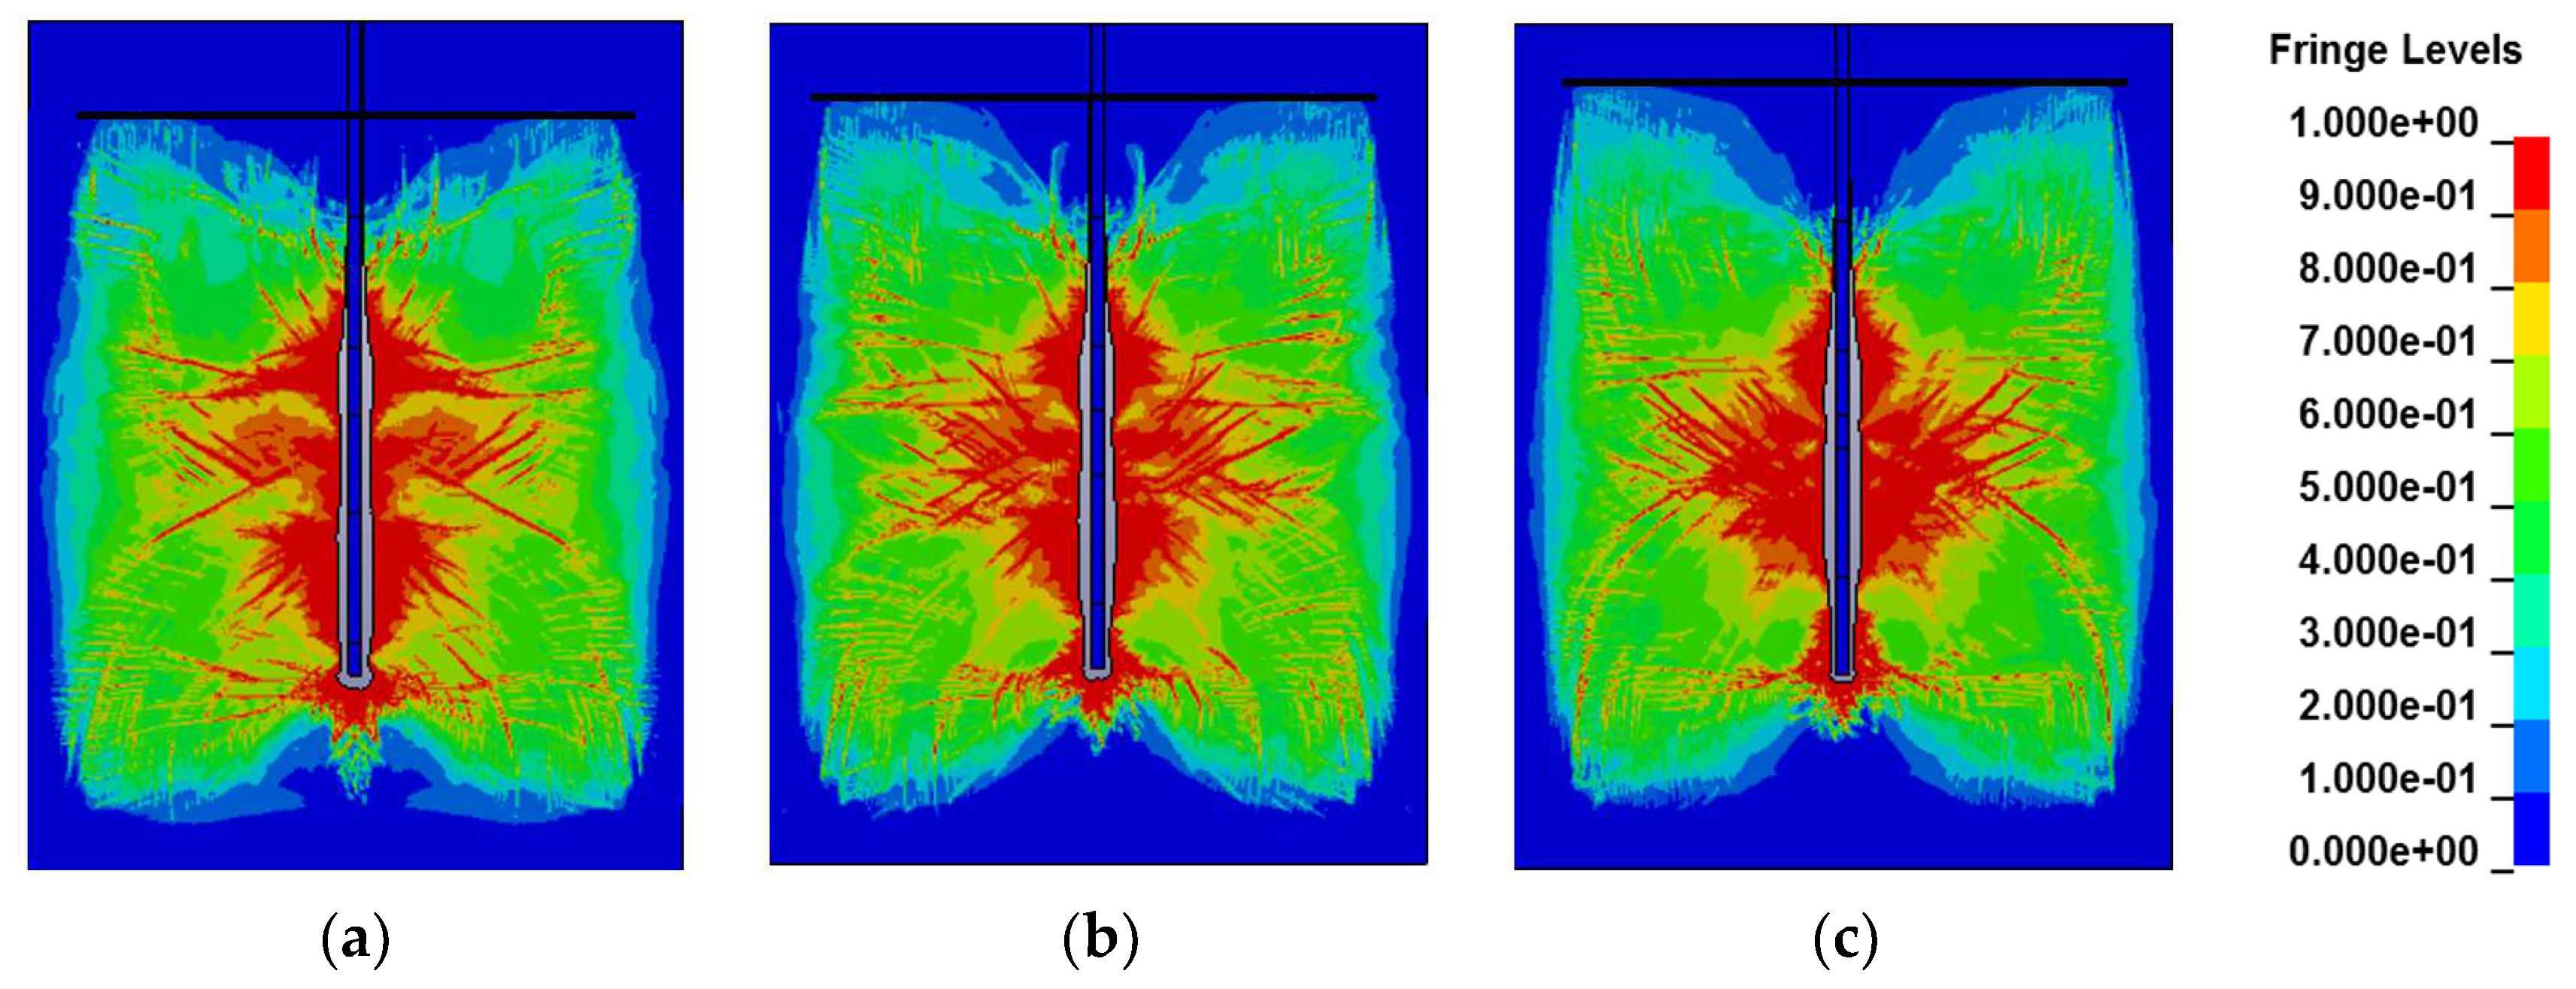
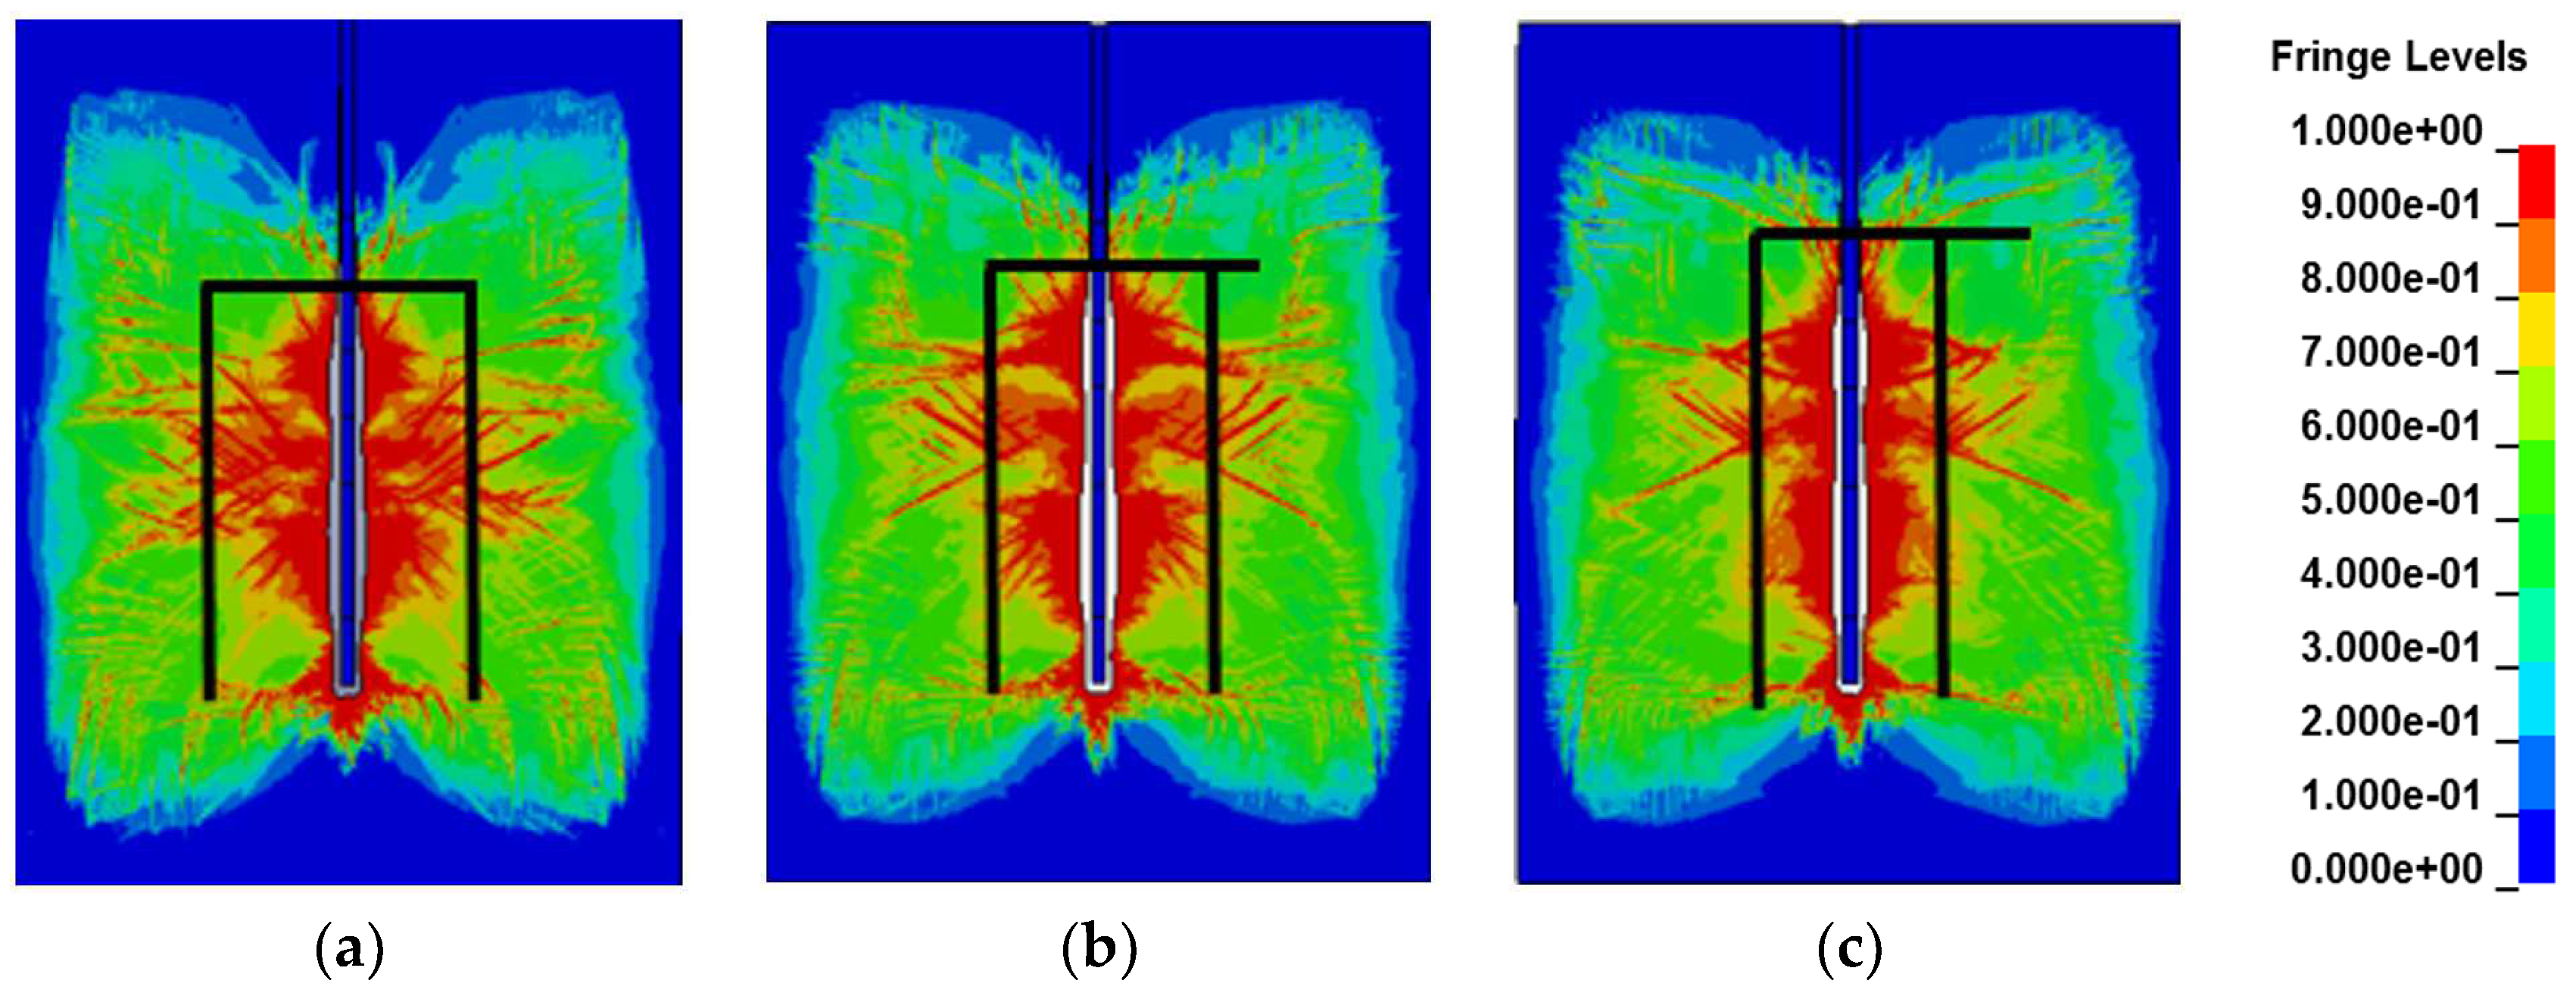
In tunnel blasting, the explosive charge at the bottom of the blast hole is relatively concentrated and far from the free surface, which is easily caused by excessive damage to the rock near the bottom of the blast hole. To avoid over-excavation of the rock at the bottom of the borehole, using the control variable method, 10 cm, 20 cm, and 30 cm water bags are set here to protect the rock while moving the explosive center of gravity upwards to improve the distribution of explosive energy. The charging structure is CS#1, CS#2, and CS#3 (CS is the abbreviation of Charge Structure, and CS#1 means the first charging structure), as shown in Figure 7. Figure 8 shows the cloud diagram of surrounding rock damage at 0.6 ms.
Figure 8 shows that as the center of gravity of the explosives rises, the damage range shifts upwards, and the damage width at the bottom decreases. With the distance between the upper and lower explosives reducing, the damage in the middle of the hole is aggravating, which is not conducive to the damage of other parts of the rock body and the reasonable distribution of explosive energy.
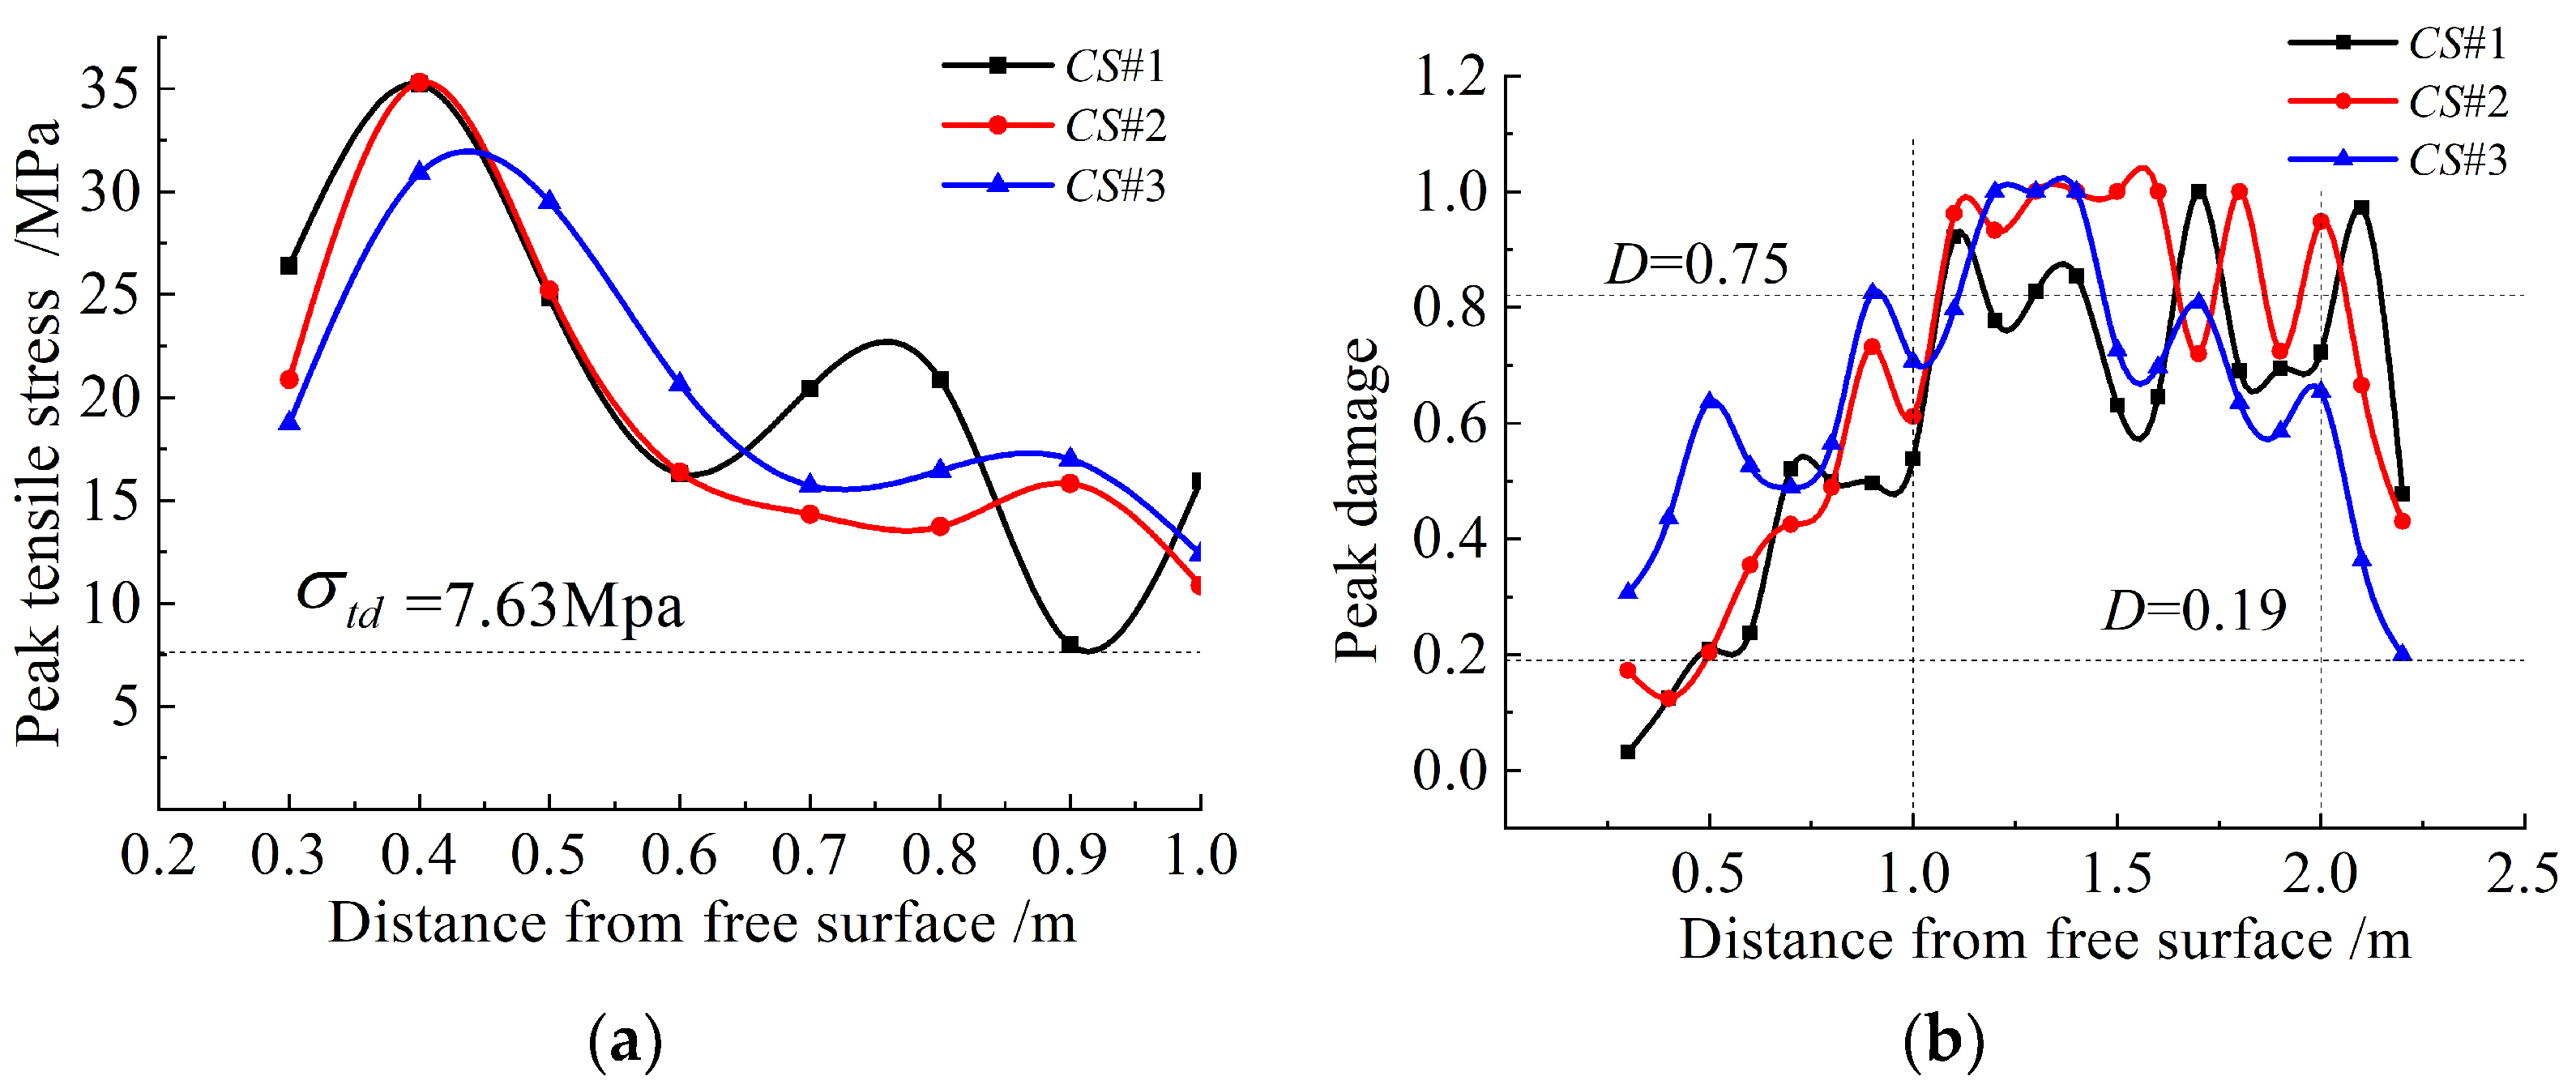
Extract the peak tensile stress σtmax for 8 units in the PT partition, and extract the peak value of the damage variable Dmax for all the monitoring units. Figure 9 shows the variation of σtmax and Dmax with the depth of the borehole.
Figure 9 shows that in CS#1, the tensile stress fluctuates obviously in the range of 0.6 m~1.0 m, and σtmax is equal to σtd at the hole depth of 0.9 m. Because the middle water medium is long, the stress wave generated by the upper and lower parts of the explosive cannot be effectively superimposed, and underexcavation may occur. The trend of σtmax of CS#2 and CS#3 is similar, which is greater than the dynamic tensile strength; a comprehensive evaluation of the damage to the rock by Dmax is needed. Dmax increases rapidly to 0.75 at the hole depth of 1 m ± 5 cm, indicating that the rock has been completely damaged at this location. According to Figure 9b, the CD values of CS#1, CS#2, and CS#3 are 50%, 70%, and 50%, and the variance D(CD) values are 0.14, 014, and 0.18, respectively. In addition, the mean value of the maximum value of the damage variable Dmax values in CS#2 is about 13.3% and 21.4% higher than that of CS#1 and CS#3, while CS#3 from 1.75 m to the bottom of the hole Dmax values are less than 0.75. Large clamps at the bottom of the hole can easily lead to underbreak.
At 8 cm below the hole bottom, Dmax is equal to 0.75 and tends to decrease rapidly under the CS#2 condition, which reduces the damage to the retained rock mass while breaking the rock. Considering the changes of σtmax and Dmax values together, CS#2 can obtain a better blasting effect.

4.2.2. Length of Water Interval at the Top of the Blast Hole

Based on the study of Section 4.2.1, the length of the upper water bags for CS#2 was adjusted using the control variable method. Set 30 cm and 20 cm water bags at the orifice, indicated by CS#4 and CS#5. Figure 10 and Figure 11 show the charge structure and the cloud diagram of damage to surrounding rock at 0.6 ms, respectively. The figure shows that as the water bags at the orifice become shorter, the center of gravity of the explosives shifts upwards, and the damage zone is no longer concentrated in the middle of the blast hole. However, the rock damage at the bottom of the hole tends to decrease because the water bags in the middle become longer and weaken the superposition of stress waves.
This section covers three charge configurations. The range sizes of PT and PD partitions are different. For comparison, CS#2, which has the largest area of PT partition, is taken as a reference. Extract the peak tensile stress σtmax for 8 units in the PT partition and extract the peak value of the damage variable Dmax for all the monitoring units. Figure 12 shows the variation of σtmax and Dmax with the depth of the borehole.
Figure 12 shows that σtmax is greater than σtd in PT partition, which reaches the destructive strength of the rock. As the length of the upper water medium changes, the height of the PD partition changes to 1 m, 1.1 m, and 1.2 m. According to Figure 12b, the lengths of the damage variables greater than 0.75 in the PD partition of CS#2, CS#4, and CS#5 are about 70 cm, 80 cm, and 60 cm, which means that the percentage of CD is 70%, 72.7%, and 50%, and the variance D(CD) values are 0.18, 0.15, and 0.21, respectively. It shows that the damage distribution in the PD partition of CS#4 is more uniform, which is no phenomenon of local damage that is too large or too small. Dmax values at 8 cm below the bottom of the hole is 0.86, the soft rock with developed joints and fissures and poor blastability, avoiding the phenomenon of underbreak while not causing extensive damage to the bottom of the hole. Considering the variation of CD and Dmax values together, CS#4 can maintain a high level of damage steadily in the PD partition, while having a higher level of tensile stress in the PT partition, resulting in better blasting results.

4.3. Damage Effect of Rock under Different Eplosive Quantities

In smooth blasting, the hole spacing is small, with stress waves between neighboring holes conducted in the direction of each other along the connecting lines of the holes, which strengthens the superimposed interference effect and makes it easier to form through fissures. When studying the impact of the explosive charge on the destructive effects, considering the interaction of stress waves between blast holes due to changes in the charge can lead to more accurate results. Therefore, double blast holes with different plosive quantities are established to evaluate the variation of stress wave interactions on the rock damage effect. According to CS#4, the length of the upper explosive is reduced by 10 cm, while the length of the lower explosive is reduced by 10 cm and 20 cm, as indicated by CS#7 and CS#8. Figure 13 and Figure 14 show the charge structure and the cloud diagram of damage to surrounding rock at 0.6 ms, respectively. Figure 14 illustrates that the damage between the holes is more severe than on both sides of the holes due to the superposition of stress waves. The degree of damage decreases with the reduction of plosive quantity. When the quantity reduces to a critical value, the damage falls below the threshold value. As a result, the stress waves cannot produce numerous through-cracks between adjacent blast holes, nor can they form a flat profile surface.
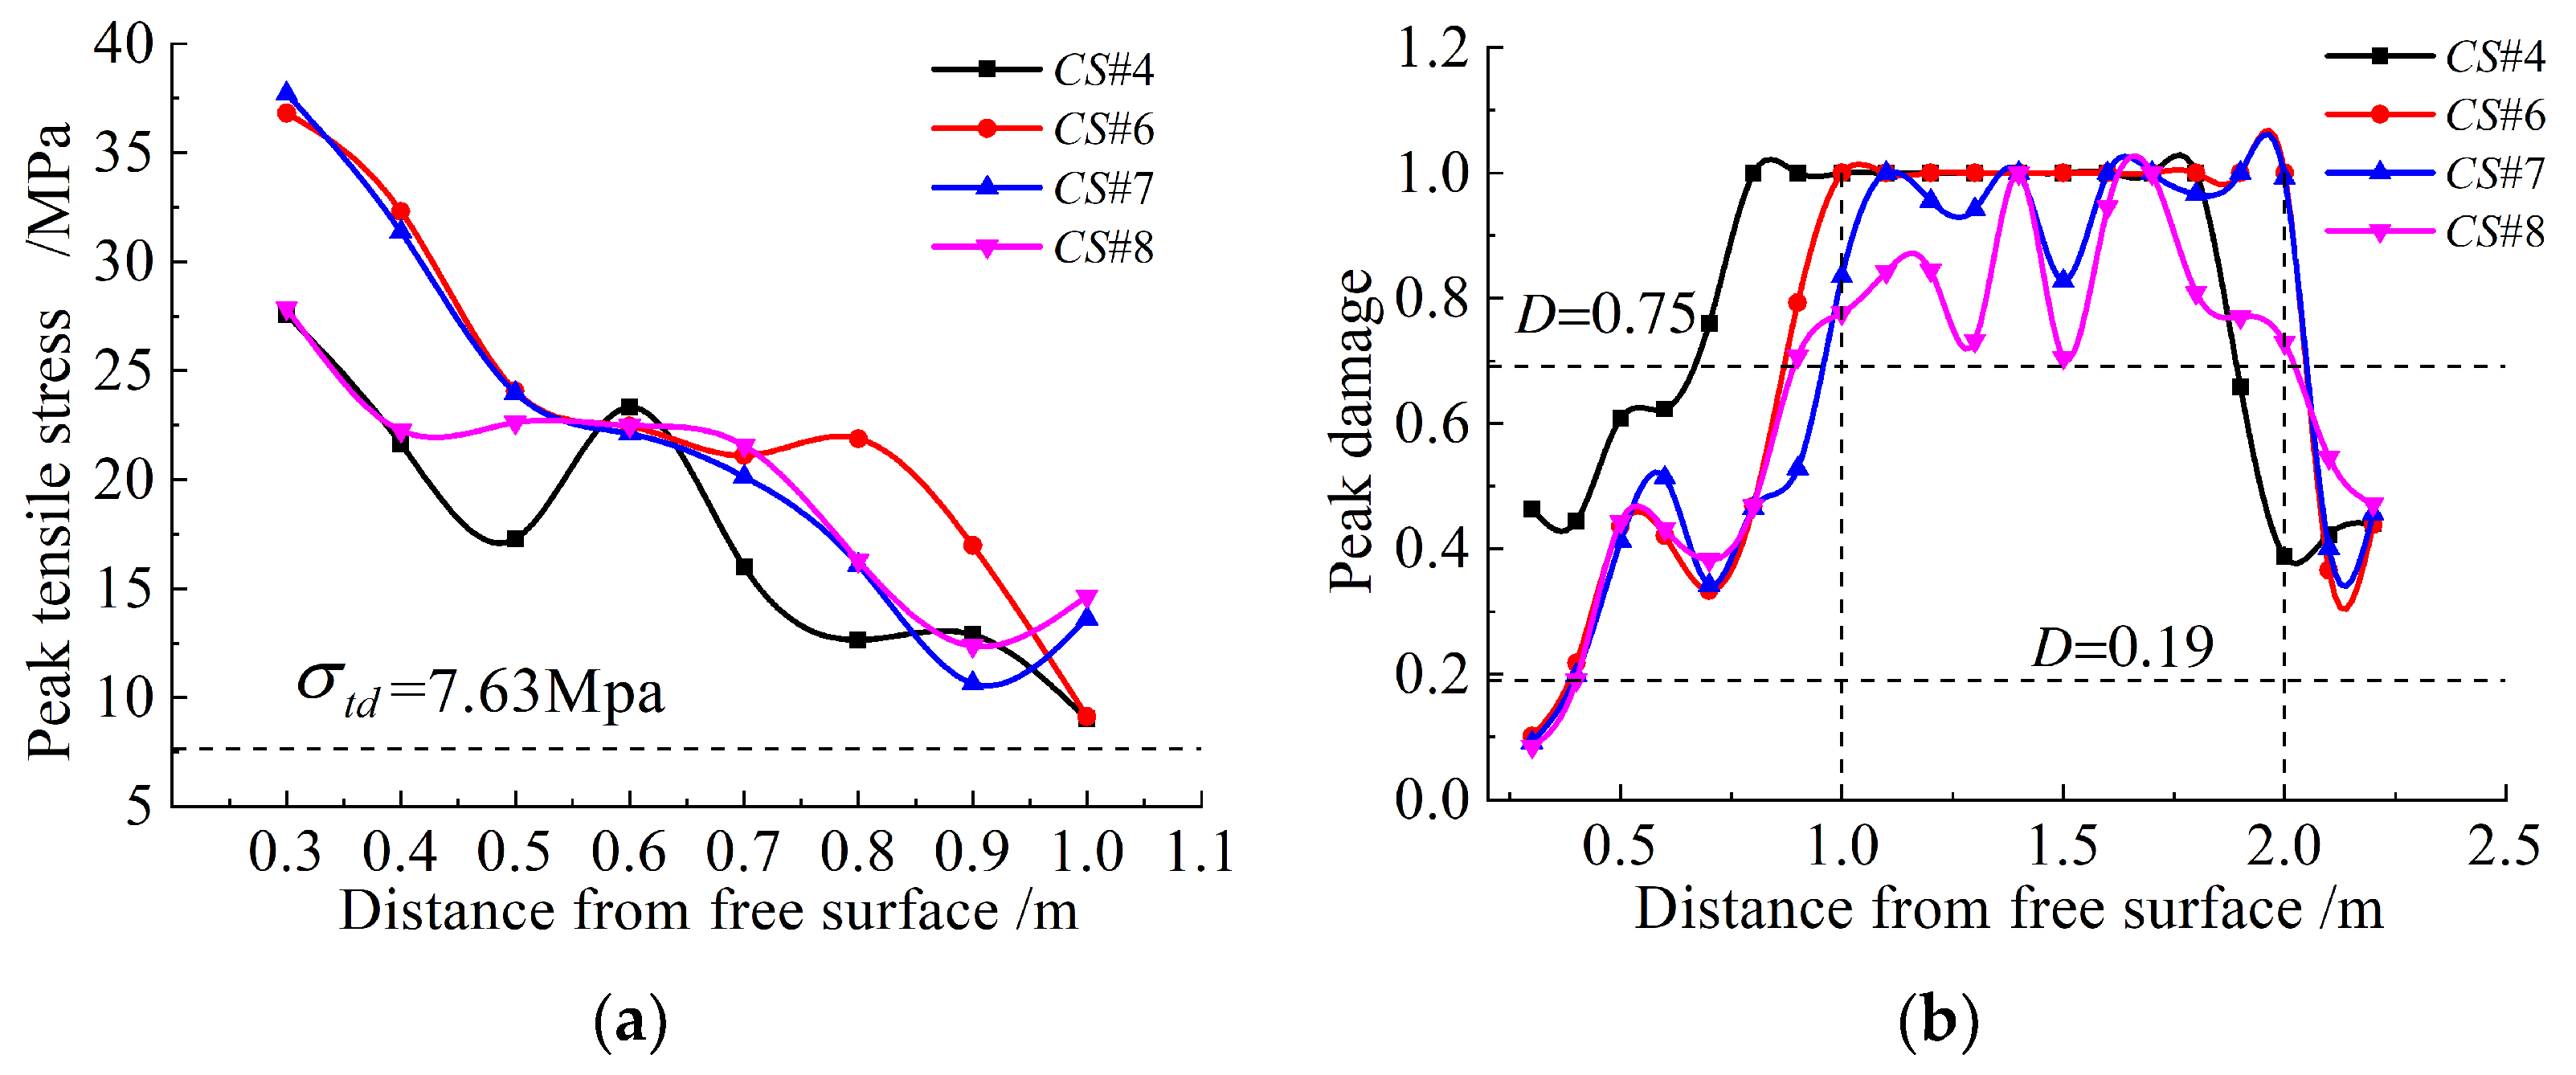
Extract the peak tensile stress σtmax for 8 units in the PT partition and extract the peak value of the damage variable Dmax for all the monitoring units. Figure 15 shows the variation of σtmax and Dmax with the depth of the borehole.
Figure 15 shows that all four charging structures can damage the rock in the PT partition. CS#6 reduces the charge by 16.7% compared with CS#4, and the distance of the upper explosive from the free surface increases by 10 cm, while the σtmax at the orifice increases by about 33.9%. CS#7 reduces the charge by 20% compared with CS#6, and the distance of the lower explosive from the free surface increases by 10 cm, but the σtmax at the orifice is about the same for both. The tmax at the orifice is approximately equal. Under the same change condition, σtmax at the orifice of CS#8 is 25% lower than that of CS#7. Therefore, CS#8 is the best, while CS#7 is the second best. For the preferred charge structure, it is necessary to evaluate the rock damage effect of the PD partition as well. Figure 15b shows that the CD values of the four charge structures are 90.9%, 100%, 100%, and 80%. Among them, the Dmax values of CS#4 and CS#8 did not reach the damage threshold at ±10 cm from the bottom of the hole, which increased the risk of the residual hole phenomenon. The Dmax values of CS#7 and CS#8 showed similar trends, with a decrease in Dmax values at 1.5 m of the middle water medium. The longer the length of the mid-water medium, the smaller the Dmax value is, and when the length of the water medium exceeds 40 cm, the Dmax value decreases to less than 0.75. CS#6 and CS#7 show better effects in the PT and PD partitions, although the D(CD) value of CS#7 is slightly larger, but the explosive quantity is less. Comprehensive analysis of the previous, preferred CS#7 for the best charging structure, the upper and lower charge ratio of 1:3, and water media volume ratio of 2:2:1. Compared with the air interval, the plosive quantity of CS#7 is reduced by about 33.3%, the explosive energy distribution is more uniform, and the utilization rate is higher.
The study of literature [2] shows that when replacing 20 cm of explosives at the bottom of the hole with air, the excavation efficiency is reduced by 4.3%. In this study, when replacing the same length of air with water, although the explosives are reduced, the bottom of the hole still shows more damage, and the damage value of the surrounding rock at the bottom of the hole does not reach the degree of fracture and avoids over-excavation and under-excavation phenomena. The result is similar to the results of research in literature [4], in which the length of the water interval at the bottom of the hole accounted for 8% of the hole, which is 2% less than in this study, but [4] did not study the blasting effect of the water interval in the middle of the hole. In contrast, literature [11] shows that the blast stress can last longer when the water is in the location of the orifice and the bottom of the hole, and it can form a flat damage area. In this study, designing different lengths of water bags at the orifice, the bottom, and the middle of the hole, and using the incompressibility and flow viscosity of water, we obtained a more uniform distribution of explosive energy through numerical calculations and reduced the consumption of the drug while obtaining a flat tunnel contour surface.

4.4. Field Test

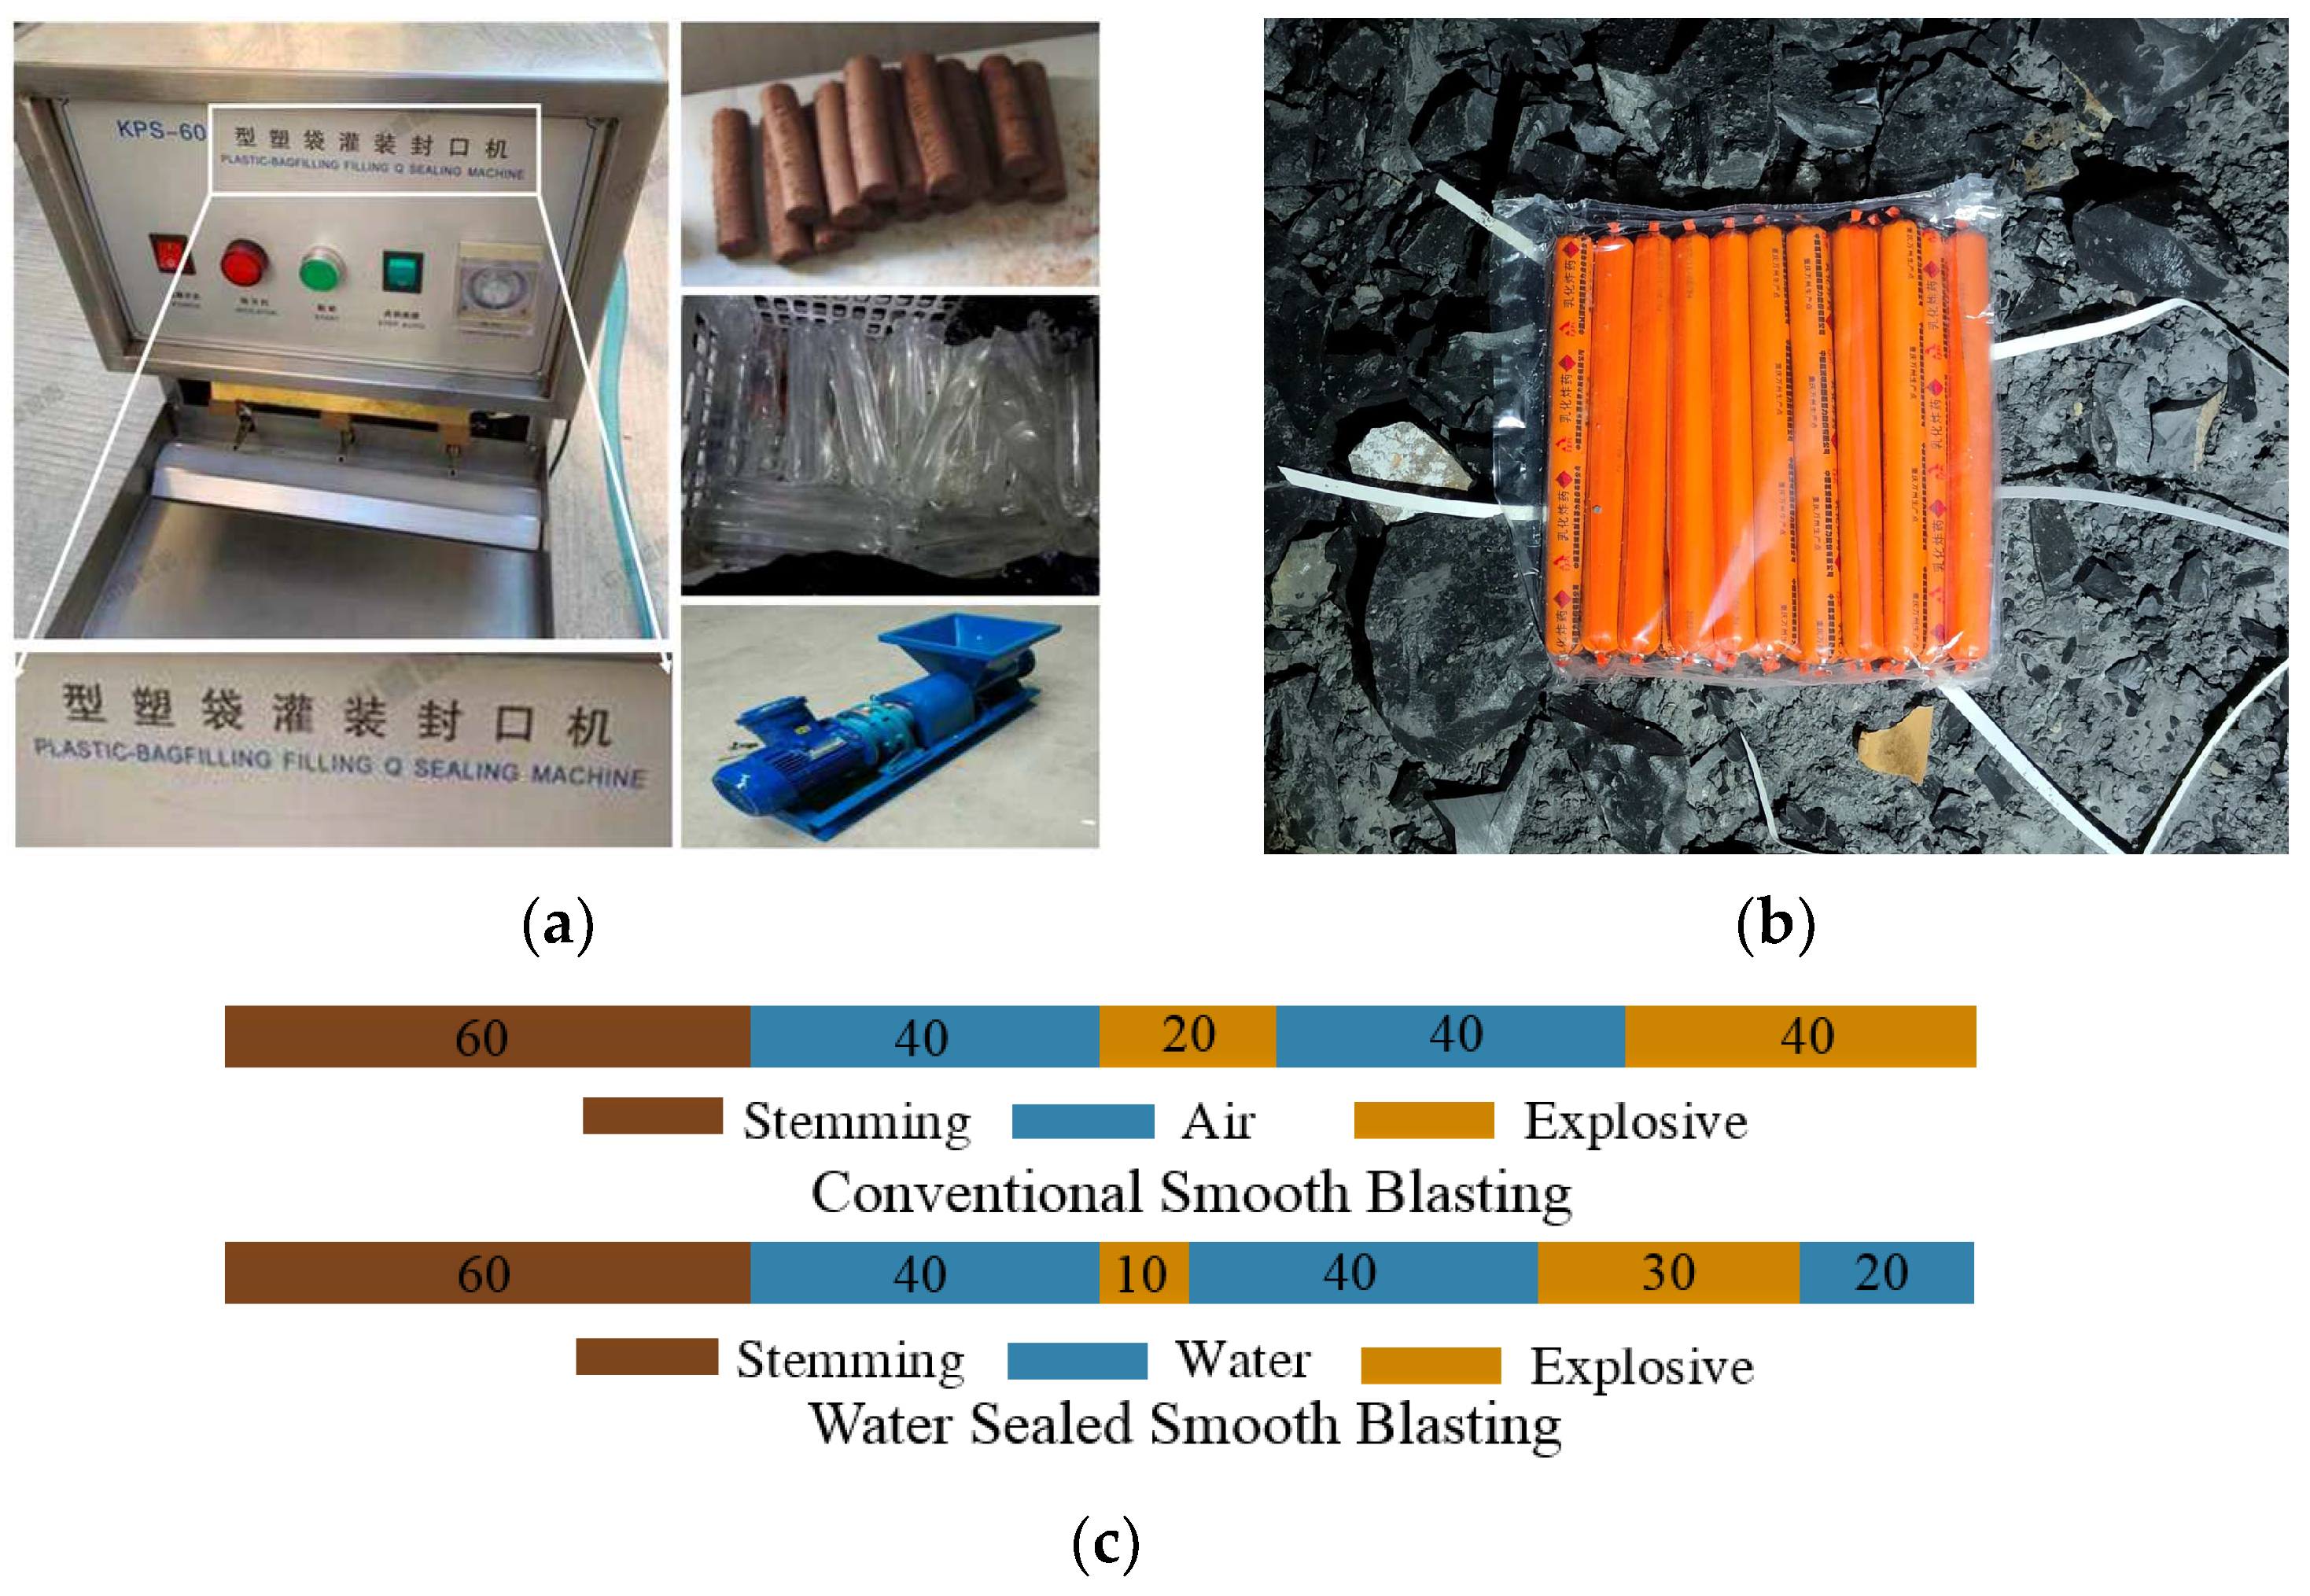
A validation experiment was conducted in the Liyue Road Tunnel in Chongqing. The rock surrounding the experimental section is primarily sandstone with low strength, developed rock stratification, and poor engineering geological conditions. The rock density is 2010 kg/m3, uniaxial compressive strength is 33.7 Mpa, modulus of elasticity is 5.6 Gpa, and Poisson’s ratio is 0.26. Rock drilling trolley drills 42 mm diameter blast holes with a depth of 2.0 m, and the hole spacing of the peripheral holes is 50 cm. The type of explosive is a waterproof #2 rock emulsion explosive. Several rounds of experiments were conducted in the field to eliminate any potential chance effects of the tests. Therefore, stemming materials are efficiently produced using a PNJ-B Mine Explosion-proof gunite machine to save time and money. And making specialized water bags in large quantities using the KPS-60 sealing machine produced by China Mining Company, with a capacity of 700 bags/person per hour. The water bags have a diameter of 35 mm and a length of 200 mm. The experiment was carried out on the right side of the tunnel. The right peripheral hole was filled with water bags and explosives by CS#7, while the left side had a conventional air-spaced charge structure, as shown in Figure 16.
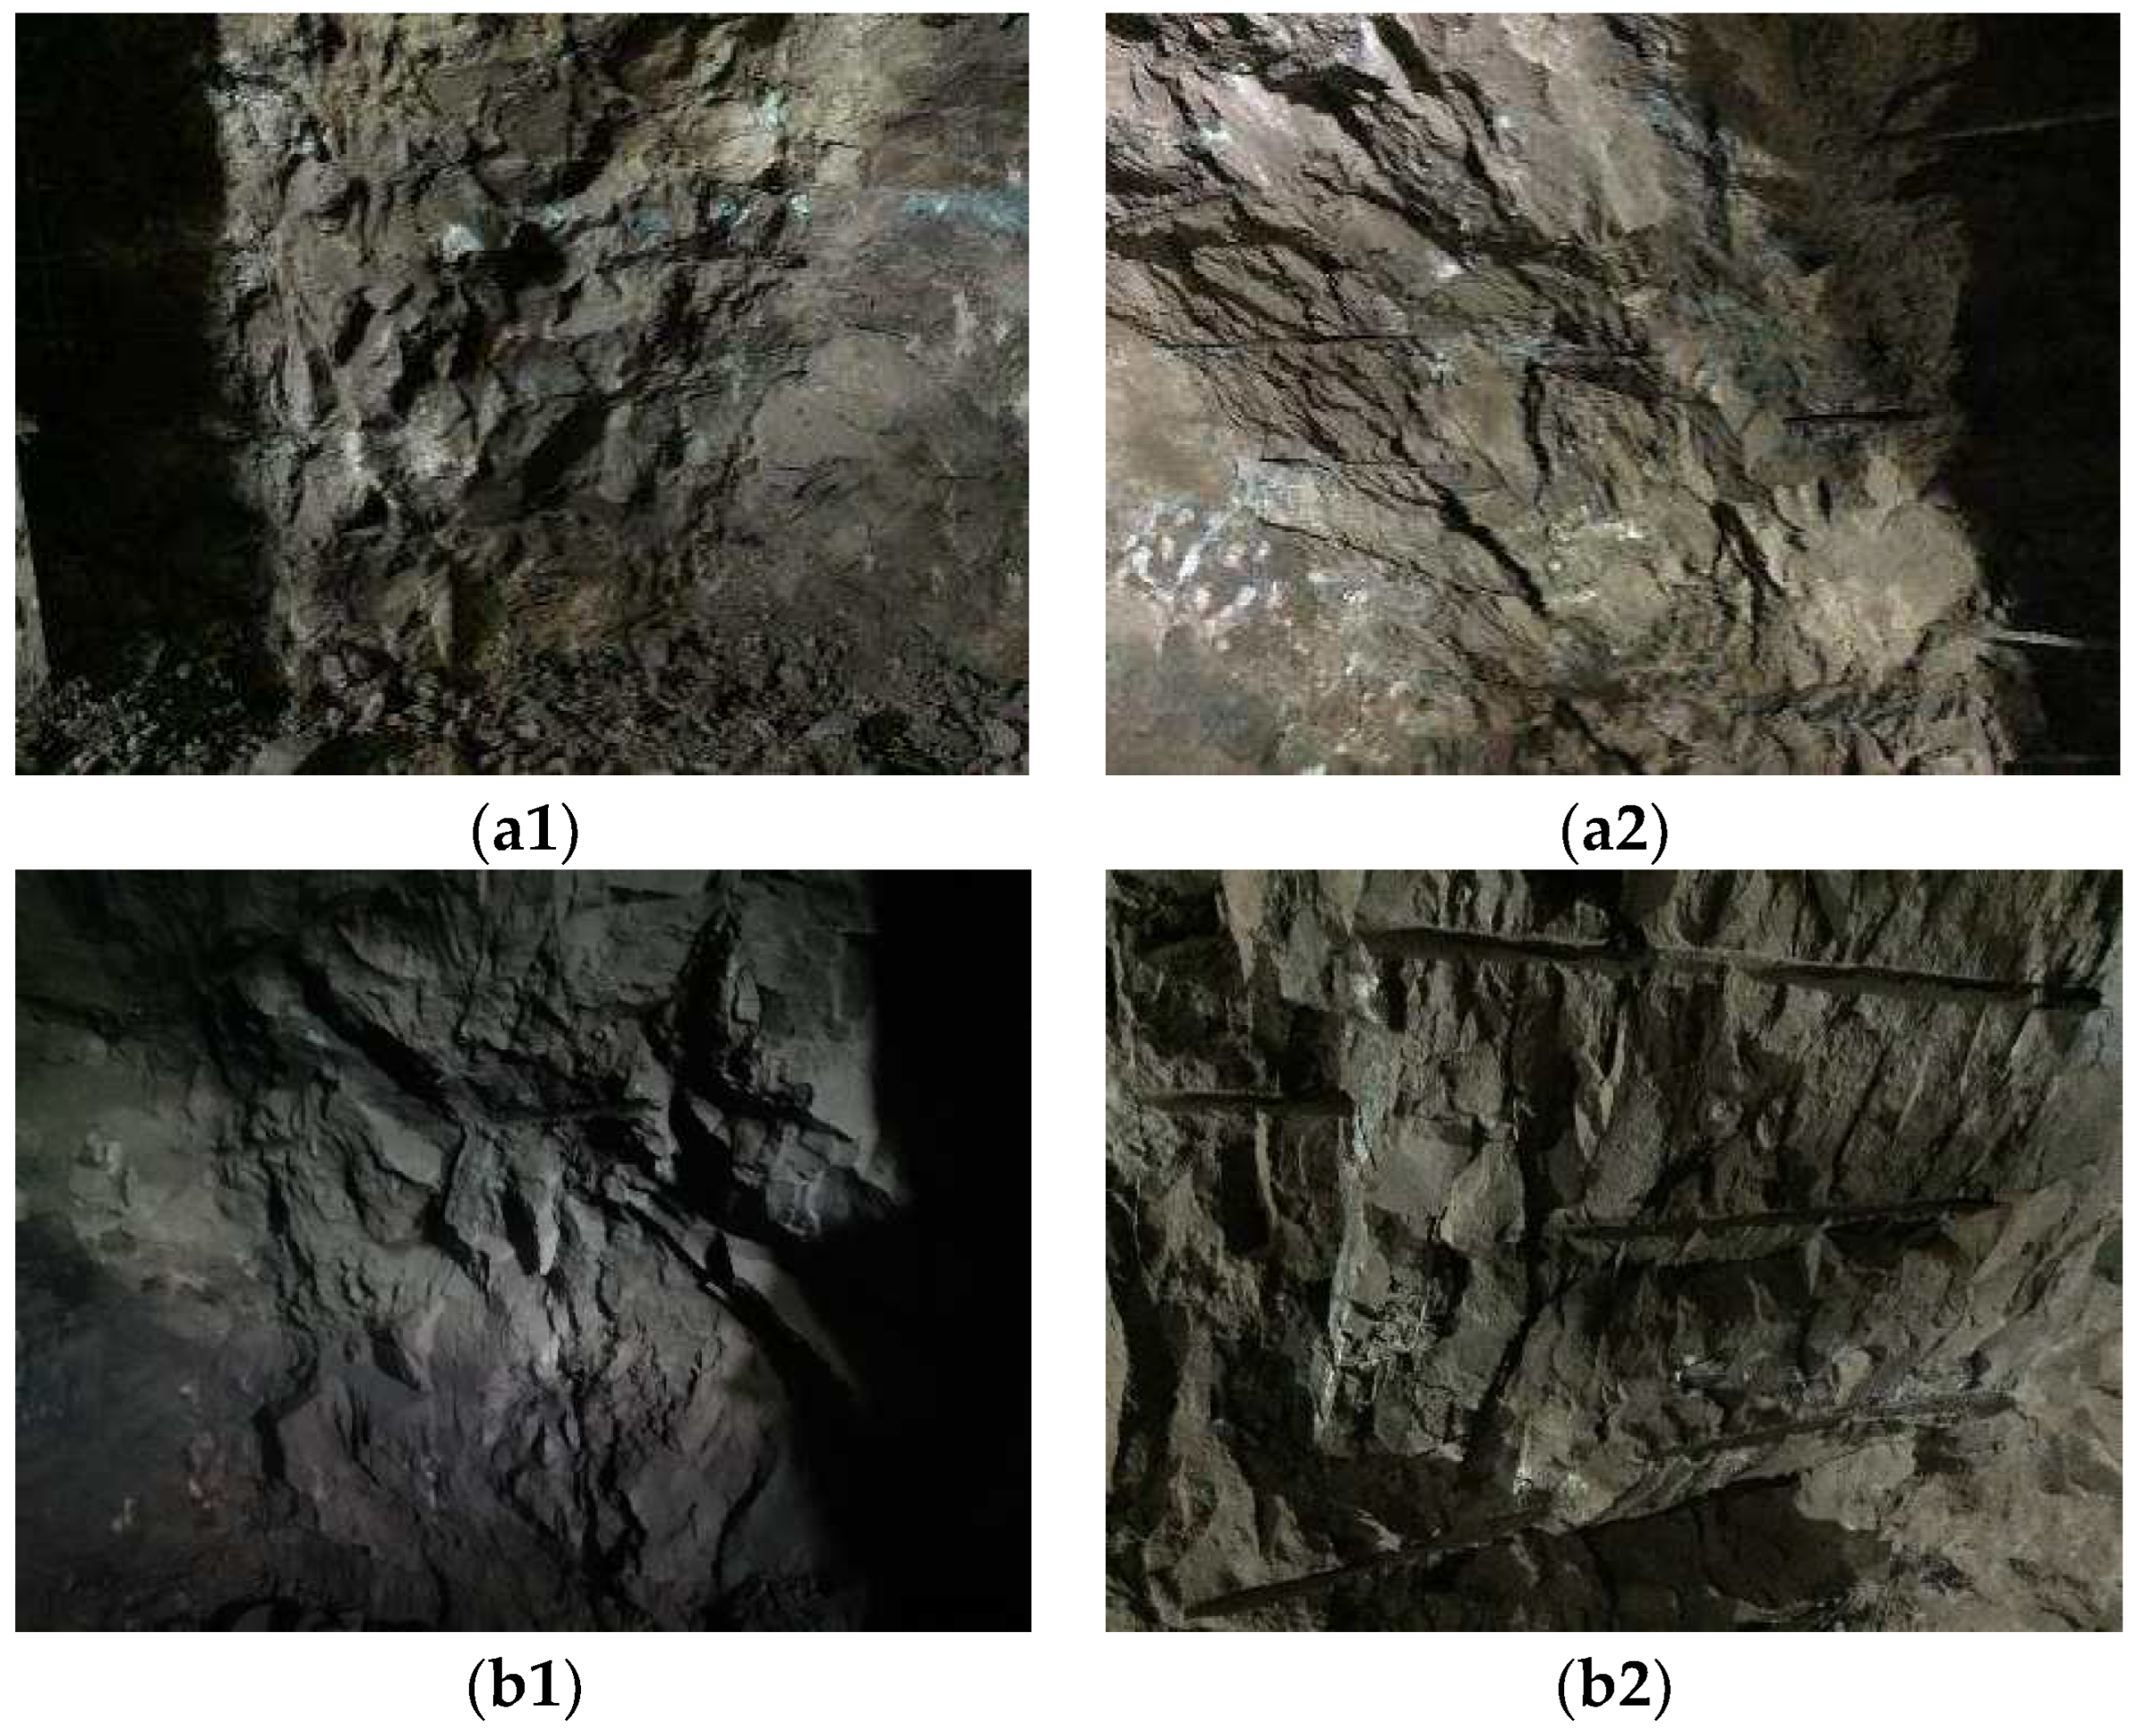
After completing three rounds of testing, statistics showed that the half-hole trace rate under the water interval charge structure was maintained at a high level, and the blasting effect performance was stable. Figure 17 illustrates the typical blast effects. The actual charge is reduced by approximately 26%, compared to the water interval and air interval charge structure, and the half-hole trace rate increases to around 75%. The contour surface is flat, without any visible fractures, avoiding over- and under-blasting phenomena, and operational efficiency is greatly improved.

5. Conclusions

This paper establishes a new method for evaluating the damage effect of rock under the action of explosion. The method analyzes the damage state of rock, and the distribution of explosive energy. Taking the Liyue Road Tunnel Project in Chongqing as an example, establish ten kinds of smooth blasting charge structure models. Based on the evaluation results, it preferred the optimal charge structure and explosive quantity. The method shows the feasibility and accuracy in the field test.
(1)
A method for evaluating the damaging effect of rock has been established based on the classical strength theory and damage fracture theory. The method divides the damaged area into two parts, takes dynamic tensile stress and damage variables as the key indexes, evaluates the numerical simulation results, and selects the preferred loading structure. Field tests verified the feasibility and accuracy of the method.
(2)
In the water interval charge structure, when the length of the water medium at the bottom of the hole is 20 cm, the damage range of the retained rock can be controlled while ensuring rock fragmentation. The length of the water medium at the orifice and in the middle of the hole is greater than 30 cm, which will affect the superimposed effect of the blasting stress wave, resulting in underdigging.
(3)
According to the evaluation results of the preferred charge structure, the length ratio of the upper and lower sections of explosives can reach 1:3, while the length ratio of the water medium is 2:2:1. In soft rock tunneling projects, the preferred charge structure reduces the amount of drugs by about 26% compared with the air-spaced charge structure, and the rate of half-hole traces is increased to 75%, which reduces the phenomenon of over-undercutting and the work of the secondary blasting, and significantly improves the operational efficiency.

Author Contributions

Conceptualization, S.W. and M.G.; methodology, S.W.; software, S.W. and H.W.; validation, H.W.; formal analysis, S.W.; investigation, S.W. and M.G.; resources, M.G.; data curation, S.W. and X.W.; writing—original draft preparation, S.W.; writing—review and editing, S.W., M.G. and X.L.; visualization, S.W. and X.L.; supervision, M.G. and X.W.; project administration, M.G.; funding acquisition, M.G. All authors have read and agreed to the published version of the manuscript.

Funding

This research was funded by the National Natural Science Foundation of China, grant number 52304204 and the China Postdoctoral Science Foundation, grant number 2022TQ0025.

Institutional Review Board Statement

Not applicable.

Informed Consent Statement

Not applicable.

Data Availability Statement

The raw data supporting the conclusions of this article will be made available by the authors on request.

Acknowledgments

The authors sincerely thank all the editors and reviewers for their support and help.

Conflicts of Interest

The authors declare no conflicts of interest.

Nomenclature

σvmMises effective stress
σcdDynamic compressive strength
σtdDynamic tensile strength
σ1/σ2/σ3Three principal stresses
εpEquivalent plastic strain increment
μpEquivalent plastic volume strain increment
εpfEquivalent plastic strain
μpfEquivalent plastic volume strain
D1, D2Material damage parameters
p*Normalized pressure
T*Maximum characteristic tensile stress
EFminMinimum plastic strain at which material breaks
εijStrain increment
σijStress bias
λInstantaneous constant
ε1/∆ε2/∆ε3Plastic strain increment under principal stress
DcCompressive damage variable
DtTensile damage variable
σtTensile stress
σtdDynamic tensile strength
σstUniaxial static tensile strength
ε ˙ Loading rate
E0Original elastic modulus
EPost-blast elastic modulus
vPost-blast rock longitudinal wave velocity
ηRock wave velocity reduction rate
DDamage variable
DmaxPeak damage variable
σtmaxPeak tensile stress

References

  1. Mandal, S.K.; Singh, M.M.; Dasgupta, S. Theoretical concept to understand plan and design smooth blasting pattern. Geotech. Geol. Eng. 2008, 26, 399–416. [Google Scholar] [CrossRef]
  2. Park, D.; Jeon, S. Reduction of blast-induced vibration in the direction of tunneling using an air-deck at the bottom of a blasthole. Int. J. Rock Mech. Min. Sci. 2010, 47, 752–761. [Google Scholar] [CrossRef]
  3. Fourney, W.; Bihr, S.; Leiste, U. Borehole pressures in an air decked situation. Fragblast 2006, 10, 47–60. [Google Scholar] [CrossRef]
  4. Jang, H.; Handel, D.; Ko, Y.; Yang, H.; Miedecke, J. Effects of water deck on rock blasting performance. Int. J. Rock Mech. Min. Sci. 2018, 112, 77–83. [Google Scholar] [CrossRef]
  5. Huang, B.; Li, P. Experimental investigation on the basic law of the fracture spatial morphology for water pressure blasting in a drillhole under true triaxial stress. Rock Mech. Rock Eng. 2015, 48, 1699–1709. [Google Scholar] [CrossRef]
  6. Kutter, H.; Fairhurst, C. On the fracture process in blasting. Int. J. Rock Mech. Min. Sci. 1971, 8, 181–202. [Google Scholar] [CrossRef]
  7. Oh, T.; Cho, G.; Ji, I. Effects of free surface using waterjet cutting for rock blasting excavation. J. Korean Tunn. Undergr. Space Assoc. 2013, 15, 49–57. [Google Scholar] [CrossRef]
  8. Yan, S.; Xu, Y. Numerical simulation of water-coupled charge rock blasting mechanism. Chin. J. Undergr. Space Eng. 2005, 1, 921–924+943. [Google Scholar]
  9. Zong, Q.; Meng, D. Blasting technieal optimization of rock tunnel digging in stratum of kaolin among coal. Rock Soil Mech. 2004, 25, 984–987. [Google Scholar]
  10. Feng, H.; Zhang, X.; Wang, L.; Huang, Q.; Ou, X.; Zhang, C.; Zhou, X. Calculation and analysis for water-sealed charge structure blasting vibration in tunnel drilling and blasting construction. J. Vib. Shock 2020, 39, 93–100+124. [Google Scholar]
  11. Liu, J.; Gao, W.; Zhang, S.; Xu, H. Numerical Analysis and Application of Uncoupled Coefficient of Water Sealed Blasting on Blasting Effect. IOP Conf. Ser. Earth Environ. Sci. 2021, 719, 032035. [Google Scholar] [CrossRef]
  12. Ishchenko, O.; Konoval, V.; Ishchenko, K. Physical and simulation modelling of solid media fracturing by means of explosive charges of different cross-sectional shapes. Min. Miner. Deposits 2022, 16, 122–131. [Google Scholar] [CrossRef]
  13. Li, S.; Ling, T.; Liu, D.; Liang, S.; Zhang, R.; Huang, B.; Liu, K. Determination of rock mass parameters for the RHT model based on the Hoek–Brown Criterion. Rock Mech. Rock Eng. 2023, 56, 2861–2877. [Google Scholar] [CrossRef]
  14. Donzé, F.; Bouchez, J.; Magnier, S. Modeling fractures in rock blasting. Int. J. Rock Mech. Min. Sci. 1997, 34, 1153–1163. [Google Scholar] [CrossRef]
  15. Zhang, Z.; Zhou, C.; Remennikov, A.; Wu, T.; Xia, Y. Dynamic response and safety control of civil Air defense tunnel under excavation blasting of subway tunnel. Tunn. Undergr. Space Technol. 2021, 112, 103879. [Google Scholar] [CrossRef]
  16. Choo, J.; Sun, Y.; Fei, F. Size effects on the strength and cracking behavior of flawed rocks under uniaxial compression: From laboratory scale to field scale. Acta Geotech. 2023, 18, 3451–3468. [Google Scholar] [CrossRef]
  17. Hoek, E.; Carranza-Torres, C.; Corkum, B. Hoek-Brown failure criterion—2002 edition. In Proceedings of the Fifth North American Rock Mechanics Symposium, Toronto, ON, Canada, 7–10 July 2002; Volume 1, pp. 267–273. [Google Scholar]
  18. Costamagna, E.; Oggeri, C.; Segarra, P.; Castedo, R.; Navarro, J. Assessment of contour profile quality in d&b tunnelling. Tunn. Undergr. Space Technol. 2018, 75, 67–80. [Google Scholar]
  19. Holmquist, T.; Johnson, G.; Cook, W. A Computational Constitutive Model for Concrete Subjected to Large Strains, High Strain Rates and High Pressures. In Proceedings of the Fourteenth International Symposium on Ballistics, Quebec City, QC, Canada, 26–29 September 1993; Volume 2, pp. 591–600. [Google Scholar]
  20. Polanco-Loria, M.; Hopperstad, O.; BØ, T.; Berstad, T. Numerical predictions of ballistic limits for concrete slabs using a modified version of the hjc concrete model. Int. J. Impact Eng. 2008, 35, 290–303. [Google Scholar] [CrossRef]
  21. Yang, X.; Wang, S. Meso-mechanism of damage and fracture on rock blasting. J. Vib. Shock 2000, 20, 247–252. [Google Scholar]
  22. Liu, K.; Wu, C.; Li, X.; Li, Q.; Fang, J.; Liu, J. A modified HJC model for improved dynamic response of brittle materials under blasting loads. Comput. Geotech. 2020, 123, 103584. [Google Scholar] [CrossRef]
  23. Grady, D.E.; Kipp, M.E. Continuum modeling of explosive fracture in Oil shale. Int. J. Rock Mech. Min. Sci. 1980, 17, 147–157. [Google Scholar] [CrossRef]
  24. Taylor, L.M.; Chen, E.P.; Kuszmaul, J.S. Microcrack-induced damage accumulation in brittle rock under dynamic loading. Comput. Methods Appl. Mech. Eng. 1986, 55, 301–320. [Google Scholar] [CrossRef]
  25. Kuszmaul, J.S. A new constitutive model for fragmentation of rock under dynamic loading. In Proceedings of the 2nd International Symposium on Rock Fragmentation by Blasting, Keystone, CO, USA, 23 August 1987. [Google Scholar]
  26. Liu, L.; Katsabanis, P.D. Development of a continuum damage model for blasting analysis. Int. J. Rock Mech. Min. Sci. 1997, 34, 217–231. [Google Scholar] [CrossRef]
  27. Thorne, B.J. A Damage Model for Rock Fragmentation and Comparison of Calculations with Blasting Experiments in Granite; Sandia National Lab. (SNL-NM): Albuquerque, NM, USA, 1990; pp. 1–52. [Google Scholar]
  28. Yang, R.; Bawden, W.; Katsabanis, P. A new constitutive model for blast damage. Int. J. Rock Mech. Min. Sci. 1996, 33, 245–254. [Google Scholar] [CrossRef]
  29. Johnson, G.R.; Holmquist, T.J. An improved computational constitutive model for brittle materials. AIP Conf. Proc. 1994, 309, 981–984. [Google Scholar]
  30. Kong, X.; Fang, Q.; Li, Q.; Wu, H.; Crawford, J.E. Modified K&C model for cratering and scabbing of concrete slabs under projectile impact. Int. J. Impact Eng. 2017, 108, 217–228. [Google Scholar]
  31. Xia, X. Study of Damage Characteristics and Safety Threshold of Rock Vibration by Blast. Ph.D. Thesis, Institute of Rock and Soil Mechanics, Chinese Academy of Sciences, Wuhan, China, 2006. [Google Scholar]
  32. Liu, L.; Lu, W.; Chen, M.; Yan, P.; Wang, G. Statistic damage threshold of critical broken rock mass under blasting load. Chin. J. Rock Mech. Eng. 2016, 35, 1133–1140. [Google Scholar]
  33. Chafi, M.; Karami, G.; Ziejewski, M. Numerical analysis of blast-induced wave propagation using FSI and ALE multi-material formulations. Int. J. Impact Eng. 2009, 36, 1269–1275. [Google Scholar] [CrossRef]
  34. Holmquist, T.J.; Johnson, G.R. A computational constitutive model for glass subjected to large strains, high strain rates and high pressures. J. Appl. Mech. 2011, 78, 051113. [Google Scholar] [CrossRef]
  35. Ling, T.; Wu, S.; Liu, D.; Liang, S.; Li, C.; Ma, J. Determination of Holmquist-Johnson-Cook model parameters for sandstone. J. China Coal Soc. 2018, 43, 2211–2216. [Google Scholar]
  36. Kury, J.; Honig, H.; Lee, E.; Mcdonnel, J.; Wilkins, M. Metal acceleration by chemical explosives. In Proceedings of the Fourth Symposium (International) on Detonation, White Oak, MD, USA, 12–15 October 1965. [Google Scholar]
  37. Livermore Software Technology Corporation (LSTC). LS-DYNA Keyword User’s Manual; LSTC: Livermore, CA, USA, 2020. [Google Scholar]
  38. Hagan, T.N. Rock breakage by explosives. In Proceedings of the 6th Colloquium, Stockholm, Sweden, 22–26 August 1977. [Google Scholar]
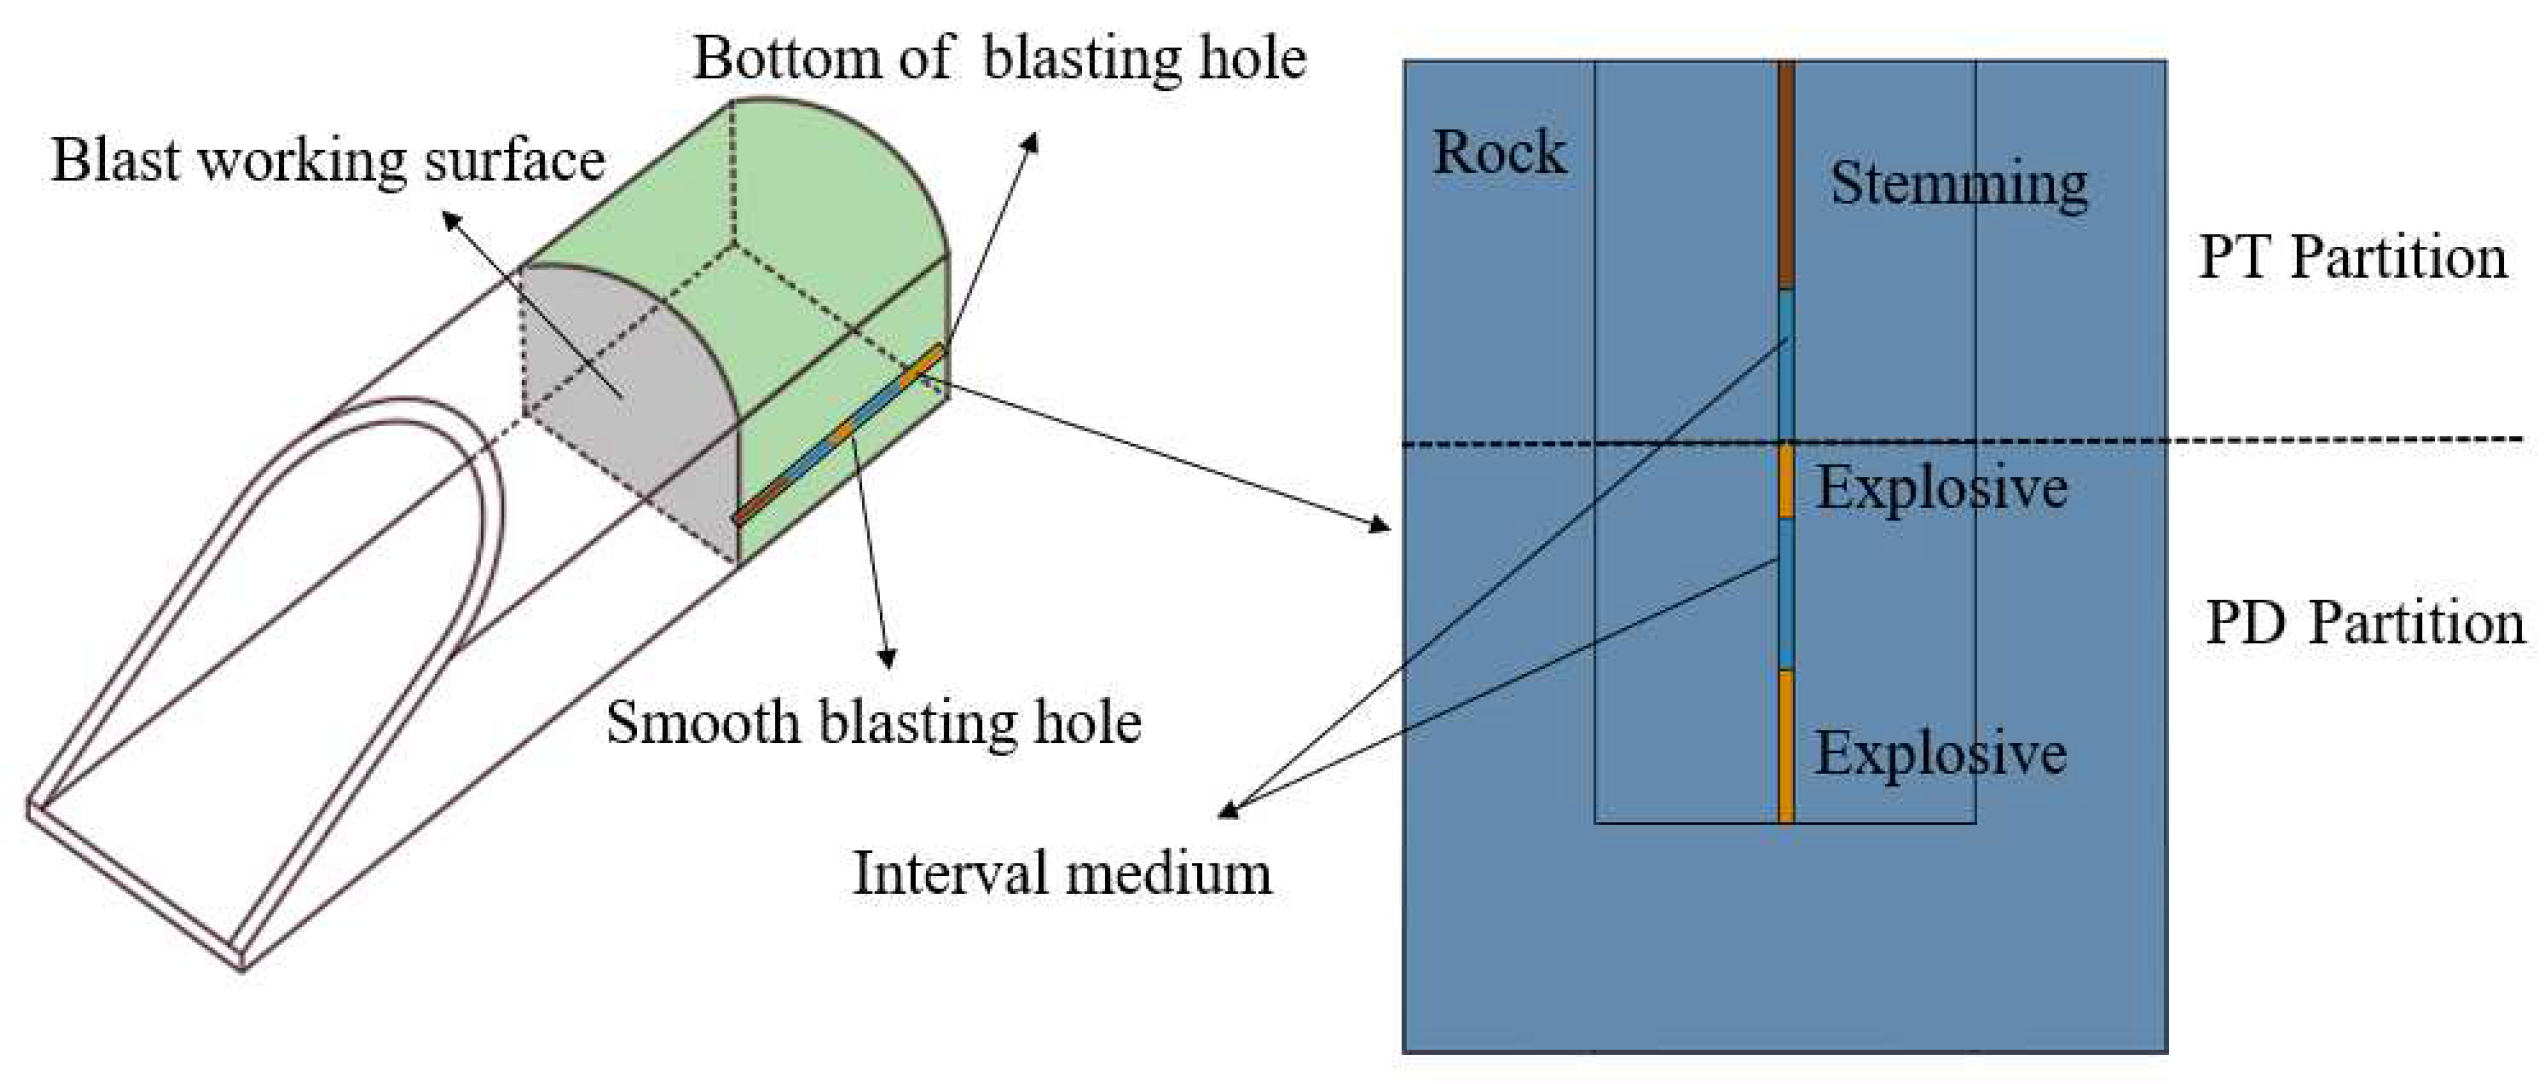
Figure 1. Location of the model and regional division of damage effect evaluation.
Applsci 14 02868 g001
Figure 2. Location of damage monitoring units: (a) single-hole model, (b) double-hole model.
Applsci 14 02868 g002
Figure 3. Numerical calculation model.
Applsci 14 02868 g003
Figure 4. Model charge structure.
Applsci 14 02868 g004
Figure 5. Rock damage range around the blast hole at 0.6 ms.
Applsci 14 02868 g005
Figure 6. Variation of σtmax and Dmax with depth of blasthole: (a) the variation curve of σtmax, (b) the variation curve of Dmax.
Applsci 14 02868 g006
Figure 7. Different water media length at the bottom of the blast hole.
Applsci 14 02868 g007
Figure 8. Rock damage range around the blast hole at 0.6 ms: (a)—CS#1, (b)—CS#2, (c)—CS#3.
Applsci 14 02868 g008
Figure 9. Variation of σtmax and Dmax with depth of blasthole: (a) the variation curve of σtmax, (b) the variation curve of Dmax.
Applsci 14 02868 g009
Figure 10. Different water media length at the blast hole orifice.
Applsci 14 02868 g010
Figure 11. Rock damage range around the blast hole at 0.6 ms: (a)—CS#2, (b)—CS#4, (c)—CS#5.
Applsci 14 02868 g011
Figure 12. Variation of σtmax and Dmax with depth of blasthole: (a) the variation curve of σtmax, (b) the variation curve of Dmax.
Applsci 14 02868 g012
Figure 13. Different plosive quantity structure.
Applsci 14 02868 g013
Figure 14. Rock damage range around the blast hole at 0.6 ms: (a)—CS#4, (b)—CS#6, (c)—CS#7, (d)—CS#8.
Applsci 14 02868 g014
Figure 15. Variation of σtmax and Dmax with depth of blasthole: (a) the variation curve of σtmax, (b) the variation curve of Dmax.
Applsci 14 02868 g015
Figure 16. Consumables, fabrication tools and test charge structure: (a) the KPS-60 water bag machine and Stemming material machines, (b) emulsion explosive, (c) test charge structure.
Applsci 14 02868 g016
Figure 17. Air interval and water interval smooth blasting profile forming effect: (a1) air interval, (a2) water interval, (b1) air interval, (b2) water interval.
Applsci 14 02868 g017
Table 1. HJC model parameters for sandstone [35].
ParameterUnitValue
Density, ρ kg/m32010
Shear modulus, GGPa5.6
Normalized cohesive strength, A 0.32
Normalized pressure hardening, B 1.76
Strain rate coefficient, C 0.0127
Pressure hardening exponent, N 0.79
Maximum tensile hydrostatic pressure, TMPa7.63
Quasi-static uniaxial compressive strength, fcMPa33.7
Quasi-static threshold strain rate, EPS0s−11
Amount of plastic strain before fracture, EFMIN 0.01
Normalized maximum strength, SFMAX 7
Crushing pressure, PcrushMPa25.38
Crushing volumetric strain, µcrush 0.00167
Locking pressure, PlockGPa0.8
Locking volumetric strain, µlock 0.08
Damage constant, D1 0.04
Damage constant, D2 1
Pressure constant, K1GPa81
Pressure constant, K2GPa−91
Pressure constant, K3GPa89
Disclaimer/Publisher’s Note: The statements, opinions and data contained in all publications are solely those of the individual author(s) and contributor(s) and not of MDPI and/or the editor(s). MDPI and/or the editor(s) disclaim responsibility for any injury to people or property resulting from any ideas, methods, instructions or products referred to in the content.