1. Introduction
Currently, the energy sector is undergoing significant changes, shifting from centralized fossil fuel-based systems to decentralized models that rely on renewable energies [
1]. In this context, the lower intensity of renewable energy resources and the possible network saturation underscore the importance of situating energy generation closer to consumption points [
2]. Consequently, governmental initiatives have emerged to promote self-consumption facilities, that help in this energy transition [
3].
In recent years, there has been notable progress in the development of innovative wind energy harvesting designs [
4]. These innovations involve triboelectric nanogenerator (TENG) technology [
5], as well as wind-induced vibrations. Notably, vortex-induced vibration (VIV) energy harvesters boast versatility [
6], offering promise in establishing wind energy within distributed energy production framework [
7], as seen in bladeless models developed by Vortex Bladeless [
8,
9,
10]. The integration of BWTs through the interaction with multiple energy system technologies introduces new challenges as well as opportunities within future energy systems [
11].
These BWT energy harvesters address several drawbacks associated with traditional turbines [
12,
13,
14]. They mitigate negative impacts on bird wildlife [
15] by minimizing collision risks [
16] and environmental impact [
17], minimize electromagnetic interference with communication frequencies, and have negligible visual and acoustic impacts. Their installation in residential settings, owing to the absence of gears and low maintenance needs, opens possibilities for hybridizing this technology with solar photovoltaics for self-consumption, optimizing energy availability even during low-solar-radiation periods or at night [
18].
Maintaining stationary alignment irrespective of wind direction is crucial for these turbines, similar to the principles outlined in [
19] utilizing cylindrical shapes. Furthermore, modifying parameters like taper ratio [
20] and surface roughness [
21] allows for optimizing vibration characteristics at different wind speeds, thereby maximizing energy generation, as evidenced by studies such as [
22,
23].
Despite their advantages, these energy harvesters have limitations, notably a narrow operational wind speed range called “Lock-In range” [
24]. Efforts to address this include analysing monostable softening behaviour in the broadband VIV energy harvesting.
The novelty of this work lies in the exploration of VIV dynamics in bluff bodies supported by a cantilever rod, exhibiting circular oscillation rather than linear. Thus, both from an aerodynamic and functional point of view, these devices are akin to single-blade horizontal-axis wind turbines, differing significantly in their rotation angles, as shown in
Figure 1.
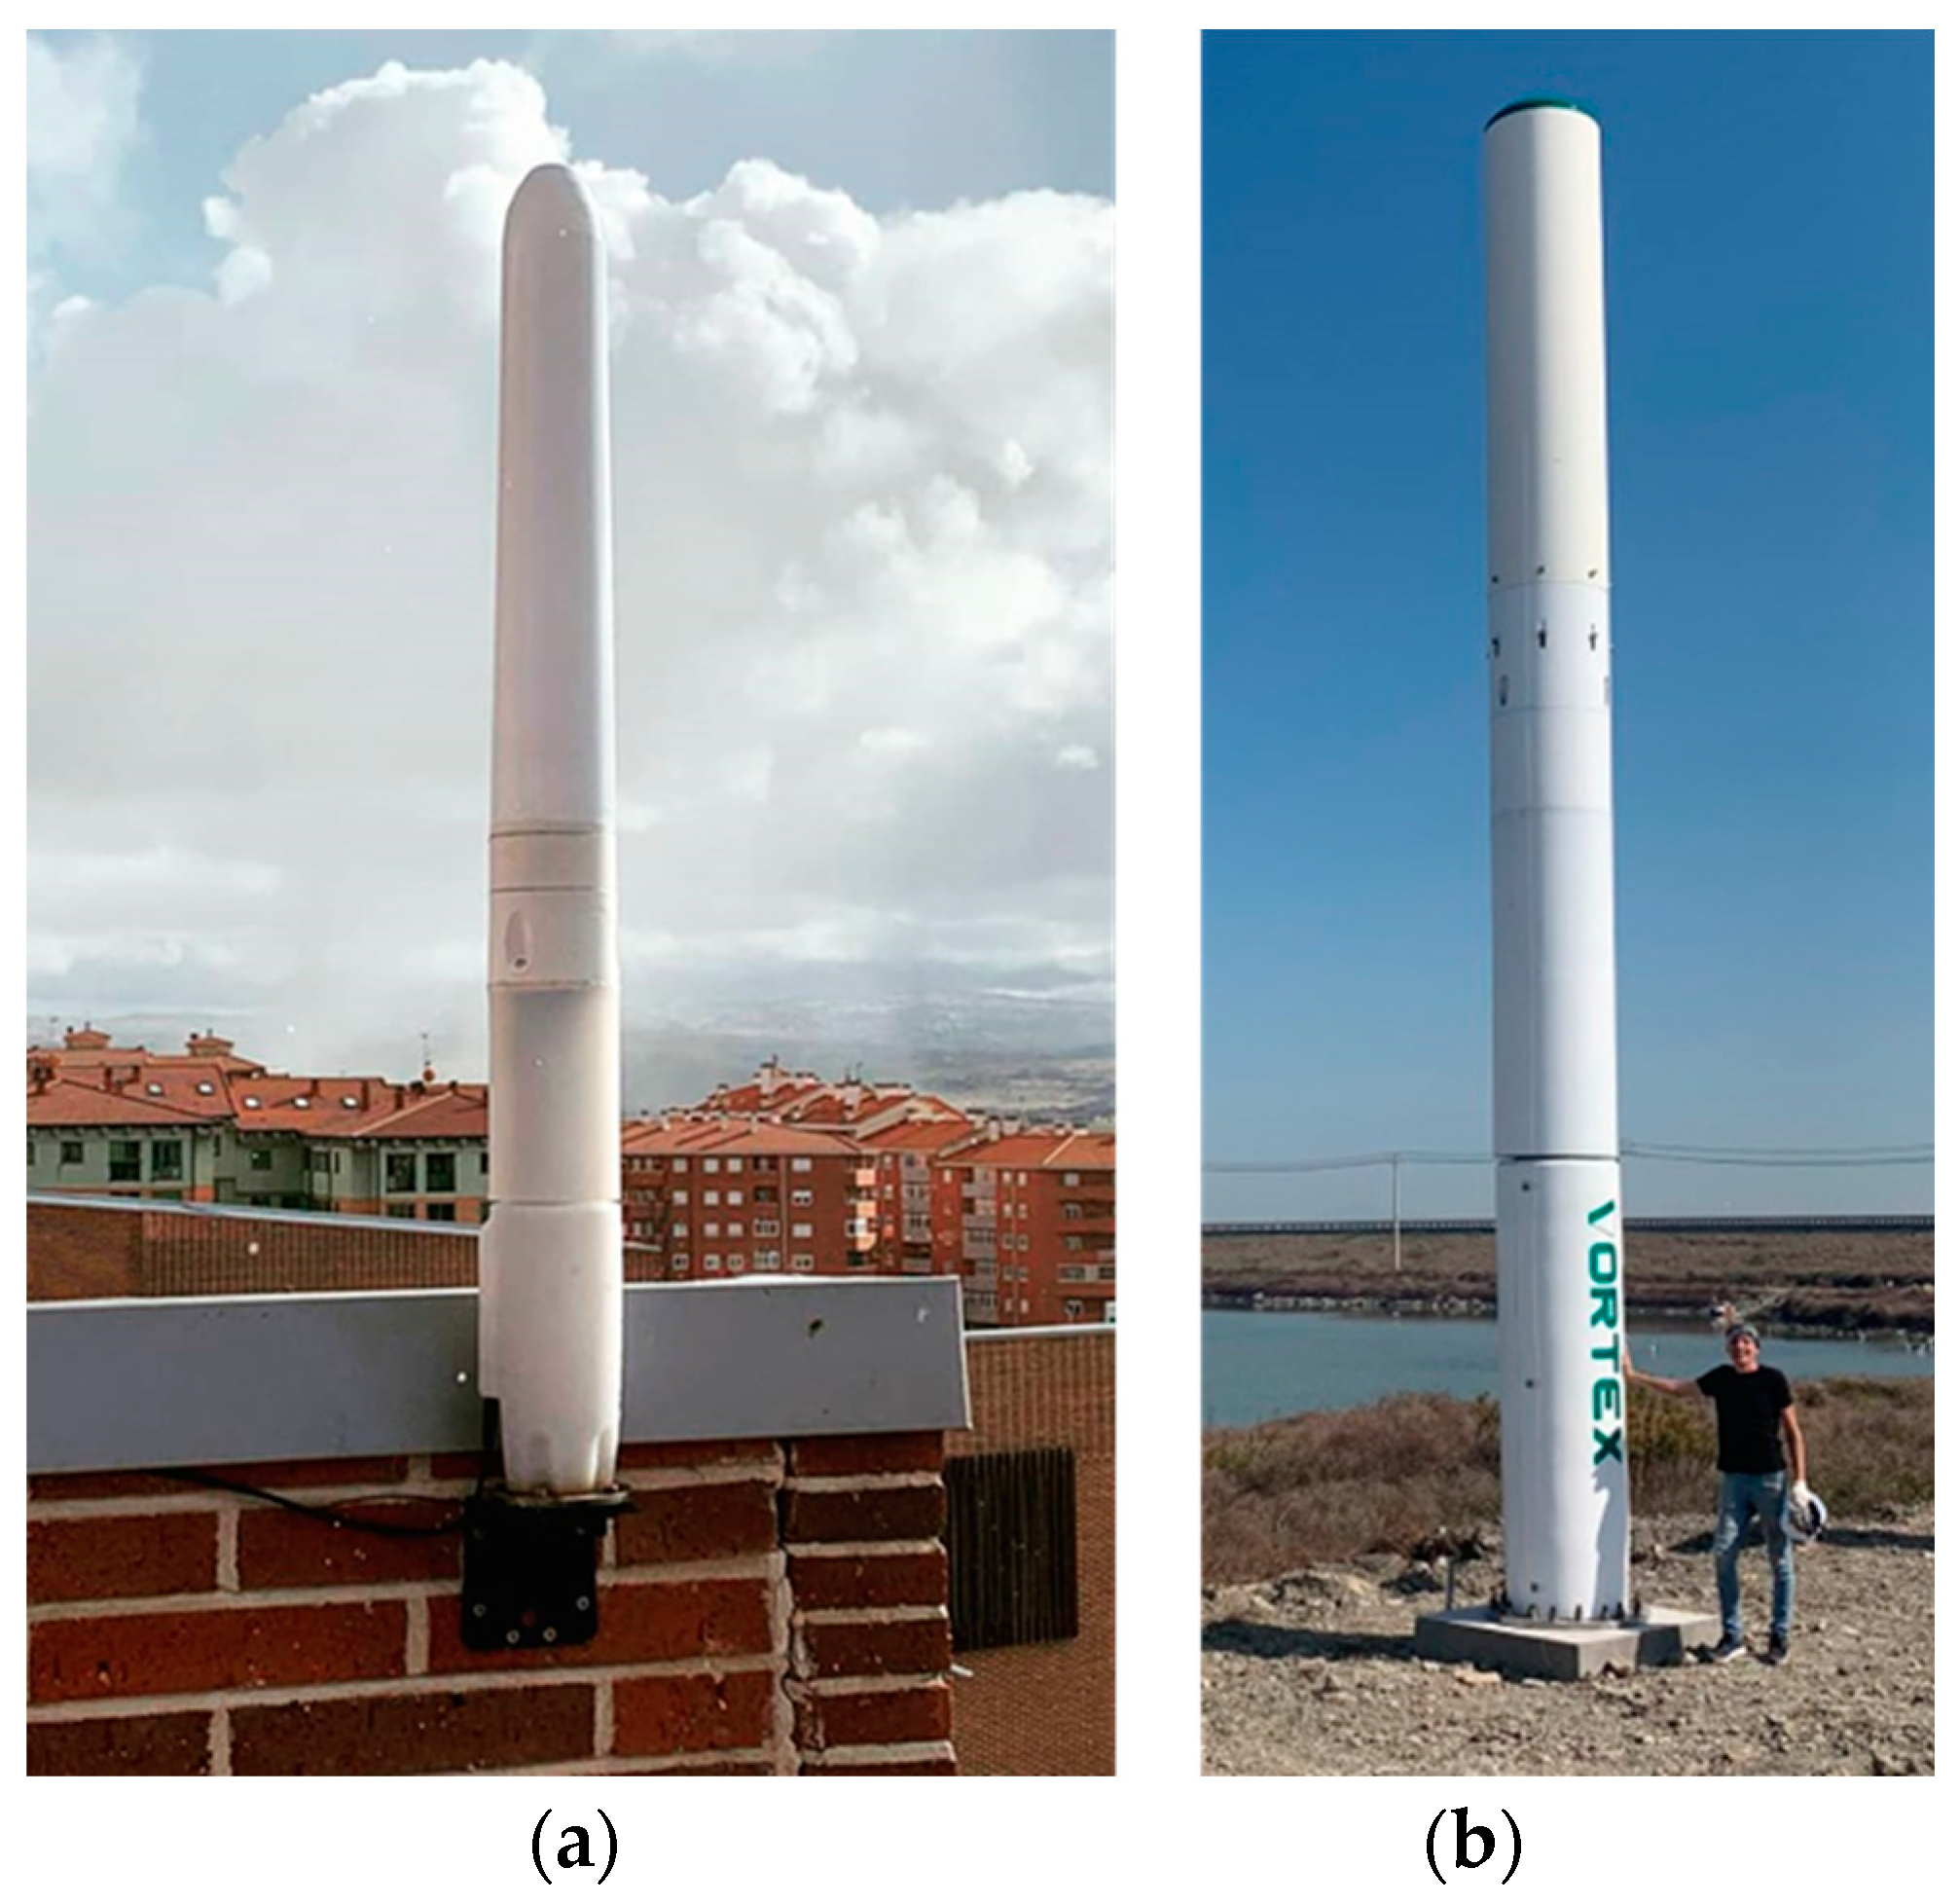
The choice of geometries studied here is consistent with their rotational nature, wherein the diameter of the mast section correlates with the distance to the rotation axis. Specifically, the investigation focuses on scaled models akin to Vortex Bladeless prototypes [
26], spanning from the Vortex Nano models (0.85 m height, 0.07 m diameter, and 1.70 Kg weight) to the Vortex Atlantis models (9 m height, 0.72 m diameter, and 1300 Kg weight), as shown in
Figure 2.
To achieve this, a series of controlled experiments were conducted in a wind tunnel, covering a range of Reynolds numbers from 2 K to 6 K. This study considered different surface conditions (smooth and rough) as well as various cylindrical mast geometries (convergent, straight, and divergent). This comprehensive analysis aims at elucidating the impact of surface characteristics and geometric parameters on the overall efficiency and energy generation potential of BWT energy harvesters.
The paper is organized as follows. After the introductory
Section 1,
Section 2 details the theoretical background underpinning the VIV principles for prototype design;
Section 3 outlines the methodology for prototype development and testing;
Section 4 and
Section 5 include the test results and their discussion; and
Section 6 presents the conclusions reached after the performance of the study.
The findings of this research highlight critical advancements in the field of bladeless wind turbines, providing essential insights into the decisive influence of geometry and diameter on the Lock-In range, a key factor for optimizing energy efficiency. The provided equation for predicting the maximum Lock-In range value, with its high predictive capacity, enables the accurate forecasting of the performance of these devices, marking a significant step forward in the development and application of bladeless wind energy technologies.
2. Theoretical Background
When solid objects or bluff bodies interact with fluid flows, they experience drag and lift forces influenced by their shape and orientation within the stream [
27]. The distribution of fluid velocity along the body surface can induce oscillatory movement through vortex shedding, a phenomenon elucidated by Karman [
28], Bearman [
29], and Gerrard [
30], explaining the vibration caused in bodies by VIV. Historically, aerodynamic effects have been studied as a detrimental effect of wind on structures, which is typically sought to be avoided, like in [
31] to avoid risk in high-rise buildings.
Roshko [
32] established the relation between shedding frequency and wake width, known as the Strouhal number (St = ƒ · D/U, where f is the frequency, D is the diameter, and U is the fluid velocity). Following this, ref. [
33] stated that the correlation between the Strouhal (St) and Reynolds (Re) numbers is such that St number consistently maintains a value of 0.2 with slight variation between a smooth surface and a rough surface, across a wide Re range (250 < Re < 2 × 10
5).
BWT energy harvesters are pioneering designs that aim to capture wind energy without traditional rotating blades. The basic main components, outlined in [
19], encompass the mast, central base, suspension and tuning system, alternator, and power storage unit.
The inherent frequency of oscillation within a rigid structure remains constant, limiting the range of wind velocities where resonance and the resulting VIV phenomenon occur, commonly known as the “Lock-In range” [
34]. Considering that the VIV can be approximated as a simple harmonic motion of a body with a mass (
m) connected to an elastic element with a spring constant (
k), the resonance frequency (
f) of this oscillation can be determined using Equation (1) [
35].
Ongoing BWT research mainly focuses on expanding this range through design extensions, as done in [
36], where an interfering cylinder analysis is conducted. In addition, ref. [
25] introduces an electro-mechanical device serving both as an energy generation (alternator) and a tuning system, aiming to broaden the Lock-In range.
Within this context, numerous tests have been performed to analyse how the shape and surface roughness of the structure influence the aerodynamic design of BWTs.
3. Methodology
3.1. Prototype Design
The blueprint for the prototype was meticulously crafted, considering multiple factors to ensure its functionality and efficacy. This prototype served as both a proof of concept and a testbed, enabling a comprehensive evaluation of the bladeless wind turbine’s performance based on VIV.
Commencing with material selection, the design process prioritized materials possessing robustness, durability, and lightweight properties essential for operational efficiency. The structural components were designed to withstand dynamic wind forces, wich produce vibrations.
Aerodynamic optimization formed a cornerstone, focusing on shaping and refining surface characteristics to facilitate the vortex generation and shedding, thereby promoting VIV. In this way, wind tunnel tests were employed to analyse and refine the turbine’s aerodynamic efficiency.
In the present work, the prototype used incorporates sensors and data acquisition systems to real-time monitor some critical parameters, like wind speed and vibration amplitudes. These data proved instrumental in evaluating the prototype’s performance and identifying avenues for further enhancements.
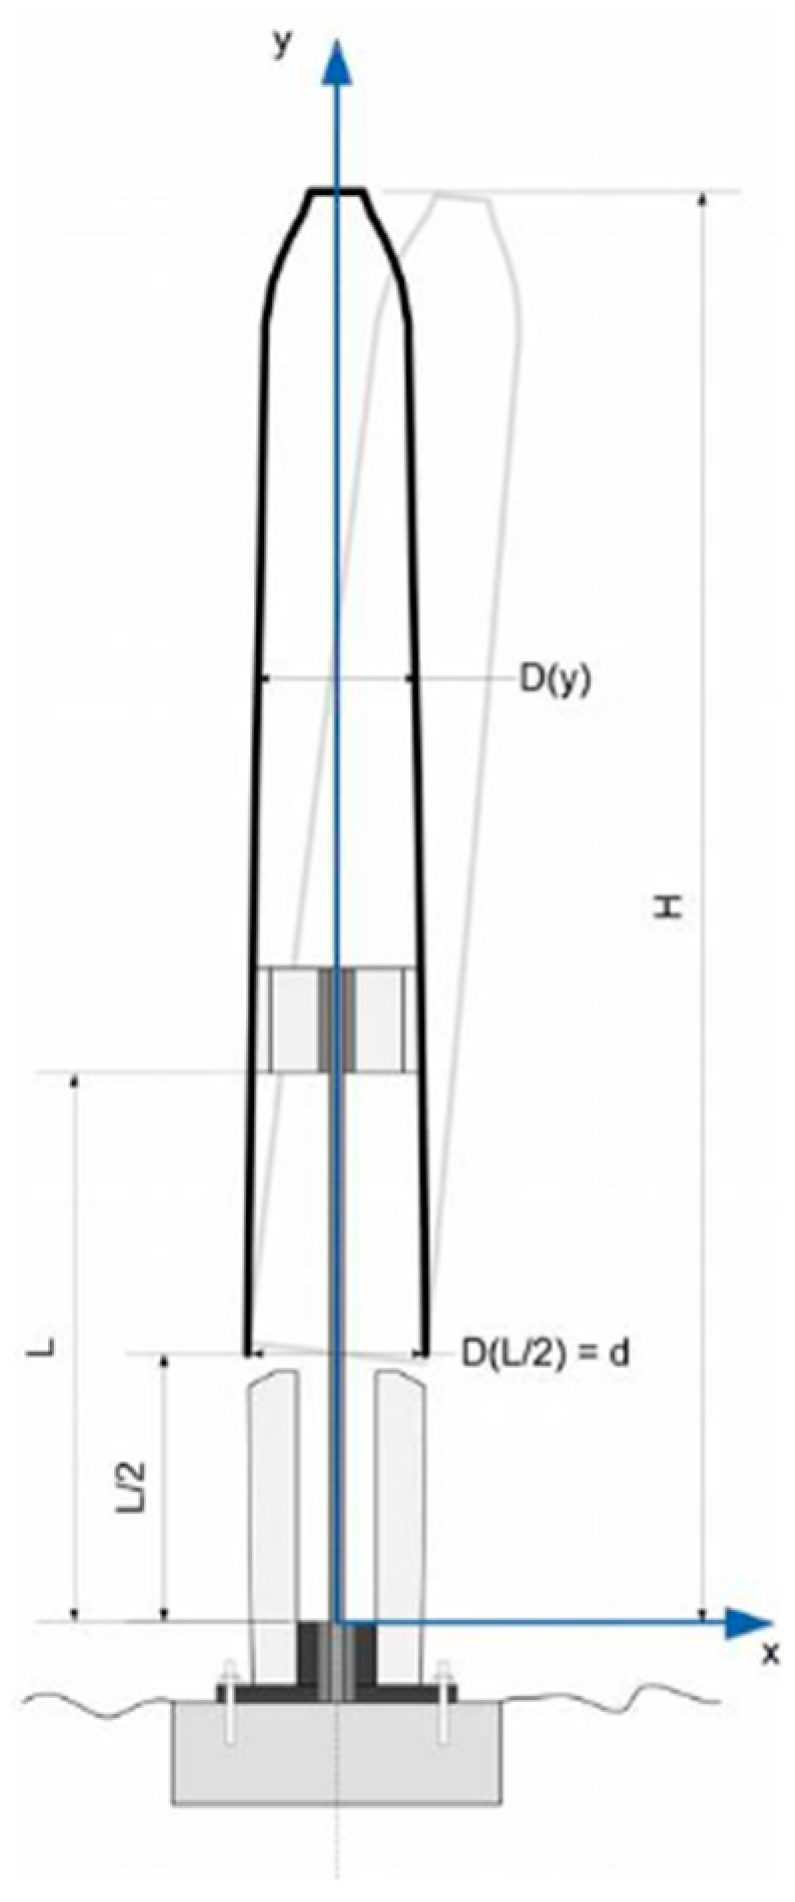
Derived from [
35], the prototype used in this study adheres to the dimensions illustrated in
Figure 3.
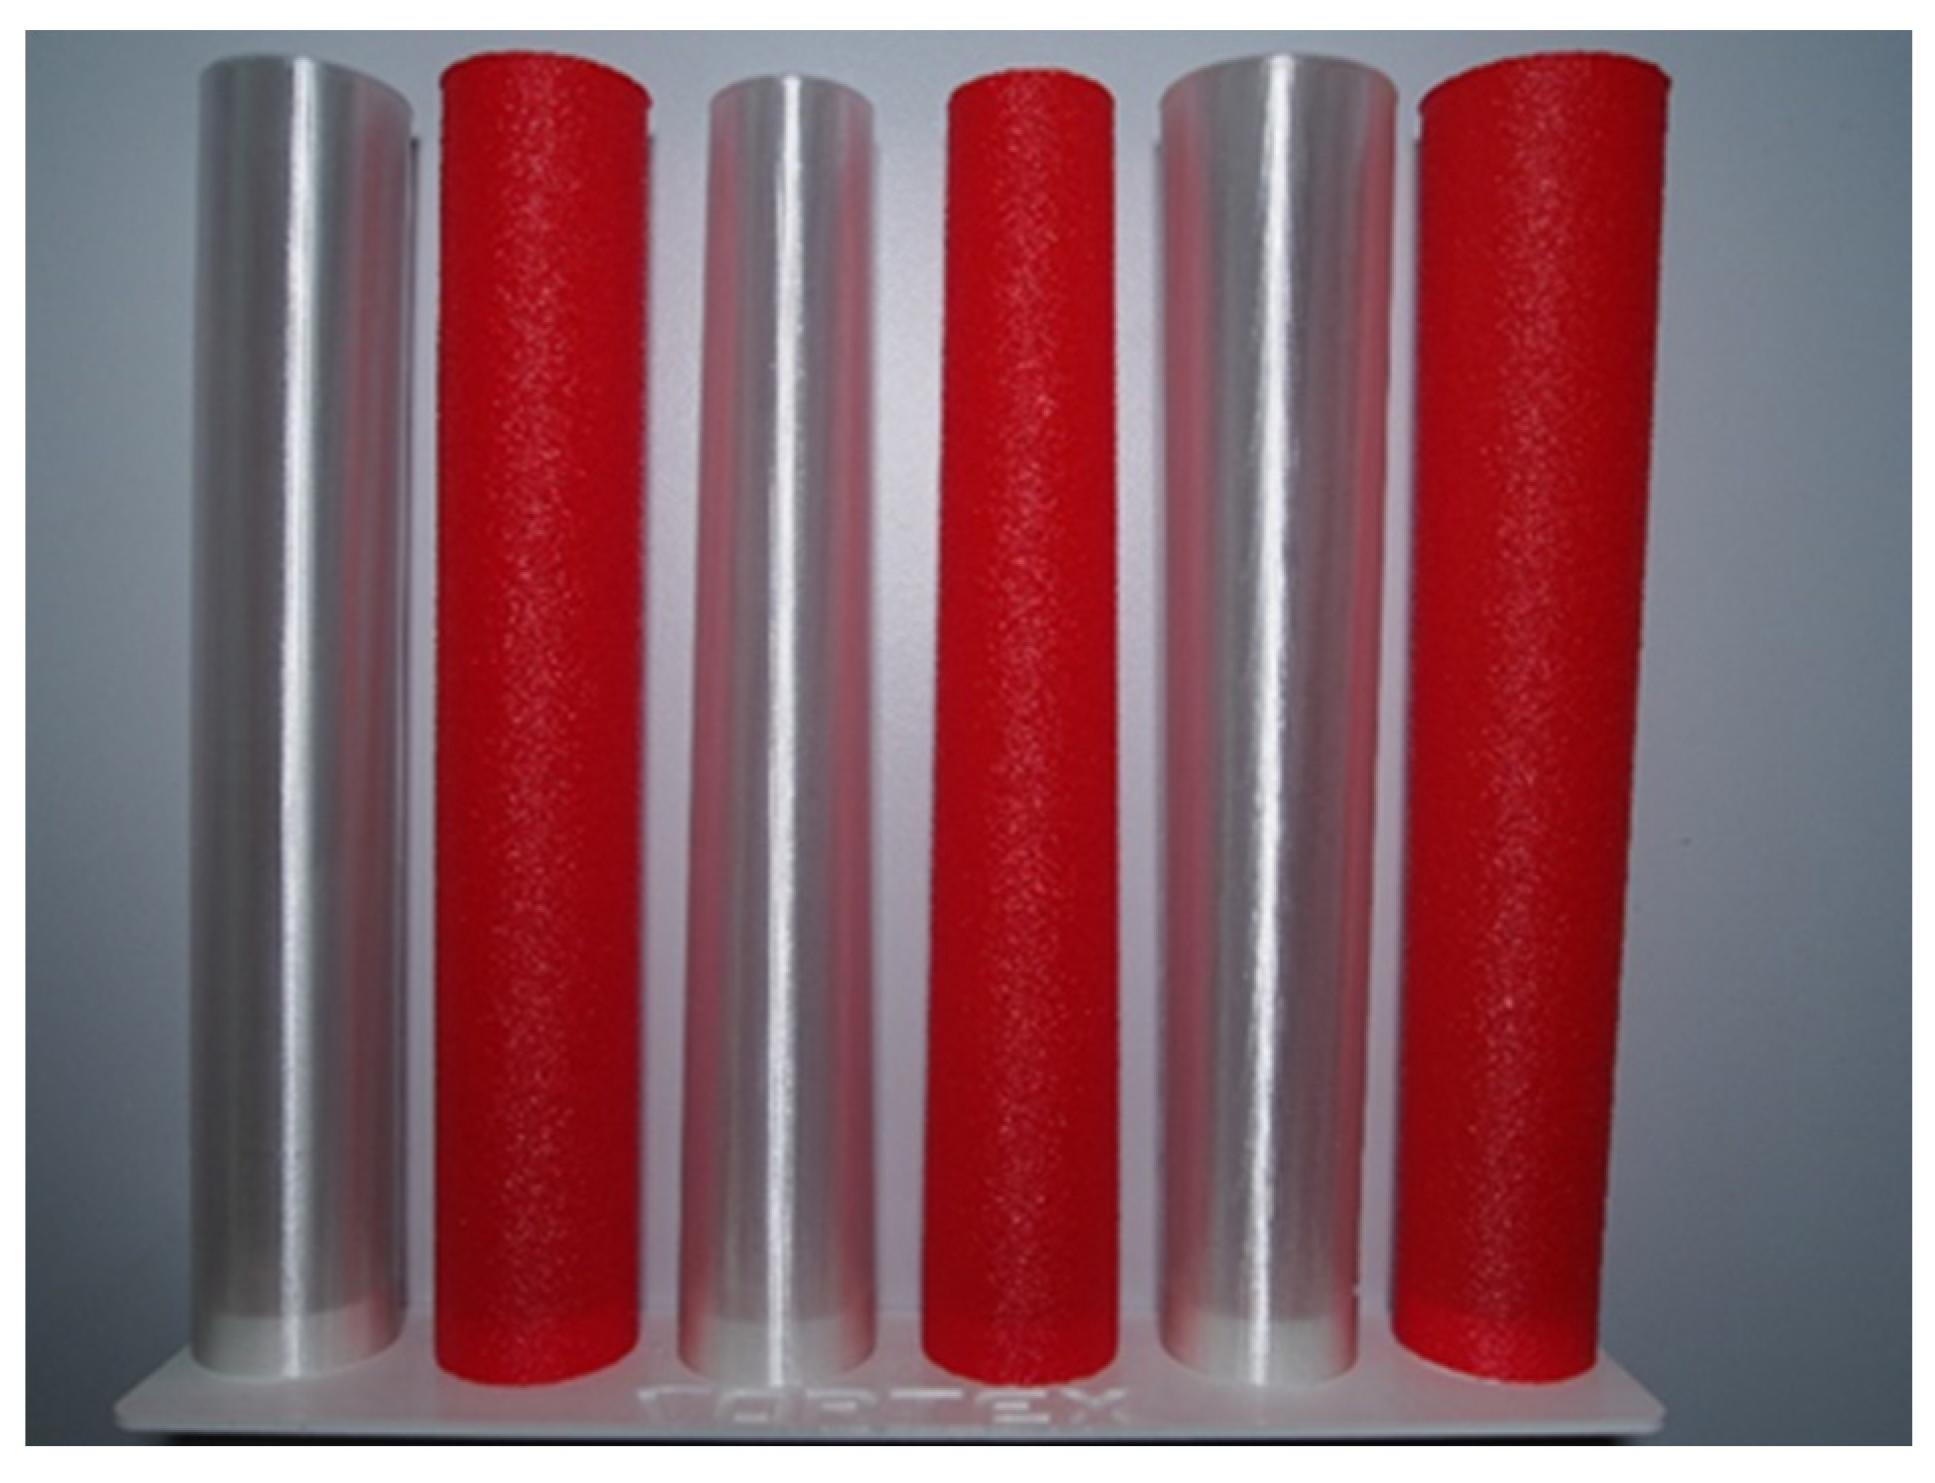
Expanding the study, two additional modified models were subjected to testing alongside the original model shown in
Figure 4. The original model features a cylindrical section of 28.50 mm transitioning into a convergent conical section with a −0.80° angle. The modifications include a pure cylindrical section model (0° angle), and another with a cylindrical section transitioning into a divergent conical section (0.80° angle). A total of six models (
Figure 4) were tested, each test under both smooth and rough surface conditions.
Figure 4 displays the six prototypes designed and manufactured to analyse the effect of geometry and roughness on the performance of BWT energy harvesters. The red surfaces represent the rough prototypes, while the transparent surfaces represent the smooth prototypes.
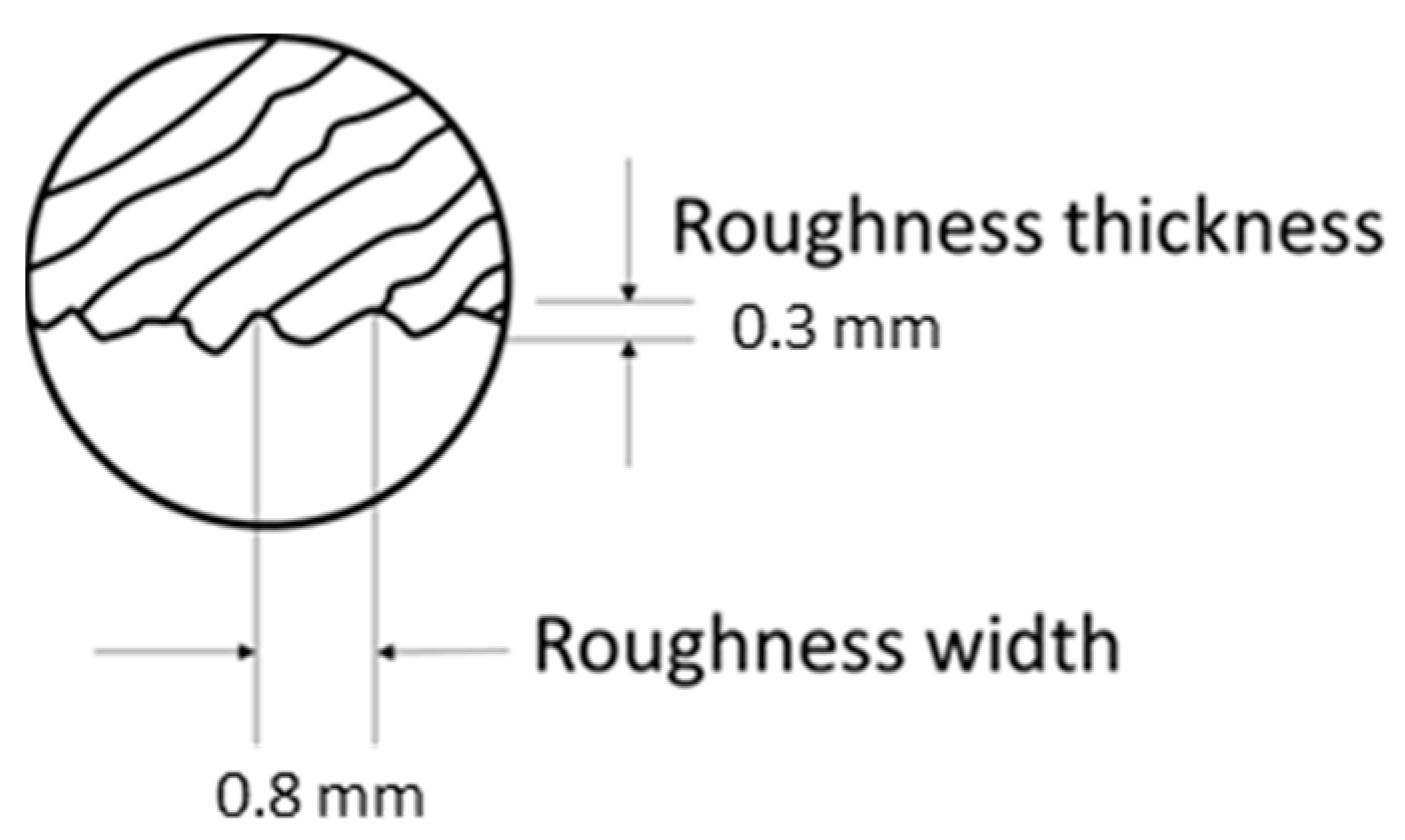
Fabrication employed additive manufacturing via 3D printing technology using Polyethylene Terephthalate Glycol (PETG) [
37]. For the smooth models, a constant diameter was maintained for each layer, whereas for the rough-surfaced ones, specific parameters (a 0.3 mm ripple thickness and a 0.80 mm spacing between ripples) were applied to each layer (
Figure 5). The printing process maintained a layer thickness of 0.10 mm.
While the joining part with the mast retained a consistent diameter (28.50 mm) across all prototypes, variations in mass occurred due to differing fabrication materials and geometries (convergent, straight, and divergent) as well as surface finishes (smooth and rough).
Table 1 provides details of the masses of the six tested prototypes.
To simplify the prototype used in the experiments, certain elements from the original model, such as coatings and casings, were omitted. Only the upper segment responsible for wind energy harvesting was tested. This segment was connected centrally (via a rib) to a 4 mm diameter fiberglass rod (200 mm long) serving as the mast, anchoring the turbine to a fixation point. The fixation involved securing 20 mm of the mast into a mandrel, further anchored to the ground. The vibration sensor, positioned 180 mm from the fixation to the rib, was minimally invasive due to the fact that the dynamics of a body subjected to an aerodynamic resonance phenomenon is influenced by its m* (characteristic mass) and/or its inertia I*. The location of the sensor in a position very close to the bottom recess of the rod minimizes the added inertia and aims to be minimally invasive by alternating as little as possible the dynamics of the device compared to the same in the case of not being monitored. In addition, the greatest bending of the rod occurs at the bottom of the rod and thus maximizes the signal produced by the piezoelectric sensor.
Figure 6 provides an overview of these parameters and the placement of the prototype within the wind tunnel’s test chamber.
3.2. Wind Tunnel Test and Data Logging
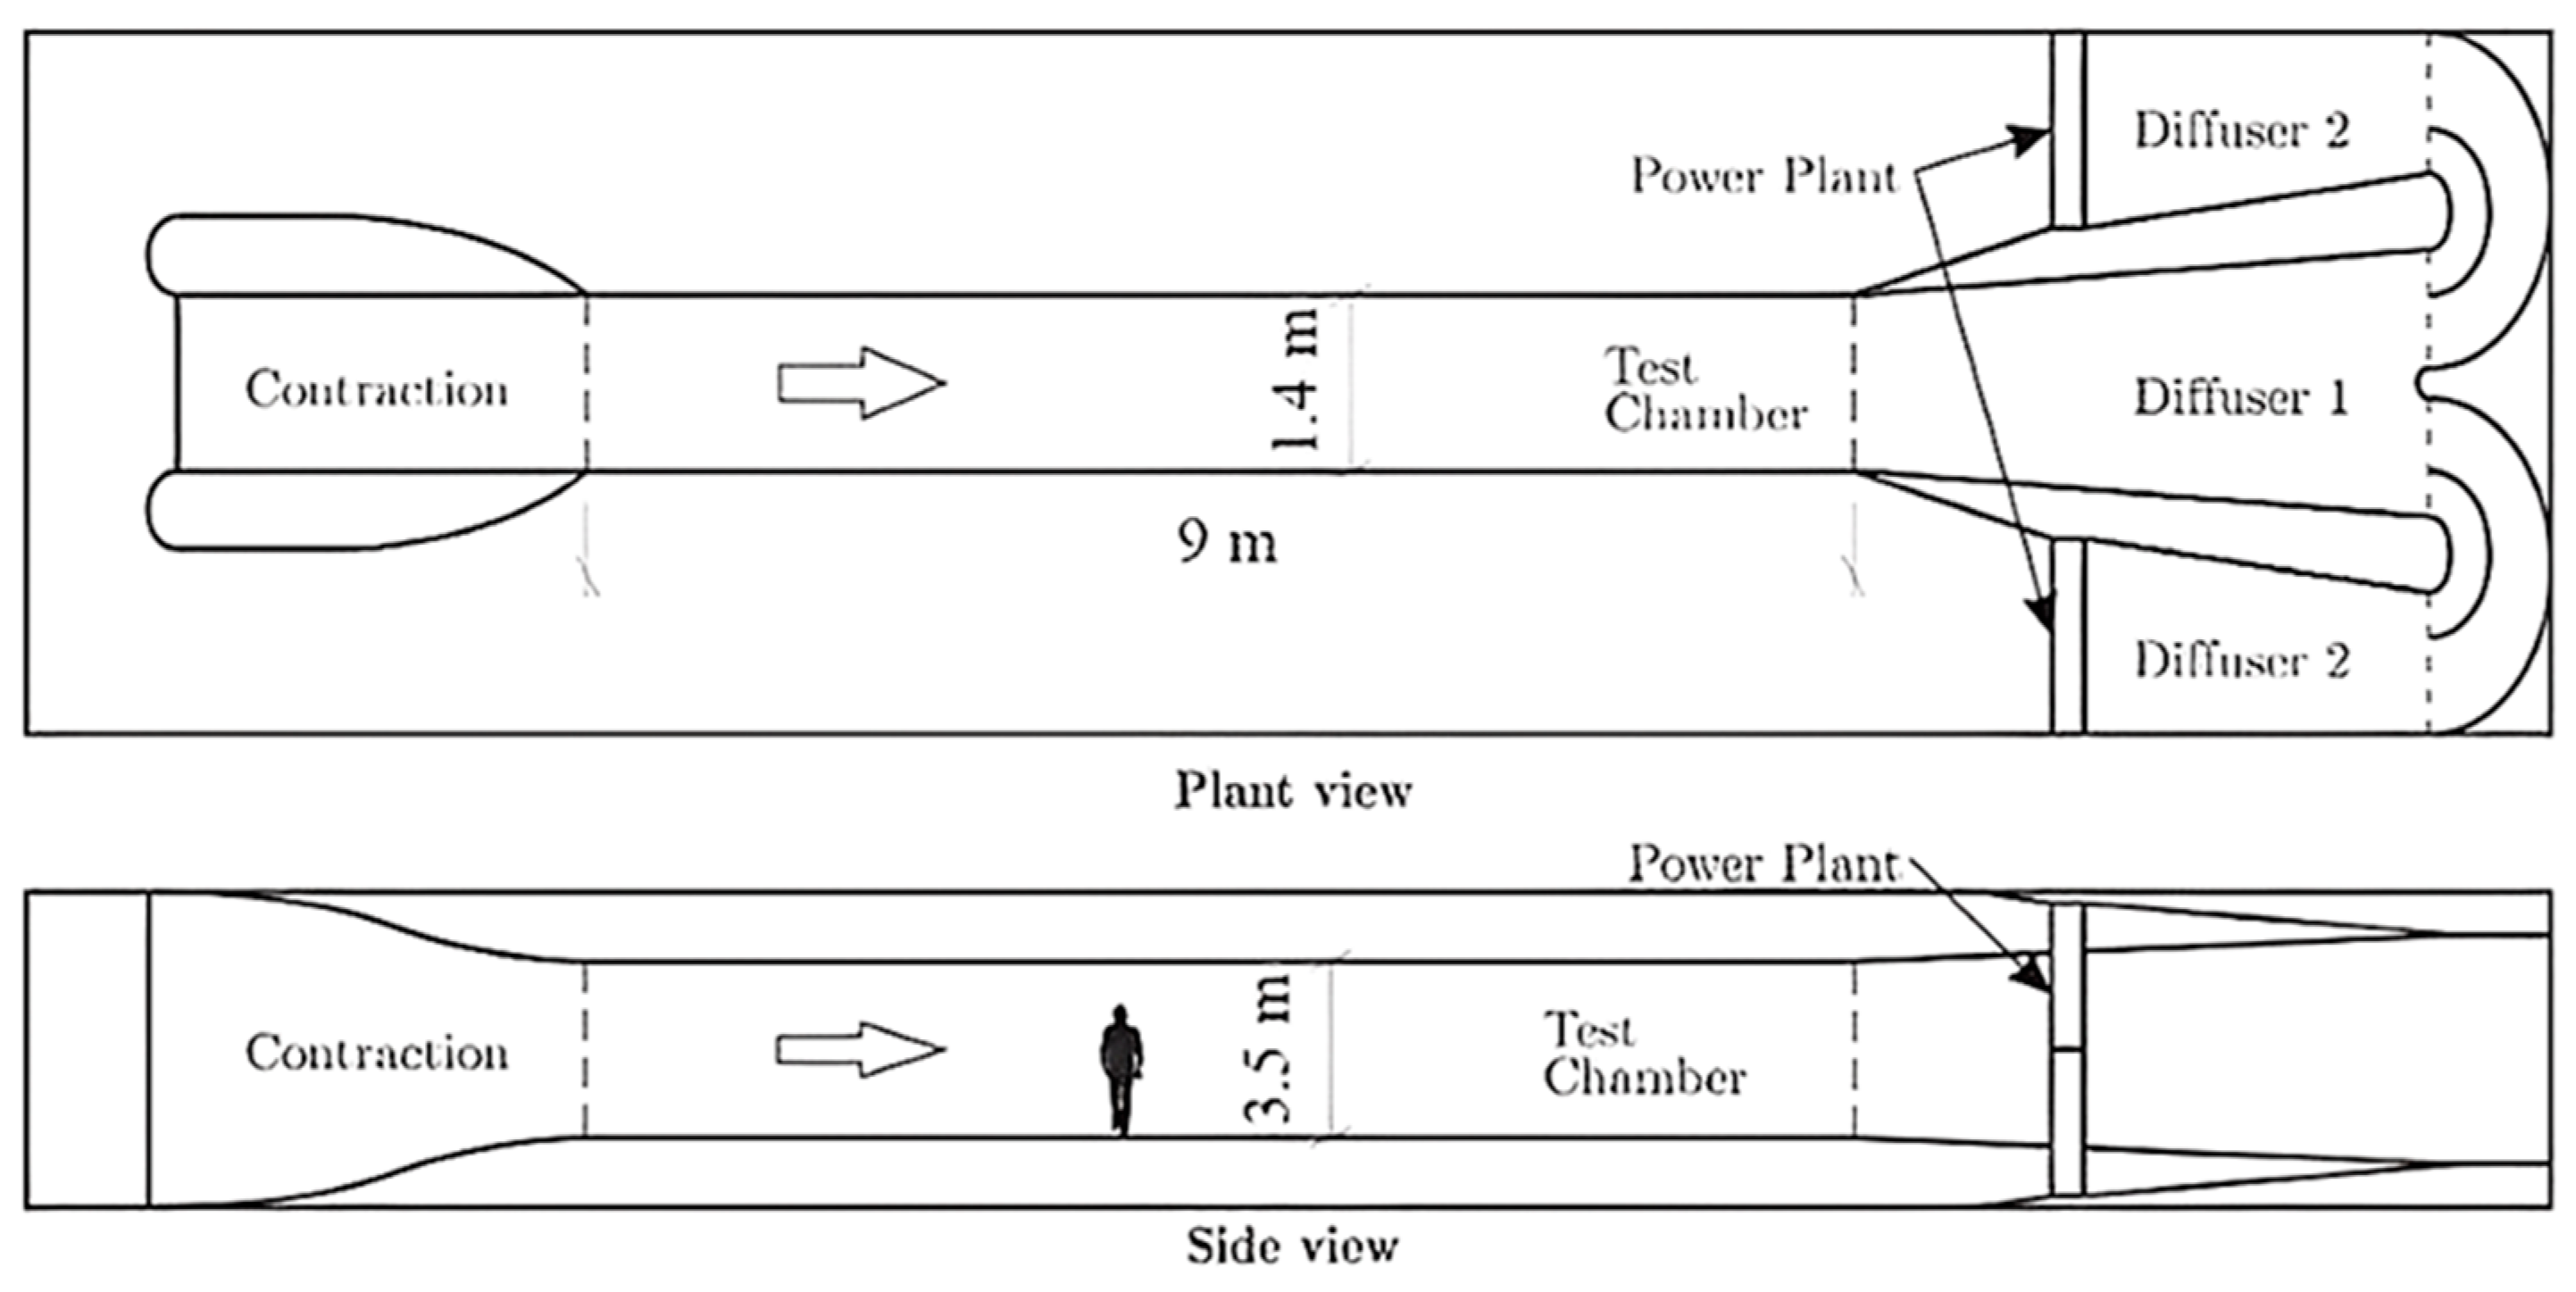
Testing was conducted in the Vortepsa wind tunnel (
Figure 7), situated at the Higher Polytechnic School of Ávila, Spain. This facility boasts a symmetrical wind tunnel (geometry in eight) of a total length of 9.1 m, whose working section is 3.2 m high by 1.4 m wide, and a distance between the laminarizing lattice and the study model of 3.7 m. The air is driven by 8 fans, model SODECA HCH-80-4T-3/PL IE3 of 2.2 kW of electrical power, arranged in 2 vertical arrays of 4 fans each, and the tunnel generates a collective power of 60 kW. Through a variable frequency drive, the wind speed can be precisely controlled, allowing velocities of up to 30 m/s to be achieved.
In the selection of the sensors, high acquisition frequency, reproducibility, and simplicity were prioritized. A piezoelectric diaphragm CPT-2065-L100 zirconate-lead titanate transducer was used, which produces an analogical signal when a deformation is induced in it. For its adaptation to the rod, a plastic support (PETG) was manufactured using 3D printing so that its bending is induced in the middle axis of the piezoelectric disc. As it is evident, with this sensor we do not obtain or try to measure net values of deformation, but to acquire comparative measures of greater or lesser bending.
For data acquisition, a piezoelectric sensor [
38] was strategically placed where the maximum bending moment occurs in a cantilever rod, at the base of each prototype’s mast during testing. This sensor, connected to an oscilloscope, facilitated the assessment of each model’s behaviour under different wind speeds. The oscilloscope, an Owon model SDS1022 [
39] manufactured by Fujian Lilliput Optoelectronics Technology Co. from Zhangzhou, China, recorded mast oscillation frequency and magnitude at a rate of 25 measurements per second. Data were stored in *.CSV format on a USB memory device for subsequent analysis and interpretation.
3.3. Test Speed Range
The study of the VIV phenomenon in laminar and turbulent environment is well known and perhaps sufficiently studied in the available literature [
40]. In the present case, the wind tunnel is intended to sufficiently mimic fluid conditions similar to those that such a device might encounter in a standard wind turbine farm. However, as usual, the “fine-grained” turbulence content is possibly higher than the airflow that would be encountered in the natural environment.
The experimental speed range for testing was determined based on the operating conditions and limitations of the wind tunnel. Controlled by a frequency converter governing fan speed, the wind speed was gauged using a hot-wire anemometer, specifically the Almemo 2470 model [
41] manufactured by Ahlborn Mess- und Regelungstechnik GmbH from Munich, Germany, positioned within the test chamber.
The natural frequency of each prototype primarily depends on the mast length, stiffness, and mass distribution it supports. Although the mast remains consistent across the prototypes, variations in the surface or geometry of the top segment cause slight mass discrepancies, which leads to empirically measuring the natural frequency of each prototype.
Table 2 presents these frequencies.
Given that the prototype geometry determines its natural frequency, this frequency is used to estimate the wind speed where VIV occurs, aligning the structure’s natural frequency with vortex frequency. The theoretical resonance velocity (V), calculated using Equation (2) [
8], stands at 1.46 m/s, considering S
t = 0.2 (
Figure 2), ƒ = [9.52–10.25] Hz (
Table 2), and ∅ = 28.5 mm (
Figure 4).
The selection of the test velocity range, grounded in theoretical calculations and starting from the calculated minimum resonance velocity (1.50 m/s) to the maximum experimentally determined velocity (10 m/s), ensures that the frequency range (5.50–10 Hz) aligns perfectly with the operational speeds of the wind turbine. Within this range of velocities, the behaviour of the six prototypes and their operational velocities (Lock-In range) were evaluated. Therefore, the velocities for the tests were fixed according to equivalent frequency drive values (5.50–10 Hz). By considering the common base diameter of the cylinder (∅) of 28.50 mm for all prototypes, the corresponding Reynolds number (Re) for each value (
Table 3) was computed using Equation (3).
where V is the air velocity, and υ is the kinematic viscosity of air (1.46 × 10
−5).
4. Results
The experimental results rely on the signals captured by the oscilloscope through the piezoelectric sensor. These signals quantify the response of each prototype to different wind velocities, offering insights into the experienced VIV and the mechanical energy absorbed through vibration. For instance,
Figure 8 illustrates an example of the superimposed signal values from the piezoelectric sensor, depicting three instances of the convergent-shaped prototype with a smooth surface, at different Reynolds numbers (Re = 3.32 K, 3.71 K, and 4.10 K).
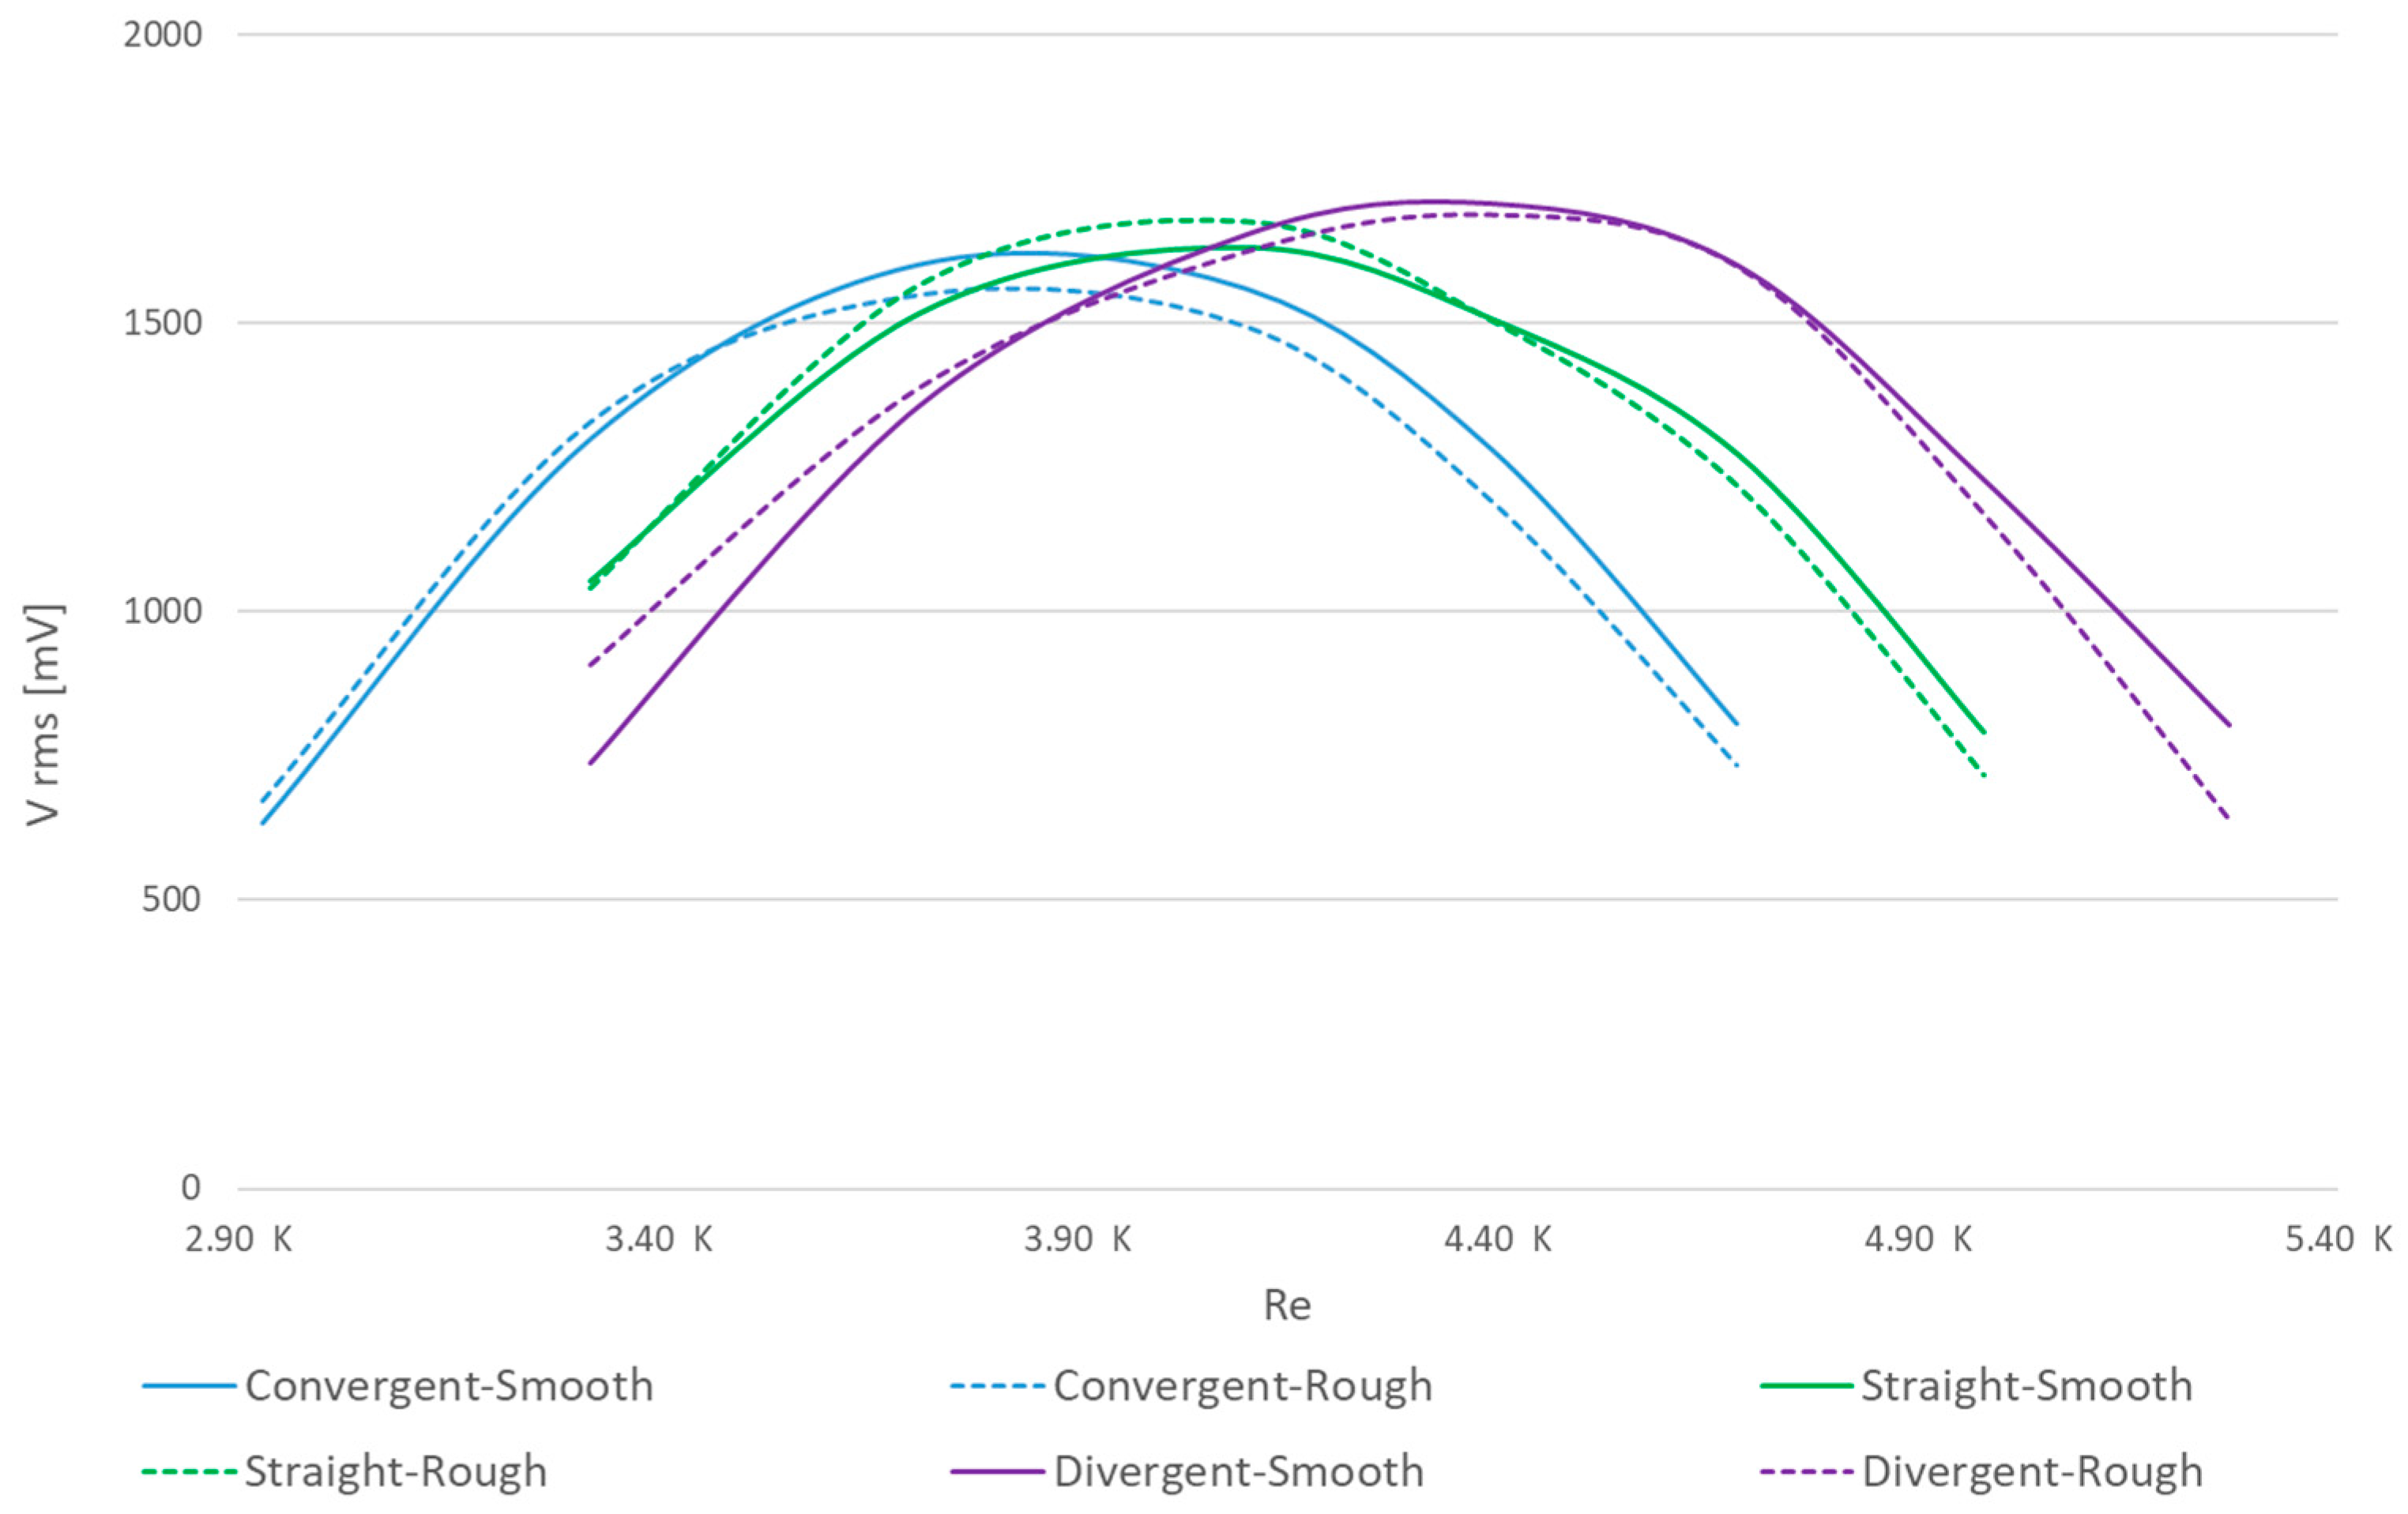
The results obtained from the tests conducted on the different surfaces within the specified range (
Table 3) are summarized in
Figure 9. Here, the
X-axis represents the Re values, while the
Y-axis represents the Root Mean Square (RMS) of the registered signals for each prototype.
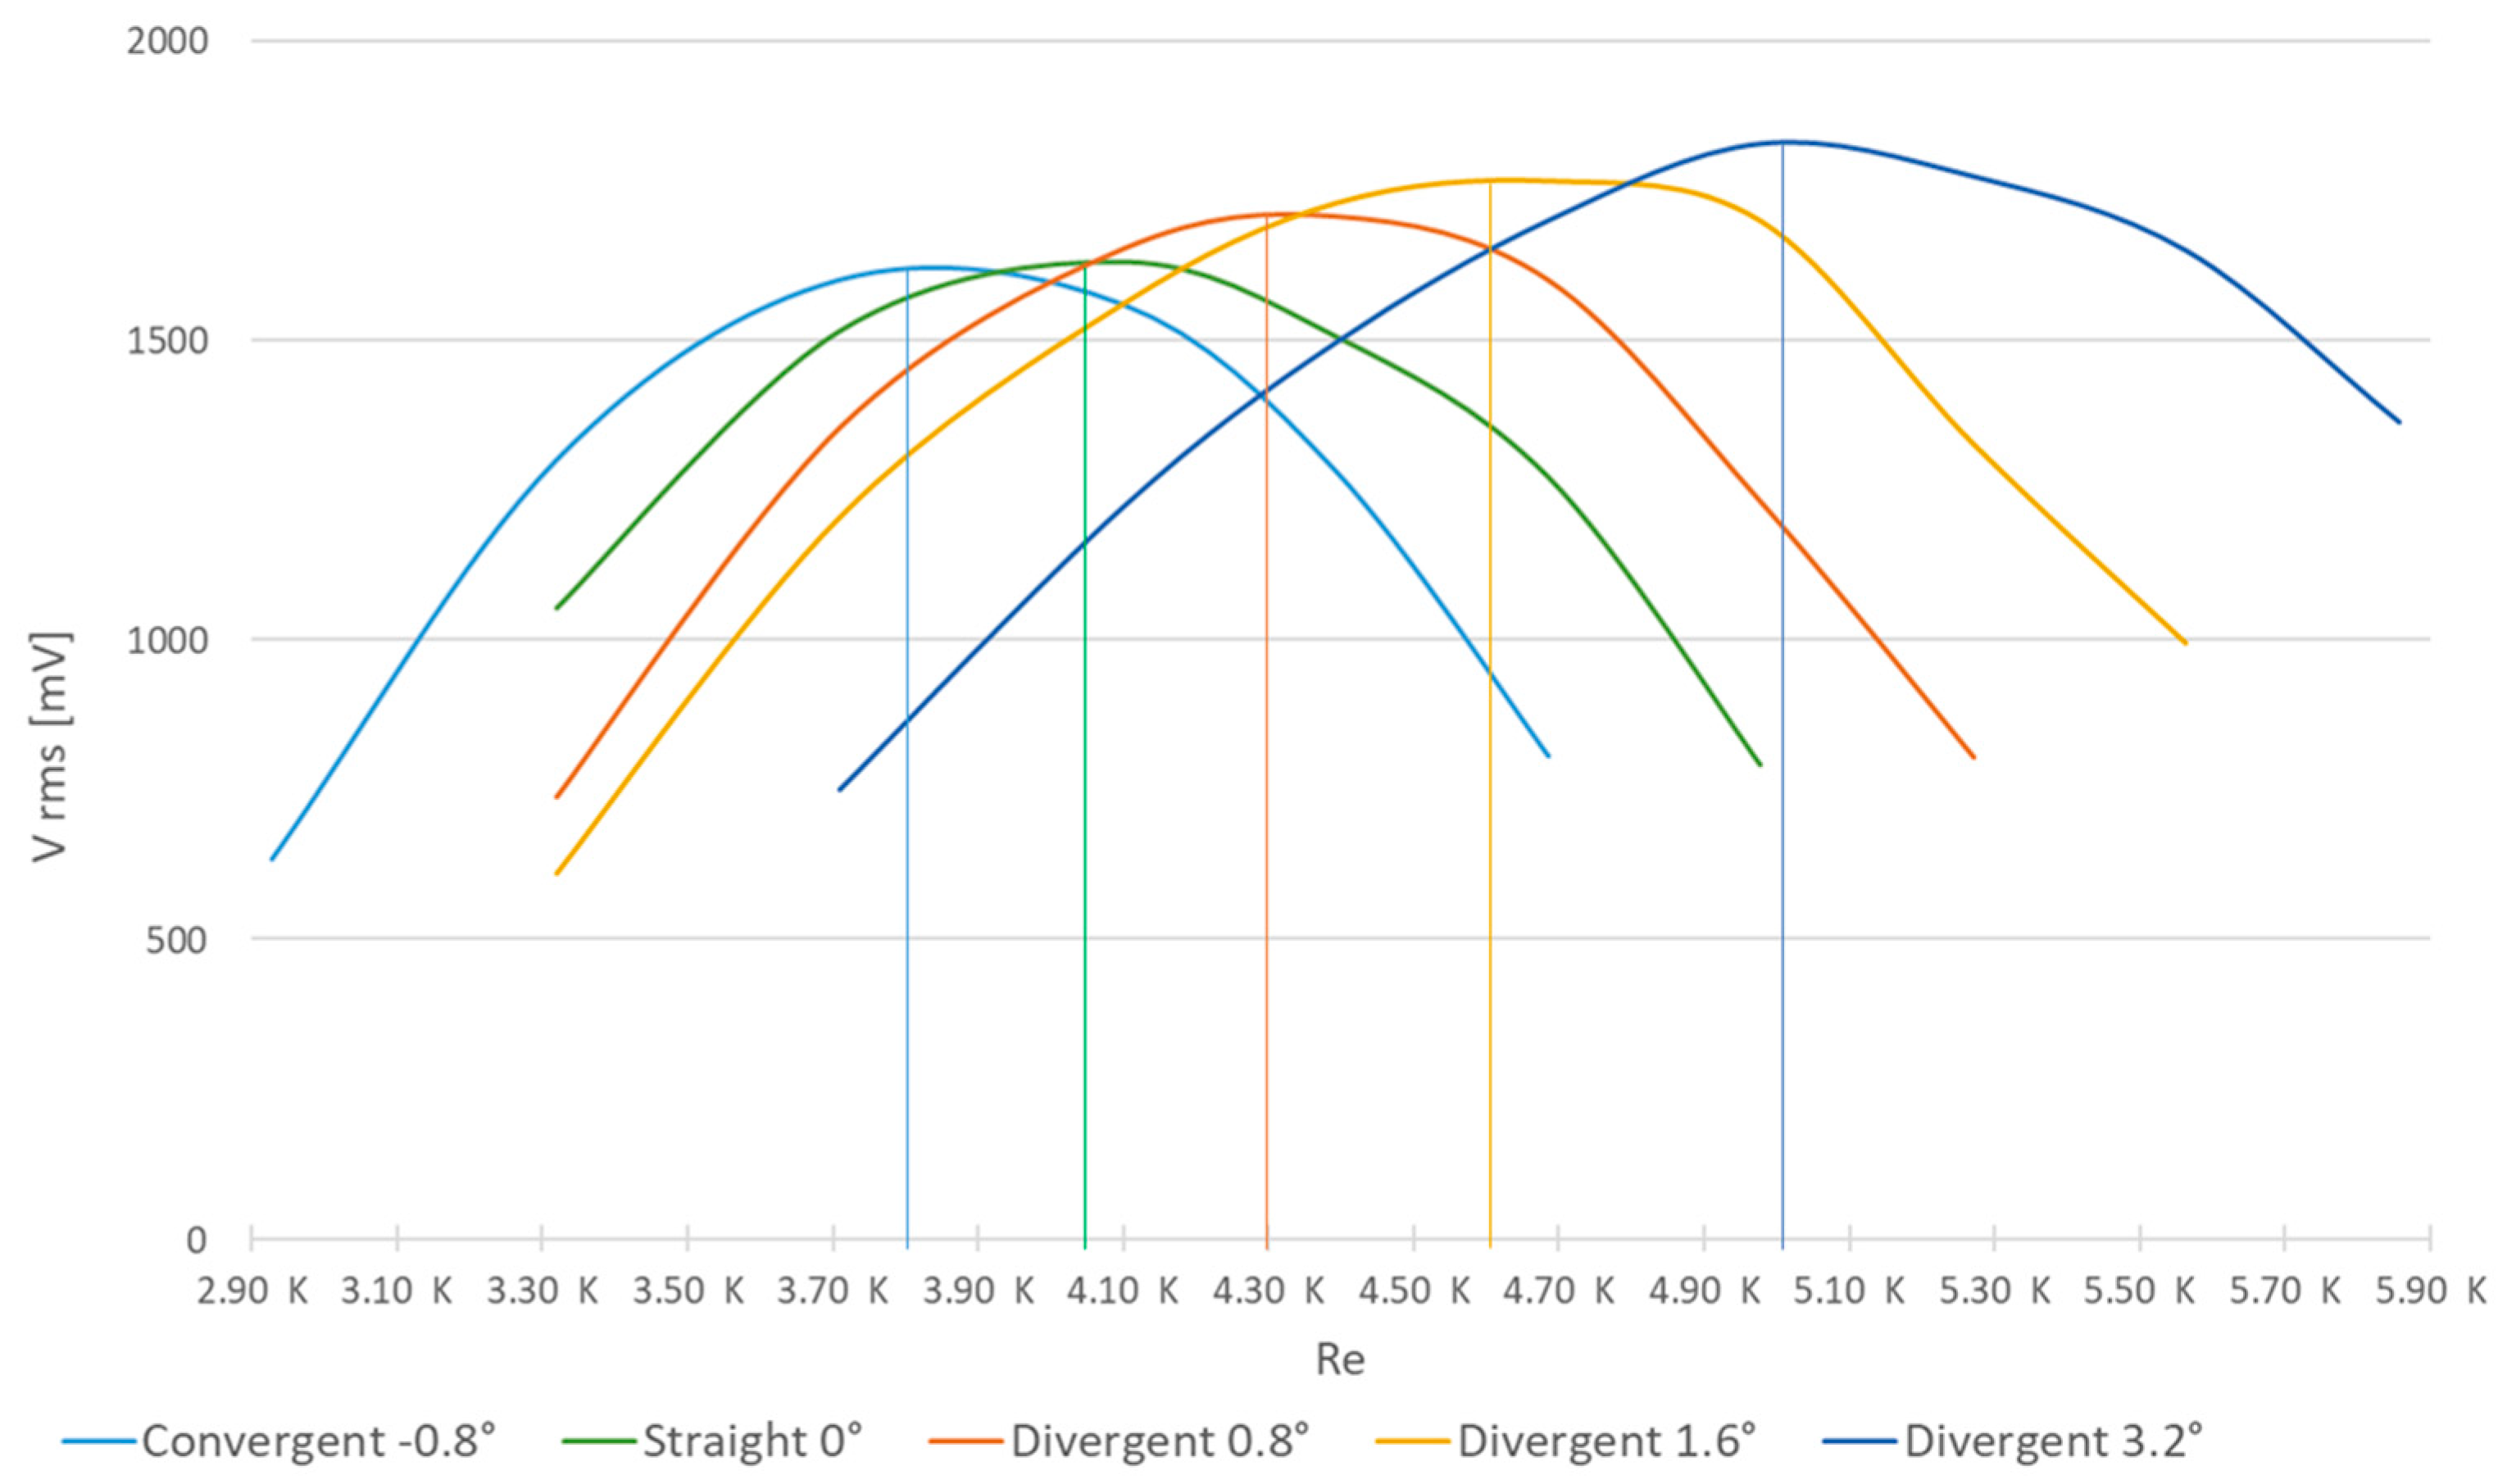
Analysing these test outcomes reveals that the divergence angle significantly influences the behaviour of the wind energy harvester, while the considered surface roughness demonstrates minimal impact on its aerodynamic performance. In pursuit of deeper insights, further tests were conducted using two additional prototypes featuring a smooth surface but differing in divergence angles. Building upon the original dimensions (
Figure 5), these two additional prototypes were designed and manufactured with doubled (1.6°) and quadrupled (3.2°) divergence angles. Convergence angles were dismissed due to physical and operational limitations.
Figure 10 showcases results from these tests, highlighting the maximum Lock-In range points corresponding to Re values for each prototype.
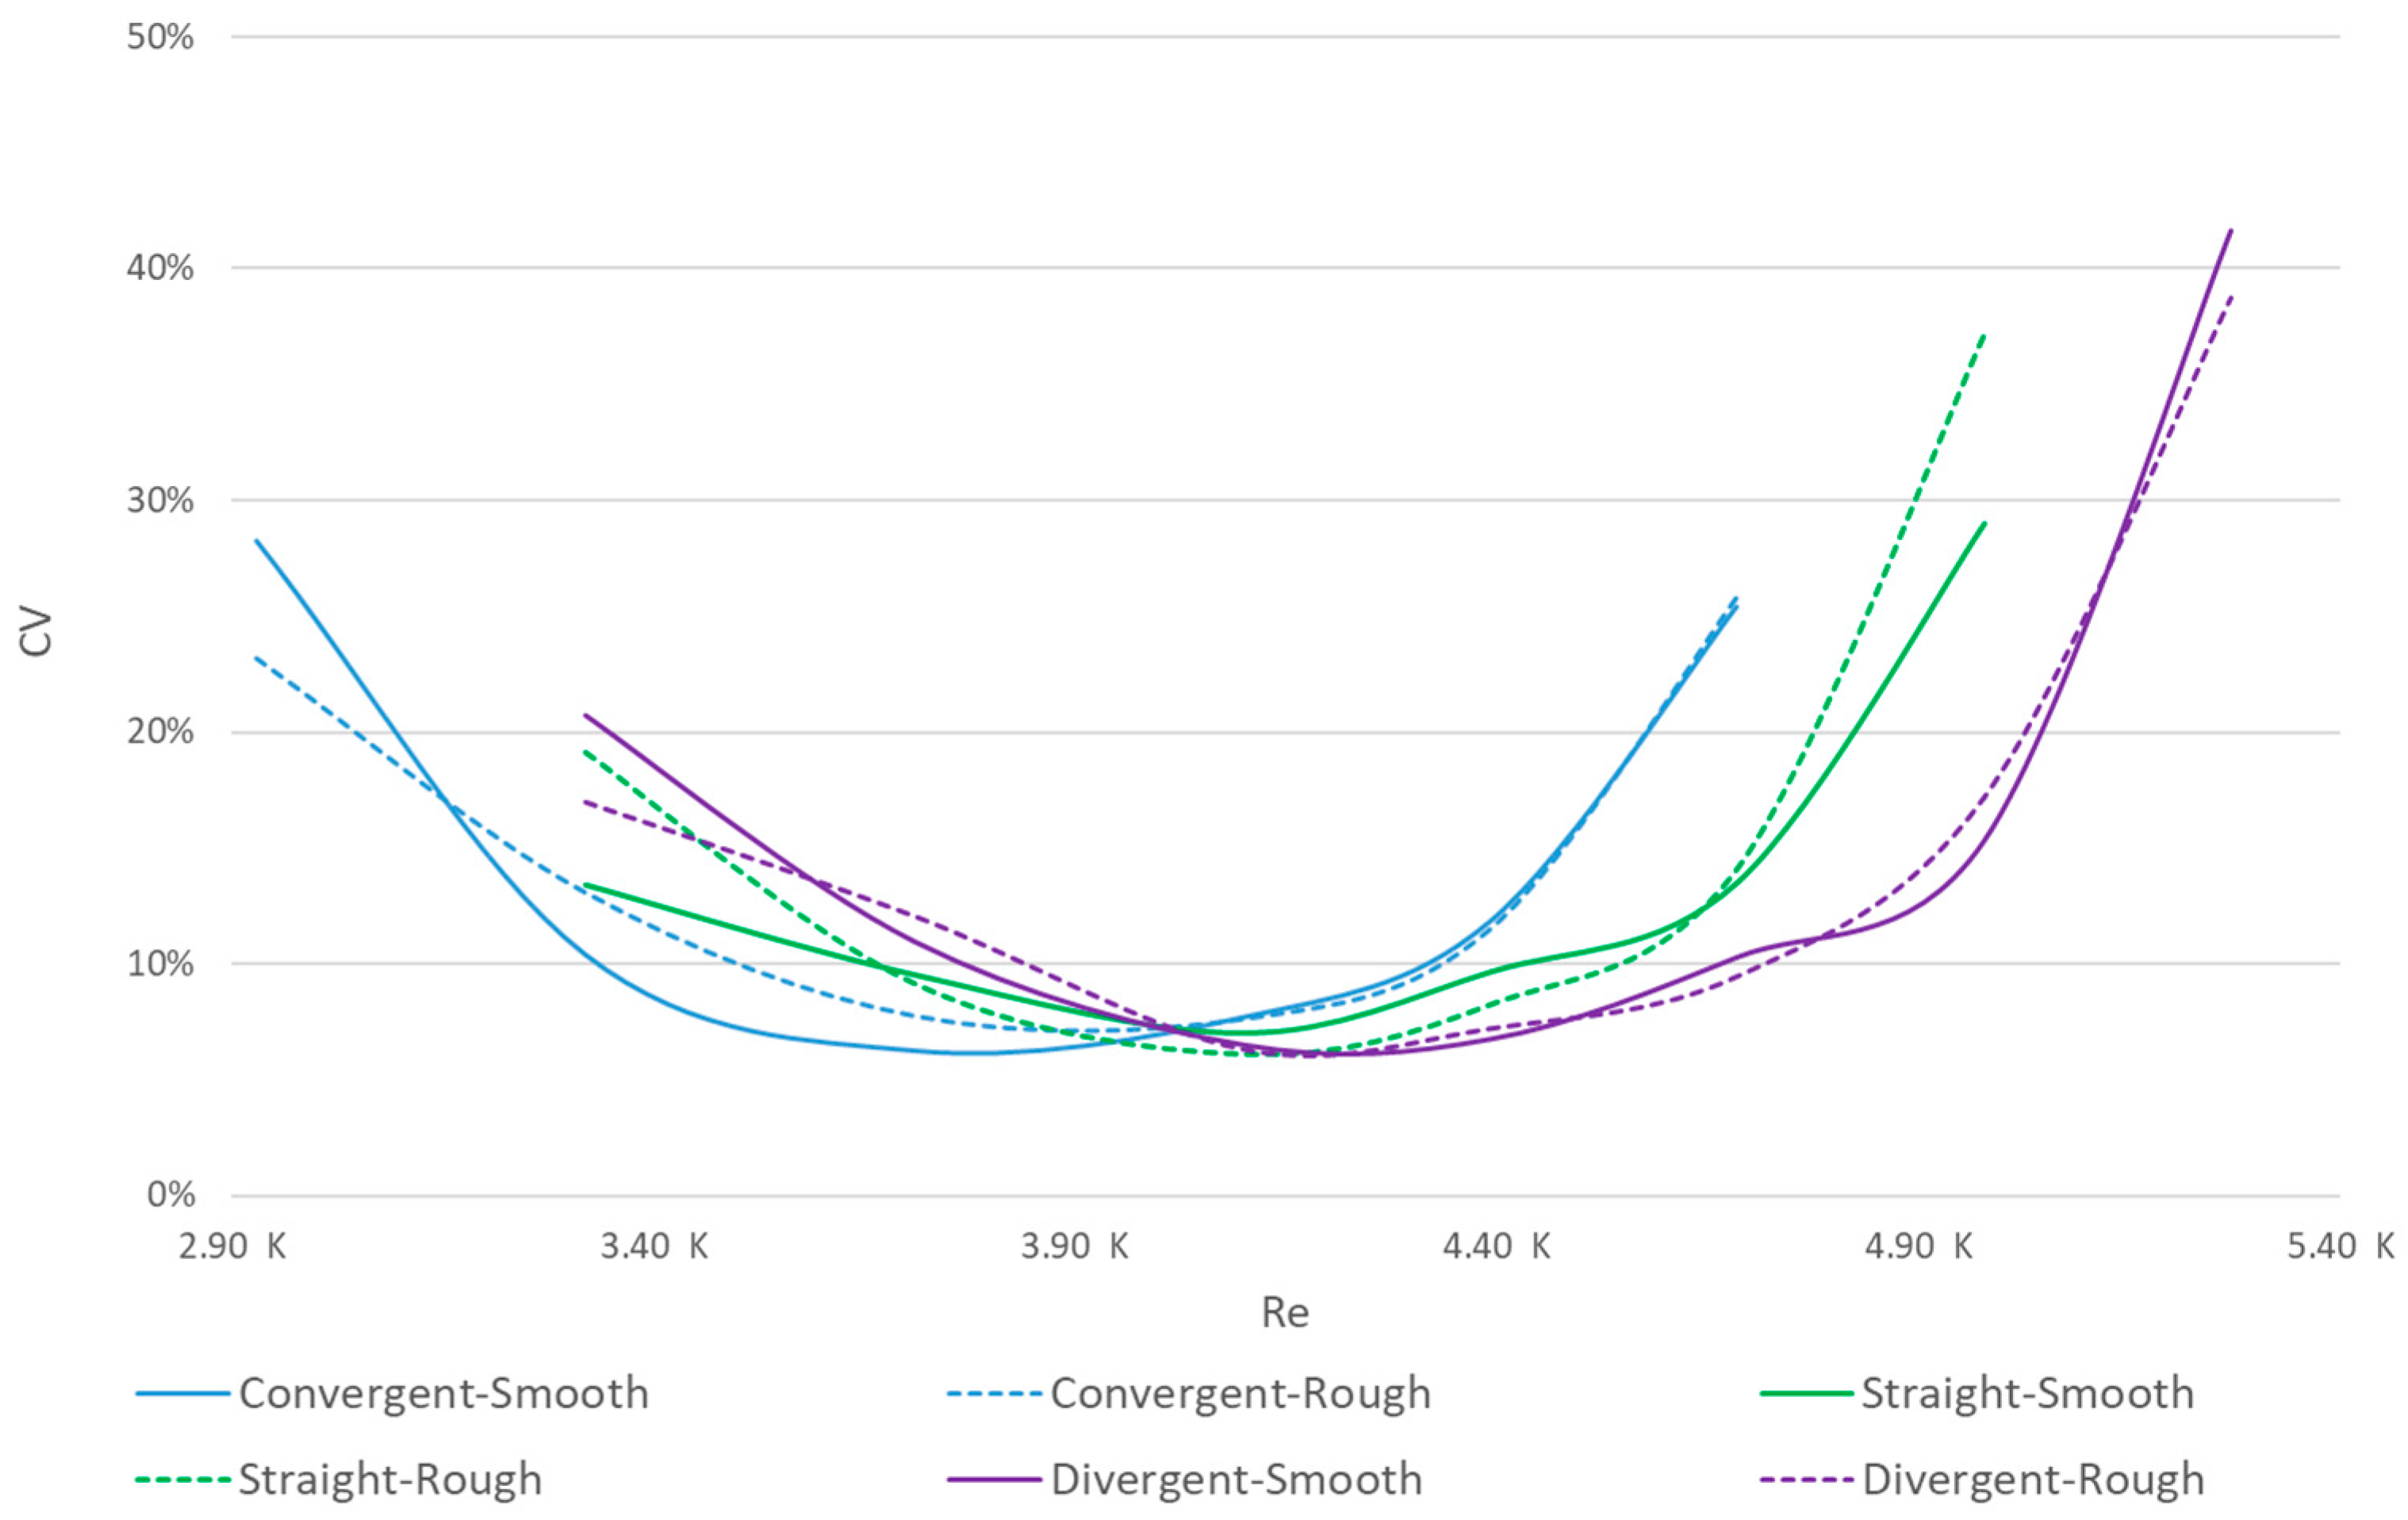
In the analysis of our experimental outcomes, the Coefficient of Variation (CV) [
42] has proven to be indispensable for evaluating the relative dispersion of our data sets in relation to their mean values. This statistical measure provides a unitless ratio of the standard deviation to the mean, offering a standardized means to assess the variability of our experimental data.
In
Figure 11, the data analysis for the first six geometries is shown, corresponding to the results depicted in
Figure 9. This visual representation elucidates the relationships and variances among the geometrical configurations under study, providing a comprehensive overview of their performance metrics and experimental outcomes.
Regarding the outcomes presented in
Figure 10,
Figure 12 illustrates the data from our Coefficient of Variation (CV) analysis. This graphical representation enables a clear comparison of the variability inherent to each set of experimental data, contextualizing the CV findings within the broader scope of our study.
5. Discussion
As mentioned in the
Section 4, it is evident that the initial prototype shape (variation in convergence/divergence angle) holds significant influence, while surface roughness has minimal impact.
Figure 12 clearly illustrates how diverse geometries shift the Lock-In range towards higher Reynolds numbers as the upper diameter expands due to geometric changes. This relationship aligns with Equation (3), linking wind velocity, Reynolds number, cylinder diameter, and the natural frequency of the prototype. The diameter variation outweighs the impact of mass differences among the prototypes. The mass disparity directly affects the natural frequency, making the mass impact less significant across the different prototype types. Consequently, this shift towards higher Reynolds numbers results in an increased Lock-In range, as evidenced by higher RMS values and peak readings recorded by the piezoelectric sensor.
Table 4 showcases Reynolds numbers corresponding to the maximum Lock-In range values.
The validity of these findings is shown by the results of the Coefficient of Variation (CV) around a value of 10% in maximal Re Lock-In points, which provide a nuanced interpretation within the context of experimental data analysis. A CV value close to 10% suggests a moderate level of variability relative to the mean of the data set. This indicates that while there is some dispersion in the data points, it is not excessively high, suggesting a relatively stable set of measurements or observations.
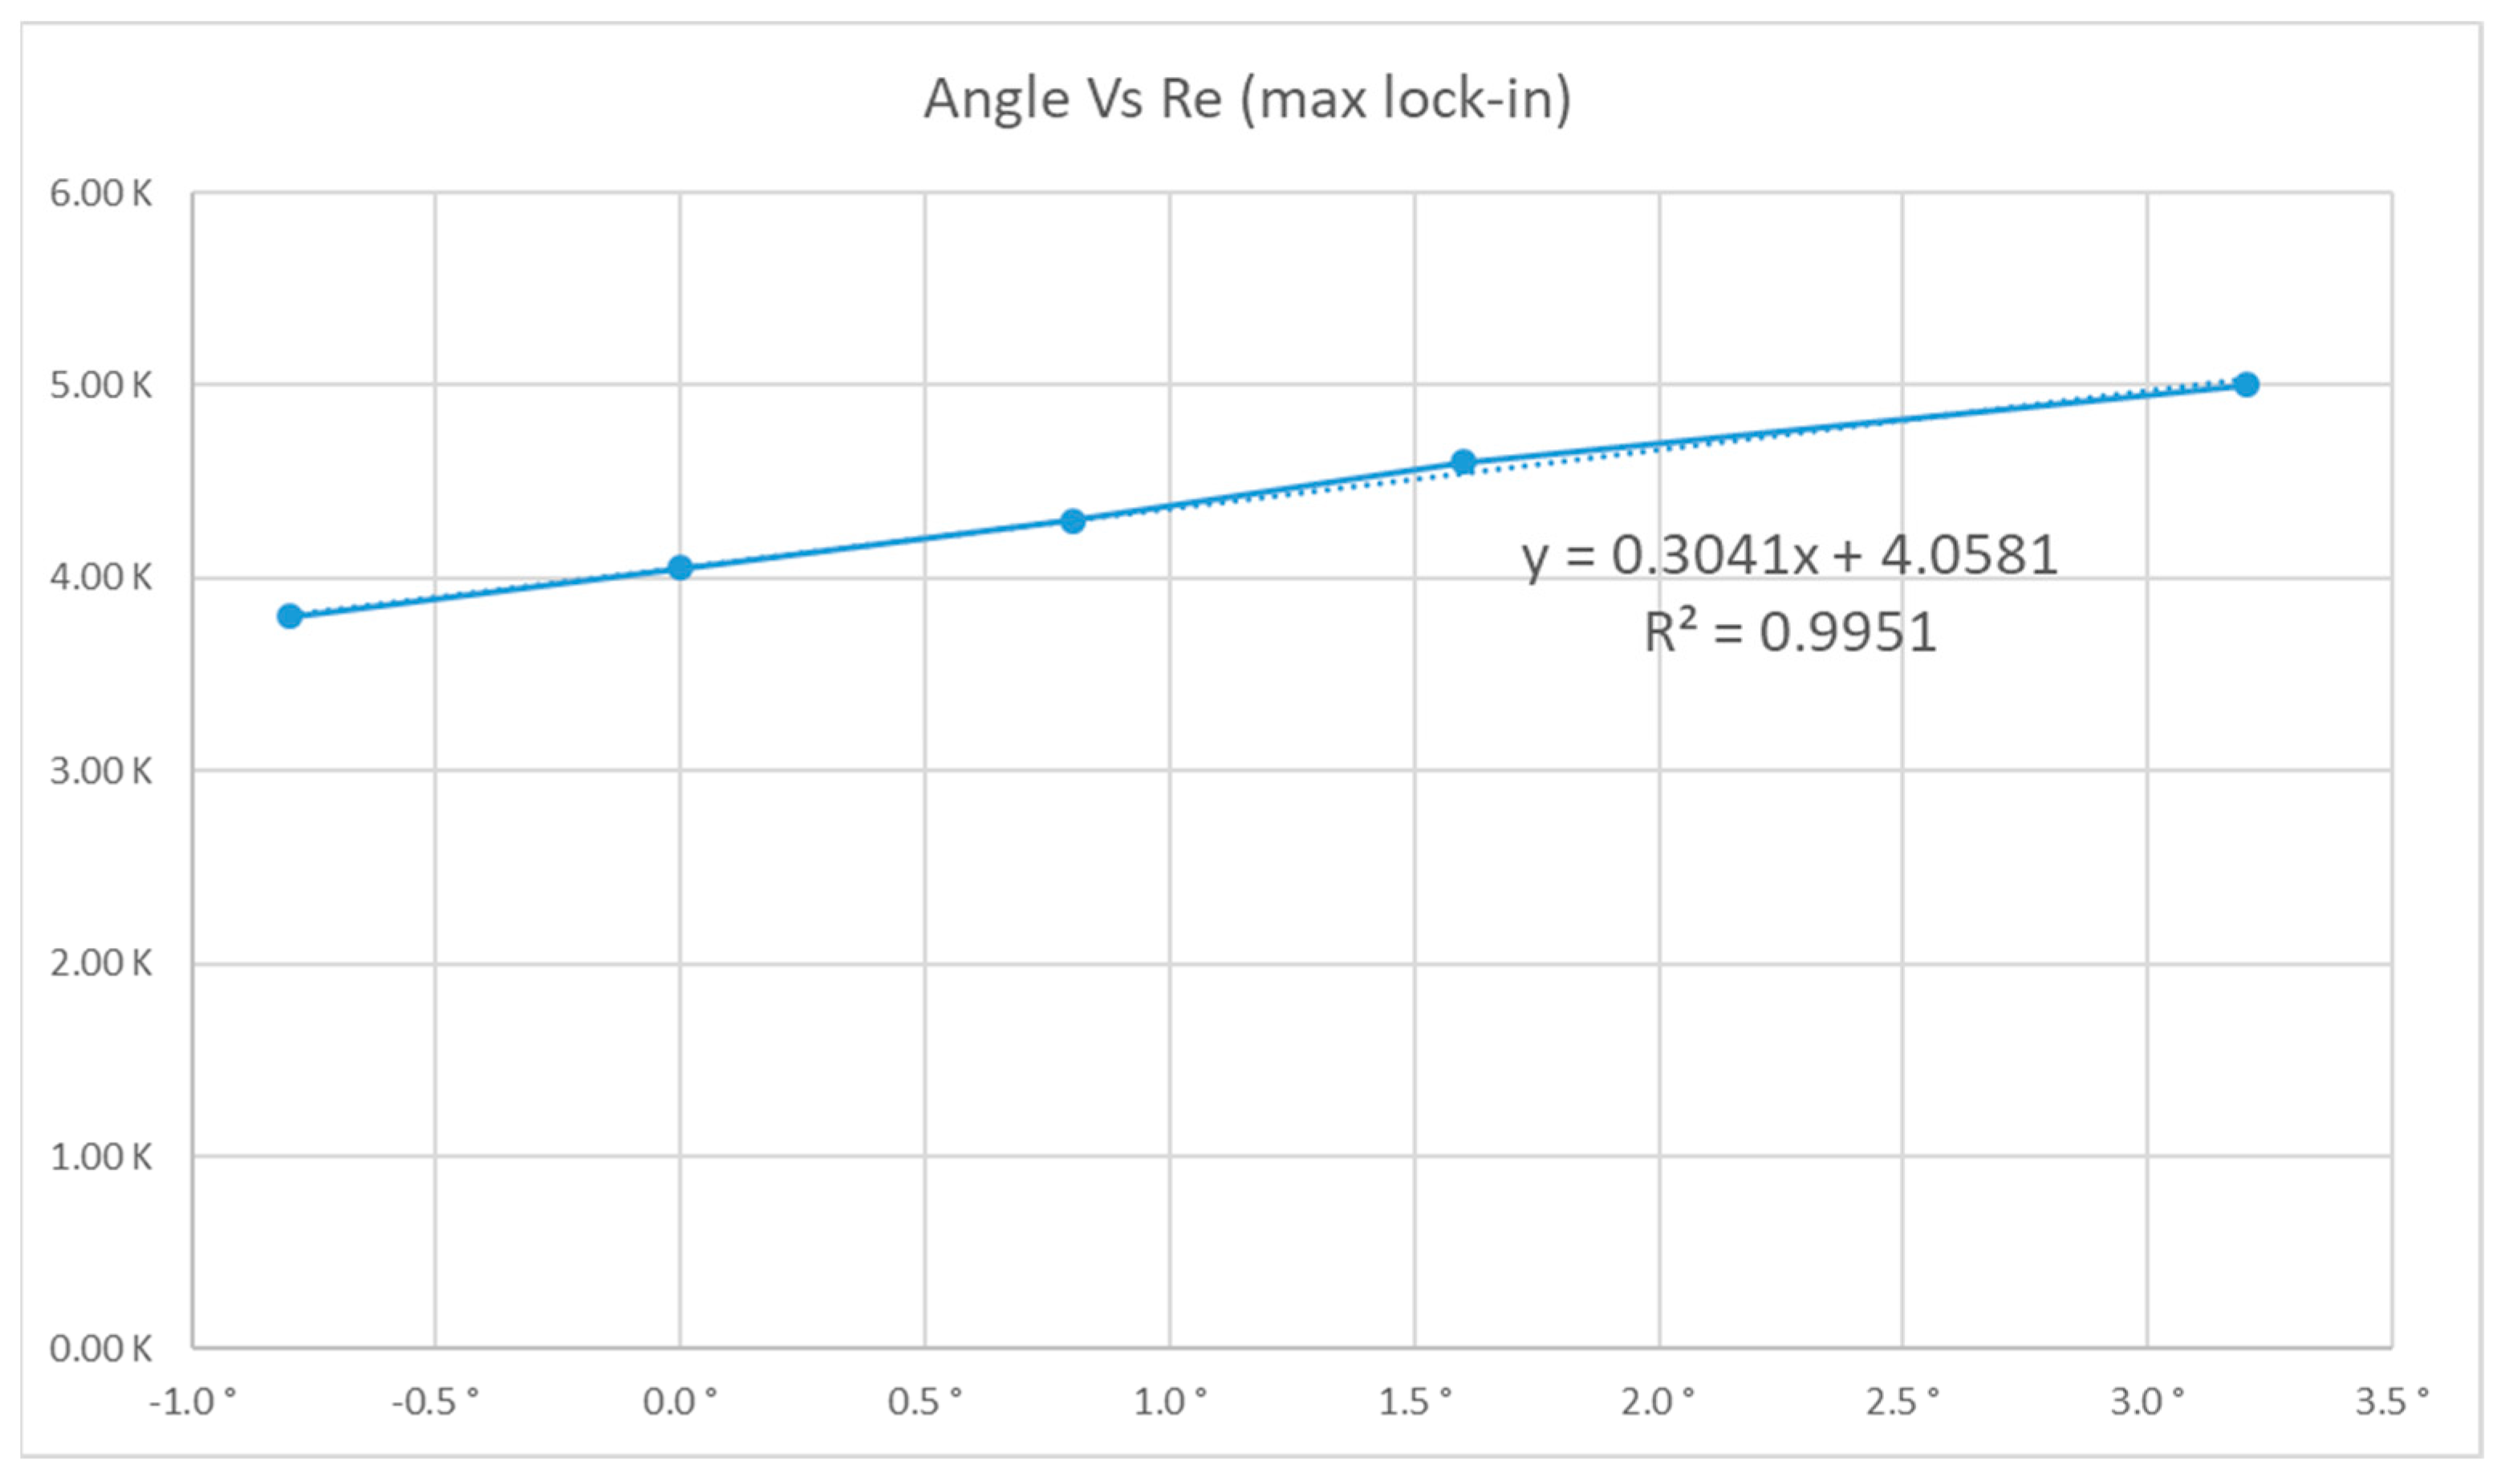
Based on these findings,
Figure 13 delineates the relationship between convergence/divergence angles of the prototype and their corresponding peak Lock-In range points.
A linear regression analysis led to Equation (4):
Lock-In values increase for higher Re values that suppose higher wind velocities (Equation (3)), increasing the energy available due to the fundamental principles governing the conversion of wind energy into electrical energy. Equation (5) indicates that the energy content of the wind striking a wind turbine (
P) is directly related to the air density (
ρ), the area (
A) swept by the turbine’s blades, and, most critically, the cube of the wind velocity (
V).
Assuming all parameters as constants, and relating Equations (4) and (5), the relationship between the power and the angle could be expressed by Equation (6), where
P is the power,
α is the angle, and
k stands in this case as a constant value that relates both variables:
Considering surface type, despite its relatively minor influence, observations in
Figure 11 depict VIV tending to decrease as Re rises for rough surfaces within each geometry. This phenomenon aligns with the behaviour of the wind turbine, which can be assimilated to a mass–spring system. As previously mentioned, the spring constant relies on mast stiffness (constant across all models). Therefore, the oscillation frequency inversely relates to the square root of the body’s mass (Equation (1)); thus, when roughness increases the mass, the natural frequency decreases. This explains the decline in Lock-In range for rough surfaces at higher Re values: increased mass, compared to smooth surfaces, reduces the natural oscillation frequency. However, for rough surfaces, the increased irregularities cause an earlier transition to turbulence [
33]. This early transition can enhance the energy and momentum transfer between the fluid layers and the surface, affecting the formation and shedding of vortices. Those effects underscore the reduction in Lock-In range for rough surfaces at higher Re values.
BWT technology remains in the developmental phase and is characterized by the challenges associated with emerging technologies. In [
43], a comparative study between BWTs and traditional horizontal axis wind turbines (HAWTs) reveals distinct advantages and limitations of each technology. As an example of the limitations of BWTs, these show an efficiency (power usage to power output ratio) of 70%, while HAWTs reach 80% efficiency.
6. Conclusions
Based on the experiment results, it can be concluded that the geometry’s shape, particularly its impact on the diameter, significantly affects the Lock-In range. This influence either extends the range towards higher Reynolds number (Re) values or reduces and shifts it towards lower Re values. Predicting the maximum Lock-In range value is feasible using the equation Re (max Lock-In) = 0.30 α + 4.06, boasting a high predictive capacity with an R2 of 0.99. Considering that the power extracted by the wind turbine is related to the cube of the velocity, this equation is equally related to the cube with respect to the power, considering that the rest of the parameters are constant, as stated in Equation (6).
Moreover, higher diameters correspond to increased maximum RMS values, indicating elevated energy generation. Specifically, a 3.2° divergence angle displays roughly a 12% surge in maximum RMS value compared to a straight shape at 0°.
While surface roughness showed a slight impact, causing a marginal reduction in the Lock-In range, its influence was not pronounced. Nevertheless, this suggests that increased surface roughness might diminish the Lock-In range, potentially affecting the performance of slender circular-shaped wind energy harvesters based on VIV, as evidenced in this study.
These results provide insights into the performance expectations for large-scale wind energy harvesters across different scales, underscoring the pivotal role of geometric adjustments in enhancing energy capture efficiency. The demonstrated ability to predict the Lock-In range with high precision paves the way for optimizing bladeless wind turbine designs, potentially leading to more effective and adaptable wind energy solutions. The findings signify a leap towards maximizing the energy generation potential of wind harvesters, crucial for advancing renewable energy technologies and meeting global energy demands sustainably.
Through this study, significant strides in bladeless wind turbine technology are underscored, emphasizing the pivotal role of geometry and diameter in determining the Lock-In range, a crucial aspect for enhancing energy efficiency. The derived predictive equation for the maximum Lock-In range value, renowned for its precision, empowers precise projections of device performance, heralding a notable advancement in the utilization and evolution of bladeless wind energy systems.
In addition, it should be considered that BWT technology is still under development and suffers from the limitations of an immature and developing technology. In fact, to date, there is no unequivocal evidence of its potential success or overtaking conventional wind technology in general. It is true that there are niches in the market not adequately covered by traditional wind machines, both vertical axis- (Sabonius, Darrieus) and horizontal axis-ones (three-blade, etc.), for example, the distributed energy environment, where the user rarely wants to go up to the roof to change parts or lubricate the device. This new technology could overcome this clear barrier for rotating machines. Another area with potential for BWTs is environments that suffer from very low temperature events. It is well known that classical devices are blocked by ice, and resonant wind turbines do not have shafts that can be frozen. In any case, the market and technological development will prove in the future the suitability of a wind machine approach such as the one studied in this work.
Building upon these findings and considerations, future investigations may expand to examine more factors influencing vortex-induced vibrations (VIVs) in bladeless wind turbines. Investigating variations in turbine geometry, such as hyperbolic diameter profiles or modifications to the leading-edge design, presents a promising avenue. Moreover, assessing external influences, including the spatial arrangements and orientations of turbine arrays, and the interference effect for these arrangements of multiple BWT, offers potential for uncovering further insights critical for the advancement of this field. These explorations could unlock new dimensions of efficiency and performance in wind energy harvesting technologies.
Author Contributions
Conceptualization, E.G.-G.; methodology, E.G.-G. and D.J.Y.; validation, D.J.Y.; formal analysis, E.G.-G.; investigation, E.G.-G.; writing—original draft preparation, E.G.-G.; writing—review and editing, E.G.-G., D.J.Y., S.D.P. and S.L.; visualization, E.G.-G.; supervision, S.D.P. and S.L. All authors have read and agreed to the published version of the manuscript.
Funding
The authors would like to thank the European Union for the funding provided through the European Union’s Horizon 2020 research and innovation program under grant agreement No 101021714 (Project LAW-GAME). Views and opinions expressed are those of the authors only and do not necessarily reflect those of the European Union or the European Research Executive Agency. Neither the European Union nor the European Research Executive Agency can be held responsible for them.
Institutional Review Board Statement
Not applicable.
Informed Consent Statement
Not applicable.
Data Availability Statement
Data is contained within the article.
Acknowledgments
The authors express their gratitude to Vortex Bladeless S.L. for their technical support.
Conflicts of Interest
Author David J. Yáñez was employed by the company Vortex Bladeless S.L. The remaining authors declare that the research was conducted in the absence of any commercial or financial relationships that could be construed as a potential conflict of interest.
References
- Energy Transition in the EU | Think Tank | European Parliament. Available online: https://www.europarl.europa.eu/thinktank/en/document/EPRS_BRI(2023)754623 (accessed on 4 December 2023).
- Xu, T.; Gao, W.; Qian, F.; Li, Y. The implementation limitation of variable renewable energies and its impacts on the public power grid. Energy 2022, 239, 121992. [Google Scholar] [CrossRef]
- Gjorgievski, V.Z.; Cundeva, S.; Georghiou, G.E. Social arrangements, technical designs and impacts of energy communities: A review. Renew. Energy 2021, 169, 1138–1156. [Google Scholar] [CrossRef]
- Lei, K.; Tang, Z.; Sun, Z. Harvesting airflow energy from circular cylinder wake via a thin polyvinylidene fluoride film. J. Wind Eng. Ind. Aerodyn. 2022, 231, 105235. [Google Scholar] [CrossRef]
- Ren, Z.; Wu, L.; Pang, Y.; Zhang, W.; Yang, R. Strategies for effectively harvesting wind energy based on triboelectric nanogenerators. Nano Energy 2022, 100, 107522. [Google Scholar] [CrossRef]
- Zhang, B.; Song, B.; Mao, Z.; Tian, W.; Li, B. Numerical investigation on VIV energy harvesting of bluff bodies with different cross sections in tandem arrangement. Energy 2017, 133, 723–736. [Google Scholar] [CrossRef]
- Barrows, S.E.; Homer, J.S.; Orrell, A.C. Valuing wind as a distributed energy resource: A literature review. Renew. Sustain. Energy Rev. 2021, 152, 111678. [Google Scholar] [CrossRef]
- Vortex Technical Paper—Bladeless Wind Turbines explained. Vortex Bladeless Wind Power. Available online: https://vortexbladeless.com/download-green-paper/ (accessed on 20 July 2023).
- García, J.C.C.; Houzeaux, G.; Yáñez, D.J.; Mier-Torrecilla, M. SHAPE Project Vortex Bladeless: Parallel Multi-Code Coupling for Fluid-Structure Interaction in Wind Energy Generation. 2016. Available online: https://upcommons.upc.edu/handle/2117/88263 (accessed on 20 July 2023).
- View of Aerodynamic Characteristic of Vortex Bladeless Wind Turbine: A Short Review. Available online: https://publisher.uthm.edu.my/periodicals/index.php/rpmme/article/view/1981/567 (accessed on 20 July 2023).
- Jadidbonab, M.; Mohammadi-Ivatloo, B.; Marzband, M.; Siano, P. Short-Term Self-Scheduling of Virtual Energy Hub Plant Within Thermal Energy Market. IEEE Trans. Ind. Electron. 2021, 68, 3124–3136. [Google Scholar] [CrossRef]
- Dai, K.; Bergot, A.; Liang, C.; Xiang, W.-N.; Huang, Z. Environmental issues associated with wind energy—A review. Renew. Energy 2015, 75, 911–921. [Google Scholar] [CrossRef]
- Enevoldsen, P. Onshore wind energy in Northern European forests: Reviewing the risks. Renew. Sustain. Energy Rev. 2016, 60, 1251–1262. [Google Scholar] [CrossRef]
- Torres Sibille, A.d.C.; Cloquell-Ballester, V.-A.; Cloquell-Ballester, V.-A.; Darton, R. Development and validation of a multicriteria indicator for the assessment of objective aesthetic impact of wind farms. Renew. Sustain. Energy Rev. 2009, 13, 40–66. [Google Scholar] [CrossRef]
- Estudio Comparativo de los Impactos Ambientales Producidos por los Aerogeneradores con palas vs. Aerogeneradores Vortex Bladeless. Available online: https://seo.org/wp-content/uploads/2015/06/Informe-Vortex_SEO_BIRDLIFE_Def_.pdf (accessed on 20 July 2023).
- la Puente, A.B.-D.; Balmori, A. Flight Type and Seasonal Movements Are Important Predictors for Avian Collisions in Wind Farms. Birds 2023, 4, 85–100. [Google Scholar] [CrossRef]
- Marques, A.T.; Batalha, H.; Bernardino, J. Bird Displacement by Wind Turbines: Assessing Current Knowledge and Recommendations for Future Studies. Birds 2021, 2, 460–475. [Google Scholar] [CrossRef]
- Lakatos, L.; Hevessy, G.; Kovács, J. Advantages and Disadvantages of Solar Energy and Wind-Power Utilization. World Futures 2011, 67, 395–408. [Google Scholar] [CrossRef]
- Tandel, R.; Shah, S.; Tripathi, S. A state-of-art review on Bladeless Wind Turbine. J. Phys. Conf. Ser. 2021, 1950, 012058. [Google Scholar] [CrossRef]
- Vallès, B.; Andersson, H.I.; Jenssen, C.B. Oblique Vortex Shedding Behind Tapered Cylinders. J. Fluids Struct. 2002, 16, 453–463. [Google Scholar] [CrossRef]
- Han, X.; Tang, Y.; Meng, Z.; Fu, F.; Qiu, A.; Gu, J.; Wu, J. Surface roughness effect on cylinder vortex-induced vibration at moderate Re regimes. Ocean Eng. 2021, 224, 108690. [Google Scholar] [CrossRef]
- Piccirillo, P.S.; Atta, C.W.V. An experimental study of vortex shedding behind linearly tapered cylinders at low Reynolds number. J. Fluid Mech. 1993, 246, 163–195. [Google Scholar] [CrossRef]
- Papangelou, A. Vortex shedding from slender cones at low Reynolds numbers. J. Fluid Mech. 1992, 242, 299–321. [Google Scholar] [CrossRef]
- Fang, S.; Du, H.; Yan, T.; Chen, K.; Li, Z.; Ma, X.; Lai, Z.; Zhou, S. Theoretical and experimental investigation on the advantages of auxetic nonlinear vortex-induced vibration energy harvesting. Appl. Energy 2024, 356, 122395. [Google Scholar] [CrossRef]
- Yáñez, D.J. VIV Resonant Wind Generators. June 2018. Available online: https://www.researchgate.net/profile/David-J-Yanez/publication/331345449_VIV_resonant_wind_generators/links/5c74f3c3299bf1268d25c051/VIV-resonant-wind-generators.pdf (accessed on 20 July 2023).
- Vortex Bladeless—Energía Eólica sin Palas. Vortex Bladeless Wind Power. Available online: https://vortexbladeless.com/es/ (accessed on 20 July 2023).
- Simiu, E.; Scanlan, R.H. Wind Effects on Structures: Fundamentals and Applications to Design, 3rd ed.; John Wiley: New York, NY, USA, 1996. [Google Scholar]
- Von Kármán, T. Ueber den Mechanismus des Widerstandes, den ein bewegter Körper in einer Flüssigkeit erfährt. Nachrichten Von Ges. Wiss. Zu Gött. Math.-Phys. Kl. 1911, 1911, 509–517. [Google Scholar]
- Bearman, P.W. Vortex Shedding from Oscillating Bluff Bodies. Annu. Rev. Fluid Mech. 1984, 16, 195–222. [Google Scholar] [CrossRef]
- Gerrard, J.H. The mechanics of the formation region of vortices behind bluff bodies. J. Fluid Mech. 1966, 25, 401–413. [Google Scholar] [CrossRef]
- Yuan, K.; Hui, Y.; Chen, Z. Effects of facade appurtenances on the local pressure of high-rise building. J. Wind Eng. Ind. Aerodyn. 2018, 178, 26–37. [Google Scholar] [CrossRef]
- Roshko, A. On the Drag and Shedding Frequency of Two-Dimensional Bluff Bodies; National Advisory Committee for Aeronautics: Kitty Hawk, NC, USA; Califormia Institute of Technology: Pasadena, CA, USA, 1954.
- Flow Induced Vibration by Robert D. Blevins-2nd Ed | PDF | Reynolds Number | Boundary Layer. Scribd. Available online: https://www.scribd.com/doc/42602999/Flow-Induced-Vibration-by-Robert-D-Blevins-2nd-Ed (accessed on 20 July 2023).
- Bourguet, R.; Karniadakis, G.E.; Triantafyllou, M.S. Lock-in of the vortex-induced vibrations of a long-tensioned beam in shear flow. J. Fluids Struct. 2011, 27, 838–847. [Google Scholar] [CrossRef]
- Hidalgo, M.Á.S.; Pascual, R.A.; VIllareal, D.Y. Diseño y optimizacion de una estructura geométrica cilindica para un desprendimiento uniforme de vortices de von karman. Tecnol. Desarro. 2017, 15. Available online: https://revistas.uax.es/index.php/tec_des/article/view/1181 (accessed on 20 July 2023).
- Zhang, L.; Dai, H.; Abdelkefi, A.; Wang, L. Improving the performance of aeroelastic energy harvesters by an interference cylinder. Appl. Phys. Lett. 2017, 111, 073904. [Google Scholar] [CrossRef]
- Velasco, M.A.; Quevedo, Y.N.; Bonilla, C.A. Determinación de Propiedades Mecánicas a Tensión y Compresión de PETG Procesado Mediante Fabricación Por Filamento Fundido. 2022. Available online: https://somim.org.mx/memorias/memorias2022/articulos/A2_179.pdf (accessed on 8 June 2023).
- Zalazar, M.A.; Guarnieri, F.A. Análisis y Evaluación del Comportamiento de Sensores Piezoeléctricos. Mecánica Comput. 2010, 29, 67. [Google Scholar]
- OWON SDS1000 Series Super Economical Type Digital Oscilloscope Technical spec.s.pdf. Available online: https://files.owon.com.cn/specifications/OWON%20SDS1000%20Series%20Super%20Economical%20Type%20Digital%20Oscilloscope%20technical%20spec.s.pdf (accessed on 18 January 2023).
- Pastò, S. Vortex-induced vibrations of a circular cylinder in laminar and turbulent flows. J. Fluids Struct. 2008, 24, 977–993. [Google Scholar] [CrossRef]
- 0allge.pdf. Available online: https://www.ahlborn.com/download/pdfs/kap01/eng/0allge.pdf (accessed on 19 January 2023).
- Brown, C.E. Coefficient of Variation. In Applied Multivariate Statistics in Geohydrology and Related Sciences; Brown, C.E., Ed.; Springer: Berlin/Heidelberg, Germany, 1998; pp. 155–157. [Google Scholar] [CrossRef]
- Bardakjian, A.; Mandadakis, P.; Tingle, A. Efficiency comparison of horizontal axis wind turbines and bladeless turbines. PAM Rev. Energy Sci. Technol. 2017, 4, 59. [Google Scholar] [CrossRef]
| Disclaimer/Publisher’s Note: The statements, opinions and data contained in all publications are solely those of the individual author(s) and contributor(s) and not of MDPI and/or the editor(s). MDPI and/or the editor(s) disclaim responsibility for any injury to people or property resulting from any ideas, methods, instructions or products referred to in the content. |
© 2024 by the authors. Licensee MDPI, Basel, Switzerland. This article is an open access article distributed under the terms and conditions of the Creative Commons Attribution (CC BY) license (https://creativecommons.org/licenses/by/4.0/).


