1. Introduction
Among different bridge typologies, steel truss bridges are widely diffused because of intrinsic steel properties as well as time- and cost-savings during the construction process [
1]. It is widely acknowledged among practitioners and academicians that steel structures allow people to design slender structures resulting in low structural weight and economic cost [
2].
Aiming to exploit the performance of both steel and concrete, the use of composite joints in steel truss bridges has emerged, which may show some advantages over conventional practices [
3]. In particular, this specific bridge typology is composed of a steel truss system whose elements are connected by composite steel-concrete joints aiming to enhance fatigue strength during the cyclic loads caused by traffic [
4] as an efficient solution to cover large spans and preserve low structural complexity during the assembly and erection stage.
In this way, the resulting structure presents an improved structural behavior while maintaining the advantages of a steel bridge [
5].
Currently, many countries in Europe have bridges with a lifespan of more than 50 years, and the connections of these structures are usually one of the most critical aspects due to fatigue phenomena caused by excessive cyclic loads or changes in the vehicle’s weight [
6,
7,
8,
9]. In such cases, the proposed retrofitting approach of connections can be very useful in improving the overall strength of the existing bridges [
10]. Specifically, the method consists of encasing the steel connections of the steel truss structure with concrete. In this way, the interaction between concrete and steel leads to a new behavior and can guarantee the required safety level for variable traffic loads. The implementation process of the strengthening of the connection starts with the preliminary design of the joints, followed by the concrete mix design, and finally molding and injecting the concrete into the connections [
11].
The efficiency of the retrofitting approach has been demonstrated by Liu et al. [
12] and Xue et al. [
13] adopting the Deshenglu Bridge (China) as case study for the researches. A sample of the composite connection type of the bridge was reproduced in the laboratory and fatigue tests were performed aiming to detect the level of damage under cyclic loads. Moreover, analytical and numerical models were developed by the authors showing good accordance with the experimental results. Other experiments, conducted on composite tubular K-joints of steel bridges, confirmed the beneficial effect of concrete encasing to preserve steel connections under fatigue phenomena [
14].
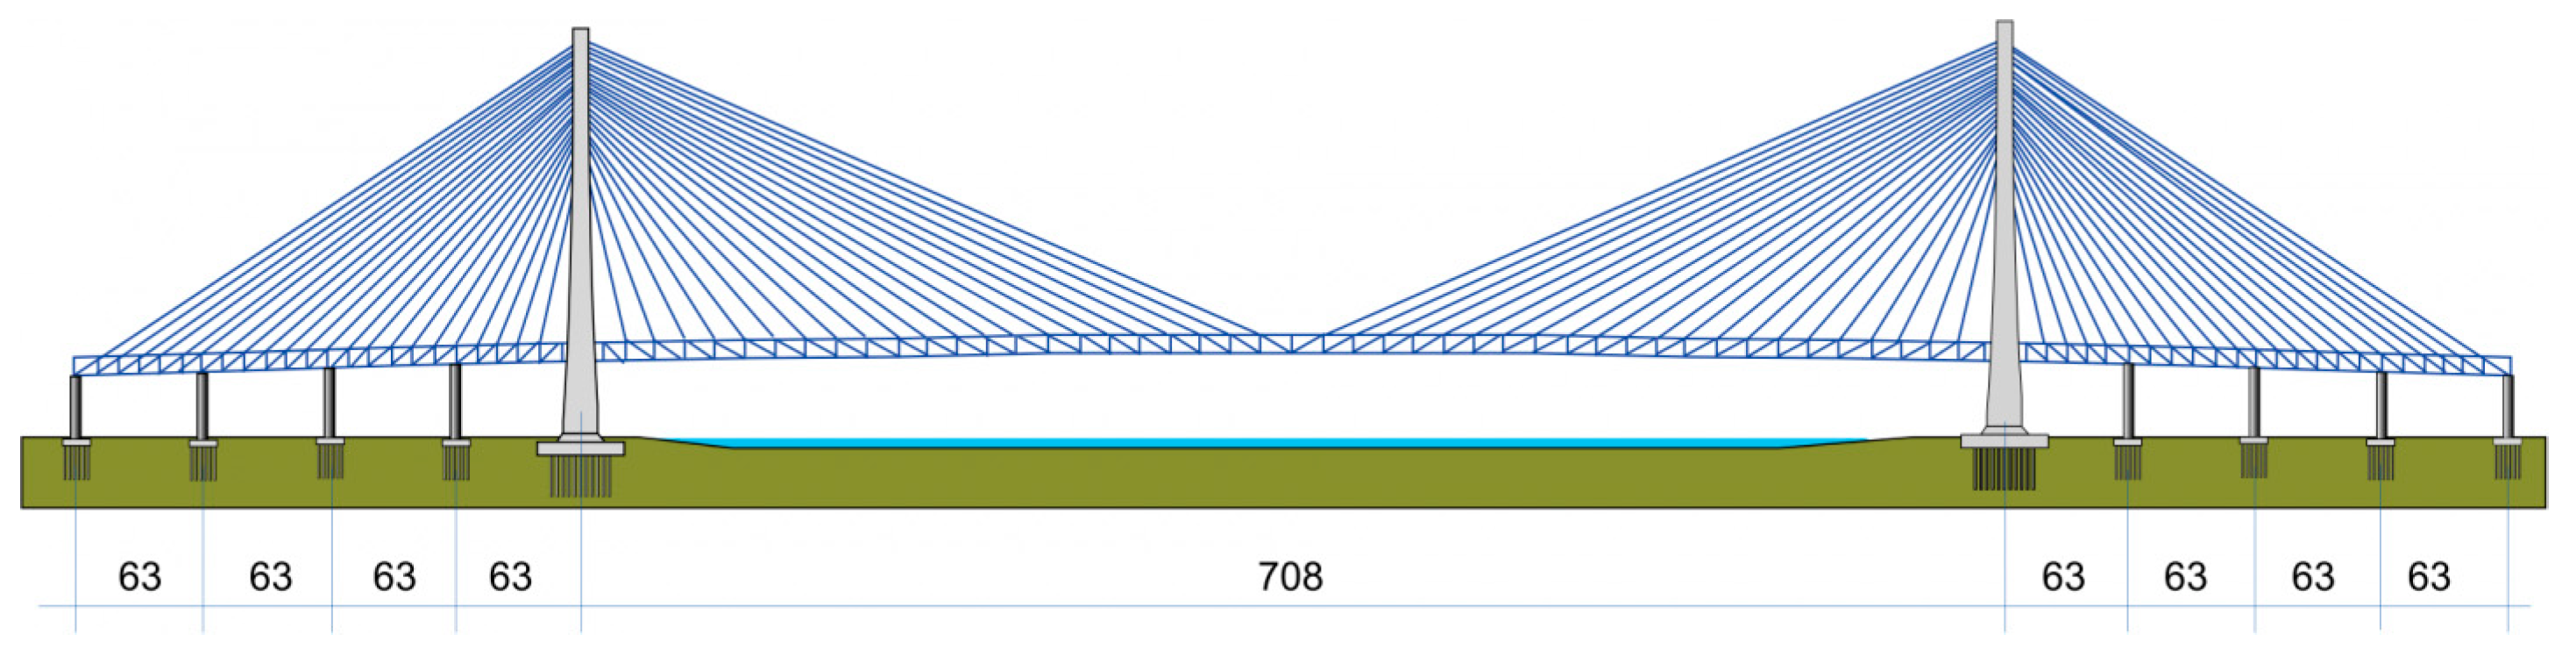
One of the most famous real-scale applications of this strengthening approach can be observed on the Minpu Bridge in Shanghai (China). It is a road and railway steel cable-stayed bridge with a total length of almost 1208 m and a main span of 708 m [
15]. It is realized with a truss steel deck and stiffened by concrete joints [
16,
17].
Laboratory simulations and an experimental campaign conducted by other authors will be discussed in the following to better understand the global behavior of the joint and the role played by concrete encasing.
A new methodology that emerged in the last few years is the use of post-tensioned metal straps (PTMSs) [
18,
19]. This practice consists of placing steel belts/straps around the concrete and prestressing them with an initial tensile force [
20]. This approach has been widely adopted for civil buildings where the performance of the post-tensioned metal strips was first investigated [
21,
22]. The optimal placement and the areas to be retrofitted by adopting this approach can be detected through numerical and finite element analyses as well as laboratory tests [
23]. Several authors focused on investigating the mechanical performance of this specific retrofitting system.
Frangou et al. [
24] took the first steps in introducing prestressed steel belts. Through laboratory tests performed on damaged concrete samples, the benefits of adopting this retrofitting approach were assessed. Specifically, it was proven that the post-tensioning features of these elements can play a decisive role in increasing the bending and shear capacity of concrete beams and columns. Additionally, experimental outcomes reveal that this approach allows the satisfaction of the confinement requirements provided by the Eurocode 8 [
25].
In 2010, Garcia et al. [
22] examined some specimens under compressive load where PTMSs were installed in both active and passive ways. By comparing the results obtained from the experiments and strain-stress diagrams, the active installation exhibited a higher capacity than the passive one.
In 2012, Garcia et al. [
23] investigated a two-story concrete building under different seismic accelerations (i.e., from 0.05 g to 0.35 g) by simulating the effect of the earthquake by means of a shaking table. Strain-gauges were adopted to measure the strain of specific target points until failure.
In this study, PTMSs are selected as a strengthening system for concrete joints and their effect and performance are assessed by varying geometric and mechanical parameters. Despite the fact that the well-known structural efficiency of these retrofitting approaches is clearly acknowledged in the scientific community, few authors focused on the identification of the optimal parameter that controls the final performance of both approaches. Additionally, the real novelty of the current research resides in the characterization of a retrofitting system in which both approaches are considered simultaneously.
In this article, the behavior of the composite joints has been deeply investigated through the creation of a model in ABAQUS (rel. 2022.0) and validated by comparison with experimental tests. A first preliminary sensitivity analysis has been conducted, aiming to verify the correct sizing of the concrete joint and the dependency of the global behavior with respect to concrete class. In the second stage, post-tensioned metal straps have been added to evaluate eventual benefits and identify changes in the global behavior of the joint. The reliability of the results has been validated towards comparison with well-known refined models pointed out by other authors.
The paper’s structure unfolds as follows. It starts with a brief introduction outlining the specific joint typology addressed in this study. Additionally, details of the case study are introduced. Subsequently, a comprehensive state-of-the-art composite bridge, in which concrete joints are adopted as retrofitting solutions, is described. Then, the methodology adopted for the modelling phase and the results obtained by the sensitivity analysis are presented. Finally, an overview of the results obtained is pointed out and final outcomes and future developments of the research are discussed.
2. Background of the Research and Case Study
In this section, the authors focused on identifying previous research conducted on the Minpu bridge in China, where the role of the composite connection has been investigated. Specifically, proper numerical models and experimental data have been collected in order to compare the modeling strategy and validate the numerical results of the authors.
The Minpu bridge in China can be acknowledged as the first practical example of a large-span bridge with composite connections. This bridge has eight spans of 63 m each, with a main span of 708 m and a total length of 1212 m. For clarity purposes, the side view of the bridge is reported in
Figure 1.
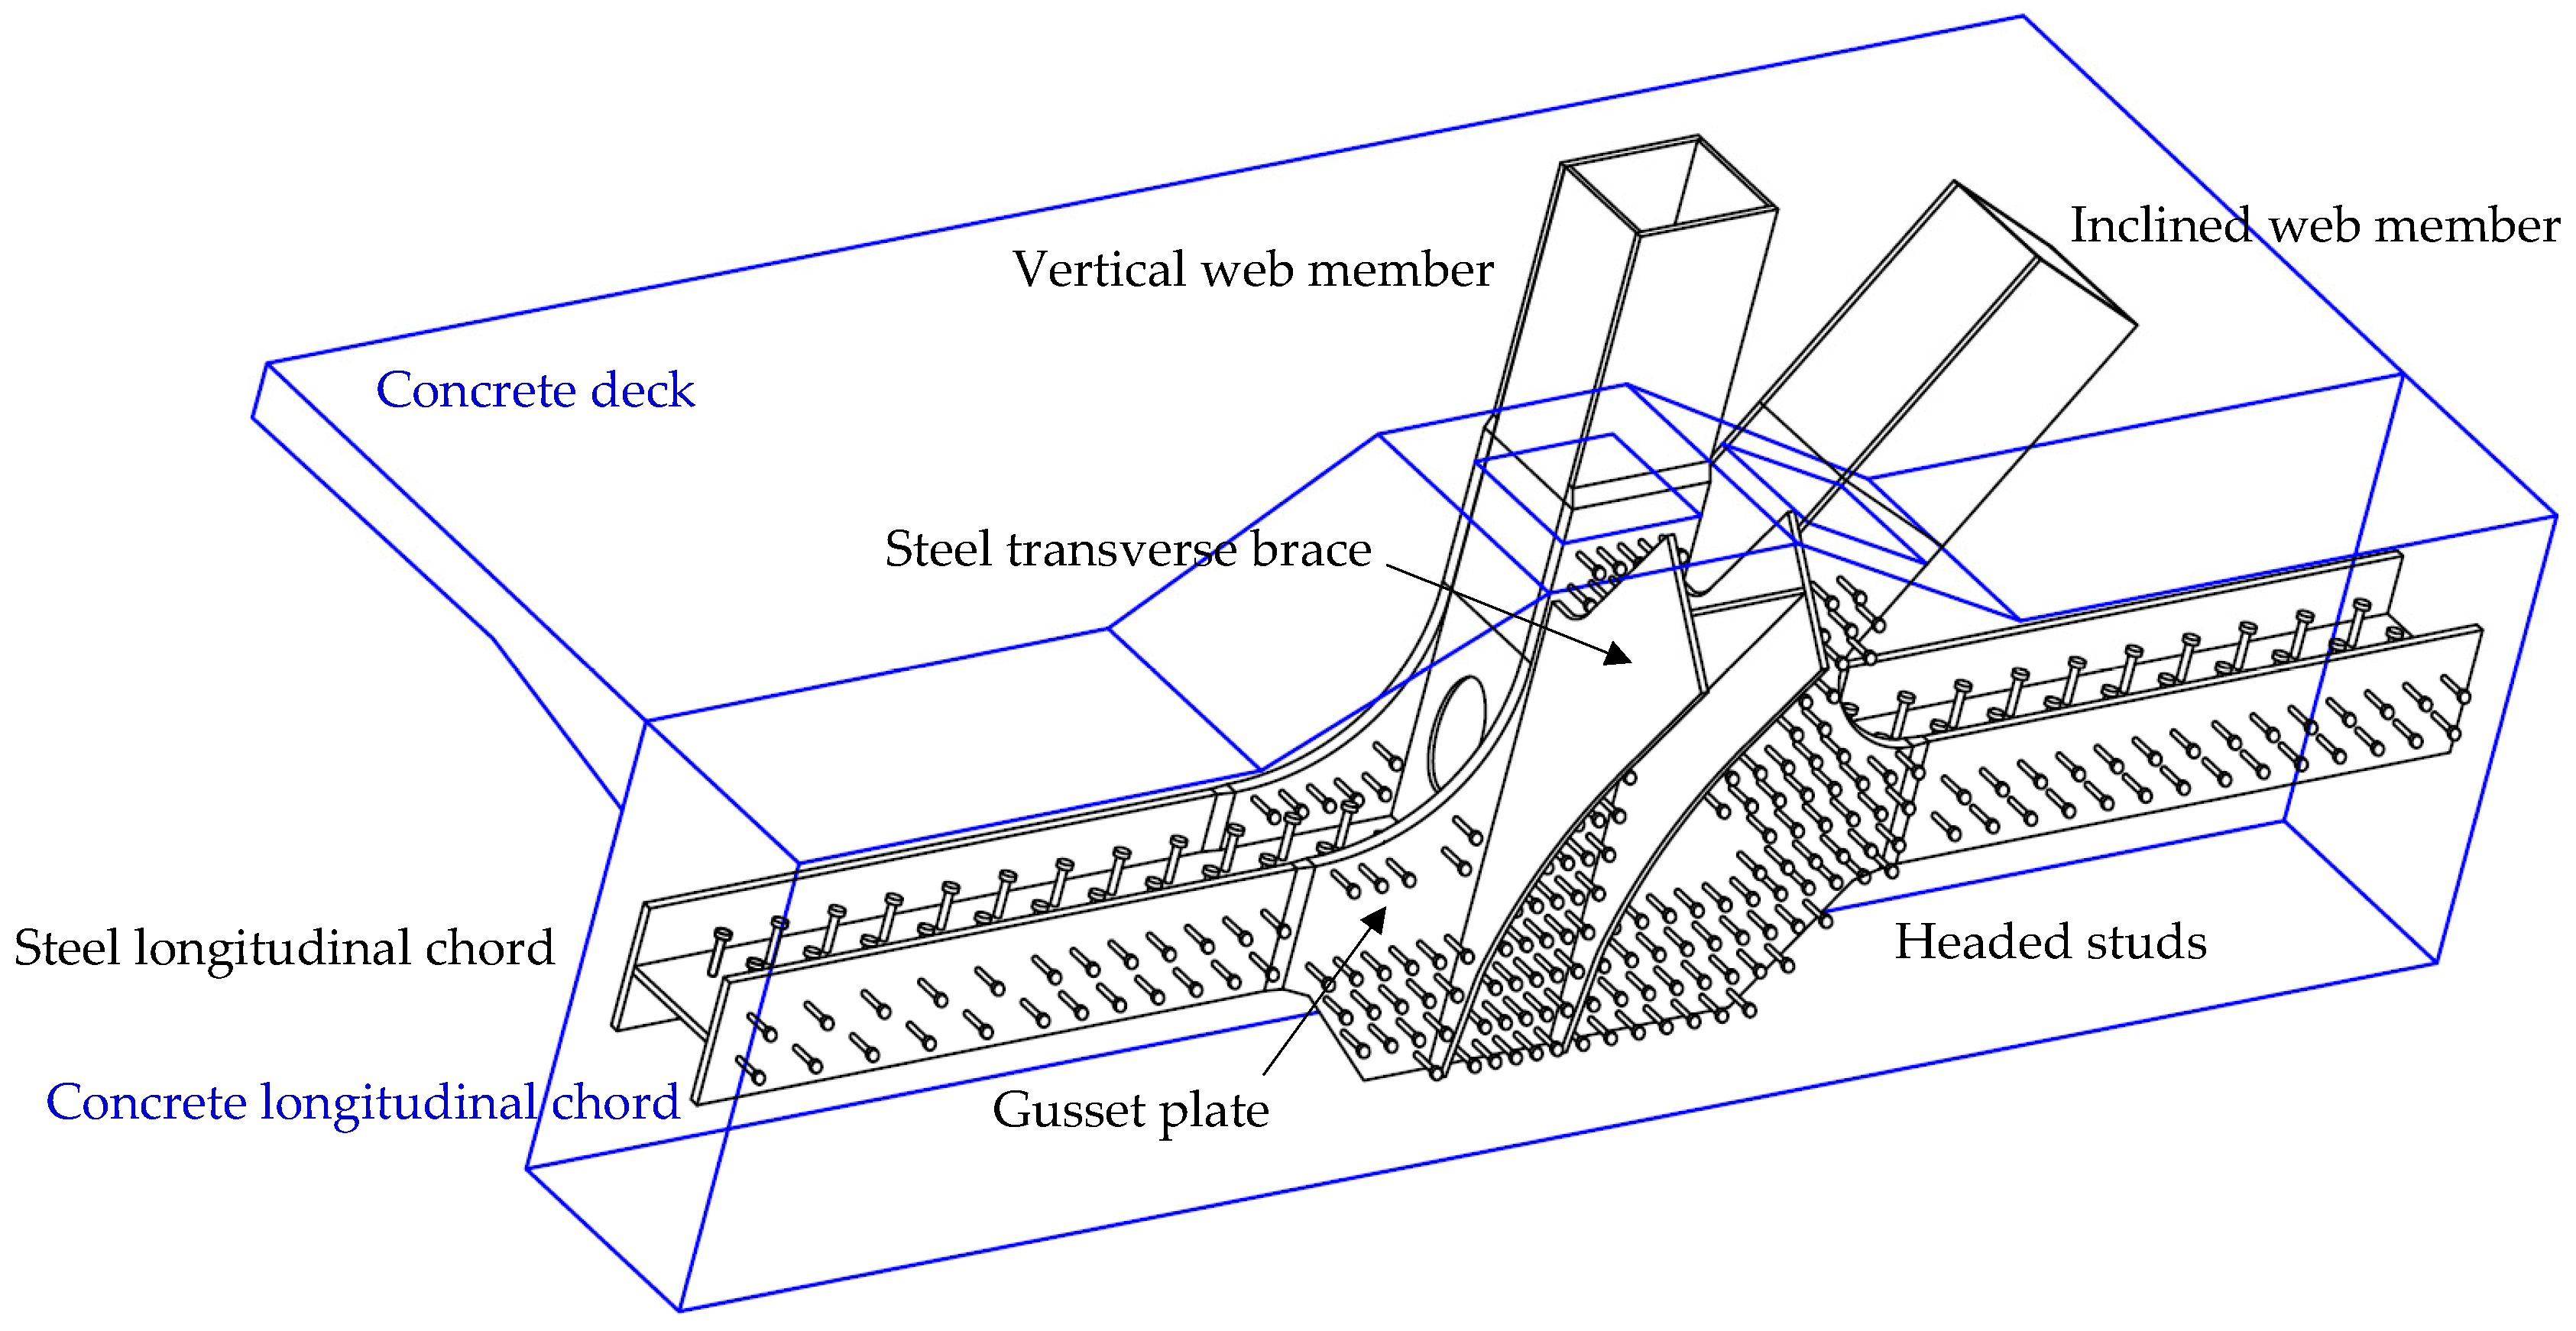
Xue et al. [
13] identified the most stressed joint of the bridge (shown in
Figure 2) by means of numerical analyses and reproduced it in a laboratory to perform load tests.
The joint was tested by Xue in the laboratory under the load condition shown in
Figure 3. Force cells were positioned at the interfaces between the joint and the different members arriving in the connection. The structure was loaded up to 1.7 times the design loads, the forces were applied by hydraulic jacks using 17 steps with a load step increment of 10%. Each load step took 5 min and the load was maintained constantly for 10 min before proceeding with the next step. The maximum loads reached during the laboratory test are pictured in
Figure 3.
In 2010, the experimental results pointed out in [
13] were used by the same authors for the realization of a finite element model of the same composite joint (using ANSYS). Even if the model faithfully reproduced the geometry of the connection, the effects of cracks in concrete were not considered during the analysis. The strains and stresses obtained from the F.E. software were compared with the results obtained from the laboratory tests to validate the accuracy and reliability of the model.
3. Model Definition and Methodology
In this section, the modelling strategy adopted for the realization of the F.E. model as well as the material properties and geometric features of the composite connection are described.
The composite joint is modeled considering the behavior of the different materials using the finite element software ABAQUS (rel. 2022.0). The model is built aiming to replicate the connection tested in the laboratory by Xue et al. [
13] in order to validate the reliability of numerical results.
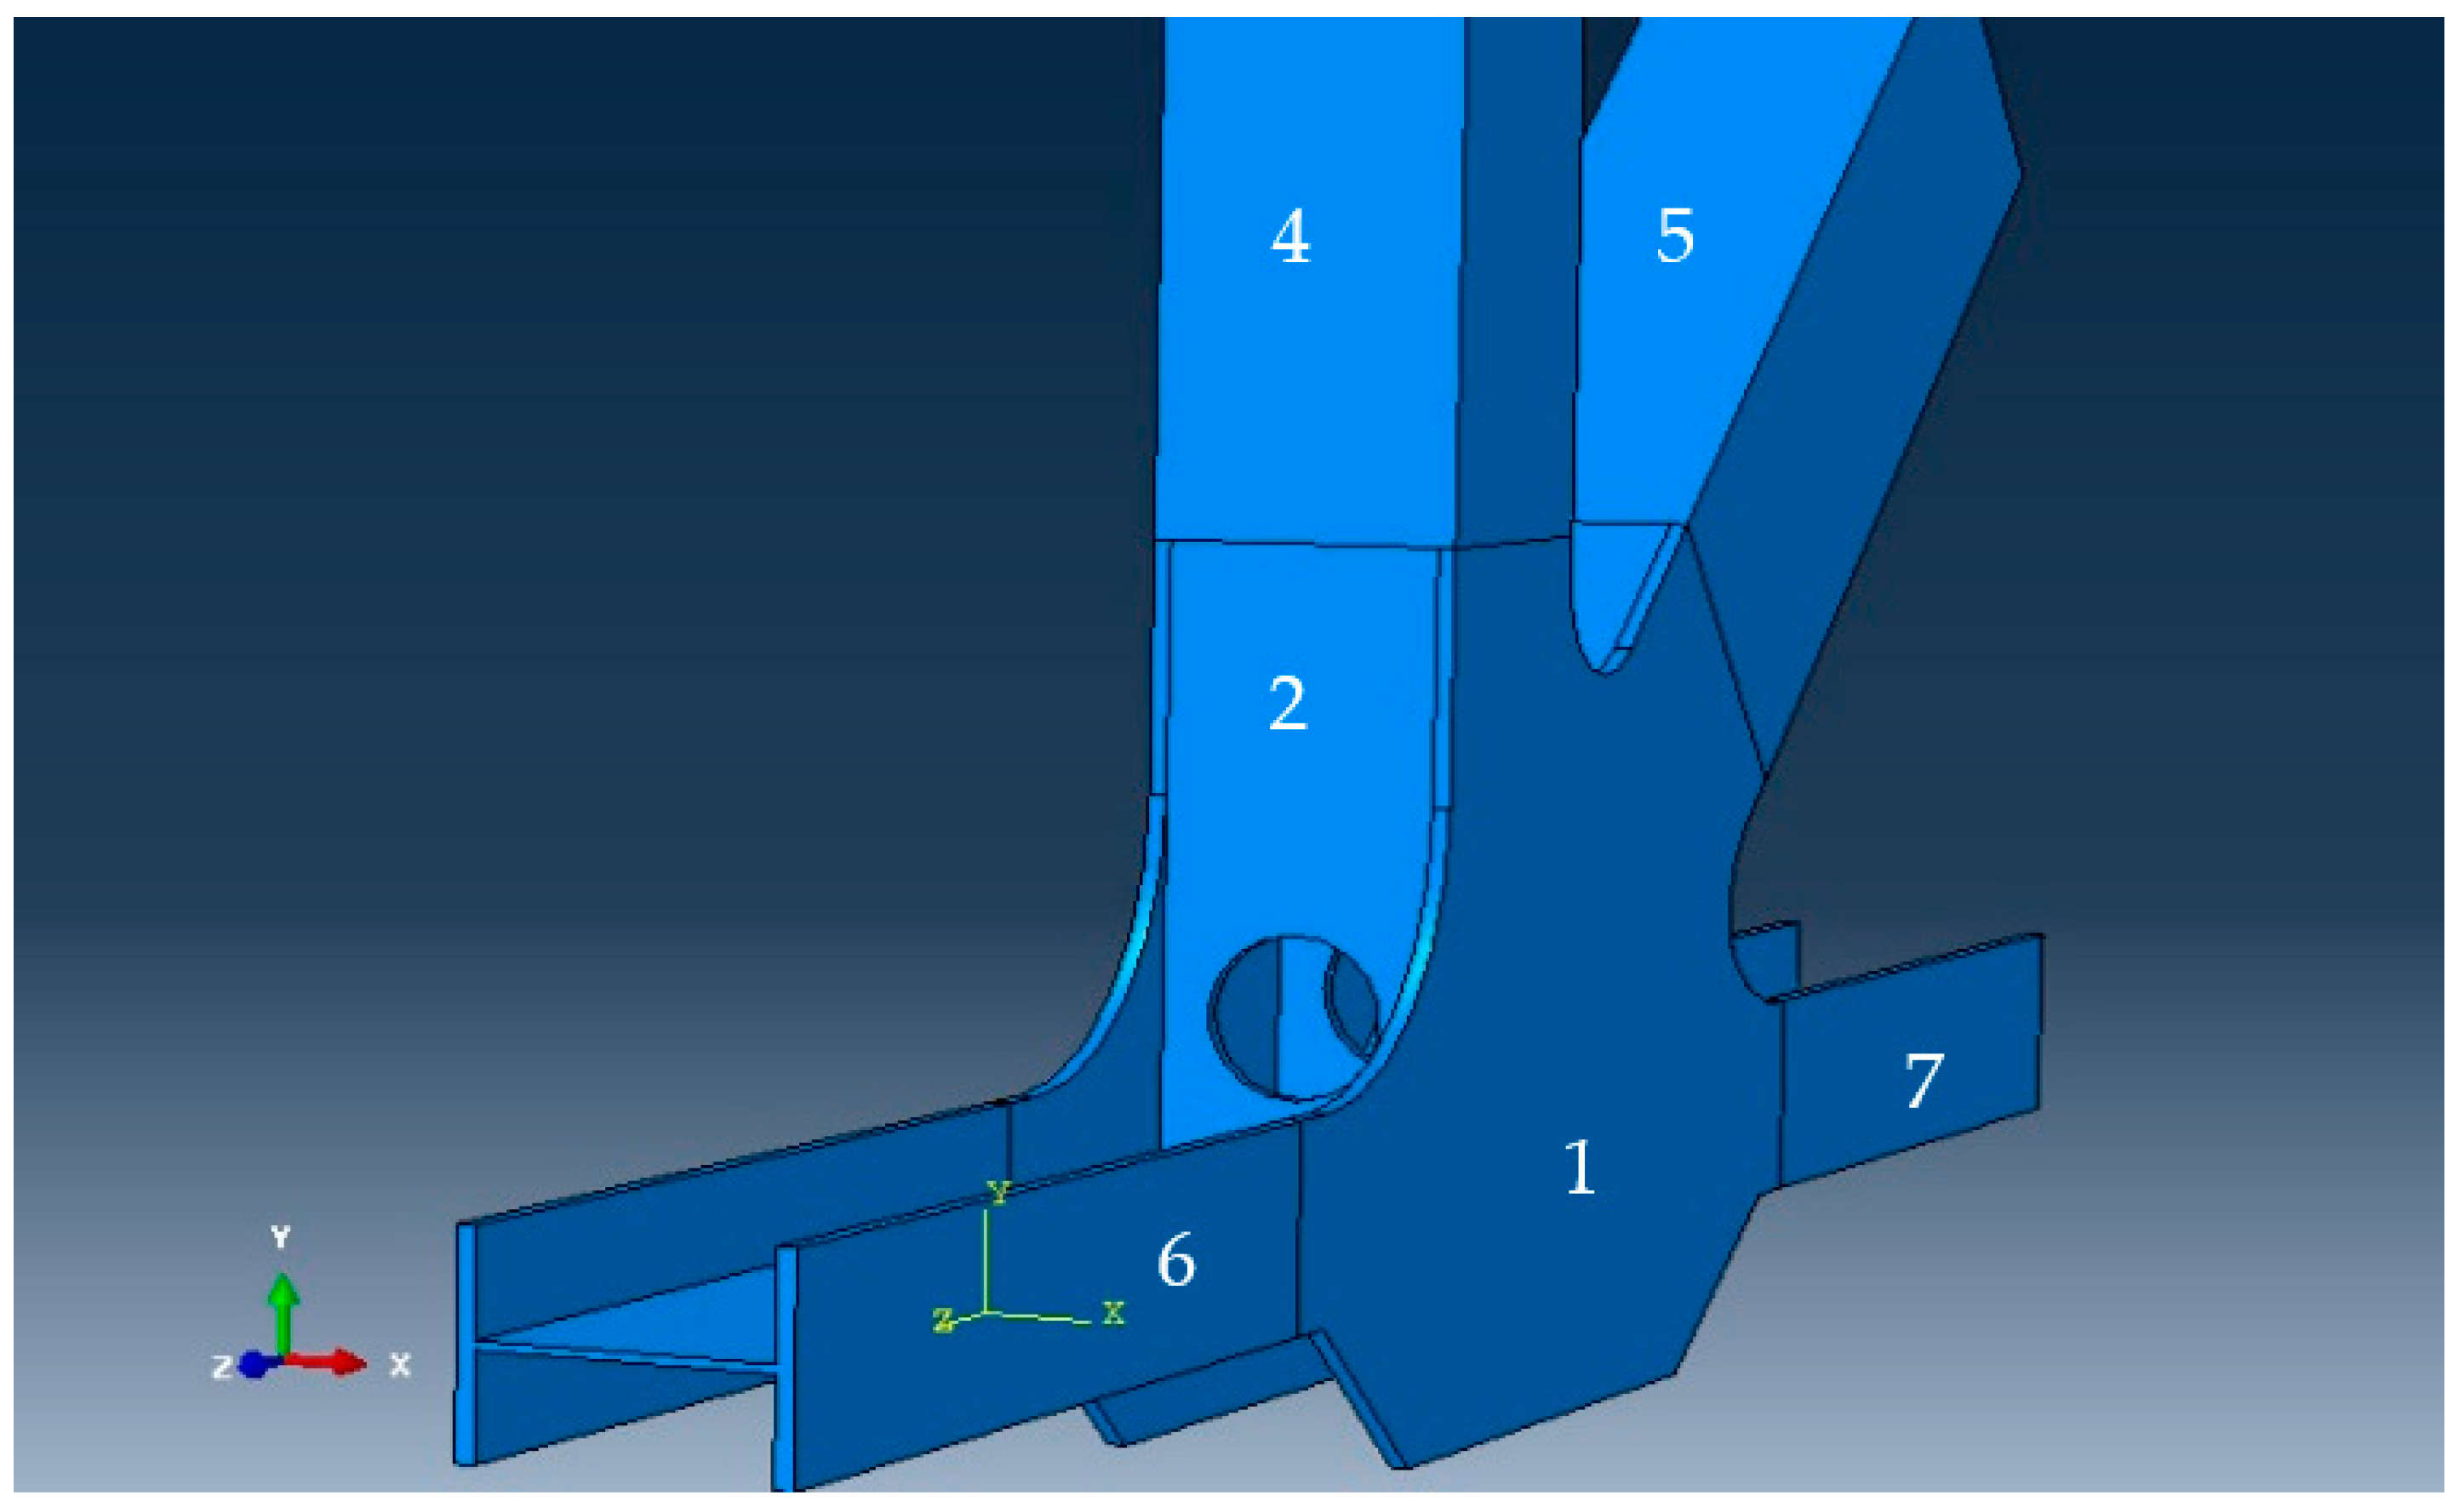
Figure 4 shows the steel plates of the joint. Information regarding the geometry of each member composing the entire connection as well as material properties are obtained from the original technical drawings and are reported in
Table 1.
According to the data provided by laboratory tests done by Xue et al., the authors chose C50 concrete class and ST52 steel. In
Table 2 and
Table 3, the characteristics of concrete and steel assumed as input of the software model have been reported, respectively.
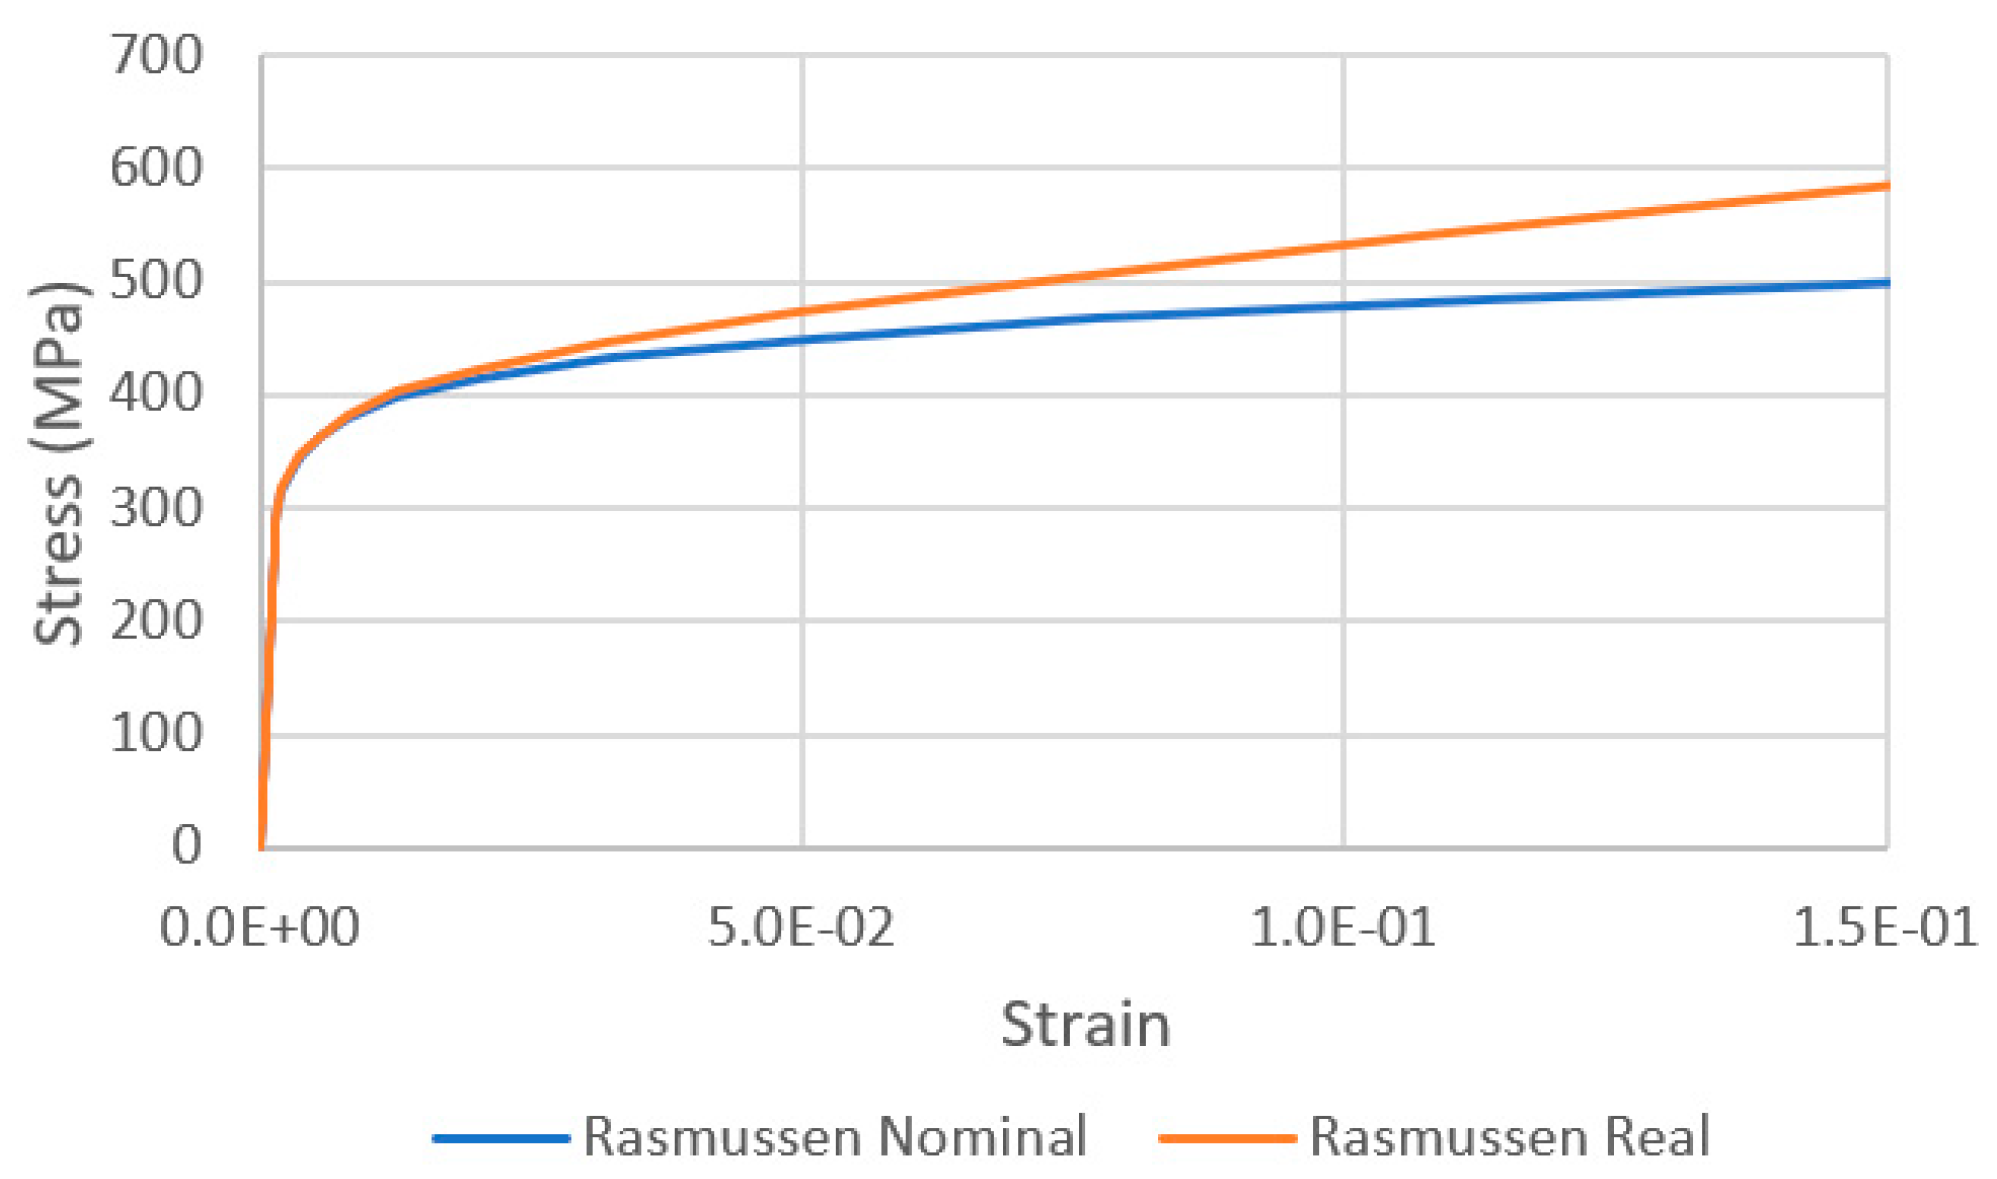
Well-known constitutive laws, widely adopted in the literature, are employed for the characterization of the nonlinear behavior of the materials. The modified version of the Ramberg-Osgood relationship [
26] is used for steel (see
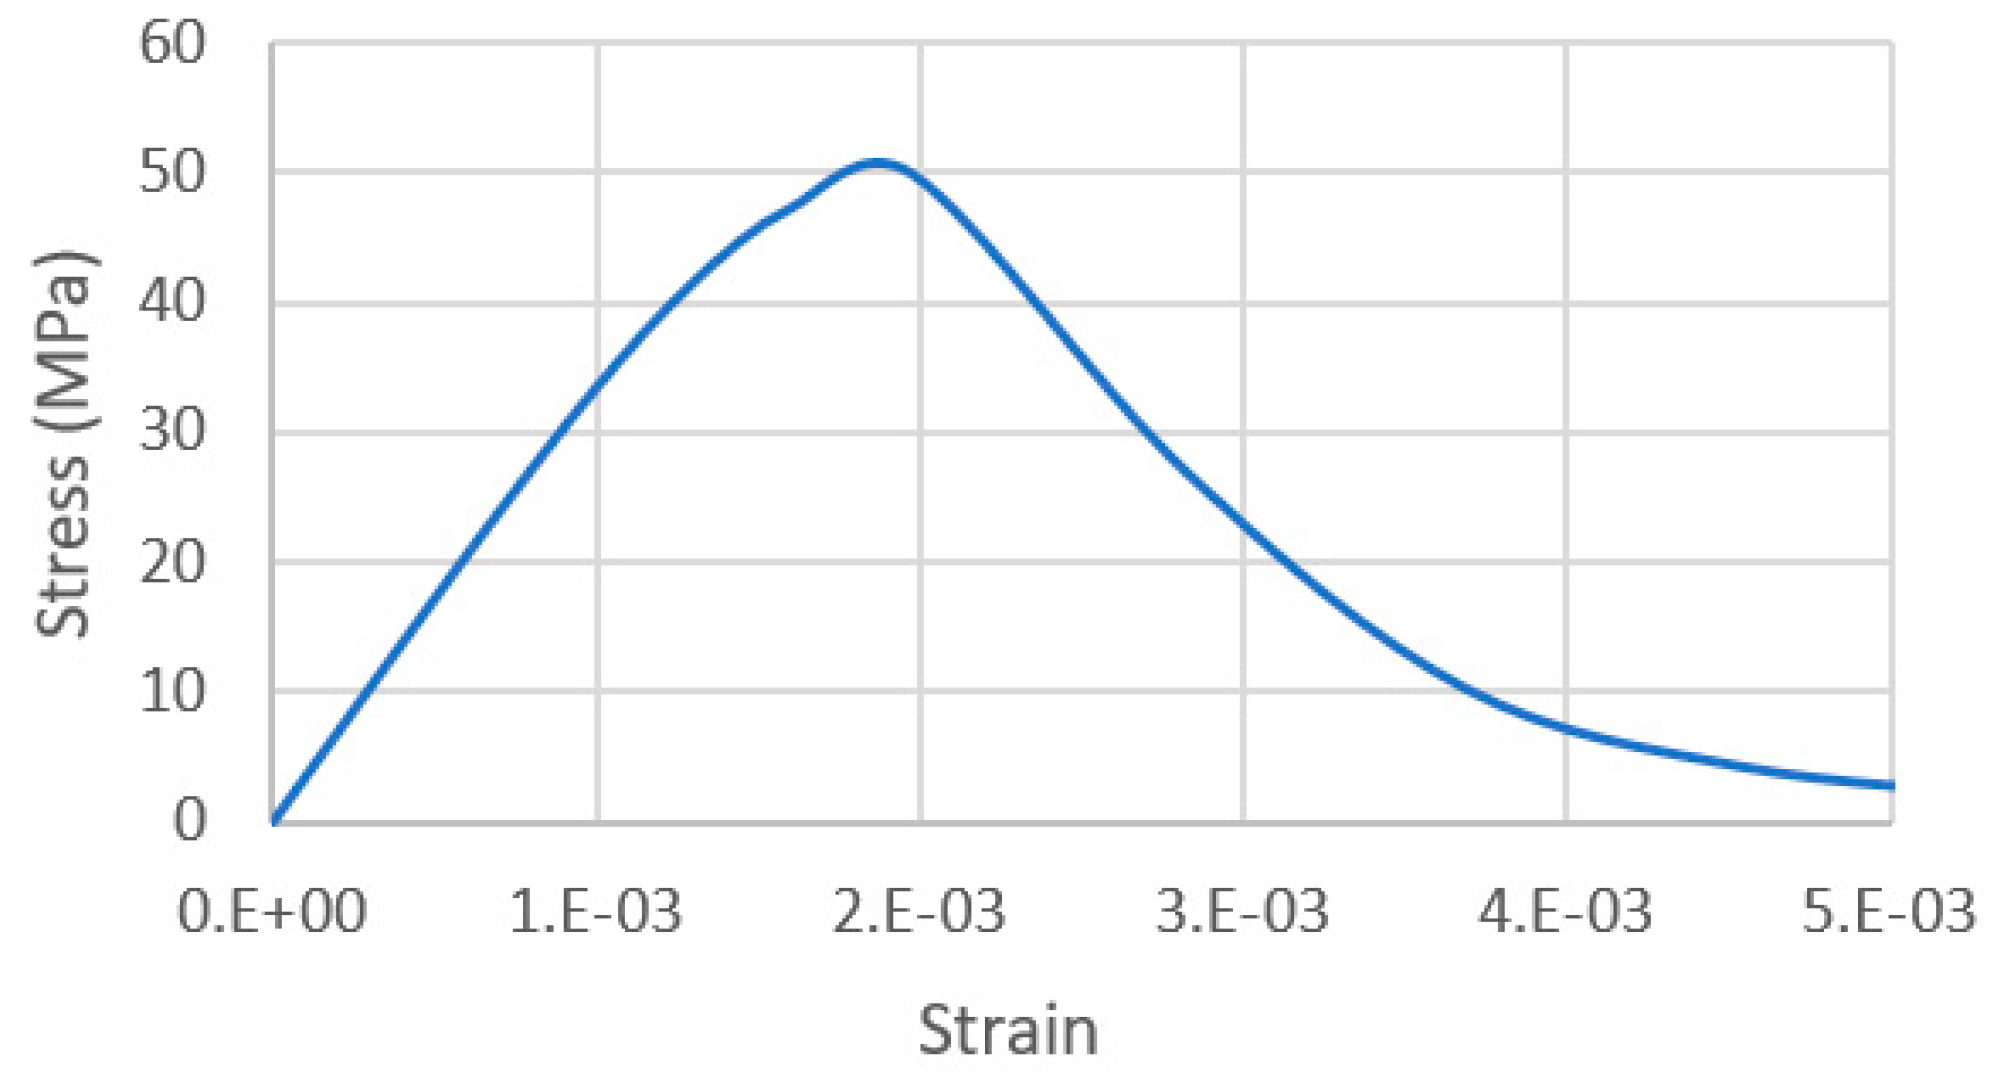
Figure 5). The modified version of the Popovics relationship [
27] is used for the compressive behavior of the concrete (see
Figure 6) and the Belarbi-Hsu relationship [
28] is implemented to reproduce the tensile behavior.
According to the loading process performed during the laboratory tests, the incremental analysis has been subdivided into 17 steps by assigning 10% of the final design force at each step. The final forces applied to the joint (equal to 1.7 times the design load) are pictured in
Figure 3.
The concentrated loads applied by the jacks in the laboratory test, shown in
Figure 3, have been converted into uniform pressures on the cross-section areas of each steel member.
A ‘buried constraint’ is selected to simulate the interaction between the steel surface and the concrete surrounding it. Only the surfaces of the steel members that are embedded within concrete are considered connected to concrete, while the vertical and diagonal elements of the truss system outside the concrete chord are considered free and independent.
The type of contact between the two materials is defined by means of friction interaction surfaces with a friction coefficient of 0.5 and a cohesion of 0.25 f
ct as prescribed by EN1992-1-1 [
29] in clause 6.2.5.
Shear headed stud connectors are 13 × 80 mm and are realized with steel with a yielding strength of 385 MPa and an ultimate strength of 490 MPa. Their shear resistance is calculated according to clause 6.6.3.1 of EN 1994-1-1 [
30] and is equal to 52 kN per stud.
They are considered linear elastic spring elements as they do not reach plasticity for the loads applied in the test. Their stiffness is calculated by means of the method proposed in Annex A3 and Annex B of EN1994-1-1 [
30] and is equal to 47 kN/mm.
A four-node squared mesh is created with a mesh size defined, aiming to make feasible and reliable the comparisons between the reference points of the numerical model and the measurement derived from the experimental tests.
Static nonlinear analyses were performed on the model and the results were compared with the results of the laboratory tests performed by Xue et al. [
13]. The numerical strains and stresses obtained by the model have been compared to the target points where information was available from the laboratory sample, hence in coincidence with the gauges’ positions shown in
Figure 7. Such correspondence is highlighted in
Figure 8.
4. Model Validation
In this section, the numerical results are presented and the accuracy of the F.E. model is be discussed. The stresses in concrete and steel at the final load step are pictured in
Figure 8: (a) shows the maximum tensile principal stress (σ
11) in concrete, whereas (b) shows the minimum compressive principal stress (σ
33) in concrete, (c) shows maximum tensile principal stress (σ
11) in steel and (d) shows the minimum compressive principal stress (σ
33) in concrete.
The comparison between numerical output and the stresses measured in the laboratory is drawn in correspondence with the position of the strain gauges placed in the specimen.
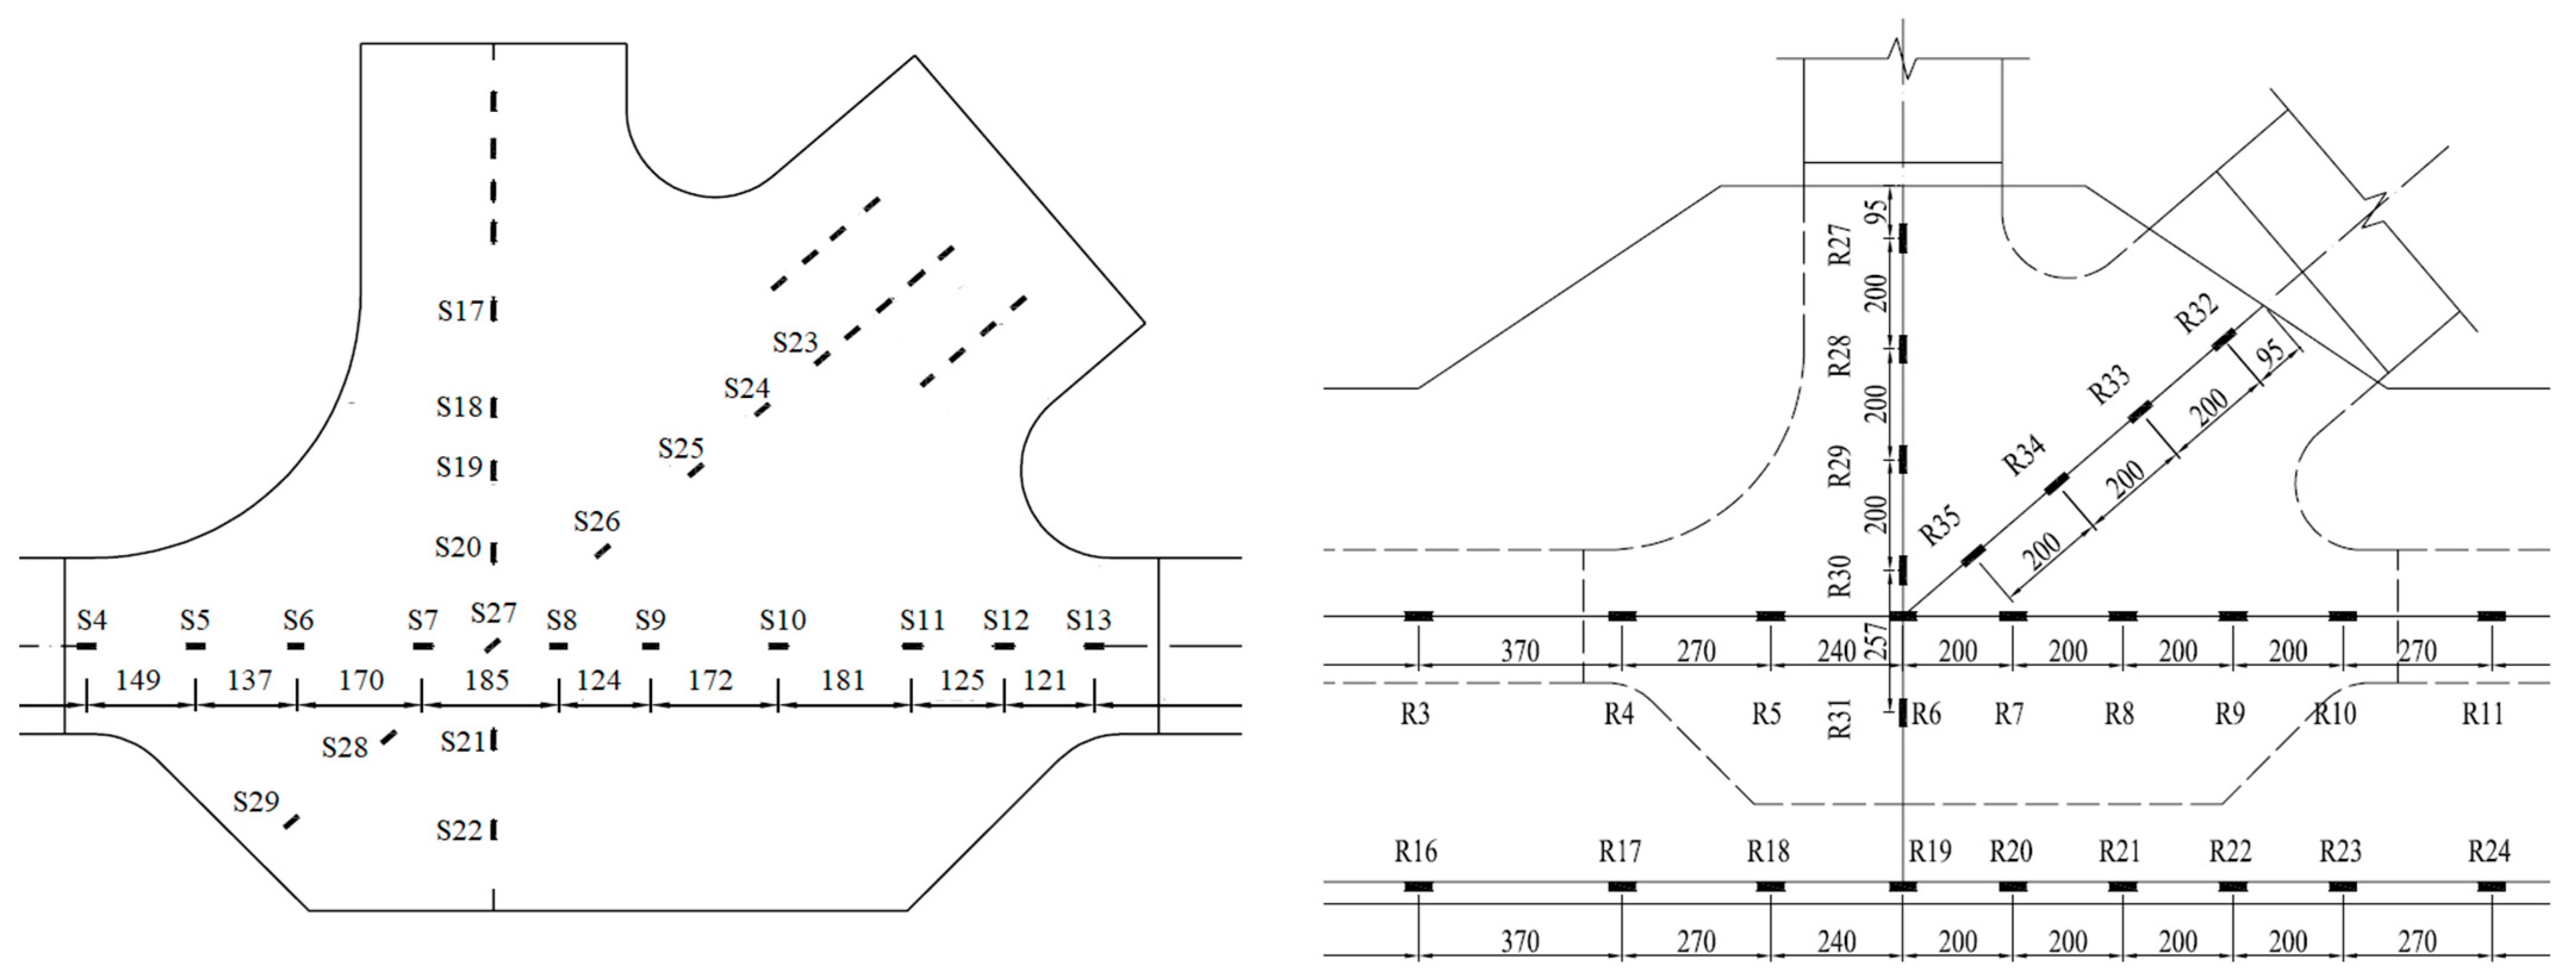
As shown in
Figure 7, strain gauges from S4 to S13 are placed on steel plates along the axis of the longitudinal element, whereas gauges from S23 to S29 are placed along the diagonal member’s axis.
Figure 7.
Strain gauges’ positions on steel surfaces (S) and concrete reinforcement bars (R).
Figure 7.
Strain gauges’ positions on steel surfaces (S) and concrete reinforcement bars (R).
Figure 8.
Results of numerical simulation of laboratory test in term of stresses [kN/m2].
Figure 8.
Results of numerical simulation of laboratory test in term of stresses [kN/m2].
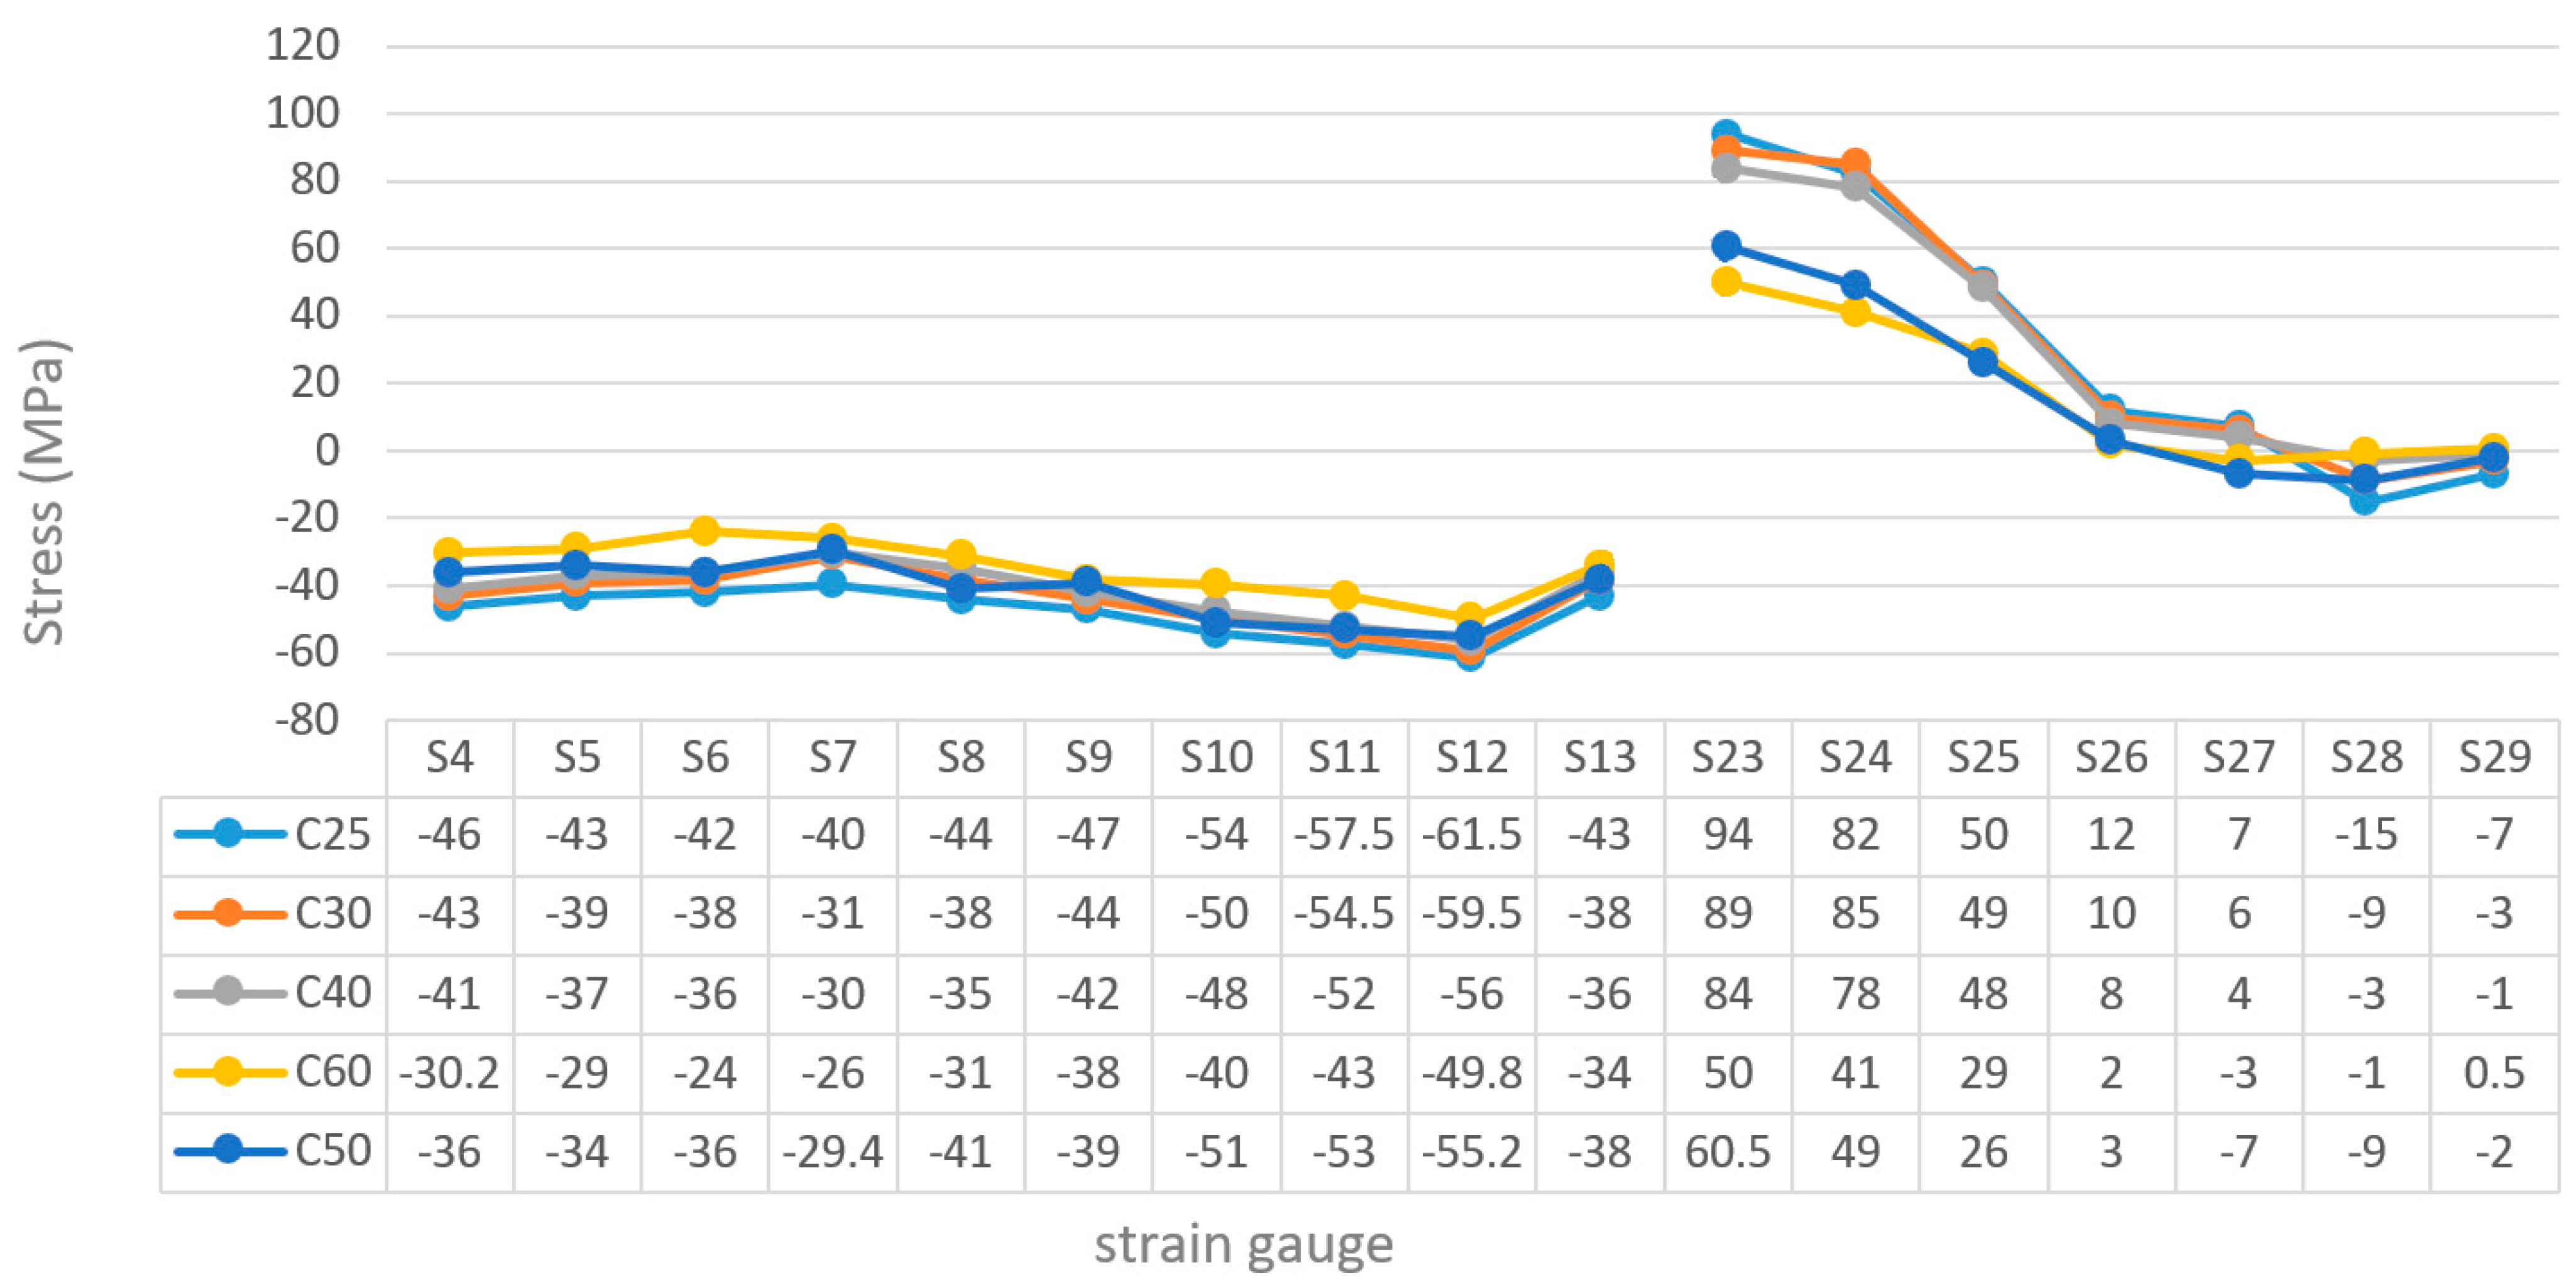
Horizontal gauges are compressed with stresses ranging between 30 and 55 MPa, whereas diagonal ones are tensed in the upper part (S23 to S26) and almost unloaded in the lower part (S27 to S29) as shown in
Table 4.
The same process is repeated to determine the stress state within the concrete encasing the steel plates. Nine strain gauges (from R3 to R11, see
Figure 7) placed on horizontal rebars within concrete are considered for the comparison in this study.
The resulting stresses from the laboratory tests, Xue’s ANSYS model and the ABAQUS model developed by the authors are presented in
Table 4 and
Table 5 for steel and concrete rebars of the composite joint, respectively.
A good level of match between the experimental results and the adopted numerical model as well as fair agreement with the numerical results obtained in [
13] can be appreciated from the comparison; nevertheless, the better performance of the ABAQUS model is clear.
For the steel plates, which are subjected to stresses ranging from 0 to 60 MPa, the average difference between the laboratory results and the finite element models drops from 6.8 MPa (Xue data) to 2.6 MPa in the present research. For concrete rebars, which are subjected to stresses ranging from −6 to −11 MPa, the average difference between the laboratory results and the finite element models drops from 1.2 MPa (Xue data) to 0.6 MPa in the present research.
In conclusion, given that the behavior and the numerical results of the built model are in good agreement with the results obtained from the previous research, it can be affirmed that the 3D finite elements model proposed by the authors is validated and can be adopted for further investigations.
5. Sensitivity Analysis: The Influence of the Concrete Grade
Grounded on the validated numerical model, a sensitivity analysis has been performed to analyze the structural response for different concrete classes.
The optimization of the studs’ layout and the pre-tensioning force in the PTMSs can also be objects of further sensitivity investigation.
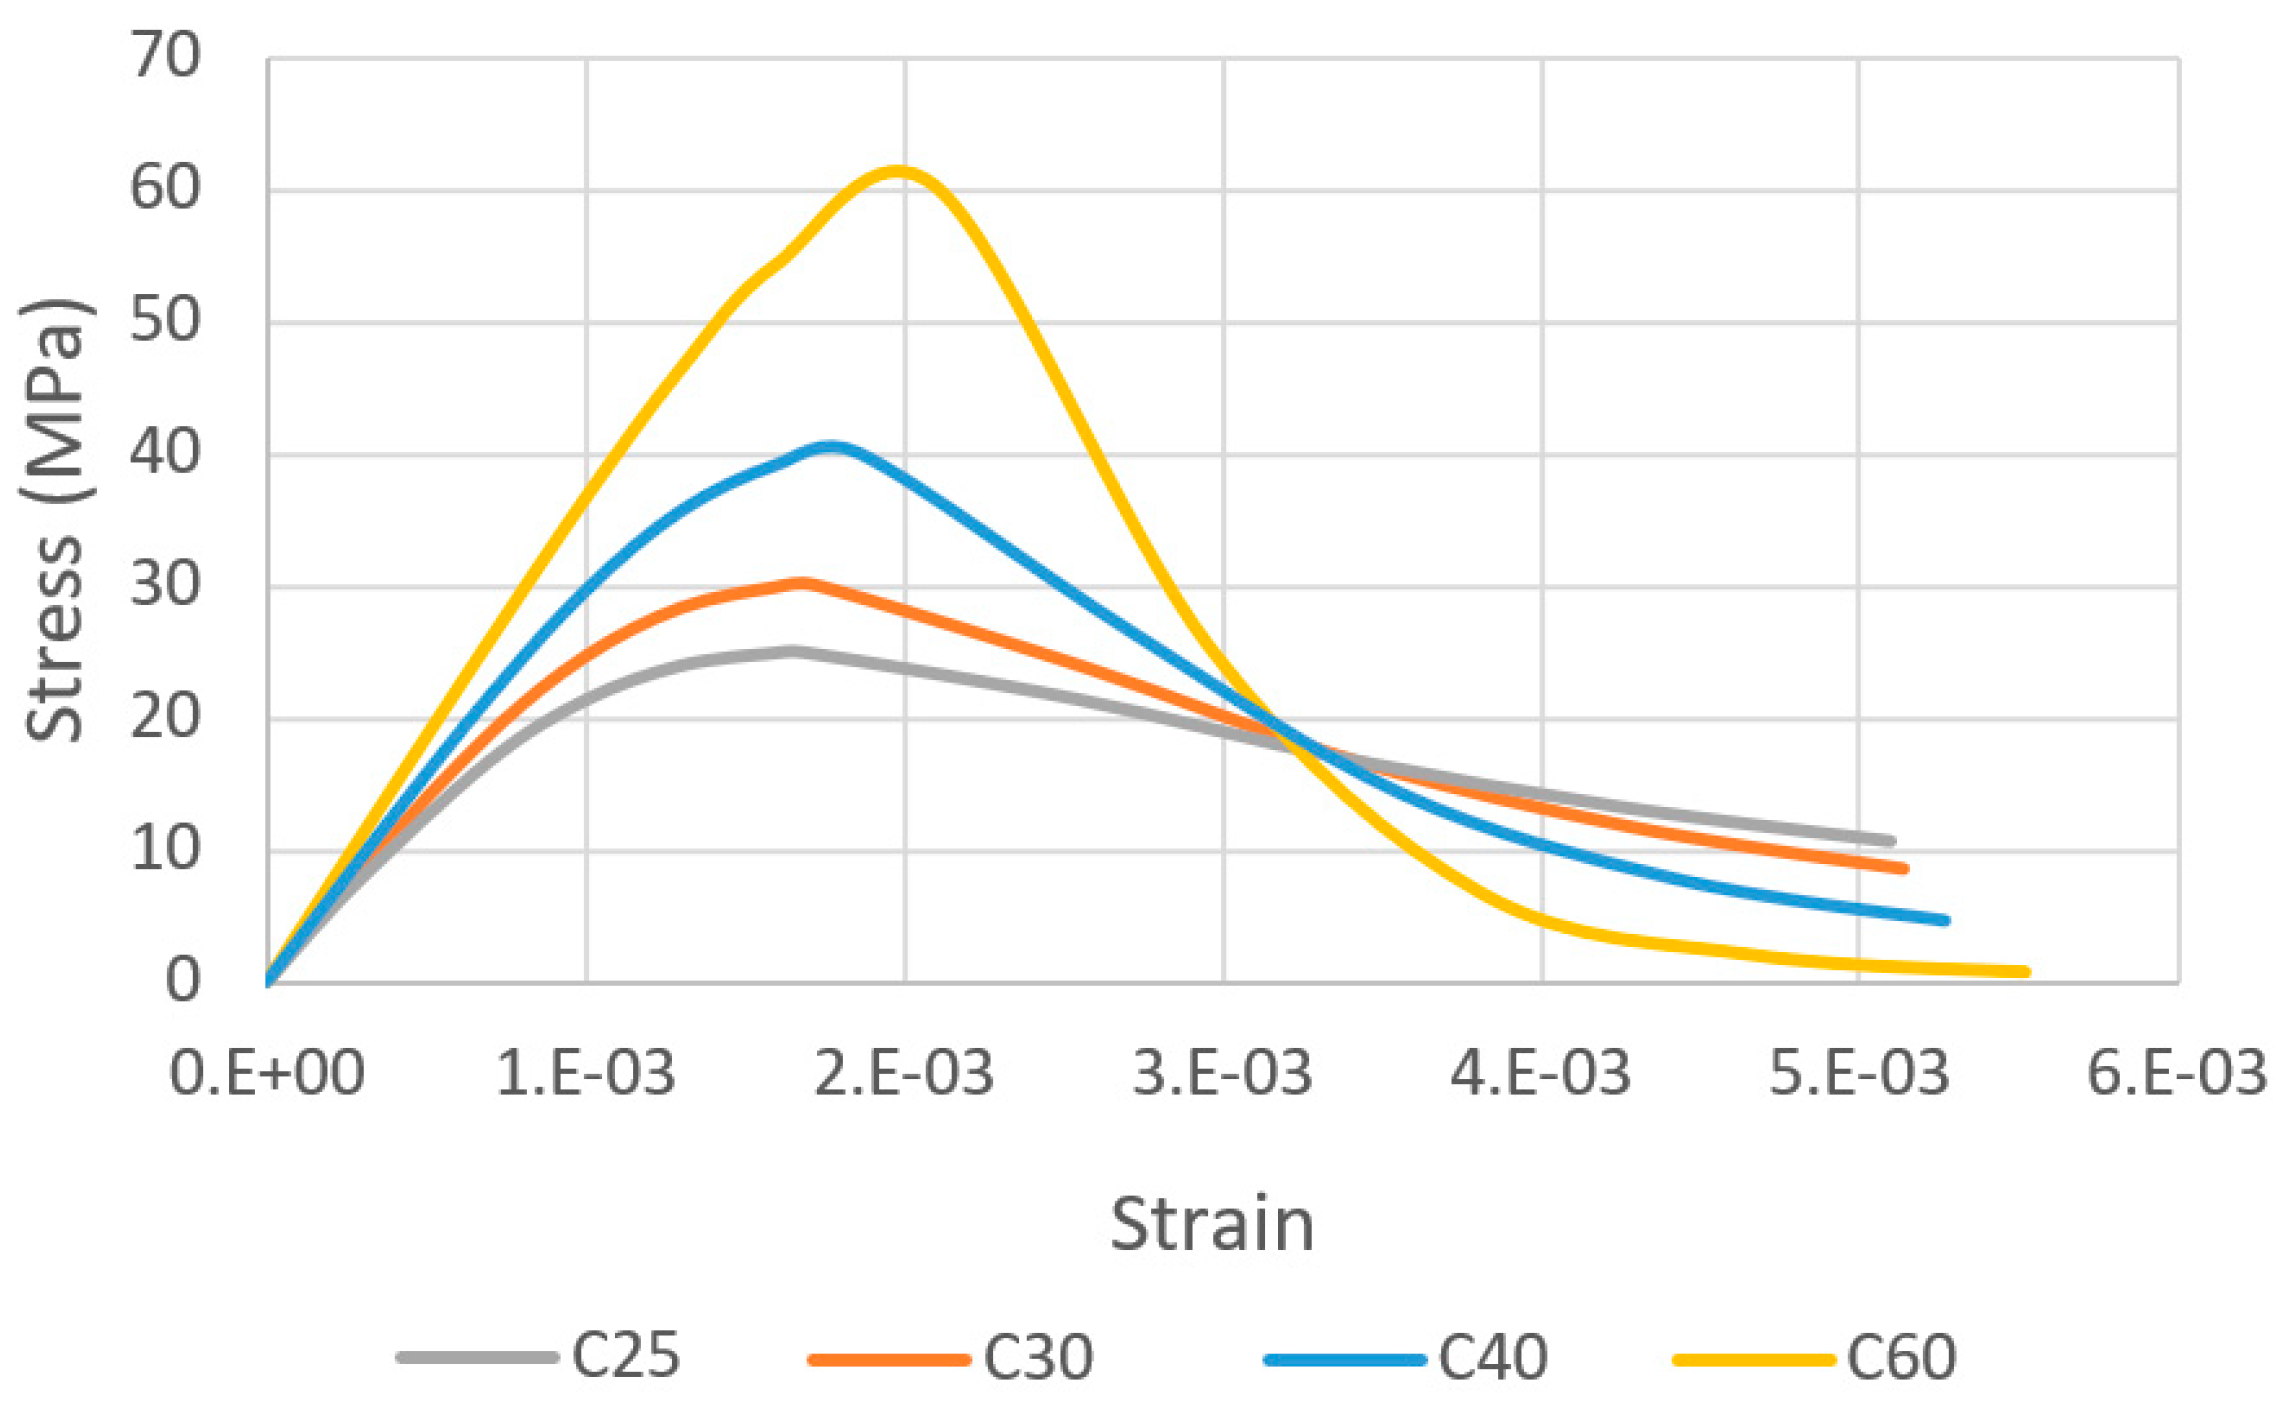
Starting from the concrete type C50, used in the experimental test, the ultimate strength of concrete has been modified simulating the mechanical response of different concrete grades equal to C25, C30, C40 and C60.
The detailed mechanical properties for the different concretes are reported in
Table 6 to better appreciate the effects introduced by the changes in concrete class on the numerical model.
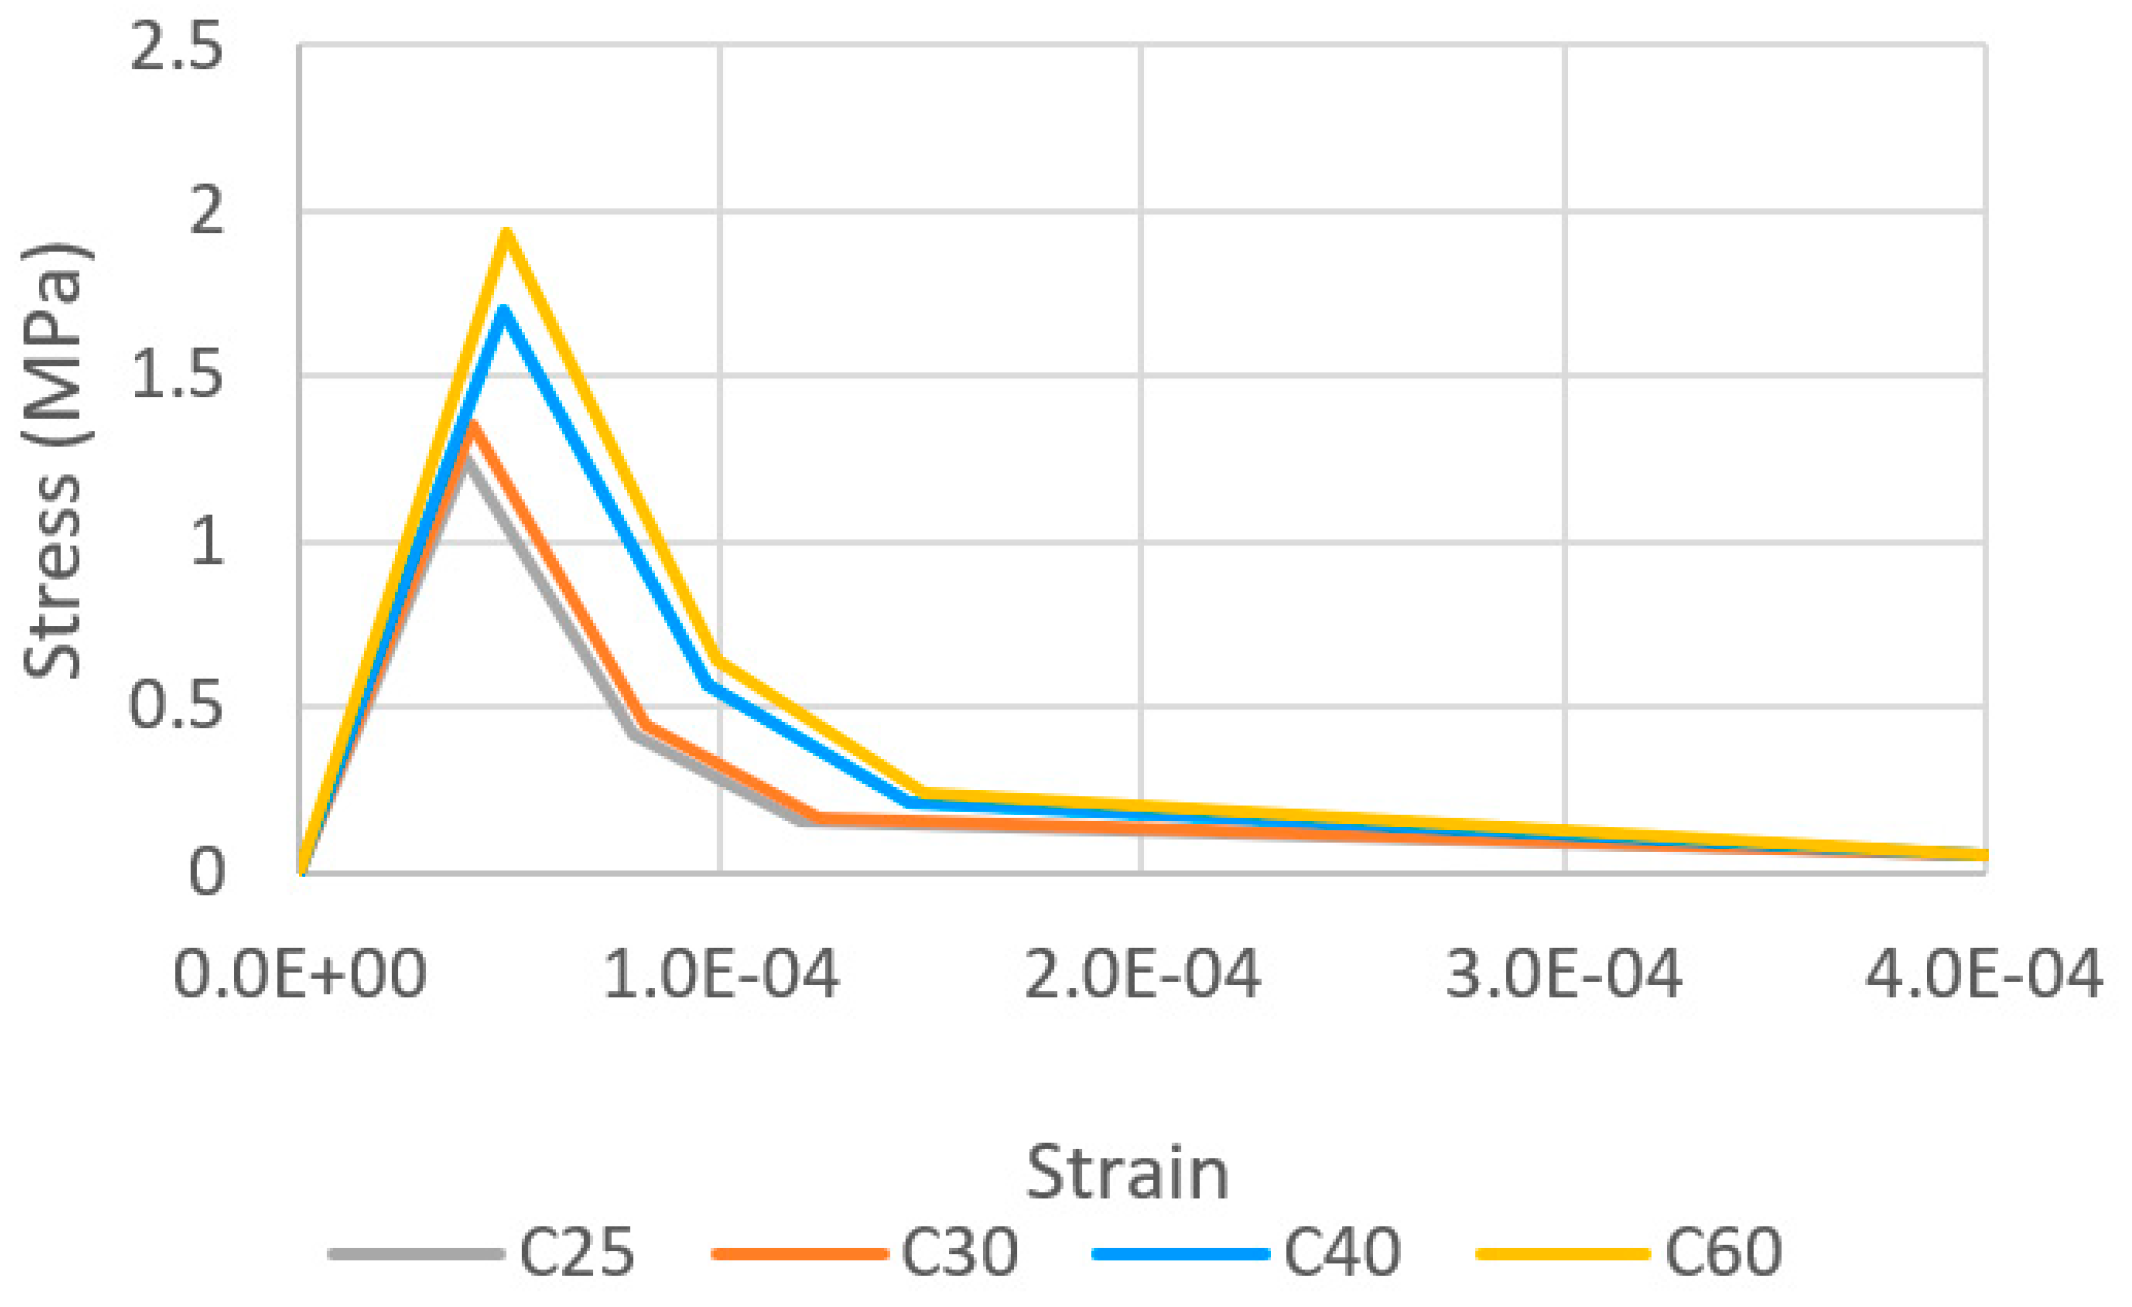
The resulting compressive and tensile stress–strain curves, for each of the four types of concrete investigated in this study, are depicted in
Figure 9 and
Figure 10, respectively.
Figure 11 and
Figure 12 illustrate the evolution of the stress according to the reference points selected for both steel and concrete, respectively, while changing the concrete grade.
It can be appreciated that when the grade of concrete decreases, the strain gauges installed on the surface of the steel show an increase in the amount of tension on the surface of the steel and also increase the pressure on the level of the horizontal strain gauges appointed in the main beam. Moreover, as expected, an opposite trend can be observed for the model with concrete grade equal to C60. Also, as the grade of concrete decreases, the strain gauges installed on the concrete rebars show the reduction of the recorded compressive stresses and the increase of the recorded tensile stresses. Nevertheless, the structural response of the model seems to be only slightly affected globally by the concrete grade. Negligible discrepancies in compressive and tension behavior are recognized.
The loading process consists of several steps, in each of which 10% of the final load is applied and the analysis is run to identify the exact location and size of the first cracks.
The model that corresponds to C25 concrete has been loaded until the appearance of cracks on the concrete. The load corresponding to this initial crack state is 35% of the load shown in
Figure 3 and is used to set an additional comparison between concretes, shown in
Table 7, where the maximum tensile and compressive stresses in steel and concrete are reported.
It can be appreciated that the load that induces first cracking in the specimen modeled with C25 (1.25 MPa tensile stress) generates higher tensile and compressive stresses in concrete specimens realized with higher grades, as the modulus of elasticity of stronger concretes is higher.
For the same reason, stresses in steel are uniformly decreasing when stiffer concretes are used for strengthening the connection.
The process of crack formation evolves rapidly in the tensed parts of the concrete section with the increase in the load. The zones that exhibited nonlinear behavior due to the presence of cracks are the top and bottom concrete surfaces. Especially for the former, the load transmitted by the vertical steel members causes the propagation of cracks within the concrete surface.
6. Application of PTMS
The parametric study on the beneficial effect of the use of PTMSs is done on the model realized with C25 concrete. The poorest material among the one tested in the previous chapter is chosen in order to simulate a situation of bad casting that needed strengthening.
Post-tensioned steel straps are added to the model, considering different layouts, and the resulting structural behavior is computed to identify the optimal retrofitting design to control the crack formation.
Post-tensioned metal strap (PTMS) layouts are shown in
Figure 13. The characteristics of the material used for the straps are presented in
Table 8.
Five different layout are studied: the first one is characterized by four straps placed around the thickest part of the chord close to the vertical element; the second one is equal to the first but an additional strap is placed in correspondence of the area where high principal stress are found; the third one is equal to the second but an additional strap is placed just beside the last one; the fourth one shows seven straps placed in the same position of the four of the first one; and the fifth one increases again, using all the available space to place eleven straps in the central zone.
A friction interaction between belts and concrete with a friction coefficient of 0.5 and a nil cohesion has been established while the confinement effect has been simulated by a prestressing force equal to 10% of the yield force of the belt.
The load corresponding to 35% of the one applied in the laboratory test is used in this section, it being the load that causes first cracking in the specimen.
Analyzing the model with the PTMSs, the connection experiences tensile stresses close to the middle of the section, but due to the confinement given by the steel belts, the lower part of the concrete part remains almost unstressed. Thanks to the presence of steel belts, no cracks have been localized in the lower area even if an additional 10% of load increment has been achieved (from 35% to 45% of the laboratory test).
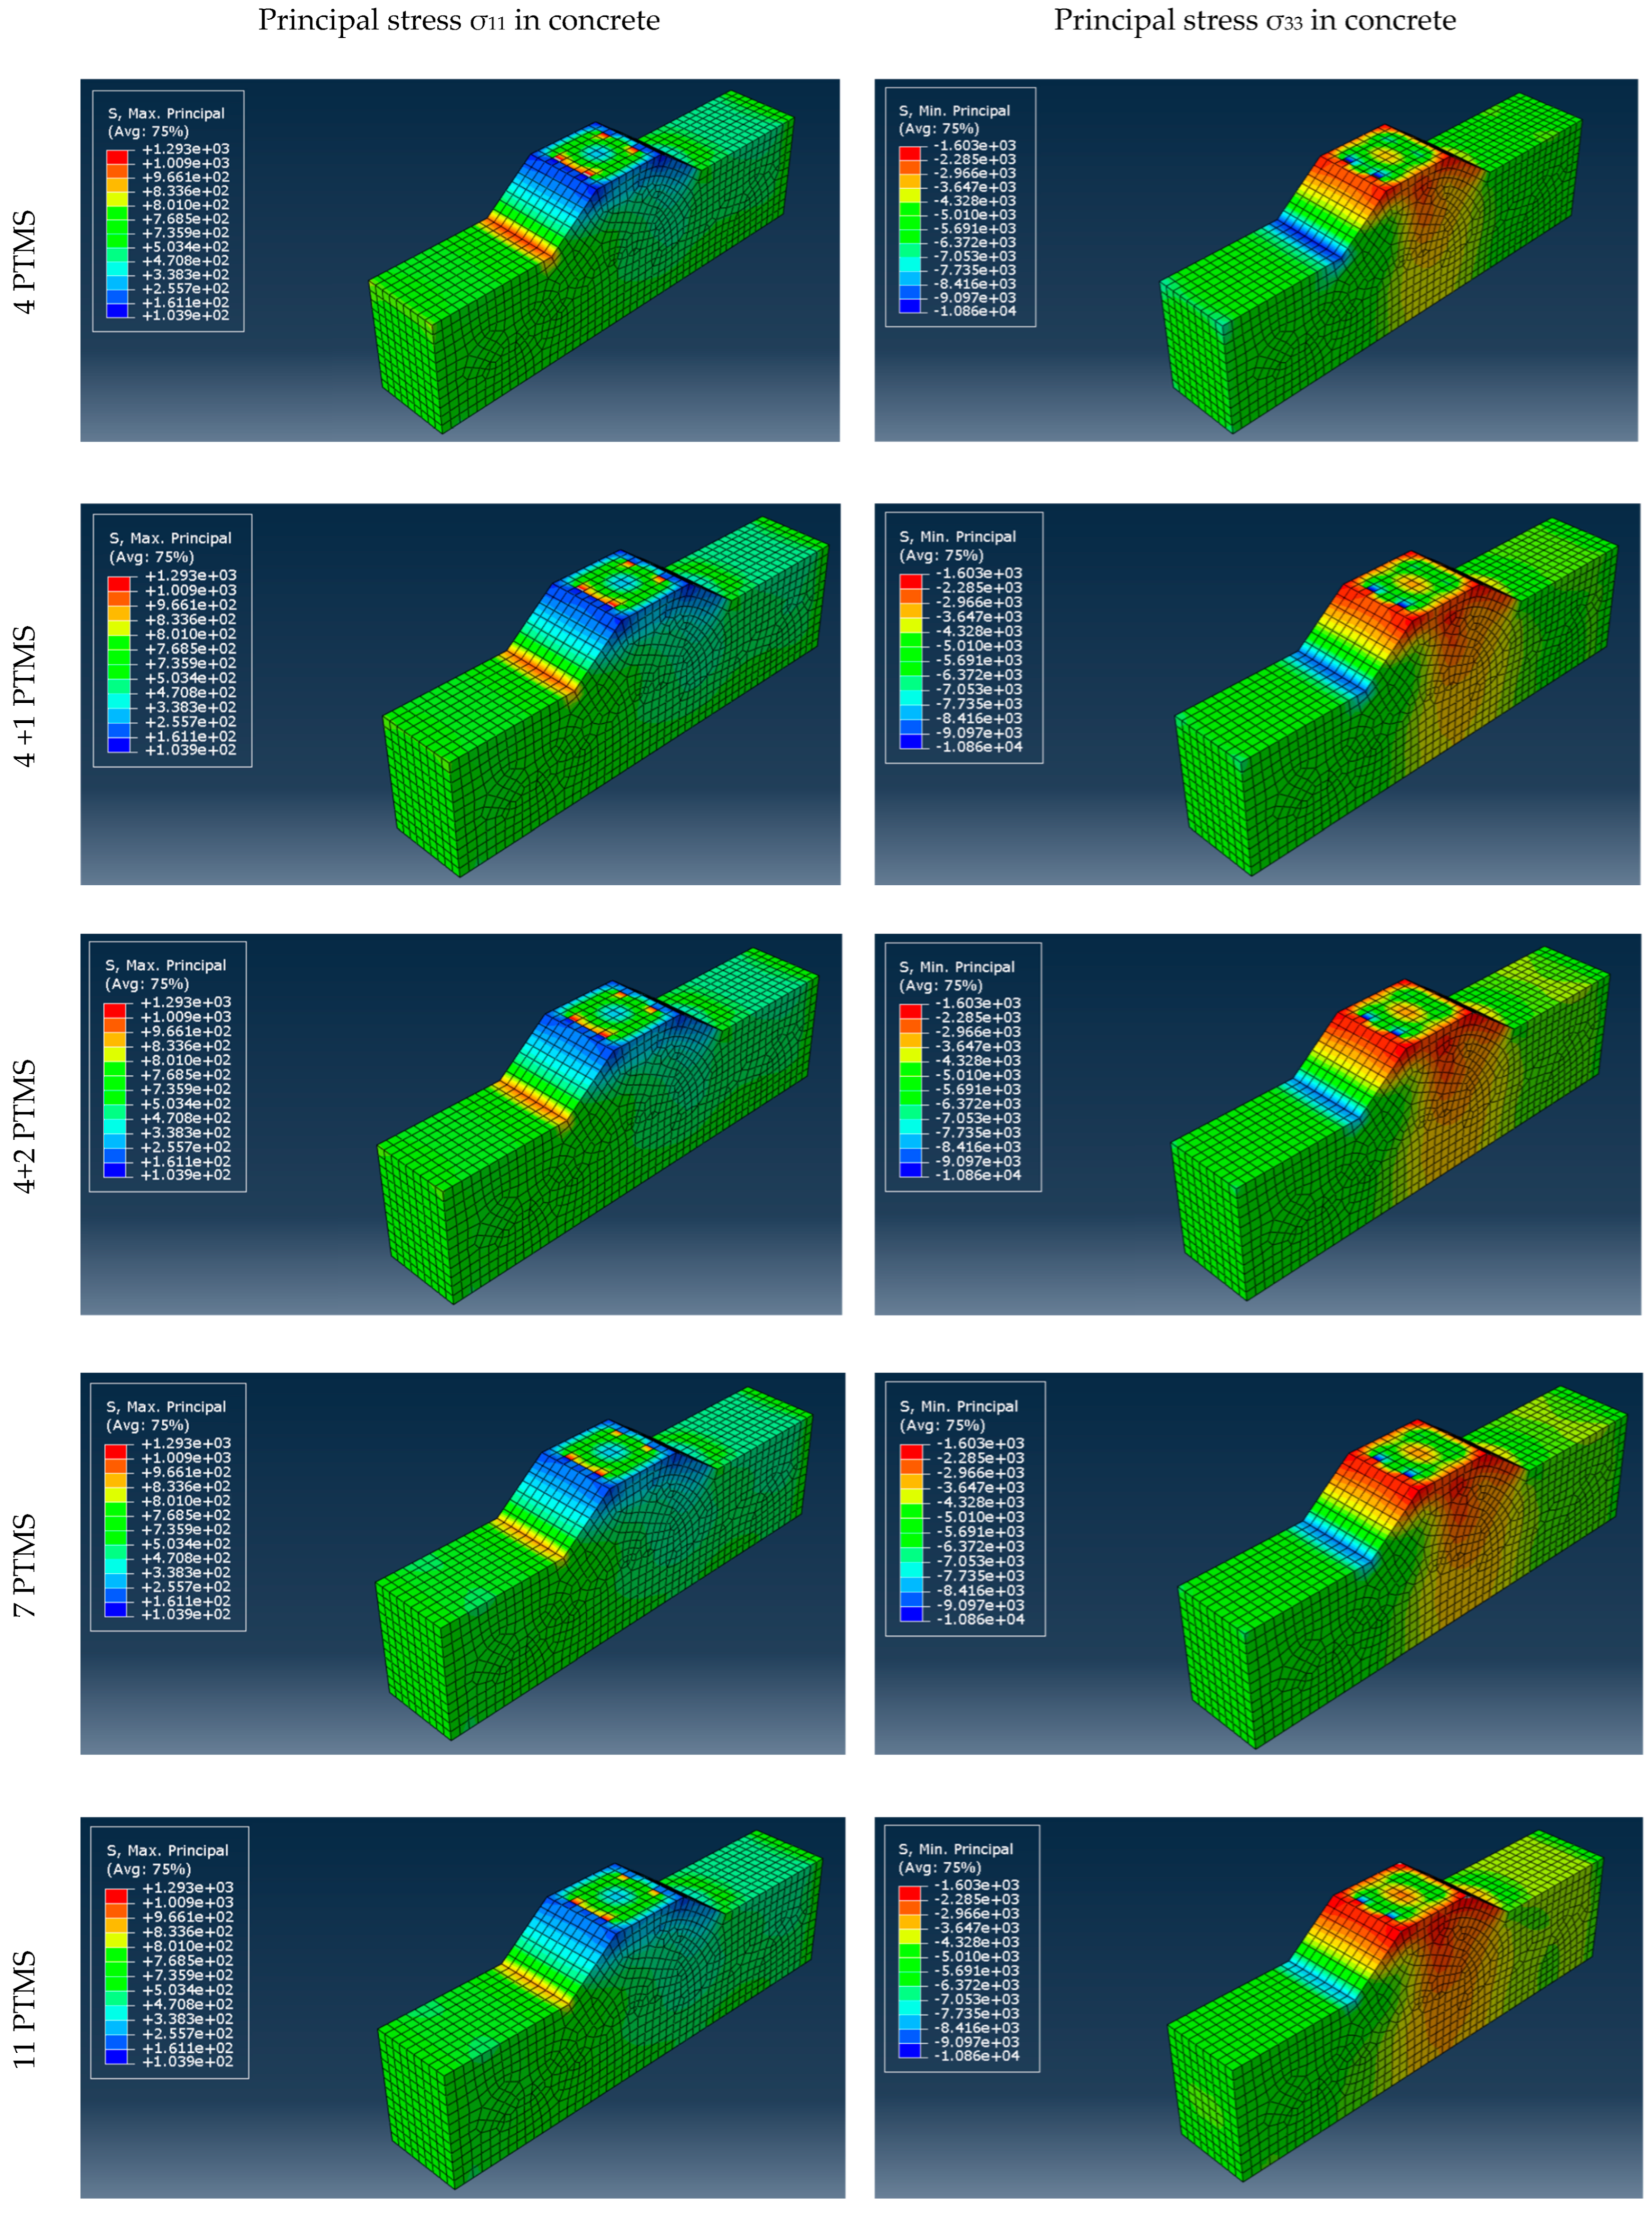
The principal stresses in concrete under the different belt arrangements are presented in
Figure 14.
The behavior of the belts (PTMSs) becomes clear through the investigation of the distribution of stresses in the areas reinforced with the belts, particularly when examining different belt arrangements. For instance, when two belts are examined together, it can be observed that the sections where the belts are joined undergoes significantly reduced tensile stresses compared to other regions.
The maximum stress generated in the belts in different arrangements (variable number of belts) are shown in
Figure 13 and in
Table 9.
Moreover, the analysis reveals that the highest concentration of stress occurs in the thinner portion of the concrete structure. This stress concentration contributes significantly to the vertical deformation of the concrete element.
The best retrofitting layout results are the ones with the higher number of straps concentrated around the central column. After the retrofitting, the tensile stresses in the concrete connection present an overall reduction of 20% of maximum tensile stresses and 14% of the minimum compressive stresses if compared with the initial state without PTMS. The four-plus-one scheme performs almost as well as the one with seven straps, but with a much smaller quantity of steel and easier installation.
The understanding of these stress distribution patterns and their implications on structural safety is essential for optimizing the design and performance of PTMS systems, particularly in ensuring durability and reliability under various operating conditions.
7. Conclusions
In this paper, the composite joint of the Minpu bridge is selected as a case study for the assessment of the structural behavior of strengthened composite joints. An ABAQUS model of the truss connection has been realized and a comparison with the experimental test of a previous study has been conducted successfully. The validation of the numerical model and its reliability was demonstrated.
The authors then performed a sensitivity analysis in order to assess the impact of the concrete grade on the structural response of the composite joint. A predictable influence of this parameter with slight differences on the concrete stresses but stronger variations on the concentration of stresses in steel for the different concrete grades can be observed.
Finally, a retrofitting approach with post-tensioned metal straps (PTMSs) is proposed on a specimen modeled using C25/30 concrete.
The cracking load of the member realized with C25/30 concrete corresponds to 35% of the load applied in the laboratory test.
Different layouts of straps were analyzed. The number of the straps as well as their position was studied.
The introduction of PTMSs reduces both the principal tensile stress and the principal compressive stress in concrete caused by the applied external load.
The principal tensile stress can be reduced up to 17%, and the principal compressive stress up to 14%.
Two PTMS layouts show better cost/benefit characteristics: the eleven-strap solution provides the best absolute results, whereas the four-plus-one solution evidences the best gain per unit weight of PTMS introduced.
A smaller number of PTMSs leads to higher stresses at cracking (155 MPa for four-plus-one vs. 112 MPa for eleven). Therefore, the performance after cracking is better for the eleven PTMS configuration as they remain in elastic field for higher applied loads.
In conclusion, as a result of this research, post-tensioned metal straps can be assumed as a cheap and effective retrofitting approach to increase the cracking load of composite joints, control the crack formation and reduce the opening of the cracks.
Better confinement and higher stiffness of the concrete strengthening reduce the stress concentration in the steel elements of the joint, reducing the dangerous effect of fatigue phenomena.
Further studies may analyze the effect of construction and retrofitting phases to assess the real load effectively transferred to concrete encasing and PTMSs when they are realized after the opening to traffic of the bridge as a retrofitting technique.


