Article

High-Volume Resistance Training Improves Double-Poling Peak Oxygen Uptake in Youth Elite Cross-Country Skiers and Biathletes: A Pilot Study

1
Institute of Exercise, Sport and Health, Leuphana University, 21335 Lüneburg, Germany
2
Centre of Elite Sports Research, Department of Neuromedicine and Movement Science, Norwegian University of Science and Technology, 7034 Trondheim, Norway
3
Department of Sport Science, Medical School Hamburg, 20457 Hamburg, Germany
4
Department of Exercise and Training Science, German University of Health and Sport, 85737 Ismaning, Germany
*
Author to whom correspondence should be addressed.
Appl. Sci. 2024, 14(7), 2774; https://doi.org/10.3390/app14072774
Submission received: 8 February 2024 / Revised: 11 March 2024 / Accepted: 13 March 2024 / Published: 26 March 2024
(This article belongs to the Special Issue Exercise, Fitness, Human Performance and Health)

Abstract

:
A total of nineteen elite youth cross-country skiers (16 ± 2 years) were divided into three groups: a low-load group (LL, n = 6) performing 15–20 repetitions per exercise, a high-load group (HL, n = 9) executing 6–12 repetitions, and a control group (CON, n = 4) exclusively engaging in endurance training. Testing included 1RM in upper-body exercises, VO2max running tests, and double-poling (DP) ergometer exhaustion and sprint tests to determine peak oxygen uptake (VO2peak-DP) and peak power (PP). The results indicated that HL and LL showed significant increases in VO2peak-DP, both in absolute values (d = −1.2 and −1.2, p < 0.05) and when normalized to body mass (d = 0.93 and 1.3, p < 0.05). Although there were no group*time effects for VO2peak-DP, PP during DP tests to exhaustion increased in both HL (d = −1.6, p < 0.05) and LL (d = 1.4, p < 0.05) compared to CON. Standardized to body mass, only HL showed significant improvements in PP during the sprint test (d = 1.7, p < 0.05). During the sprint test, both absolute and body-mass-normalized peak power increased only in the high-load group (d = −1.0 and 0.93, p < 0.05). In conclusion, high-load resistance training resulted in the greatest improvements in strength, DP performance, and VO2peak-DP, indicating a dose–response relationship to the load magnitude of resistance training.

1. Introduction

Cross-country skiing is a winter endurance sport, performed in varying terrain, necessitating constant transitions between sub-techniques, with propulsion derived from varying degrees of upper- and lower-body involvement. In recent decades, the average skiing speed in World Cup competitions has increased by 5–8%, with the addition of mass starts and sprint competitions that demand higher power outputs. This shift underscores the growing importance of anaerobic capacity, maximal strength, and speed, which now play a more significant role alongside aerobic metabolism in determining competitive success [1,2].
Double poling (DP), a sub-technique within the classical style with the highest degree of upper-body involvement, has therefore become increasingly important [3,4,5,6]. Research has focused on strength and power development, especially in the upper body, due to double poling’s significance in cross-country skiing [7]. Double-poling performance is linked to upper-body strength and power, resulting in higher peak forces, shorter contact times, increased cycle length, and reduced poling frequency at both maximal and submaximal speeds [1,6,8,9,10]. The significance of having superior upper-body endurance capacity is emphasized by strong correlations between peak oxygen uptake in double-poling (VO2peak-DP) and race performance [11,12,13,14]. Several studies have investigated the impact of adding heavy resistance training (within the three to twelve repetition range) to the regular endurance training regime of cross-country skiers on double-poling performance, with varying results. Some studies indicated positive effects of resistance training on double-poling performance [15,16,17,18]. However, other studies reported positive effects in experimental as well as control groups (both active and passive), with no changes between groups [10,18,19,20], or in the control group only [21]. While certain studies have reported improvements in exercise economy during double poling at submaximal intensities [15,16,17], others did not report a significant reduction in oxygen cost [19].
The effects of resistance training on VO2peak-DP are inconsistent, too, underscoring the need for a detailed analysis of potentially contributing factors. Notably, only a few studies reported VO2peak-DP increases following resistance training among junior cross-country skiers, suggesting a nuanced relationship between resistance training and physiological adaptations in this athletic population. [19,20]. However, when normalized for body mass, no significant changes were observed in any of these studies. Other studies have reported no significant effects of resistance training on VO2peak-DP, although it could be expected that better double-poling performance would allow a greater utilization of VO2max in the double-poling technique [15,16,17,18]. In this context, previous research suggests that peak oxygen uptake (VO2peak) is considerably influenced by the active muscle mass during upper-body dominant modes [22,23,24]. In accordance, various investigations in cross-country skiers reported a decrease in oxygen uptake when using techniques with decreasing muscle-mass recruitment [25,26,27]. For example, Hegge et al. [28] reported a decrease in VO2peak-DP by 15% and 22% when power output during DP was only generated by the upper body and a further decrease by 23% and 25% when the arms worked in isolation compared to whole body DP for men and women, respectively.
However, previous literature has mainly focused on resistance training methods aimed to provide minimal muscle hypertrophy [29,30,31,32], and no study has so far aimed to investigate the potential effects of increasing muscle mass in the upper body on VO2peak and DP performance, even though significant correlations between fat-free mass in the upper body and DP performance have already been reported [33,34]. Therefore, the current study aimed to investigate the effects of low- and high-load upper-body resistance training, aiming to provide upper-body muscle hypertrophy, on maximum strength and double-poling performance, as well as on peak oxygen uptake. This would address gaps in our current understanding on how to optimize training strategies in cross-country skiing with the increasing importance of upper-body performance. It was hypothesized that resistance training would increase maximum strength, as well as both VO2peak-DP and DP performance.

2. Materials and Methods

During the 10-week intervention, experimental groups incorporated two upper-body resistance training sessions per week into their late preparation phase (September–December). Participants were divided into a low-load (LL, n = 6) and a high-load training group (HL, n = 9). The study was not fully randomized due to the limited number of highly trained and experienced participants within this peer group who were willing to participate in 10 weeks of extensive resistance training or control testing. However, similar selection has previously been frequently used when studying high-level athletes [10,35]. LL executed 15–20 repetitions per exercise and HL aimed for 6–12 repetitions, while both groups trained to momentary concentric muscle failure in each session. Training volume was balanced across groups by matching the number of sets and sessions [36,37]. The control group (n = 4) maintained their usual endurance training without added resistance training. All groups continued their regular core stability training, incorporating band or sling exercises, Swiss Ball routines, and various mat exercises, targeting lower back and abdominal muscles.
Before and after the 10-week intervention phase, all participants were assessed through upper-body strength and power tests, a treadmill running test to exhaustion, and both submaximal and maximal double-poling ergometer tests. This comprehensive testing protocol aimed to evaluate the participants’ strength and endurance adaptations resulting from the intervention (see Figure 1).

2.1. Participants

Twenty-six (male, n = 11; female, n = 15; age: 16 ± 2 years; height: 1.69 ± 0.08 cm; body mass: 56.8 ± 6.5 kg; VO2max: 61.1 ± 7.1 mL·kg−1·min−1) youth cross-country skiers (n = 12) and biathletes (n = 14) from two elite training centers volunteered to participate in this study. Participants included in the study were classified as at least highly trained/national-level (Tier 3) [38]. The participants placed among the top 30 in their respective national and international competition classes (mean: 19; range: 1–52) and can therefore be defined as elite [39].
Each subject and their parents (if the subjects were younger than 18 years) were informed about the aims of the study and the experimental risks involved with the research before providing written informed consent. Furthermore, this study was performed in accordance with the Declaration of Helsinki and was approved by the Universities Ethics Committee (DHGS-EK-2023-004). Eight participants were subsequently excluded from the study (LL, n = 3; CON, n = 5) due to illness (COVID-19, n = 6), other reasons (n = 1), or lack of compliance with the prescribed training (n = 1).

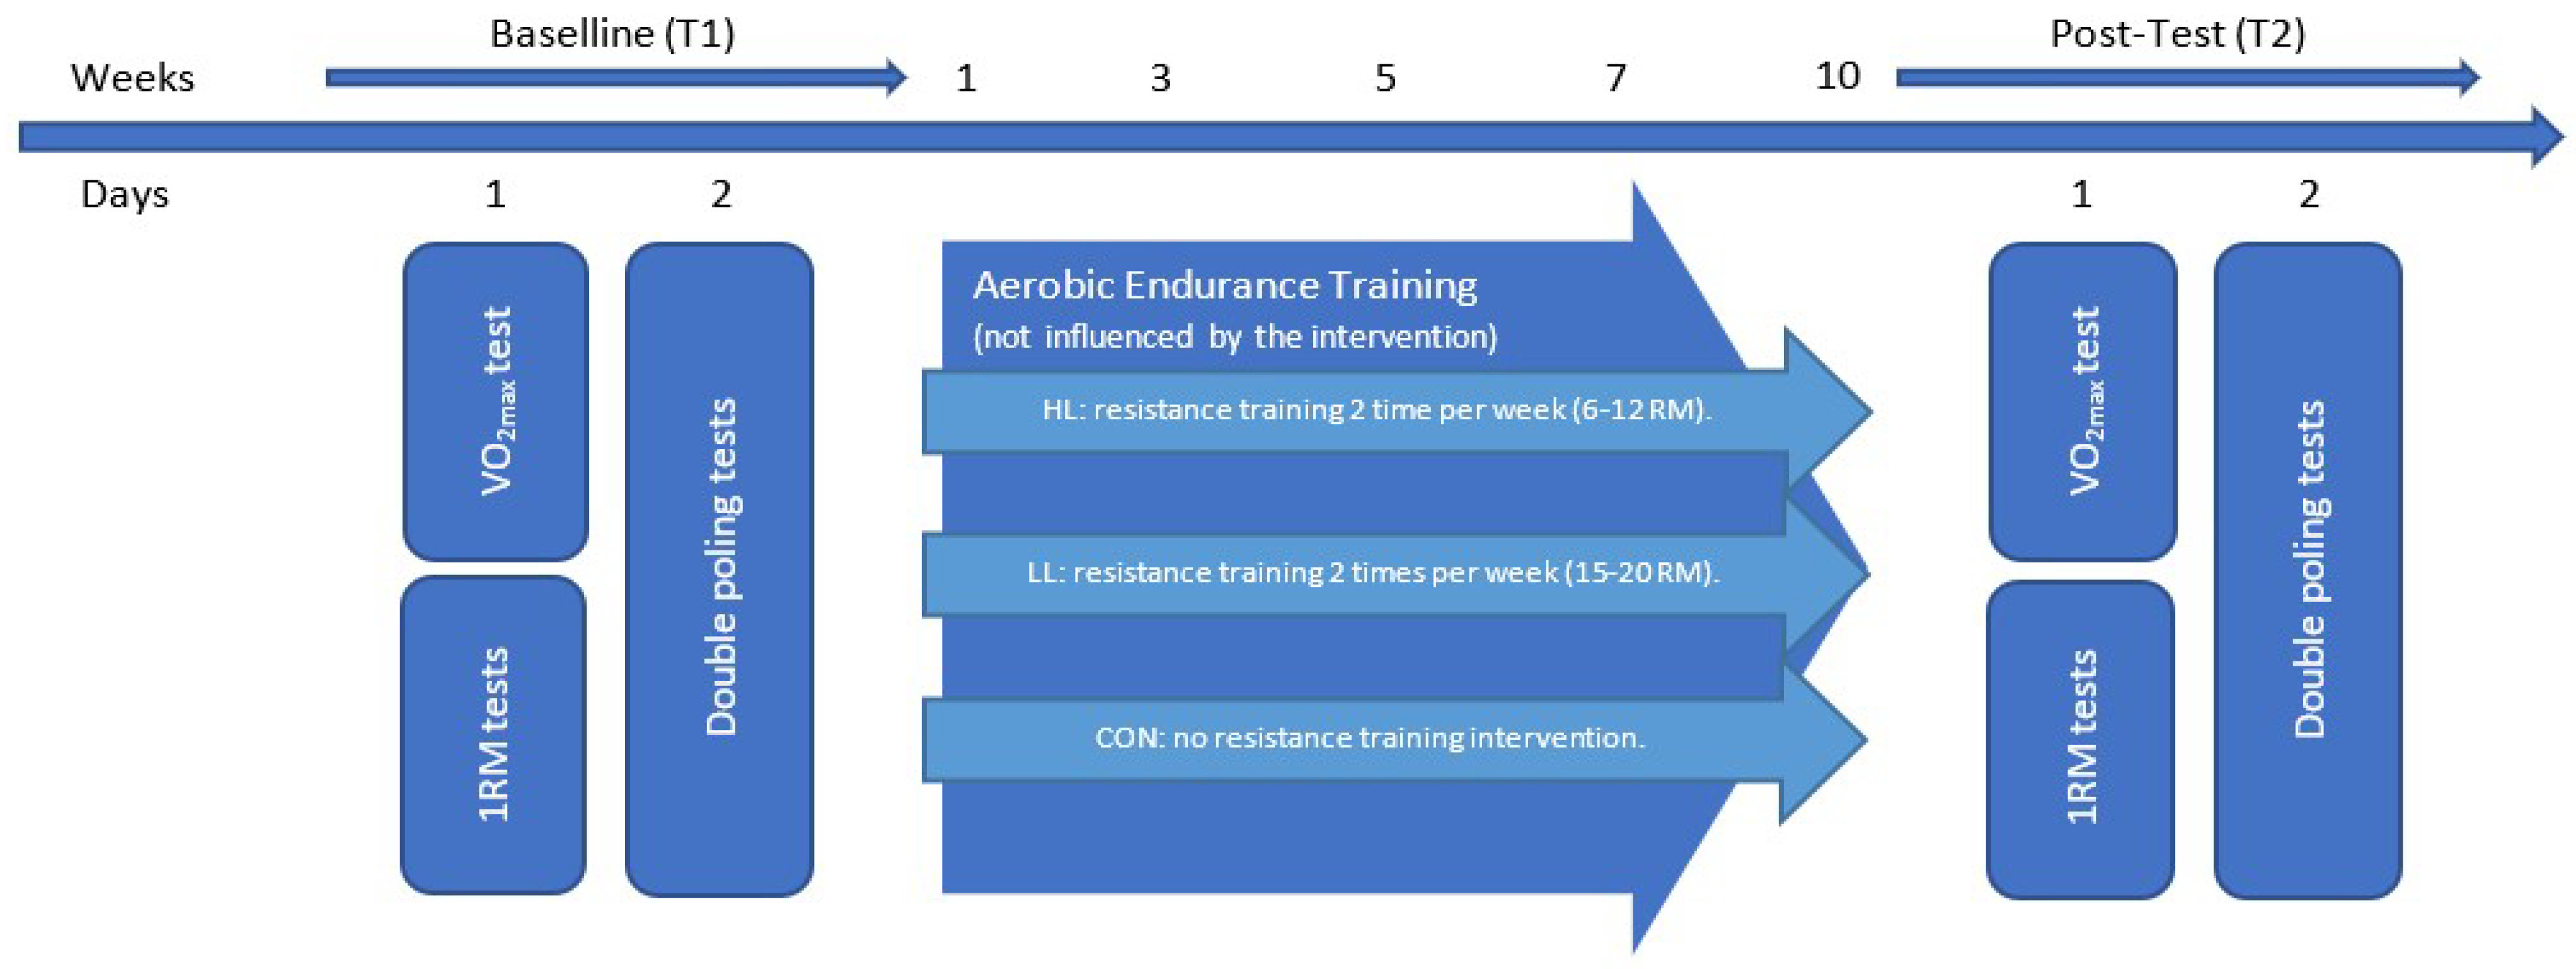
2.2. Test Procedures

All participants completed at least one familiarization session on the double-poling ergometer and in the strength tests one week prior to the pre-test at the start of the intervention. Athletes with little to no experience with performance diagnostics completed two sessions to familiarize themselves with the different testing protocols. All participants were familiar with the VO2max running test. The majority of the participants were already acquainted with ski ergometer and resistance training, thus requiring only one familiarization session. The strength familiarization began with three submaximal sets, with increasing load: 10 repetitions at 40%, 6 repetitions at 75%, and 3 repetitions at 85% of the estimated 1RM. Then, two heavier, almost maximal lifts were performed to estimate 1RM. The familiarization process for the ski ergometer began with a 10 min general warm-up using the ergometer. This was followed by two to three submaximal 4 min stages, and finally, two successive 15 s sprints.
Participants were asked to exercise for a maximum of ninety minutes at low intensities (<75% of maximum heart rate [HRmax]) the day before the test days. They were instructed to avoid consuming large meals or coffee, or other products containing caffeine, during the last 3 h before the test. On test days, participants refrained from performing any training before testing. All tests were conducted under similar environmental conditions, specifically at a temperature range of 21–24 °C, and at approximately the same time of day to avoid circadian variance within a range of ±1.5 h.
The testing protocol was conducted over two consecutive days. The tests were conducted in the following order: anthropometric measurements, upper-body strength tests, VO2max running tests on test day 1, and double-poling ergometer tests on test day 2. Verbal encouragement was provided to athletes throughout all tests to stimulate maximal effort.

2.3. Assessment of Upper-Body Maximal Strength

One-Repetition Maximum

Upper-body maximal strength was assessed by measuring the 1RM in bench-press and bench-pull exercises. Repetition maximum testing was conducted in accordance with the guidelines established by the National Strength and Conditioning Association [40]. The warm-up protocol included a 10 min warm-up on a cycle ergometer, followed by 3 sets with 2–5 repetitions at approximately 50–80% of 1RM for each exercise. The initial attempts were performed with a load of approximately 90–95% of the estimated one-repetition maximum (1RM). The load was then increased by 2–5% after each successful attempt until the participants were unable to lift or pull the load with proper technique. The best attempt was recorded as the 1RM after two consecutive non-accepted attempts. The order of the tests was consistent across all testing sessions. Rest periods of at least five minutes were given between the trials. The 1RMs were achieved within a maximum of five attempts. All 1RM testing was supervised by the same investigator and conducted on the same equipment with identical equipment positioning for each subject.
Bench-press performance was tested in supine position on a bench. Proper form was assessed based on a 5-point body contact position, which required the head, upper back, and buttocks to be firmly on the bench with both feet flat on the floor. During the eccentric phase of the exercise, a gentle contact of the barbell with the chest was permitted, although the attempt was considered unsuccessful if the chest movement helped the execution. The end position was determined by fully extended elbows at the end of the concentric movement [41].
Bench-pull performance was tested in prone position on a bench. The examiner visually inspected whether the arms were straight as participants grabbed the barbell. The athletes performed a concentric arm flexion beginning from the extended position. The end position was determined by touching the bench with an elbow angle of ≤90° [42]. Chest and lower extremities were required to stay in contact with the bench for a trial to be successfully performed.
Given the hypothetical significance of body weight for endurance performance, 1RMs were reported as both absolute (kilogram) and relative strength (kilogram per kilogram of body mass).

2.4. Assessment of Maximal Aerobic Capacity

Maximum Oxygen Uptake Test

Following a standardized 20 min warm-up (60–80% of HRmax), the subjects ran with poles on a treadmill at a constant incline of 10.5%. The speed increased incrementally by 1 km·h−1 every 60 s until exhaustion, with a starting speed of 7 km·h−1. The subjects reached exhaustion within 4 min and 45 s to 8 min and 15 s. VO2max was calculated as the average of the three highest consecutive 10 s measurements. To evaluate whether VO2max was achieved, two or more of the following criteria had to be met: (1) a respiratory exchange ratio (RER) greater than 1.1; (2) a plateau in oxygen uptake, observed when the two highest oxygen uptake (VO2) measurements were within 2.5 mL·kg−1·min−1 of each other; (3) heart rate (HR) greater than 95% of the subjects’ reported HRmax; or (4) blood lactate concentration ([La-]) greater than 8.0 mmol·L−1. The highest HR averaged over 30 s during the test was considered the subject’s HRmax (Polar H10, Polar, Kempele, Finland). Similarly, the oxygen pulse was averaged over 30 s and taken as O2-PulseVO2max. Peak treadmill speed (Vmax) was calculated using the formula: Vmax = vCOM + (t/60) × S, where vCOM is the speed of the last completed stage, t is the number of seconds completed in the last uncompleted stage, and S is the change in velocity of the last uncompleted stage.
Respiratory parameters (VO2, VCO2) were measured (10 s sampling time) using a computerized metabolic unit with mixing chamber (K5, Cosmed, Rome, Italy). The flow turbine was calibrated with a 3L calibration syringe. The metabolic system was calibrated with known concentrations of certified calibration gases before each test according to the specifications of the manufacturer. The spiroergometric system used for the double-poling tests was identical.

2.5. Assessment of Double-Poling Capacity

A specially designed double-poling ergometer (SkiErg, Concept 2, Morrisville, VT, USA) was used for all double-poling capacity tests. Power is generated by pulling cords that spin a wind resistance flywheel. The deceleration rate of the flywheel (drag factor) is controlled by a damper located on the flywheel. Therefore, the work required to accelerate the flywheel during each stroke is predetermined. For all performance tests, the damper settings were set at 100% of body weight to account for the hypothetical importance of body weight for endurance performance. Similar set-ups were utilized in previous studies [43]. Participants were instructed to choose a position that mimicked their habitual positions during double poling on skis.
Given the hypothetical significance of body weight for endurance performance, mean power was reported in both absolute (watts) as well as standardized values (watts per kilogram of body mass).

2.5.1. Assessment of Double-Poling Power (Sprint Test)

After a self-paced 5 min warm-up on the ski ergometer, the participants performed a 15 s bout with maximal effort to determine their maximal double-poling power (DPP15s). The mean power was used for subsequent analyses. Participants were allowed to choose their own cadence. Wattage and cycle rate were recorded using software (C2 ErgData Version 2.2.21, Concept 2, Morrisville, VT, USA).

2.5.2. Peak Oxygen Uptake Test during Double Poling

After 10 min of rest, participants performed a 15 min warm-up at different submaximal intensities (i.e., relative intensities between 65% and 81% of HRmax) followed by an incremental test to exhaustion on the double-poling ergometer. The test began at 75 W for women and 80 W for men, with the work rate increasing by 15 and 20 W, respectively, every minute. Exhaustion was defined as a power output drop of five or more watts below the required work rate for five or more seconds. Participants were free to choose their own cadences at each stage of the test. The subjects reached exhaustion within 3 min to 7 min and 10 s. Cardiorespiratory variables were continuously monitored during the test. The highest average VO2 during a continuous 30 s period was defined as VO2peak-DP. The subject’s peak heart rate during double poling (HRpeak-DP) was determined as the highest HR averaged over 30 consecutive seconds (Polar H10, Polar, Kempele, Finland). Similarly, the oxygen pulse was averaged over 30 consecutive seconds and recorded as O2-PulseVO2peak-DP. Peak power output (DPPPEAK) was calculated using an equation originally developed for stationary cycle ergometer test protocols [44]: DPPPEAK = DPPCOM + (t/60) × W. Here, DPPCOM is the power output of the last completed stage, t is the number of seconds completed in the last uncompleted stage, and W is the change in power output of the last uncompleted stage [45].

2.6. Intervention

Both the HL and LL groups underwent two weekly resistance training sessions on non-consecutive days for 10 weeks in addition to their regular endurance training. The hypertrophy-oriented resistance training protocols aimed to increase the maximum strength of the upper-body muscles and subsequently enhance VO2peak-DP. As previously described [46,47], effort (proximity to failure) and volume (number of working sets) were considered principal factors for hypertrophic outcomes. Accordingly, the protocol consisted of five sets of the free-weight bench press and bench pull, as well as dips and chin-ups, performed for five sets per exercise, with a minimum of two minutes of rest taken between sets. As described by Schoenfeld, Contreras, Vigotsky, and Peterson [41], participants were verbally encouraged to perform all sets until they reached momentary concentric muscular failure, which is defined as the inability to perform another concentric repetition while maintaining proper form. This helped to standardize the training protocols. Additionally, participants were instructed to perform repetitions with a focus on maximal acceleration and speed during the concentric phase (i.e., lasting around 1 s), while the eccentric phase, which is non-performance specific, should be performed in a slower, more controlled manner (i.e., lasting around 2–3 s). This approach is based on the assumption that the intended velocity, rather than the actual velocity, determines the velocity-specific training response [48,49,50]. During the intervention period, participants in the HL group aimed to maintain a 6–12 repetition maximum (RM) per set and per exercise, while participants in the LL group aimed to maintain a 15–20 RM per set and per exercise. Following a standardized warm-up, which consisted of 10 min of general aerobic exercise (running or cycling at a self-selected intensity) and three submaximal series (8-6-3 reps) with increased loads (40%, 60%, and 80% of 1RM), participants performed the working sets for the first exercise. For the subsequent exercises, two warm-up sets per exercise (2–4 repetitions, 80% of 1RM) were performed before the maximal sets. The participants in both groups were encouraged to progressively increase their RM loads during the intervention period while maintaining the target repetition range. They were permitted assistance on the final repetition. Participants were supervised during every training session by either the research team or a coach to ensure proper technique and appropriate workload.
Aerobic endurance training in HL, LL, SIT, and CON was managed by the participants’ respective coaches. Throughout the intervention period, participants logged their training sessions and provided this information to the project coordinator. Aerobic endurance training was categorized into three intensity zones: low-intensity training (LIT: 60–81% of HRmax), moderate-intensity training (MIT: 82–87% of HRmax), and high-intensity training (HIT: ≥88% of HRmax). The volume and intensity of endurance training were determined based on data recorded by heart rate monitors.

2.7. Blinding

To minimize potential bias, one level of blinding was incorporated into the analysis of this study. Statistical analyses were performed blinded; only after the analyses were completed was the correct dataset unveiled to the responsible researcher. However, it was not possible to blind the performance tests, and thus the potential for bias in the measures cannot be completely ruled out.

2.8. Statistical Analysis

Statistical analyses were performed using SPSS 29.0.1.1 (IBM, Ehningen, Germany) and data visualization using syntax from Loffing [51]. The best performance values were used in the data analyses for all performance tests. Data are presented as the means, standard deviations, and 95% confidence intervals. The level of significance was set a priori at p < 0.05 for all statistical methods. Data were checked for a normal distribution using the Shapiro–Wilk test.
For the longitudinal data, differences between groups at baseline were determined using one-factor ANOVA. The effect sizes for pairwise comparisons were calculated using Cohen’s d [52]. To analyze the changes in performance within and between groups, a 3 × 2 ANOVA with repeated measures (baseline to 10 weeks) was performed using the factors ‘time’ and ‘interaction’ (group × time). In the case of significant F-values, post hoc Scheffé tests were conducted for pairwise comparisons. The effect sizes for the global effects were calculated via the partial square of eta (η2). In general, effect sizes of η2 ≥ 0.25 are classified as large, η2 ≥ 0.1 as moderate, and η2 ≥ 0.01 as small. The effect sizes for pairwise (inner-subject) comparisons were calculated using Cohen’s d. In general, effect sizes of Cohen’s d defined as d > 0.8 can be interpreted as large effects, d > 0.5 can be interpreted as medium effects, and > 0.2 can be interpreted as small effects [52]. The analysis included calculating the number of participants who showed improvements exceeding the smallest worthwhile change (SWC) from baseline to 10 weeks, defined as 0.5 of the between-athletes standard deviations, reflecting a Cohen effect size of 0.50 [53].
The relationships between pre- to post-changes in strength parameters and upper-body endurance parameters were analyzed with one-tailed bivariate Pearson correlation coefficient (r). Additionally, a 95% CI for correlation coefficients was reported. Correlation coefficients were squared (r2) to examine the variance (in percent [%, r2 × 100]) explained by each variable.

3. Results

3.1. Baseline Characteristics and Body Mass

The study found no differences between age and anthropometrics between groups. There were no within- (F = 2.900, p = 0.108, partial η2 = 0.153) or between-group differences (F = 1.902, p = 0.108, partial η2 = 0.192) in body mass changes. There were differences between HL and LL in bench-pull 1RM absolute (F = 5.021, p = 0.02, partial η2 = 0.386; ES, d = −1.79 [−3.01 to −0.58]) and standardized to body mass (F = 4.387, p = 0.03, partial η2 = 0.354; ES, d = −1.58 [−2.76 to −0.41]). No other performance variable showed differences between the groups prior to the intervention (F = 0.325–3.843, p = 0.103–0.727).

3.2. Endurance Training during the Intervention

Analysis of training data extracted from the subject’s training diaries revealed no significant difference in the weekly duration of endurance training or its distribution across the low-, medium-, and high-intensity zones between HL (10.0 ± 0.8 h, 0.3 ± 0.2 h, and 0.8 ± 0.1 h, respectively), LL (9.9 ± 0.8 h, 0.2 ± 0.1 h, and 0.9 ± 0.1 h, respectively), and CON (9.9 ± 1.3 h, 0.4 ± 0.2 h, and 0.8 ± 0.1 h, respectively) during the 10-week intervention period.

3.3. Maximum Strength

The results for 1RMs in absolute terms are shown in Table 1. Figure 2 illustrates the mean and individual changes in relative strength in bench press and bench pull within HL, LL, and CON, respectively.
Maximal strength tests revealed large main effects for the time (i.e., from pre to post) for relative strength in bench press (F = 18.184, p < 0.001, partial η2 = 0.532) and bench pull (F = 13.507, p = 0.002, partial η2 = 0.458), as well as for the interaction effect group * time (F = 5.255, p = 0.018, partial η2 = 0.963) for relative strength in bench pull. The Scheffé test showed that the relative strength in bench press increased significantly in HL (0.72 ± 0.08 kg·kg−1 to 0.82 ± 0.10 kg·kg−1, d = −2.561, p < 0.05) and LL (0.63 ± 0.14 kg·kg−1 to 0.67 ± 0.13 kg·kg−1, d = −0.780, p < 0.05) but not in CON (0.66 ± 017 kg·kg−1 to 0.68 ± 0.14 kg·kg−1) and the relative strength in bench pull increased significantly in HL (0.81 ± 0.04 kg·kg−1 to 0.93 ± 0.04 kg·kg−1, d = −2.754, p < 0.05) and LL (0.69 ± 0.10 kg·kg−1 to 0.80 ± 0.13 kg·kg−1, d = −0.926, p < 0.05) but not in CON (0.84 ± 0.14 kg·kg−1 to 0.83 ± 0.11 kg·kg−1) from pre-test to post-test, respectively. The group differences determined by the Scheffé test showed significant differences between HL and LL, as well as HL and CON, for relative strength in bench press (p < 0.05), as well as significant differences between HL and CON, as well as LL and CON, for relative strength in bench pull (p < 0.05). No significant differences could be determined between HL and LL for relative strength in bench pull, as well as LL and CON for relative strength in bench press. Figure 3 shows correlations between changes in 1RM and VO2peak, as well as DPPpeak and DPP15s including all participants within the study.

3.4. Maximal Endurance Measurements
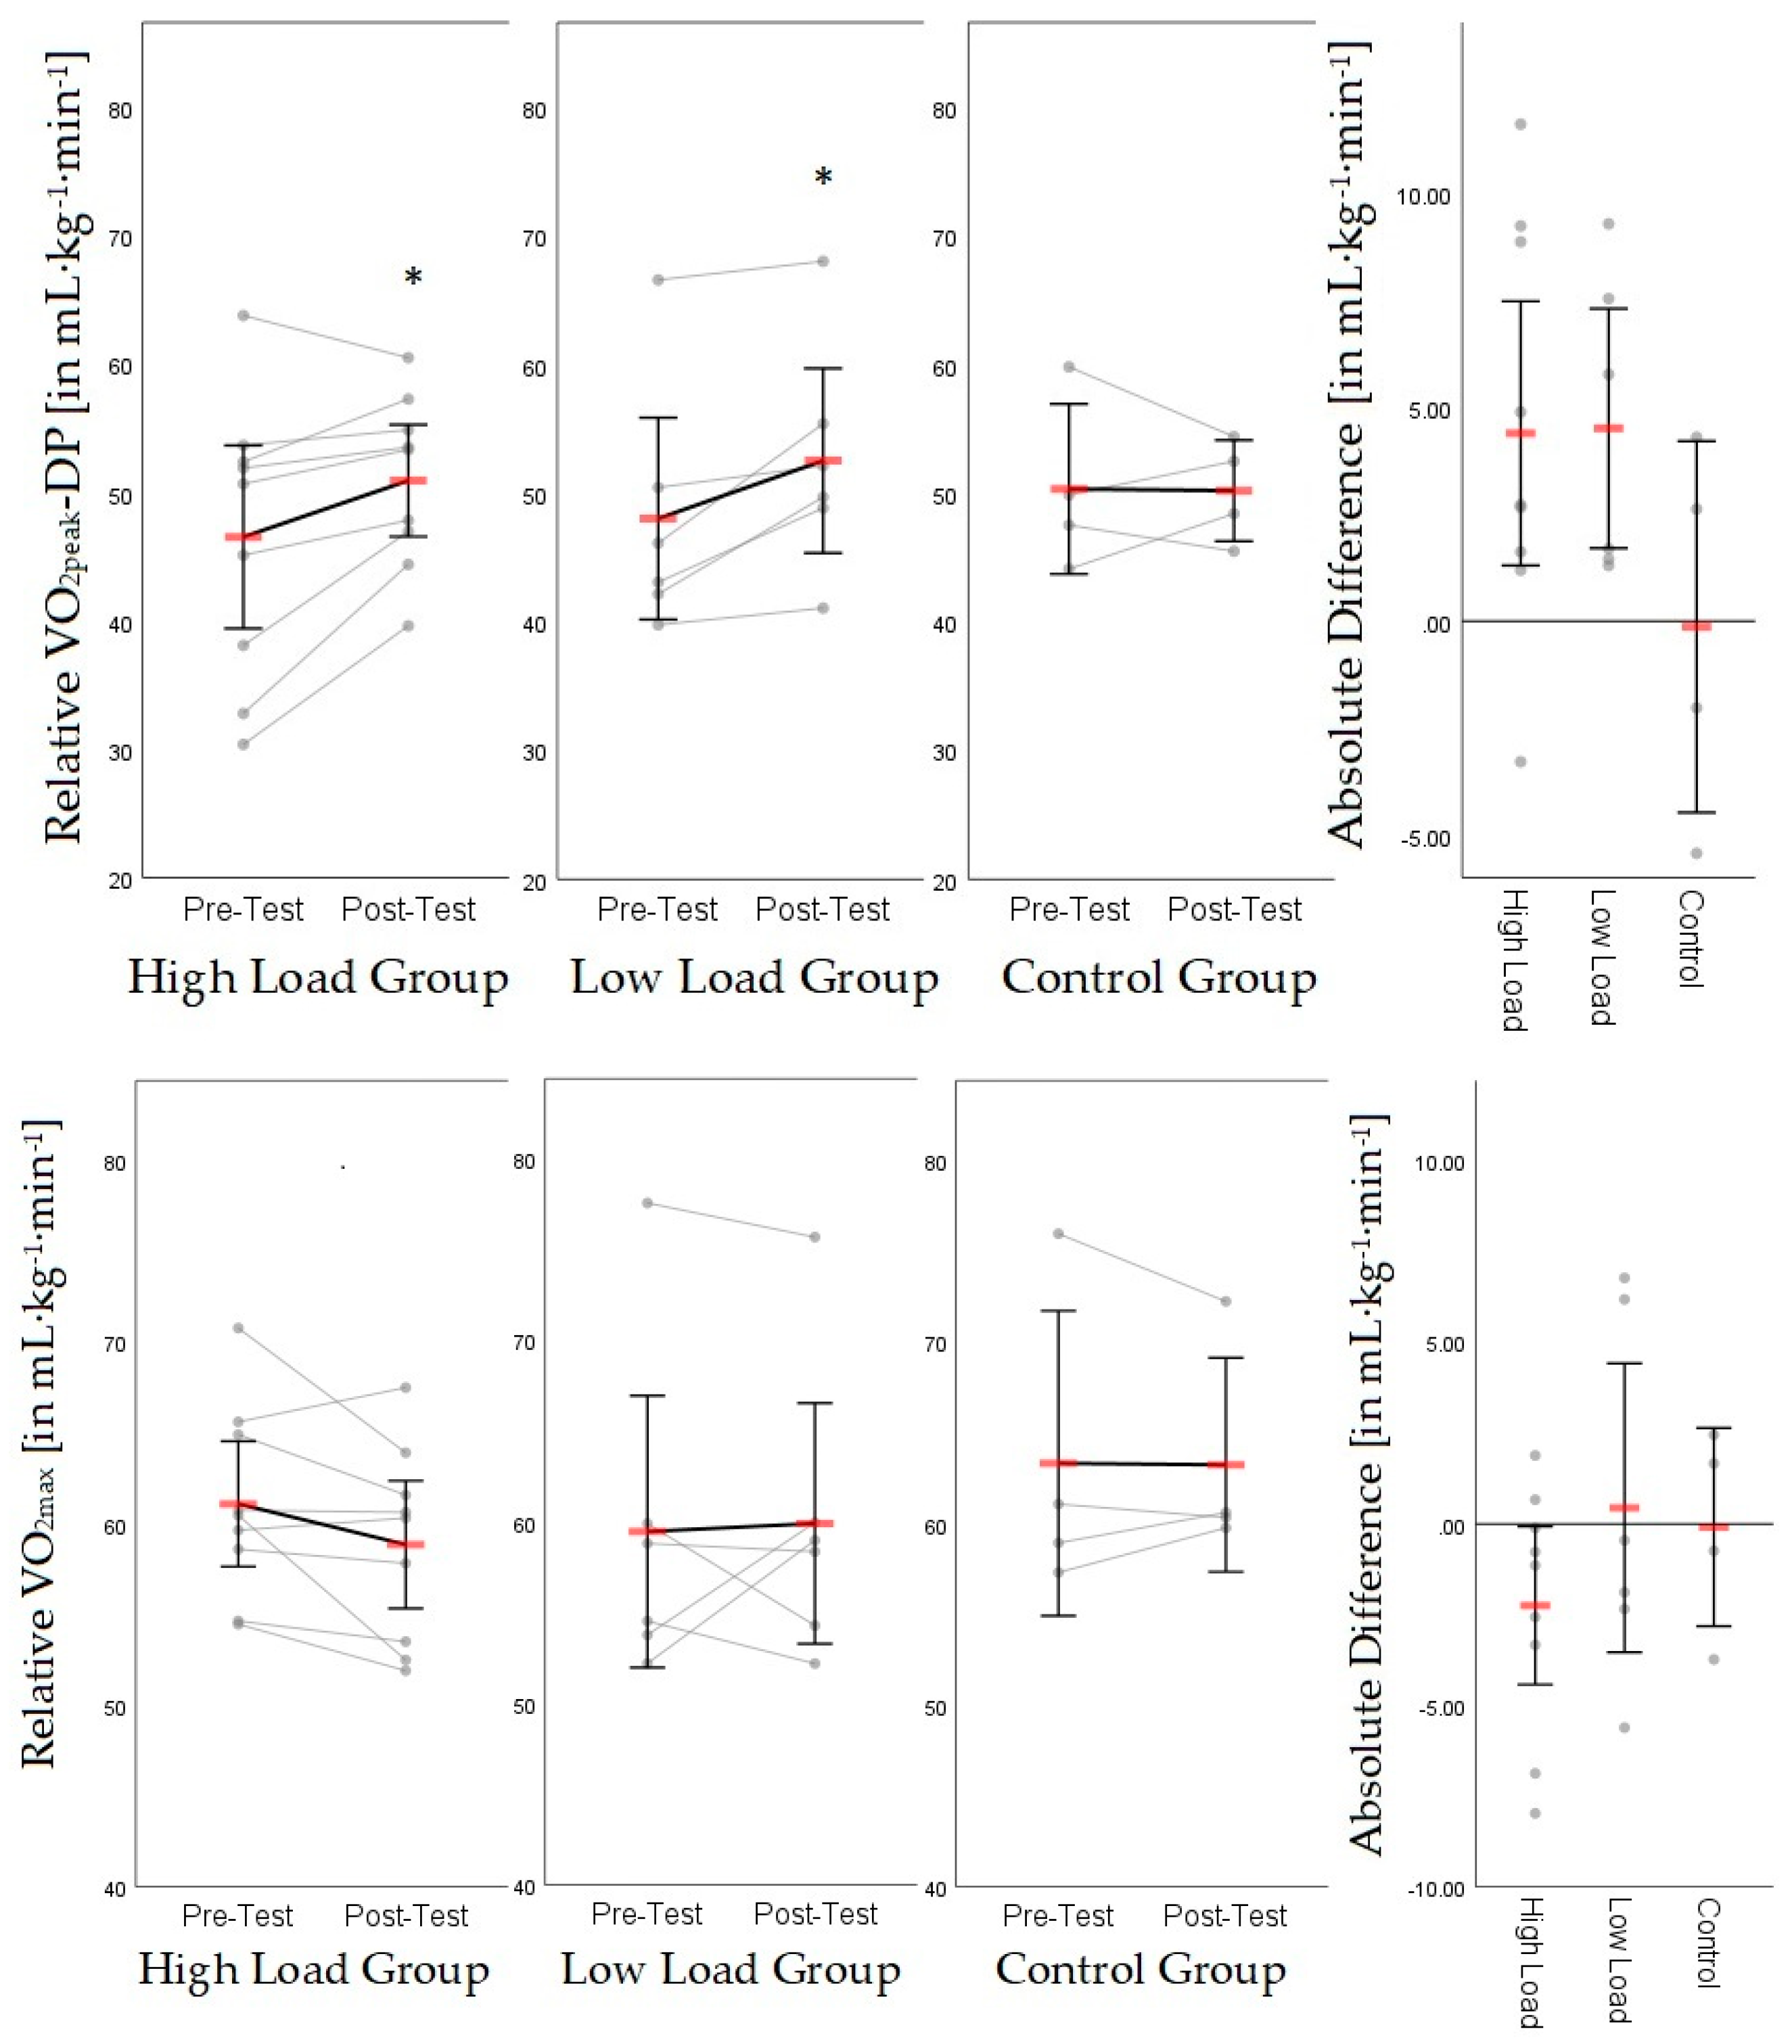
Table 1 show the results for upper-body maximal endurance and sprint measurements during the ski ergometer tests. Figure 4 illustrates mean and individual changes in VO2max and VO2peak DP within HL, LL, and CON, respectively. Figure 5 illustrates the individual responses for pre- and post-test changes summarized in two categories: high-responder (>0.5*STDpre) and low-responder (<0.5*STDpre).

3.4.1. VO2max

Results of the VO2max treadmill test showed no time effect for VO2max rel (HL: 61.1 ± 5.3–58.9 ± 5.4 mL·min−1·kg−1; LL: 59.7 ± 9.4–59.9 ± 8.3 mL·min−1·kg−1; CON: 63.4 ± 8.6–63.3 ± 6.0 mL·min−1·kg−1; p = 0.905), O2-PulseVO2max (HL: 18.9 ± 2.6–18.3 ± 2.5 VO2·HR−1; LL: 15.9 ± 5.0–16.3 ± 4.5 VO2·HR−1; CON: 17.8 ± 3.2–18.3 ± 3.2 VO2·HR−1; p = 0.735), and Vmax (HL: 11.6 ± 0.8–12.0 ± 1.3 km·h−1; LL: 11.7 ± 0.9–11.9 ± 0.9 km·h−1; CON: 12.5 ± 1.5–12.5 ± 1.1 km·h−1; p = 0.202). There were no significant interactions between time and group for any of the variables.

3.4.2. VO2peak-DP

The repeated-measures ANOVA revealed large main effects for time (i.e., pre to post) for VO2peak-DP rel (F = 7.788, p = 0.003, partial η2 = 0.327) and the ratio between VO2max and VO2peak-DP (F = 9.335, p = 0.008, partial η2 = 0.368), as well as the ratio between O2-PulseVO2max and the O2-PulseVO2peak-DP (F = 11.312, p = 0.004, partial η2 = 0.414). There were no significant interactions between time and group for both variables, respectively. The Scheffé test showed VO2peak-DP rel increased significantly in HL (46.6 ± 10.9–51.0 ± 6.7, d = −0.929, p < 0.05) and LL (48.1 ± 9.8–52.6 ± 9.0, d = −1.288, p < 0.05) but not in CON (50.4 ± 6.8–50.2 ± 4.0, d = 0.030, p < 0.05). The ratio between VO2max and VO2peak-DP increased significantly in HL (0.76 ± 0.13–0.87 ± 0.06, d = −1.055, p < 0.05) but not in LL (0.80 ± 0.07–0.87 ± 0.05) and CON (0.79 ± 0.04–0.80 ± 0.06). The ratio between O2-PulseVO2max and O2-PulseVO2peak-DP increased significantly in HL (0.78 ± 0.11–0.88 ± 0.06, d = −1.091, p < 0.05) and LL (0.82 ± 0.07–0.90 ± 0.07, d = −1.294, p < 0.05), but not in CON (0.85 ± 0.05–0.85 ± 0.07).

4. Discussion

To the best of the authors’ knowledge, this is the first study designed to investigate the effects of a volume-based (i.e., sets per exercise or muscle group) resistance training protocol on performance in well-trained endurance athletes. The primary findings of this study demonstrate that elite youth cross-country skiers improve their double-poling aerobic capacity and performance after a 10-week training intervention independent of loading, provided that sets are equated and carried out with a close proximity to momentary concentric muscle failure. Both HL and LL increased maximal dynamic strength and power, as well as aerobic capacity and power, during double-poling ergometry; however, only HL increased significantly in average power during the 15 s sprint. Group differences in traditional determinants of endurance performance were only found for changes in peak power during the double-poling peak oxygen uptake test.
Significant upper-body strength increases of 9–17% were observed in both intervention groups, aligning with previous studies showing 6–24% strength gains after 6–12 weeks resistance training in cross-country skiers [7]. HL showed superior strength gains, supporting a strength–endurance continuum and a dose–response effect of load on dynamic strength [47,54,55]. This observation warrants caution due to the presence of an outlier (a decrease in performance) in both LL and control groups, which could influence the overall interpretation of the data. The cause of this variance remains uncertain, whether it is natural variability, issues with test–retest reliability, fatigue, or learning effects. Strength gains likely resulted from both neural adaptations and hypertrophy [56,57,58,59,60], with studies indicating similar hypertrophy changes in HL and LL conditions when effort (proximity to failure) and volume (number of working sets) are equated [47,54,61], emphasizing the significance of load in maximizing dynamic strength in experienced individuals [47].
The study observed moderate to large correlations between changes in dynamic strength and changes in peak power during double-poling oxygen uptake tests. This highlights the critical role of the neuromuscular system in generating high-propelling forces for optimal double-poling performance, which aligns with prior research [4,5,6,62]. The results highlight the importance of maximum strength in improving mean power output for HL during the double-poling sprint test, with a significant increase of 12.2% (relative and absolute). In contrast, LL and CON conditions showed non-significant improvements of 7.7% (absolute) and 6.1% (relative), and 4% (absolute) and 2.2% (relative), respectively. Further investigation is warranted due to the low delta-correlations (8.5–9% explained variance) observed between sprint power and strength measures. This may indicate a need for enhanced technical efficiency through sprint-specific training to facilitate improved force production transfer into sport-specific double-poling performance.
The study observed large improvements in VO2peak-DP for both absolute terms (HL: 8.5%, LL: 9.2%) and relative terms (HL: 9.4%, LL: 9.4%), with no significant changes observed in the control group. It is worth noting that there were no alterations across the groups, aligning with prior research [7]. The change in the ratio between VO2max and VO2peak-DP highlights the distinct effect of resistance training on aerobic performance during DP, necessitating further exploration of the underlying mechanisms.
The findings align with resistance training research, highlighting hypertrophic effects across muscle fiber types and capillary adaptations in response to training duration and intensity [47,54,63,64,65,66]. These adaptations may enhance upper-body oxidative capacity [67,68], facilitating improved oxygen extraction and utilization of Type I muscle fibers, delaying the recruitment of Type II fibers [69]. Additionally, increased upper-body strength might reduce muscle activation during prolonged submaximal exercise [69,70], leading to improved perfusion conditions [8,15,16] and muscle oxygen saturation [71].
Strong correlations between resistance-training-induced strength gains (1RM) and changes in VO2peak-DP underscore the role of resistance training in mitigating peripheral limitations, explaining 23–41% of the observed variance. However, existing literature presents varying outcomes regarding the relationship between resistance training and VO2peak-DP [15,16,17,18,19,20]. While some studies reported increases in absolute terms that became non-significant when normalized for body mass [19,20], others showed no effect at all [15,16,17,18], emphasizing the need for a comprehensive understanding of contributing factors. Studies have shown that an increase in VO2peak is often accompanied by a rise in muscle-mass-related parameters such as body mass, fat-free mass, and upper-extremity circumference [19,20]. This supports the hypothesis that, up to a certain threshold, VO2peak-DP is primarily constrained by the amount of muscle mass that can be utilized to produce propulsion and/or peripheral factors within the working muscles. This limitation persists until a critical level of active muscle mass is attained. At this point, central factors, such as stroke volume, assume a more prominent role in limiting VO2peak and VO2max [24]. Therefore, the current body of evidence on the impact of resistance training on VO2peak-DP may be biased due to the focus on neuromuscular adaptations in previous studies, potentially neglecting hypertrophic or other physiological responses [15,16,17]. In this study, the somewhat lower response rate for VO2peak-DP compared to dynamic strength (Figure 5) could be attributed to potential neural adaptations resulting from resistance training, underscoring the greater impact of structural changes over neural adaptations on VO2peak-DP development.
Additionally, the performance level and gender of the investigated populations are crucial variables that need consideration. For instance, Ofsteng et al. [18] reported no significant effect of resistance training on VO2peak-DP standardized to body mass (from 68.5 ± 5.3 mL·min−1·kg−1 to 68.3 ± 5.4 mL·min−1·kg−1), despite a regimen involving three exercises for three sets in the 4 to 12 RM range. Although VO2max data were not provided, the reported values suggest a smaller ratio between VO2peak and VO2max compared to the population in this study, indicating limited potential for performance improvement by peripheral factors. This may elucidate why resistance training failed to influence VO2peak-DP despite a notable increase in upper-body lean body mass. Moreover, Carlsson et al. [20] observed significant enhancements in VO2peak-DP among female athletes but noted non-significant changes in men. Hegge et al. [28] linked gender differences in DP performance to significantly higher muscle mass in the upper body of male athletes compared to that of their female counterparts. These sex-specific nuances underscore the importance of considering the diverse physiological responses to resistance training based on sex, further contributing to the complexity of understanding its impact on VO2peak-DP.
The observed increase in VO2peak-DP corresponded to substantial improvements in peak power during the DP peak oxygen uptake test, particularly evident in the HL group (14.6% absolute; 14.8% relative) compared to LL (10.3% absolute; 8.1% relative) and CON (0.2% absolute; −1.6% relative). These outcomes align with existing studies demonstrating the positive effect of resistance training on various aspects of DP performance. The generation of high power outputs during DP is partially influenced by VO2peak, but also related to the fractional utilization of VO2peak, efficiency, and anaerobic capacity. Therefore, one possible explanation for improved DP performance could be the increased energetic flux resulting from the enhanced oxidative capacity within the working muscles, possibly supplemented by an increased maximal strength, and anaerobic capacity—assuming that there was an increase in lean body mass [72]. The significance of dynamic strength is uncertain. For instance, upper-body 1RM measurements were imprecise in distinguishing between national and world-class athletes in their capacity to generate high power outputs on DP ergometers. [1,6,73,74].
One of the limitations of the study was that participants were relatively young and included both genders, leading to a heterogeneous group. This diversity might influence the results due to variations in maturation, with younger individuals in the LL and control group potentially affecting outcomes differently compared to those in the HL group. Therefore, these findings might not be directly applicable to more homogeneous groups of elite or world-class senior athletes. Moreover, the study utilized a per-protocol design rather than intent-to-treat, due to organizational reasons. Therefore, a reduced sample size (n = 8) and varying sample size within the different groups diminished the statistical power, possibly impacting the significance levels. Additionally, the decrease in study population size during the intervention, due to illness, limited the number of participants in different groups for robust analysis, which means that a single outlier impacts the calculation. This situation underscores the inherent challenges of conducting applied research in elite sports, where such specific populations are rarely accessible. Despite these obstacles, the data collected remain valuable, providing unique insights into a group that is seldom studied, thus contributing significantly to our understanding of high-performance sports.
The study’s findings demonstrate significant improvements in VO2peak-DP among elite youth cross-country skiers following a 10-week resistance training intervention. This suggests enhanced peak aerobic capacity with potential implications for enhancing endurance performance in cross-country skiing. While both HL and LL protocols resulted in significant increases in upper-body strength, HL showed superior improvements compared to LL in strength. This indicates a dose–response relationship to load magnitude for strength development. Interestingly, these strength gains, particularly pronounced in the HL group, significantly enhanced DP performance. Thus, endurance athletes could benefit from prioritizing high-load protocols with ample volume (e.g., 20 sets per major muscle group per week) while emphasizing effort (proximity to failure) to maximize their upper-body endurance performance. However, future investigation is warranted to ascertain whether this improvement extends to DP efficiency, as observed in previous research. Examining the interplay between increased energy delivery and potential improvements in efficiency will contribute to a more comprehensive understanding of the performance adaptations resulting from resistance training.

5. Conclusions

The study demonstrates that high-volume resistance training, particularly high-load protocols, can significantly enhance upper-body strength as well as double-poling VO2peak and performance among elite youth cross-country skiers and biathletes, indicating a dose–response relationship to the load magnitude of resistance training. These findings provide valuable insights that can guide future resistance training practices which will potentially contribute to advancements in performance outcomes in cross-country skiing and biathlon.

Author Contributions

Conceptualization, C.-M.W. and M.K.; methodology, C.-M.W., T.S., S.S. and M.K.; formal analysis, C.-M.W. and D.R.; investigation, C.-M.W. and T.S.; writing—original draft preparation, C.-M.W., M.K. and Ø.S.; writing—review and editing, D.R., T.S. and S.S.; visualization, D.R. and C.-M.W.; supervision, S.S. All authors have read and agreed to the published version of the manuscript.

Funding

This research received no external funding.

Institutional Review Board Statement

The study was conducted in accordance with the Declaration of Helsinki, and approved by the local university’s institutional Ethics committee (DHGS-EK-2023-004, 25 May 2023).

Informed Consent Statement

Informed consent was obtained from all subjects involved in the study.

Data Availability Statement

The raw data supporting the conclusions of this article will be made available by the authors on request.

Acknowledgments

The authors would like to thank all participants who contributed to this study and the coaches who played a significant role in the planning and execution of this research.

Conflicts of Interest

The authors declare no conflicts of interest.

References

  1. Stoggl, T.; Lindinger, S.; Muller, E. Evaluation of an upper-body strength test for the cross-country skiing sprint. Med. Sci. Sports Exerc. 2007, 39, 1160–1169. [Google Scholar] [CrossRef]
  2. Stoggl, T.; Lindinger, S.; Muller, E. Analysis of a simulated sprint competition in classical cross country skiing. Scand. J. Med. Sci. Sports 2007, 17, 362–372. [Google Scholar] [CrossRef]
  3. Bojsen-Moller, J.; Losnegard, T.; Kemppainen, J.; Viljanen, T.; Kalliokoski, K.K.; Hallen, J. Muscle use during double poling evaluated by positron emission tomography. J. Appl. Physiol. 2010, 109, 1895–1903. [Google Scholar] [CrossRef]
  4. Holmberg, H.C.; Lindinger, S.; Stoggl, T.; Eitzlmair, E.; Muller, E. Biomechanical analysis of double poling in elite cross-country skiers. Med. Sci. Sports Exerc. 2005, 37, 807–818. [Google Scholar] [CrossRef]
  5. Holmberg, H.-C. The Physiology of Cross-Country Skiing: With Special Emphasis on the Role of the Upper Body; Department of Physiology and Pharmacology: Stockholm, Sweden, 2005. [Google Scholar]
  6. Stöggl, T.; Müller, E.; Ainegren, M.; Holmberg, H.-C. General strength and kinetics: Fundamental to sprinting faster in cross country skiing? Scand. J. Med. Sci. Sports 2011, 21, 791–803. [Google Scholar] [CrossRef]
  7. Stöggl, T.; Holmberg, H.-C. A Systematic Review of the Effects of Strength and Power Training on Performance in Cross-Country Skiers. J. Sports Sci. Med. 2022, 21, 555–579. [Google Scholar] [CrossRef]
  8. Sunde, A.; Johansen, J.M.; Gjora, M.; Paulsen, G.; Braten, M.; Helgerud, J.; Storen, O. Stronger Is Better: The Impact of Upper Body Strength in Double Poling Performance. Front. Physiol. 2019, 10, 1091. [Google Scholar] [CrossRef]
  9. Staib, J.L.; Im, J.; Caldwell, Z.; Rundell, K.W. Cross-Country Ski Racing Performance Predicted by Aerobic and Anaerobic Double Poling Power. J. Strength Cond. Res. 2000, 14, 282–288. [Google Scholar]
  10. Losnegard, T.; Mikkelsen, K.; Ronnestad, B.R.; Hallen, J.; Rud, B.; Raastad, T. The effect of heavy strength training on muscle mass and physical performance in elite cross country skiers. Scand. J. Med. Sci. Sports 2011, 21, 389–401. [Google Scholar] [CrossRef]
  11. Mahood, N.V.; Kenefick, R.W.; Kertzer, R.; Quinn, T.J. Physiological determinants of cross-country ski racing performance. Med. Sci. Sports Exerc. 2001, 33, 1379–1384. [Google Scholar] [CrossRef]
  12. Sandbakk, O.; Ettema, G.; Leirdal, S.; Jakobsen, V.; Holmberg, H.C. Analysis of a sprint ski race and associated laboratory determinants of world-class performance. Eur. J. Appl. Physiol. 2011, 111, 947–957. [Google Scholar] [CrossRef]
  13. Sandbakk, O.; Losnegard, T.; Skattebo, O.; Hegge, A.M.; Tonnessen, E.; Kocbach, J. Analysis of Classical Time-Trial Performance and Technique-Specific Physiological Determinants in Elite Female Cross-Country Skiers. Front. Physiol. 2016, 7, 326. [Google Scholar] [CrossRef]
  14. Carlsson, M.; Carlsson, T.; Knutsson, M.; Malm, C.; Tonkonogi, M. Oxygen uptake at different intensities and sub-techniques predicts sprint performance in elite male cross-country skiers. Eur. J. Appl. Physiol. 2014, 114, 2587–2595. [Google Scholar] [CrossRef]
  15. Hoff, J.; Helgerud, J.; Wisloff, U. Maximal strength training improves work economy in trained female cross-country skiers. Med. Sci. Sports Exerc. 1999, 31, 870–877. [Google Scholar] [CrossRef]
  16. Hoff, J.; Gran, A.; Helgerud, J. Maximal strength training improves aerobic endurance performance. Scand. J. Med. Sci. Sports 2002, 12, 288–295. [Google Scholar] [CrossRef]
  17. Osteras, H.; Helgerud, J.; Hoff, J. Maximal strength-training effects on force-velocity and force-power relationships explain increases in aerobic performance in humans. Eur. J. Appl. Physiol. 2002, 88, 255–263. [Google Scholar] [CrossRef]
  18. Ofsteng, S.; Sandbakk, O.; van Beekvelt, M.; Hammarstrom, D.; Kristoffersen, R.; Hansen, J.; Paulsen, G.; Ronnestad, B.R. Strength training improves double-poling performance after prolonged submaximal exercise in cross-country skiers. Scand. J. Med. Sci. Sports 2018, 28, 893–904. [Google Scholar] [CrossRef]
  19. Skattebo, O.; Hallen, J.; Ronnestad, B.R.; Losnegard, T. Upper body heavy strength training does not affect performance in junior female cross-country skiers. Scand. J. Med. Sci. Sports 2016, 26, 1007–1016. [Google Scholar] [CrossRef]
  20. Carlsson, T.; Wedholm, L.; Nilsson, J.; Carlsson, M. The effects of strength training versus ski-ergometer training on double-poling capacity of elite junior cross-country skiers. Eur. J. Appl. Physiol. 2017, 117, 1523–1532. [Google Scholar] [CrossRef]
  21. Nesser, T.W.; Chen, S.; Serfass, R.C.; Gaskill, S.E. Development of upper body power in junior cross-country skiers. J. Strength Cond. Res. 2004, 18, 63–71. [Google Scholar] [CrossRef]
  22. Astrand, P.O.; Saltin, B. Maximal oxygen uptake and heart rate in various types of muscular activity. J. Appl. Physiol. 1961, 16, 977–981. [Google Scholar] [CrossRef] [PubMed]
  23. Larsen, R.T.; Christensen, J.; Tang, L.H.; Keller, C.; Doherty, P.; Zwisler, A.D.; Taylor, R.S.; Langberg, H. A Systematic Review and Meta-Analysis Comparing Cardiopulmonary Exercise Test Values Obtained from the Arm Cycle and the Leg Cycle Respectively in Healthy Adults. Int. J. Sports Phys. Ther. 2016, 11, 1006–1039. [Google Scholar] [PubMed]
  24. Shephard, R.J.; Bouhlel, E.; Vandewalle, H.; Monod, H. Muscle mass as a factor limiting physical work. J. Appl. Physiol. 1988, 64, 1472–1479. [Google Scholar] [CrossRef] [PubMed]
  25. Holmberg, H.C.; Lindinger, S.; Stoggl, T.; Bjorklund, G.; Muller, E. Contribution of the legs to double-poling performance in elite cross-country skiers. Med. Sci. Sports Exerc. 2006, 38, 1853–1860. [Google Scholar] [CrossRef] [PubMed]
  26. Holmberg, H.C.; Rosdahl, H.; Svedenhag, J. Lung function, arterial saturation and oxygen uptake in elite cross country skiers: Influence of exercise mode. Scand. J. Med. Sci. Sports 2007, 17, 437–444. [Google Scholar] [CrossRef] [PubMed]
  27. Stoggl, T.; Ohtonen, O.; Takeda, M.; Miyamoto, N.; Snyder, C.; Lemmettyla, T.; Linnamo, V.; Lindinger, S.J. Comparison of Exclusive Double Poling to Classic Techniques of Cross-country Skiing. Med. Sci. Sports Exerc. 2019, 51, 760–772. [Google Scholar] [CrossRef] [PubMed]
  28. Hegge, A.M.; Bucher, E.; Ettema, G.; Faude, O.; Holmberg, H.C.; Sandbakk, O. Gender differences in power production, energetic capacity and efficiency of elite crosscountry skiers during wholebody, upperbody, and arm poling. Eur. J. Appl. Physiol. 2016, 116, 291–300. [Google Scholar] [CrossRef] [PubMed]
  29. Aagaard, P.; Mayer, F. Neuronal adaptation to strength training. Dtsch. Z. Fur Sportmed. 2007, 58, 50–53. [Google Scholar]
  30. Almasbakk, B.; Hoff, J. Coordination, the determinant of velocity specificity? J. Appl. Physiol. 1996, 81, 2046–2052. [Google Scholar] [CrossRef]
  31. Behm, D.G. Neuromuscular Implications and Applications of Resistance Training. J. Strength Cond. Res. 1995, 9, 264–274. [Google Scholar]
  32. Sale, D.G. Neural adaptation to resistance training. Med. Sci. Sports Exerc. 1988, 20, S135–S145. [Google Scholar] [CrossRef] [PubMed]
  33. Osteras, S.; Welde, B.; Danielsen, J.; van den Tillaar, R.; Ettema, G.; Sandbakk, O. Contribution of Upper-Body Strength, Body Composition, and Maximal Oxygen Uptake to Predict Double Poling Power and Overall Performance in Female Cross-Country Skiers. J. Strength Cond. Res. 2016, 30, 2557–2564. [Google Scholar] [CrossRef]
  34. Stoggl, T.; Enqvist, J.; Muller, E.; Holmberg, H.C. Relationships between body composition, body dimensions, and peak speed in cross-country sprint skiing. J. Sports Sci. 2010, 28, 161–169. [Google Scholar] [CrossRef] [PubMed]
  35. Ronnestad, B.R.; Kojedal, O.; Losnegard, T.; Kvamme, B.; Raastad, T. Effect of heavy strength training on muscle thickness, strength, jump performance, and endurance performance in well-trained Nordic Combined athletes. Eur. J. Appl. Physiol. 2012, 112, 2341–2352. [Google Scholar] [CrossRef] [PubMed]
  36. Krieger, J.W. Single vs. multiple sets of resistance exercise for muscle hypertrophy: A meta-analysis. J. Strength Cond. Res. 2010, 24, 1150–1159. [Google Scholar] [CrossRef] [PubMed]
  37. Schoenfeld, B.J.; Ogborn, D.; Krieger, J.W. Dose-response relationship between weekly resistance training volume and increases in muscle mass: A systematic review and meta-analysis. J. Sports Sci. 2017, 35, 1073–1082. [Google Scholar] [CrossRef] [PubMed]
  38. McKay, A.K.A.; Stellingwerff, T.; Smith, E.S.; Martin, D.T.; Mujika, I.; Goosey-Tolfrey, V.L.; Sheppard, J.; Burke, L.M. Defining Training and Performance Caliber: A Participant Classification Framework. Int. J. Sports Physiol. Perform. 2022, 17, 317–331. [Google Scholar] [CrossRef] [PubMed]
  39. Lorenz, D.S.; Reiman, M.P.; Lehecka, B.J.; Naylor, A. What performance characteristics determine elite versus nonelite athletes in the same sport? Sports Health 2013, 5, 542–547. [Google Scholar] [CrossRef] [PubMed]
  40. Haff, G.; Triplett, N.T. Essentials of Strength Training and Conditioning, 4th ed.; Human Kinetics: Champaign, IL, USA, 2016. [Google Scholar]
  41. Schoenfeld, B.J.; Contreras, B.; Vigotsky, A.D.; Peterson, M. Differential Effects of Heavy Versus Moderate Loads on Measures of Strength and Hypertrophy in Resistance-Trained Men. J. Sports Sci. Med. 2016, 15, 715–722. [Google Scholar]
  42. Akca, F. Prediction of rowing ergometer performance from functional anaerobic power, strength and anthropometric components. J. Hum. Kinet. 2014, 41, 133–142. [Google Scholar] [CrossRef]
  43. Faiss, R.; Willis, S.; Born, D.P.; Sperlich, B.; Vesin, J.M.; Holmberg, H.C.; Millet, G.P. Repeated double-poling sprint training in hypoxia by competitive cross-country skiers. Med. Sci. Sports Exerc. 2015, 47, 809–817. [Google Scholar] [CrossRef] [PubMed]
  44. Kuipers, H.; Verstappen, F.T.; Keizer, H.A.; Geurten, P.; van Kranenburg, G. Variability of aerobic performance in the laboratory and its physiologic correlates. Int. J. Sports Med. 1985, 6, 197–201. [Google Scholar] [CrossRef] [PubMed]
  45. Alsobrook, N.G.; Heil, D.P. Upper body power as a determinant of classical cross-country ski performance. Eur. J. Appl. Physiol. 2009, 105, 633–641. [Google Scholar] [CrossRef] [PubMed]
  46. Plotkin, D.; Coleman, M.; Van Every, D.; Maldonado, J.; Oberlin, D.; Israetel, M.; Feather, J.; Alto, A.; Vigotsky, A.D.; Schoenfeld, B.J. Progressive overload without progressing load? The effects of load or repetition progression on muscular adaptations. PeerJ 2022, 10, e14142. [Google Scholar] [CrossRef] [PubMed]
  47. Schoenfeld, B.J.; Grgic, J.; Ogborn, D.; Krieger, J.W. Strength and Hypertrophy Adaptations Between Low- vs. High-Load Resistance Training: A Systematic Review and Meta-analysis. J. Strength Cond. Res. 2017, 31, 3508–3523. [Google Scholar] [CrossRef] [PubMed]
  48. Behm, D.G.; Sale, D.G. Velocity specificity of resistance training. Sports Med. 1993, 15, 374–388. [Google Scholar] [CrossRef] [PubMed]
  49. Schmidtbleicher, D. Training for power events. In Strength and Power in Sport; Komi, P., Ed.; Blackwell Scientific Publications: Oxford, UK, 1992; pp. 381–395. [Google Scholar]
  50. Hoff, J.; Almåsbakk, B. The Effects of Maximum Strength Training on Throwing Velocity and Muscle Strength in Female Team-Handball Players. J. Strength Cond. Res. 1995, 9, 255–258. [Google Scholar]
  51. Loffing, F. Raw Data Visualization for Common Factorial Designs Using SPSS: A Syntax Collection and Tutorial. Front. Psychol. 2022, 13, 808469. [Google Scholar] [CrossRef] [PubMed]
  52. Cohen, J. Statistical Power Analysis for the Behavioral Sciences, 2nd ed.; Lawrence Erlbaum Associates: New York, NY, USA, 2013. [Google Scholar]
  53. Hopkins, W.G. How to interpret changes in an athletic performance test. Sportscience 2004, 8, 1–7. [Google Scholar]
  54. Campos, G.E.; Luecke, T.J.; Wendeln, H.K.; Toma, K.; Hagerman, F.C.; Murray, T.F.; Ragg, K.E.; Ratamess, N.A.; Kraemer, W.J.; Staron, R.S. Muscular adaptations in response to three different resistance-training regimens: Specificity of repetition maximum training zones. Eur. J. Appl. Physiol. 2002, 88, 50–60. [Google Scholar] [CrossRef]
  55. Weiss, L.W.; Conex, H.D.; Clark, F.C. Differential Functional Adaptations to Short-Term Low-, Moderate-, and High-Repetition Weight Training. J. Strength Cond. Res. 1999, 13, 236–241. [Google Scholar]
  56. Gabriel, D.A.; Kamen, G.; Frost, G. Neural adaptations to resistive exercise: Mechanisms and recommendations for training practices. Sports Med. 2006, 36, 133–149. [Google Scholar] [CrossRef] [PubMed]
  57. Erskine, R.M.; Fletcher, G.; Folland, J.P. The contribution of muscle hypertrophy to strength changes following resistance training. Eur. J. Appl. Physiol. 2014, 114, 1239–1249. [Google Scholar] [CrossRef] [PubMed]
  58. Bamman, M.M.; Newcomer, B.R.; Larson-Meyer, D.E.; Weinsier, R.L.; Hunter, G.R. Evaluation of the strength-size relationship in vivo using various muscle size indices. Med. Sci. Sports Exerc. 2000, 32, 1307–1313. [Google Scholar] [CrossRef] [PubMed]
  59. Moritani, T.; deVries, H.A. Neural factors versus hypertrophy in the time course of muscle strength gain. Am. J. Phys. Med. 1979, 58, 115–130. [Google Scholar] [PubMed]
  60. Folland, J.P.; Williams, A.G. The adaptations to strength training: Morphological and neurological contributions to increased strength. Sports Med. 2007, 37, 145–168. [Google Scholar] [CrossRef] [PubMed]
  61. Schoenfeld, B.J.; Peterson, M.D.; Ogborn, D.; Contreras, B.; Sonmez, G.T. Effects of Low- vs. High-Load Resistance Training on Muscle Strength and Hypertrophy in Well-Trained Men. J. Strength Cond. Res. 2015, 29, 2954–2963. [Google Scholar] [CrossRef]
  62. Lindinger, S.J.; Stoggl, T.; Muller, E.; Holmberg, H.C. Control of speed during the double poling technique performed by elite cross-country skiers. Med. Sci. Sports Exerc. 2009, 41, 210–220. [Google Scholar] [CrossRef] [PubMed]
  63. Kraemer, W.J.; Patton, J.F.; Gordon, S.E.; Harman, E.A.; Deschenes, M.R.; Reynolds, K.; Newton, R.U.; Triplett, N.T.; Dziados, J.E. Compatibility of high-intensity strength and endurance training on hormonal and skeletal muscle adaptations. J. Appl. Physiol. 1995, 78, 976–989. [Google Scholar] [CrossRef]
  64. Green, H.; Goreham, C.; Ouyang, J.; Ball-Burnett, M.; Ranney, D. Regulation of fiber size, oxidative potential, and capillarization in human muscle by resistance exercise. Am. J. Physiol. 1999, 276, R591–R596. [Google Scholar] [CrossRef]
  65. Hepple, R.T.; Mackinnon, S.L.; Thomas, S.G.; Goodman, J.M.; Plyley, M.J. Quantitating the capillary supply and the response to resistance training in older men. Pflügers Archiv. 1997, 433, 238–244. [Google Scholar] [CrossRef] [PubMed]
  66. McCall, G.E.; Byrnes, W.C.; Dickinson, A.; Pattany, P.M.; Fleck, S.J. Muscle fiber hypertrophy, hyperplasia, and capillary density in college men after resistance training. J. Appl. Physiol. 1996, 81, 2004–2012. [Google Scholar] [CrossRef] [PubMed]
  67. Calbet, J.A.; Holmberg, H.C.; Rosdahl, H.; van Hall, G.; Jensen-Urstad, M.; Saltin, B. Why do arms extract less oxygen than legs during exercise? Am. J. Physiol. Regul. Integr. Comp. Physiol. 2005, 289, R1448–R1458. [Google Scholar] [CrossRef] [PubMed]
  68. Calbet, J.A.; Jensen-Urstad, M.; van Hall, G.; Holmberg, H.C.; Rosdahl, H.; Saltin, B. Maximal muscular vascular conductances during whole body upright exercise in humans. J. Physiol. 2004, 558, 319–331. [Google Scholar] [CrossRef] [PubMed]
  69. Trowell, D.; Vicenzino, B.; Saunders, N.; Fox, A.; Bonacci, J. Effect of Strength Training on Biomechanical and Neuromuscular Variables in Distance Runners: A Systematic Review and Meta-Analysis. Sports Med. 2020, 50, 133–150. [Google Scholar] [CrossRef] [PubMed]
  70. Hausswirth, C.; Argentin, S.; Bieuzen, F.; Le Meur, Y.; Couturier, A.; Brisswalter, J. Endurance and strength training effects on physiological and muscular parameters during prolonged cycling. J. Electromyogr. Kinesiol. 2010, 20, 330–339. [Google Scholar] [CrossRef]
  71. Usaj, A.; Jereb, B.; Robi, P.; von Duvillard, S.P. The influence of strength-endurance training on the oxygenation of isometrically contracted forearm muscles. Eur. J. Appl. Physiol. 2007, 100, 685–692. [Google Scholar] [CrossRef] [PubMed]
  72. Bangsbo, J.; Michalsik, L.; Petersen, A. Accumulated O2 deficit during intense exercise and muscle characteristics of elite athletes. Int. J. Sports Med. 1993, 14, 207–213. [Google Scholar] [CrossRef]
  73. Hebert-Losier, K.; Zinner, C.; Platt, S.; Stoggl, T.; Holmberg, H.C. Factors that Influence the Performance of Elite Sprint Cross-Country Skiers. Sports Med. 2017, 47, 319–342. [Google Scholar] [CrossRef]
  74. Sandbakk, O.; Holmberg, H.C.; Leirdal, S.; Ettema, G. The physiology of world-class sprint skiers. Scand. J. Med. Sci. Sports 2011, 21, e9–e16. [Google Scholar] [CrossRef]
Figure 1. A schematic overview of the experimental protocol.
Applsci 14 02774 g001
Figure 2. Individual data points for 1RM Bench Press and 1RM Bench Pull standardized to body mass before (pre-test) and after the intervention period (post-test) for HL, LL, and CON. The absolute difference indicates Δ changes in maximum strength during the interventional period. The data points in bold and black with red crossbars represent mean values for each data set. * Larger than at pre (p < 0.05). # Different from CG at post (p < 0.05). % Different from LL at post (p < 0.05).
Applsci 14 02774 g002
Figure 3. Correlations between changes in 1RM and VO2peak, as well as DPPpeak and DPP15s including all participants within the study. R-values interpreted as follows: <0.1, trivial; 0.1–0.3, small; 0.3–0.5, moderate; 0.5–0.7, large; 0.7–0.9, very large; 0.9, nearly perfect; 1.0, perfect. Dashed lines represent 95%CI. * p < 0.05. ** p < 0.01.
Applsci 14 02774 g003
Figure 4. Individual data points for VO2max and VO2peak-DP standardized to body mass before (pre-test) and after the intervention period (post-test) for HL, LL, and CON. The absolute difference indicates Δ changes in oxygen uptake during the interventional period. The data points in bold and black with red crossbars represent mean values for each data set. * Larger than at pre (p < 0.05).
Applsci 14 02774 g004
Figure 5. Smallest worthwhile change: individual responses for pre- to post-test changes summarized in two categories: high-responder (dark gray), >0.5*STDpre; and low-responder (light gray), <0.5*STDpre.
Applsci 14 02774 g005
Table 1. Upper-body maximal strength, endurance capacity, performance, and physiological indices at pre- and post-intervention in 19 well-trained xc-skiing and biathlon athletes, presented as mean ± SD (CI).
VariableGroupBaseline (T1)Post-Test (T2)Effect Sizes (d)Time EffectInteraction
Effect
1 RM Bench Pull (kg)HL
(n = 9)
48.8 ± 6.3
(43.9–53.6)
55.8 ± 7.5
(50.1–61.6)
−2.416 *F = 15.464
p = 0.001
η2 = 0.491
F = 3.485
p = 0.055
η2 = 0.303
LL (n = 6)36.7 ± 7.4
(28.9–44.4)
42.5 ± 8.7
(33.4–51.6)
−0.998 *
CG (n = 4)47.5 ± 10.2
(31.3–63.7)
47.5 ± 9.8
(31.9–63.1)
0.000
1RM Bench Press (kg)HL
(n = 9)
43.1 ± 7.2
(37.6–48.6)
48.9 ± 8.9
(42.0–55.8)
−2.694 *%#F = 30.635
p < 0.001
η2 = 0.657
F = 5.456
p = 0.016
η2 = 0.405
LL (n = 6)32.9 ± 8.7
(23.8–42.1)
35.8 ± 8.3
(27.1–44.6)
−0.998 *
CG (n = 4)37.5 ± 11.6
(19.1–55.9)
38.8 ± 10.3
(22.4–55.2)
−0.500
VO2peak-DP
(mL·min−1)
HL
(n = 9)
2790 ± 485
(2417–3163)
3028 ± 398
(2723–3334)
−1.182 *F = 12.597
p = 0.003
η2 = 0.441
F = 1.716
p = 0.211
η2 = 0.177
LL (n = 6)2651 ± 778
(1835–3467)
2894 ± 719
(2139–3649)
−1.209 *
CG (n = 4)2834 ± 479
(2071–3596)
2866 ± 325
(2348–3384)
−0.171
O2-PulseVO2peak-DP (VO2·HR−1)HL
(n = 9)
14.8 ± 2.6
(12.8–16.8)
16.1 ± 2.4
(14.3–17.9)
−1.202 *F = 14.484
p = 0.002
η2 = 0.475
F = 1.351
p = 0.287
η2 = 0.144
LL (n = 6)13.3 ± 5.1
(8.0–18.6)
14.9 ± 4.7
(10.0–19.9)
−1.111 *
CG (n = 4)15.1 ± 3.3
(9.9–20.3)
15.5 ± 2.4
(11.6–19.3)
−0.392
DPPPEAK (W)HL
(n = 9)
143.9 ± 14.8
(132.5–155.2)
165.0 ± 13.5
(154.6–175.4)
−1.638 *%#F = 16.982
p < 0.001
η2 = 0.515

Greenhouse-Geisser
F = 4.730
p = 0.024
η2 = 0.372

LL (n = 6)122.5 ± 32.1
(88.9–156.1)
135.2 ± 39.3
(94.0–176.4)
−1.425 *#
CG (n = 4)143.3 ± 43.6
(73.8–212.7)
143.5 ± 33.8
(89.7–197.3)
−0.023
DPPPEAK (W·kg−1)HL
(n = 9)
2.43 ± 0.38
(2.13–2.72)
2.78 ± 0.32
(2.54–3.03)
−1.695 *%#F = 11.805
p = 0.003
η2 = 0.425

Greenhouse-Geisser
F = 5.483
p = 0.015
η2 = 0.407

LL (n = 6)2.31 ± 0.35
(1.94–2.67)
2.49 ± 0.48
(1.99–2.99)
−1.223 #
CG (n = 4)2.53 ± 0.66
(1.49–3.58)
2.49 ± 0.42
(1.82–3.16)
0.163
DPP15s (W)HL
(n = 9)
217.1 ± 32.0
(192.5–241.7)
243.7 ± 36.7
(215.5–271.9)
−1.029 *F = 11.815
p = 0.003
η2 = 0.425
F = 1.493
p = 0.254
η2 = 0.157
LL (n = 6)183.2 ± 58.6
(121.7–244.6)
197.3 ± 59.0
(135.5–259.2)
−1.216
CG (n = 4)202.0 ± 58.7
(108.6–295.4)
210.0 ± 55.5
(121.8–298.2)
−1.494
DPP15s (W·kg−1)HL
(n = 9)
3.63 ± 0.41
(3.32–3.94)
4.07 ± 0.36
(3.80–4.35)
−0.9321 *F = 7.411
p = 0.015
η2 = 0.317
F = 1.562
p = 0.240
η2 = 0.163
LL (n = 6)3.44 ± 0.69
(2.71–4.16)
3.65 ± 0.74
(2.87–4.42)
−0.871
CG (n = 4)3.57 ± 0.87
(2.18–4.96)
3.65 ± 0.74
(2.48–4.82)
−0.450
1RM, one-repetition maximum; VO2peak-DP, peak oxygen uptake during double-poling ergometry; O2pulseVO2peak-DP, peak oxygen pulse during double-poling ergometry; DPPpeak, peak power during double-poling ergometry; DPP15s, mean power during 15 s double-poling ergometer sprint. * Larger than at pre (p < 0.05). # Different from CG at post (p < 0.05). % Different from LL at post (p < 0.05).
Disclaimer/Publisher’s Note: The statements, opinions and data contained in all publications are solely those of the individual author(s) and contributor(s) and not of MDPI and/or the editor(s). MDPI and/or the editor(s) disclaim responsibility for any injury to people or property resulting from any ideas, methods, instructions or products referred to in the content.

