Abstract
This paper describes the numerical modeling and simulation of the wind effects on an ore reclaimer structure using analytical and numerical methods. The physical model is a large machine with a height of 34 m and a width of 77 m, and due to its complexity, a simplified model was used. This study aims to investigate the influence of wind speed on the stability failure of the reclaimer and to provide a more efficient and precise stopping criterion. The simulations were performed using a two-way FSI (fluid–structure interaction) approach. An FSI analysis was performed to study the dynamic behavior of a numerical model consisting of two separate parts with contact constraints. This article also highlights the importance of FSI in improving the reliability of the stability failure. Finally, the numerical results showed differences compared to the analytical model, and the wind load limit to stability failure was observed at higher wind speeds. The structure was able to support wind velocities higher than suggested by the FEM (European Materials Handling Federation) standard without stability fails.
1. Introduction
Mining reclaimer equipment is widely employed in the mining industry for the efficient transportation of materials. These machines, which were extensively used in the past, were designed to handle the retrieval and transportation of bulk materials such as ores, coal, and other minerals. The primary purpose of a mining reclaimer is to gather and load materials from stockpiles onto conveyors or trucks for further processing or transportation. The mining reclaimer typically consists of a large boom equipped with a bucket or blade that can be raised, lowered, and rotated. This configuration allows the equipment operator to excavate materials from a stockpile in a controlled manner. The reclaimed materials are then deposited onto a conveyor system or loaded directly onto trucks for transport to processing plants or distribution centers [1].
These reclaimers are known for their high productivity and efficiency, as they can handle large volumes of material in a short period. They are usually equipped with advanced control systems and sensors to optimize the material retrieval process and ensure precise placement on conveyors or trucks.
Crosswind stability of large equipment has long been a key aspect to be assessed. Wind tunnel tests have been widely applied in aerodynamic studies due to some unique advantages [2]. Some examples of the use of wind tunnels to optimize the geometry of equipment to obtain a more efficient operation can be found in the literature. Andersen [3] assessed the influence of wind forces on a container ship geometry inside a 1:450-scale wind tunnel. Kääriaä et al. [4] evaluated the potential advantages of some aerodynamic effects on a model-scale generic ship using a wind tunnel.
The development and advancement of computers have increased the use of numerical techniques, which have been used to complement the experimental analyses carried out in wind tunnels. Computational fluid dynamics (CFD) solves the governing transport equations for the fluid flow, offering a predictive methodology to evaluate the behavior of the structures. The combined use of multiple-body dynamics (MDB) and CFD techniques allows for reducing the differences found in the solution when the dynamic effects are neglected. By taking into account the turbulence and dynamic excitation effects on the bodies, better experimental approximation results can be achieved [5].
Advanced numerical methods and CFD equations can be used to forecast the aerodynamic action forces on structures [6,7,8,9,10]. The authors predicted the aerodynamic forces on distinct structures, based on the pressure fields numerically obtained, allowing the optimization of the geometry regarding the wind loads. However, they disregarded the effects of the dynamics of the structures, which can be considered using the coupling of CFD and finite element analysis (FEA) into fluid–structure interaction (FSI) techniques. Cardiff et al. [11] developed software coupling CFD, FEA, and MBD techniques, based on the free and open-source CFD software OpenFOAM v10. The authors compared seven simple coupling tests with commercial codes such as Abaqus and Comsol, obtaining differences lower than 1%. The software was called Solids4FOAM 2.1 and it was also used in other works [12,13].
The FSI analysis can detect oscillatory phenomena that can cause structure instabilities, such as the effect known as flutter, which causes an increase in the stress and displacements of the structure excited by a fluid if a critical velocity is achieved. Therefore, the displacements experienced by the structure may be higher than the static displacements, leading it to fail at low wind speeds. This effect has the potential to be significantly harmful and it is very important to evaluate the structure stability, which can only be studied in FSI analyses.
Several works in the literature used FSI to evaluate the effect of the flow in structures. Ali and Kim [14], Elsherif et al. [15], and [16] evaluated the structural resistance and energy produced by wind turbines using FSI techniques. The effect of the geometry and wind direction was assessed. The modeling of the turbulence played an important role in the results obtained. The effect of fluid properties on the frequencies of cylindrical vibrating rods was assessed by [17]. For a fixed-rod configuration, the authors performed FSI simulations with different fluids to cover a wide range of the properties of the modal parameters. FSI analyses have been widely used to evaluate the stability and the effect of the wind on structures. Unsteady FSI on downwind sails was studied by [18]. The objective of the paper was to predict propulsive force and sail dynamic stability. The stability and nonlinear dynamics of shock absorber vehicle valves were assessed by [19]. The effect of the crosswind on cooling towers was evaluated by [20,21] using FSI. Rigid and flexible structures were investigated by [22]. The authors performed FSI simulations of turbulent wind gusts hitting the structures. The test case was a rigid and membranous hemisphere impacted by different wind gusts.
The FSI analysis could provide exclusive results like the flutter effect and structural vibration modes provoked by fluid forces. Testing the main modal response of a force-based frame structure, [23] proposed a methodology in which the numerical method coupling was carried out by a geometric interface between the fluid and solid domains, using different positions of the solid model in the fluid domain. The work shows the accuracy of this interface method in decreasing the structural mesh elements and obtaining similar results compared with commercial FSI software. Another similar work, [19], evaluated the dynamic stability of vehicle dampers. The fluid–structure interaction was simulated in the oil function for the damper. The study provided an optimized spring and a fast time response of the system. The authors evaluated the main vibration frequencies and examined the influence of each parameter on it.
Despite the importance of mining equipment and the influence of crosswind on reclaimers, no work was found in the literature evaluating the stability of this equipment when subjected to wind loads. The stability of the reclaimers can be compromised if the wind reaches high speeds. This paper intends to evaluate the effect of the wind velocity on the stability of a reclaimer and to investigate if the maximum wind speed established by the standards is accurate. The evaluation of the crosswind effects on a reclaimer is performed using a two-way coupling FSI technique developed in the solids4FOAM code. FSI is an integrated advanced numerical analysis, in which the flow outputs are transferred to structural analysis [24], requiring high computational cost and effort and demanding high computational time. Therefore, a simplified model is proposed to simulate the geometry of a reclaimer, obtaining preliminary results in acceptable computational times.
2. Materials and Methods
2.1. Mathematical Model
The mathematical model is divided into two parts: the analytical model presents the model used in the standards to determine the maximum wind speed to which the structure may be subjected, and the numerical model presents the governing equations used in the FSI model.
2.1.1. Analytical Model
Figure 1 presents the free-body diagram of the reclaimer. The main forces can be classified as wind and resistance forces. The wind forces may cause the superior part of the equipment to fall over the bottom part, causing a destabilizing moment. The resistance forces are responsible for making the body stable, in a counter-movement moment. The FEM 2-131/13 standard [25], defined by the European Materials Handling Federation (FEM), established that when the destabilizing moment is higher than 1.5 times the stabilizing moment, the structure may fall.
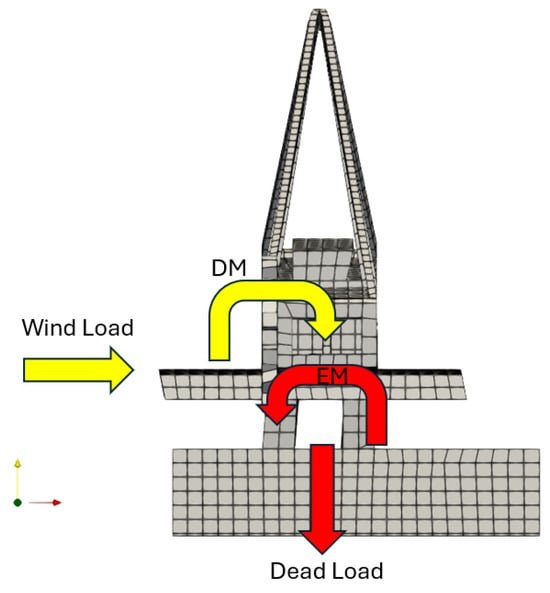
Figure 1.
Free-body diagram of the reclaimer.
The destabilizing (Dm) and stabilizing (Em) moments are determined based on the wind speed V and mass of the equipment M, according to Equations (1) and (2):
where is the density of the air, V is the wind velocity, A is the area of wind incidence, and is the distance between the wind load center and the support point.
where M is the mass of the superior part of the reclaimer, g is the gravity, and is the distance between the mass center and the support point.
The ratio between these moments determines the security operation levels. The FEM standard determines a security level when the ratio of Em/Dm is lower than 1.5. When this ratio was lower than 1, the Dm moments were bigger than the Em moments.
2.1.2. Numerical Model
The FSI numerical model comprises the CFD and MDB models, which are interconnected. While the fluid forces act as external loads on the structure, the displacement and velocity of the structural interface characterize the boundary conditions for the CFD problem [26].
In the CFD analysis, the flow of the fluid follows the conservation equations of mass, momentum, and energy, and the transport equations for the turbulent variables are applied. The partial derivatives are numerically approximated and applied to several small control volumes. Boundary conditions are applied and the solution of the fluid properties is found after several computational iterations [27]. The mass and momentum equations are given by Equations (3)–(6):
where is the specific mass of the air, x, y, and z are the spatial directions, u is the velocity in the x direction, v is the velocity in the y direction, w is the velocity in the z direction, P is the pressure, μ is the air dynamic viscosity, k is the turbulent kinetic energy, ε is the dissipation of the turbulent kinetic energy, and are general source terms (these terms can represent any other external forces acting on the fluid that are not accounted for by the standard terms in the Navier–Stokes equations. For example, in magneto hydrodynamics (MHD), these terms might represent electromagnetic forces). The algorithm used to overcome the pressure–velocity coupling was PIMPLE. The “PIMPLE” algorithm in OpenFOAM stands for “Pressure-Implicit with Multiple Picard-Loops”. It is an extension of the SIMPLE (Semi-Implicit Method for Pressure-Linked Equations) algorithm and is used for solving the pressure–velocity coupling problem in computational fluid dynamics (CFD) simulations. PIMPLE is designed to handle transient and steady-state incompressible flows, particularly those with unsteady or turbulent behavior.
The temporal scheme applied was the forward Euler scheme, a first-order scheme. The spatial order was Gauss linear and Gauss upwind, both first-order schemes.
Multi-body dynamics is a subject that deals with the dynamic behavior of mechanical systems consisting of a series of bodies connected by kinematic constraints imposing restrictions on their relative motion [28]. The analysis is based mainly on the Lagrange equations, based on the energy conservation laws. The variables to be solved are the mass centers of each body and their mass and inertia moments. According to Skelton [29], the generalized concept of the inertial moment was introduced by Hamilton, using the vibration modes of the bodies to characterize their dynamic behavior. The main formulations used to represent the behavior of mechanical equipment requiring contact such as rolling and sliding are the Newtonian, Lagrange, and Hamiltonian techniques. The models consist of the use of a restitution coefficient, contact stiffness, damping for normal contact, and a friction coefficient for tangential contact [30].
In the past, structural analyses have been linearized and represented in a steady state when subjected to aerodynamic forces, failing to consider the unsteady effect of these forces. Also, complex CFD models have been used to predict physical phenomena influenced by dynamic structural responses, neglecting the deformation caused in the structure. The FSI analysis minimizes the limitations imposed by the former models in one-way or two-way coupling [27]. In the one-way coupling, a converged solution is obtained for one field and then used as a boundary condition for the second field. In the two-way coupling, the fluid and solid equations are solved separately and iterated within each timestep [31]. In the present work, the displacements of the solid are obtained, assuming contact with the fluid and no penetration into the body. The pressure fluctuations are obtained for the fluid motion, which imposes force fluctuations on the solid surface and modifies the motion of the solid. The movement of the solid causes pressure gradients in the fluid and changes its movements. For the interaction between the methods, mesh movement algorithms are required. According to Li et al. [32], this kind of algorithm has increasingly been used, and the most general technique is the Arbitrary Lagrangian–Eulerian (ALE) technique, which forces the equations to modify the domain at each timestep.
In this code [11], there is no distinction between solid and fluid materials; the difference is in the constitutive relations. For the analysis of solids, a Lagrangian technique is used, while for fluids, a Eulerian approach is used. The convection terms are eliminated in a Lagrangian formulation because the material velocity equals the domain velocity, but they are retained in a Eulerian formulation. Constitutive relations defining the Cauchy stress and the heat flux must be stated in order to solve the governing equations. Deformation frequency, the symmetric component of the velocity gradient, is denoted as D (Equation (7)):
where v is the velocity deformation.
The linearized strain tensor is described in terms of the displacement gradient for small rotations and small strains (Equation (8)):
where e is the strain tensor and u represents deformation values.
There are many well-known constitutive rules for the case of linear geometry, when modest strains and minor rotations are considered. To enable simple interaction with the solids4FOAM modules, the standard OpenFOAM fluid model implementations have been taken and refactored into the fluid model class design. Laminar and turbulent isothermal incompressible Navier–Stokes formulations have been included within a static domain, and the governing equations take the form of the Navier–Stokes Equations (4)–(6), where the pressure term and the viscous term (first term on the right-hand side of the second equation above) represent the surface force terms in the momentum equation. The difference between the deformed and undeformed configurations, as well as the discrepancy between Eulerian and Lagrangian descriptions, can be overlooked in the case where the strains and rotations are minor; also, the Cauchy and engineering stress tensors coincide. The momentum equation becomes a linear function of the displacement field u when the definition of engineering stress is a linear function of the displacement vector.
The physical model is an ore reclaimer installed at the port of São Luís in Maranhão, Brazil. It had a width of 34 m and a height of 77 m (Figure 2). Its primary purpose was to extract material from stockpiles and load ships for iron ore exportation for Vale, shown in Figure 2. Due to the high computational effort required to simulate the real structure, a simplified model was used in this paper, represented in Figure 3. The simplified model has the same mass, frontal area, and superior and bottom parts as the real reclaimer. The parts are overlapped with contact steel–steel properties, fixed to the ground, and able to move in the other degrees of freedom.
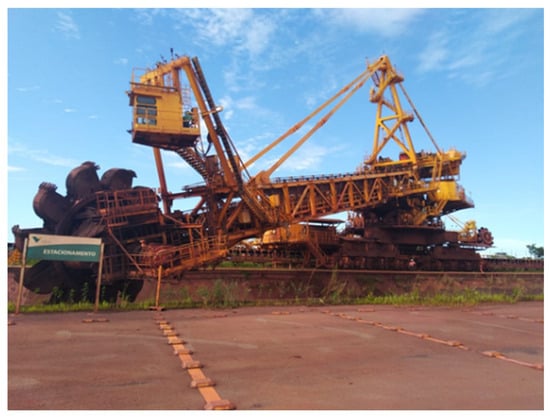
Figure 2.
Real ore reclaimer.
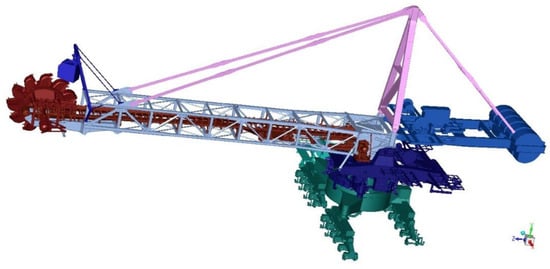
Figure 3.
CAD 3D model.
The principal data used for modeling the reclaimer were the project drawings with all the structure information. Figure 3 shows all parts from the reclaimer and an example ore pile beside it. This 3D CAD (computer-aided design) was developed in SolidWorks software as a base for discretization and simplification to a numerical model.
The first developed model (left in Figure 4) used the full CAD 3D model trying a tetrahedral mesh in all solids of the CAD 3D model with all details. This model had a complexity to mesh that increased the number of elements (about 50~60 million) and decreased the quality, making it impossible to run in the solvers proposed to be used in this work. Then, the most simplified model was developed (right in Figure 4) by removing the more complex parts and keeping the principal dimensions (height, width, and frontal area). This simplified model enabled the use of some hexahedral elements and decreased the number of elements (about 1~2 million), making it possible to run mainly because of the quality increase.
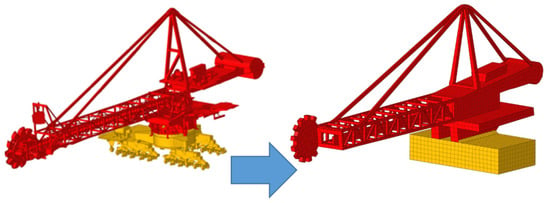
Figure 4.
Complex and simplified models.
In computational fluid dynamics, the selection and optimization of mesh configurations play a pivotal role in the accuracy and efficiency of simulations conducted within platforms such as OpenFOAM. This study presents a comparative analysis between two mesh configurations: a simplified model significantly reducing the element count by approximately fifty times, and a complex model incorporating elements of comparatively lower quality. The simplified model showcased a maximum aspect ratio of 15.5351354, skewness not exceeding 1.01987345, and a non-orthogonality peak at 74.4576614°, with a mere dozen faces presenting severe non-orthogonality issues (beyond 70 °). In contrast, the complex model exhibited escalated values in these parameters with a maximum aspect ratio reaching 38.3411, skewness peaking at 1.95792, and an utmost non-orthogonality of 81.1284°, alongside a substantial increase in the count of severely non-orthogonal faces to 418. This juxtaposition elucidates the inherent trade-offs between mesh complexity and element quality, emphasizing the crucial impact of mesh characteristics such as skewness, aspect ratio, and non-orthogonality on the fidelity and computational demands of fluid dynamics simulations.
The main properties applied to solid and fluid models are presented in Table 1. The air was assumed as an ideal gas, with properties evaluated at 20 °C and ambient pressure of 1 atm. The simplification used simple geometrical forms to represent the main model. Figure 3 shows a comparison between the more complex and simplified models.

Table 1.
Materials properties.
The boundary conditions are represented in Figure 5. To simulate the effect of the wind velocity, the equipment was placed inside an air box, with a prescribed value for the air velocity at the inlet. The prescribed value varied from 36 m/s to 132 m/s. The box dimensions are 115 m in height, 205 m in width, and 500 m in length, according to the requirements presented in [33], which established that it can extend from 10 to 15 times the equipment’s largest dimension. The k-ε turbulence model was used as in reference [4].
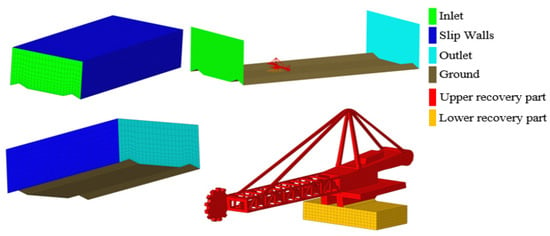
Figure 5.
Boundary conditions.
The FSI model worked with a two-way approach, and the software used was solids4FOAM developed by Cardiff et al. [16], which uses an automatic remeshing procedure to represent the solid displacement. After a preliminary mesh test, a CFD mesh of about 350 thousand tetrahedral, pyramidal, and hexahedral elements was defined. The solid mesh had about 250 thousand tetrahedral and pyramidal elements.
The mesh refinement is shown in Figure 6, with smaller elements next to the reclaimer, growing to the domain limits. The body was set up with all six degrees of freedom and solid–solid contact between the upper reclaimer part (in red in Figure 5) and the lower reclaimer part (in yellow in Figure 5). The lower part was fixed in the ground with all six degrees of freedom fixed.
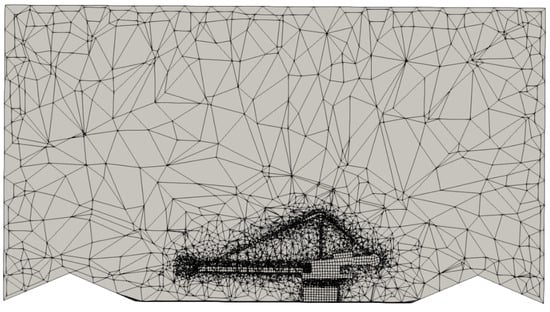
Figure 6.
Mesh refinement—YZ Plane.
The problem was solved in unsteady conditions. For the static stabilization, the simulation was set up to run for 0.25 s with a wind velocity of 0 m/s and, subsequently, the prescribed velocity was applied.
3. Results
In this paper, it is intended to investigate the influence of wind speed on the failure of a given reclaimer using CFD and MDB analyses. CFD results predict the velocity field and streamlines, as well as the pressures imposed by the wind and the resulting forces. MDB results predict the reclaimer displacements, vibration levels, and the acting and reacting forces.
The structure may fall when the destabilizing moment is higher than the stabilizing moment. The FEM 2-131/13 standard [25] considers a safety factor of 1.5, which means that when the ratio of Em/Dm is greater than this, the structure may fall. The standard considers only velocities below 36 m/s. For a frontal area of 524 square meters and a mass of 491.4 tons, the velocity of 36 m/s results in a wind pressure of 777.6 Pa, a force of 407.8 kN, and a destabilizing moment of 3.4 MN.m. The stabilizing moment is 24 MN.m, leading to a condition in which the reclaimer would not fall. According to the standard, the condition for failure would occur at a wind speed of 68 m/s. In this condition, the ratio of the destabilizing and stabilizing moments is still below 1.5. The velocity at which this ratio exceeds 1.5 is 83 m/s. For this reason, the model was simulated for wind speeds of 36, 68, and 84 m/s. To evaluate the behavior of the structure for higher velocities, wind speeds of 100 and 132 m/s were also simulated.
In all simulations, the airflow was considered unsteady due to structural vibration modes. Numerical results showed differences related to the analytical model. It was observed that the wind deflection to the superior part provided a vertical force promoting stability. Although the analytical model indicated a critical velocity of about 68 m/s, the numerical results showed pressure variations and forces stabilizing the equipment for velocities until 132 m/s. These differences may be attributed to the detailed analysis performed in the numerical simulation. The analytical model considers a flat area of 524 square meters, while the numerical solution represents a more realistic geometry, resulting in a different velocity and pressure distribution. Figure 7 presents the velocity fields for wind speeds from 36 m/s to 132 m/s. The vorticity and recirculation zone formed after the equipment increased with the wind velocities, indicating a higher flow perturbation with higher velocities. The reclaimer displacements were more significant with higher wind velocities, causing more disturbance to the fluid. Although the velocity gradients increased with the wind velocity, the recirculation zone did not increase similarly, and the airflow velocities increased to a lesser extent than the free current velocity.
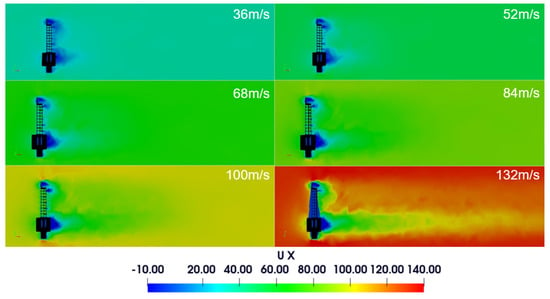
Figure 7.
Lateral velocity field—XY Plane—simplified FSI model.
The comparative analysis of the complex and simplified reclaimer models, based on Figure 8, sheds light on the distinctions between CFD (computational fluid dynamics) and FSI (fluid–structure interaction) simulations under the conditions tested. The complex model, with a mesh size of 50 to 60 million elements, was analyzed using only CFD and was subjected to a wind speed of 36 m/s. This model captures the flow details with higher granularity, which is evident in the intricate wind patterns and pressure distributions observed. However, the simulation’s time constraint limits the analysis to initial transient phenomena.
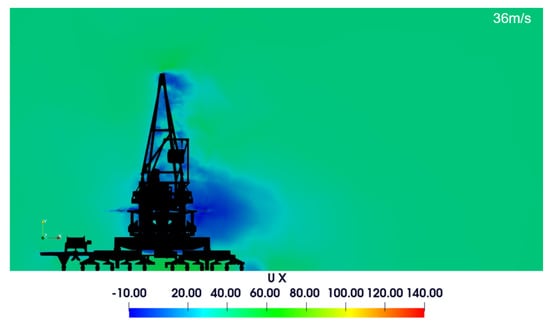
Figure 8.
Lateral velocity field—XY Plane—complex CFD model.
On the other hand, the simplified model, with a mesh size between 1 and 2 million elements, employed an FSI approach, integrating the interaction between the fluid flow and the structural response of the reclaimer. This approach provides a more comprehensive understanding of the system’s behavior by considering the structure’s flexibility and the resultant deflections that may affect the flow patterns. Despite the reduced geometric detail, the simplified model facilitates a longer simulation period and allows for the examination of steady-state behavior under various wind speed conditions, expanding beyond the singular condition examined in the complex model.
From the first of the six results for the simplified model corresponding to the 36 m/s wind speed, it is clear that there is a difference in the flow separation and wake region when compared to the complex model. This could be attributed to the FSI effects and the model’s capacity to account for structural deformations, which are not considered in the CFD-only approach of the complex model.
Figure 9 presents a visualization of the upper region of the reclaimer. It can be noticed that the mast plays a more important role in the velocity distribution than the boom, because, even with similar areas, the velocity in the boom is more distributed. The sizes of the recirculation zone and the velocity magnitudes in the lateral view were similar.
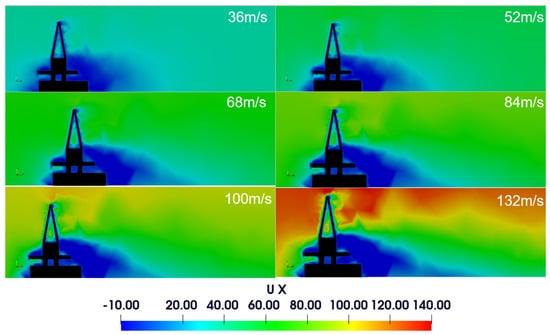
Figure 9.
Top velocity field—XZ Plane—simplified FSI model.
Upon examining the results from both the complex and simplified models of the reclaimer from the superior and lateral views, distinct observations can be made regarding the fluid flow characteristics and structural interactions. For the complex model (Figure 10), which has been analyzed solely under computational fluid dynamics (CFD) at a wind speed of 36 m/s, the visual results indicate detailed flow patterns around the structure. The superior view particularly shows the wake region’s intricate structure and how the wind interacts with the fine geometrical features.
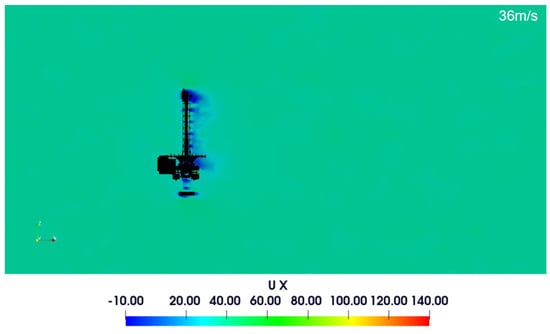
Figure 10.
Top velocity field—XZ Plane—complex CFD model.
The simplified model, evaluated using fluid–structure interaction (FSI) analysis, exhibits a more generalized flow pattern. This is expected due to the reduced geometric details; however, the FSI approach provides additional insights into the structural response to the wind loading, which is absent in the CFD-only approach. It is worth noting that the FSI results represent a range of wind speeds, which allows for a broader understanding of the dynamic behavior of the structure under varying conditions.
Comparing the first result of the simplified model at the same wind speed of 36 m/s as the complex model, we can observe that while the complex model shows more localized flow features, the overall pressure distribution trends remain consistent between the two models. The simplified model, due to better element quality, likely offers more reliable insights into the overall structural behavior, despite the lack of granularity in the flow details.
Figure 11 shows the streamlines on a transversal plane. The recirculation patterns observed can also be seen with the streamlines and the vorticity colormap, with red when the recirculation is higher and blue when the flow is linear. It is worth mentioning that due to the reduction of the airflow area, the air reaches the reclaimer with velocities higher than the free current, which might increase the pressure gradient and aerodynamic forces, increasing the probability of failure by stabilization. The results showed more intense vorticity at higher wind speeds, caused by an increase in the displacement of the reclaimer and an increase in the velocity gradients in the boundary layer next to the reclaimer. The format and size of the vortices after the reclaimer were similar for all wind speeds, but distinct magnitudes and thicknesses were observed.
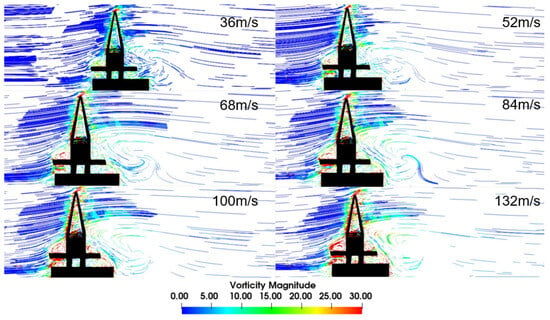
Figure 11.
Velocity field streamlines—XY Plane—simplified FSI model.
The streamline and vorticity patterns depicted in the CFD results for both the complex and simplified models of the reclaimer structure offer insightful contrasts. In the complex model, which only incorporates CFD and is limited to a single wind speed of 36 m/s, the streamlines exhibit pronounced interaction with the structure, demonstrating intricate patterns of flow separation and recirculation zones (Figure 12).
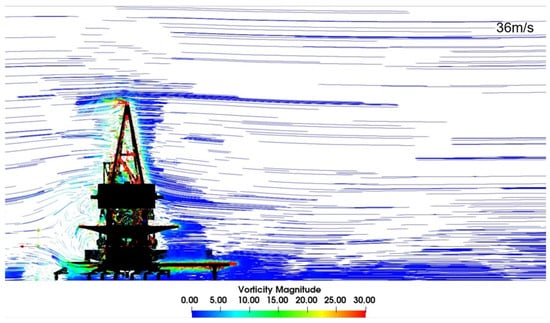
Figure 12.
Velocity field streamlines—XY Plane—complex CFD model.
The vorticity results for the complex model, while limited in temporal scope, capture the rotational flow regions with high detail, emphasizing the localized effects of the structure’s geometry on the flow field. Such detail aids in identifying potential areas of vortex-induced vibrations, which are critical in assessing fatigue life and structural integrity.
For the simplified model, the streamlines and vorticity patterns, although analyzed within an FSI framework, are less granular due to the mesh’s reduced complexity. Despite this, the FSI analysis adds a dimension of interaction between the flow and the structural response, which is not captured in a pure CFD study. The results from the simplified model across different wind speeds, as seen in the provided images, indicate how the structure dynamically responds to varied wind loadings.
The pressure imposed by the airflow is shown in Figure 13, Figure 14, Figure 15, Figure 16, Figure 17, Figure 18 and Figure 19. The maximum values varied from about 0.98 to 10 kPa considering all the wind speeds evaluated. The forces and displacements in the X direction were plotted to be compared with the analytical force. For a prescribed value of wind speed of 36 m/s (Figure 10), the analytical model predicted a drag force of 407.8 kN. Numerical results predicted an initial value between 700 and 800 kN, decreasing up to 560 kN. For the other velocities evaluated, the general transient behavior was similar, only changing the magnitude of the forces. Positive displacements were observed in all the wind speeds evaluated, caused by the X force. For a wind speed of 36 m/s, the maximum X displacement was about 0.04 mm. It is worth noting that the results are only presented after 0.25 s since the simulation before 0.25 s was run with a wind speed of 0 m/s.
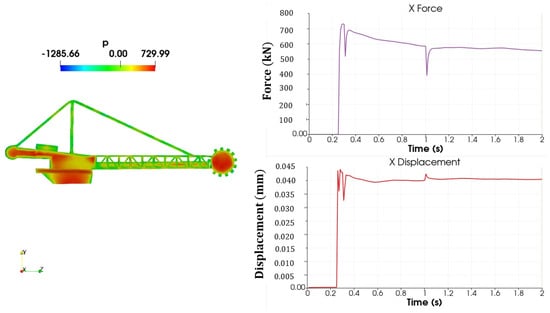
Figure 13.
Pressure, force, and displacement—36 m/s—simplified FSI model.
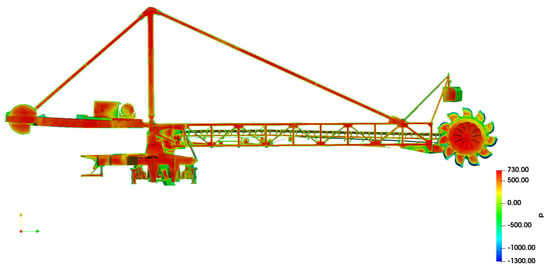
Figure 14.
Pressure distribution—36 m/s—complex CFD model.
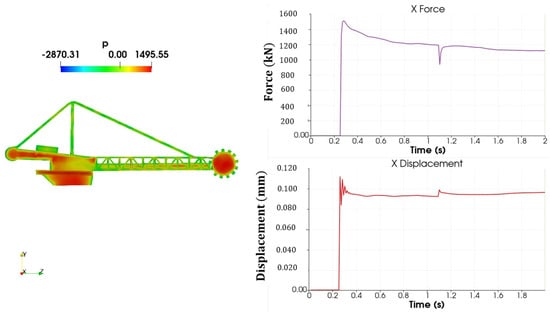
Figure 15.
Pressure, force, and displacement—52 m/s.
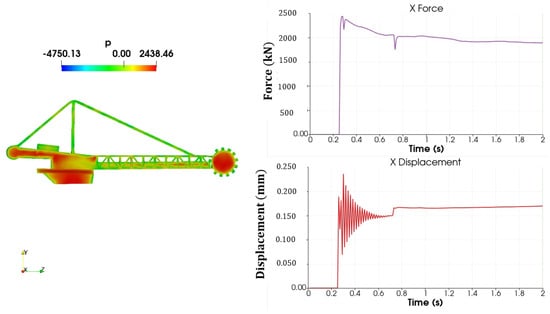
Figure 16.
Pressure, force, and displacement—68 m/s.
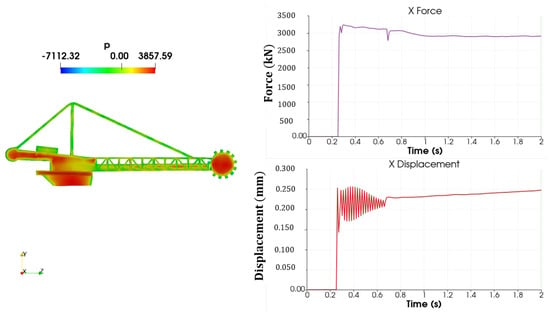
Figure 17.
Pressure, force, and displacement—84 m/s.
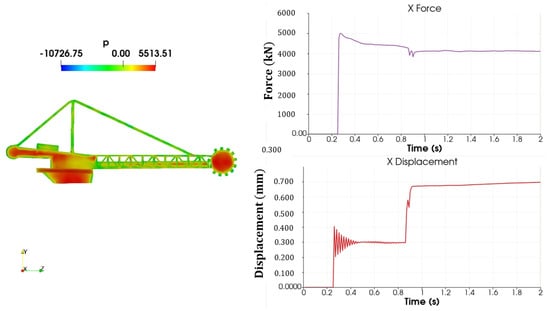
Figure 18.
Pressure, force, and displacement—100 m/s.
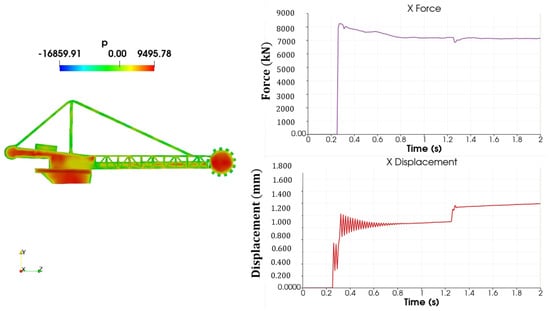
Figure 19.
Pressure, force, and displacement—132 m/s.
The numerical results predicted higher wind forces than the analytical model, which could indicate fewer security levels of stability in the latter case. Nevertheless, the forces found in the numerical analysis were not enough to cause failure in stability, as shown in the reaction force analysis presented in Figure 20.
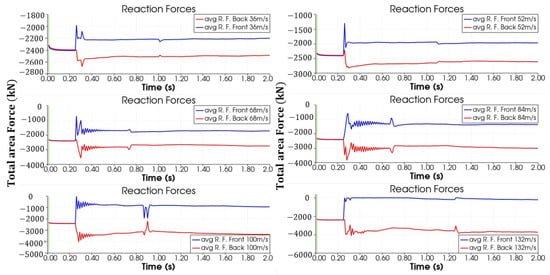
Figure 20.
Vertical reactions—front and back parts.
Analyzing the surface pressure results between the two models (Figure 13 and Figure 14) provides a clear visual contrast of the pressure distribution due to the wind load on the reclaimer. The complex model, which seems to incorporate a higher level of geometrical detail, shows pressure extremes with higher fidelity. This can be observed from the more pronounced pressure gradients on certain components of the structure, which can be critical in identifying localized stress concentrations that could impact design and fatigue life assessments. On the other hand, the simplified model, despite its reduced mesh detail, still captures the overall pressure distribution trend. However, it smooths out the localized pressure extremes, possibly overlooking areas that could be susceptible to high stress concentrations. This can be beneficial for computational efficiency and for identifying general load distribution patterns for preliminary design stages or for larger design iterations where detailed local effects are less critical.
In practical applications, engineers may use the simplified model for quick assessments and to inform the design process iteratively. In contrast, the complex model, with its detailed pressure mapping, is more suited for final validation stages where understanding the precise load effects on every part of the structure is necessary. The pressure results from both models can complement each other, with the simplified model used for broad evaluations and optimization, while the complex model is reserved for final checks and detailed investigations. This dual-level approach ensures that engineering design benefits from both computational efficiency and accuracy, aligning with the practical needs of the project development phases.
For a wind speed of 52 m/s (Figure 15), the X force reached 1100 kN, 23% higher than the analytical force (850 kN), replicating the behavior of the 36 m/s analysis. The displacement was about 0.1 mm and the stability did not fail.
For a wind speed of 68 m/s, considered critical in the analytical model (Figure 16), the ratio of the moments Em/Dm was still lower than 1.5. Similar to previous speeds, the forces predicted by the numerical model were higher than the forces predicted by the analytical model of 1450 kN; the numerical force was about 1900 kN, causing a maximum displacement of 0.17 mm. The stability did not fail in this case.
For a wind speed of 84 m/s, the numerical predicted value for the force was about 2900 kN, 23% higher than the analytical predicted value. Although the destabilizing moment was higher than the stabilizing moment, the stability did not fail. Nevertheless, higher displacements were found, and a larger transient variation in the displacements. This may be attributed to differences in the real values of the stabilizing moment or phenomena not considered in the analytical evaluation.
For a wind speed of 100 m/s (Figure 18), the general behavior of the previous results was repeated, with numerical forces higher than analytical forces. Also, the structure did not fail by stability. It can be seen that, after approximately 1 s of simulation, a higher displacement was reached.
For a wind speed of 132 m/s (Figure 19), the average X force was about 7000 kN, 22% higher than the analytical value. In this case, the maximum displacement value was about 1.4 mm, and the stability failed due to reaction forces, as can be seen in Figure 15.
The system required 0.25 s to stabilize under a wind speed of 0 m/s. All the simulations were run by applying the prescribed wind velocity after this static analysis. The stability failure was defined by the determination of the reaction forces in the base of the reclaimer. The moment in the Z direction is caused by the misaligned wind forces on the mass center of the structure. The front part receives the dynamic pressure before the back part. The reaction forces in the supports of the reclaimer are shown in Figure 16. The forces are negative, indicating that the structure is being held by the supports. Stability fails when the reaction force over one of the supports reaches 0 N. In this case, the reaction force on the other support increases to the total dead load, and the reclaimer rotates to fall.
As a summary, Table 2 presents a comparison between the analytical and numerical results for X forces at each evaluated wind speed. For all wind speeds, it is noticeable that the numerical results were higher than the analytical results. It is worth mentioning that the forces were not expected to be the same when comparing analytical and numerical results. This is because the analytical forces are predicted based on global parameters, such as the area of wind incidence, the distance between the wind load center and the support point, and the distance between the mass center and the support point. In contrast, the numerical forces were predicted for a specific reclaimer with defined dimensions.

Table 2.
Comparison between analytical and numerical forces.
For the lower wind speeds (36, 52, 68, 84, and 100 m/s), an increase can be seen in the difference between the reaction forces on the front and back supports, but these forces stabilize over time. For the wind speed of 132 m/s, the reaction force on the front support reached 0 N and it was concluded that the structure failed by stability.
To evaluate the dynamic behavior of the reclaimer, the vibration levels are shown in Figure 21. It can be seen that the higher vibration levels are found in the initial steps when the structure was suddenly subjected to the crosswind. The vibration levels reduced over time, and they could not cause a dynamic displacement amplification high enough to make the structure fail for stability causes.
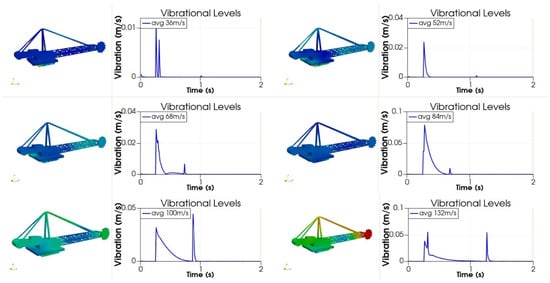
Figure 21.
Reclaimer vibration level.
4. Conclusions
This study evaluated the stability of a mining reclaimer due to wind loads. Due to the complexity of the geometry of a real device, a simplified model was studied. The analysis was carried out for different wind speeds, using analytical and numerical methods. The FEM standard criterion was used in the analytical method and the FSI method was used in the numerical evaluation. Six different values of wind speeds were evaluated, considering the critical values suggested by the FEM standard, and equally spaced values above the most critical condition suggested.
Numerical values of velocity and pressure fields were obtained by the CFD analysis, enabling the determination of the wind forces on the structure. The MDB analysis predicted the displacements of the structure, as well as reaction forces and vibration levels.
The wind forces on the reclaimer structure predicted by the numerical model were 23% higher than the values predicted by the analytical model, due to dynamic and recirculation effects not considered in the analytical model.
Both the complex and simplified models are valuable in the engineering workflow. They should be employed strategically at different stages of the design process to balance the need for detail, accuracy, and computational resources. While the simplified model allows for efficient design iterations and optimization, the complex model provides the necessary depth for final verifications and detailed analysis. Together, they form a comprehensive toolkit that supports sound engineering judgment, ensuring both the safety and efficiency of the structure under the investigated loading conditions.
A stability analysis was performed based on the reaction forces. When the reaction force in the reclaimer support was 0 N, it was assumed that the reclaimer lost stability and rotated to fall and, therefore, failed. The wind speed required for the reclaimer to lose stability was 132 m/s, twice the critical value established by the FEM 2-131/13 standard [25].
The vibration levels did not increase with the wind velocity and in all cases, they stabilized, confirming a low influence of dynamic effects.
It is worth noting that the present study utilized a simplified model due to the complexity of the reclaimer’s geometry, which may introduce some degree of uncertainty. Future research could involve developing more advanced models that better capture the intricacies of the real device.
Author Contributions
Conceptualization, J.R.J. and C.B.M.; methodology, J.R.J.; formal analysis, J.R.J.; investigation, J.R.J.; resources, J.L.J.; writing—original draft preparation, J.R.J.; writing—review and editing, C.B.M.; supervision, C.B.M.; funding acquisition, J.L.J. All authors have read and agreed to the published version of the manuscript.
Funding
This study was financed in part by the Coordenação de Aperfeiçoamento de Pessoal de Nível Superior—Brasil (CAPES)—Finance Codes 001 and PROAP 88881.888660/2023-01. The work was also financed by PUC Minas, FAPEMIG (grant PPM-00650-18), CNPq (grant 302175/2022-9), and VALE.
Institutional Review Board Statement
Not applicable.
Data Availability Statement
The data presented in this study are available on request from the corresponding author due to restrictions.
Conflicts of Interest
The authors declare no conflicts of interest.
References
- Zamorano, S. Surface ore movement, storage, and recovery systems. In SME Mining Engineering Handbook; SME: Englewood, CO, USA, 2011; Volume 3, pp. 977–985. [Google Scholar]
- He, X.; Zou, S. Advances in wind tunnel experimental investigations of train–bridge systems. Tunn. Undergr. Space Technol. 2021, 118, 104157. [Google Scholar] [CrossRef]
- Andersen, I.M.V. Wind loads on post-panamax container ship. Ocean Eng. 2013, 58, 115–134. [Google Scholar] [CrossRef]
- Kääriä, C.H.; Wang, Y.; White, M.D.; Owen, I. An experimental technique for evaluating the aerodynamic impact of ship superstructures on helicopter operations. Ocean Eng. 2013, 61, 97–108. [Google Scholar] [CrossRef]
- Mousaviraad, M.; Conger, M.; Stern, F.; Peterson, A.; Ahmadian, M. Validation of CFD-MBD FSI for high-fidelity simulations of full-scale WAM-V Sea-Trials with suspended payload. In Proceedings of the SNAME 13th International Conference on Fast Sea Transportation—FAST 2015, Washington, DC, USA, 1–4 September 2015. [Google Scholar]
- Huang, P.; Peng, X.; Gu, M. Wind tunnel study on effects of various parapets on wind load of a flat-roofed low-rise building. Adv. Struct. Eng. 2017, 20, 1907–1919. [Google Scholar] [CrossRef]
- Elshaer, A.; Bitsuamlak, G. Multiobjective Aerodynamic Optimization of Tall Building Openings for Wind-Induced Load Reduction. J. Struct. Eng. 2018, 144, 04018198. [Google Scholar] [CrossRef]
- Sanyal, P.; Dalui, S.K. Effects of courtyard and opening on a rectangular plan shaped tall building under wind load. Int. J. Adv. Struct. Eng. 2018, 10, 169–188. [Google Scholar] [CrossRef]
- Chen, G.; Rong, L.; Zhang, G. Unsteady-state CFD simulations on the impacts of urban geometry on outdoor thermal comfort within idealized building arrays. Sustain. Cities Soc. 2021, 74, 103187. [Google Scholar] [CrossRef]
- Abu-Zidan, Y.; Mendis, P.; Gunawardena, T. Optimising the computational domain size in CFD simulations of tall buildings. Heliyon 2021, 7, e06723. [Google Scholar] [CrossRef] [PubMed]
- Cardiff, P.; De Jaeger, P.; Jasak, H.; Nagy, J. An open-source finite volume toolbox for solid mechanics and fluid-solid interaction simulations. arXiv 2018, arXiv:1808.10736. [Google Scholar]
- Tuković, Ž.; Jasak, H.; Karač, A.; Cardiff, P.; Ivanković, A. Openfoam finite volume solver for fluid-solid interaction. Trans. Famena 2018, 42, 206941. [Google Scholar] [CrossRef]
- Cardiff, P.; Karač, A.; Ivanković, A. A large strain finite volume method for orthotropic bodies with general material orientations. Comput. Methods Appl. Mech. Eng. 2014, 268, 318–335. [Google Scholar] [CrossRef]
- Ali, Q.S.; Kim, M.H. Unsteady aerodynamic performance analysis of an airborne wind turbine under load varying conditions at high altitude. Energy Convers. Manag. 2020, 210, 112696. [Google Scholar] [CrossRef]
- Elsherif, D.M.; El-Wahab, A.A.A.; Abdellatif, M.H. Factors affecting stress distribution in wind turbine blade. In Proceedings of the IOP Conference Series: Materials Science and Engineering, Cairo, Egypt, 9–11 April 2019; Volume 610. [Google Scholar]
- Sayed, M.; Lutz, T.; Krämer, E.; Shayegan, S.; Wüchner, R. Aeroelastic analysis of 10 MW wind turbine using CFD–CSD explicit FSI-coupling approach. J. Fluids Struct. 2019, 87, 354–377. [Google Scholar] [CrossRef]
- De Santis, D.; Shams, A. Scaling of added mass and added damping of cylindrical rods by means of FSI simulations. J. Fluids Struct. 2019, 88, 241–256. [Google Scholar] [CrossRef]
- Durand, M.; Leroyer, A.; Lothodé, C.; Hauville, F.; Visonneau, M.; Floch, R.; Guillaume, L. FSI investigation on stability of downwind sails with an automatic dynamic trimming. Ocean Eng. 2014, 90, 129–139. [Google Scholar] [CrossRef][Green Version]
- Schickhofer, L.; Wimmer, J. Fluid–structure interaction and dynamic stability of shock absorber check valves. J. Fluids Struct. 2022, 110, 103536. [Google Scholar] [CrossRef]
- Zou, Z.; Guan, Z.; Gurgenci, H.; Lu, Y. Solar enhanced natural draft dry cooling tower for geothermal power applications. Sol. Energy 2012, 86, 2686–2694. [Google Scholar] [CrossRef]
- Agarwal, A.; Letsatsi, M.T. FSI investigation of cooling tower subjected to high gusts. Mater. Today Proc. 2022, 60, 2141–2150. [Google Scholar] [CrossRef]
- De Nayer, G.; Breuer, M.; Boulbrachene, K. FSI simulations of wind gusts impacting an air-inflated flexible membrane at Re = 100,000. J. Fluids Struct. 2022, 109, 103462. [Google Scholar] [CrossRef]
- Kalliontzis, D. Fluid–structure interaction with ALE formulation and skeleton-based structural models. J. Fluids Struct. 2022, 110, 103513. [Google Scholar] [CrossRef]
- Ramesh, M.; Vijayanandh, R.; Jagadeeshwaran, P.; Deviparameswari, K.; Meenakshi, S.; Asher, P.K.; Antonitta, B.F. Impact behavioral studies on various composite materials using fluid-structure interaction (FSI). Mater. Today Proc. 2022, 51, 1134–1140. [Google Scholar] [CrossRef]
- FEM 2-131/13; Rules for the Design of Mobile Equipment for Continuous Handling of Bulk Materials. European Materials Handling Federation: Brussels, Belgium, 1997.
- Versteeg, H.K.; Malalasekera, W. An Introduction to Computational Fluid Dynamics: The Finite Volume Method; Pearson Education Limited: London, UK, 2007. [Google Scholar]
- Bulge, U. Progress in Computational Flow-Structure Interaction: Results of the Project UNSI, Supported by the European Union 1998–2000; Springer: Berlin/Heidelberg, Germany, 2002; Volume 81. [Google Scholar]
- Ham, S.H.; Roh, M.I. Time-domain structural analysis during block turnover and lifting using 2D flexible multibody dynamics. Mar. Struct. 2021, 75, 102841. [Google Scholar] [CrossRef]
- Skelton, R.E. Efficient Models of Multi-body Dynamics. In Encyclopedia of Aerospace Engineering; John Willey & Sons: Hoboken, NJ, USA, 2010. [Google Scholar]
- Rahnejat, H.; Rothberg, S. (Eds.) Multi-Body Dynamics: Monitoring and Simulation Techniques III; John Wiley & Sons: Hoboken, NJ, USA, 2004. [Google Scholar]
- Pantua, C.A.J.; Calautit, J.K.; Wu, Y. A fluid-structure interaction (FSI) and energy generation modelling for roof mounted renewable energy installations in buildings for extreme weather and typhoon resilience. Renew. Energy 2020, 160, 770–787. [Google Scholar] [CrossRef]
- Li, L.; Sherwin, S.J.; Bearman, P.W. A moving frame of reference algorithm for fluid/structure interaction of rotating and translating bodies. Int. J. Numer. Methods Fluids 2002, 38, 187–206. [Google Scholar] [CrossRef]
- Rahman, M.; Morshed, K.N.; Mian, A. Aerodynamic performance analysis of three bladed savonius wind turbine with different overlap ratios and at various reynolds number. In Proceedings of the ASME International Mechanical Engineering Congress and Exposition, Proceedings (IMECE), Vancouver, BC, Canada, 12–18 November 2010; Volume 5. [Google Scholar]
Disclaimer/Publisher’s Note: The statements, opinions and data contained in all publications are solely those of the individual author(s) and contributor(s) and not of MDPI and/or the editor(s). MDPI and/or the editor(s) disclaim responsibility for any injury to people or property resulting from any ideas, methods, instructions or products referred to in the content. |
© 2024 by the authors. Licensee MDPI, Basel, Switzerland. This article is an open access article distributed under the terms and conditions of the Creative Commons Attribution (CC BY) license (https://creativecommons.org/licenses/by/4.0/).