Abstract
The analysis of environmental DNA (eDNA) is a powerful and non-invasive method for monitoring the presence of species in ecosystems. However, ecologists and laboratory staff can find it challenging to use eDNA analysis software effectively due to the unfamiliar command-line interfaces used by many of these packages. Therefore, we developed the eDNA-container app, a free and open-source software package that provides a simple user-friendly interface for eDNA analysis. The application is based on the popular QIIME2 library and is distributed as a Docker image. The use of Docker makes it compatible with a wide range of operating systems and facilitates the reproducible analysis of data across different laboratories. The application includes a point-and-click user interface for selecting sequencing files, configuring parameters, and accessing the results. Key pipeline outputs, such as sequence quality plots, denoising, and ASV generation statistics, are automatically included in a PDF report. This open-source and freely available analysis package should be a valuable tool for scientists using eDNA in biodiversity and biosecurity applications.
1. Introduction
Environmental DNA (eDNA) is genetic material originating from organisms in the environment, including shed cells, secretions, and whole microorganisms [1]. The high-throughput sequencing of eDNA has proven to be a powerful tool in ecology and biosecurity as it can be used to monitor the presence of species, assess the impact of human activities on ecosystems, and track the spread of invasive species [2,3,4,5]. eDNA sampling is also less invasive than traditional biodiversity monitoring methods such as electrofishing, and being relatively inexpensive, it is a cost-effective option for large-scale sampling surveys. Due to the ease of sampling, eDNA can be used to survey a wide range of habitats, including those that are difficult to access, such as deep lakes and remote streams [6,7,8].
There are several bioinformatics tools that are commonly used for eDNA analysis including vsearch, usearch, MiFish, and QIIME2 [9,10,11,12,13]. These tools clean and process short-read sequencing data, assign species to reference sequences, and quantify the species diversity of each sample. However, the unfamiliar command-line interface adopted by many of these packages can make it difficult for wet lab staff and field ecologists to use the software effectively. Additionally, Microsoft Windows versions of these packages are often not available due to the popularity of UNIX/Linux amongst developers of scientific software.
QIIME2 is one of the most popular software packages for DNA barcoding-based community analyses [14,15,16]. This open-source package includes plugins for workflows such as cutadapt for quality trimming, DADA2 for denoising and building amplified sequence variants (ASVs), as well as tools for building custom taxonomic classifiers [17,18,19]. This package was developed to run natively on Linux systems; however, a command-line interface can be accessed on Microsoft Windows via Windows Subsystem for Linux (WSL) or using a Linux virtual machine. WSL and virtual machines are relatively advanced computer utilities, which could hinder the wider adoption of this package for eDNA analysis.
Docker is a software platform that allows developers to build, run, and share applications in containers. The containers are lightweight, standalone packages of software that include everything needed to run an application, including code, system libraries, and program settings. Docker makes it easy to deploy applications because it provides a consistent way to package and run software regardless of the underlying operating system. These features have made Docker an important tool for scientific software development because applications will generate consistent outputs irrespective of the underlying computer frameworks being utilized [20,21,22,23].
Here, we introduce the eDNA-container app, which is an eDNA analysis pipeline that uses QIIME2 for amplicon sequence variant generation and taxonomic assignment. The application includes a graphics user interface (GUI) that allows the user to configure runtime and quality control parameters, select primers, and utilize custom taxonomic databases. Key pipeline outputs, such as sequence quality plots and ASV generation statistics are automatically included in a final PDF report. The final feature counts and taxonomic assignments across all samples are provided in a comma-separated file (CSV) that can be viewed using spreadsheet software (i.e., Excel or LibreOffice Calc). This free open-source application is available on the Docker hub, and developers can access the underlying python and bash code by directly cloning the projects GitHub repository.
2. Methods
A Snakemake (version 7.24) file defines the execution of a QIIME2 (version label 2023.2) eDNA analysis workflow [13,24]. A summary of the Snakemake rules is shown in Figure 1. Snakemake rules automatically build a QIIME2-compatible metadata file based on the FASTQ file names selected by the user through the GUI (Figure S1). The only specification is that unique sample names are included in the FASTQ filename (gzipped) and that the short-read data are paired-end. The metadata file is used to build a QIIME2 data object by running the qiime tools import and qiime demux summarize commands. The qiime cutadapt trim-paired plugin command removes primers and adaptor sequences [17]. The number of primers identified in the sequencing data and the number of reads that pass trimming filters are included in a final run PDF report. The DADA2 plugin is used through the qiime dada2 denoise-paired command and denoise parameters p-trunc-len-f, p-trunc-len-r, p-max-ee-f, p-max-ee-r, p-trunc-q, and p-chimera-method set via a configuration file [18]. This configuration file is modified by the user through the GUI (Figure S2).
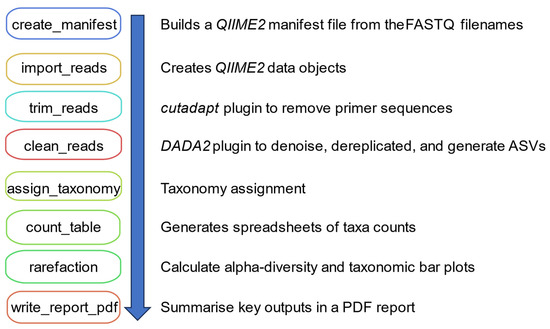
Figure 1.
A summary of the Snakemake rules used to execute the eDNA-container app pipeline. Each box represents a Snakemake rule that runs a specific step in the pipeline as indicated by the description. The rules are executed in the order indicated by the arrow.
Taxonomy is assigned to the ASVs based on a QIIME2-compatible taxonomic database built using the feature-classifier classify-sklearn command [19]. The pipeline is distributed with a database based on the MIDORI2 (12S rRNA) reference sequences and the Teleo fish amplicon primers (teleoF: 5′-ACACCGCCCGTCACTCT-3′, teleoR: 5′-CTTCCGGTACACTTACCATG-3′) [25,26]. Any compatible QIIME2 database “qza” file, however, can be selected via the GUI (Figure S2). Alpha diversity rarefaction plots and taxonomic barplots are generated by the commands qiime taxa barplot and qiime diversity alpha-rarefaction, respectively. A PDF report (Supplemental File S1) containing run metrics is generated by pandoc (version 7.2.9) from a markdown template populated by the python library jinja2 (version 3.1.2).
The eDNA-container app is distributed as a Docker image based on continuumio miniconda3, a bootstrapped version of miniconda. The image was built using Docker version 18.09.7 on an HP workstation running Ubuntu 22.04 LTS. The QIIME2 pipelines bash and python scripts are maintained in a separate git repository, which is cloned into the container as part of the build script. Software tools are installed inside the container through a conda environment YAML file. The Flask library (version 2.3.2) was used to build a browser-based GUI. The GUI is displayed using a virtual server running on the host computer, so no network connection is required, and no data are shared over the internet.
Results from an eDNA-container app (version 1.5) analysis were compared to those generated by MiFish (version 1.0.3) using an eDNA test 12S rRNA dataset from [27], as described by the protocol in the MiFish GitHub page [12]. The MiFish parameters used in this analysis were as follows: -m 0 -M 99999 -f ACTGGGATTAGATACCCC -r TAGAACAGGCTCCTCTAG -s -t 10, with the primers based on [28]. The eDNA-container app DADA2 parameters were --p-trunc-len-f 100, --p-trunc-len-r 100, --p-max-ee-f 2, --p-max-ee-r 4, and --p-trunc-q 2--consensus-method consensus.
3. Results
3.1. The eDNA-Container App
The eDNA-container app is based on a core QIIME2 pipeline, with data reformatting carried out using python scripts [13]. The only software requirement is that the free application Docker Desktop is installed on the host system. Pipeline execution is managed by Snakemake with the entire application packaged in a Docker image so that it is cross-platform and will run reproducibly across different computer frameworks [24]. The image can be obtained freely from the Docker hub using the search tag “dwheelerau/edna” or using the Docker pull command from a terminal window. Advanced users with access to Linux can use the pipeline independently of Docker by cloning the conda environment from the supplied environment file and executing the snakemake workflow manually. A Flask app is used as a GUI front-end that can be accessed using a standard web-browser with no data shared across the internet. An extensive user-friendly guide targeted at ecologists and laboratory staff is provided with the package (Supplemental File S2).
3.2. The User Interface
The eDNA-container app GUI uses a Flask web interface served on the host’s computer, so no internet connection is required to use the package. Initially, a folder of paired-end sequencing data is selected using a folder selection dialogue (Figure S1). The pipeline is configured to accept paired-end FASTQ (gzip) sequencing data, which is the standard output from the Illumina MiSeq platform widely adopted by the eDNA research community.
After selecting the sequencing data, a project name is added, as well as the amplicon primer sequences, and the QIIME2 plugin parameters are adjusted (Table 1). The primer sequence information is used by the cutadapt plugin to remove any adaptor or primer sequences contained in the raw reads, with the percentage of reads containing primers included in the final project report [17]. This information is a critical quality control step as reads lacking the expected primer sequences could be an indication of sample misidentifications or poor read quality. The trunc-len-f and trunc-len-r settings parameters can be adjusted based on the read quality profiles and the size of the expected forward and reverse read overlap (Figure S2). Read quality plots and ASV statistics are presented in the final run report and can be used to adjust the previously described settings. Three chimera removal options are available, including consensus, pooled, or none, as described in the QIIME2 documentation. After entering the specific runtime settings, the pipeline will begin to process the eDNA data, and upon completion, the results are provided as a compressed zip file. In testing on a HP Z440 desktop workstation (Intel Xeon E5-1620, Intel Corporation, Santa Clara, CA, USA) with 20 GB of RAM, 12,000 paired-end reads were processed in <5 min. The taxonomic assignment step is computationally intensive in terms of RAM usage, and for this reason, a minimum of 8 GB of RAM is required to run the software (16 GB is recommended). The results include intermediate files and runtime logs that are useful for troubleshooting and parameter optimization. Output related to the pipeline progress is printed to the Docker terminal window as this contains useful information should the pipeline report that the run has failed (Figure S3).

Table 1.
A summary describing the key settings that are available to the user via the GUI.
3.3. Pipeline Outputs
The key pipeline outputs are shown in Table 2. The main taxa count spreadsheet summarizes species identifications across all samples and includes the ASV sequence used to assign the taxonomic label. The ASV sequence included in the spreadsheet allows for NCBI-BLAST searches so that the taxonomic identification can be independently verified, which is an important quality control step in eDNA analyses (Supplemental File S3). When multiple ASVs are given for the same taxonomic assignment, these counts are summed, and the most common variant presented in the spreadsheet, with the number of variants, is included in the “Reference_variants” column. Also, alpha diversity plots are created allowing the researcher to determine if the sequencing depth was likely sufficient to identify all species found in each sample. These plots are interactive when viewed using the online QIIME2 viewer. A PDF report is populated with information on the key quality control metrics and ASV statistics (Supplemental File S1). This report contains the read quality plots and DADA2 denoise outputs that are important for quality control and can be used to adjust runtime settings to improve the number of forward and reverse read overlaps [18].
Table 2.
A summary of the output files generated by the eDNA-container app (qzv files can be viewed interactively using the QIIME2 viewer).
3.4. A Comparison to the MiFish eDNA Pipeline
MiFish is a mature eDNA processing pipeline that is under active development [11,12]. We were interested in testing the performance of the eDNA-container app against this well-established pipeline. Therefore, we used the eDNA-container app to analyze the test dataset provided by MiFish, which is based on an eDNA dataset generated by [27]. The species lists reported across all samples by both packages were very similar, with 18 of 19 species identified by the eDNA-container app (Supplemental File S3) also being found by MiFish (Supplemental File S4). The eDNA-container app identified a Bos taurus barcode that was not in the MiFish outputs, but this was a low confidence assignment (<90%). MiFish shared 19 of 21 species with the eDNA-container app, with the two unique species in the MiFish results being Anas platyrhynchos and Blicca bjoerkna. Once again, these species assignments unique to MiFish were flagged as low confidence by the software. Table 3 shows a comparison of the number of species detected in each sample found in the tested dataset. There is a high level of consistency across both pipelines, and differences were detected only for low-count taxa. The detection of low-count taxa is strongly influenced by sampling biases due to the different read quality filtering and ASV algorithms adopted by the eDNA-container app and MiFish.
Table 3.
The number of species detected by the eDNA-container app and MiFish based on the data from Brys et al. (2021). When species are only detected by one pipeline, it is indicated in parentheses. Species are only considered if the assignment confidence level is medium/high for MiFish or >90% for the eDNA-container app. SRA accession numbers for each sample from Brys et al. (2021) are provided in column 1.
The main difference in the outputs from the two pipelines is that MiFish consistently reports higher read counts for each taxon. The reason for these higher taxa counts is that MiFish reports single-end read counts, whilst the eDNA-container app reports amplicon fragment counts (the R1 and R2 read pairs are considered as a single fragment). Another reason for the difference in taxa counts between the two pipelines is that the eDNA-container app conservatively only counts amplicons if the PCR primers can be identified at the ends of the paired-end reads. Although this latter strategy reduces the influence of putative PCR artifacts, it does come at the cost of sampling depth.
In summary, despite differences in the detection of low-count taxa, the outputs from the eDNA-container app and MiFish are very similar in terms of high confidence identifications and abundance rankings of taxa. Users familiar with the popular QIIME2 ecosystem of tools will benefit from eDNA-container app outputs as they will be compatible with existing downstream processing pipelines. The ability to view raw data outputs from the eDNA-container app using the drag-and-drop QIIIME2 viewer is also advantageous for scientists who prefer web-based interactive plotting tools. As MiFish and the eDNA-container app use different underlying algorithms, the availability of both packages provides scientists with two alternative pipelines to assess the robustness of captured eDNA profiles.
4. Discussion
The ability to monitor ecosystems using non-invasive and relatively inexpensive methods such as eDNA will contribute to the better management of these important habitats and the resources they contain [2,4,5,24,29]. However, many of the free and open-source tools used for eDNA analysis have complex command-line interfaces that can be challenging for wet lab staff to utilize [30,31]. The eDNA-container app uses a point-and-click interface that will allow lab scientists to analyze their own eDNA sequencing data using the latest bioinformatics software. The distribution of the app as a Docker image allows for cross-platform usage and supports reproducible eDNA analyses across different computer frameworks.
The eDNA-container app automatically generates a PDF report that describes important runtime parameters so that researchers can adjust quality trimming stringency and ASV generation settings. The final ASV spreadsheet includes the DNA sequence of the loci so taxonomic classifications can be confirmed quickly using tools such as NCBI-BLAST. Also, alpha diversity and species barplots are reported so scientists can assess the taxonomic sampling depth obtained in the experiment, as well as visualize the species diversity across samples.
The eDNA-container app is customizable and can be used to analyze data from any eDNA loci or QIIME2-compatible taxonomic database. Importantly, the use of Docker supports reproducible research in the eDNA community, which is an important development as the underlying methodologies continue to be optimized [3,32]. The development of a free and easy-to-use analysis application will support the increased uptake of eDNA technologies and thus help improve biosecurity and ecosystem monitoring.
Supplementary Materials
The following supporting information can be downloaded at: https://www.mdpi.com/article/10.3390/app14062641/s1. Supplemental_figs.docx: Supplemental Figures S1–S3. Supplemental File S1: an example PDF report generated using the eDNA-container app. Supplemental File S2: a guide for ecologists and lab scientists on using Docker and the eDNA-container app. Supplemental File S3: an example of the eDNA taxonomy counts spreadsheet generated by the app based on the data from [27]. Supplemental File S4: MiFish outputs from the [27] dataset.
Author Contributions
D.W. conceived the idea for the eDNA-container app, wrote the software, and drafted the manuscript. L.B., A.K. and M.L.R. provided critical feedback during testing, contributed to the project development, and reviewed the manuscript. All authors have read and agreed to the published version of the manuscript.
Funding
This work was supported by a grant from Krista Mentjox from the NSW Department of Primary Industries Business Development team.
Institutional Review Board Statement
Not applicable.
Informed Consent Statement
Not applicable.
Data Availability Statement
The complete code for this project is available at the GitHub (https://github.com/dwheelerau/edna-container) and Bitbucket (https://bitbucket.org/dpi_data_analytics/snakemake-qiime-edna/) code repositories.
Acknowledgments
We wish to thank Bernie Dominiak, John Webster, and Niharika Sharma for the critical review of this manuscript before submission. The authors declare that the written English used in this manuscript was polished with the aid of a Large Language AI model (Google Bard).
Conflicts of Interest
The authors declare no conflicts of interest.
References
- Barnes, M.A.; Turner, C.R. The Ecology of Environmental DNA and Implications for Conservation Genetics. Conserv. Genet. 2016, 17, 1–17. [Google Scholar] [CrossRef]
- Fonseca, V.G.; Davison, P.I.; Creach, V.; Stone, D.; Bass, D.; Tidbury, H.J. The Application of EDNA for Monitoring Aquatic Non-Indigenous Species: Practical and Policy Considerations. Diversity 2023, 15, 631. [Google Scholar] [CrossRef]
- Bowers, H.A.; Pochon, X.; von Ammon, U.; Gemmell, N.; Stanton, J.-A.L.; Jeunen, G.-J.; Sherman, C.D.H.; Zaiko, A. Towards the Optimization of EDNA/ERNA Sampling Technologies for Marine Biosecurity Surveillance. Water 2021, 13, 1113. [Google Scholar] [CrossRef]
- Altermatt, F.; Carraro, L.; Antonetti, M.; Albouy, C.; Zhang, Y.; Lyet, A.; Zhang, X.; Pellissier, L. Quantifying Biodiversity Using EDNA from Water Bodies: General Principles and Recommendations for Sampling Designs. Environ. DNA 2023, 5, 671–682. [Google Scholar] [CrossRef]
- Takahashi, M.; Saccò, M.; Kestel, J.H.; Nester, G.; Campbell, M.A.; van der Heyde, M.; Heydenrych, M.J.; Juszkiewicz, D.J.; Nevill, P.; Dawkins, K.L.; et al. Aquatic Environmental DNA: A Review of the Macro-Organismal Biomonitoring Revolution. Sci. Total Environ. 2023, 873, 162322. [Google Scholar] [CrossRef] [PubMed]
- Govindarajan, A.F.; McCartin, L.; Adams, A.; Allan, E.; Belani, A.; Francolini, R.; Fujii, J.; Gomez-Ibañez, D.; Kukulya, A.; Marin, F.; et al. Improved Biodiversity Detection Using a Large-Volume Environmental DNA Sampler with in Situ Filtration and Implications for Marine EDNA Sampling Strategies. Deep Sea Res. Part I 2022, 189, 103871. [Google Scholar] [CrossRef]
- Maiello, G.; Talarico, L.; Carpentieri, P.; De Angelis, F.; Franceschini, S.; Harper, L.R.; Neave, E.F.; Rickards, O.; Sbrana, A.; Shum, P.; et al. Little Samplers, Big Fleet: EDNA Metabarcoding from Commercial Trawlers Enhances Ocean Monitoring. Fish. Res. 2022, 249, 106259. [Google Scholar] [CrossRef]
- Hervé, A.; Domaizon, I.; Baudoin, J.-M.; Dejean, T.; Gibert, P.; Jean, P.; Peroux, T.; Raymond, J.-C.; Valentini, A.; Vautier, M.; et al. Spatio-Temporal Variability of EDNA Signal and Its Implication for Fish Monitoring in Lakes. PLoS ONE 2022, 17, e0272660. [Google Scholar] [CrossRef]
- Rognes, T.; Flouri, T.; Nichols, B.; Quince, C.; Mahé, F. VSEARCH: A Versatile Open Source Tool for Metagenomics. PeerJ 2016, 4, e2584. [Google Scholar] [CrossRef]
- Edgar, R.C. Search and Clustering Orders of Magnitude Faster than BLAST. Bioinformatics 2010, 26, 2460–2461. [Google Scholar] [CrossRef]
- Zhu, T.; Sato, Y.; Sado, T.; Miya, M.; Iwasaki, W. MitoFish, MitoAnnotator, and MiFish Pipeline: Updates in 10 Years. Mol. Biol. Evol. 2023, 40, msad035. [Google Scholar] [CrossRef] [PubMed]
- Sato, Y.; Miya, M.; Fukunaga, T.; Sado, T.; Iwasaki, W. MitoFish and MiFish Pipeline: A Mitochondrial Genome Database of Fish with an Analysis Pipeline for Environmental DNA Metabarcoding. Mol. Biol. Evol. 2018, 35, 1553–1555. [Google Scholar] [CrossRef] [PubMed]
- Bolyen, E.; Rideout, J.R.; Dillon, M.R.; Bokulich, N.A.; Abnet, C.C.; Al-Ghalith, G.A.; Alexander, H.; Alm, E.J.; Arumugam, M.; Asnicar, F.; et al. Reproducible, Interactive, Scalable and Extensible Microbiome Data Science Using QIIME 2. Nat. Biotechnol. 2019, 37, 852–857. [Google Scholar] [CrossRef] [PubMed]
- Xiong, F.; Shu, L.; Zeng, H.; Gan, X.; He, S.; Peng, Z. Methodology for Fish Biodiversity Monitoring with Environmental DNA Metabarcoding: The Primers, Databases and Bioinformatic Pipelines. Water Biol. Secur. 2022, 1, 100007. [Google Scholar] [CrossRef]
- Casas, L.; Saborido-Rey, F. State of the Art Review of Bioinformatics Analysis of Environmental DNA. 2022. Available online: https://digital.csic.es/handle/10261/297267 (accessed on 1 June 2023).
- Dubois, B.; Debode, F.; Hautier, L.; Hulin, J.; Martin, G.S.; Delvaux, A.; Janssen, E.; Mingeot, D. A Detailed Workflow to Develop QIIME2-Formatted Reference Databases for Taxonomic Analysis of DNA Metabarcoding Data. BMC Genom Data 2022, 23, 53. [Google Scholar] [CrossRef] [PubMed]
- Martin, M. Cutadapt Removes Adapter Sequences from High-Throughput Sequencing Reads. EMBnet. J. 2011, 17, 10–12. [Google Scholar] [CrossRef]
- Callahan, B.J.; McMurdie, P.J.; Rosen, M.J.; Han, A.W.; Johnson, A.J.A.; Holmes, S.P. DADA2: High-Resolution Sample Inference from Illumina Amplicon Data. Nat. Methods 2016, 13, 581–583. [Google Scholar] [CrossRef]
- Pedregosa, F.; Varoquaux, G.; Gramfort, A.; Michel, V.; Thirion, B.; Grisel, O.; Blondel, M.; Müller, A.; Nothman, J.; Louppe, G.; et al. Scikit-Learn: Machine Learning in Python. J. Mach. Learn. Res. 2012, 12, 2825–2830. Available online: https://www.jmlr.org/papers/volume12/pedregosa11a/pedregosa11a.pdf?ref=https:/ (accessed on 2 January 2024).
- Boettiger, C. An Introduction to Docker for Reproducible Research. Oper. Syst. Rev. 2015, 49, 71–79. [Google Scholar] [CrossRef]
- Chamberlain, R.; Schommer, J. Using Docker to Support Reproducible Research. Figshare 2014, 44, 1101910. [Google Scholar] [CrossRef]
- Peikert, A.; Brandmaier, A.M. A Reproducible Data Analysis Workflow With R Markdown, Git, Make, and Docker. Quant. Comput. Methods Behav. Sci. 2021, 1, 1–27. [Google Scholar] [CrossRef]
- Cohen-Boulakia, S.; Belhajjame, K.; Collin, O.; Chopard, J.; Froidevaux, C.; Gaignard, A.; Hinsen, K.; Larmande, P.; Bras, Y.L.; Lemoine, F.; et al. Scientific Workflows for Computational Reproducibility in the Life Sciences: Status, Challenges and Opportunities. Future Gener. Comput. Syst. 2017, 75, 284–298. [Google Scholar] [CrossRef]
- Köster, J.; Rahmann, S. Snakemake—A Scalable Bioinformatics Workflow Engine. Bioinformatics 2012, 28, 2520–2522. [Google Scholar] [CrossRef]
- Leray, M.; Knowlton, N.; Machida, R.J. MIDORI2: A Collection of Quality Controlled, Preformatted, and Regularly Updated Reference Databases for Taxonomic Assignment of Eukaryotic Mitochondrial Sequences. Environ. DNA 2022, 4, 894–907. [Google Scholar] [CrossRef]
- Valentini, A.; Taberlet, P.; Miaud, C.; Civade, R.; Herder, J.; Thomsen, P.F.; Bellemain, E.; Besnard, A.; Coissac, E.; Boyer, F.; et al. Next-Generation Monitoring of Aquatic Biodiversity Using Environmental DNA Metabarcoding. Mol. Ecol. 2016, 25, 929–942. [Google Scholar] [CrossRef]
- Brys, R.; Haegeman, A.; Halfmaerten, D.; Neyrinck, S.; Staelens, A.; Auwerx, J.; Ruttink, T. Monitoring of Spatiotemporal Occupancy Patterns of Fish and Amphibian Species in a Lentic Aquatic System Using Environmental DNA. Mol. Ecol. 2021, 30, 3097–3110. [Google Scholar] [CrossRef]
- Riaz, T.; Shehzad, W.; Viari, A.; Pompanon, F.; Taberlet, P.; Coissac, E. EcoPrimers: Inference of New DNA Barcode Markers from Whole Genome Sequence Analysis. Nucleic Acids Res. 2011, 39, e145. [Google Scholar] [CrossRef]
- Rishan, S.T.; Kline, R.J.; Rahman, M.S. Applications of Environmental DNA (EDNA) to Detect Subterranean and Aquatic Invasive Species: A Critical Review on the Challenges and Limitations of EDNA Metabarcoding. Environ. Adv. 2023, 12, 100370. [Google Scholar] [CrossRef]
- Laub, V.; Devraj, K.; Elias, L.; Schulte, D. Bioinformatics for Wet-Lab Scientists: Practical Application in Sequencing Analysis. BMC Genom. 2023, 24, 382. [Google Scholar] [CrossRef] [PubMed]
- Rather, M.A.; Agarwal, D.; Bhat, T.A.; Khan, I.A.; Zafar, I.; Kumar, S.; Amin, A.; Sundaray, J.K.; Qadri, T. Bioinformatics Approaches and Big Data Analytics Opportunities in Improving Fisheries and Aquaculture. Int. J. Biol. Macromol. 2023, 233, 123549. [Google Scholar] [CrossRef]
- Sanches, T.M.; Schreier, A.D. Optimizing an EDNA Protocol for Estuarine Environments: Balancing Sensitivity, Cost and Time. PLoS ONE 2020, 15, e0233522. [Google Scholar] [CrossRef] [PubMed]
Disclaimer/Publisher’s Note: The statements, opinions and data contained in all publications are solely those of the individual author(s) and contributor(s) and not of MDPI and/or the editor(s). MDPI and/or the editor(s) disclaim responsibility for any injury to people or property resulting from any ideas, methods, instructions or products referred to in the content. |
© 2024 by the authors. Licensee MDPI, Basel, Switzerland. This article is an open access article distributed under the terms and conditions of the Creative Commons Attribution (CC BY) license (https://creativecommons.org/licenses/by/4.0/).