
Diagnostic Accuracy of Digital Solutions for Screening for Cognitive Impairment: A Systematic Review and Meta-Analysis
 , , and
Abstract
1. Introduction
2. Materials and Methods
2.1. Protocol Registration
2.2. Search Strategy and Study Eligibility Criteria
2.3. Study Selection Process and Data Extraction
2.4. Methodological Quality Assessment
2.5. Quality of the Evidence
2.6. Data Analysis
3. Results
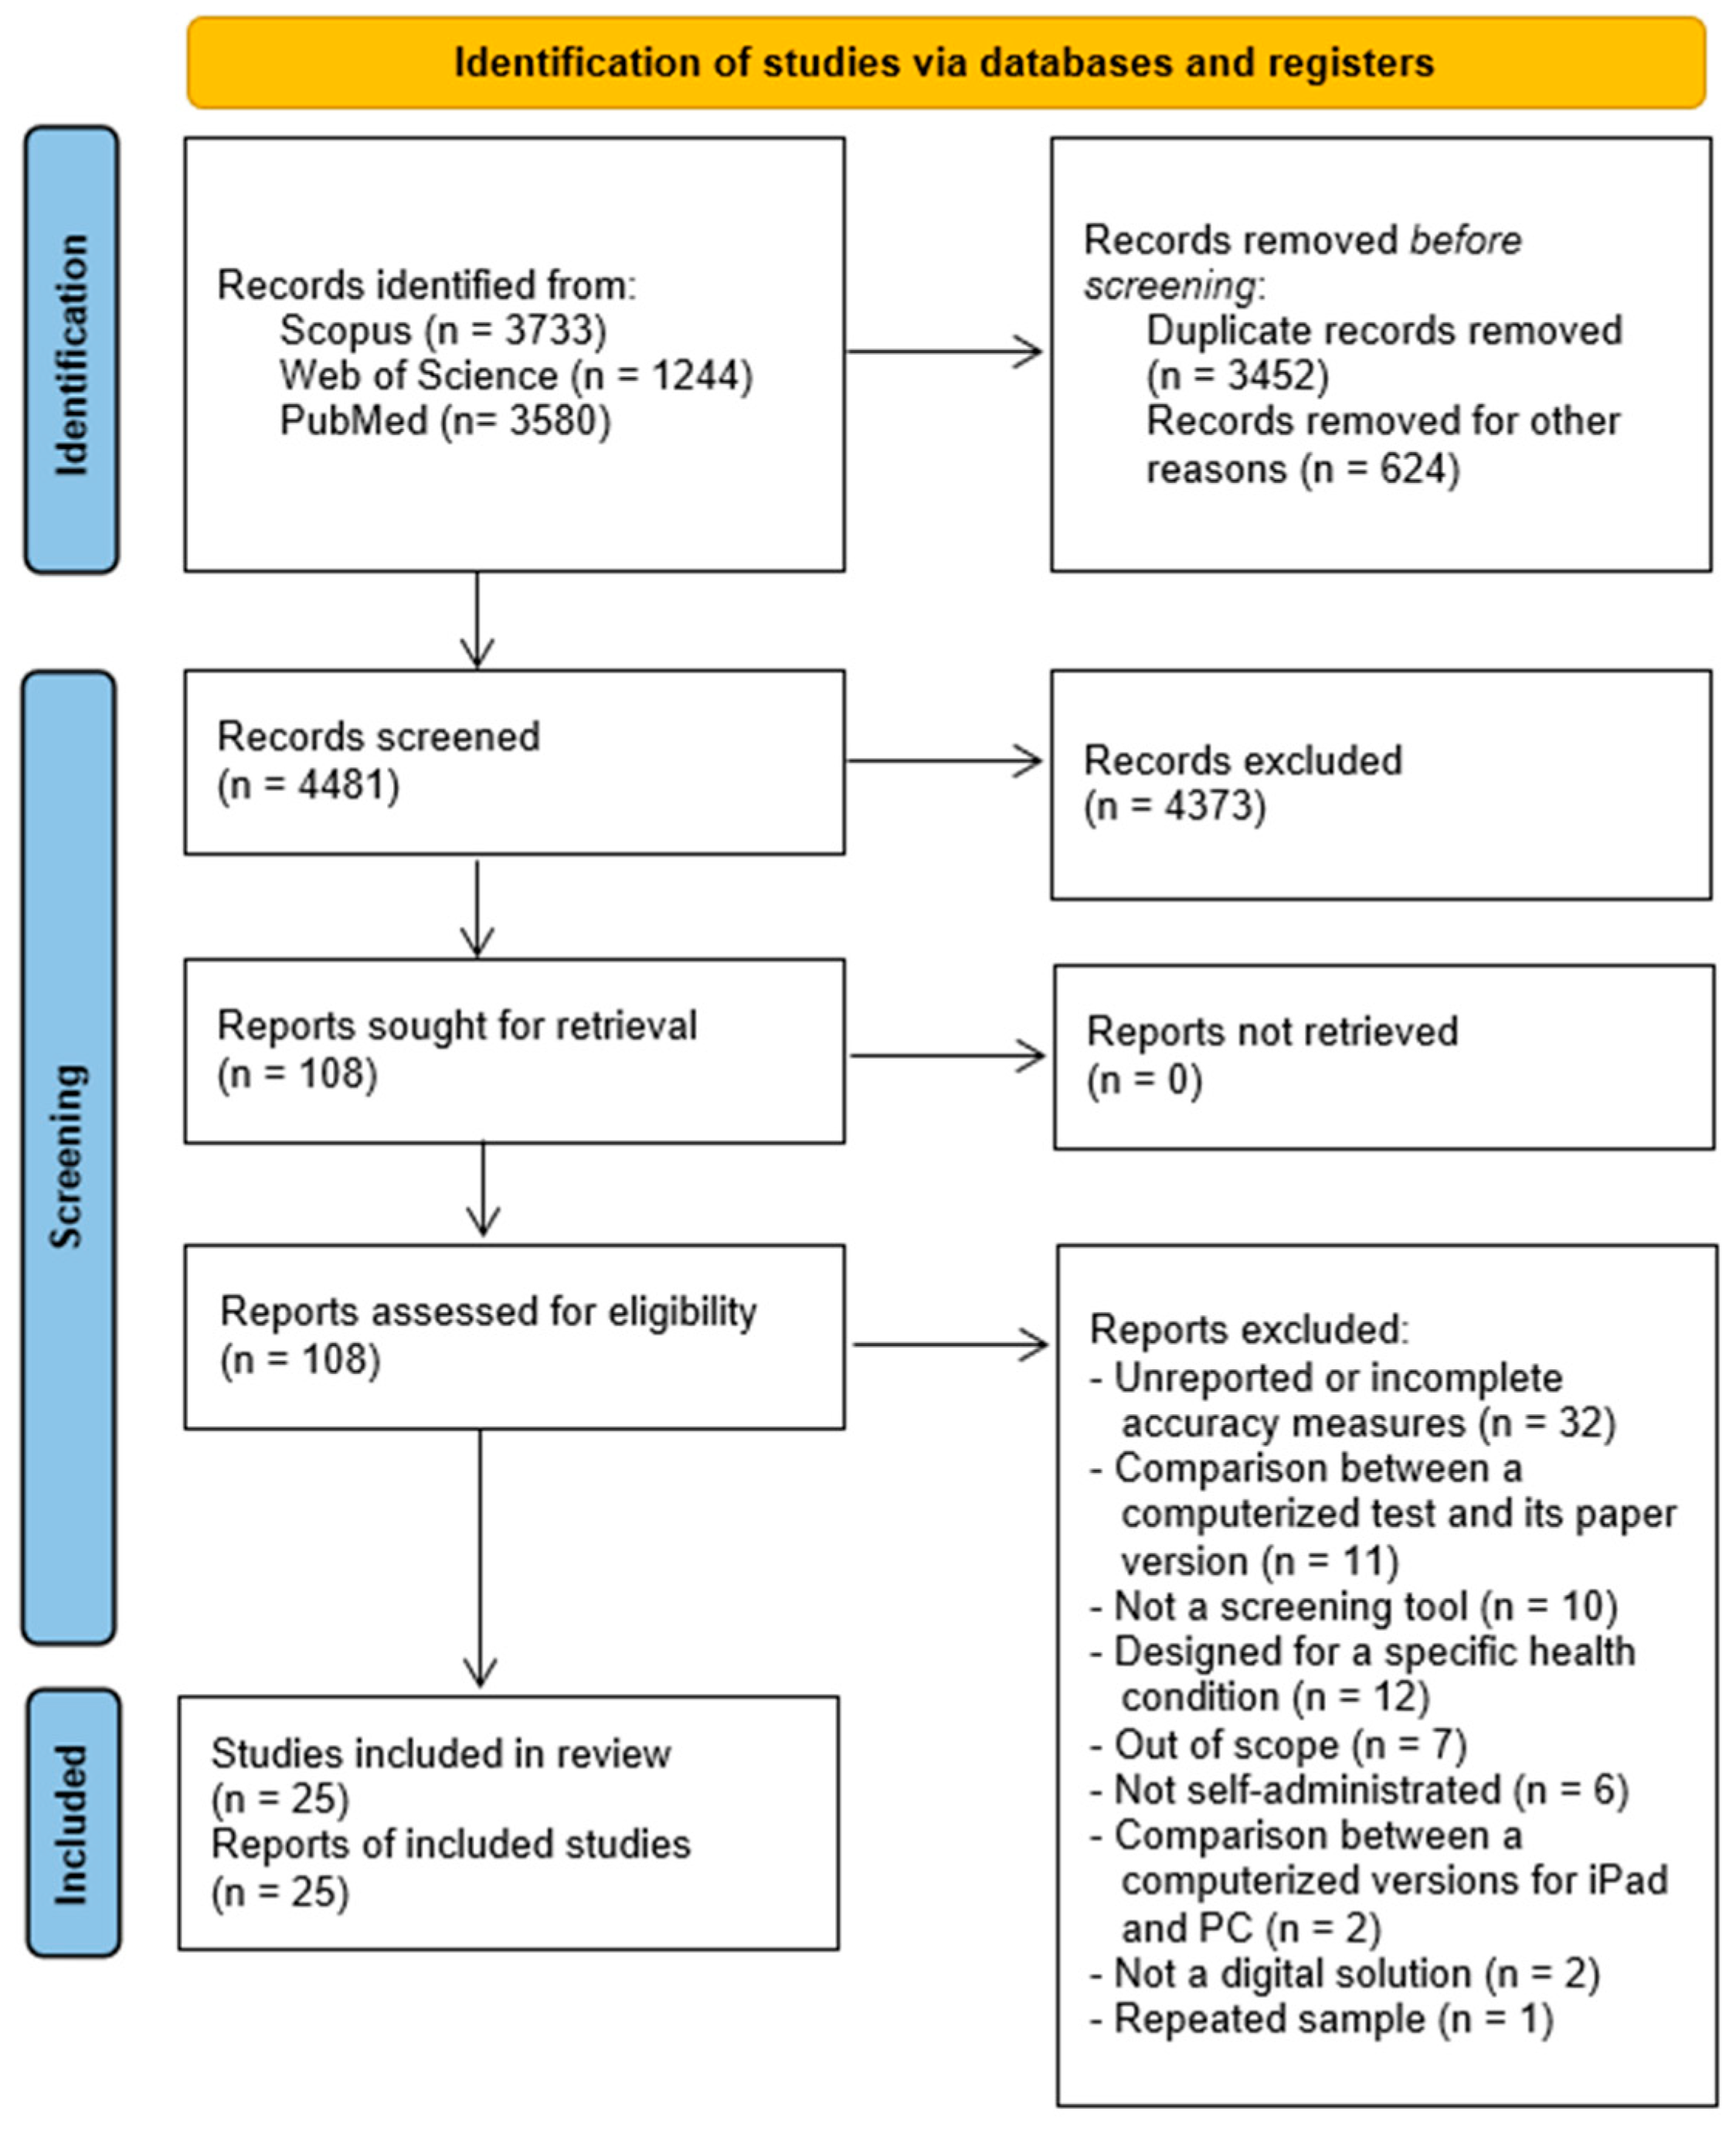
3.1. Study Selection
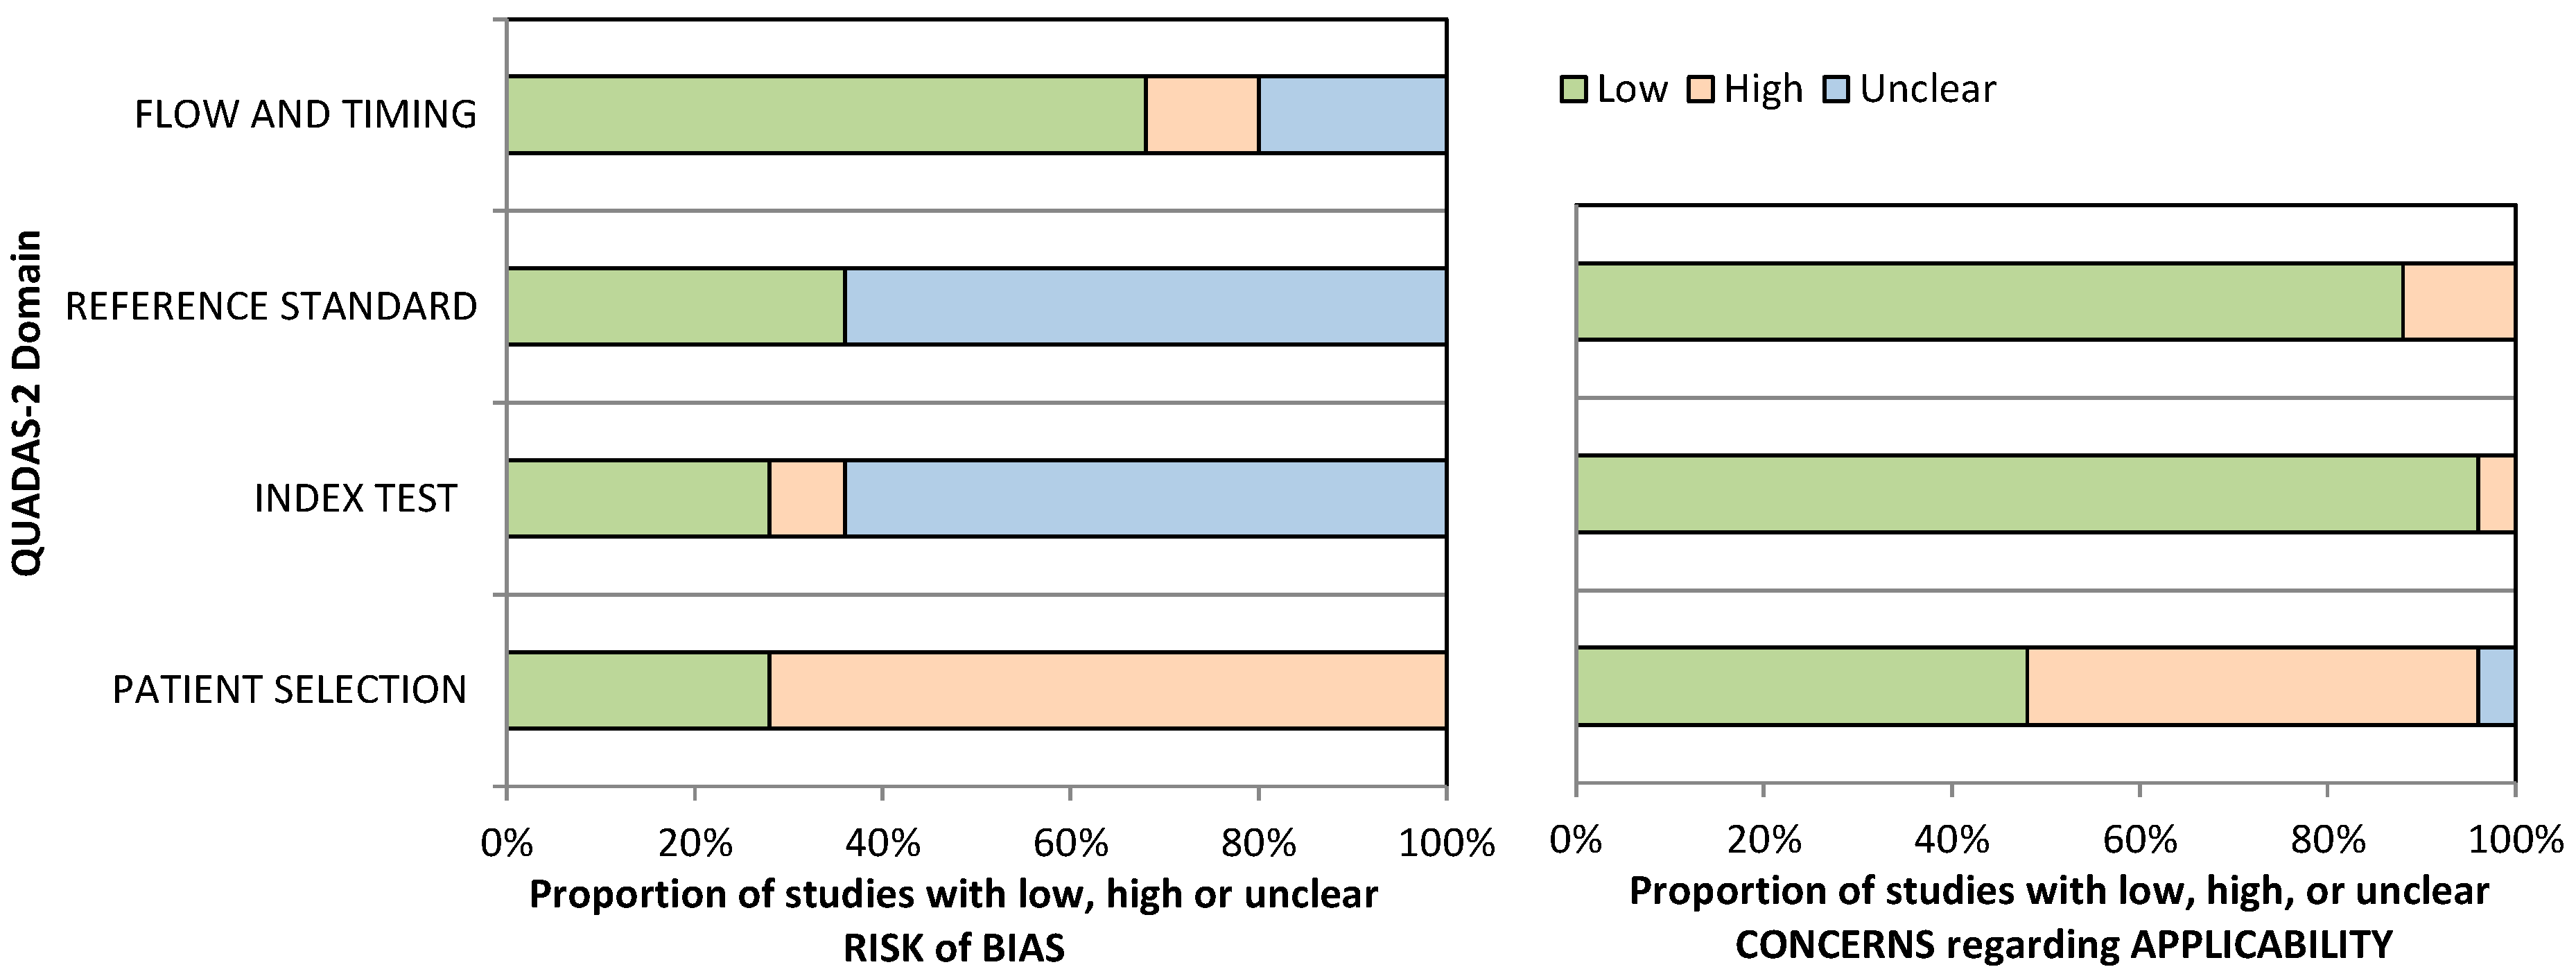
3.2. Methodological Quality
3.3. General Overview of Included Studies
3.4. Meta-Analysis Results
4. Discussion
5. Conclusions
Supplementary Materials
Author Contributions
Funding
Institutional Review Board Statement
Informed Consent Statement
Data Availability Statement
Conflicts of Interest
References
- Holsinger, T.; Deveau, J.; Boustani, M.; Williams, J.W. Does this patient have dementia? JAMA 2007, 297, 2391–2404. [Google Scholar] [CrossRef] [PubMed]
- Plassman, B.L.; Williams, J.W.J.; Burke, J.R.; Holsinger, T.; Benjamin, S. Systematic review: Factors associated with risk for and possible prevention of cognitive decline in later life. Ann. Intern. Med. 2010, 153, 182–193. [Google Scholar] [CrossRef] [PubMed]
- Ritchie, K.; Carriere, I.; Ritchie, C.W.; Berr, C.; Artero, S.; Ancelin, M.-L. Designing prevention programmes to reduce incidence of dementia: Prospective cohort study of modifiable risk factors. BMJ 2010, 341, c3885. [Google Scholar] [CrossRef] [PubMed]
- Livingston, G.; Sommerlad, A.; Orgeta, V.; Costafreda, S.G.; Huntley, J.; Ames, D.; Ballard, C.; Banerjee, S.; Burns, A.; Cohen-Mansfield, J.; et al. Dementia prevention, intervention, and care. Lancet 2017, 390, 2673–2734. [Google Scholar] [CrossRef]
- Boyle, P.A.; Buchman, A.S.; Wilson, R.S.; Leurgans, S.E.; Bennett, D.A. Physical frailty is associated with incident Mild Cognitive Impairment in community-based older persons. J. Am. Geriatr. Soc. 2010, 58, 248–255. [Google Scholar] [CrossRef] [PubMed]
- US Preventive Services Task Force. Screening for cognitive impairment in older adults: US Preventive Services Task Force recommendation statement. JAMA 2020, 323, 757–763. [Google Scholar] [CrossRef]
- Sabbagh, M.N.; Boada, M.; Borson, S.; Chilukuri, M.; Dubois, B.; Ingram, J.; Iwata, A.; Porsteinsson, A.P.; Possin, K.L.; Rabinovici, G.D.; et al. Early detection of Mild Cognitive Impairment (MCI) in primary care. J. Prev. Alzheimer’s Dis. 2020, 7, 165–170. [Google Scholar] [CrossRef]
- Jack, C.R.; Bennett, D.A.; Blennow, K.; Carrillo, M.C.; Dunn, B.; Haeberlein, S.B.; Holtzman, D.M.; Jagust, W.; Jessen, F.; Karlawish, J.; et al. NIA-AA Research Framework: Toward a biological definition of Alzheimer’s disease. Alzheimer’s Dement. 2018, 14, 535–562. [Google Scholar] [CrossRef]
- Petersen, R.C.; Caracciolo, B.; Brayne, C.; Gauthier, S.; Jelic, V.; Fratiglioni, L. Mild Cognitive Impairment: A concept in evolution. J. Intern. Med. 2014, 275, 214–228. [Google Scholar] [CrossRef]
- Roberts, R.O.; Knopman, D.S.; Mielke, M.M.; Cha, R.H.; Pankratz, V.S.; Christianson, T.J.; Geda, Y.E.; Boeve, B.F.; Ivnik, R.J.; Tangalos, E.G.; et al. Higher risk of progression to dementia in Mild Cognitive Impairment cases who revert to normal. Neurology 2014, 82, 317–325. [Google Scholar] [CrossRef]
- Limpawattana, P.; Manjavong, M. The Mini-Cog, Clock Drawing Test, and Three-Item Recall Test: Rapid cognitive screening tools with comparable performance in detecting Mild NCD in older patients. Geriatrics 2021, 6, 91. [Google Scholar] [CrossRef]
- De Roeck, E.E.; De Deyn, P.P.; Dierckx, E.; Engelborghs, S. Brief cognitive screening instruments for early detection of Alzheimer’s disease: A systematic review. Alzheimer’s Res. Ther. 2019, 11, 21. [Google Scholar] [CrossRef]
- Brodaty, H.; Low, L.-F.; Gibson, L.; Burns, K. What is the best dementia screening instrument for general practitioners to use? Am. J. Geriatr. Psychiatry 2006, 14, 391–400. [Google Scholar] [CrossRef]
- Folstein, M.F.; Folstein, S.E.; McHugh, P.R. “Mini-mental state”: A practical method for grading the cognitive state of patients for the clinician. J. Psychiatr. Res. 1975, 12, 189–198. [Google Scholar] [CrossRef]
- Nasreddine, Z.S.; Phillips, N.A.; Bédirian, V.; Charbonneau, S.; Whitehead, V.; Collin, I.; Cummings, J.L.; Chertkow, H. The Montreal Cognitive Assessment, MoCA: A brief screening tool for Mild Cognitive Impairment. J. Am. Geriatr. Soc. 2005, 53, 695–699. [Google Scholar] [CrossRef]
- Walterfang, M.; Siu, R.; Velakoulis, D. The NUCOG: Validity and reliability of a brief cognitive screening tool in neuropsychiatric patients. Aust. N. Z. J. Psychiatry 2006, 40, 995–1002. [Google Scholar] [CrossRef] [PubMed]
- Tariq, S.H.; Tumosa, N.; Chibnall, J.T.; Perry, M.H., 3rd; Morley, J.E. Comparison of the Saint Louis University Mental Status examination and the Mini-Mental State Examination for detecting dementia and mild neurocognitive disorder—A pilot study. Am. J. Geriatr. Psychiatry 2006, 14, 900–910. [Google Scholar] [CrossRef] [PubMed]
- Scharre, D.W.; Chang, S.I.; Murden, R.A.; Lamb, J.; Beversdorf, D.Q.; Kataki, M.; Nagaraja, H.N.; Bornstein, R.A. Self-Administered Gerocognitive Examination (SAGE): A brief cognitive assessment instrument for Mild Cognitive Impairment (MCI) and early dementia. Alzheimer Dis. Assoc. Disord. 2010, 24, 64–71. [Google Scholar] [CrossRef]
- Elamin, M.; Holloway, G.; Bak, T.H.; Pal, S. The utility of the Addenbrooke’s Cognitive Examination Version Three in early-onset dementia. Dement. Geriatr. Cogn. Disord. 2016, 41, 9–15. [Google Scholar] [CrossRef] [PubMed]
- Dsurney, J. Alzheimer’s Quick Test: Assessment of parietal lobe function. Appl. Neuropsychol. 2007, 14, 232–233. [Google Scholar] [CrossRef] [PubMed]
- Takechi, H.; Dodge, H.H. Scenery Picture Memory Test: A new type of quick and effective screening test to detect early stage Alzheimer’s disease patients. Geriatr. Gerontol. Int. 2010, 10, 183–190. [Google Scholar] [CrossRef]
- Buschke, H.; Kuslansky, G.; Katz, M.; Stewart, W.; Sliwinski, M.; Eckholdt, H.; Lipton, R. Screening for dementia with the Memory Impairment Screen. Neurology 1999, 52, 231. [Google Scholar] [CrossRef] [PubMed]
- Borson, S.; Scanlan, J.M.; Chen, P.; Ganguli, M. The Mini-Cog as a screen for dementia: Validation in a population-based sample. J. Am. Geriatr. Soc. 2003, 51, 1451–1454. [Google Scholar] [CrossRef] [PubMed]
- Borson, S.; Scanlan, J.; Brush, M.; Vitaliano, P.; Dokmak, A. The Mini-Cog: A cognitive ‘vital signs’ measure for dementia screening in multi-lingual elderly. Int. J. Geriatr. Psychiatry 2000, 15, 1021–1027. [Google Scholar] [CrossRef] [PubMed]
- Ehreke, L.; Luppa, M.; König, H.-H.; Riedel-Heller, S.G. Is the Clock Drawing Test a screening tool for the diagnosis of Mild Cognitive Impairment? A systematic review. Int. Psychogeriatr. 2010, 22, 56–63. [Google Scholar] [CrossRef] [PubMed]
- Siqueira, G.S.A.; Hagemann, P.D.M.; Coelho, D.D.S.; Santos, F.H.D.; Bertolucci, P.H. Can MoCA and MMSE be interchangeable cognitive screening tools? A systematic review. Gerontologist 2019, 59, e743–e763. [Google Scholar] [CrossRef]
- Sabbagh, M.N.; Boada, M.; Borson, S.; Doraiswamy, P.M.; Dubois, B.; Ingram, J.; Iwata, A.; Porsteinsson, A.P.; Possin, K.L.; Rabinovici, G.D.; et al. Early detection of Mild Cognitive Impairment (MCI) in an at-home setting. J. Prev. Alzheimer’s Dis. 2020, 7, 171–178. [Google Scholar] [CrossRef]
- Diaz-orueta, U.; Blanco-Campal, A.; Lamar, M.; Libon, D.J.; Burke, T. Marrying past and present neuropsychology: Is the future of the process-based approach technology-based? Front. Psychol. 2020, 11, 361. [Google Scholar] [CrossRef]
- Berg, J.-L.; Durant, J.; Léger, G.C.; Cummings, J.L.; Nasreddine, Z.; Miller, J.B. Comparing the electronic and standard versions of the Montreal Cognitive Assessment in an outpatient memory disorders clinic: A validation study. J. Alzheimer’s Dis. 2018, 62, 93–97. [Google Scholar] [CrossRef]
- Wohlfahrt-Laymann, J.; Hermens, H.; Villalonga, C.; Vollenbroek-Hutten, M.; Banos, O. MobileCogniTracker. J. Ambient Intell. Humaniz. Comput. 2019, 10, 2143–2160. [Google Scholar] [CrossRef]
- Lauraitis, A.; Maskeliūnas, R.; Damaševičius, R.; Krilavičius, T. A mobile application for smart computer-aided self-administered testing of cognition, speech, and motor impairment. Sensors 2020, 20, 3236. [Google Scholar] [CrossRef]
- Hansen, T.I.; Haferstrom, E.C.D.; Brunner, J.F.; Lehn, H.; Håberg, A.K. Initial validation of a web-based self-administered neuropsychological test battery for older adults and seniors. J. Clin. Exp. Neuropsychol. 2015, 37, 581–594. [Google Scholar] [CrossRef]
- Assmann, K.E.; Bailet, M.; Lecoffre, A.C.; Galan, P.; Hercberg, S.; Amieva, H.; Kesse-Guyot, E. Comparison between a self-administered and supervised version of a web-based cognitive test battery: Results from the NutriNet-Santé cohort study. J. Med. Internet Res. 2016, 18, e68. [Google Scholar] [CrossRef]
- Morris, R.G.; Evenden, J.L.; Sahakian, B.J.; Robbins, T.W. Computer-aided assessment of dementia: Comparative studies of neuropsychological deficits in Alzheimer-type dementia and Parkinson’s disease. In Cognitive Neurochemistry; Oxford University Press: Oxford, UK, 1987; pp. 21–36. [Google Scholar]
- Bevilacqua, R.; Barbarossa, F.; Fantechi, L.; Fornarelli, D.; Paci, E.; Bolognini, S.; Giammarchi, C.; Lattanzio, F.; Paciaroni, L.; Riccardi, G.R.; et al. Radiomics and artificial intelligence for the diagnosis and monitoring of Alzheimer’s disease: A systematic review of studies in the field. J. Clin. Med. 2023, 12, 5432. [Google Scholar] [CrossRef]
- Bevilacqua, R.; Felici, E.; Cucchieri, G.; Amabili, G.; Margaritini, A.; Franceschetti, C.; Barboni, I.; Paolini, S.; Civerchia, P.; Raccichini, A.; et al. Results of the italian RESILIEN-T pilot study: A mobile health tool to support older people with Mild Cognitive Impairment. J. Clin. Med. 2023, 12, 6129. [Google Scholar] [CrossRef]
- Pereira, C.R.; Pereira, D.R.; Weber, S.A.; Hook, C.; de Albuquerque, V.H.C.; Papa, J.P. A survey on computer-assisted Parkinson’s disease diagnosis. Artif. Intell. Med. 2019, 95, 48–63. [Google Scholar] [CrossRef] [PubMed]
- Lumsden, J.; Edwards, E.A.; Lawrence, N.S.; Coyle, D.; Munafò, M.R. Gamification of cognitive assessment and cognitive training: A systematic review of applications and efficacy. JMIR Serious Games 2016, 4, e11. [Google Scholar] [CrossRef] [PubMed]
- Macaskill, P.; Gatsonis, C.; Deeks, J.; Harbord, R.; Takwoingi, Y. Analysing and presenting results. In Cochrane Handbook for Systematic Reviews of Diagnostic Test Accuracy; Cochrane: London, UK, 2010; pp. 1–61. [Google Scholar]
- Moher, D.; Liberati, A.; Tetzlaff, J.; Altman, D.G.; Group, T.P. Preferred Reporting Items for Systematic Reviews and Meta-Analyses: The PRISMA statement. PLoS Med. 2009, 6, e1000097. [Google Scholar] [CrossRef] [PubMed]
- Silva, A.; Rocha, N.; Martins, A.; Pais, J. Diagnostic accuracy of digital solutions to screen for cognitive impairment: A systematic review. Available online: http://srdta.cochrane.org/ (accessed on 31 March 2022).
- Cohen, J.F.; Korevaar, D.A.; Altman, D.G.; Bruns, D.E.; Gatsonis, C.A.; Hooft, L.; Irwig, L.; Levine, D.; Reitsma, J.B.; de Vet, H.C.W.; et al. STARD 2015 guidelines for reporting diagnostic accuracy studies: Explanation and elaboration. BMJ Open 2016, 6, e012799. [Google Scholar] [CrossRef]
- Macaskill, P.; Takwoingi, Y.; Deeks, J.J.; Gatsonis, C. Understanding meta-analysis. In Cochrane Handbook for Systematic Reviews of Diagnostic Test Accuracy; John Wiley & Sons, Ltd.: Hoboken, NJ, USA, 2023; pp. 203–247. [Google Scholar] [CrossRef]
- Ghaaliq, A.; Mb, L.; Frca, C.; Mccluskey, A.; Chb, M.B. Clinical tests: Sensitivity and specificity. Contin. Educ. Anaesth. Crit. Care Pain 2008, 8, 221–223. [Google Scholar]
- Whiting, P.F.; Rutjes, A.W.S.; Westwood, M.E.; Mallett, S.; Deeks, J.J.; Reitsma, J.B.; Leeflang, M.M.G.; Sterne, J.A.C.; Bossuyt, P.M.M.; QUADAS-2 Group. QUADAS-2: A revised tool for the quality assessment of diagnostic accuracy studies. Ann. Intern. Med. 2011, 155, 529–536. [Google Scholar] [CrossRef]
- Schünemann, H.J.; Mustafa, R.A.; Brozek, J.; Steingart, K.R.; Leeflang, M.; Murad, M.H.; Bossuyt, P.; Glasziou, P.; Jaeschke, R.; Lange, S.; et al. GRADE guidelines: 21 part 1. Study design, risk of bias, and indirectness in rating the certainty across a body of evidence for test accuracy. J. Clin. Epidemiol. 2020, 122, 129–141. [Google Scholar] [CrossRef]
- Schünemann, H.J.; Mustafa, R.A.; Brozek, J.; Steingart, K.R.; Leeflang, M.; Murad, M.H.; Bossuyt, P.; Glasziou, P.; Jaeschke, R.; Lange, S.; et al. GRADE guidelines: 21 part 2. Test accuracy: Inconsistency, imprecision, publication bias, and other domains for rating the certainty of evidence and presenting it in evidence profiles and summary of findings tables. J. Clin. Epidemiol. 2020, 122, 142–152. [Google Scholar] [CrossRef]
- Dinnes, J.; Deeks, J.J.; Leeflang, M.M.; Li, T. Collecting data. In Cochrane Handbook for Systematic Reviews of Diagnostic Test Accuracy; John Wiley & Sons, Ltd.: Hoboken, NJ, USA, 2023; pp. 131–167. [Google Scholar] [CrossRef]
- Takwoingi, Y.; Dendukuri, N.; Schiller, I.; Rücker, G.; Jones, H.E.; Partlett, C.; Macaskill, P. Undertaking meta-analysis. In Cochrane Handbook for Systematic Reviews of Diagnostic Test Accuracy; John Wiley & Sons, Ltd.: Hoboken, NJ, USA, 2023; pp. 249–325. [Google Scholar] [CrossRef]
- Patel, A.; Cooper, N.; Freeman, S. Graphical enhancements to summary receiver operating characteristic plots to facilitate the analysis and reporting of meta-analysis of diagnostic test accuracy data. Res. Synth. Methods 2021, 12, 34–44. [Google Scholar] [CrossRef] [PubMed]
- Freeman, S.C.; Kerby, C.R.; Patel, A.; Cooper, N.J.; Quinn, T.; Sutton, A.J. Development of an interactive web-based tool to conduct and interrogate meta-analysis of diagnostic test accuracy studies: MetaDTA. BMC Med. Res. Methodol. 2019, 19, 81. [Google Scholar] [CrossRef]
- Kokubo, N.; Yokoi, Y.; Saitoh, Y.; Murata, M.; Maruo, K.; Takebayashi, Y.; Shinmei, I.; Yoshimoto, S.; Horikoshi, M. A new device-aided cognitive function test, User eXperience-Trail Making Test (UX-TMT), sensitively detects neuropsychological performance in patients with dementia and Parkinson’s disease. BMC Psychiatry 2018, 18, 220. [Google Scholar] [CrossRef]
- Rhodius-meester, H.F.M.; Paajanen, T.; Koikkalainen, J.; Mahdiani, S.; Bruun, M.; Baroni, M.; Lemstra, A.W.; Scheltens, P.; Herukka, S.; Pikkarainen, M.; et al. cCOG: A web-based cognitive test tool for detecting neurodegenerative disorders. Alzheimer’s Dement. 2020, 12, e12083. [Google Scholar] [CrossRef]
- Brandt, J.; Blehar, J.; Anderson, A.; Gross, A.L. Further validation of the Internet-based Dementia Risk Assessment. J. Alzheimer’s Dis. 2014, 41, 937–945. [Google Scholar] [CrossRef] [PubMed]
- Kalafatis, C.; Modarres, M.H.; Apostolou, P.; Marefat, H. Validity and cultural generalisability of a 5-minute AI-based, computerised cognitive assessment in Mild Cognitive Impairment and Alzheimer’s dementia. Front. Psychiatry 2021, 12, 706695. [Google Scholar] [CrossRef]
- Curiel, R.E.; Crocco, E.; Rosado, M.; Duara, R.; Greig, M.T. A brief computerized paired associate test for the detection of Mild Cognitive Impairment in community-dwelling older adults. J. Alzheimer’s Dis. 2016, 54, 793–799. [Google Scholar] [CrossRef] [PubMed]
- Alegret, M.; Muñoz, N.; Roberto, N.; Rentz, D.M.; Valero, S.; Gil, S.; Marquié, M.; Hernández, I.; Riveros, C.; Sanabria, A.; et al. A computerized version of the Short Form of the Face-Name Associative Memory Exam (FACEmemory®) for the early detection of Alzheimer’s disease. Alzheimer’s Res. Ther. 2020, 12, 25. [Google Scholar] [CrossRef] [PubMed]
- Ichii, S.; Nakamura, T.; Kawarabayashi, T.; Takatama, M.; Ohgami, T.; Ihara, K.; Shoji, M. CogEvo, a cognitive function balancer, is a sensitive and easy psychiatric test battery for age-related cognitive decline. Geriatr. Gerontol. Int. 2019, 20, 248–255. [Google Scholar] [CrossRef] [PubMed]
- Wong, A.; Fong, C.; Mok, V.C.; Leung, K. Computerized Cognitive Screen (CoCoSc): A self-administered computerized test for screening for cognitive impairment in community social centers. J. Alzheimer’s Dis. 2017, 59, 1299–1306. [Google Scholar] [CrossRef] [PubMed]
- Buckley, R.F.; Sparks, K.; Papp, K.; Dekhtyar, M.; Martin, C.; Burnham, S.; Sperling, R.; Rentz, D. Computerized cognitive testing for use in clinical trials: A comparison of the NIH Toolbox and Cogstate C3 Batteries. J. Prev. Alzheimer’s Dis. 2017, 4, 3–11. [Google Scholar] [CrossRef] [PubMed]
- Memória, C.M.; Yassuda, M.S.; Nakano, E.Y.; Forlenza, O.V. Contributions of the Computer-Administered Neuropsychological Screen for Mild Cognitive Impairment (CANS-MCI) for the diagnosis of MCI in Brazil. Int. Psychogeriatr. 2014, 26, 1483–1491. [Google Scholar] [CrossRef] [PubMed]
- Yu, K.; Zhang, S.; Wang, Q.; Wang, X.; Qin, Y.; Wang, J.; Li, C.; Wu, Y.; Wang, W.; Lin, H. Development of a computerized tool for the chinese version of the Montreal Cognitive Assessment for screening Mild Cognitive Impairment. Int. Psychogeriatr. 2015, 27, 213–219. [Google Scholar] [CrossRef]
- Scharre, D.W.; Chang, S.; Nagaraja, H.N.; Vrettos, N.E.; Bornstein, R.A. Digitally translated Self-Administered Gerocognitive Examination (eSAGE): Relationship with its validated paper version, neuropsychological evaluations, and clinical assessments. Alzheimer’s Res. Ther. 2017, 9, 44. [Google Scholar] [CrossRef]
- Tierney, M.C.; Naglie, G.; Upshur, R.; Moineddin, R.; Charles, J.; Jaakkimainen, R.L. Feasibility and validity of the self-administered computerized assessment of Mild Cognitive Impairment with older primary care patients. Alzheimer Dis. Assoc. Disord. 2014, 28, 311–319. [Google Scholar] [CrossRef]
- Van Mierlo, L.D.; Wouters, H.; Sikkes, S.A.M.; Van Der Flier, W.M. Screening for Mild Cognitive Impairment and dementia with automated, anonymous online and Telephone Cognitive Self-Tests. J. Alzheimer’s Dis. 2017, 56, 249–259. [Google Scholar] [CrossRef]
- Dougherty, J.H.; Cannon, R.L.; Nicholas, C.R.; Hall, L.; Hare, F. The Computerized Self Test (CST): An interactive, internet accessible cognitive screening test for dementia. J. Alzheimer’s Dis. 2010, 20, 185–195. [Google Scholar] [CrossRef]
- Van Der Hoek, M.D.; Nieuwenhuizen, A.; Keijer, J.; Ashford, J.W. The MemTrax Test compared to the Montreal Cognitive Assessment estimation of Mild Cognitive Impairment. J. Alzheimer’s Dis. 2019, 67, 1045–1054. [Google Scholar] [CrossRef] [PubMed]
- Scanlon, L.; O’Shea, E.; O’Caoimh, R.; Timmons, S. Usability and validity of a battery of computerised cognitive screening tests for detecting cognitive impairment. Gerontology 2015, 62, 247–252. [Google Scholar] [CrossRef] [PubMed]
- Fung, A.W.; Chiu, L.; Lam, W.; Fung, A.W. Validation of a computerized Hong Kong-vigilance and memory test (HK-VMT) to detect early cognitive impairment in healthy older adults. Aging Ment. Health 2020, 24, 185–191. [Google Scholar] [CrossRef] [PubMed]
- Cahn-hidalgo, D.; Estes, P.W.; Benabou, R. Validity, reliability, and psychometric properties of a computerized, cognitive assessment test (Cognivue®). World J. Psychiatry 2020, 10, 1–11. [Google Scholar] [CrossRef]
- Rodríguez-Salgado, A.M.; Llibre-Guerra, J.J.; Tsoy, E.; Peñalver-Guia, A.I.; Bringas, G.; Erlhoff, S.J.; Kramer, J.H.; Allen, I.E.; Valcour, V.; Miller, B.L.; et al. A brief digital cognitive assessment for detection of cognitive impairment in cuban older adults. J. Alzheimer’s Dis. 2021, 79, 85–94. [Google Scholar] [CrossRef]
- Liu, X.; Chen, X.; Zhou, X.; Shang, Y.; Xu, F.; Zhang, J.; He, J.; Zhao, F.; Du, B.; Wang, X.; et al. Validity of the MemTrax Memory Test compared to the Montreal Cognitive Assessment in the detection of Mild Cognitive Impairment and dementia due to Alzheimer’s disease in a chinese cohort. J. Alzheimer’s Dis. 2021, 80, 1257–1267. [Google Scholar] [CrossRef]
- Yan, M.; Yin, H.; Meng, Q.; Wang, S.; Ding, Y.; Li, G.; Wang, C.; Chen, L. A Virtual Supermarket Program for the screening of Mild Cognitive Impairment in older adults: Diagnostic accuracy study. JMIR Serious Games 2021, 9, e30919. [Google Scholar] [CrossRef]
- Ye, S.; Sun, K.; Huynh, D.; Phi, H.Q.; Ko, B.; Huang, B.; Ghomi, R.H. A computerized cognitive test battery for detection of dementia and Mild Cognitive Impairment: Instrument validation study. JMIR Aging 2022, 5, e36825. [Google Scholar] [CrossRef]
- Paterson, T.S.E.; Sivajohan, B.; Gardner, S.; Binns, M.A.; Stokes, K.A.; Freedman, M.; Levine, B.; Troyer, A.K. Accuracy of a self-administered online cognitive assessment in detecting Amnestic Mild Cognitive Impairment. J. Gerontol. Ser. B Psychol. Sci. Soc. Sci. 2022, 77, 341–350. [Google Scholar] [CrossRef]
- Cheah, W.; Hwang, J.; Hong, S.; Fu, L.; Chang, Y. A digital screening system for Alzheimer disease based on a neuropsychological test and a convolutional neural network: System development and validation. JMIR Med. Inform. 2022, 10, e31106. [Google Scholar] [CrossRef]
- Lu, J.; Li, D.; Li, F.; Zhou, A.; Wang, F.; Zuo, X.; Jia, X.-F.; Song, H.; Jia, J. Montreal Cognitive Assessment in detecting cognitive impairment in chinese elderly individuals: A population-based study. J. Geriatr. Psychiatry Neurol. 2011, 24, 184–190. [Google Scholar] [CrossRef] [PubMed]
- Petersen, R.C.; Stevens, J.; Ganguli, M.; Tangalos, E.G.; Cummings, J.; DeKosky, S.T. Practice parameter: Early detection of dementia: Mild Cognitive Impairment (an evidence-based review). Report of the Quality Standards Subcommittee of the American Academy of Neurology. Neurology 2001, 56, 1133–1142. [Google Scholar] [CrossRef] [PubMed]
- Mitchell, A.J. A meta-analysis of the accuracy of the Mini-Mental State Examination in the detection of dementia and Mild Cognitive Impairment. J. Psychiatr. Res. 2009, 43, 411–431. [Google Scholar] [CrossRef] [PubMed]
- World Health Organization. WHO Handbook for Guideline Development; World Health Organization: Geneva, Switzerland, 2014.
- Reitsma, J.B.; Rutjes, A.W.; Whiting, P.; Yang, B.; Leeflang, M.M.; Bossuyt, P.M.; Deeks, J.J. Assessing risk of bias and applicability. In Cochrane Handbook for Systematic Reviews of Diagnostic Test Accuracy; John Wiley & Sons, Ltd.: Hoboken, NJ, USA, 2023; pp. 169–201. [Google Scholar] [CrossRef]


| Study | Risk of Bias | Applicability Concerns | |||||
|---|---|---|---|---|---|---|---|
| Patient Selection | Index Test | Reference Standard | Flow and Timing | Patient Selection | Index Test | Reference Standard | |
| Curiel et al. (2016) [56] | ☺ | ? | ☺ | ☺ | ☺ | ☺ | ☺ |
| Alegret et al. (2020) [57] |  | | ? | ☺ | | ☺ | ☺ |
| Kokubo et al. (2018) [52] | | ? | ? | ☺ | | ☺ | |
| Rhodius-Meester et al. (2020) [53] | ☺ | | ? | ? | ☺ | ☺ | |
| Ichii et al. (2019) [58] | ☺ | ? | ? | ? | | ☺ | ☺ |
| Wong et al. (2017) [59] | | ? | ? | ☺ | ☺ | ☺ | ☺ |
| Buckley et al. (2017) [60] | | ? | ? | ☺ | | ☺ | ☺ |
| Memória et al. (2014) [61] | | ? | ? | ☺ | ☺ | ☺ | ☺ |
| Ke Yu et al. (2015) [62] | | ☺ | ☺ | ☺ | ☺ | ☺ | ☺ |
| Scharre et al. (2017) [63] | | ☺ | ☺ | | | ☺ | ☺ |
| Tierney et al. (2014) [64] | | ? | ? | ☺ | ☺ | ☺ | ☺ |
| Brandt et al. (2014) [54] | ☺ | ? | ☺ | | | ☺ | |
| Van Mierlo et al. (2017) [65] | | ☺ | ☺ | ? | | ☺ | ☺ |
| Dougherty Jr. et al. (2010) [66] | | ☺ | ☺ | ? | | ☺ | ☺ |
| Van der Hoek et al. (2019) [67] | | ? | ? | ? | ☺ | ☺ | ☺ |
| Scanlon et al. (2015) [68] | | ☺ | ☺ | ☺ | | ☺ | ☺ |
| Fung et al. (2020) [69] | | ? | ? | ☺ | ☺ | ☺ | ☺ |
| Cahn-Hidalgo et al. (2020) [70] | ☺ | ? | ? | | ☺ | ☺ | ☺ |
| Kalafatis et al. (2021) [55] | | ? | ? | ☺ | ☺ | | ☺ |
| Rodríguez-Salgado et al. (2021) [71] | | ? | ? | ☺ | ☺ | ☺ | ☺ |
| Liu et al. (2021) [72] | ☺ | ☺ | ☺ | ☺ | ☺ | ☺ | ☺ |
| Yan et al. (2021) [73] | | ? | ? | ☺ | | ☺ | ☺ |
| Ye et al. (2022) [74] | | ? | ? | ☺ | | ☺ | ☺ |
| Paterson et al. (2022) [75] | ☺ | ☺ | ☺ | ☺ | ? | ☺ | ☺ |
| Cheah et al. (2022) [76] | | ? | ? | ☺ | | ☺ | ☺ |
: high risk; ?: unclear risk.| Summary Estimates | Sensitivity (95% CI) | Specificity (95% CI) | False Positive Rate (95% CI) |
|---|---|---|---|
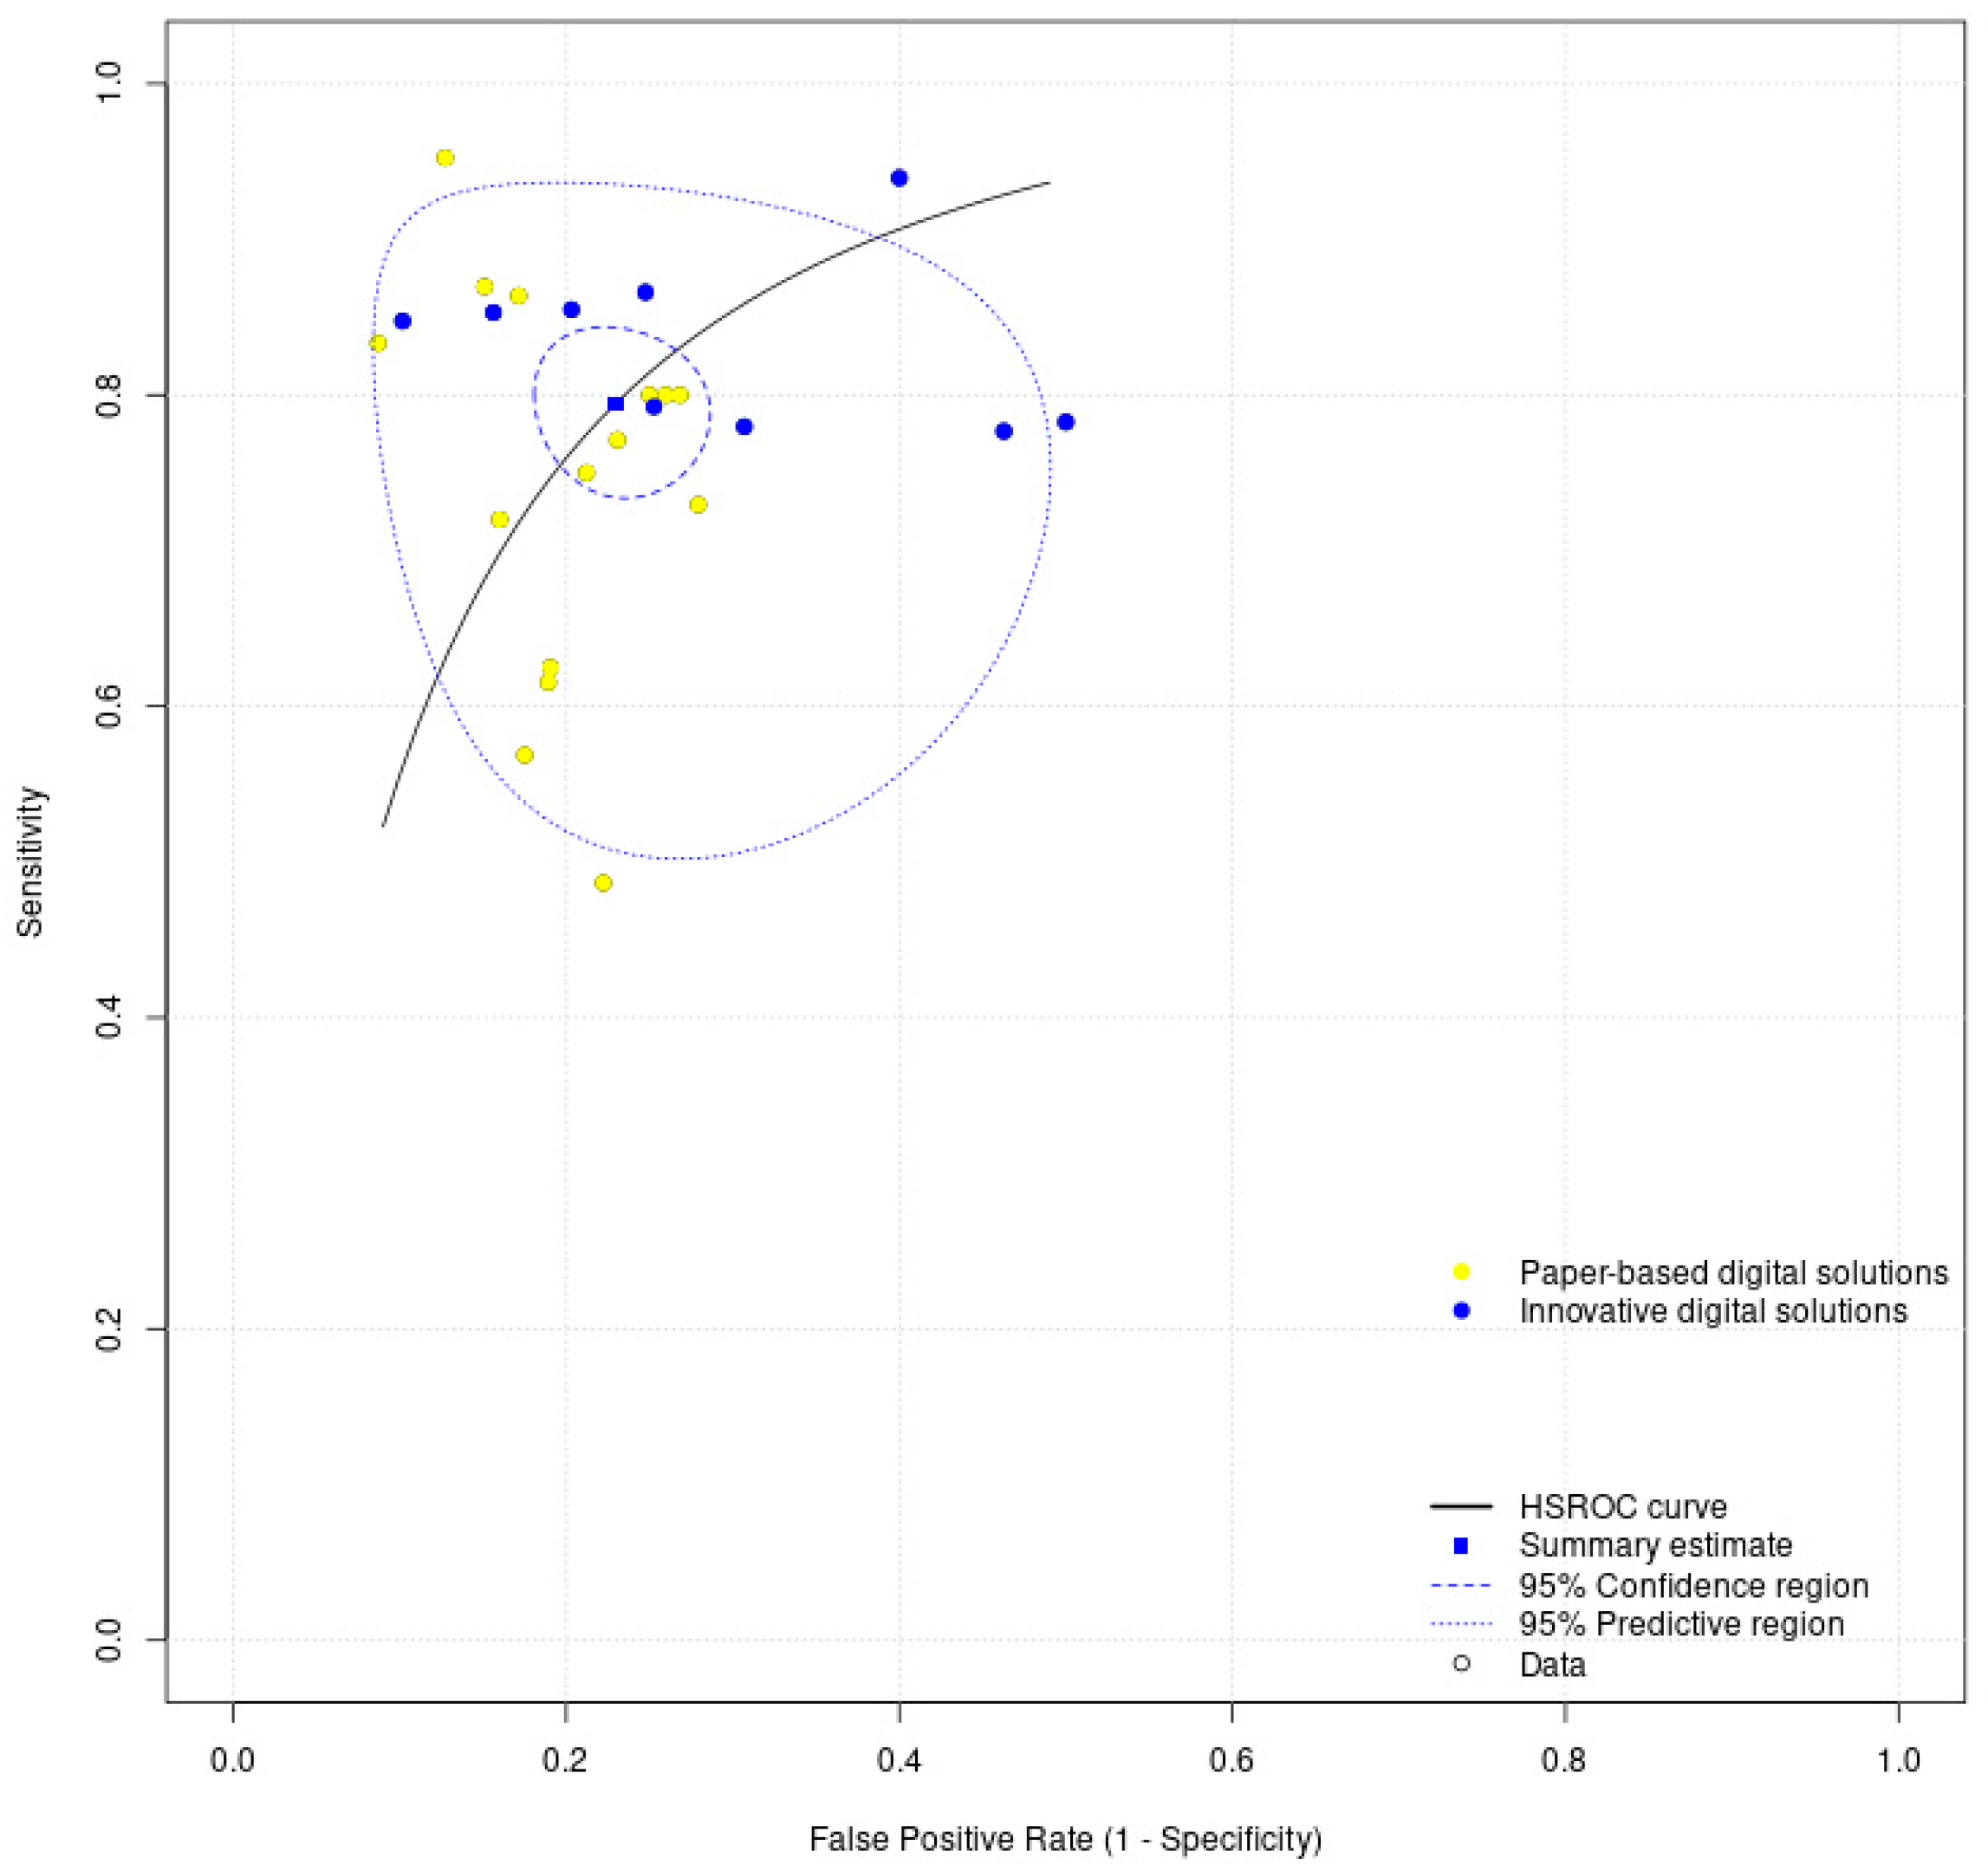
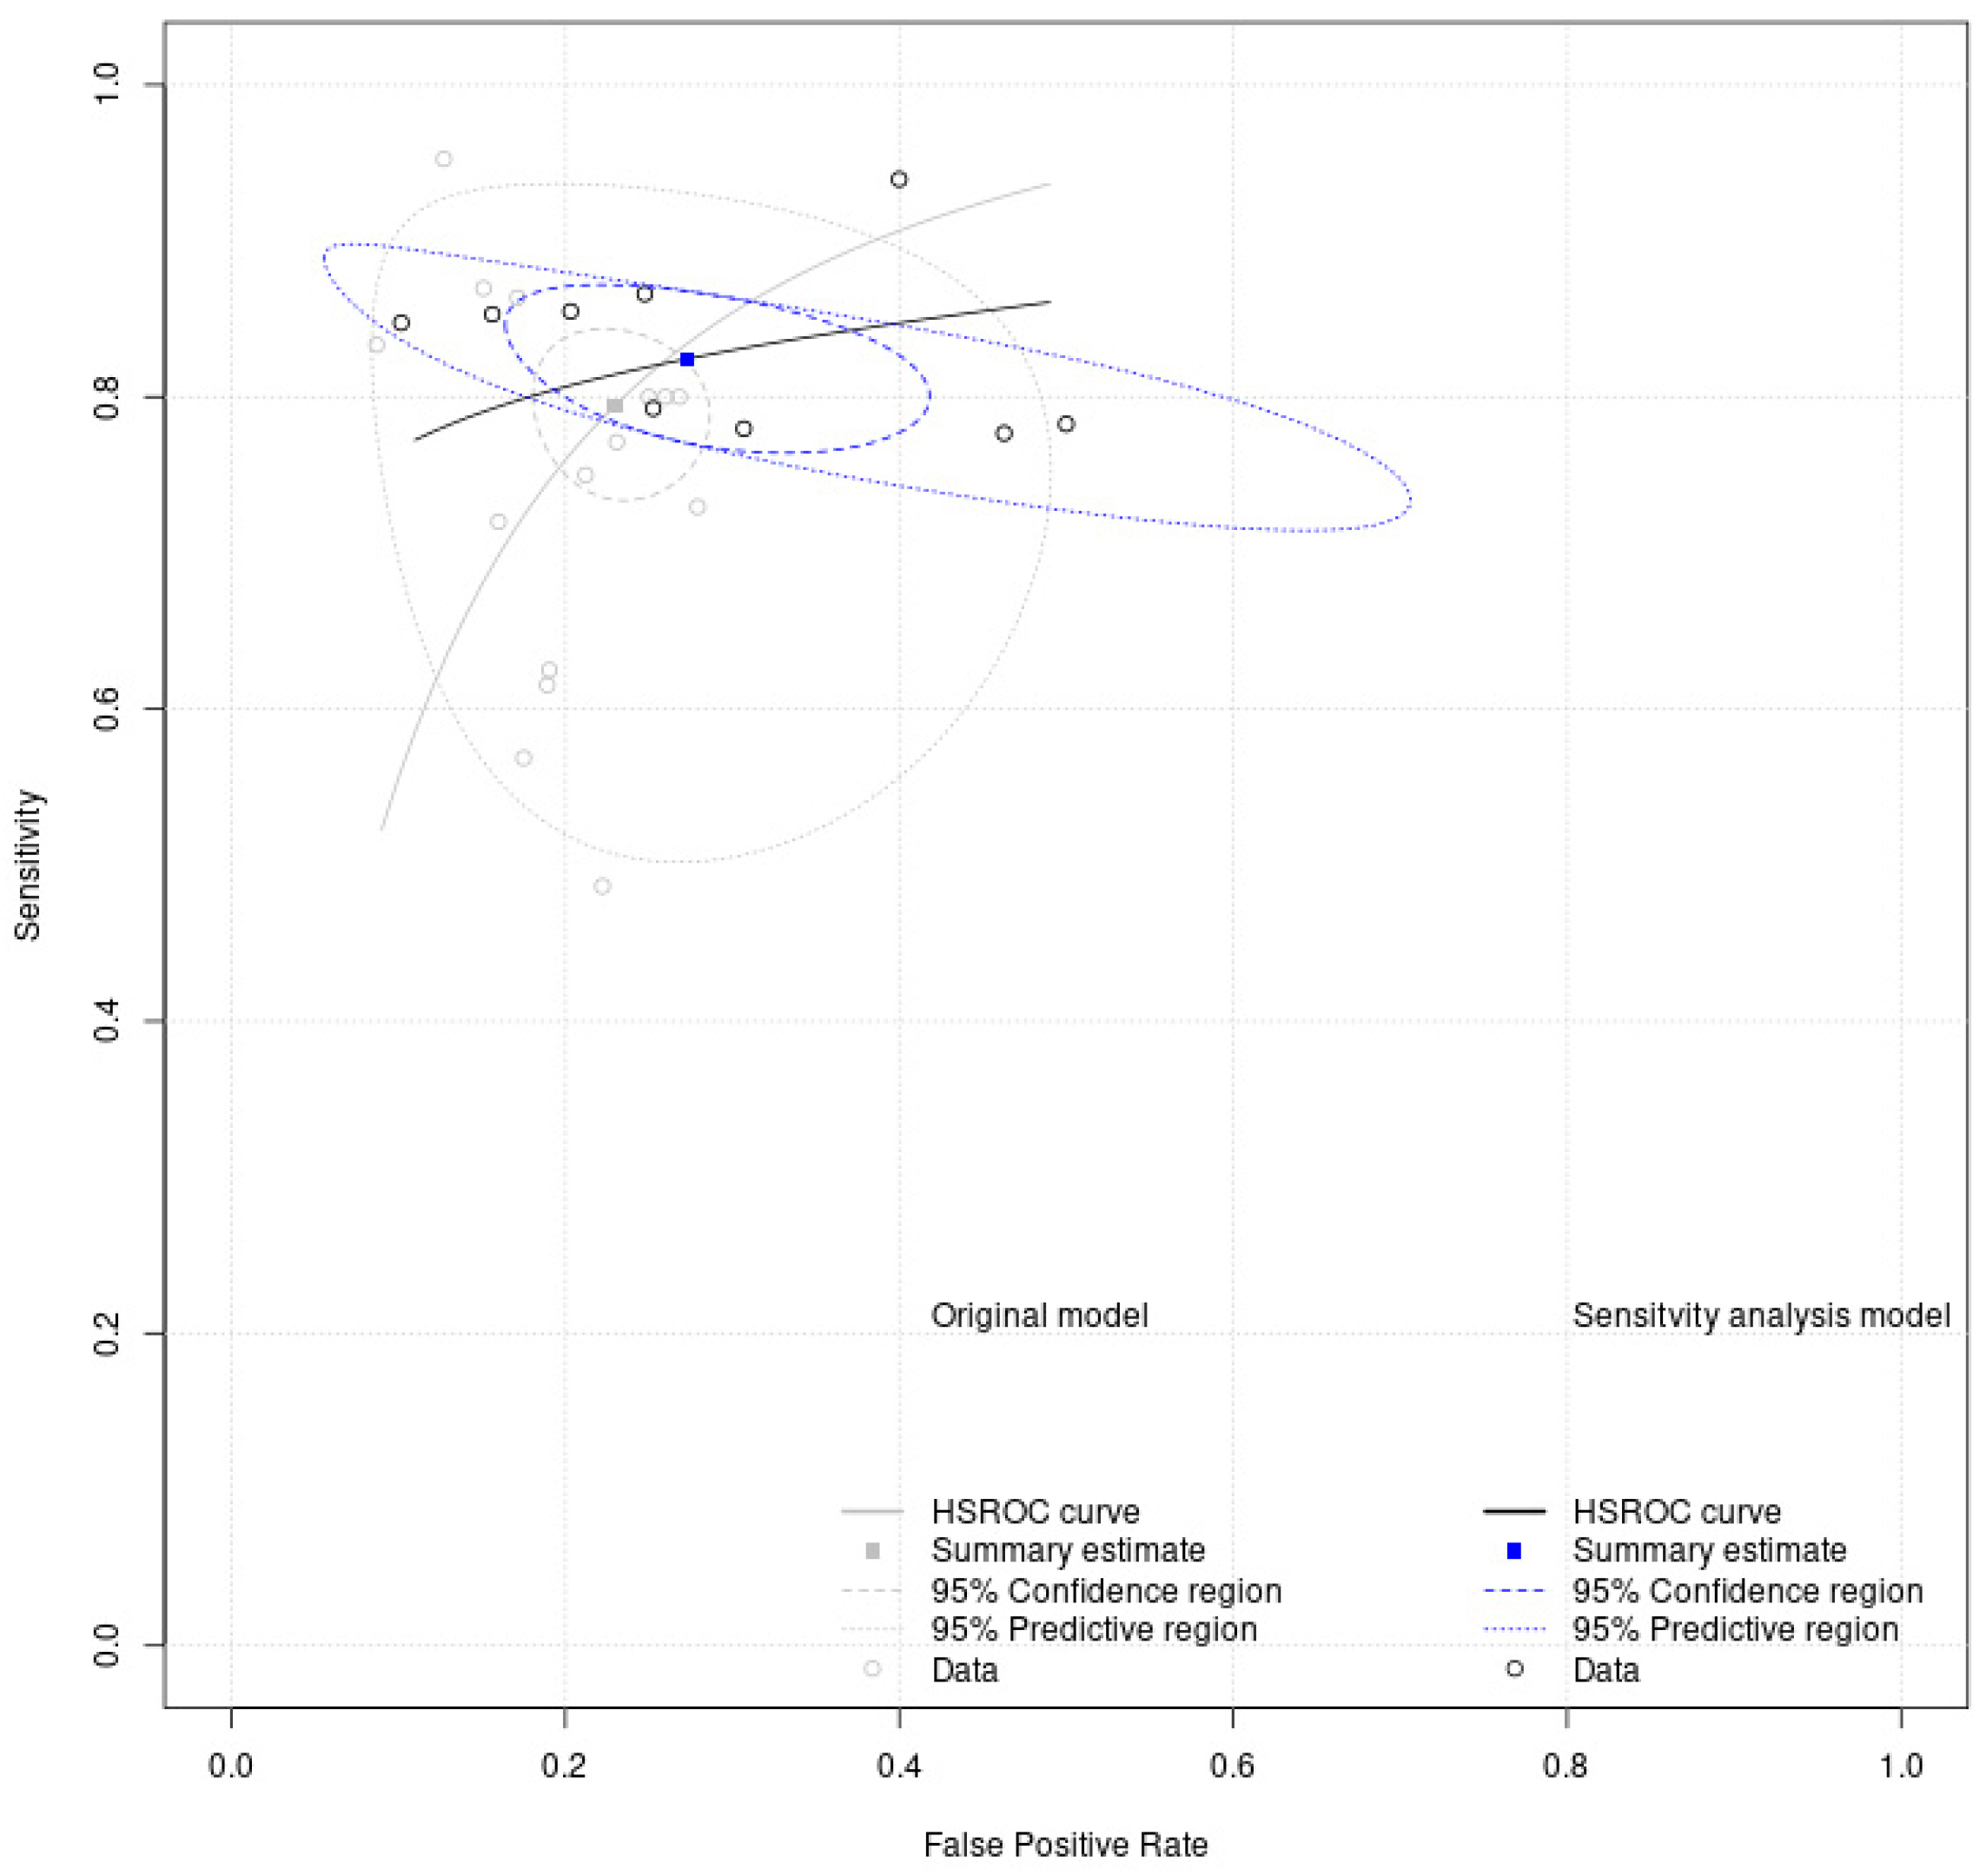
| Meta-analysis of all digital solutions | 0.79 (0.75–0.83) | 0.77 (0.73–0.81) | 0.23 (0.19–0.27) |
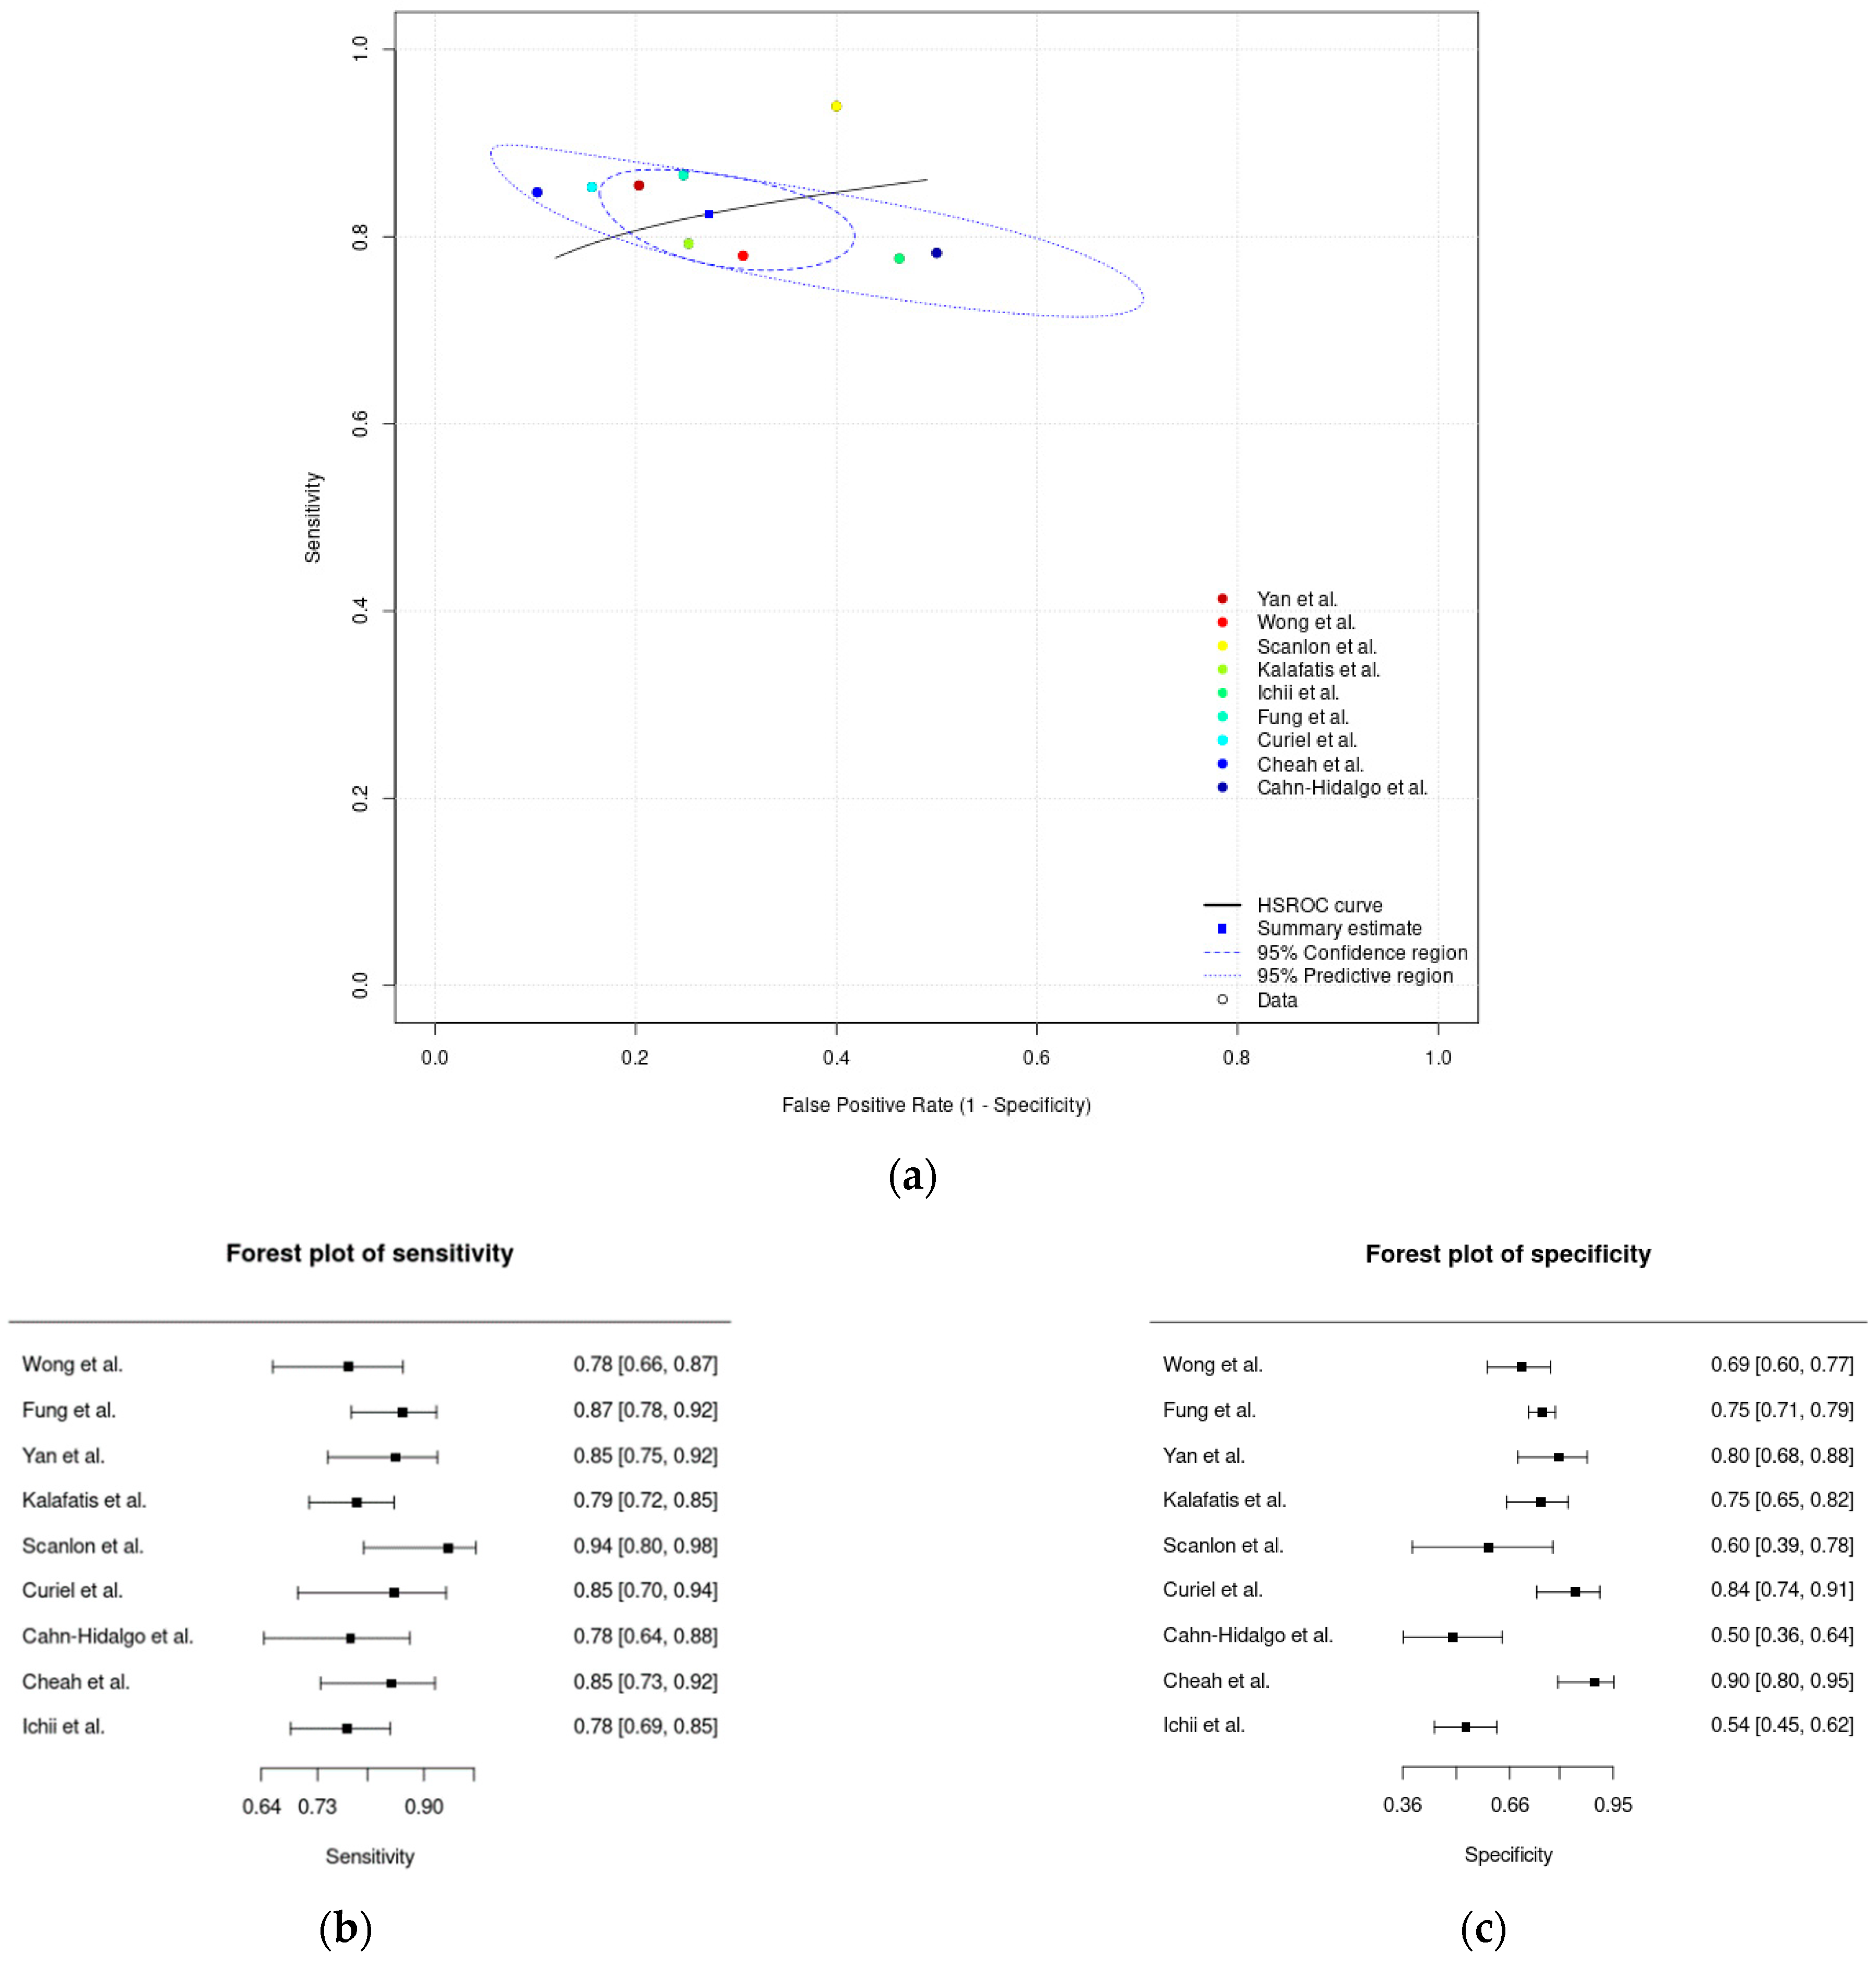
| Meta-analysis of innovative digital solutions | 0.82 (0.79–0.86) | 0.73 (0.64–0.80) | 0.27 (0.20–0.36) |
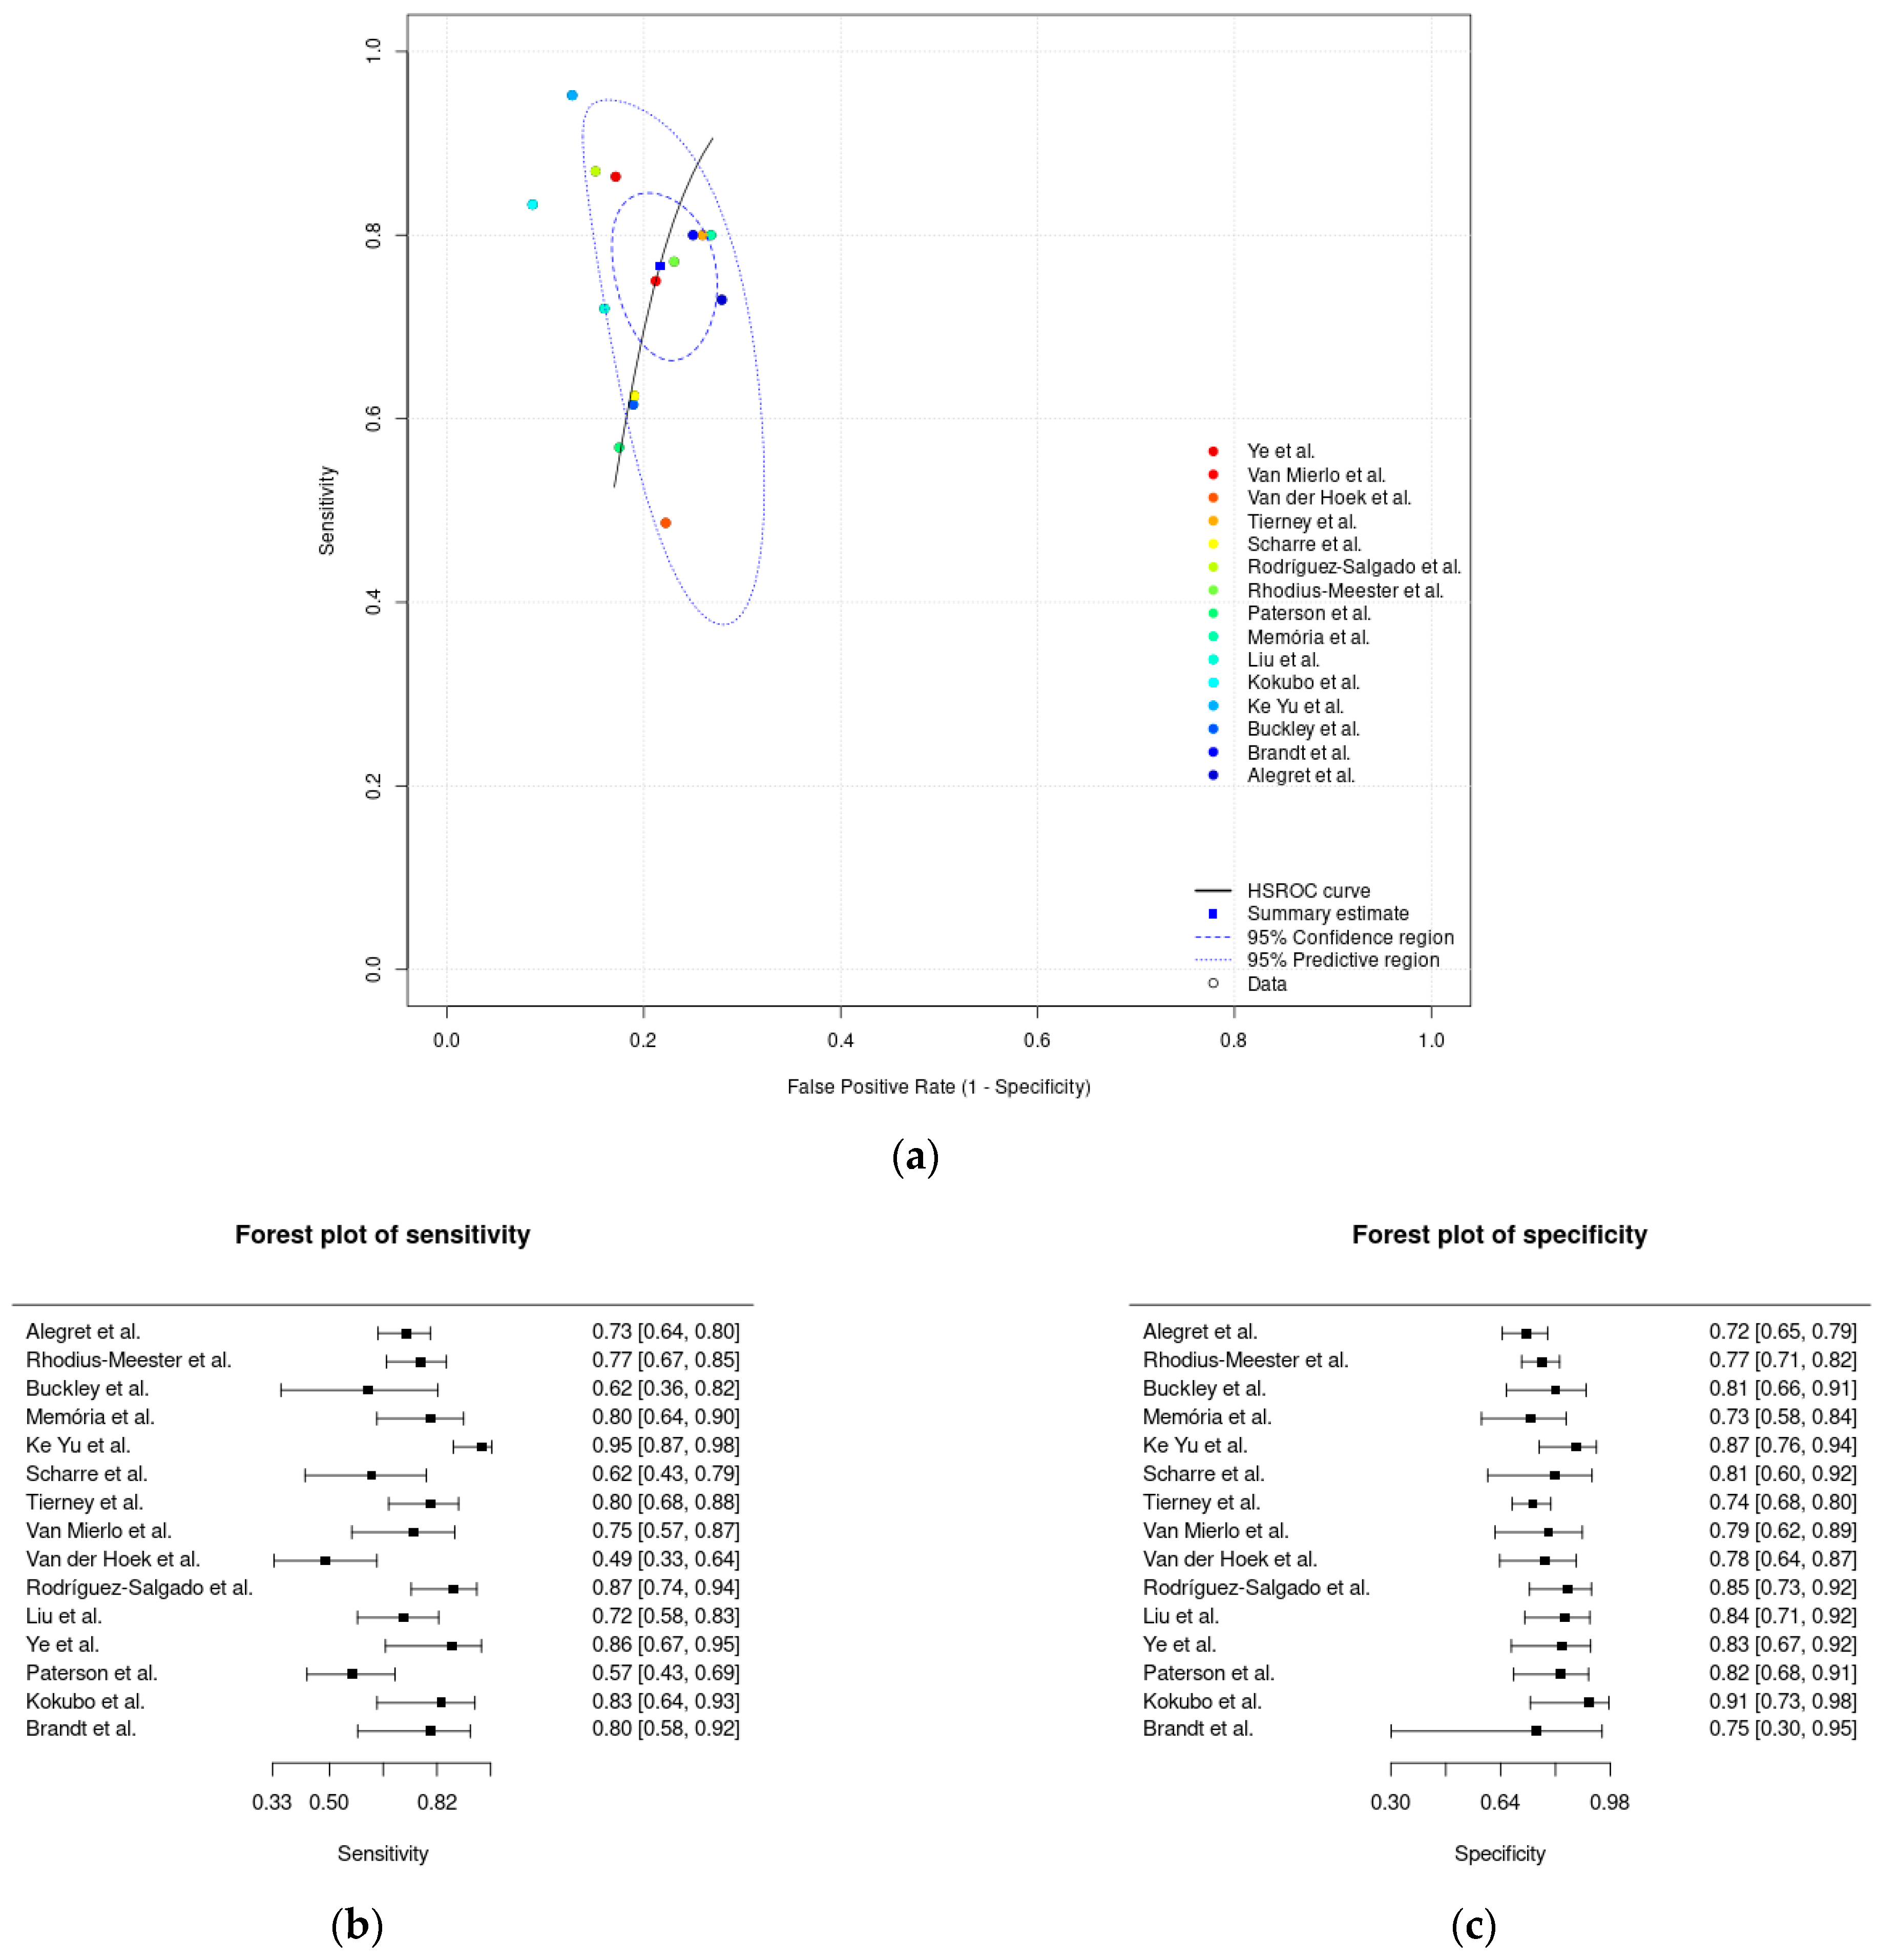
| Meta-analysis of paper-based digital solutions | 0.77 (0.70–0.83) | 0.78 (0.74–0.82) | 0.22 (0.18–0.26) |
| Outcome | Number of Studies (Number of Participants) | Risk of Bias | Inconsistency | Indirectness | Imprecision | Publication Bias | Quality of the Evidence (GRADE) |
|---|---|---|---|---|---|---|---|
| Sensitivity (all digital solutions) | 24 studies (1301 participants) | Serious (downgraded one level). Seventeen studies (71%) suggested a high risk of bias in the patient selection, and sixteen studies (67%) presented an unclear risk of bias for the index test and reference standard domains, as assessed by the QUADAS-2. | Serious (downgraded one level). High heterogeneity was identified based on the dissimilarity of the point estimates, nonoverlap of CIs through forest plots, and examining the random-effects meta-analysis figure, where the 95% prediction region is much larger than the 95% confidence region. | Not serious. Regarding indirectness, no critical differences were found between the populations studied and those for whom the recommendation is intended. Also, there is a low concern about the applicability for the index and reference test domains. | Not serious. The CI of the sensitivity summary point was considered sufficiently narrow not to demand downgrading. | None. A test for funnel plot asymmetry (Deek’s test) for assessment of publication bias suggests that the publication bias is low (p-value = 0.78). | Low |
| Specificity (all digital solutions) | 24 studies (2069 participants) | Serious (downgraded one level). Seventeen studies (71%) suggested a high risk of bias in the patient selection, and sixteen studies (67%) presented an unclear risk of bias for the index test and reference standard domains, as assessed by the QUADAS-2. | Serious (downgraded one level). High heterogeneity was identified based on the dissimilarity of the point estimates, nonoverlap of CIs through forest plots, and examining the random-effects meta-analysis figure, where the 95% prediction region is much larger than the 95% confidence region. | Not serious. Regarding indirectness, no critical differences were found between the populations studied and those for whom the recommendation is intended. Also, there is a low concern about the applicability for the index and reference test domains. | Not serious. The CI of the specificity summary point was considered sufficiently narrow not to demand downgrading. | None. A test for funnel plot asymmetry (Deek’s test) for assessment of publication bias suggests that the publication bias is low (p-value = 0.78). | Low |
| Sensitivity (innovative digital solutions) | 9 studies (628 participants) | Serious (downgraded one level). Six studies (67%) suggested a high risk of bias in the patient selection, eight studies (89%) presented an unclear risk of bias for the index test domain, and seven studies (78%) presented an unclear risk of bias for the reference standard domain, as assessed by the QUADAS-2. | Not serious. Low heterogeneity was identified based on the similarity of the point estimates, in the overlap of CIs with the inspection of forest plots, and in examining the random-effects meta-analysis figure, where the 95% prediction region is close to the 95% confidence region. | Not serious. Regarding indirectness, no critical differences were found between the populations studied and those for whom the recommendation is intended. Also, there is a low concern about applicability for the index and reference test domains. | Not serious. The CI of the sensitivity summary point was considered sufficiently narrow not to demand downgrading. | None. A test for funnel plot asymmetry (Deek’s test) for the assessment of publication bias suggests that the publication bias is low (p-value = 0.94). | Moderate |
| Specificity (innovative digital solutions) | 9 studies (1079 participants) | Serious (downgraded one level). Six studies (67%) suggested a high risk of bias in the patient selection, eight studies (89%) presented an unclear risk of bias for the index test domain, and seven studies (78%) presented an unclear risk of bias for the reference standard domain, as assessed by the QUADAS-2. | Serious (downgraded one level). High heterogeneity was identified based on the dissimilarity of the point estimates, nonoverlap of CIs through forest plots, and examining the random-effects meta-analysis figure, where the 95% prediction region is much larger than the 95% confidence region. | Not serious. Regarding indirectness, no critical differences were found between the populations studied and those for whom the recommendation is intended. Also, there is a low concern about applicability for the index and reference test domains. | Not serious. The CI of the specificity summary point was considered sufficiently narrow not to demand downgrading. | None. A test for funnel plot asymmetry (Deek’s test) for the assessment of publication bias suggests that the publication bias is low (p-value = 0.94). | Low |
| Sensitivity (paper-based digital solutions) | 15 studies (673 participants) | Serious (downgraded one level). Eleven studies (73%) suggested a high risk of bias in the patient selection, eight studies (53%) presented an unclear risk of bias for the index test domain, and nine studies (60%) presented an unclear risk of bias for the reference standard domain, as assessed by the QUADAS-2. | Serious (downgraded one level). High heterogeneity was identified based on the dissimilarity of the point estimates, nonoverlap of CIs through forest plots, and examining the random-effects meta-analysis figure, where the 95% prediction region is much larger than the 95% confidence region. | Not serious. Regarding indirectness, no critical differences were found between the populations studied and those for whom the recommendation is intended. Also, there is a low concern about applicability for the index and reference test domains. | Not serious. The CI of the sensitivity summary point was considered sufficiently narrow not to demand downgrading. | None. A test for funnel plot asymmetry (Deek’s test) for the assessment of publication bias suggests that the publication bias is low (p-value = 0.69). | Low |
| Specificity (paper-based digital solutions) | 15 studies (990 participants) | Serious (downgraded one level). Eleven studies (73%) suggested a high risk of bias in the patient selection, eight studies (53%) presented an unclear risk of bias for the index test domain, and nine studies (60%) presented an unclear risk of bias for the reference standard domain, as assessed by the QUADAS-2. | Not serious. Low heterogeneity was identified based on the similarity of the point estimates, in the overlap of CIs with the inspection of forest plots, and in examining the random-effects meta-analysis figure, where the 95% prediction region is close to the 95% confidence region. | Not serious. Regarding applicability, seven studies (47%) revealed low concern for the patient-selection domain, fifteen studies (100%) revealed low concern for the index test domain, and twelve studies (80%) were considered to have low concern for the reference test domain, as assessed by the QUADAS-2. | Not serious. The CI of the specificity summary point was considered sufficiently narrow not to demand downgrading. | None. A test for funnel plot asymmetry (Deek’s test) for the assessment of publication bias suggests that the publication bias is low (p-value = 0.69). | Moderate |
Disclaimer/Publisher’s Note: The statements, opinions and data contained in all publications are solely those of the individual author(s) and contributor(s) and not of MDPI and/or the editor(s). MDPI and/or the editor(s) disclaim responsibility for any injury to people or property resulting from any ideas, methods, instructions or products referred to in the content. |
© 2024 by the authors. Licensee MDPI, Basel, Switzerland. This article is an open access article distributed under the terms and conditions of the Creative Commons Attribution (CC BY) license (https://creativecommons.org/licenses/by/4.0/).
Share and Cite
Magno, M.; Martins, A.I.; Pais, J.; Silva, A.G.; Rocha, N.P. Diagnostic Accuracy of Digital Solutions for Screening for Cognitive Impairment: A Systematic Review and Meta-Analysis. Appl. Sci. 2024, 14, 2640. https://doi.org/10.3390/app14062640
Magno M, Martins AI, Pais J, Silva AG, Rocha NP. Diagnostic Accuracy of Digital Solutions for Screening for Cognitive Impairment: A Systematic Review and Meta-Analysis. Applied Sciences. 2024; 14(6):2640. https://doi.org/10.3390/app14062640
Chicago/Turabian StyleMagno, Marisa, Ana Isabel Martins, Joana Pais, Anabela G. Silva, and Nelson Pacheco Rocha. 2024. "Diagnostic Accuracy of Digital Solutions for Screening for Cognitive Impairment: A Systematic Review and Meta-Analysis" Applied Sciences 14, no. 6: 2640. https://doi.org/10.3390/app14062640
APA StyleMagno, M., Martins, A. I., Pais, J., Silva, A. G., & Rocha, N. P. (2024). Diagnostic Accuracy of Digital Solutions for Screening for Cognitive Impairment: A Systematic Review and Meta-Analysis. Applied Sciences, 14(6), 2640. https://doi.org/10.3390/app14062640