
Incorporating Citizen Science to Enhance Public Awareness in Smart Cities: The Case Study of Balaguer

 ,
,  ,
,  ,
, 
Abstract
Featured Application
Abstract
1. Introduction
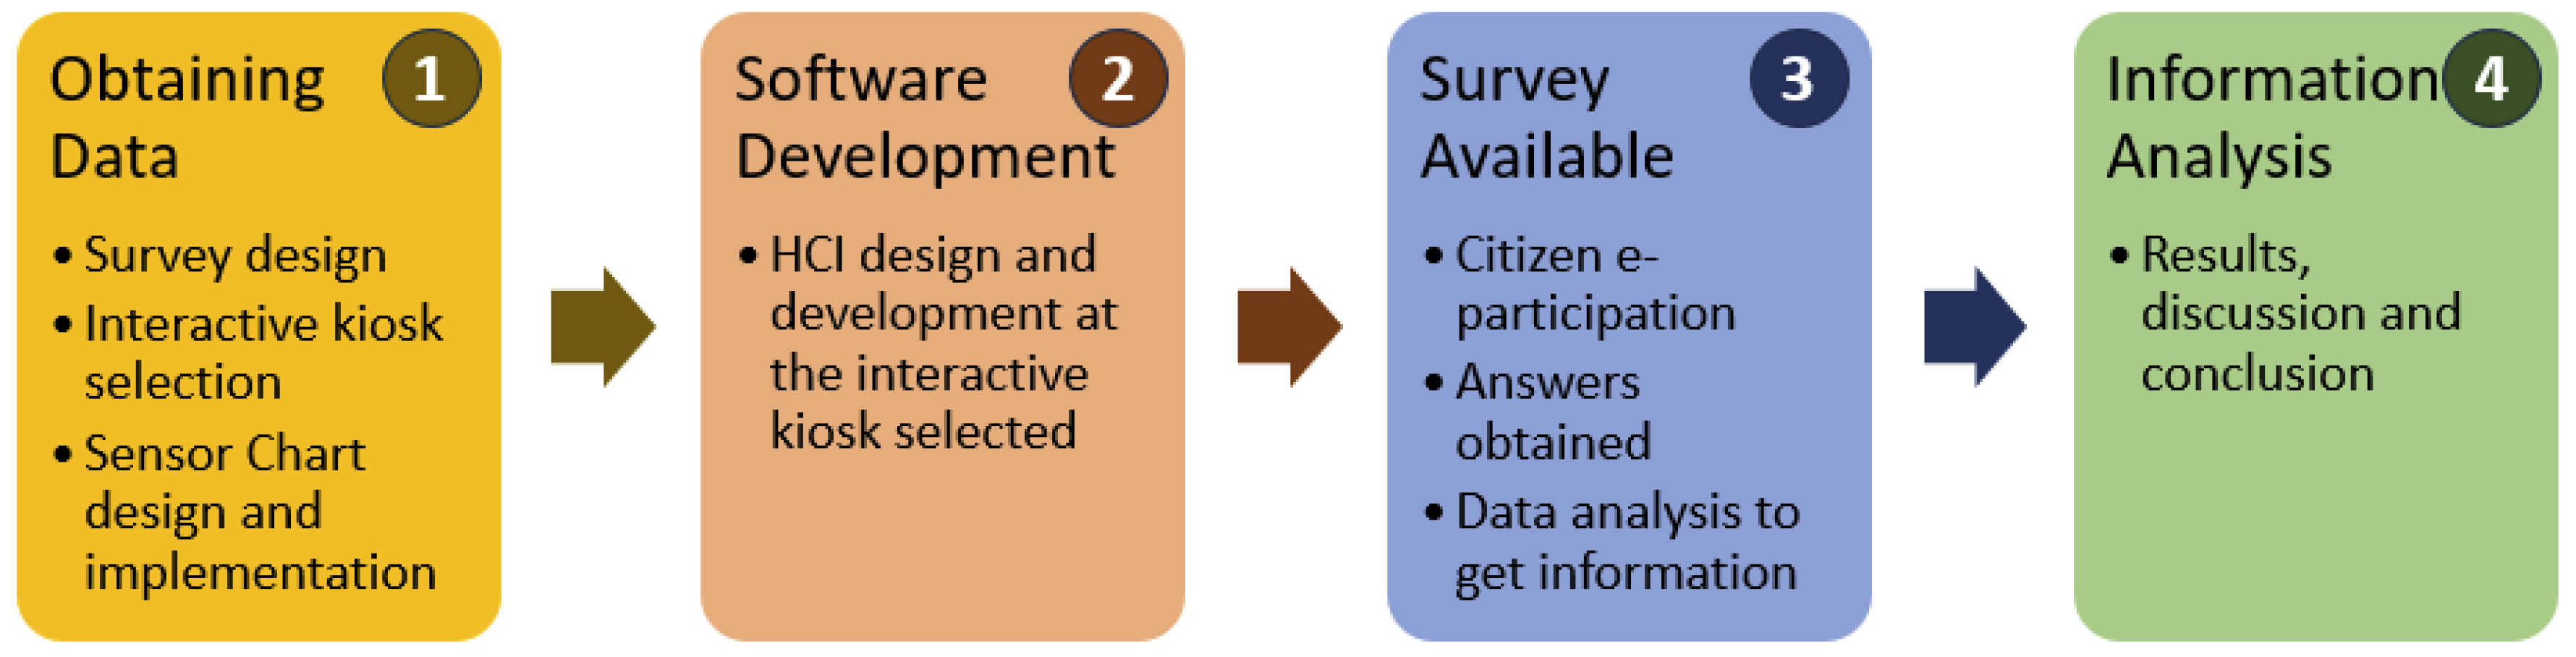
2. Methods
2.1. Methodology
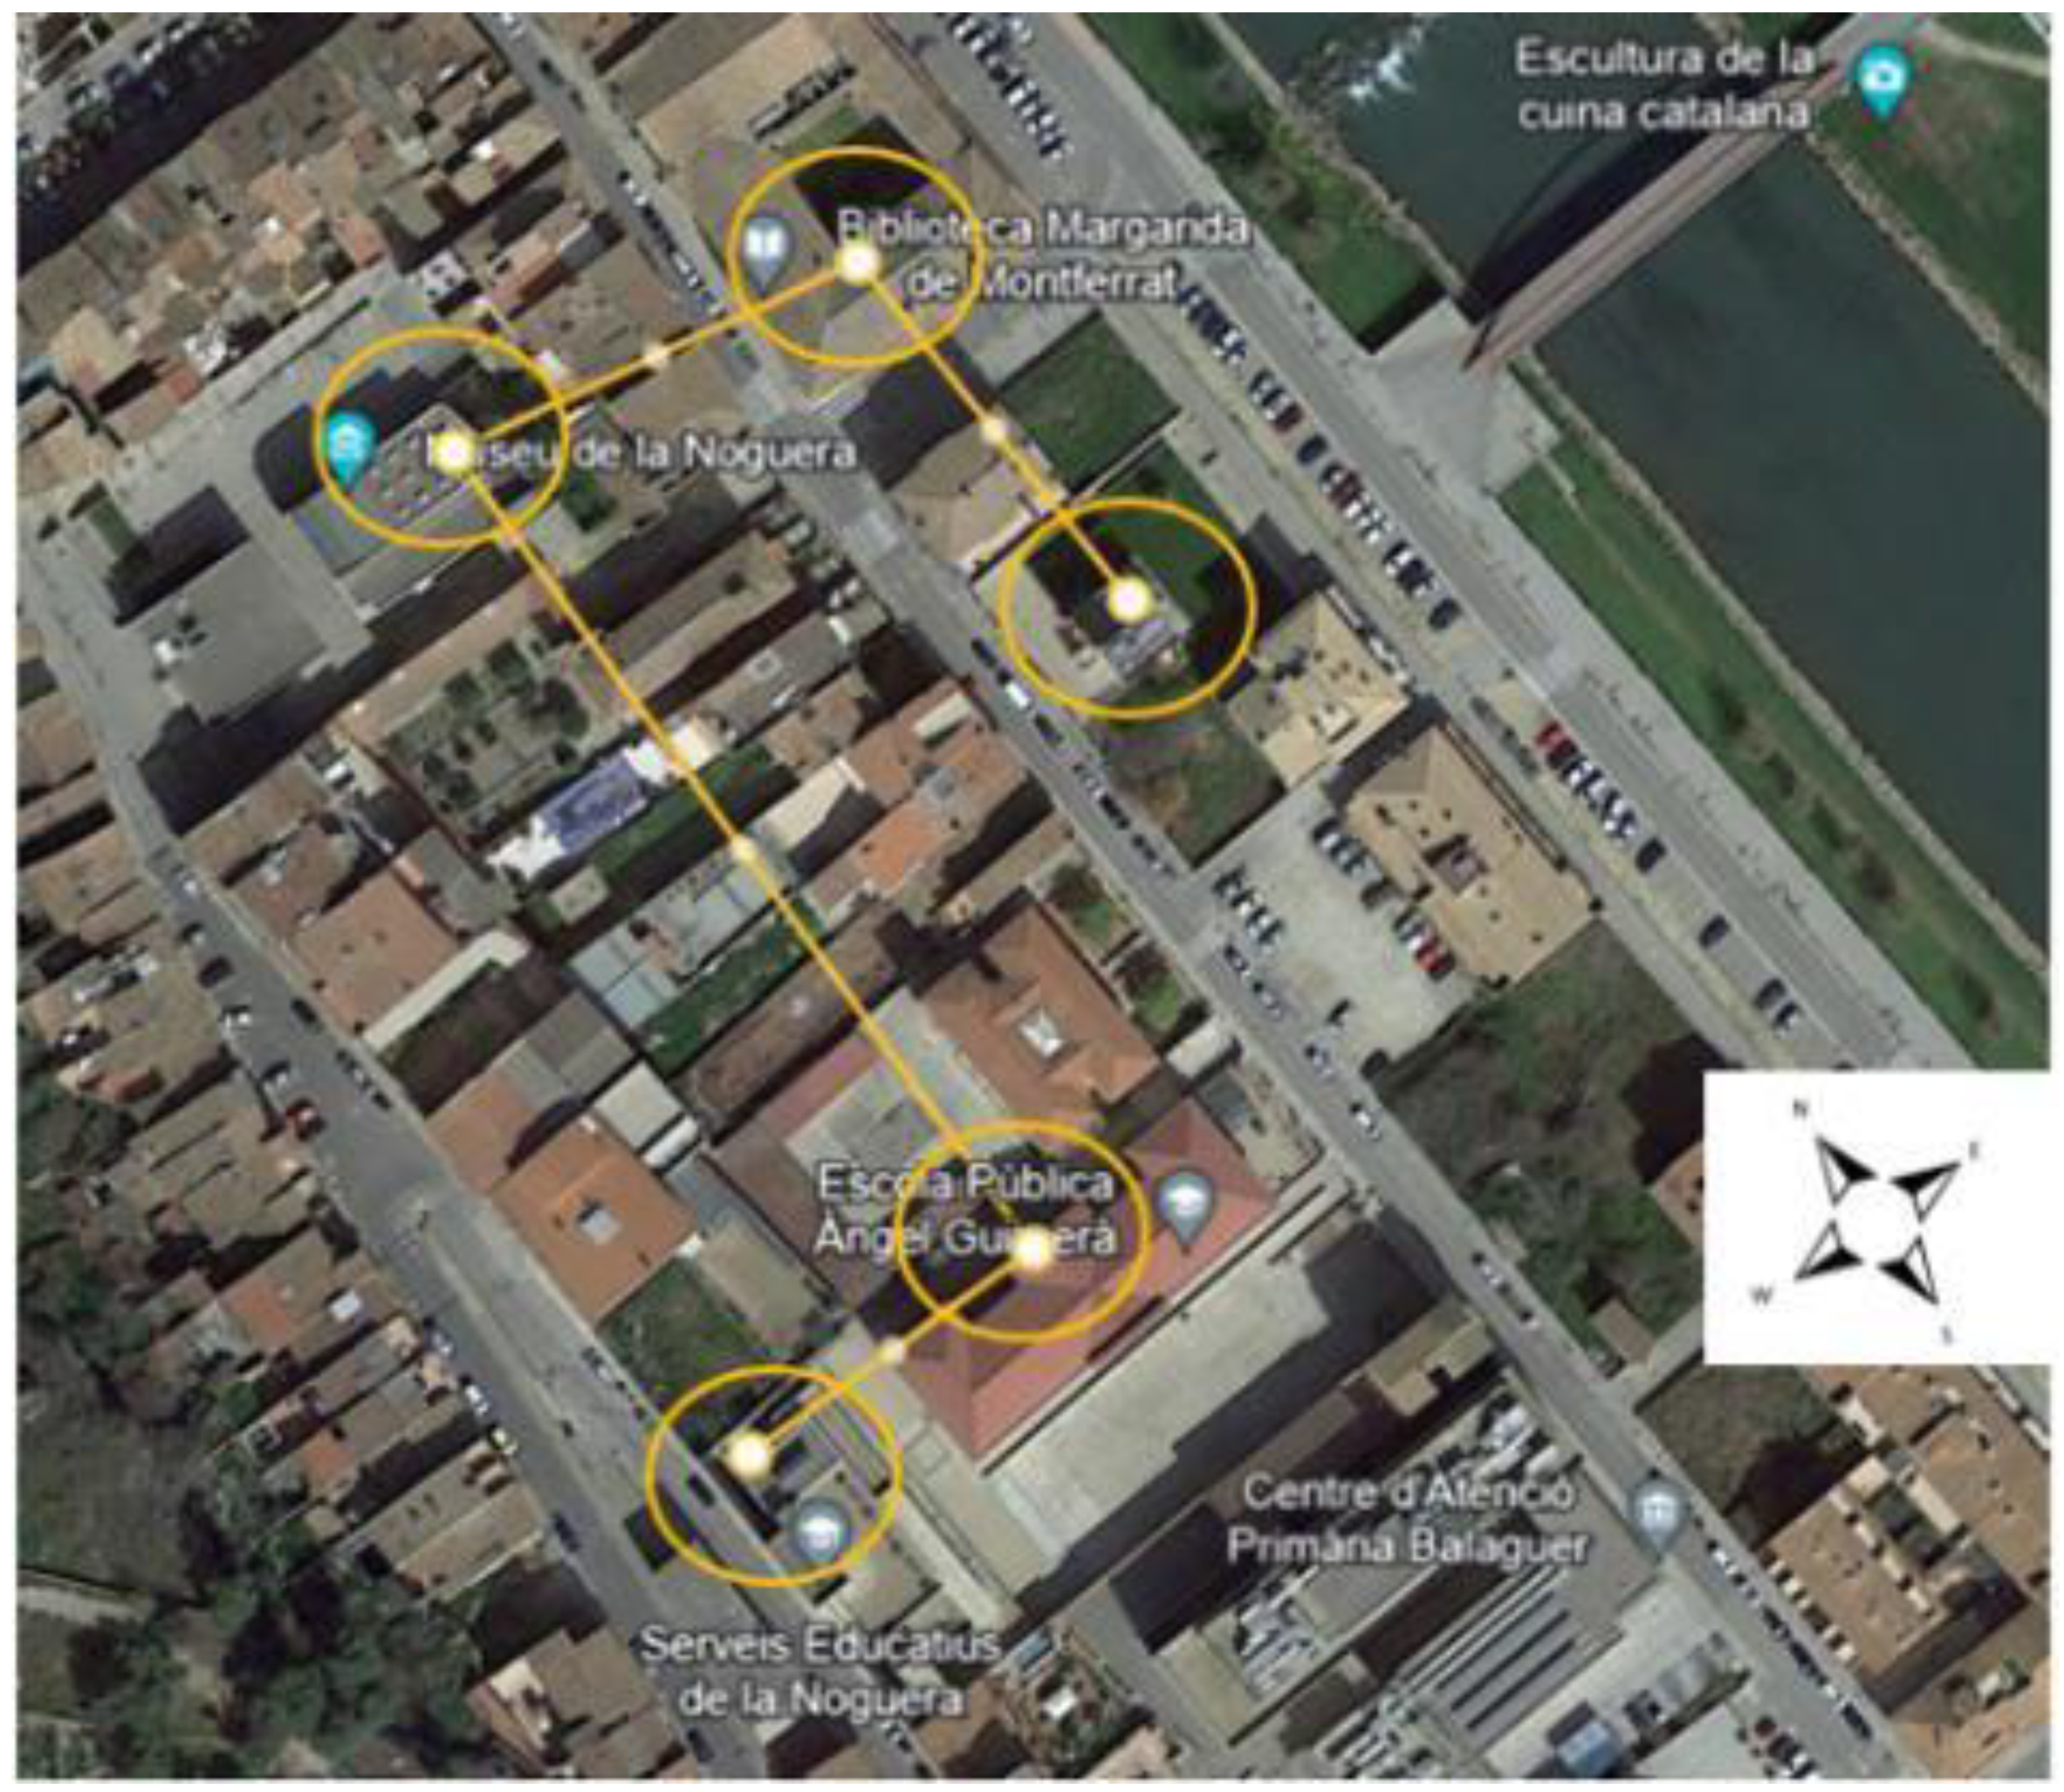
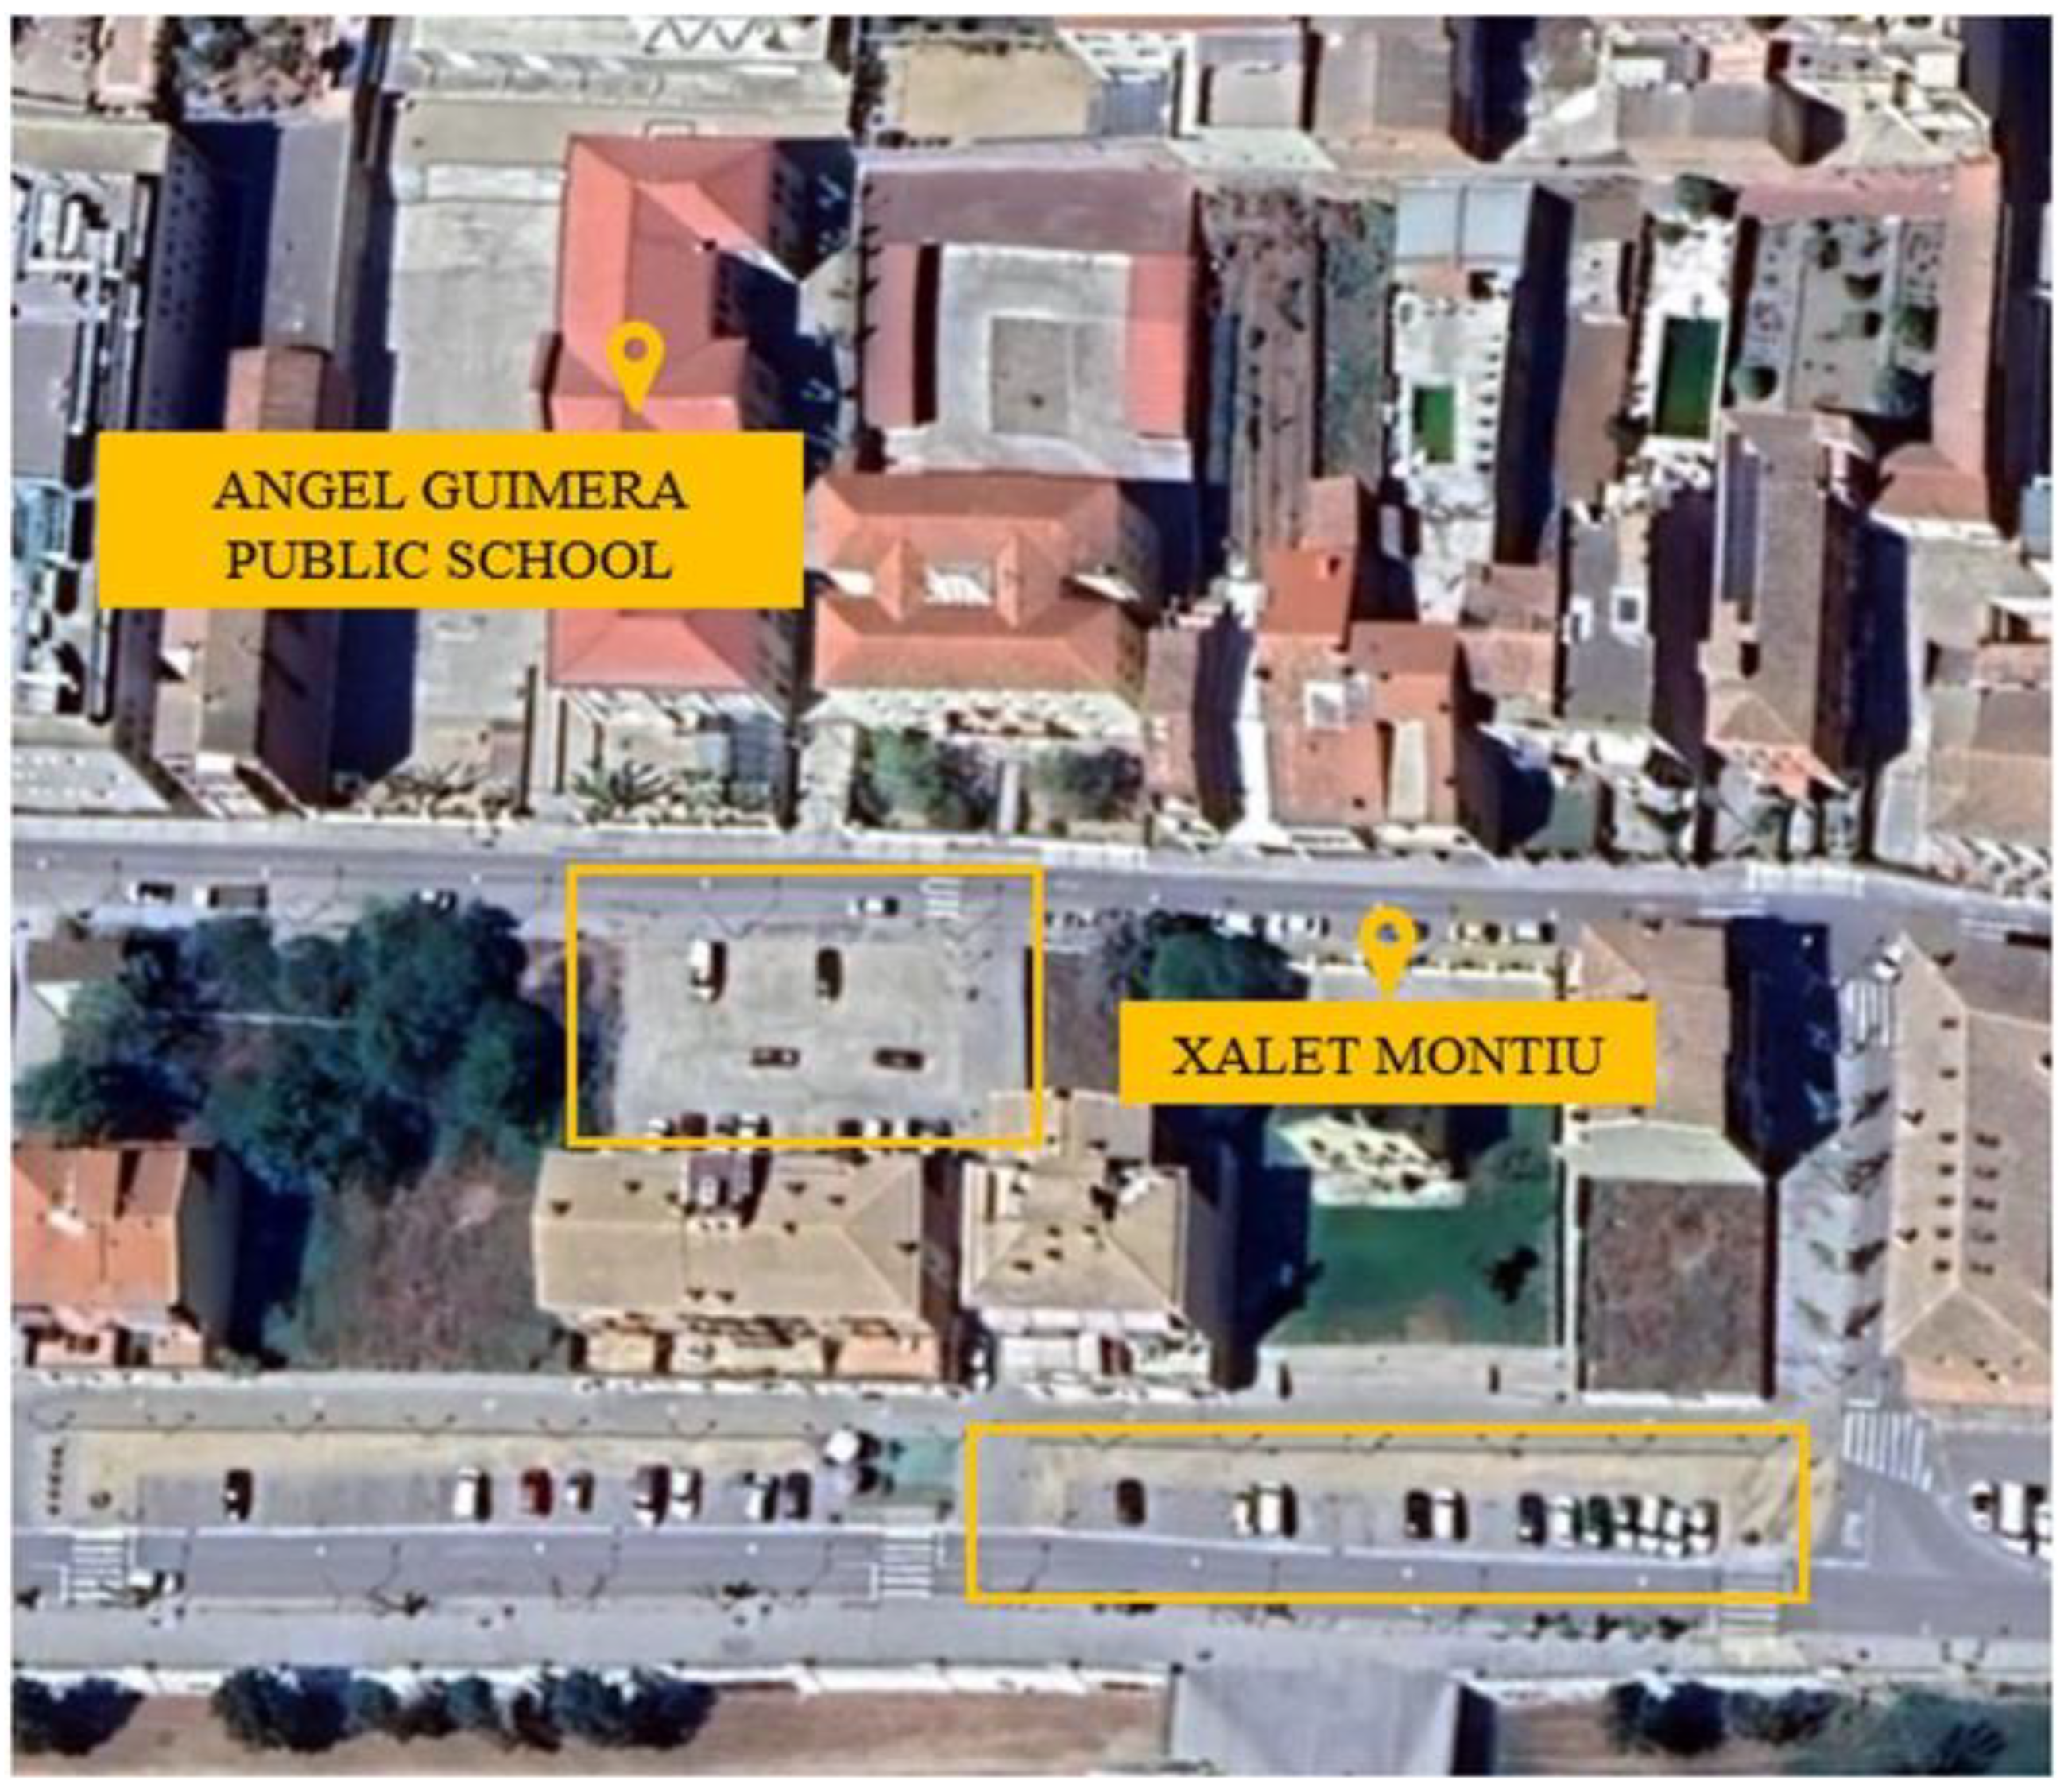
2.2. Case Study
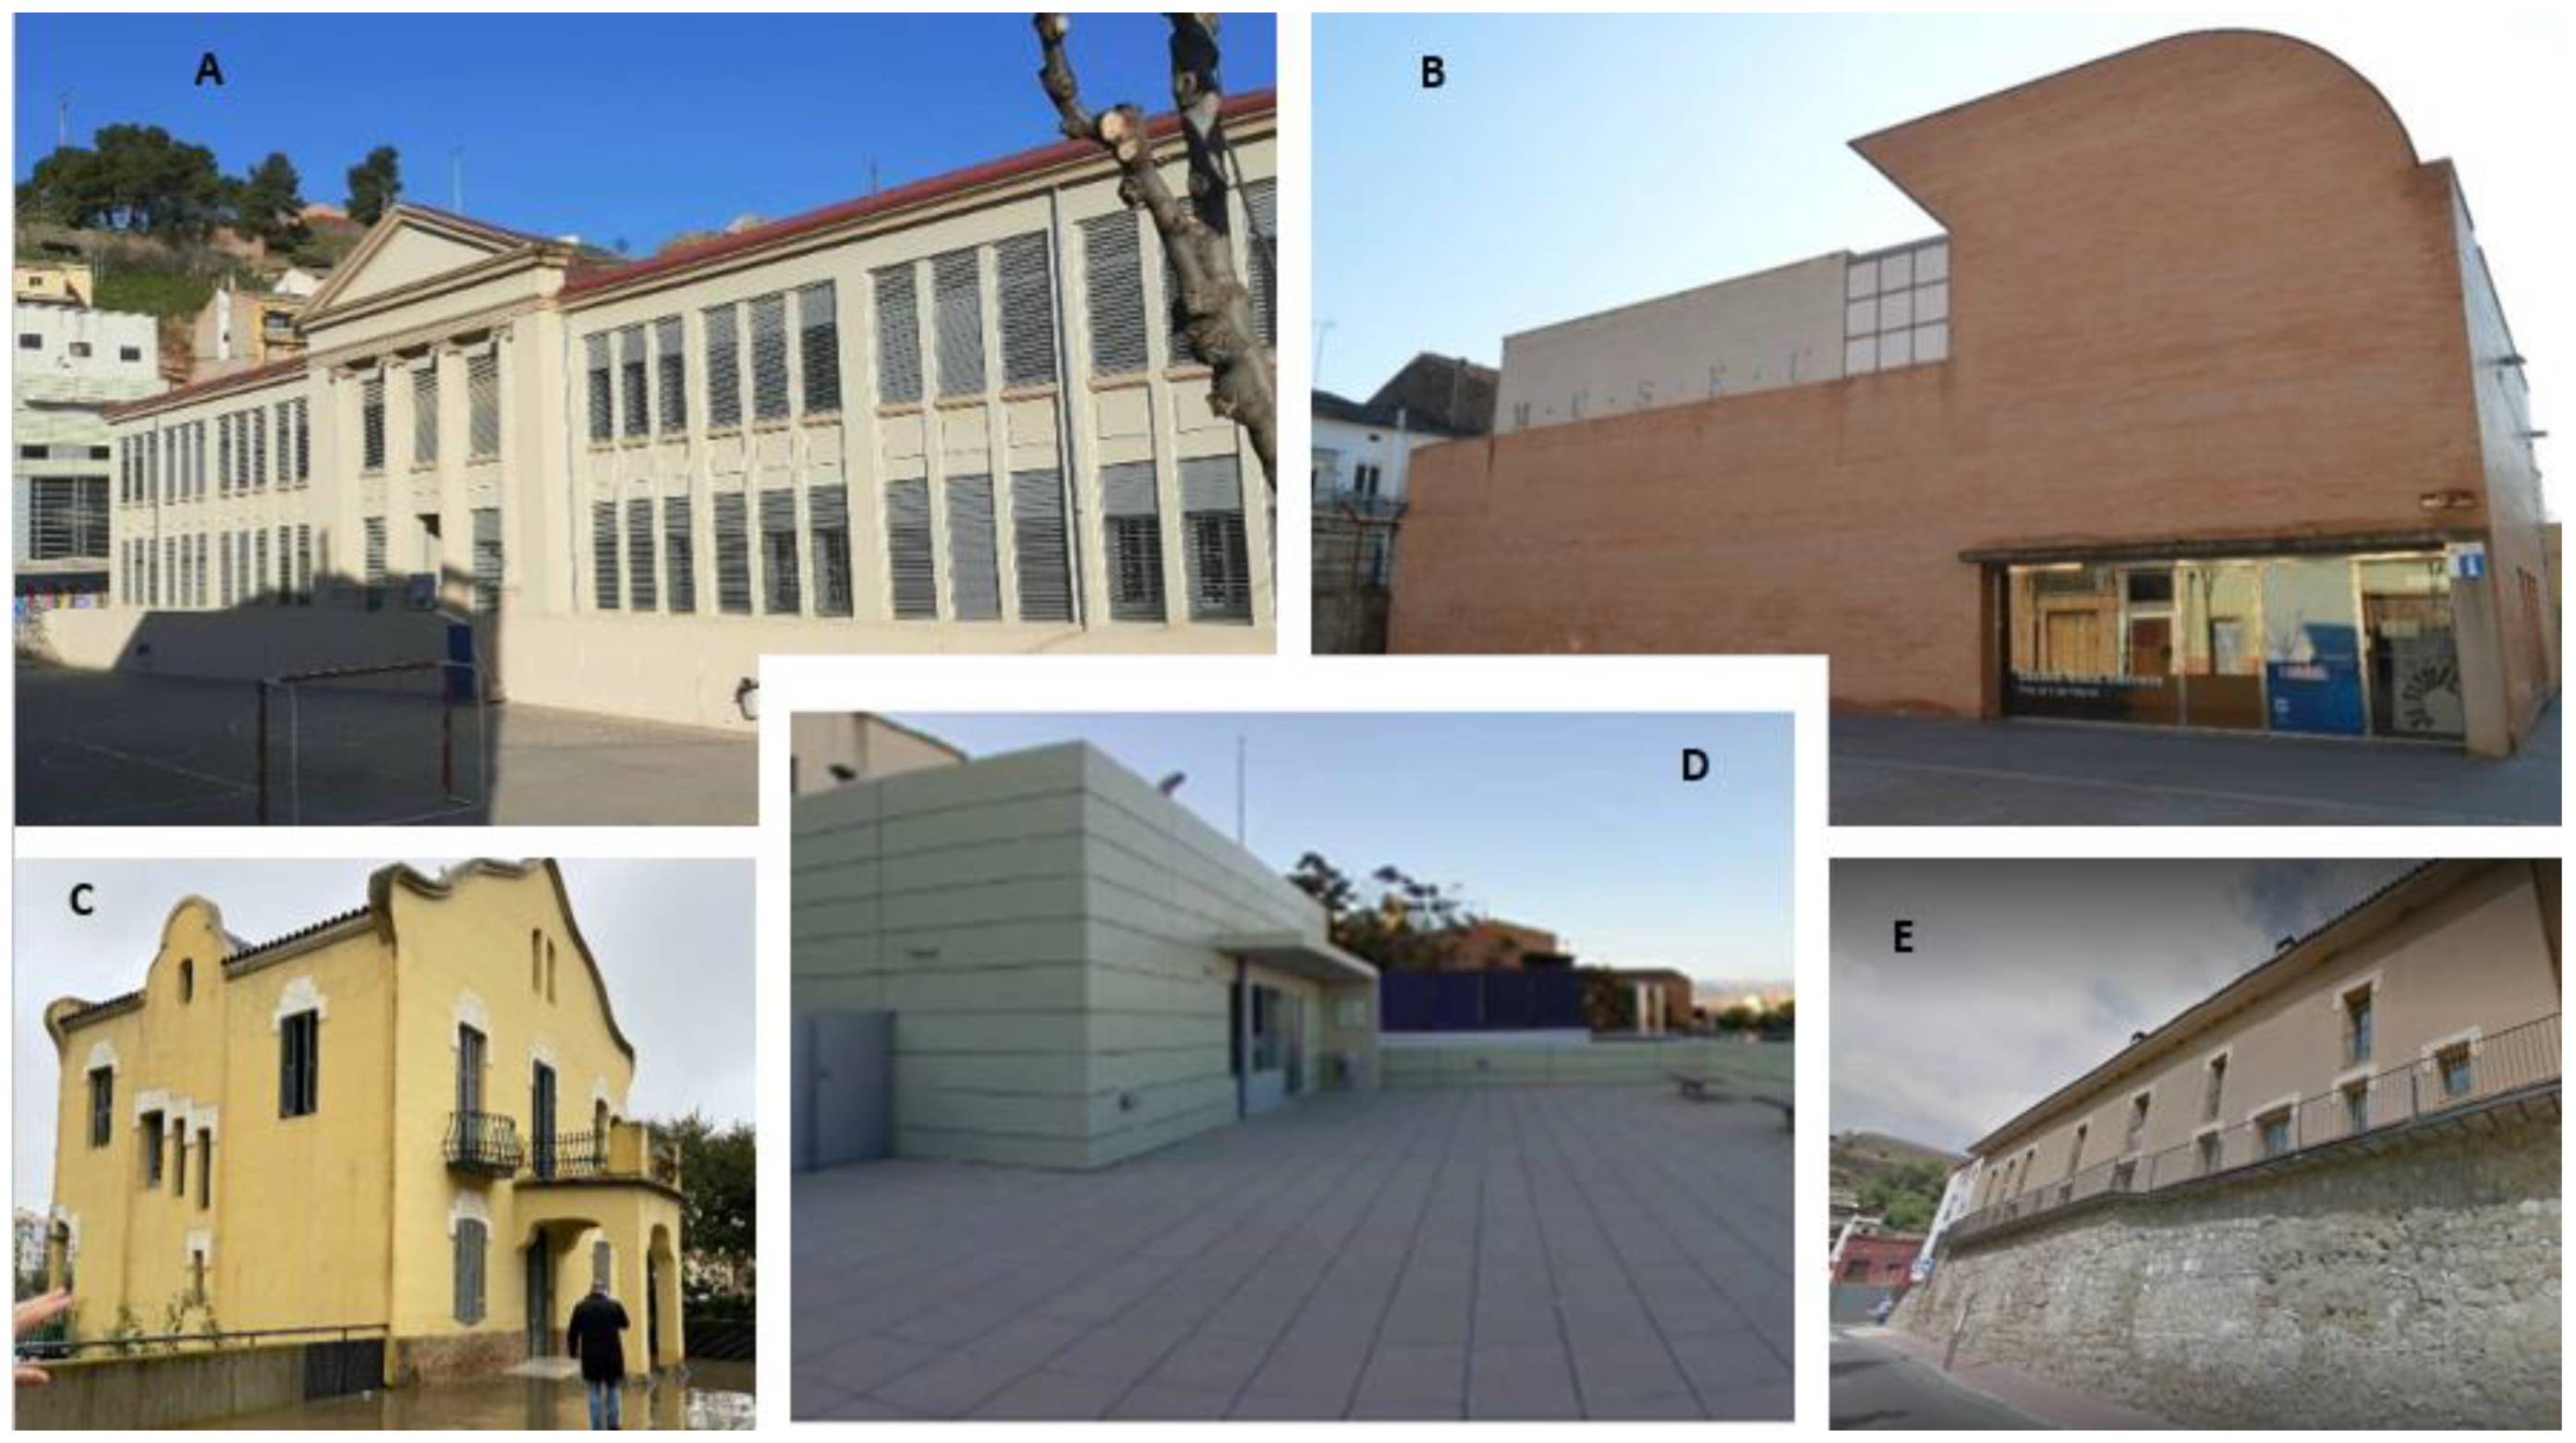
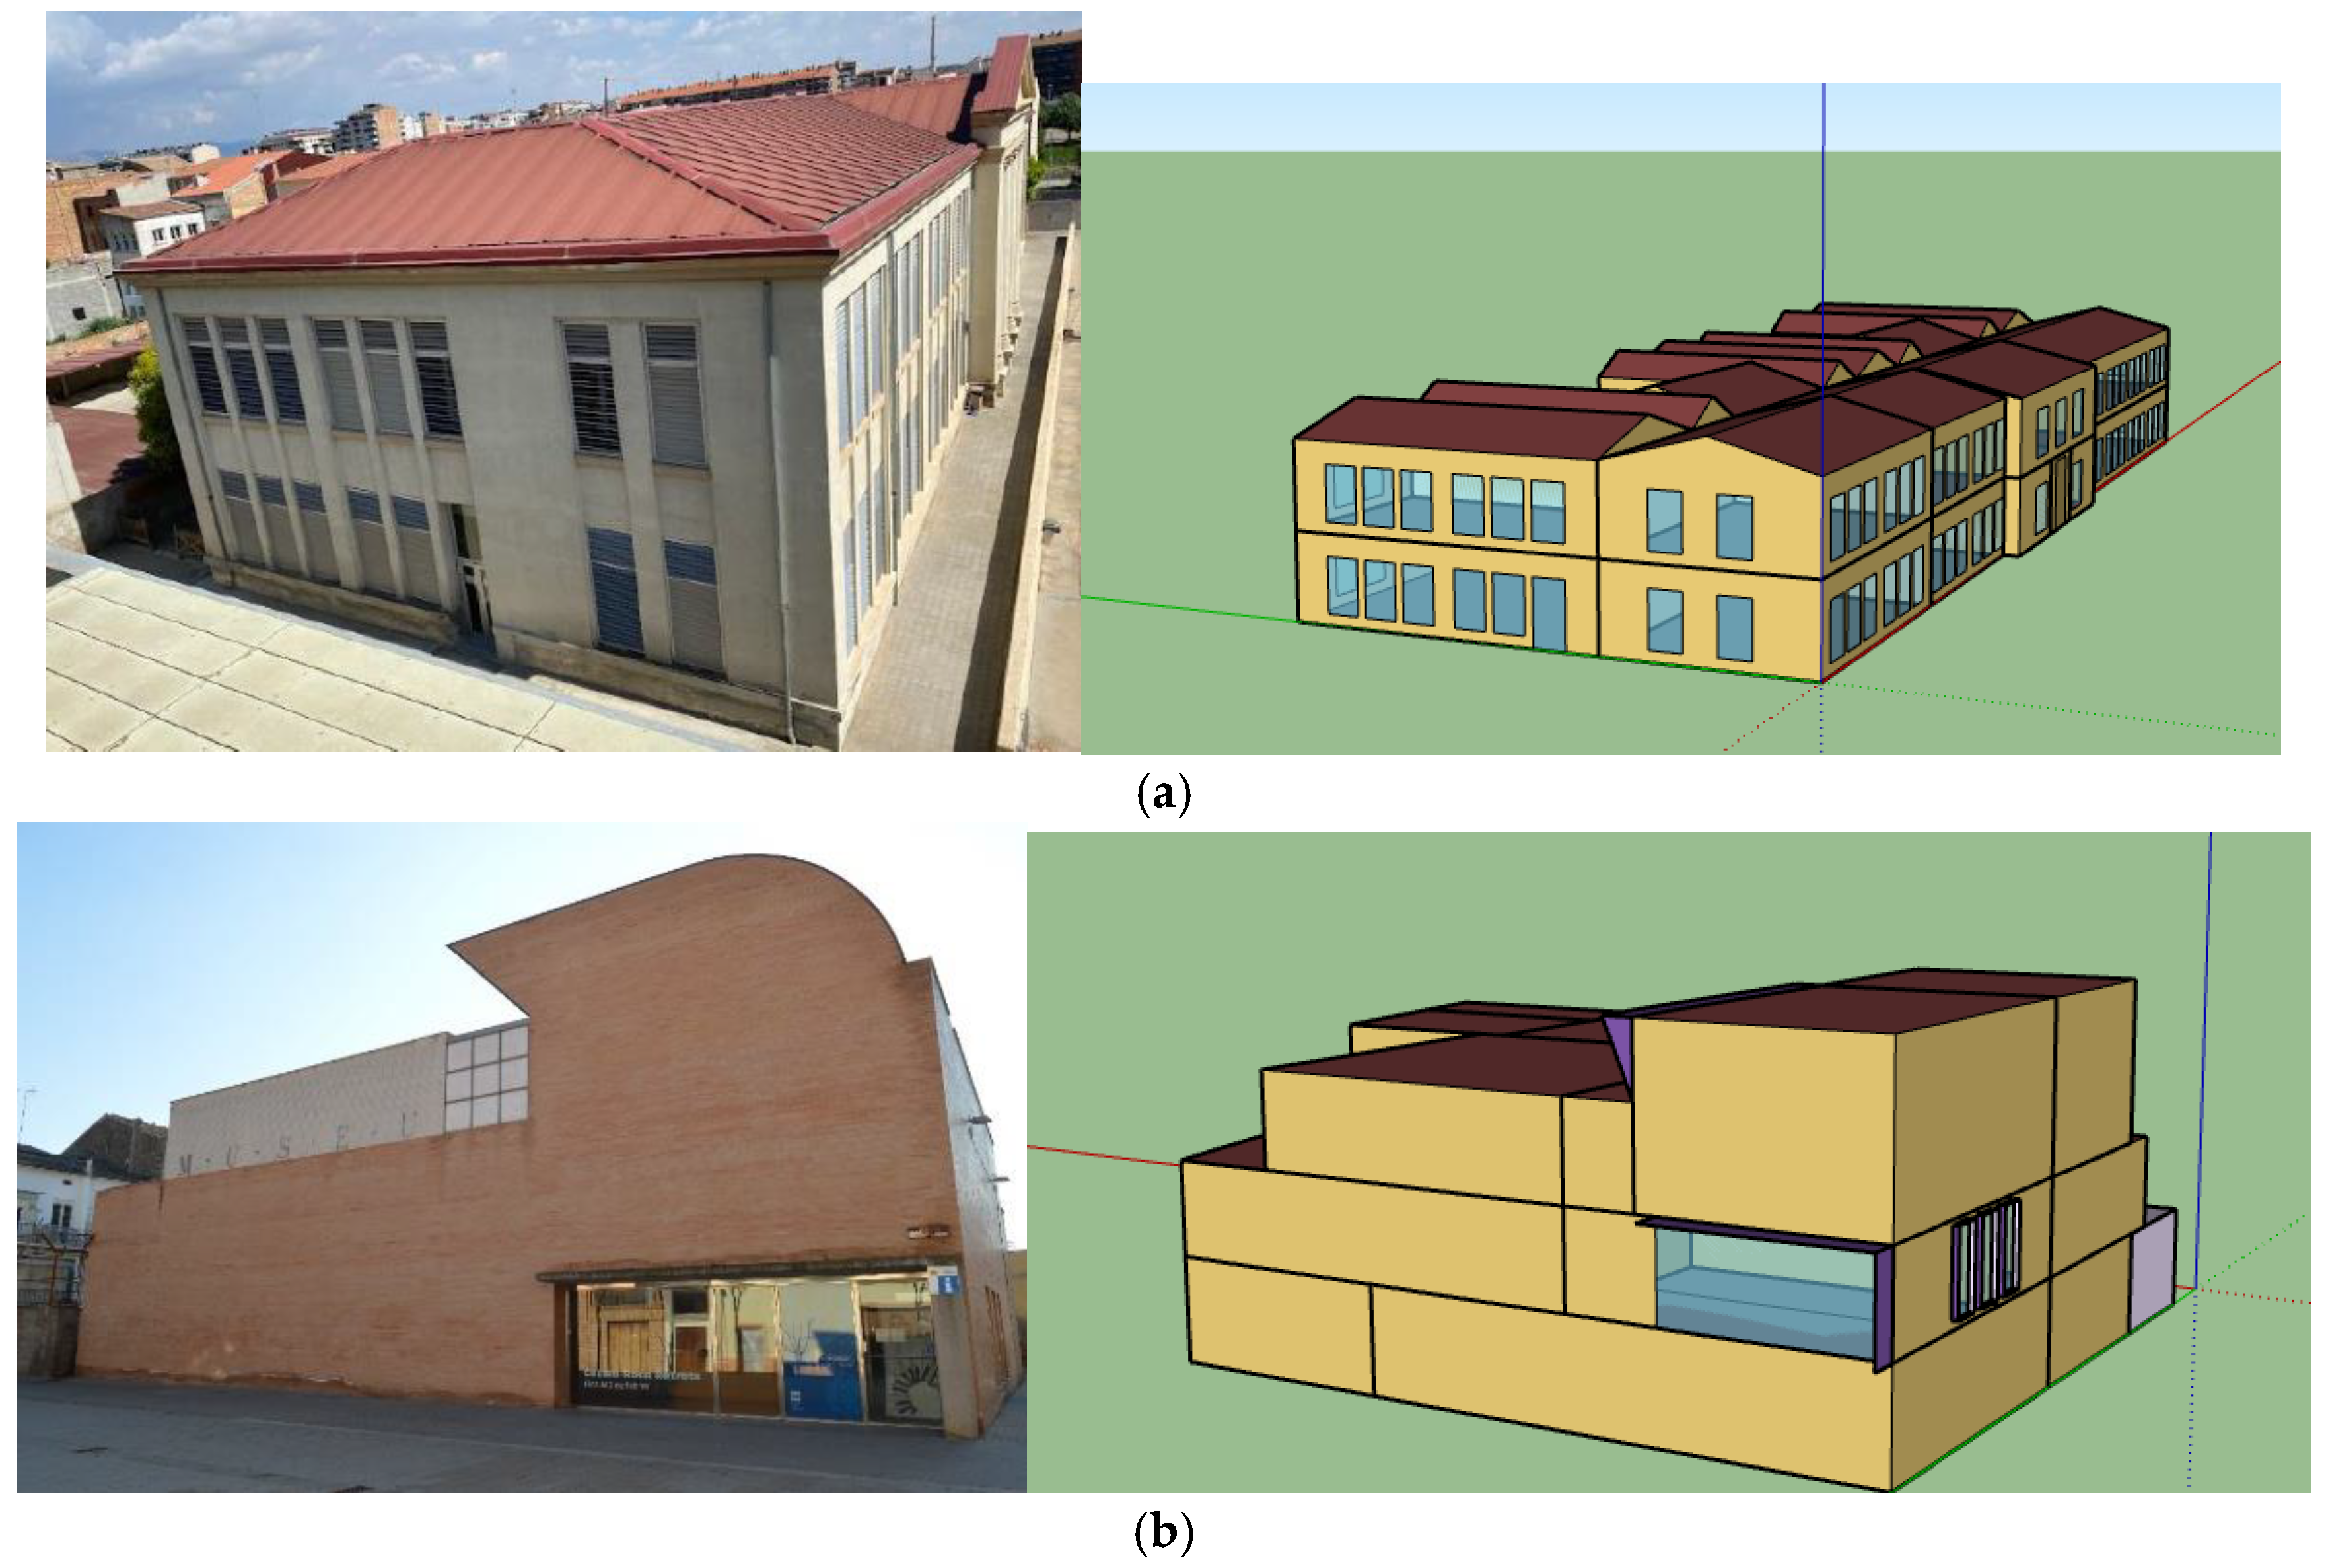
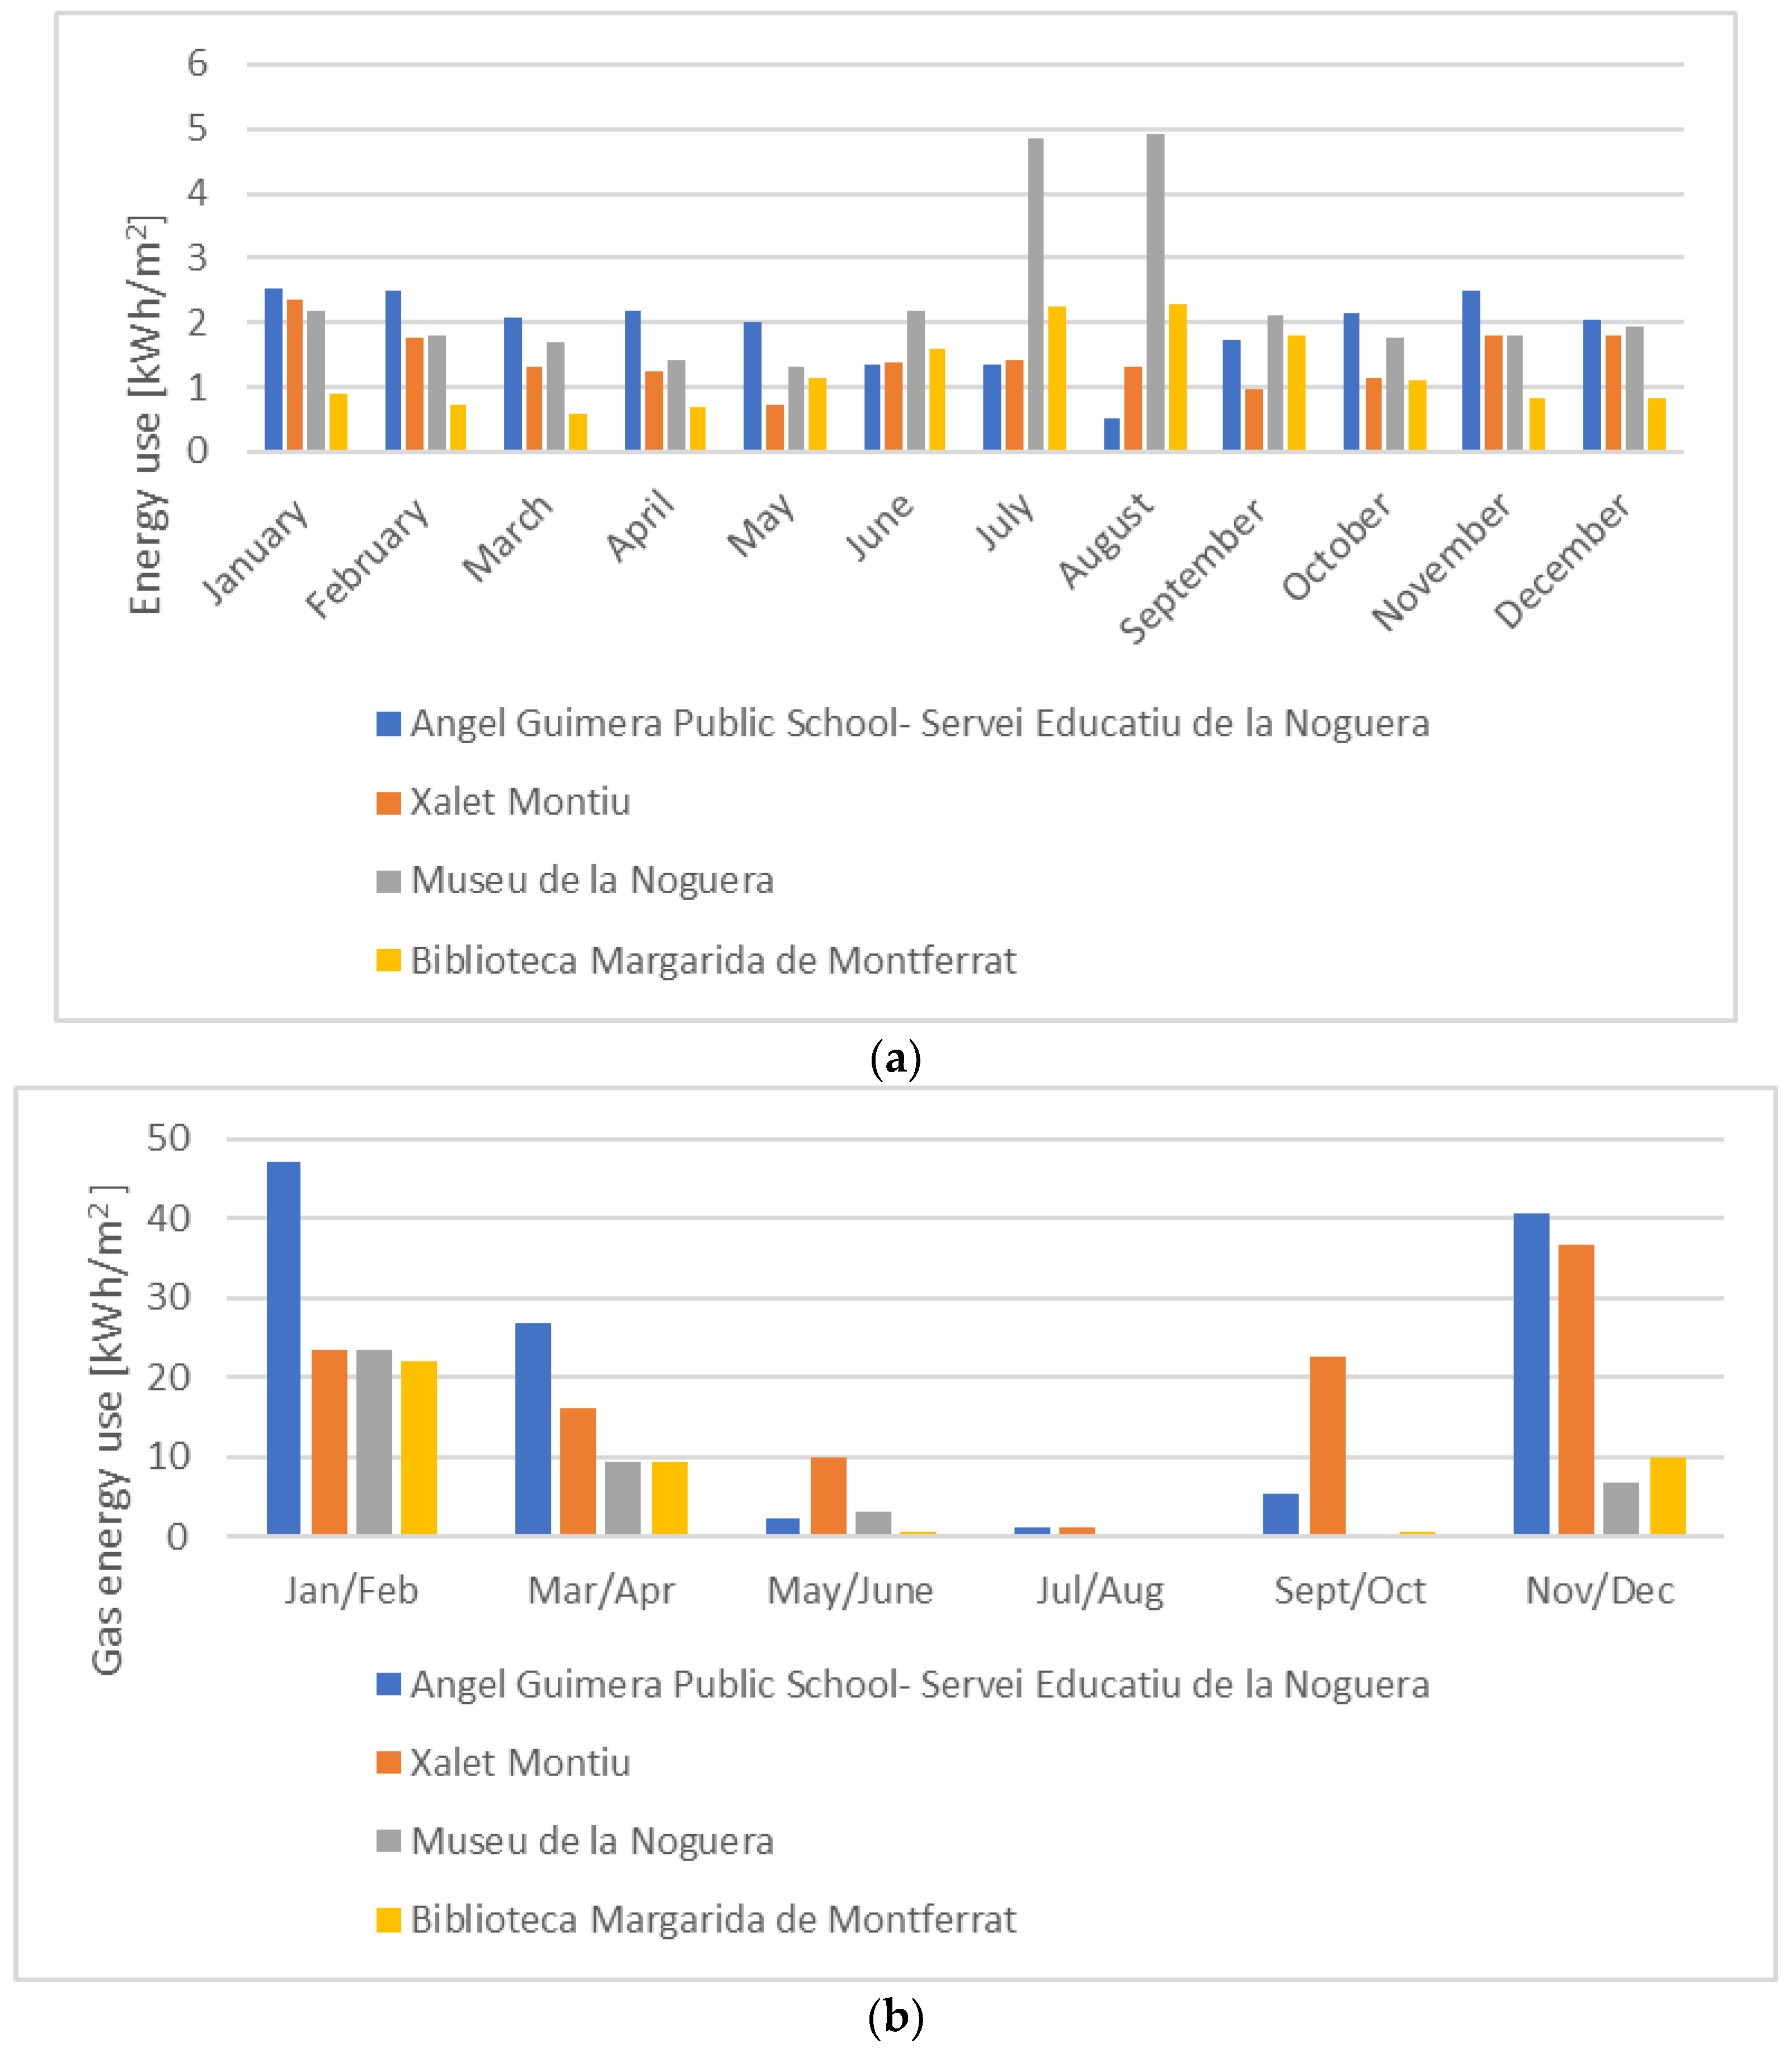
- Angel Guimerà Public School (1800 m2): Primarily operational during the day with limited afternoon occupancy and a month of inactivity in August. Envelope materials include solid brick and plaster, with single-glazed windows. Gas heating is utilized, and cooling is provided by single split systems in most areas, with some zones remaining unconditioned.
- Xalet Montiu (461.44 m2): A historic building showcasing modernist architecture, operating mainly from 9:00 am to 8:00 pm. Envelope features solid brick and plaster, along with single-glazed windows. Various split air conditioner systems complement radiator-based heating, with cooling based on split single systems.
- Educative Service of La Noguera (1093 m2): Mainly active during the day with limited afternoon occupancy and a month of inactivity in August. Envelope comprises solid brick and plaster, with double-glazed windows. Gas burner and radiators facilitate heating, while multi-split air systems are employed for cooling.
- Museum of La Noguera (1496 m2): The building operates at different hours during the week. Envelope materials include brick, polystyrene, clay, plaster, and double-glazed windows. Gas is used for heating, and air systems distribute it, with chiller-based cooling systems of low efficiency.
- Library Margarida de Montferrat (3975 m2): It operates with variable schedules during the week. Envelope features brick and plaster, along with double-glazed windows. Heating relies on radiators gas-based, while split air conditioning systems provide cooling for the entire area of the building.
2.3. Monitoring of Public Buildings
- It has to involve small form factor sensors (they should be aesthetically unpleasant and bulky, as they are placed in public places).
- Data from the sensors have to be collected wirelessly (for the same reasons as 1).
- As one of the goals was to enable citizen science and participation (a future endeavor), sensors and components should be cheap, and, if possible, COTS (Components Off The Shelf).
- All protocols and software, wherever possible, should be open source and based on standards (to ease replication).
2.4. Modelling and Simulation of the District
- i.
- On-site investigation of the district: multiple visits to the buildings were conducted between 2020 and 2022. Comprehensive data, including details about the building envelope, energy systems, occupancy levels, internal loads, lighting and equipment, and energy bill usage, were systematically gathered.
- ii.
- District energy modeling and model calibration: This phase was executed within the Energy Plus modelling and simulation environment. All relevant data obtained during the on-site investigations were input into the models. A calibration procedure was executed, focusing on refining the accuracy of key variables that carried uncertainty.
- iii.
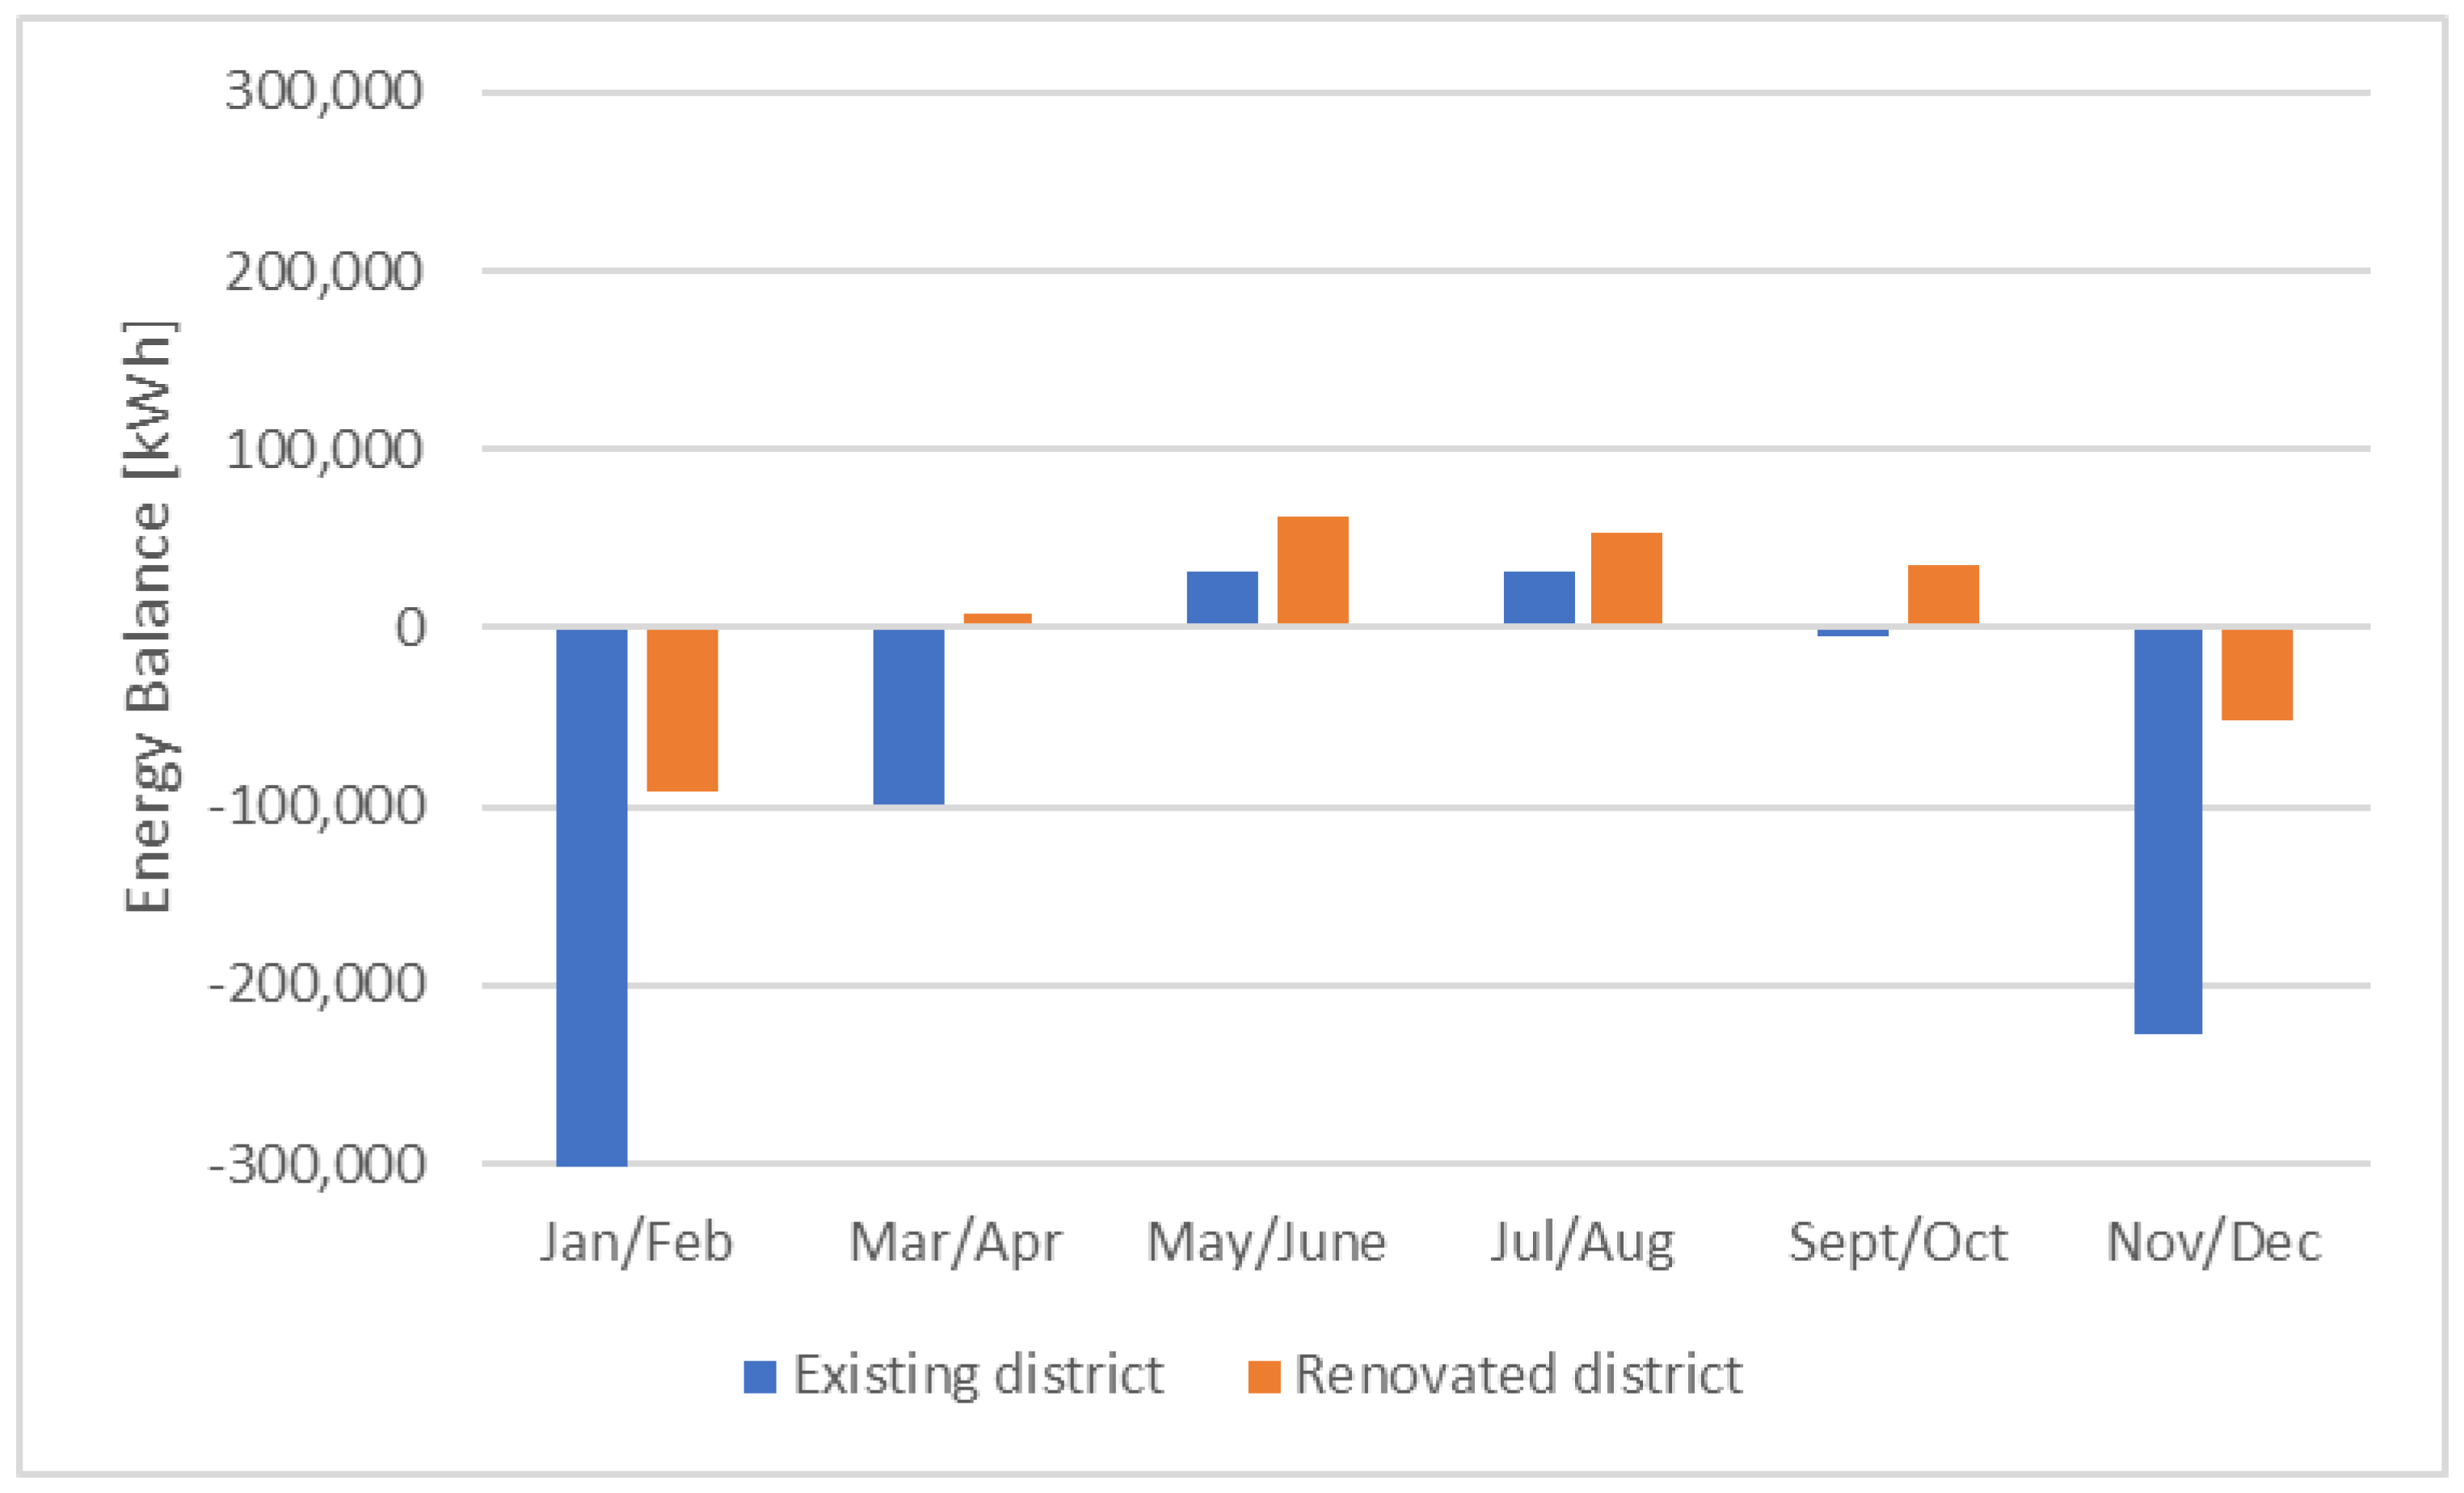
- Towards the level of Positive Energy District, renovation, and energy efficiency measures: several solutions for enhancing energy efficiency and energy generation were introduced and implemented in the calibrated model. The subsequent calculation involved assessing the impact of these modifications on the overall energy consumption and verifying the achievement of the definition of the Positive Energy District.
- External wall insulation coating (polystyrene): applied to buildings including Xalet Montiu, Servei Educatiu de la Noguera, Àngel Guimerà Public School, and Biblioteca Margarida de Montferrat.
- Roof external insulation coating (polystyrene): implemented in Xalet Montiu, Servei Educatiu de la Noguera, Àngel Guimerà Public School, and Biblioteca Margarida de Montferrat.
- Window substitution: windows with a thermal transmittance up to 1.6 W/m2·K and a Solar Heat Gain Coefficient (SHGC) of 0.6 are introduced to Àngel Guimerà Public School and Xalet Montiu.
- Replacement of lighting bulbs and heating/cooling generators: commercially available, state-of-the-art heat pumps (air or water-based) with Coefficient of Performance (COP) and an Energy Efficiency Ratio (EER) greater than 4.5 are implemented.
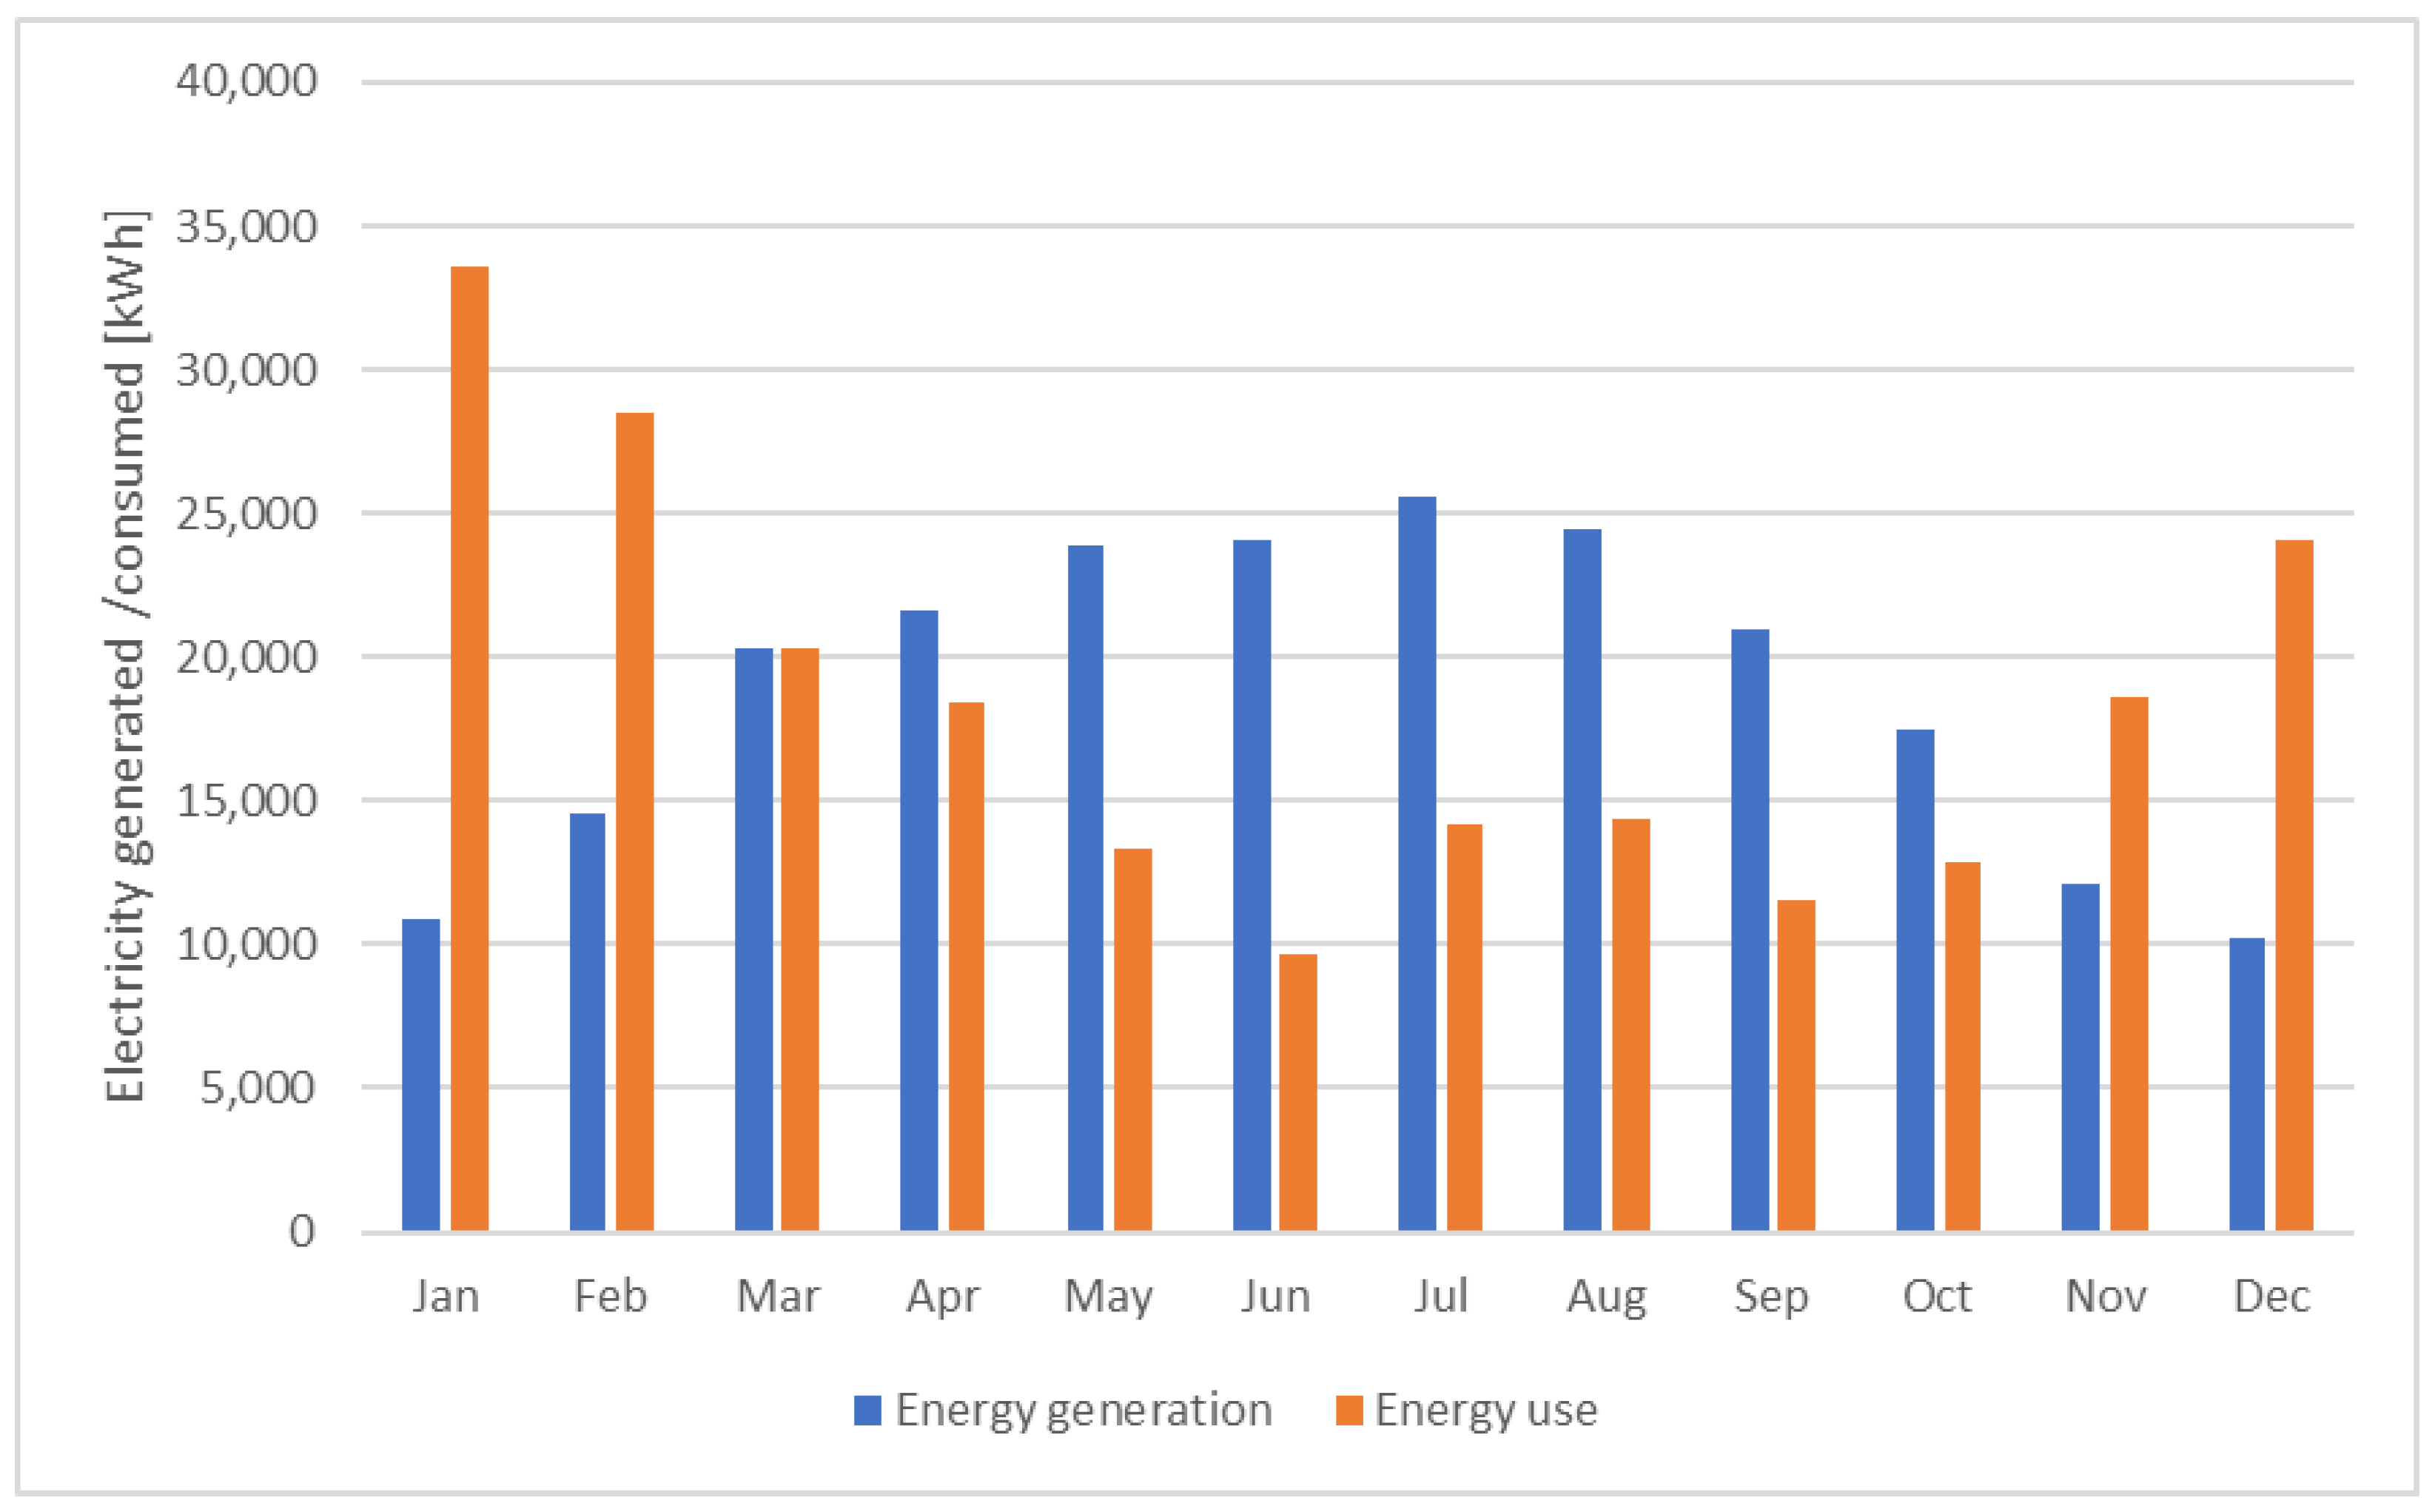
- Photovoltaic generation systems installation: deployed on surfaces facing south, south-east, and south-west, as well as on on-site close surfaces, such as parking areas. The planned total installation is 104 kW, covering a total area of 528 m2, as detailed in Table 2.
- Utilization of a 250-kWh storage system in scenario, reflecting the concept of structuring an energy community with peer-to-peer energy flow connections across the entire district.
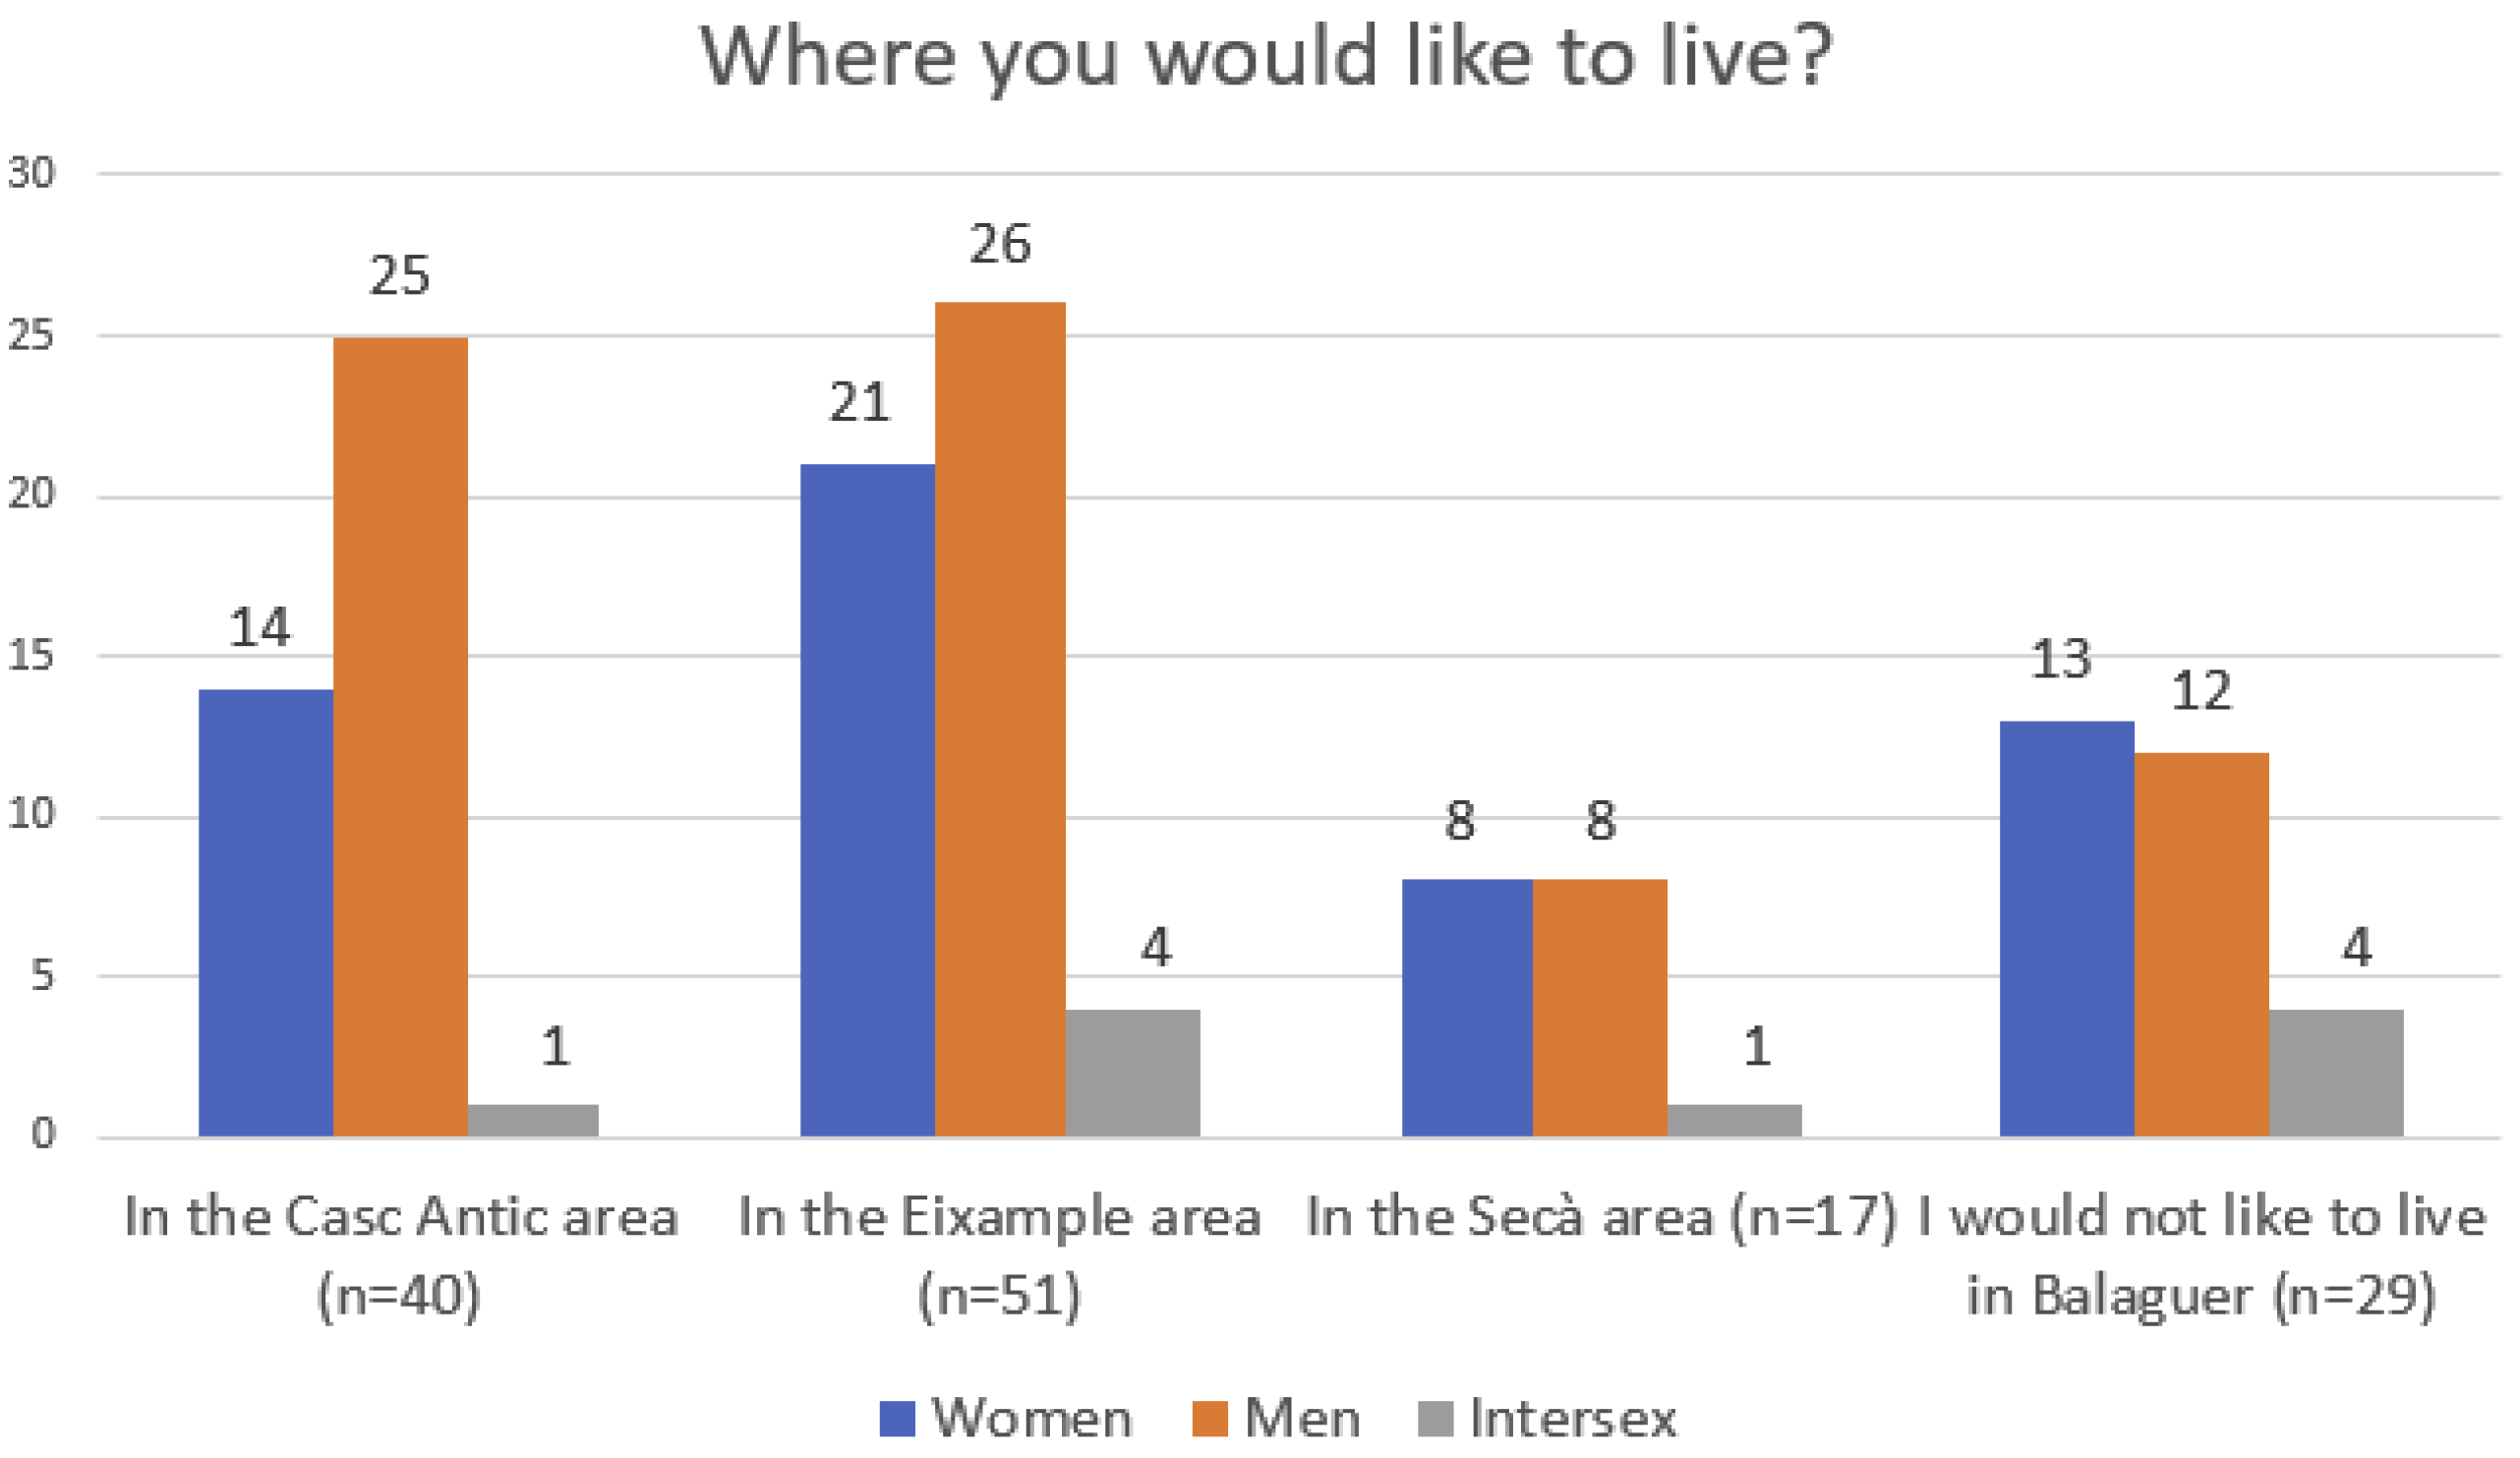
2.5. Questionnaires
- SDG3: Good health and well-being: citizens should be aware of the temperature in public buildings, as it serves as an example of the temperature that should be maintained in private homes.
- SDG5: Gender Equality: the study results have been analyzed from the perspective of the participants’ gender.
- SDG9: Industry, innovation, and infrastructure: the totem pole installed on the city hall’s door is an innovative public infrastructure for the city.
- SDG10: Reduce inequalities: to reduce inequality, citizens can provide input on which neighborhoods need revitalization.
- SDG13: Climate action: analysis of wind chill’s impact on women, men, and intersex people raises awareness of climate change.
3. Implementation Details
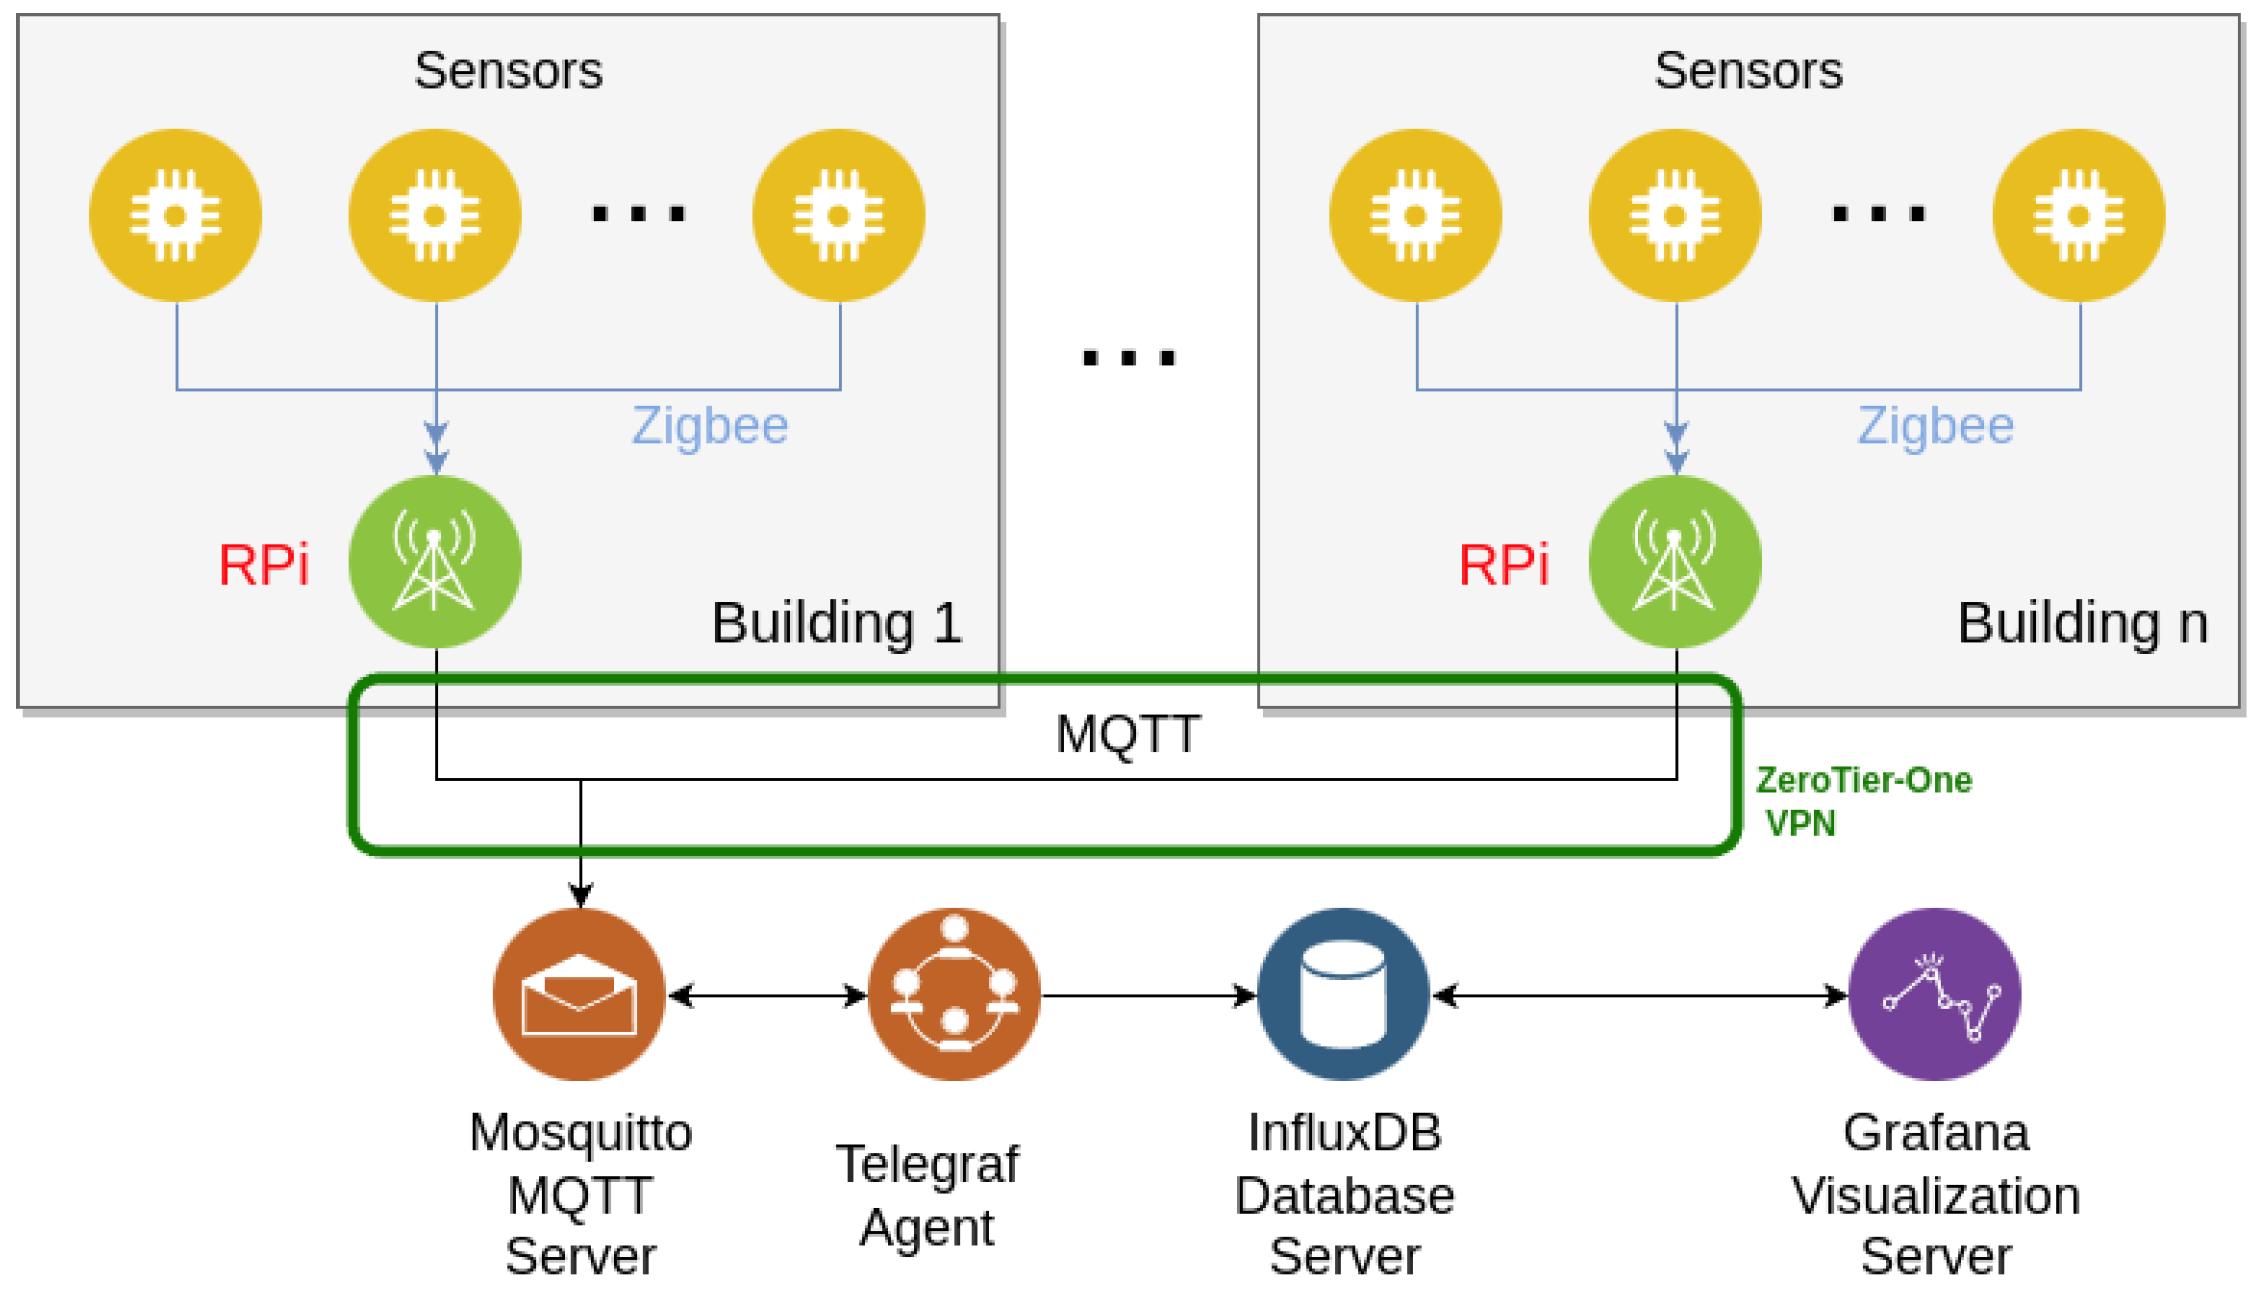
- Aqara/Xiaomi Zigbee Sensors. We wished to have standard off-the-shelf components wherever it was possible, to lower the cost of possible replications of that setup, especially for citizen science. Zigbee is a wireless transmission protocol designed for IoT (Internet of Things) data transmission, and is becoming, due to its reliability, low power requirements, area coverage, and low price, the de facto standard for home sensoring. There are several manufacturers of Zigbee based devices, and one of such, Xiaomi/Aqara, has a wide selection of products, is affordable, and is aesthetically pleasant enough so they will not stand out once installed in place.
- Raspberry PI (RPi3). For the data collection nodes, we require a small form factor computer, which is affordable and easy to acquire. One such device is the RaspberryPi (Raspberry Pi Foundation, UK). For the deployment for this work, we used RaspberryPi 4/2 GB of RAM, the state-of-the-art SBC at the moment. Other models (RaspberryPi 5, or RaspberryPi Zero 2W) could be used, as they fulfill the requirements of RAM/CPU for the task they have to perform. These RaspberryPi will require this additional hardware and software:
- o
- CC2531 USB-2-Zigbee: Any USB to Zigbee device will operate. For our project we used one based on a Texas Instrument CC2531 (with a price tag around 10EUR each), with a modified firmware from the Zigbee2MQTT project.
- o
- Zigbee2MQTT: Zigbee2MQTT is a software system that, using a USB 2 Zigbee dongle, receives Zigbee messages from a network of sensors and relays them using MQTT to a MQTT broker. This software is running on a Docker container on the RPi3 for better isolation and more reliability.
- ZeroTier-One VPN. For increased security, the connections between the RPi3 nodes and the central MQTT broker are routed through a secure VPN (Virtual Private Network) using ZeroTier-One service.
- Mosquitto MQTT Server. All MQTT messages with the sensor data are transmitted from the RPi3 via the local building internet (through a VPN) to a Mosquitto MQTT Server that acts as the MQTT broker.
- Telegraf Agent. A Telegraf agent is running continuously subscribed to the MQTT broker and rerouting (and format translating) all messages to the InfluxDB database server.
- InfluxDB Database. Data is stored on an InfluxDB instance. As data coming from sensors is a time-series data stream, InfluxDB is one of the best choices for storing that data.
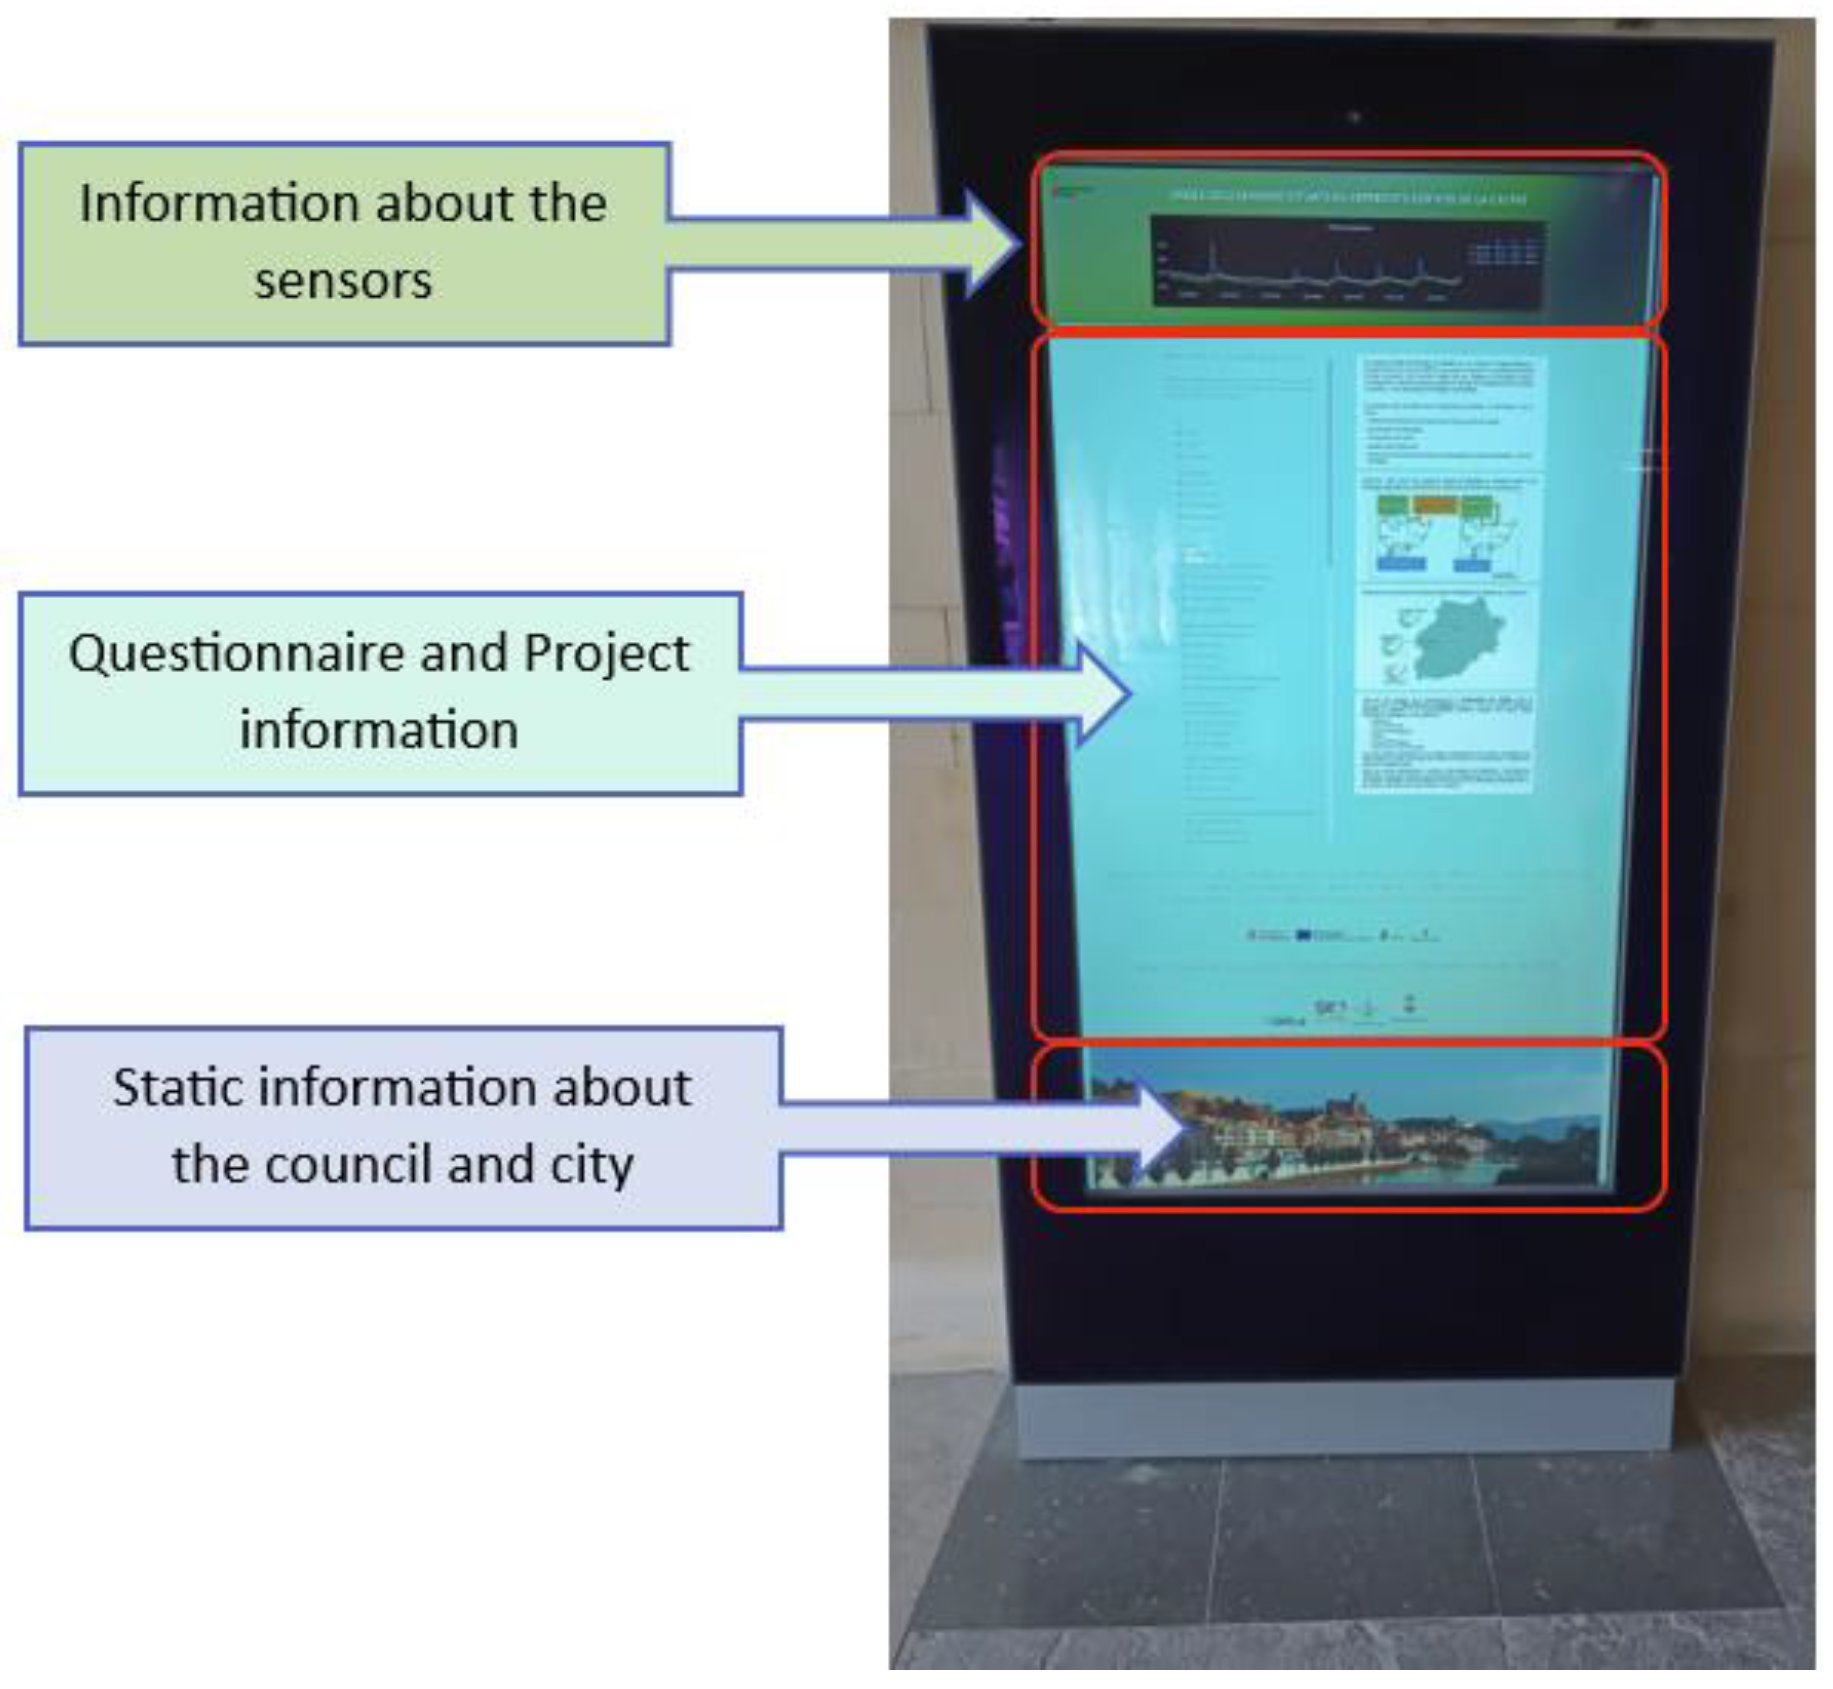
- Grafana Visualization Server. We are running a Grafana instance that, as it has the InfluxDB instance as a data source, allows us to visualize the collected data, as seen in Figure 8. The Grafana instance also provides the graphs that will be visualized as part of the display of the totem.
- The sensors by Xiaomi/Aqara, priced around 5 EUR each, have enough precision for this kind of study: temperature can be between −20 °C and +50 °C, with a ±0.3 °C error; humidity can be 0–100% RH (non-condensing), ±3%, and, for those with atmospheric pressure, it can be between 30 kPa and 110 kPa, ±0.12 kPa. Their battery, a CR2032 cell, lasts around two years. And the chosen communications protocol, Zigbee, has a longer range than WiFi or Bluetooth and lower power consumption.
- The RPi is a robust SBC, and the latest models (Zero 2W) are widely available with a price tag floating around 20 EUR.
- The required Zigbee USB dongles have become, thanks to the expansion of domotic hardware by big brands (IKEA and Lidl amongst them), widely available, with prices between 10 EUR and 30 EUR (depending on antennas, range, brand, etc.).
- The combination of MQTT for messaging, InfluxDB for data storage, and Grafana as a visualization platform, has proven reliable and robust. No wonder this combination is becoming the powerhouse behind many home automation and sensoring projects.
4. Results and Discussion
- SDG3—Good health and well-being: decreasing GHG emissions and improving thermal comfort inside the buildings increased the population’s health and its well-being.
- SDG4—Quality education: citizen science contributes to lifelong learning of the citizens involved in the actions.
- SDG5—Gender equality: The study results have been analyzed from the perspective of the participants’ gender.
- SDG7—Affordable and clean energy: decreasing the energy demand of buildings decreases energy poverty; increasing the use of renewable energy contributes to having affordable, reliable, and sustainable energy.
- SDG9—Industry, innovation, and infrastructure: introducing innovation in public buildings and private households contributes to this SDG.
- SDG10—Reduce inequalities: decreasing energy demand and contributing to more affordable energy in buildings reduces inequalities between citizens.
- SDG11—Sustainable cities and communities: the study contributes to making cities and human settlements inclusive, safe, resilient, and sustainable.
- SDG12—Responsible consumption and production: an objective that also applies to energy.
- SDG13—Climate action: decreasing energy demand in buildings and introducing renewable energy production are clear actions towards climate change mitigation.
- SDG16—Peace, justice, and strong institutions: the involvement of municipality authorities in citizen science and energy-use optimization contributes to having stronger institutions.
5. Conclusions
Author Contributions
Funding
Institutional Review Board Statement
Informed Consent Statement
Data Availability Statement
Acknowledgments
Conflicts of Interest
References
- Du, H.; Han, Q.; de Vries, B. Modelling Energy-Efficient Renovation Adoption and Diffusion Process for Households: A Review and a Way Forward. Sustain. Cities Soc. 2022, 77, 103560. [Google Scholar] [CrossRef]
- ur Rehman, H.; Reda, F.; Paiho, S.; Hasan, A. Towards Positive Energy Communities at High Latitudes. Energy Convers. Manag. 2019, 196, 175–195. [Google Scholar] [CrossRef]
- Sareen, S.; Albert-Seifried, V.; Aelenei, L.; Reda, F.; Etminan, G.; Andreucci, M.-B.; Kuzmic, M.; Maas, N.; Seco, O.; Civiero, P.; et al. Ten Questions Concerning Positive Energy Districts. Build. Environ. 2022, 216, 109017. [Google Scholar] [CrossRef]
- Neumann, H.-M.; Garayo, S.D.; Gaitani, N.; Vettorato, D.; Aelenei, L.; Borsboom, J.; Etminan, G.; Kozlowska, A.; Reda, F.; Rose, J.; et al. Qualitative Assessment Methodology for Positive Energy District Planning Guidelines. In Proceedings of the Sustainability in Energy and Buildings 2021; Littlewood, J.R., Howlett, R.J., Jain, L.C., Eds.; Springer Nature: Singapore, 2022; pp. 507–517. [Google Scholar]
- JPI Urban Europe, SET-Plan ACTION nº3.2 Implementation Plan. 2018. Available online: https://jpi-urbaneurope.eu/wp-content/uploads/2021/10/setplan_smartcities_implementationplan-2.pdf (accessed on 15 December 2023).
- Hedman, Å.; Rehman, H.U.; Gabaldón, A.; Bisello, A.; Albert-Seifried, V.; Zhang, X.; Guarino, F.; Grynning, S.; Eicker, U.; Neumann, H.-M.; et al. IEA EBC Annex83 Positive Energy Districts. Buildings 2021, 11, 130. [Google Scholar] [CrossRef]
- EERA. Smart Cities, European Energy Research Alliance Joint Programme on Smart Cities. Available online: https://www.eera-sc.eu/ (accessed on 28 January 2024).
- PED-EU-NET. European Cooperation in Science & Technology Ped Eu Net. 2023. Available online: https://pedeu.net/action/ (accessed on 15 December 2023).
- JPI Urban Europe. Europe Towards Positive Energy Districts. 2020. Available online: https://jpi-urbaneurope.eu/wp-content/uploads/2020/06/PED-Booklet-Update-Feb-2020_2.pdf (accessed on 20 May 2023).
- Guarino, F.; Rincione, R.; Mateu, C.; Teixidó, M.; Cabeza, L.F.; Cellura, M. Renovation Assessment of Building Districts: Case Studies and Implications to the Positive Energy Districts Definition. Energy Build. 2023, 296, 113414. [Google Scholar] [CrossRef]
- Cellura, M.; Fichera, A.; Guarino, F.; Volpe, R. Sustainable Development Goals and Performance Measurement of Positive Energy District: A Methodological Approach. In Proceedings of the Sustainability in Energy and Buildings 2021; Littlewood, J.R., Howlett, R.J., Jain, L.C., Eds.; Springer Nature: Singapore, 2022; pp. 519–527. [Google Scholar]
- Aliu, A. Automation and Control Applications in Developing Regions: An Industry Perspective of Emerging Technologies and Challenges: Surveys of Technology Projects Regarding e-Citizen Services and Smart City Approach. IFAC-Pap. 2019, 52, 568–572. [Google Scholar] [CrossRef]
- Amsellem, A. The Noise of Silent Machines: A Case Study of LinkNYC. Surveill. Soc. 2021, 19, 168–186. [Google Scholar] [CrossRef]
- Gangneux, J.; Joss, S.; Humphry, J.; Hanchard, M.; Chesher, C.; Maalsen, S.; Merrington, P.; Wessels, B. Situated, Yet Silent: Data Relations in Smart Street Furniture. J. Urban Technol. 2022, 29, 19–39. [Google Scholar] [CrossRef]
- Eksioglu, M. User Experience Design of a Prototype Kiosk: A Case for the Stanbul Public Transportation System. Int. J. Hum.-Comput. Interact. 2016, 32, 802–813. [Google Scholar] [CrossRef]
- Gomez-Carmona, O.; Sadaba, J.; Casado-Mansilla, D. Enhancing Street-Level Interactions in Smart Cities through Interactive and Modular Furniture. J. Ambient Intell. Humaniz. Comput. 2019, 13, 5419–5432. [Google Scholar] [CrossRef]
- Grigorescu, S.D.; Argatu, F.C.; Paturca, S.V.; Cepisca, C.; Seritan, G.C.; Adochiei, F.C.; Enache, B. Robotic Platform with Medical Applications in the Smart City Environment. In Proceedings of the 11th International Symposium on Advanced Topics in Electrical Engineering (ATEE), Bucharest, Romania, 28–30 March 2019; IEEE: New York, NY, USA, 2019. [Google Scholar]
- Hosio, S.; Goncalves, J.; Kukka, H. Situated Engagement and Virtual Services in a Smart City. In Proceedings of the 7th International Conference on Service-Oriented Computing and Applications, Matsue, Japan, 17–19 November 2014; pp. 328–331. [Google Scholar]
- Tanny, T.; Al-Hossienie, C. Trust in Government: Factors Affecting Public Trust and Distrust. J. Adm. Stud. 2019, 12, 49–63. [Google Scholar]
- Ramo, F.J.L. The Rise and Fall of Institutional Trust in Spain. In Borders and Margins; Barbara Budrich Publishers: Berlin, Germany, 2018; Volume 4, pp. 93–108. [Google Scholar]
- Marozzi, M. Measuring Trust in European Public Institutions. Soc. Indic. Res. 2015, 123, 879–895. [Google Scholar] [CrossRef]
- CIS (Centro de Investigaciones Sociológicas). Study Number 3383 of October—November 2022. Available online: https://datos.cis.es/pdf/Es3383marMT_A.Pdf (accessed on 9 November 2023).
- Sartori, I.; Napolitano, A.; Voss, K. Net Zero Energy Buildings: A Consistent Definition Framework. Energy Build. 2012, 48, 220–232. [Google Scholar] [CrossRef]
- Salom, J.; Marszal, A.J.; Widén, J.; Candanedo, J.; Lindberg, K.B. Analysis of Load Match and Grid Interaction Indicators in Net Zero Energy Buildings with Simulated and Monitored Data. Appl. Energy 2014, 136, 119–131. [Google Scholar] [CrossRef]
- Nielsen, J. Enhancing the Explanatory Power of Usability Heuristics. In Proceedings of the Human Factors in Computing Systems, Chi ’94 Conference Proceedings—Celebrating Interdependence; Adelson, B., Dumais, S., Olson, J., Eds.; Association for Computing Machinery: New York, NY, USA, 1994; pp. 152–158. [Google Scholar]
- ISO 52000-1:2017; Energy Performance of Buildings Overarching EPB Assessment. ISO: Geneva, Switzerland, 2017. Available online: https://www.iso.org/standard/65601.html (accessed on 28 January 2024).
- Weather Spark. The Weather Year Round Anywhere on Earth. Available online: https://weatherspark.com/ (accessed on 28 January 2024).


| Parameter | Angel Guimera Public School | Museum of La Noguera | Xalet Montiu | Educative Service of La Noguera | Library Margarida de Montferrat |
|---|---|---|---|---|---|
| Area m2 | 1800 | 1496 | 461 | 1093 | 3975 |
| U Exterior fenestration average (W/m2K) | 5.80 | 2.72 | 5.80 | 2.72 | 2.72 |
| Average solar heat gain coefficient (−) | 0.80 | 0.65 | 0.80 | 0.65 | 0.65 |
| U Opaque exterior wall average (W/m2·K) | 1.2 | 0.3 | 1.2 | 1.2 | 1.5 |
| U Opaque exterior floor (W/m2·K) | 3.7 | 3.7 | 3.7 | 0.5 | 3.7 |
| U Opaque exterior roof (W/m2·K) | 5.1 | 1.7 | 2.3 | 0.7 | 0.8 |
| Occupant | 241 | 157 | 10 | 36 | 381 |
| Lights (W/m2) | 9 | 7–20 | 9 | 10 | 10 |
| Electric equipment (W/m2) | 0–14 | 0–3 | 0–10 | 0–7 | 3–5 |
| PV Power [kW] | |
|---|---|
| Xalet Montiu | 8.75 |
| Àngel Guimerà Public School | 26.6 |
| Educative Service of La Noguera | 6.3 |
| Library Margarida de Montferrat | 11.5 |
| Museum of La Noguera | 21 |
| PV installation A | 58 |
| PV installation B | 30.8 |
| Consumption | Xalet Montiu | Àngel Guimerà Public School | Biblioteca Margarida de Montferrat | Museu de la Noguera |
|---|---|---|---|---|
| Electricity and cooling consumption [kWh] | 8202 | 64,596 | 55,114 | 40,940 |
| Gas consumption [kWh] | 50,282 | 367,853 | 175,482 | 64,700 |
| Building | PV Area [m2] | Generation [kWh/y] |
|---|---|---|
| Xalet Montiu | 50 | 11,540 |
| Àngel Guimerà Public School | 170 | 37,760 |
| Servei Educatiu de la Noguera | 74 | 8729 |
| Biblioteca Margarida de Montferrat | 73 | 16,647 |
| Museu de la Noguera | 234 | 29,212 |
| PV installation A | 769 | 79,661 |
| PV installation B | 352 | 40,605 |
| Month | Electricity | Gas | ||
|---|---|---|---|---|
| Renovation | Existing District | Renovation | Existing District | |
| Jan | 33,624 | 15,137 | 0 | 270,208 |
| Feb | 28,501 | 13,531 | 0 | |
| Mar | 20,343 | 11,522 | 0 | 135,898 |
| Apr | 18,422 | 11,723 | 0 | |
| May | 13,371 | 12,565 | 0 | 18,954 |
| Jun | 9628 | 14,036 | 0 | |
| Jul | 14,168 | 20,721 | 0 | 3,918 |
| Aug | 14,333 | 18,583 | 0 | |
| Sep | 11,547 | 15,810 | 0 | 28,539 |
| Oct | 12,855 | 13,729 | 0 | |
| Nov | 18,620 | 14,022 | 0 | 184,459 |
| Dec | 24,119 | 12,987 | 0 | |
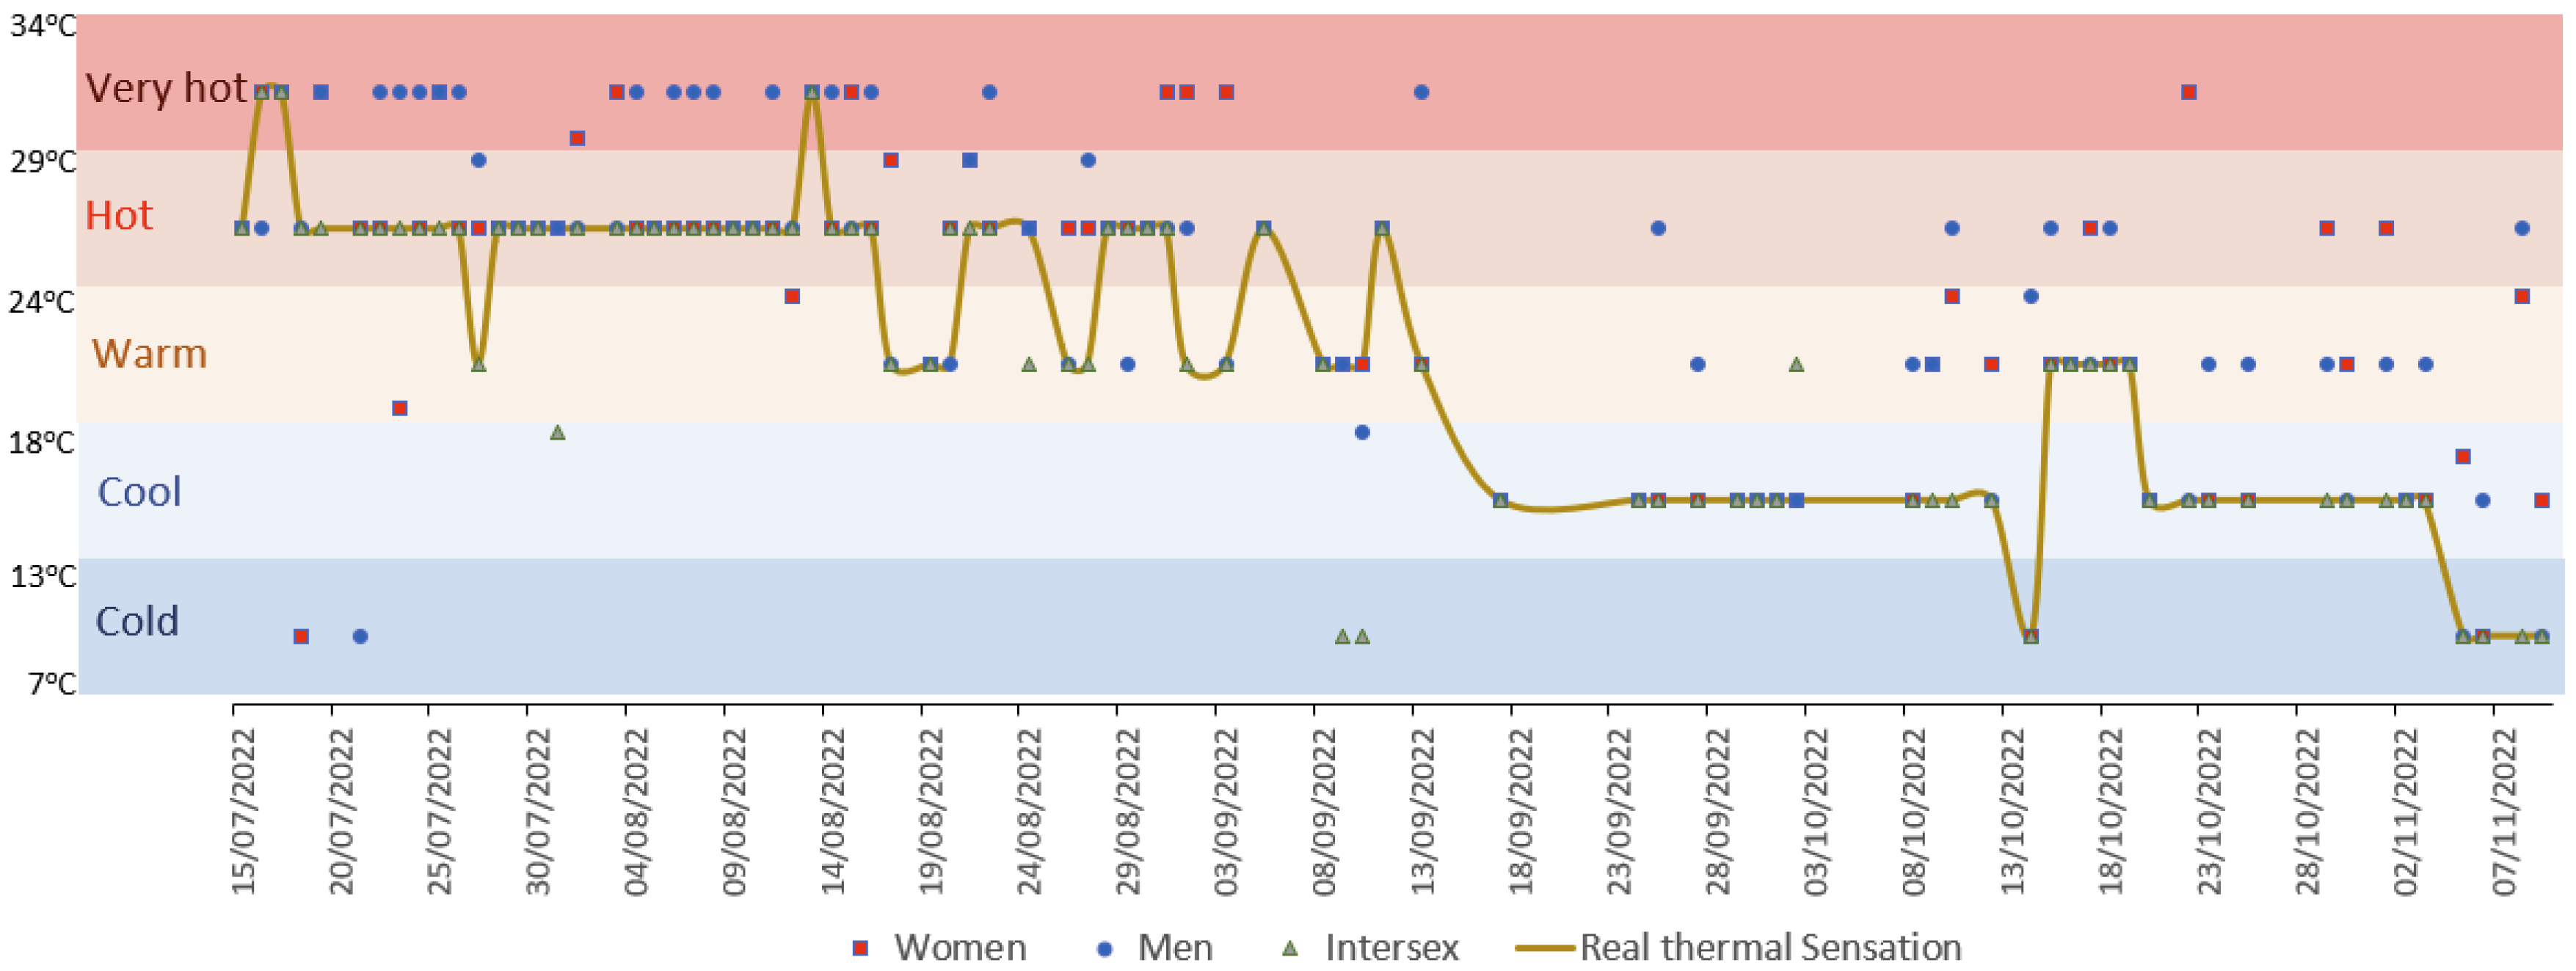
| Deviation | No Deviation | 2 Band | 2 Band | 2 Band |
|---|---|---|---|---|
| Women | 14 | 17 | 8 | 3 |
| Men | 17 | 30 | 5 | 3 |
| Intersex | 1 | 3 | 3 | 0 |
Disclaimer/Publisher’s Note: The statements, opinions and data contained in all publications are solely those of the individual author(s) and contributor(s) and not of MDPI and/or the editor(s). MDPI and/or the editor(s) disclaim responsibility for any injury to people or property resulting from any ideas, methods, instructions or products referred to in the content. |
© 2024 by the authors. Licensee MDPI, Basel, Switzerland. This article is an open access article distributed under the terms and conditions of the Creative Commons Attribution (CC BY) license (https://creativecommons.org/licenses/by/4.0/).
Share and Cite
Cabeza, L.F.; Teixidó, M.; Guarino, F.; Rincione, R.; Díaz, M.; Gil, R.M.; Cellura, M.; Mateu, C. Incorporating Citizen Science to Enhance Public Awareness in Smart Cities: The Case Study of Balaguer. Appl. Sci. 2024, 14, 2544. https://doi.org/10.3390/app14062544
Cabeza LF, Teixidó M, Guarino F, Rincione R, Díaz M, Gil RM, Cellura M, Mateu C. Incorporating Citizen Science to Enhance Public Awareness in Smart Cities: The Case Study of Balaguer. Applied Sciences. 2024; 14(6):2544. https://doi.org/10.3390/app14062544
Chicago/Turabian StyleCabeza, Luisa F., Mercè Teixidó, Francesco Guarino, Roberta Rincione, Manel Díaz, Rosa M. Gil, Maurizio Cellura, and Carles Mateu. 2024. "Incorporating Citizen Science to Enhance Public Awareness in Smart Cities: The Case Study of Balaguer" Applied Sciences 14, no. 6: 2544. https://doi.org/10.3390/app14062544
APA StyleCabeza, L. F., Teixidó, M., Guarino, F., Rincione, R., Díaz, M., Gil, R. M., Cellura, M., & Mateu, C. (2024). Incorporating Citizen Science to Enhance Public Awareness in Smart Cities: The Case Study of Balaguer. Applied Sciences, 14(6), 2544. https://doi.org/10.3390/app14062544