Article

Dynamic Flow and Heat Transfer Characteristics of Uncracked Hydrocarbon Fuel under Super-Critical Pressure in the Cooling Channel of a Regeneratively Cooled Scramjet

Department of Thermal Power and Power Engineering, College of Ocean Engineering and Energy, Guangdong Ocean University, No. 1, Haida Road, Zhanjiang 524088, China
*
Author to whom correspondence should be addressed.
Appl. Sci. 2024, 14(6), 2508; https://doi.org/10.3390/app14062508
Submission received: 29 January 2024 / Revised: 1 March 2024 / Accepted: 2 March 2024 / Published: 16 March 2024
(This article belongs to the Topic Advanced Energy Harvesting Technology)

Abstract

:
Regeneratively cooled scramjets are successfully used as propulsion devices in hypersonic vehicles. During operation, scramjets experience acceleration. This special process causes a dynamic flow process, and heat transfer in the cooling channel commonly occurs, which may cause hazards and control difficulties for scramjets. A dynamic numerical model with a modified heat transfer coefficient calculation method was established to study the transient flow and heat transfer processes in a cooling channel. The dynamic characteristics of the flow and heat transfer under different conditions were calculated and are discussed, including the changes in the inlet fuel mass flow, heat flux, and pressure working conditions. The results indicate that the stable time of the cooling channel outlet fuel temperature is related to the rate of change in the inlet mass flow and heat flux. The stable time of the outlet fuel temperature under decreasing heat flux working conditions was approximately 12.5 s. These results summarize the dynamic flow and heat transfer characteristics, which are significant for designing cooling channels in scramjets.

1. Introduction

Scramjets are highly promising for hypersonic flight and offer benefits such as exceptional speed, stealth, and maneuverability. Scramjets are extensively employed as they provide higher specific thrust than any other air-breathing propulsion system [1]. The availability of scramjets was verified by the success of X-43A and X-51 [2]. Owing to the combination of high-speed, high-intensity combustion, and friction, there is a large heat load in the combustor in scramjets. To prevent potential damage, regenerative active cooling is adopted [3], where fuel is pumped into the cooling channel inside the combustor wall of the scramjet to dissipate heat before entering the combustor. Both liquid hydrogen and liquid hydrocarbon fuels are frequently utilized for the regenerative active cooling of scramjets. Liquid hydrocarbon fuel is often preferred owing to its convenient storage [4]. Furthermore, liquid hydrocarbon fuels can absorb a significant amount of heat through endothermic cracking and pyrolysis, which effectively reduces the engine wall temperature [5]. The structure of the regenerative cooling process is shown in Figure 1 [6]. Additionally, a successful flight test of the X-51 confirmed the viability of regenerative cooling using hydrocarbon fuel as a coolant [7].
Numerous studies have been conducted on the steady flow and heat transfer characteristics of hydrocarbon fuel within a cooling channel, including investigations on the cross-sectional geometry of the cooling channel [8], working pressure [9,10], heating mode [11,12], and convective heat transfer correlation [13]. Owing to different off-design working conditions, sudden changes in the heat flux, inlet fuel mass flow, and working pressure in the cooling channel of the scramjet may occur. However, studies on transient flow and heat transfer in these scenarios are often limited to the instability phenomena within experimental flows. For example, Zhu et al. [14] identified the transition instability phenomenon in flow and heat transfer experiments of n-decane under supercritical pressure. These studies did not specifically analyze the influence of these factors on the transient flow and heat transfer characteristics of n-decane from the perspective of variable conditions. Consequently, a detailed analysis of the underlying mechanisms involved in transient flow and heat transfer processes is required.
The cooling channels serve as a heat exchanger, with them being curved inside the combustor wall, and fuel flows through them as a coolant [15]. Owing to the significance of the convective heat transfer coefficient, extensive research has been conducted in this area. Cheng et al. [16] determined the convective heat transfer coefficient by calculating the average fuel temperature across a cross-section. However, this method does not consider the impact of the thermophysical properties of hydrocarbon fuels near the pseudocritical temperature. Liu et al. [17] focused on the impact of dynamic viscosity on the convective heat transfer coefficient; however, their findings were limited to turbulent flows. Subsequent studies conducted by Dong et al. [18], Zhang et al. [19], and Jiang et al. [20] expanded on the previous work by calculating the convective heat transfer coefficient in segments, considering the ratio of the average temperature across a cross-section within the critical temperature region. Furthermore, the thermophysical properties of hydrocarbon fuels in convective heat transfer calculations were explored. However, when piecewise convective heat transfer correlations are used, there is an inherent discontinuity in the overall heat transfer coefficient derived from the experimental data. Zhang et al. [21] addressed this issue by fitting three separate convective heat transfer correlations based on experimental data for the laminar, transition, and turbulent flow regions. Furthermore, as the fuel temperature increases, the thermal physical properties of the hydrocarbon fuel experience significant changes in the pseudo-critical region, especially for the specific constant-pressure heat capacity and thermal conductivity coefficient, as shown in Figure 2, which is inevitable. As a result, the dynamic characteristics of the flow and heat transfer processes of uncracked hydrocarbon fuels are significant and warrant further study.

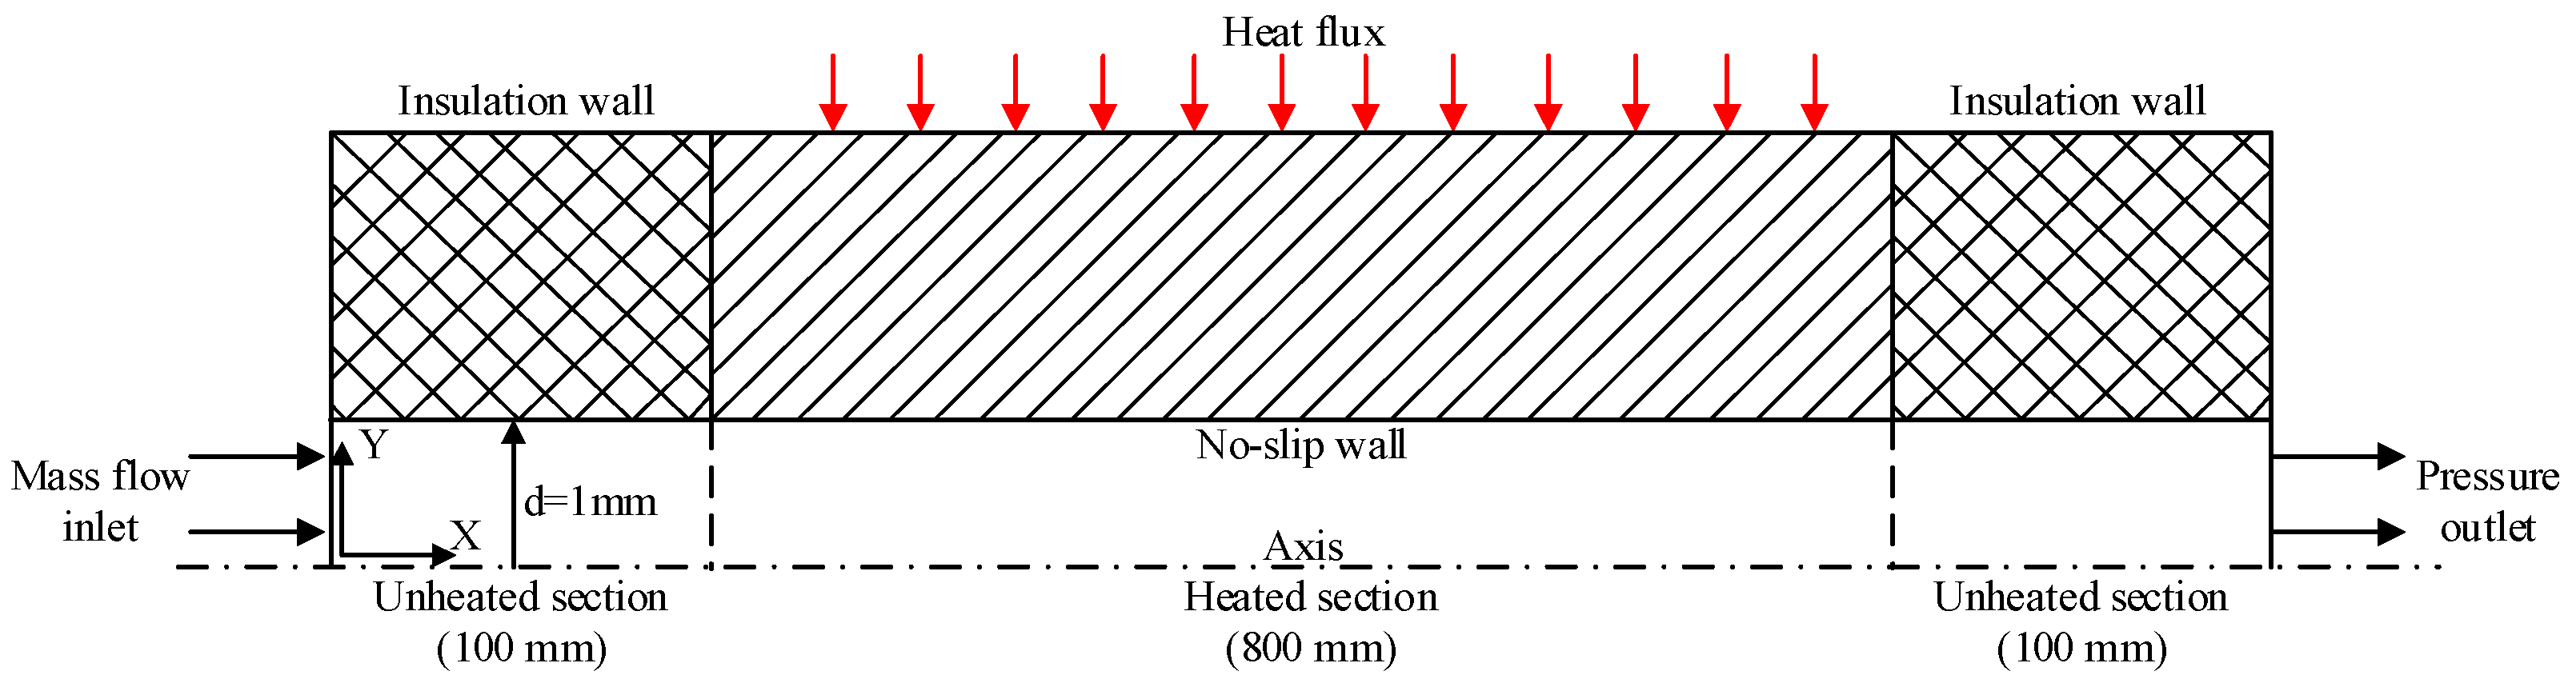
2. Numerical Model and Calculation Scheme

The calculation model employed in this study is a two-dimensional axisymmetric model derived from the real structure shown in Figure 3, as depicted in Figure 4, with respect to geometry. The cooling channel has a circular cross-section with an inner diameter of 1 mm and a length of 1000 mm. Along the cooling channel, two unheated adiabatic sections are used to ensure a fully developed flow and heat transfer of the fuel set at the inlet and outlet with a length of 100 mm. The tubes were subjected to a uniform heat flux. Within the unheated section, a section with a length of 800 mm was developed and heated using different uniform heat fluxes. The fuel was assumed to exhibit no slip at the wall.

2.1. Governing Equation

In the fluid domain, the continuity, momentum, and energy equations are expressed in Equations (1)–(3). The x- and y-axes are set as shown in Figure 3.
ρ t + 𝛻 ρ U = 0
ρ U t + 𝛻 ρ U U = 𝛻 p + 𝛻 τ + S M
ρ e t + 𝛻 ρ U e = 𝛻 λ f 𝛻 T 𝛻 p U + S E
Endothermic pyrolysis occurs when hydrocarbon fuels absorb specific amounts of heat. The mass, substance, and quantity of each species involved in these reactions depend on conservation laws. The component conservation equations are expressed as Equations (4) and (5).
ρ Y i t + 𝛻 ρ Y i u = 𝛻 ρ Y i u d , i + S i
S i = ω i M w , i
The chemical reaction rate ωi of the species i can be obtained by the Arrhenius formula, as shown in Equation (6).
ω i = A i T e x p E i / R u T
To ensure accuracy and computational efficiency, this study adopts the 18 species 24 steps model proposed by Jiao et al. [22] to describe the molecular reaction kinetics of n-decane. The pressure implicit with splitting of operators algorithm was utilized to solve the velocity–pressure coupling in the momentum equation. In the solid domain, the heat transferred to the wall is converted into an internal heat source, and the energy equation is expressed as Equation (7).
ρ w c p w T t = 𝛻 λ w 𝛻 T + ϕ ˙
By establishing a coupling condition at the interface between the solid domain and the fluid domain, the following equations can be derived as follows in Equations (8) and (9).
q w , i n = q f
T w , i n = T f
To accurately capture the turbulent flow near the adjacent wall, the SST kω turbulence model [23] was chosen. This model considers the Reynolds time-averaged equation and Boussinesq’s hypothesis [24]. The expressions for the SST kω turbulence model are written in Equations (10) and (11).
ρ k t + 𝛻 ρ k U = 𝛻 μ l + δ k μ t 𝛻 k + P k β * ρ k ω
ρ ω t + 𝛻 ρ ω U = 𝛻 μ l + δ ω μ t 𝛻 ω + α ω k P k β ρ ω 2 + C D

2.2. Thermo-Physical Property Calculation Model

To accurately capture the variations in the thermophysical properties of n-decane under supercritical pressure, the density was calculated using the Peng–Robinson cubic equation of state (P-R EoS) [25]. The P-R EoS has been extensively applied in research on the heat exchange of hydrocarbon fuel [8,26,27,28] and has proven to be effective and accurate in calculating physical properties. This equation is expressed as Equation (12).
p = ρ R u T M w b ρ a α T ρ 2 M w 2 + u M w b ρ + w b 2 ρ 2
Chung’s method was used to determine the dynamic viscosity and thermal conductivity of n-decane under high pressure [29]. The expressions for dynamic viscosity and thermal conductivity are expressed in Equations (13) and (14).
μ = μ * 36.344 M w T c 0.5 V c 2 / 3
λ = 31.2 μ 0 ψ M w G 2 1 + B 6 y + q B 7 y 2 T r 0.5 G 2
The material for the cooling wall was high-temperature alloy steel GH3128 with a density of 8810 kg/m3. The constant pressure-specific heat capacity and thermal conductivity of GH3128 were calculated using a polynomial piecewise linear interpolation with the data provided in Table 1.
The measurement of the radial distribution of the fuel temperature in the cooling channel is challenging owing to the limitations of the measurement methods. Consequently, the convective heat transfer coefficient is typically used as a proxy for the overall heat transfer coefficient. However, the existing calculation methods for the overall heat transfer coefficient do not adequately consider the flow state of the hydrocarbon fuel and the presence of thermal stratification in the cooling channel.
To address this issue, a modification of the overall heat transfer coefficient was proposed in our previous study [30]. The important equations for calculating the overall heat transfer coefficient are provided in Equations (15)–(21).
k Z j = 1 1 n 1 d o u t 2 λ w l n d n + 1 d n + 1 i 1 d o u t 2 λ e f f , i l n d i + 1 d i + d o u t d i n 1 h a d j , z j
λ e f f = λ l + λ t
λ t = μ t c p P r t
μ t = ρ k ω
h a d j , z j = λ l T w , z j T a d j T Y | Y = d i n / 2
T ¯ w = d i n / 2 d o u t / 2 Y T w , i d Y d i n / 2 d o u t / 2 Y d Y
h z = 0 d i n / 2 ρ i Y h i d Y 0 d i n / 2 ρ i Y d Y
To evaluate the transient flow and dynamic heat transfer characteristics of the hydrocarbon fuel in the cooling channel, numerical studies under different dynamic working conditions were conducted. The three different dynamic conditions were the inlet mass flow, heat flux, and working pressure. The rates of change in the inlet mass flow and heat flux are defined in Equations (22) and (23).
Δ r m = m f i n a l m i n i t i a l m i n i t i a l × 100 %
Δ r q f = q f , f i n a l q f , i n i t i a l q f , i n i t i a l × 100 %
Stable conditions were considered as the initial boundary conditions of the study. The heat flux values corresponding to these stable conditions are listed in Table 2. These values were obtained for a mass flow rate of 1 g/s, two different back pressures of 5 MPa and 3 MPa, and four outlet fuel temperatures of 373.15 K, 473.15 K, 573.15 K, and 673.15 K. The heat flux values listed in Table 2 represent the heat transfer per unit area at the cooling channel boundary. These served as reference values for stable conditions and were used as the initial conditions for the numerical simulations in this study. By setting these initial boundary conditions, this study aims to analyze the transient flow and heat transfer characteristics of hydrocarbon fuel in a cooling channel under different dynamic working conditions, allowing for a comprehensive understanding of the heat transfer process.

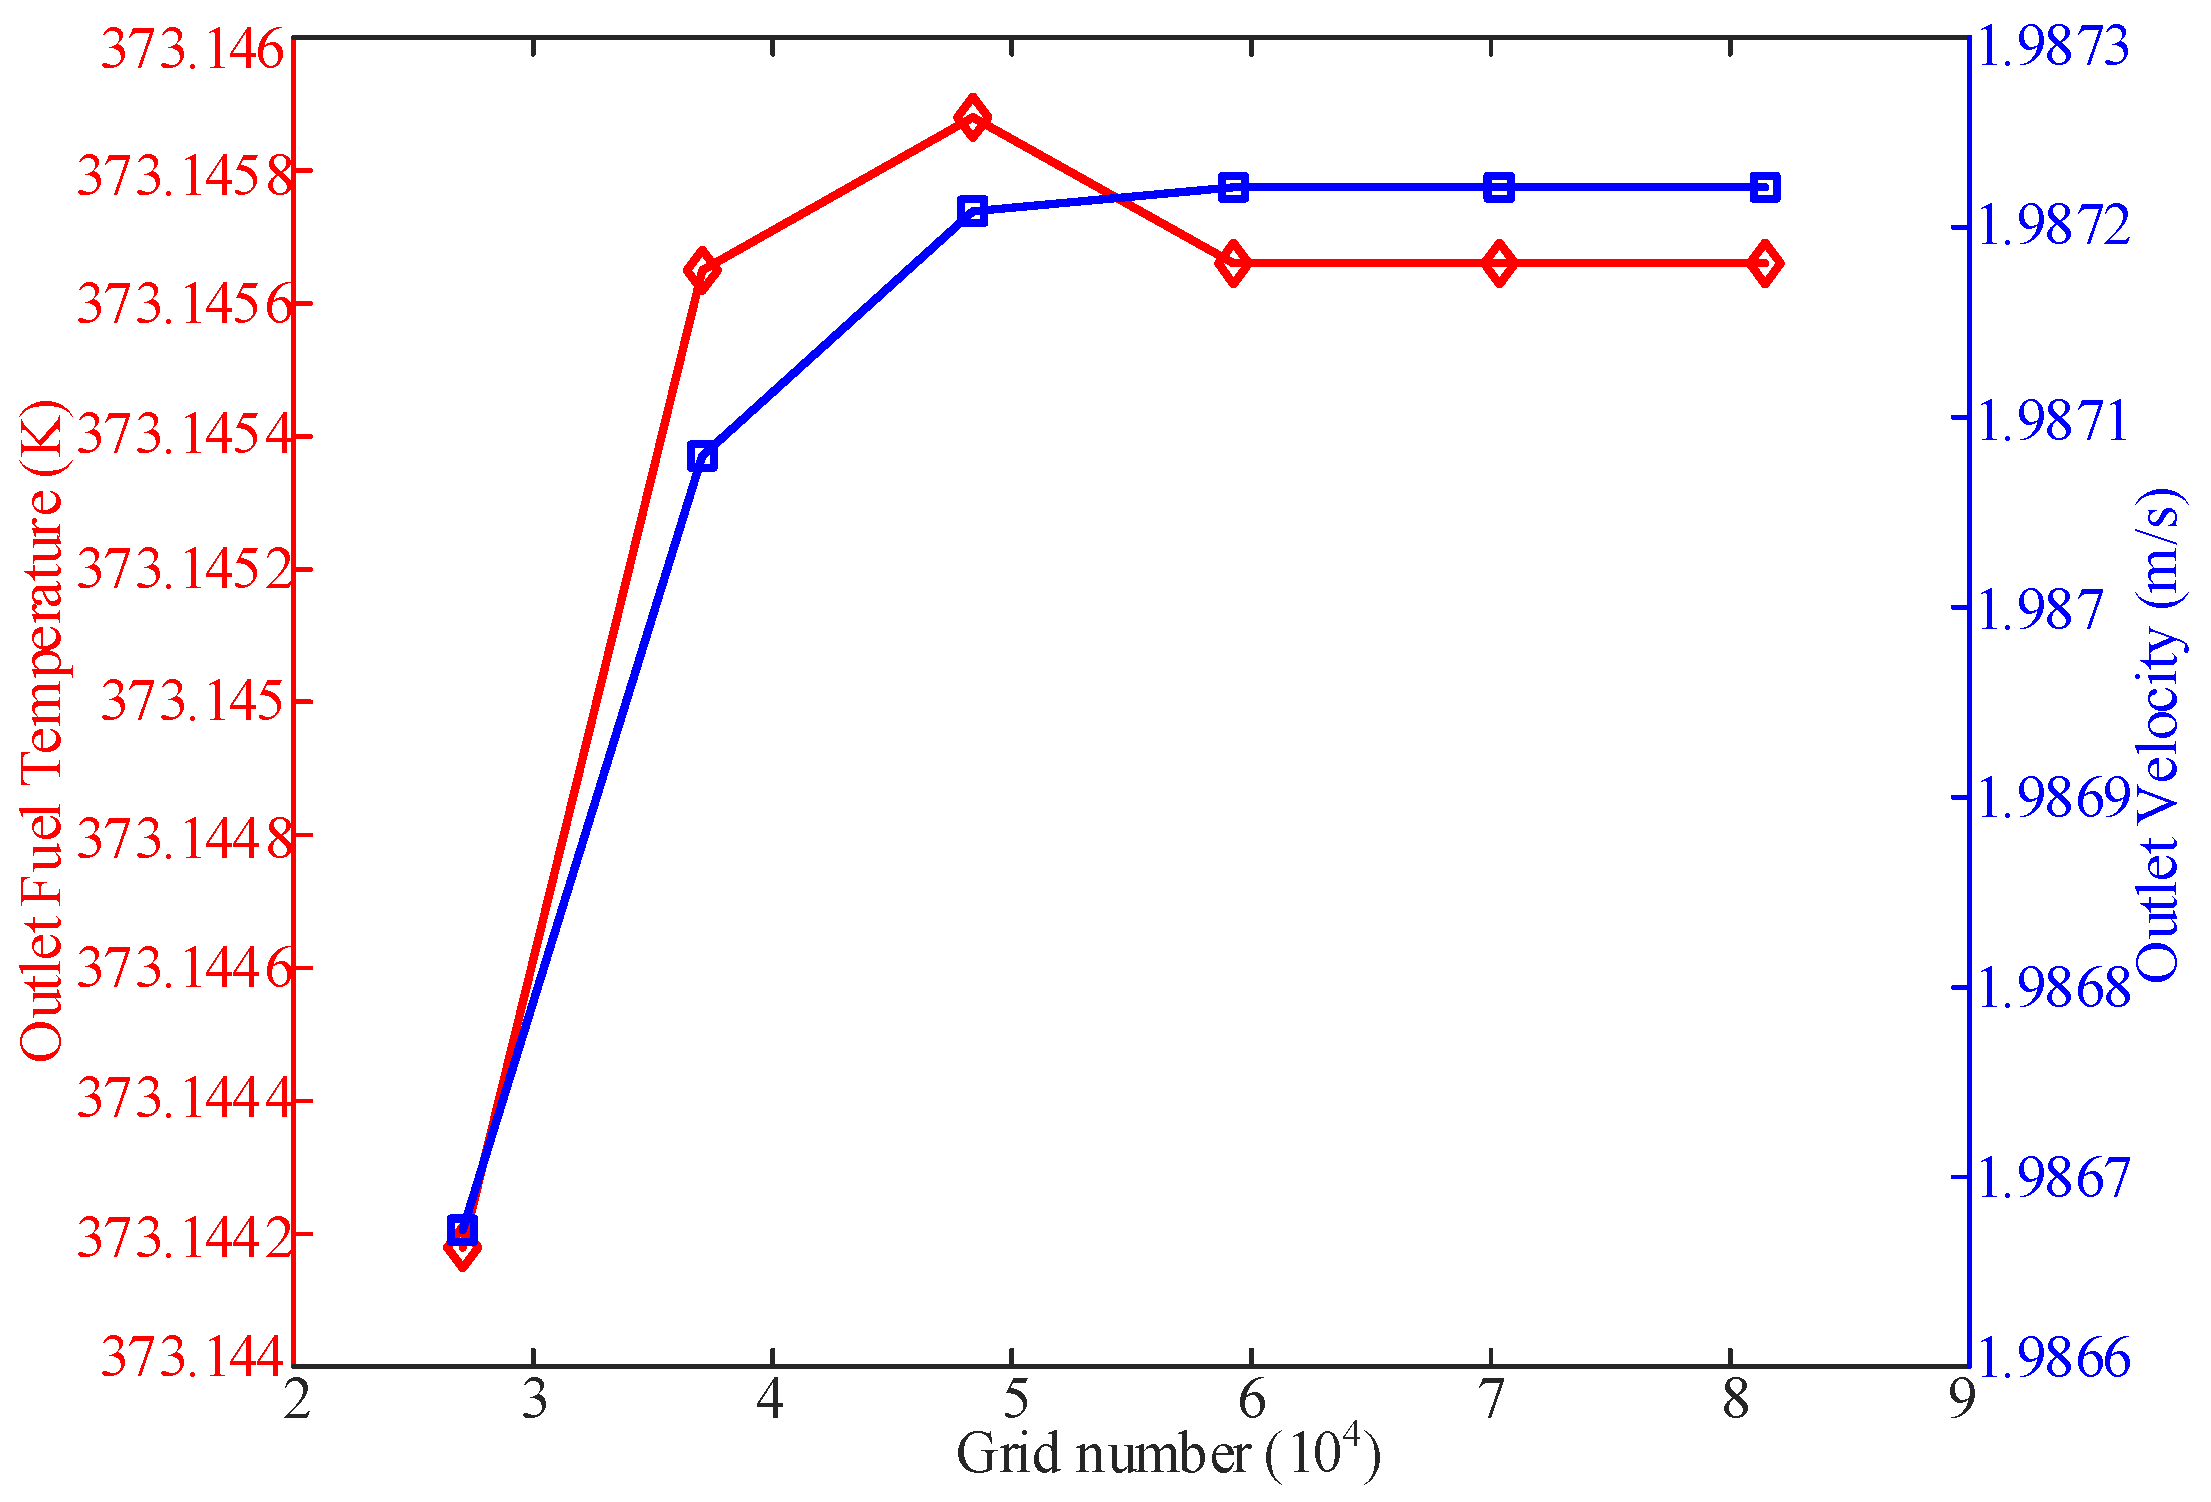
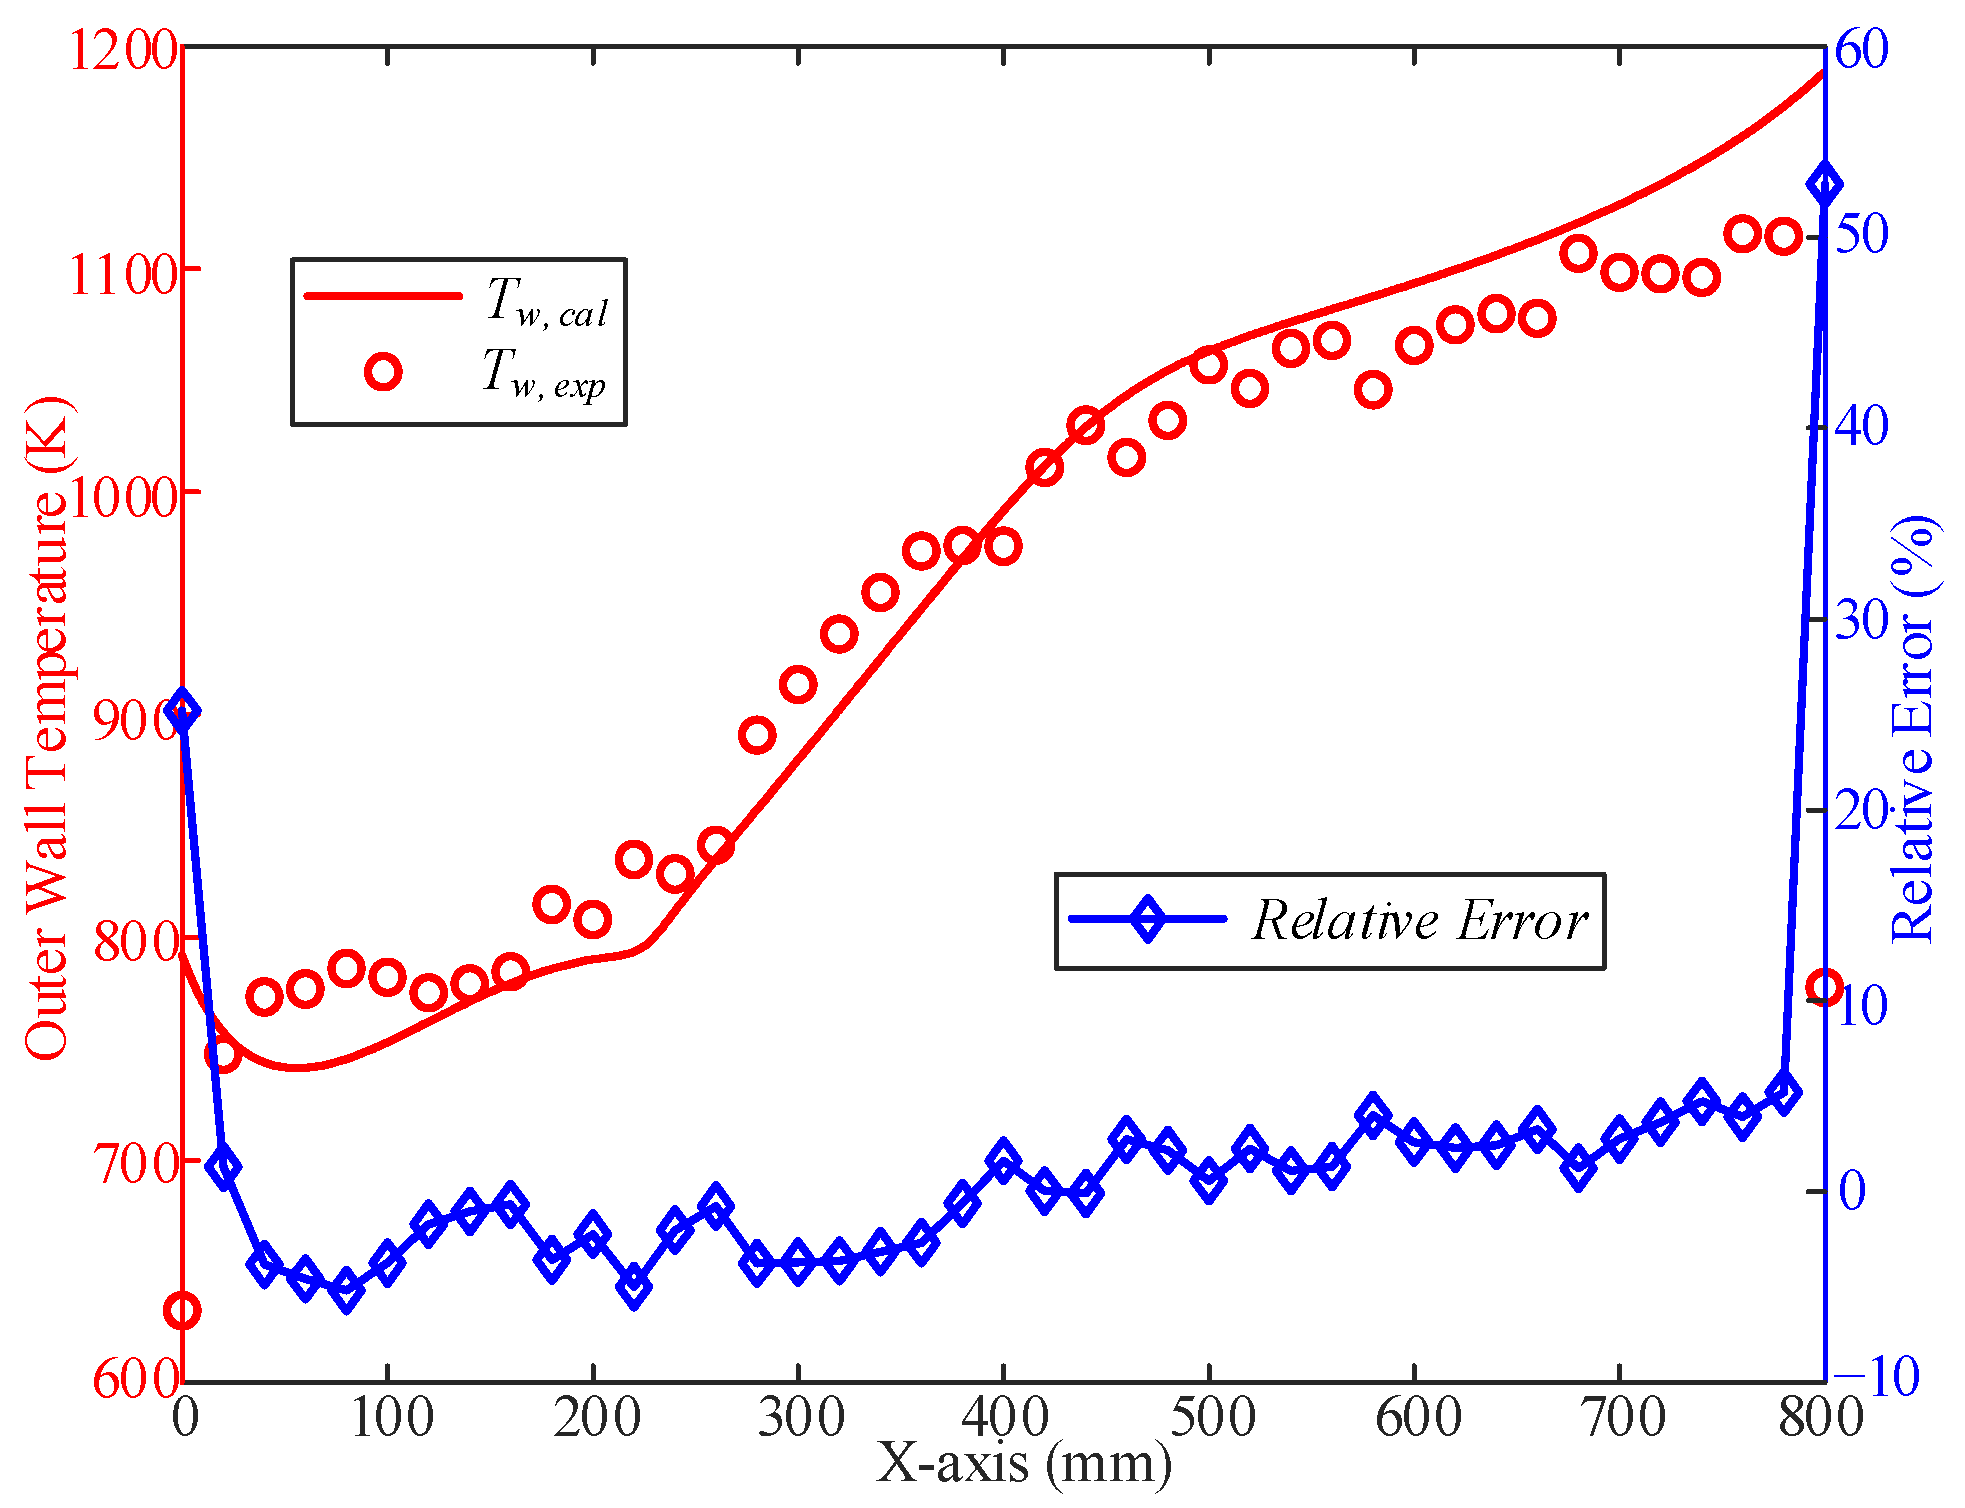
2.3. Model Validation

Grid independence verification is an important step in numerical simulations to ensure that the results are not significantly affected by grid resolution. In this study, a grid independence analysis was conducted before experimental verification. A 10-layer grid was employed in the solid domain, whereas in the fluid domain, the grid near the wall was refined to ensure that the thickness of the first layer was less than 1 and the y+ value of the first three layers was less than 5. The time-step for the calculation was set to 0.001 s.
A grid independence analysis was performed by varying the number of grids and observing their effect on the outlet fuel temperature and cross-sectional average velocity. Figure 5 illustrates the distribution of these parameters for six different grid numbers. The results showed that when the number of grid nodes reached 70,000, there was no significant change in fuel temperature and velocity at the outlet, regardless of a further increase or decrease in the number of grids. This indicated that the results reached a grid-independent state. Based on these findings, it can be concluded that the numerical simulations are sufficiently accurate and reliable, and that the chosen grid size of 70,000 nodes is appropriate for subsequent analysis and experimental verification.
To validate the accuracy of the flow and heat transfer calculation model, a common approach is to compare the calculated outer wall temperature with corresponding experimental measurements. The relative deviation between the calculated value (Tw,cal) and the experimental value (Tw,exp) can be calculated using Equation (24).
δ w = T w , c a l T w , e x p T w , e x p × 100 %
This equation measures the percentage difference between the calculated and experimental values and provides an indication of the agreement between the two. A lower relative deviation indicates a closer match between the calculated and experimental results, indicating better accuracy of the calculation model.
An electric heating tube was employed on the experimental bench to simulate the heat transfer conditions in the combustion chamber of the cooling channel, as shown in Figure 6 and Figure 7. The cooling channel is characterized by a cylindrical shape with specific dimensions: an inner diameter of 1 mm, an outer diameter of 3 mm, and a length of 800 mm. These parameters were carefully controlled throughout the experiments. The inlet mass flow was set to 0.487 g/s to ensure a consistent n-decane flow rate. The wall heat flux, which represents the amount of heat transferred to the cooling channel wall per unit area, was maintained at 715,000 W/m2. In addition, the tube back pressure was kept constant at 3 MPa, providing a consistent pressure environment for the experiment. The accuracy of experimental equipment plays a crucial role in obtaining reliable data. Table 3, along with the setup shown in Figure 5, provides information on the accuracy of the various instruments and devices used during the experiment, ensuring precise measurements and reliable results.
Measurement errors play a significant role in data processing and analysis. These errors can arise from both direct and indirect measurements, with different factors contributing to their overall magnitudes. The measurement error is expressed in Equation (25).
σ = i = 1 n a i σ i 2
For direct measurements, the errors are primarily influenced by the accuracy of the sensor and the data acquisition system. However, indirect measurements, such as heat flux calculations, involve additional sources of error, including sensor accuracy, data acquisition system accuracy, and the calculation method itself. To quantify the measurement errors, Table 4 summarizes the error expressions associated with the different types of measurements, which are adopted from Equation (25). The table presents the specific error expressions for each measurement type, considering the relevant factors that contribute to the overall measurement uncertainty. These error expressions enable a comprehensive understanding of measurement errors and their potential impact on the experimental results.
Based on the analysis and comparison of the calculated and experimental values, the flow and heat transfer calculation models used in this study were validated. The calculated results accurately predicted the changing trend of the outer wall temperature, and there was a good fit between the calculated and experimental values, with an overall relative error of less than 5% (Figure 8). It is worth noting that a relatively large error is observed at the inlet and outlet of the cooling channel, which is located at X-axis < 50 and X-axis > 750 mm. This discrepancy may be attributed to the presence of heating electrodes that act as fins, resulting in greater heat dissipation from the outer wall. Moreover, because the hydrocarbon fuel is heated to the endothermic cracking temperature region, there is a larger error in the thermophysical properties caused by pyrolysis, which results in a larger relative error. Despite this localized error, the overall performances of the flow and heat transfer calculation models were considered satisfactory.

3. Results and Discussion

3.1. Influence of Inlet Fuel Mass Flow

The dynamic characteristics of the fuel temperature at the outlet of the heating section were studied with respect to changes in the inlet mass flow. In this part, the benchmark case is under an outlet pressure of 5 MPa, a mass flow rate of 1 g/s, a Tfoi of 673.15 K, and inlet mass flow changes in the value of ±10%, ±20%, ±50%, and +100%. As shown in Figure 9a, the cross-sectional average fuel and wall temperatures at the outlet of the heating section gradually increased with a decrease in the inlet mass flow in the initial stage of the response and then approached a stable value. As the inlet mass flow decreased, the stable fuel and wall temperatures gradually increased. In addition, the stable fuel temperature gradually decreased with an increase in the inlet mass flow (Figure 9b).
The stable fuel temperatures and times are shown in Figure 10. With a decrease in the inlet mass flow, the higher the stable fuel temperature, the longer the stable time. Similarly, with an increase in the inlet mass flow, the stable fuel temperature was lower and the stable time was shorter. As shown in Figure 10c, with the same range of inlet mass flow variation, the outlet fuel temperature of the initial working condition was higher, and the stable time was shorter. As shown in Figure 10c, the inlet mass flow and steady velocity decreased when the Tfoi was 373.15 K and 473.15 K. The inlet mass flow decreased and the steady velocity increased with the Tfoi of 573.15 K and 673.15 K. A decrease in the inlet mass flow can lead to a decrease in the inlet velocity at a constant inlet temperature. Furthermore, according to the existing steady flow and heat transfer characteristics, the thermal acceleration affects the forced convective heat transfer of n-decane. With two Tfoi values of 573.15 K and 673.15 K, as the inlet mass flow decreases, the fuel passes through the pseudo-critical temperature zone. Near the pseudocritical temperature, the thermo-physical properties of n-decane change dramatically. As a result, the increase in velocity caused by the decrease in n-decane density was much larger than that caused by the decrease in inlet mass flow.
As shown in Figure 10a, with Δrm of −10% and −20%, the overall heat transfer coefficient decreases first and then increases with the decrease in inlet mass flow at the initial stage of response. With Δrm of −50%, the overall heat transfer coefficient decreases first, then increases, and then decreases with the decrease in the inlet mass flow at the initial stage of the response and then approaches the stable value. As the inlet mass flow decreased, the stable value of the overall heat transfer coefficient gradually decreased. As shown in Figure 10b, the overall heat transfer coefficient first increases and then decreases at the beginning of the response. In addition, this trend became more evident with an increase in the inlet mass flow. With an increase in the inlet mass flow, the stable value of the overall heat transfer coefficient increased gradually.
In this study, a multivariate analysis was conducted to analyze the main physical quantities that affect the overall heat transfer coefficient. The overall heat transfer coefficient was primarily influenced by the surface convective heat transfer coefficient (Figure 11). The variation trend of the surface convective heat transfer coefficient can be explained by considering the variation trends of the adjacent wall temperature difference and the derivative of the adjacent fuel temperature.
As shown in Figure 12a, the difference between the inner wall temperature and the adjacent wall fuel temperature first decreased and then increased at the beginning of the response and then approached a stable value. In contrast, with the increase in the inlet mass flow, the temperature difference first increased and then decreased, and the stable value was smaller (Figure 12b).
Combined with Figure 11a and Figure 12a, at Δrm −10% and −20% working conditions, the surface convective heat transfer coefficient shows a trend of decrease first and then increase up to the initial stage. This trend is attributed to a decrease in the derivative of the adjacent wall fuel temperature, which is larger than the decrease in the adjacent wall temperature difference. However, with Δrm of −50%, the surface convective heat transfer coefficient shows a downward trend in the 2~6 s time span. This was attributed to the increase in the adjacent wall temperature difference, which was larger than the decrease in the partial derivative of the adjacent wall fuel temperature. The partial derivatives of the adjacent wall fuel temperatures are shown in blue in Figure 10a,b.
As shown in Figure 11b and Figure 12b, the surface convective heat transfer coefficient first increased and then decreased at the beginning of the response. This trend was attributed to the increase in the partial derivative of the adjacent wall fuel temperature, which was greater than the increase in the adjacent wall temperature difference. With two Δrm of +50% and +100%, the surface convective heat transfer coefficient shows a trend of decrease with the decrease in the partial derivative of the adjacent wall fuel temperature during 1~4 s. This effect was greater than the increase caused by the decrease in the adjacent wall temperature difference.

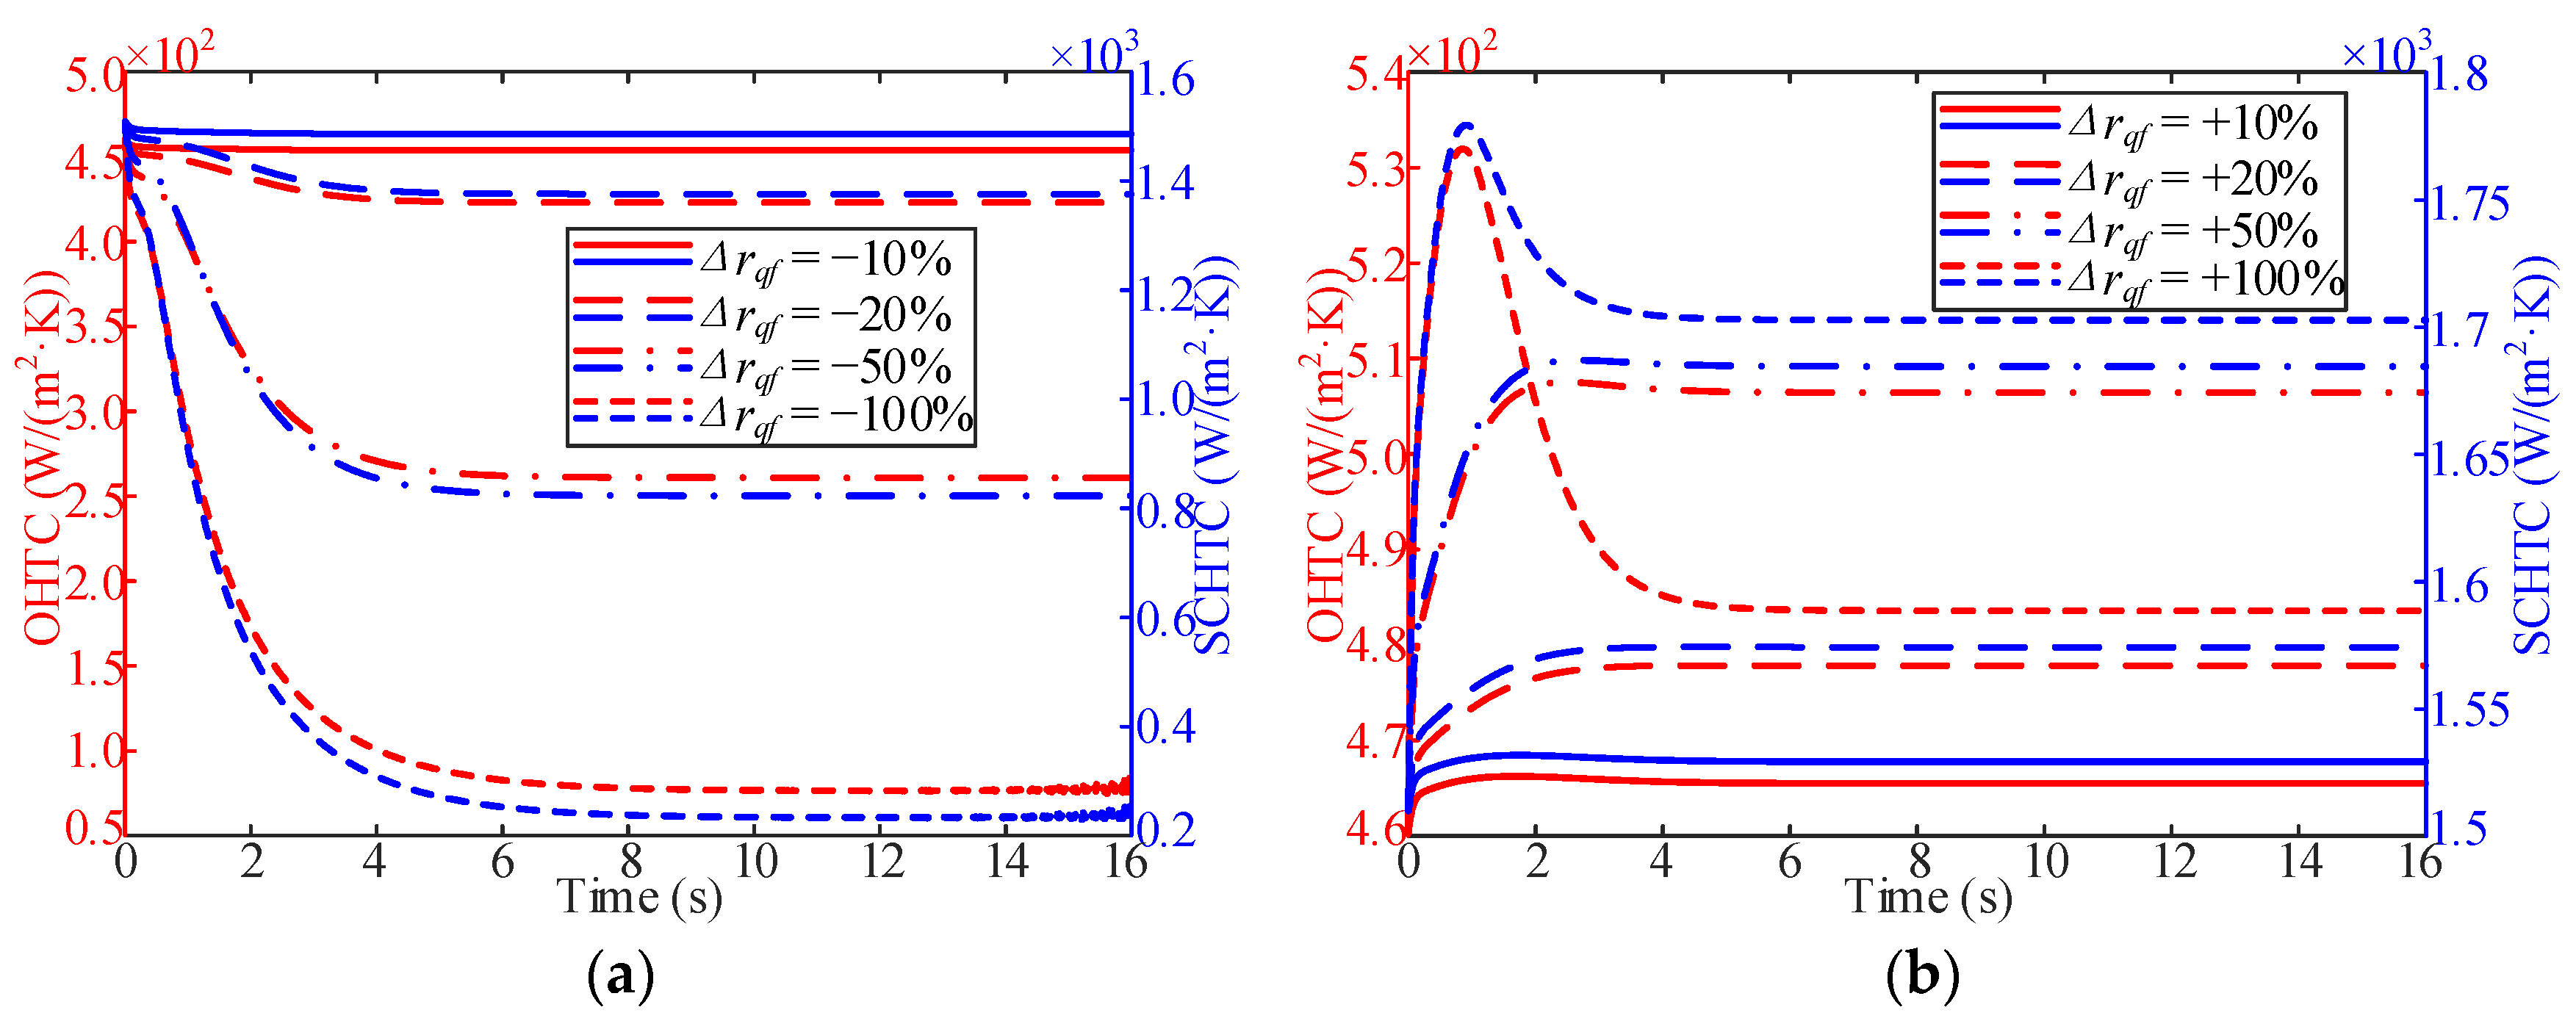
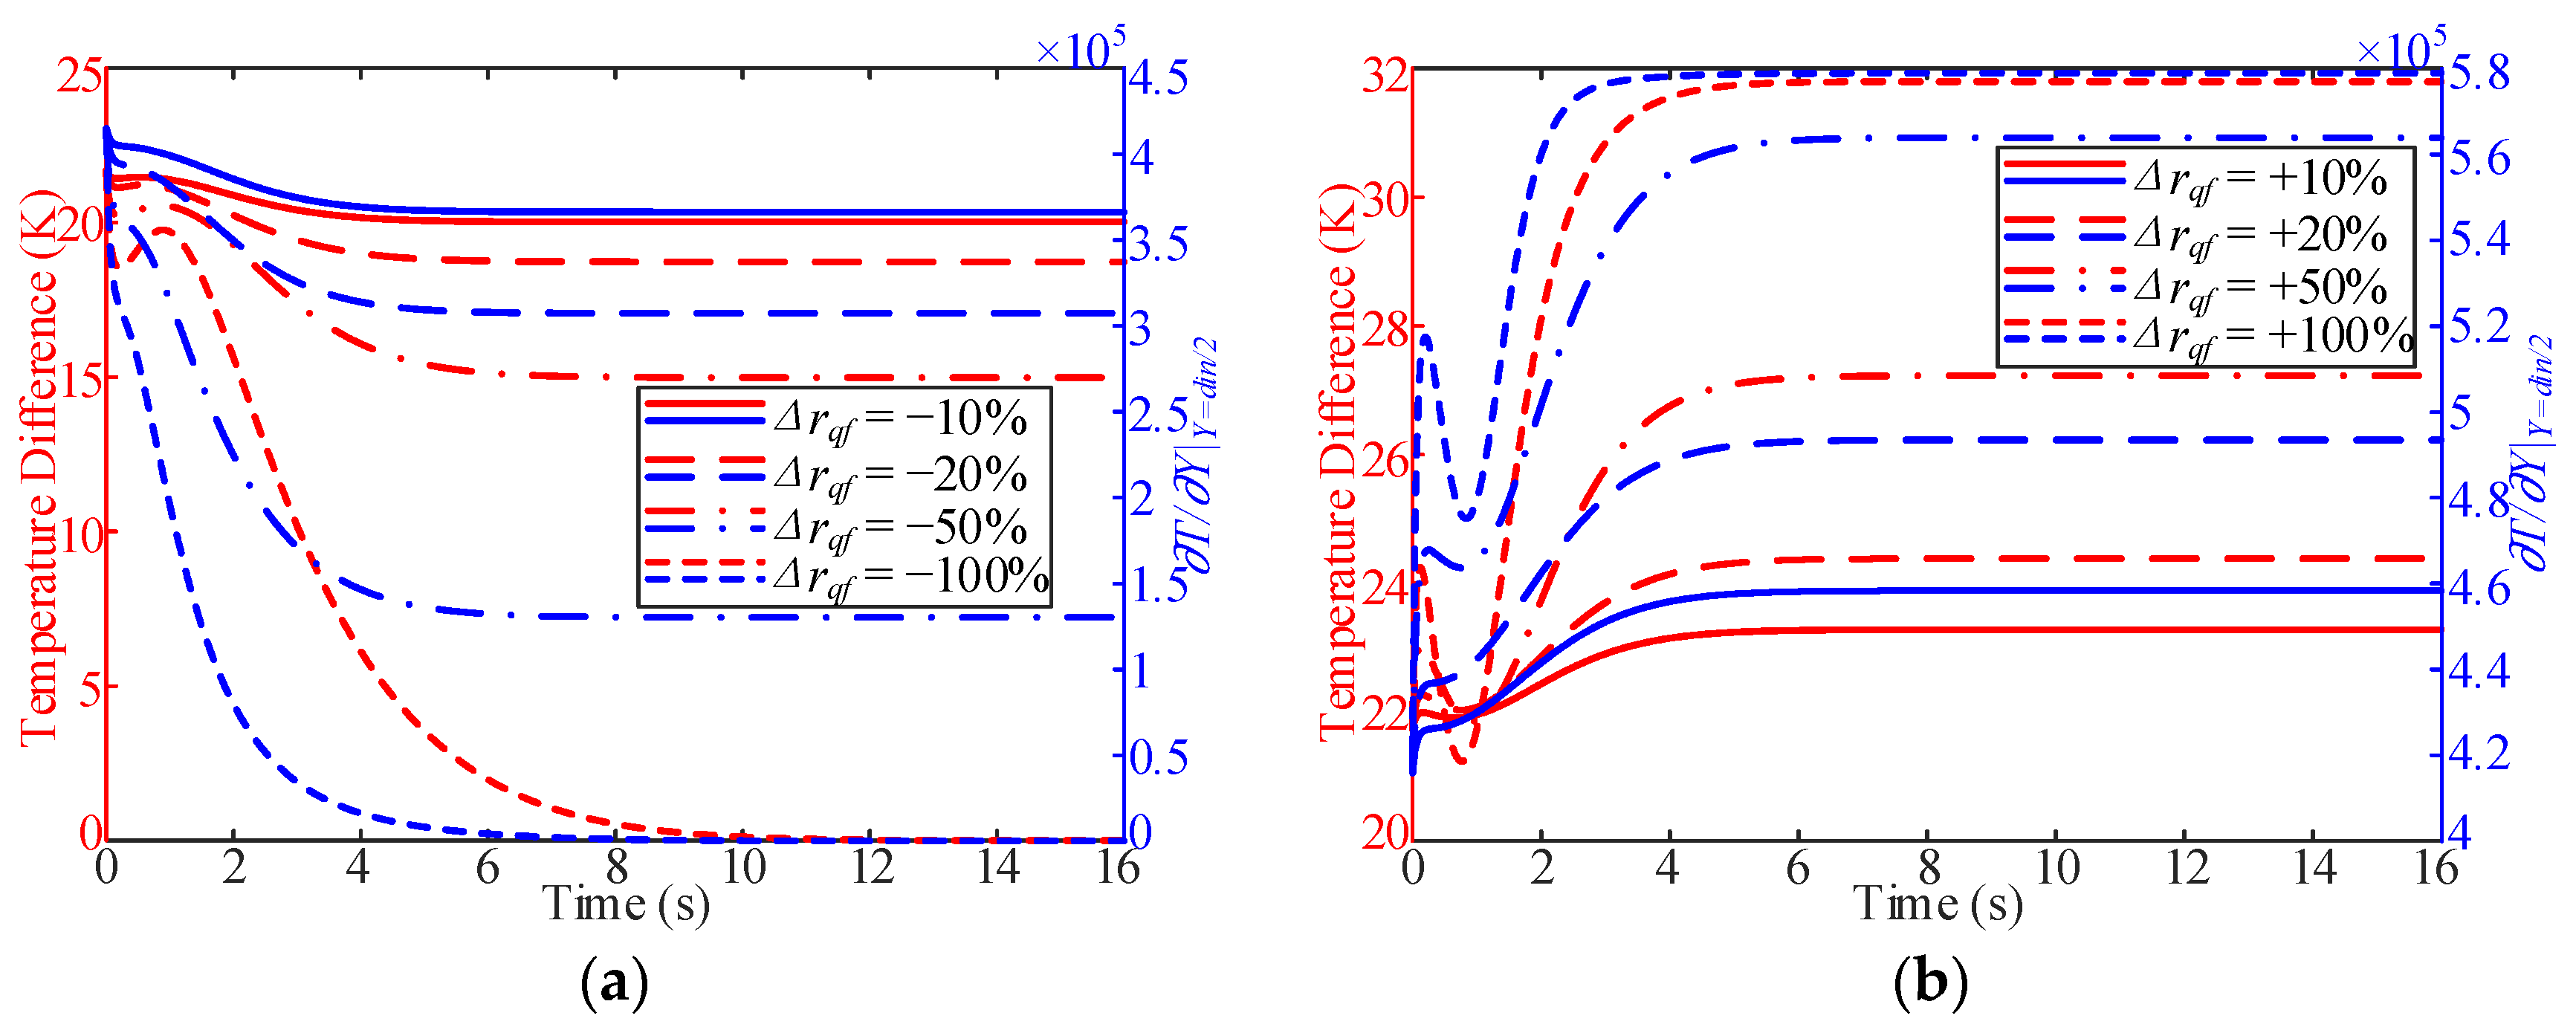
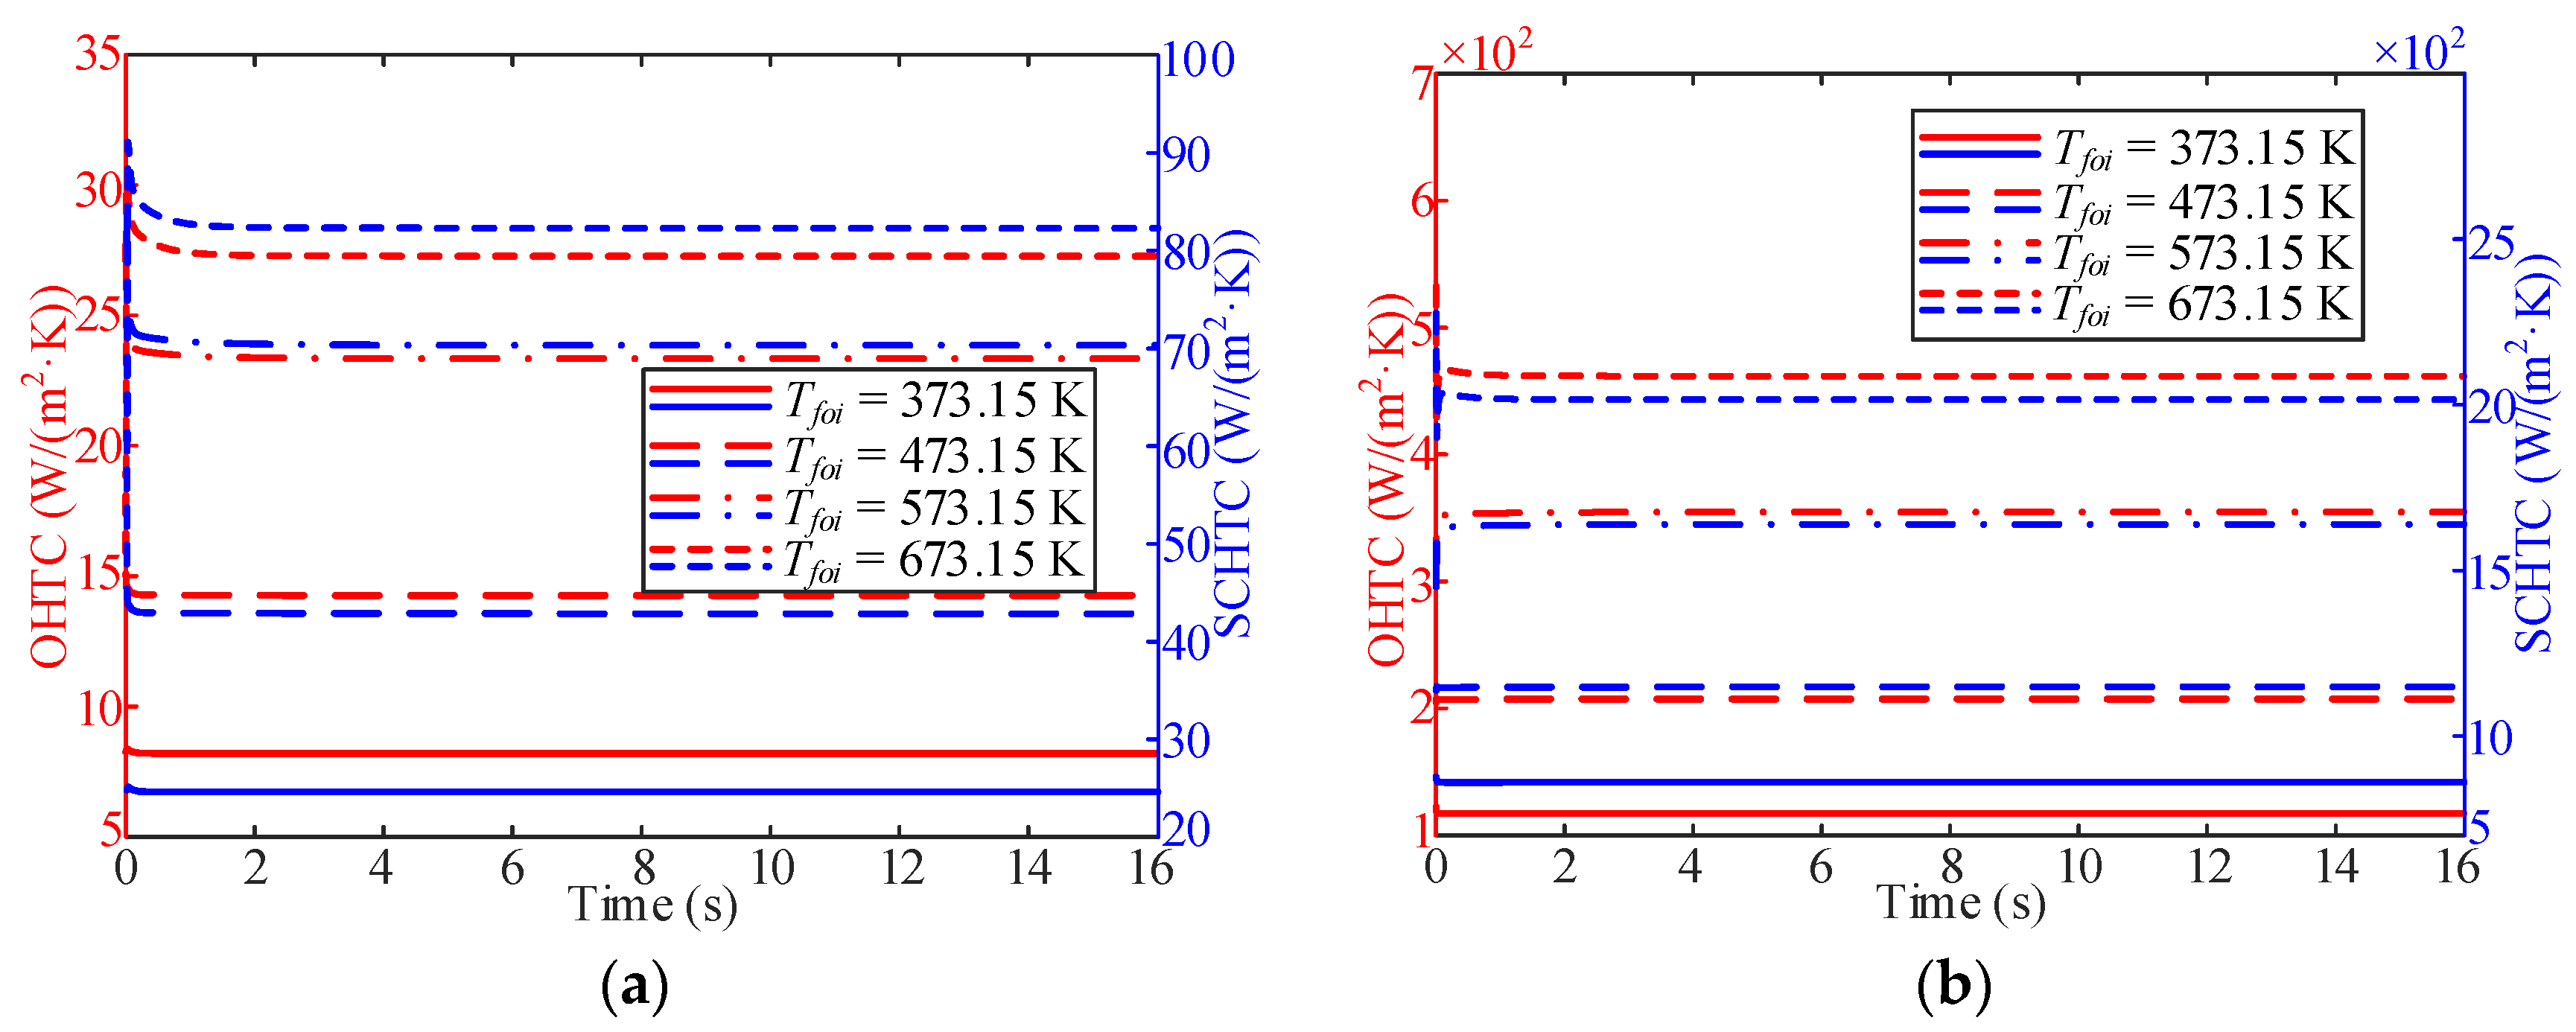
3.2. Influence of Heat Flux

The dynamic characteristics of the fuel at the outlet of the heating section with a change in the heat flux were studied. In this part, the benchmark case is under an outlet pressure of 5 MPa, a mass flow rate of 1 g/s, a Tfoi is 673.15 K, and heat flux changes in the value of ±10%, ±20%, ±50%, and ±100%. As shown in Figure 13a, the cross-sectional average fuel and wall temperatures at the outlet of the heating section gradually decreased with a decrease in heat flux in the initial stage of the response and then approached a stable value. With a decrease in heat flux, the stable fuel temperature and wall temperature gradually decreased. In addition, with an increase in the inlet mass flow, the stable fuel temperature gradually increased (Figure 13b).
The stable fuel temperatures and times are shown in Figure 14. With a decrease in heat flux, the stable time was longer when the fuel temperature was lower. Similarly, with an increase in the inlet mass flow, the higher the stable fuel temperature, the shorter the stable time. As shown in Figure 14, with the same Δrqf, the higher the Tfoi, the shorter the stable time. In addition, with a Δrqf of −100%, when the tube is heated no more, the stable time for the fuel temperature to decrease to room temperature in the four cases is almost the same, which is about 12.5 s.
As shown in Figure 15a, the overall heat transfer coefficient gradually decreases with the decrease in heat flux at the initial stage of response. With the decrease in heat flux, the stable value of the overall heat transfer coefficient decreases gradually. As shown in Figure 15b, with a Δrqf of +100%, the change in the overall heat transfer coefficient is no longer a first-order response but increases first and then decreases with the increase in heat flux at the beginning of the response. In addition, with the increase in heat flux, the stable value of the overall heat transfer coefficient gradually increases. However, with a Δrqf of +100%, the overall heat transfer coefficient is smaller than the one with a Δrqf of +50%.
As shown in Figure 16a, with the decrease in the heat flux, the temperature difference exhibits a decreasing trend. In contrast, when the heat flux increased, the temperature difference was the opposite, and the stable value increased (Figure 16b).
Combined with Figure 15a and Figure 16a, the surface convective heat transfer coefficient exhibited a decreasing trend in the initial response. This trend was attributed to the decrease in the partial derivative of the adjacent wall fuel temperature, which was greater than the decrease in the adjacent wall temperature difference. Combined with Figure 15b and Figure 17b, the surface convective heat transfer coefficient shows an increasing trend in the initial response. This was owing to the increase in the partial derivative of the adjacent wall fuel temperature, which was larger than the increase in the adjacent wall temperature difference. However, with a Δrqf of +50%, the surface convective heat transfer coefficient shows a trend of decrease in the first 1~4 s time span. This was caused by an increase in the adjacent wall temperature difference, which was larger than the increase in the partial derivative of the adjacent wall fuel temperature.

3.3. Influence of Working Pressure

In this part, the benchmark case is under a mass flow rate of 1 g/s, the Tfoi is at 373.15 K, 473.15 K, 573.15 K, and 673.15 K, and the working pressure is reduced from 5 MPa to 3 MPa and increased from 3 MPa to 5 MPa. As shown in Figure 17, the fuel temperature was more sensitive than the wall temperature under varying working pressure conditions. With a decrease in the working pressure, the fuel temperature experienced a decrease–increase–decrease process, whereas the wall temperature showed a decreasing trend. The fuel and wall temperatures under the increasing working pressure condition are in contrast to the decreasing working pressure condition. In addition, with a decrease in the working pressure, the stable temperature increased compared to the initial time. The stable temperature increased by nearly 12 K compared with the initial time when the Tfoi was approximately 673.15 K.
As shown in Figure 18, the trend of the overall heat transfer coefficient changed on a small scale and fluctuated only in the initial stage of the response. With a decrease in pressure from 5 MPa to 3 MPa, the overall heat transfer coefficient increased with Tfoi. The overall heat transfer coefficient shows a decreasing trend when the Tfoi is 373.15 K, 473.15 K, and 573.15 K. Furthermore, when the increase in Tfoi is higher, the decrease in the heat transfer coefficient is larger. The overall heat transfer coefficient shows a sharply increasing trend and then sharply decreased and approached a stable value when the Tfoi was approximately 673.15 K. When the pressure was increased from 3 to 5 MPa, the stable value of the overall heat transfer coefficient increased. However, the increase in pressure has little effect on the overall heat transfer coefficient at a Tfoi of 373.15 K and 473.15 K. The overall heat transfer coefficient shows an upward trend at the beginning of the response and then approaches a stable value at Tfoi = 573.15 K. At Tfoi = 673.15 K, the overall heat transfer coefficient first decreased sharply, then increased sharply, and then decreased slowly.
The difference between the inner wall temperature and the fuel temperature of the adjacent wall is shown in Figure 19. When the fuel pressure was 3 MPa, the temperature difference increased with the increase in Tfoi. However, the temperature difference did not change significantly with a decrease in pressure during the entire response time. In addition, with a Tfoi of 473.15 K, the partial derivative of the adjacent wall fuel temperature shows a slow downward trend; with a Tfoi of 573.15 K, the trend is more apparent. At Tfoi = 673.15 K, the partial derivative of the adjacent wall fuel temperature first increased sharply and then decreased slowly. At a pressure of 5 MPa, the temperature difference increased. This trend was more evident with an increase in Tfoi. The partial derivative of the adjacent wall fuel temperature does not change significantly with an increase in pressure; however, with an increase in Tfoi, the partial derivative of the adjacent-wall fuel temperature shows an increasing trend.
With decreasing pressure, the change in the surface convective heat transfer coefficient was caused by the partial derivative of the near-wall fuel temperature, which can be inferred from Figure 18 and Figure 19. When the pressure increased, the Tfoi was approximately 373.15 K, and the surface convective heat transfer coefficient increased with the decreasing temperature difference. However, with an increase in Tfoi, the surface convective heat transfer coefficient shows an increasing trend in the initial response. This trend was attributed to the increase in the partial derivative of the adjacent wall fuel temperature, which was greater than the increase in the adjacent wall temperature difference.

4. Conclusions

To evaluate the transient flow and heat transfer characteristics of hydrocarbon fuel in the cooling channel, a modified overall heat transfer coefficient was used to characterize the dynamic process, and a two-dimensional calculation model was established. Subsequently, the transient flow and heat transfer characteristics of hydrocarbon fuels represented by n-decane were studied from the perspectives of variable inlet mass flow, heat flux, and working pressure. The conclusions are as follows.
(1)
Three dynamic working conditions for the cooling channel were proposed, considering the real working process of a scramjet. The modified overall heat transfer coefficient was adopted to characterize the dynamic flow and heat transfer process as precisely as possible, which helps in analyzing the heat transfer enhancement under dynamic working conditions.
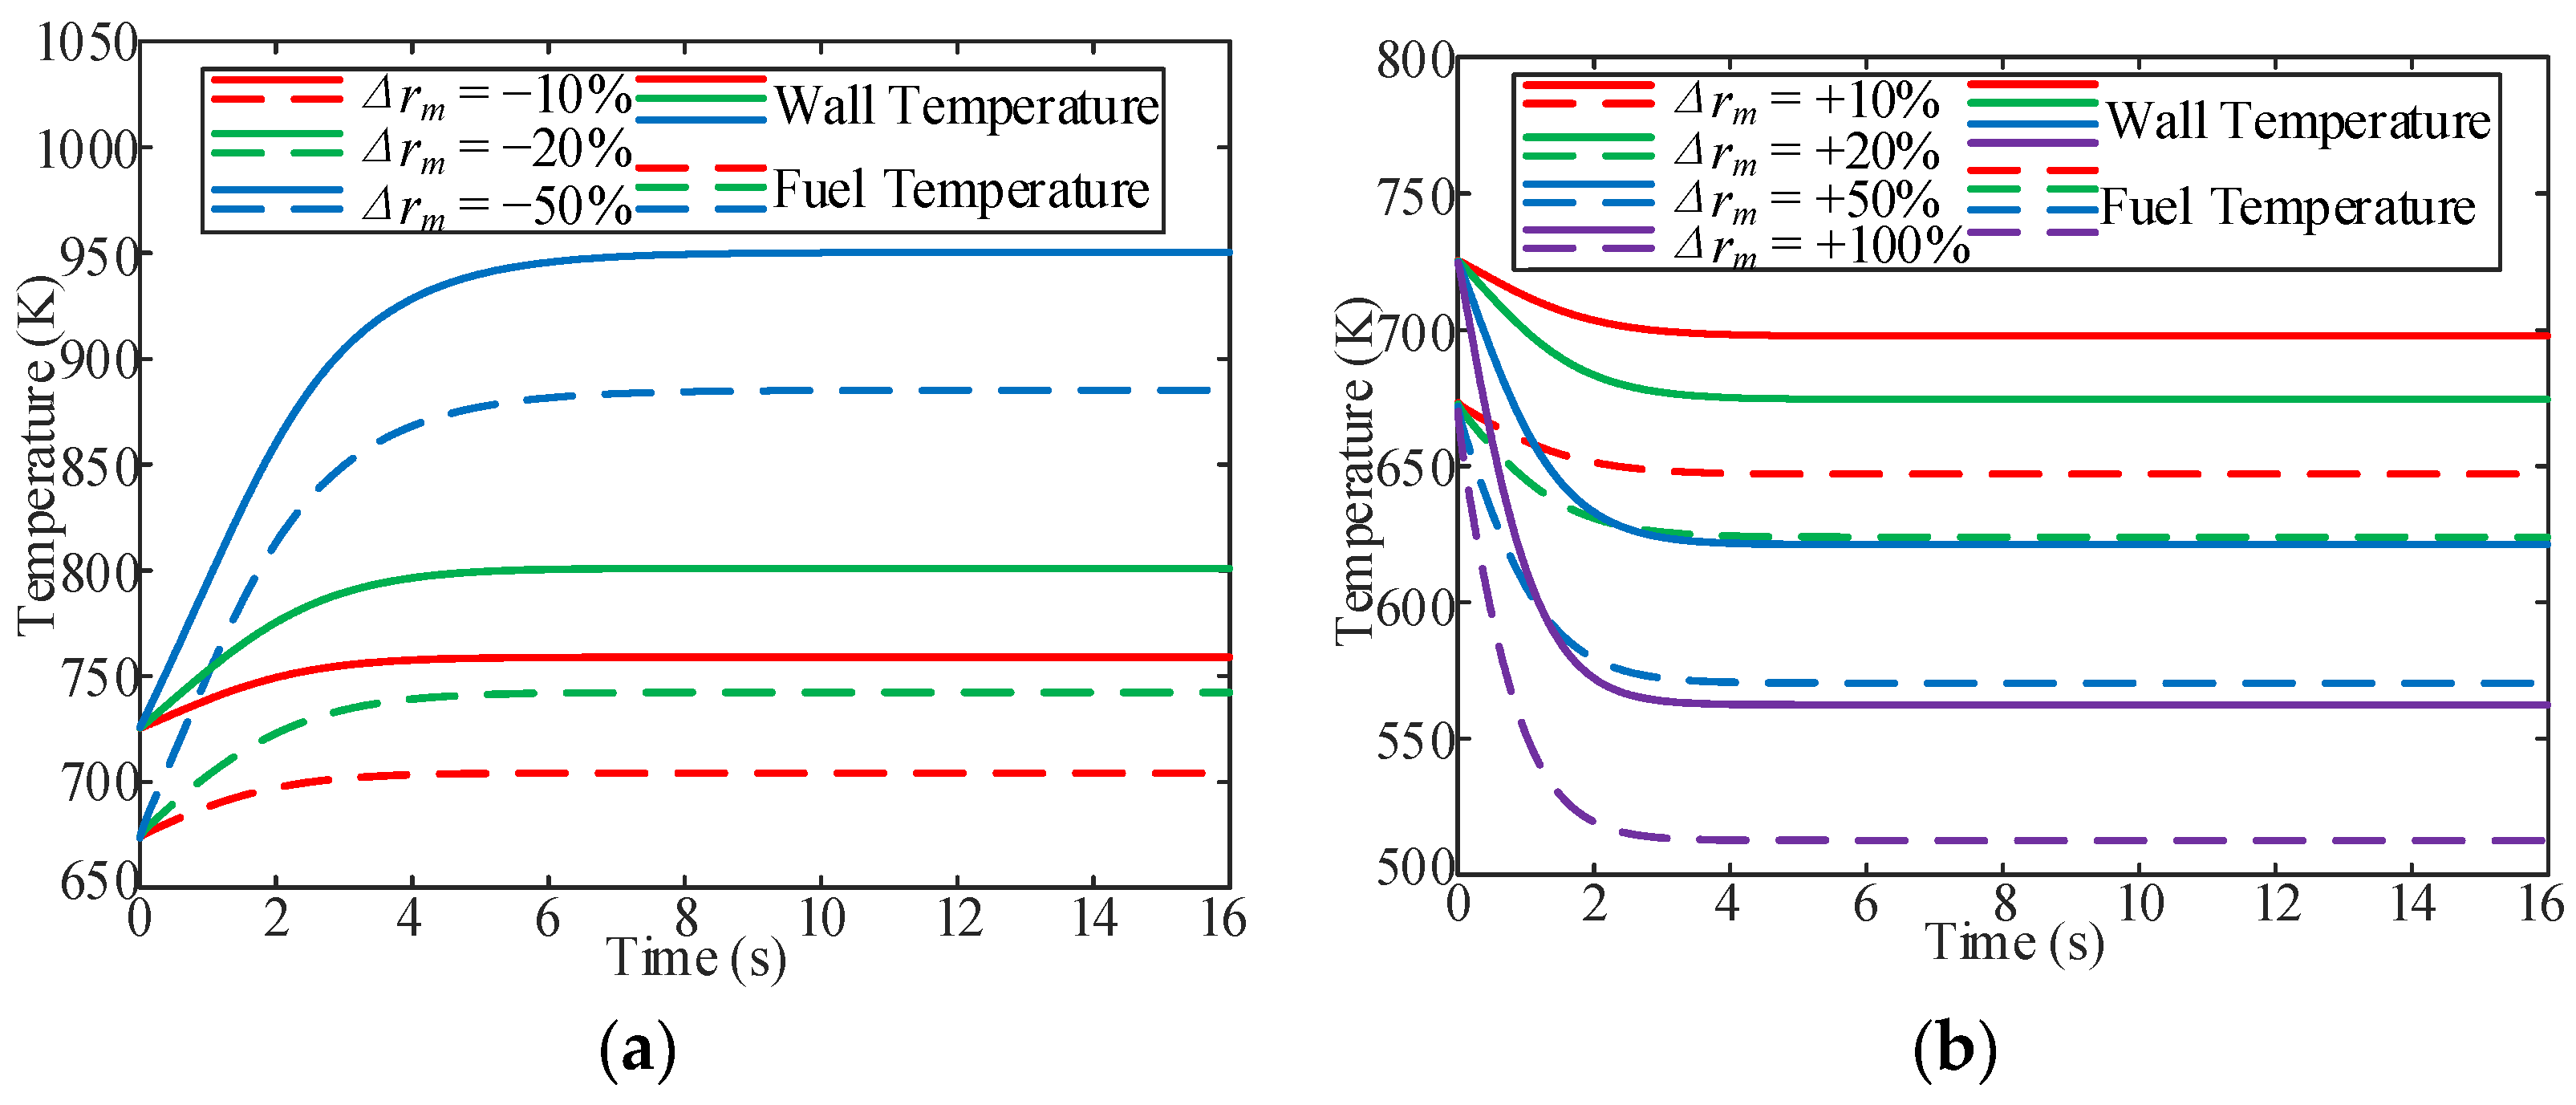
(2)
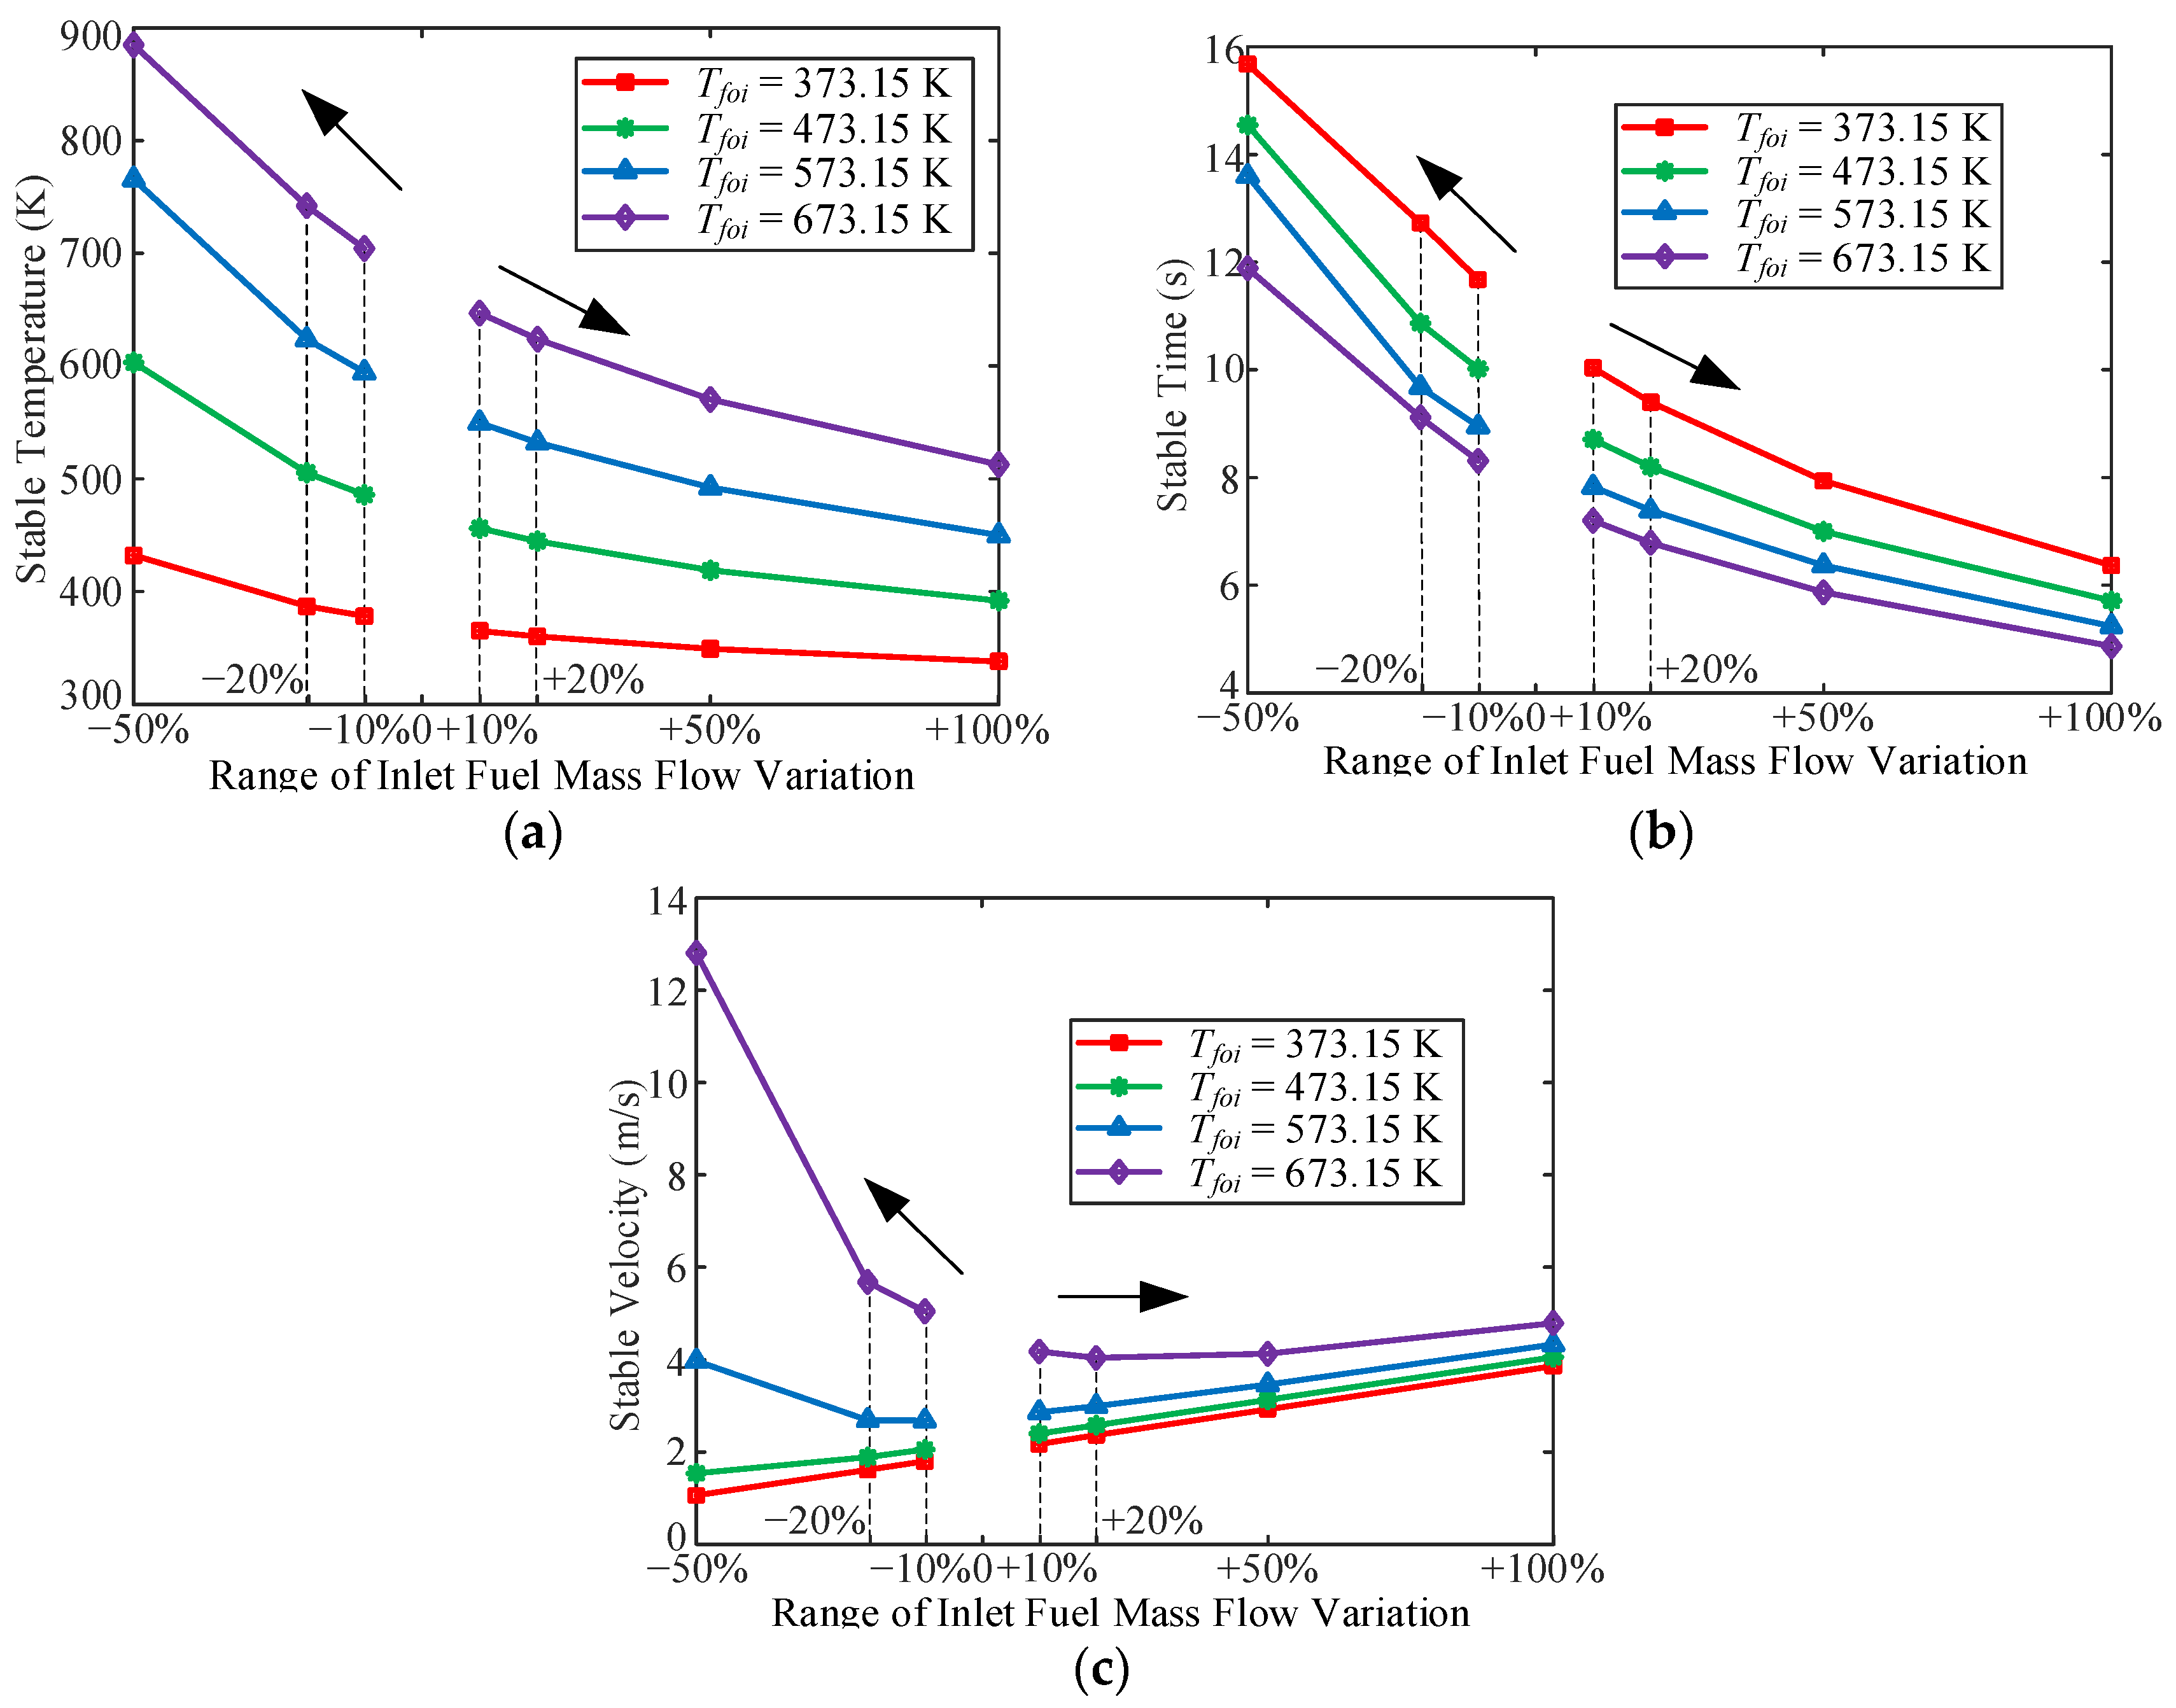
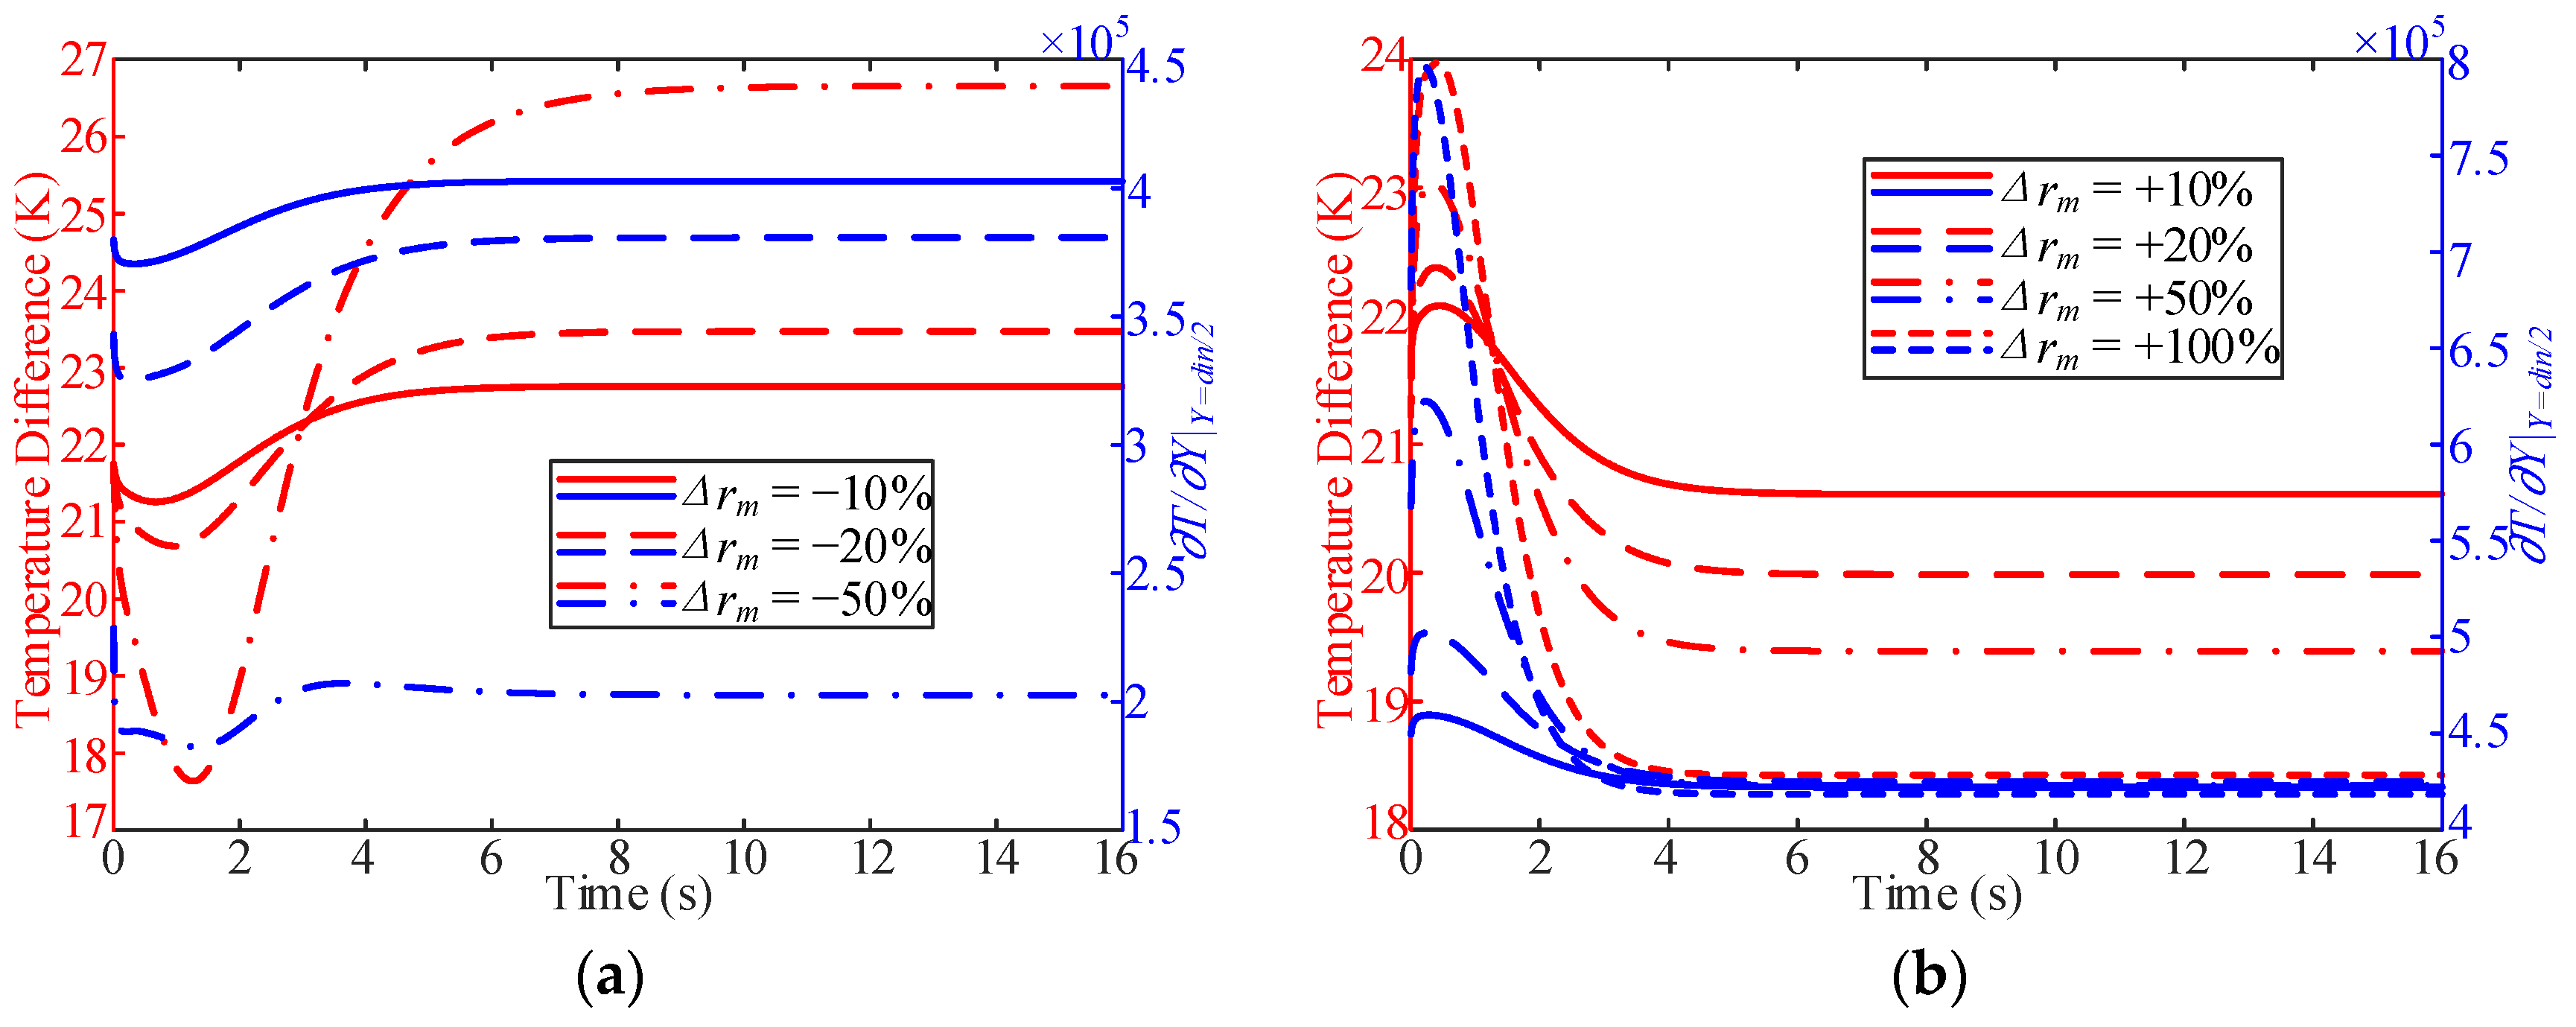
In the variable inlet mass flow process, the stable time for the fuel temperature increased with a decrease in the inlet mass flow. In addition, near the quasi-critical temperature zone, the outlet velocity increased with a decrease in the inlet mass flow. It can be observed that there is an overshoot of the OHTC at the beginning of the fuel mass flow increasing the working conditions, which implies that the increase in fuel mass flow can enhance heat transfer in the cooling channel.
(3)
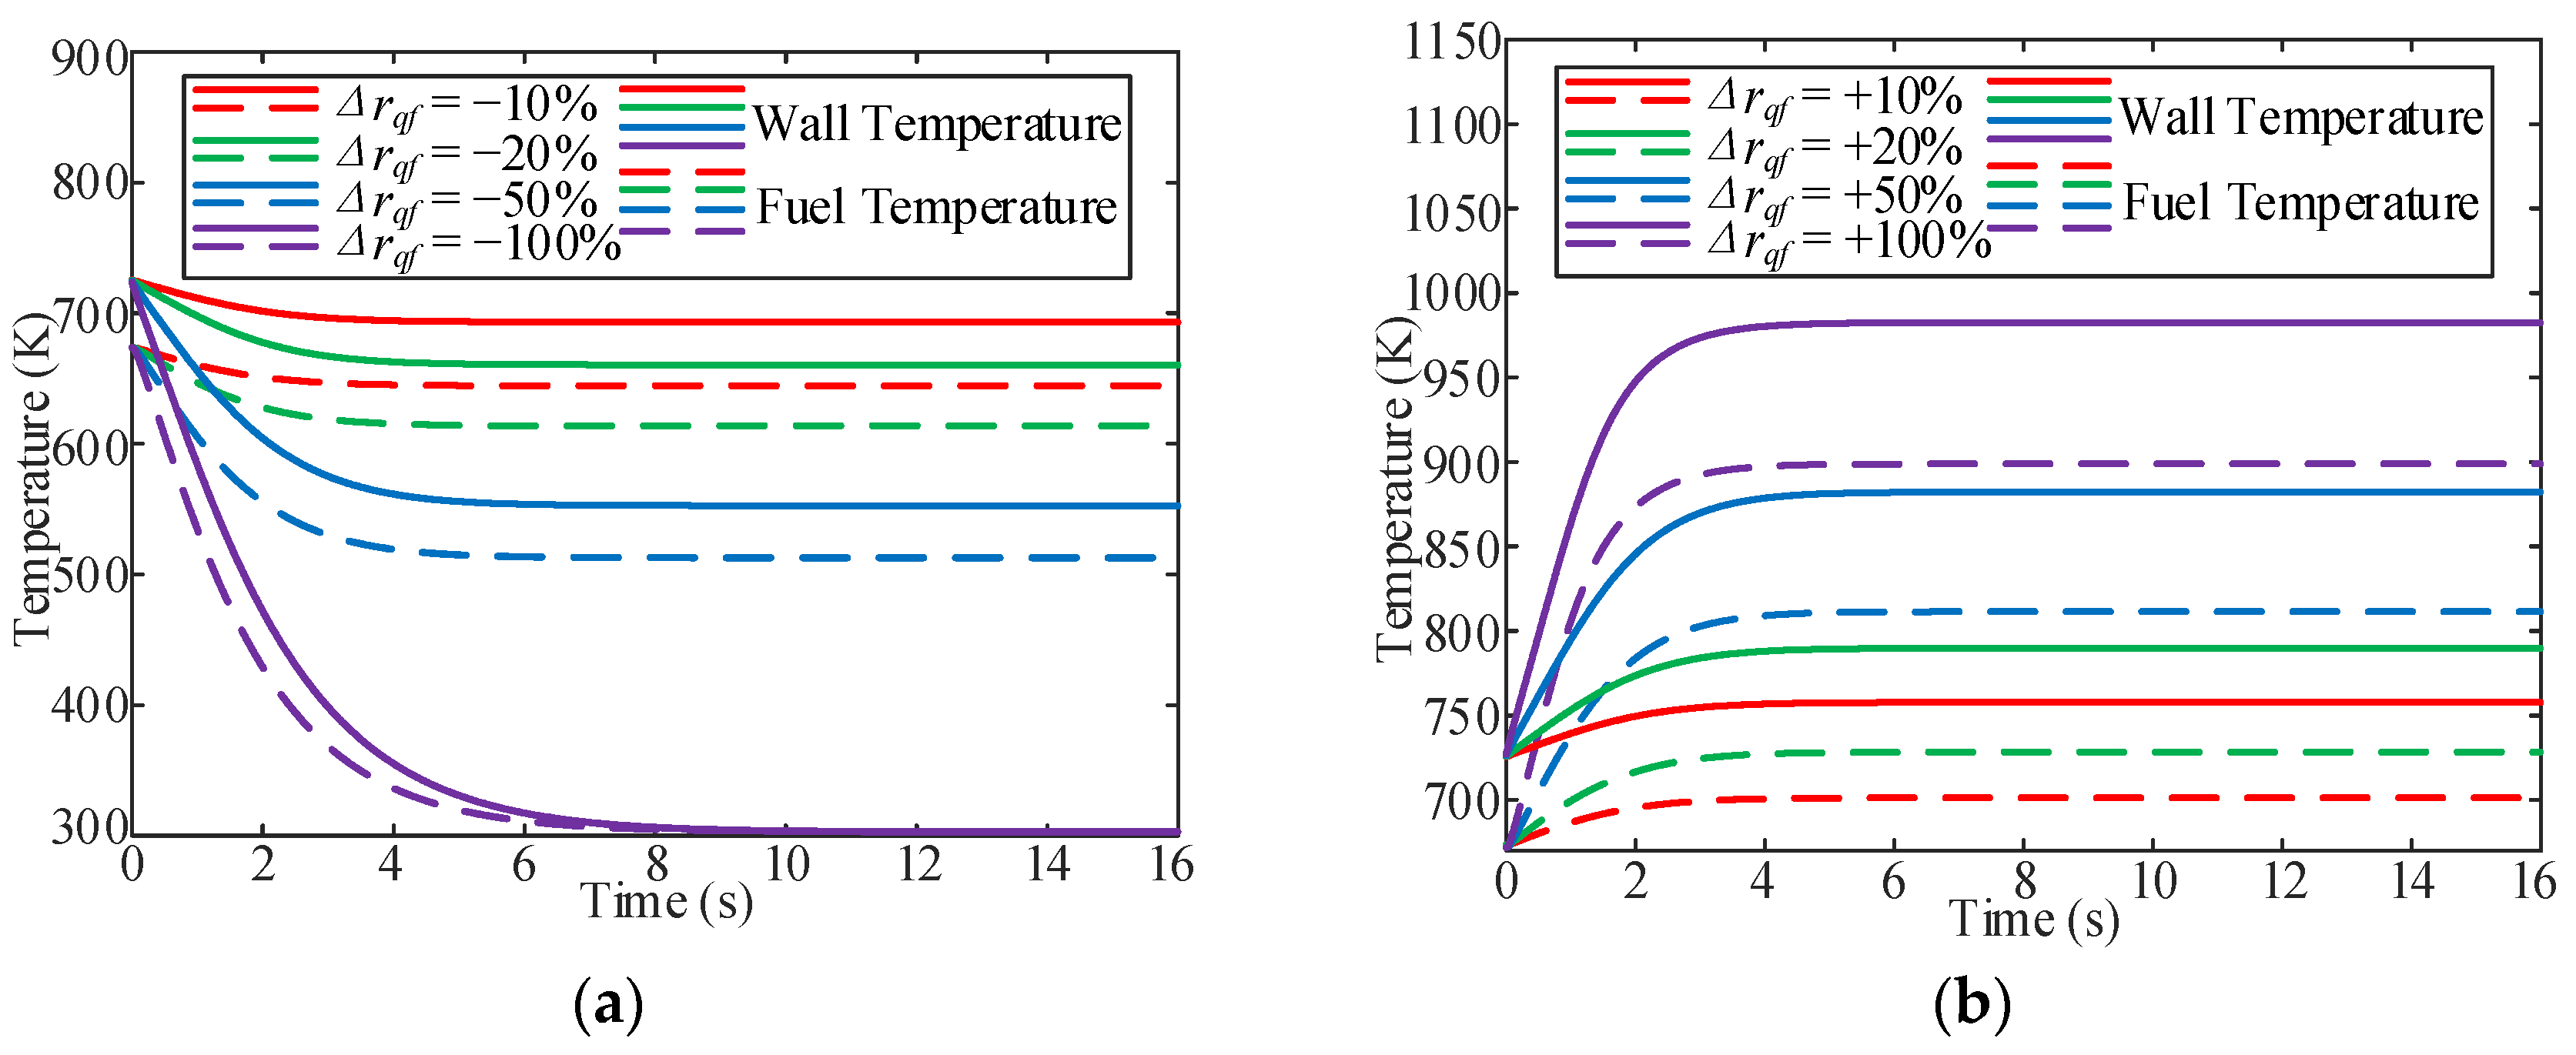
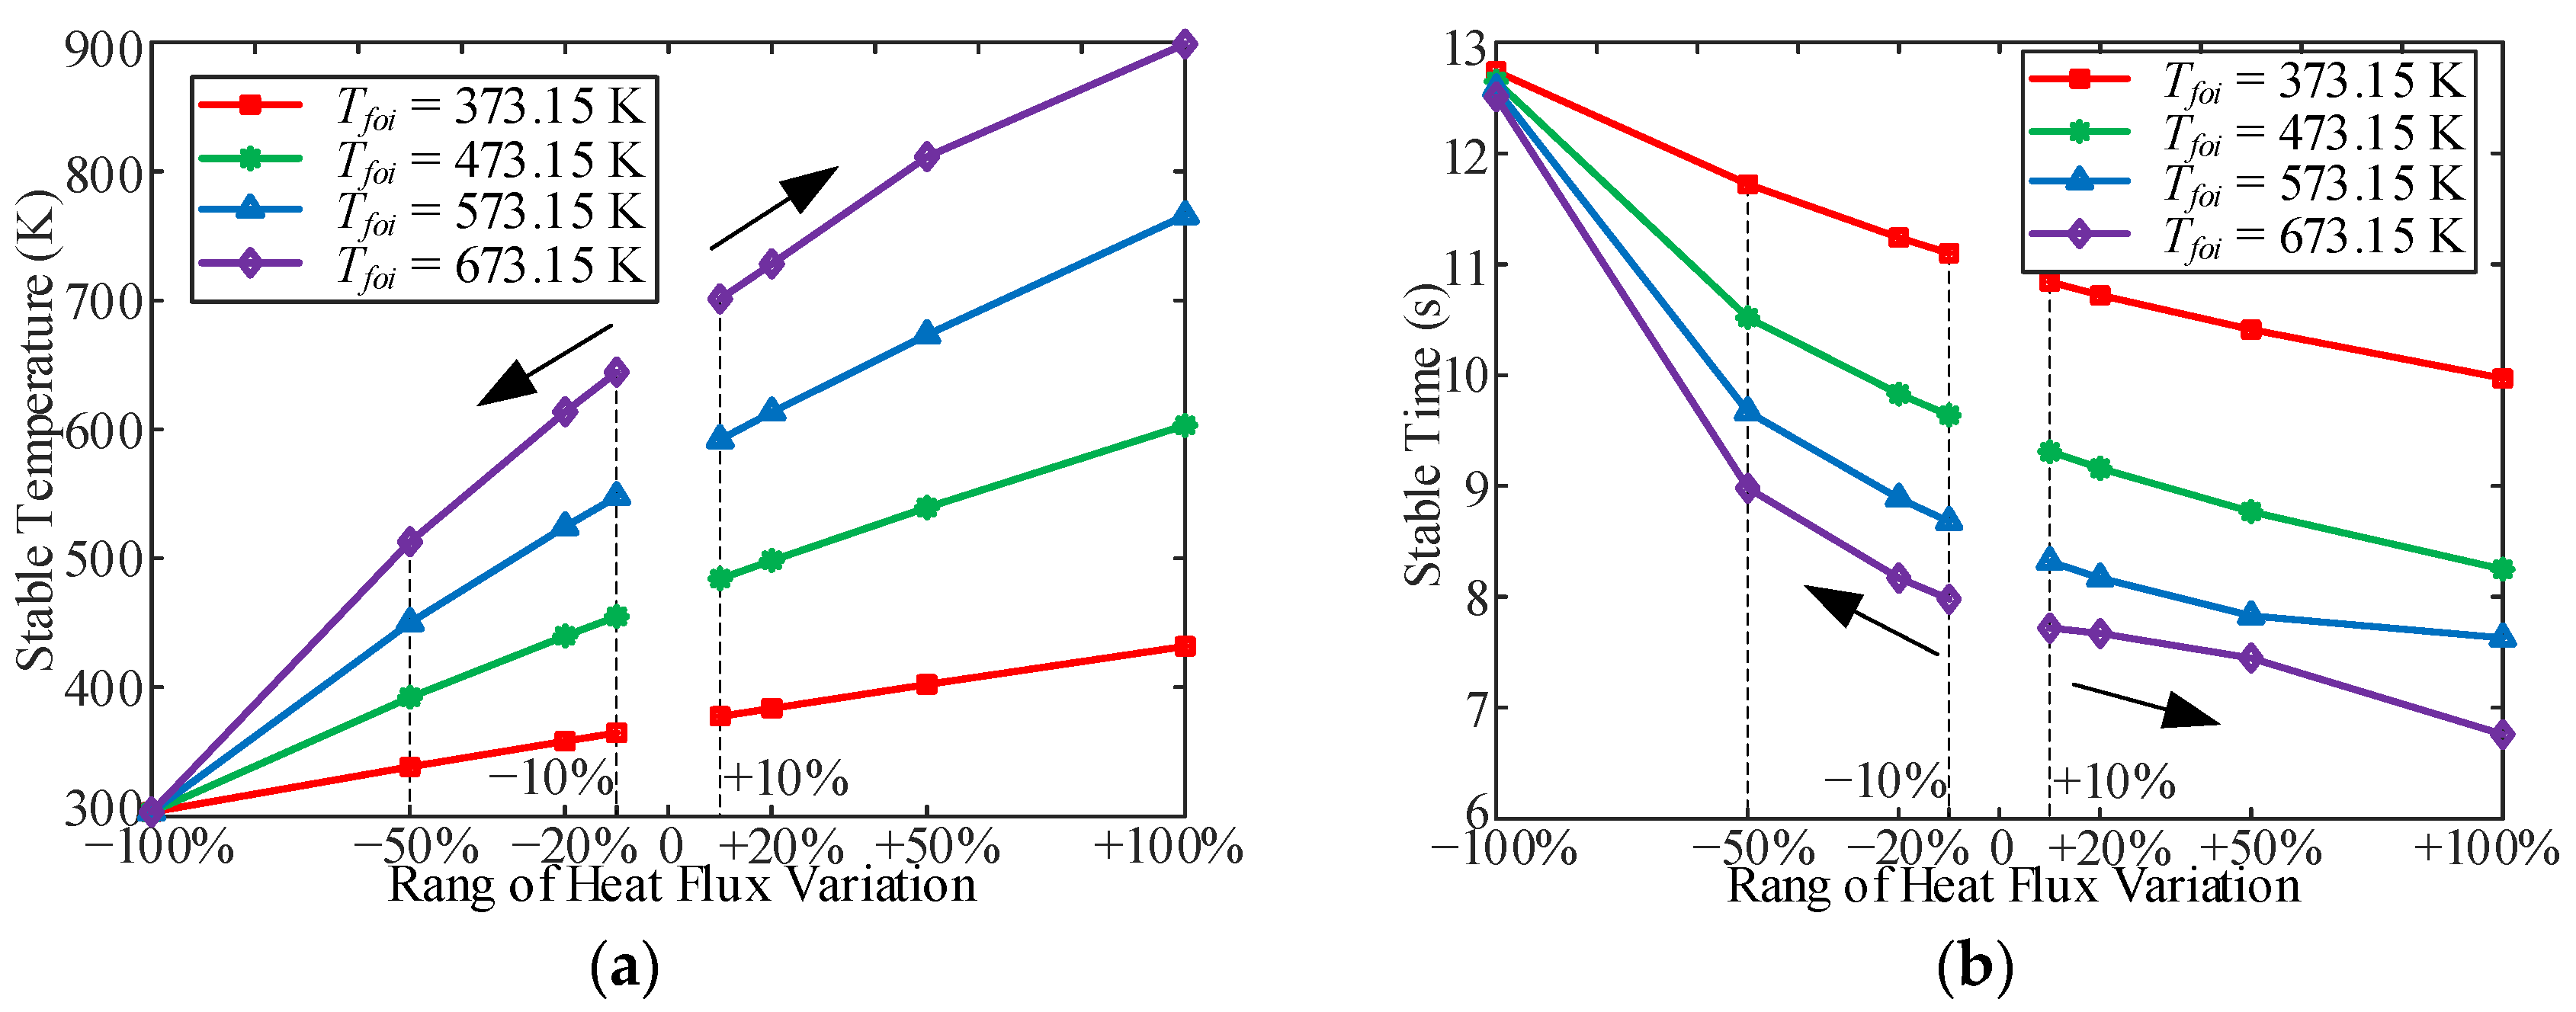
In the variable heat flux process, the stable time for the fuel temperature increased with a decrease in the heat flux. In addition, without heating, the stable time required for the outlet fuel temperature to decrease to room temperature at different Tfoi values is almost the same (approximately 12.5 s). There is also an overshoot of the OHTC at the beginning of the heat-flux-increasing working conditions because of the thermal acceleration of the fuel bought by the heat flux in the cooling channel.
(4)
In the process of variable working pressure, the fuel temperature was more sensitive to changes in the working pressure than to the wall temperature. In addition, with a change in pressure, the trend of the overall heat transfer coefficient changed slightly and only fluctuated at the initial stage of the response.
(5)
The dynamic flow and heat transfer processes of hydrocarbon fuels in cooling channels were also studied. The heat transfer characteristics were discussed using a modified heat transfer coefficient calculation method. Based on this, a suitable heat transfer correlation for the dynamic flow and heat transfer process was determined, which may provide a better understanding of the dynamic heat transfer process.

Author Contributions

Conceptualization: G.L. and H.L.; methodology: H.L.; validation: G.L., Q.X. and Y.F.; formal analysis: G.L. and H.L.; data curation management: Q.X.; writing—original draft: G.L. and Y.F.; writing—review and editing: G.L., Q.X., H.L. and Y.F. All authors have read and agreed to the published version of the manuscript.

Funding

This research was funded by GuangDong Basic and Applied Basic Research Foundation (2022A1515110605), the Postgraduate Education Innovation Project of Guangdong Ocean University (202257), the Zhanjiang Marine Youth Talent Innovation Project (2021E05013), and the Guangdong Provincial Colleges and Universities Engineering Technology Center (2023GCZX004).

Institutional Review Board Statement

Not applicable.

Informed Consent Statement

Not applicable.

Data Availability Statement

The raw data supporting the conclusions of this article will be made available by the authors on request.

Acknowledgments

The authors thank the reviewers for their valuable advice on this study.

Conflicts of Interest

The authors declare no conflicts of interest. The funders had no role in the design of the study; in the collection, analysis, or interpretation of the data; in the writing of the manuscript; or in the decision to publish the results.

Nomenclature

Apre-exponential factor, s−1
ameasurement error coefficient
cspecific heat capacity, J/(kg·K)
Cdiffusion term
ddiameter, mm
especific internal energy, J/kg
Eactivation energy, kJ/mol
hsurface convective heat transfer coefficient, W/(m2·K)
Iturbulent intensity, %
inumber of fluid radial stratification
kturbulent kinetic energy, m2/s2
overall heat coefficient, W/(m2·K)
lmicro-channel length, m
minlet fuel mass flow, g/s
Mwmolar mass, kg/mol
nnumber of solid domains
NuNusselt number
OHTCoverall heat coefficient, W/(m2·K)
ppressure, Pa
Pproduction term
PrPrandtl number
qheat flux, W/m2
ReReynolds number
Ruuniversal gas constant, J/(mol·K)
Ssource term
SCHTCsurface convective heat transfer coefficient,
W/(m2·K)
Ttemperature, K
chechemical
Eenergy, J
fFluid
inumber of fluid radial stratification
species i
inInner
jnumber of fluid axis stratification
T ¯ bulk temperature, K
ttime, s
uspecies diffusion rate, m/s
Uvelocity vector, m/s
Vcritical volume, cm3/mol
XX-axis, mm
YY-axis, mm
species mass fraction
Greek symbols
α, β, β*, δparameters in the kω model
δrelative error, %
Δrrate of change, %
ϕ ˙ internal heat source, W/m3
λthermal conductivity, W/(m·K)
ωspecific dissipation rate, 1/s
chemical reaction rate, mol/(m3·s)
μdynamic viscosity at high pressure, μP
μ*dynamic viscosity at low pressure, μP
Hamiltonian
ρdensity, kg/m3
τstress, Pa
σmeasurement error
Subscripts
adjadjacent
ccritical
calcalculated
kturbulent kinetic energy
llaminar
Mmomentum
mmass flow
outouter
ppressure
qfheat flux
tturbulent
wwall
foiinitial time outlet fluid
effeffective
expexperimental

References

  1. Wu, X.; Wei, Z. Comparison of Dual-Combustion Ramjet and Scramjet Performances Considering Combustion Efficiency. Appl. Sci. 2023, 13, 480. [Google Scholar] [CrossRef]
  2. Davis, M.; White, J. Flight-test-determined aerodynamic force and moment characteristics of the X-43A at Mach 7.0. AIAA Pap. 2006, 45, 472–484. [Google Scholar]
  3. Zhang, S.; Li, X.; Zuo, J.; Qin, J.; Cheng, K.; Feng, Y.; Bao, W. Research progress on active thermal protection for hypersonic vehicles. Prog. Aerosp. Sci. 2020, 119, 100646. [Google Scholar] [CrossRef]
  4. Landsberg, W.; Vanyai, T.; Mcintyre, T.; Veeraragavan, A. Experimental scramjet combustion models of hydrocarbon mixtures at Mach 8 flight conditions. AIAA J. 2020, 58, 5117–5122. [Google Scholar] [CrossRef]
  5. Li, X.; Zhang, Y.; Zhang, S.; Qin, J.; Bao, W. Effects of pyrolysis on heat transfer enhancement for hydrocarbon fuel flow in unilateral heated channels with dimples. Appl. Therm. Eng. 2022, 218, 119301. [Google Scholar] [CrossRef]
  6. Marshall, L.; Bahm, C.; Corpening, G.; Sherrill, R. Overview with results and lessons learned of the X-43A Mach 10 flight. In Proceedings of the AIAA/CIRA 13th International Space Planes and Hypersonics Systems and Technologies Conference, Capua, Italy, 16–20 May 2005. [Google Scholar]
  7. Hank, J.; Murphy, J.; Mutzman, R. The X-51A scramjet engine flight demonstration program. In Proceedings of the 15th AIAA International Space Planes and Hypersonic Systems and Technologies Conference, Dayton, OH, USA, 28 April–1 May 2008. [Google Scholar]
  8. Feng, Y.; Cao, J.; Li, X.; Feng, Y.; Zhang, S.; Qin, J.; Rao, Y. Flow and heat transfer characteristics of supercritical hydrocarbon fuel in mini channels with dimples. J. Heat Transf. 2017, 139, 122401. [Google Scholar] [CrossRef]
  9. Dinda, S.; Vuchuru, K.; Konda, S.; Uttaravalli, A. Heat management in supersonic/hypersonic vehicles using endothermic fuel: Perspective and challenges. ACS Omega 2021, 6, 26741–26755. [Google Scholar] [CrossRef] [PubMed]
  10. Cheng, Y.; Wang, Y.; Jiang, P.; Zhu, Y. Oxidative and pyrolytic coking characteristics of supercritical-pressure n-decane and its influence mechanism on heat transfer. Fuel 2024, 362, 130874. [Google Scholar] [CrossRef]
  11. Feng, Y.; Zhang, S.; Wu, K.; Jiang, Q.; Yong, C.; Huang, H. Numerical investigation of distribution of reaction rate during convective heat transfer with endothermic chemical reaction. Int. Commun. Heat Mass Transf. 2017, 83, 1–7. [Google Scholar] [CrossRef]
  12. Sun, F.; Li, Y.; Sunden, B.; Xie, G. The behavior of turbulent heat transfer deterioration in supercritical hydrocarbon fuel flow considering thermal resistance distribution. Int. J. Therm. Sci. 2019, 141, 19–32. [Google Scholar] [CrossRef]
  13. Fu, Y.; Zhi, T.; Xu, G.; Deng, H.; Jia, Z. Experimental study of flow distribution for aviation kerosene in parallel helical tubes under supercritical pressure. Appl. Therm. Eng. 2015, 90, 102–109. [Google Scholar] [CrossRef]
  14. Zhu, Y.; Zhao, R.; Wang, Y.; Jiang, P. Investigation of flow and heat transfer instabilities and oscillation inhibition of n-decane at supercritical pressure in vertical pipe. Appl. Therm. Eng. 2019, 161, 114143. [Google Scholar] [CrossRef]
  15. Li, H.; Qin, J.; Jiang, Y.; Zhou, W.; Bao, W.; Huang, H. Experimental study on the thermodynamic characteristics of the high temperature hydrocarbon fuel in the cooling channel of the hypersonic vehicle. Acta Astronaut. 2019, 155, 63–79. [Google Scholar] [CrossRef]
  16. Cheng, X.; Feng, S.; Bi, Q. Surface coke deposition influences on flow and heat transfer of hydrocarbon fuel in circular tubes with twisted-tape inserts. Int. Commun. Heat Mass Transf. 2021, 122, 105125. [Google Scholar] [CrossRef]
  17. Liu, Z.; Bi, Q.; Cuo, Y.; Yang, Z. Convective heat transfer and pressure drop characteristics of near-critical-pressure hydrocarbon fuel in a minichannel. Appl. Therm. Eng. 2013, 51, 1047–1054. [Google Scholar] [CrossRef]
  18. Dong, M.; Huang, H. Hydrocarbon Fuel Flow and Heat Transfer Investigation in Rotating Channels. Energies 2023, 16, 5020. [Google Scholar] [CrossRef]
  19. Zhang, Y.; Cao, Y.; Feng, Y.; Zhang, D.; Qin, J. Investigation into effect of residence time on cooling characteristics of RP-3. J. Thermophys. Heat Transf. 2022, 37, 435–447. [Google Scholar] [CrossRef]
  20. Jiang, X.; Liu, M.; Wu, H.; Zheng, Y.; Zhuang, J. Numerical study on low-temperature region as heat sink and its heat dissipation capacity for hypersonic vehicle. Aerospace 2021, 8, 238. [Google Scholar] [CrossRef]
  21. Zhang, L.; Zhang, R.; Xiao, S.; Jiang, J.; Le, J. Experimental investigation on heat transfer correlations of n-decane under supercritical pressure. Int. J. Heat Mass Transf. 2013, 64, 393–400. [Google Scholar] [CrossRef]
  22. Jiao, S.; Li, S.; Pu, H.; Dong, M.; Shang, Y. Investigation of pressure effect on thermal cracking of n-decane at supercritical pressures. Energy Fuels 2018, 32, 4040–4048. [Google Scholar] [CrossRef]
  23. Li, X.; Zhang, S.; Bao, W.; Qin, J.; Haidn, O. Flow resistance characteristics of hydrocarbon fuel at supercritical pressure under various heat fluxes in regenerative cooling channel with micro-ribs. Aerosp. Sci. Technol. 2022, 131, 107999. [Google Scholar] [CrossRef]
  24. Gatski, T.; Rumsey, C. Linear and Nonlinear Eddy Viscosity Models; Cambridge University Press: London, UK, 2002. [Google Scholar]
  25. Kim, S.; Choi, H.; Kim, Y. Thermo-physical modeling based on a generalized cubic equation of state for kerosene/LOx rocket combustion. Combust. Flame 2012, 159, 1351–1365. [Google Scholar] [CrossRef]
  26. Li, X.; Qin, J.; Zhang, S.L.; Cui, N.; Bao, W. Effects of micro-ribs on the thermal behavior of transcritical n-decane in asymmetric heated rectangular mini-channels under near critical pressure. J. Heat Transf.-Trans. ASME 2018, 140, 122402. [Google Scholar] [CrossRef]
  27. Li, X.; Zhang, S.; Qin, J.; Bao, W. Parametric analysis on the thermal behavior of cracking hydrocarbon fuel flow inside asymmetry heated cooling channels with micro-ribs. Int. J. Heat Mass Transf. 2020, 160, 120154. [Google Scholar] [CrossRef]
  28. Li, Y.; Xie, G.N.; Sunden, B. Flow and thermal performance of supercritical n-decane in double-layer channels for regenerative cooling of a scramjet combustor. Appl. Therm. Eng. 2020, 180, 115695. [Google Scholar] [CrossRef]
  29. Poling, E.; Prausnitz, J.; Paul, O. The Properties of Gases and Liquids; McGraw-Hill: New York, NY, USA, 2001. [Google Scholar]
  30. Li, H.; Lin, G.; Xu, Q.; Fang, X.; Xian, S. Overall heat transfer coefficient evaluation method for uncracked hydrocarbon fuel in a regeneratively-cooled heat exchanger of a scramjet. Appl. Sci. 2022, 12, 6590. [Google Scholar] [CrossRef]
Figure 1. Fuel flow path in the regenerative cooling channel.
Applsci 14 02508 g001
Figure 2. Thermal property variation ratio with the temperature of n−decane at 3 MPa.
Applsci 14 02508 g002
Figure 3. Model of the cooling channel developed from the real structure.
Applsci 14 02508 g003
Figure 4. Sectional structure diagram of cooling channel.
Applsci 14 02508 g004
Figure 5. Grid independence verification.
Applsci 14 02508 g005
Figure 6. Experimental structure for n-decane heating.
Applsci 14 02508 g006
Figure 7. Experimental platform for n-decane heating.
Applsci 14 02508 g007
Figure 8. Comparison of calculated and experimental wall temperature.
Applsci 14 02508 g008
Figure 9. Dynamic process of the fuel and wall temperature at X = 900 mm. (a) Δrm decreases; (b) Δrm increases.
Applsci 14 02508 g009
Figure 10. Stable parameter distribution with Δrm. (a) Stable temperature distribution with Δrm; (b) Stable time distribution with Δrm; (c) Stable velocity distribution with Δrm.
Applsci 14 02508 g010
Figure 11. Dynamic process of the OHTC and the SCHTC at X = 900 mm. (a) Δrm decreases; (b) Δrm increases.
Applsci 14 02508 g011
Figure 12. Dynamic process of adjacent temperature difference. (a) Δrm decreases; (b) Δrm increases.
Applsci 14 02508 g012
Figure 13. Dynamic process of fuel and wall temperature. (a) Δrqf decreases; (b) Δrqf increases.
Applsci 14 02508 g013
Figure 14. Stable parameter distribution with Δrqf. (a) Stable temperature distribution with Δrqf; (b) Stable time distribution with Δrqf.
Applsci 14 02508 g014
Figure 15. Change in the OHTC and SCHTC at X = 900 mm with Δrqf changes. (a) Δrqf decreases; (b) Δrqf increases.
Applsci 14 02508 g015
Figure 16. Change in temperature difference and the partial derivative of fuel temperature at X = 900 mm with Δrqf changes. (a) Δrqf decreases; (b) Δrqf increases.
Applsci 14 02508 g016
Figure 17. Dynamic process of fuel and wall temperature at X = 900 mm. (a) Tfoi = 373.15 K; (b) Tfoi = 473.15 K; (c) Tfoi = 573.15 K; (d) Tfoi = 673.15 K.
Applsci 14 02508 g017
Figure 18. Change in the OHTC and SCHTC at X = 900 mm with working pressure changes. (a) 5 MPa to 3 MPa; (b) 3 MPa to 5 MPa.
Applsci 14 02508 g018
Figure 19. Dynamic process of inner wall temperature and adjacent wall fuel temperature difference and the partial derivative of fuel temperature. (a) 5 MPa to 3 MPa; (b) 3 MPa to 5 MPa.
Applsci 14 02508 g019
Table 1. Constant pressure-specific heat and thermal conductivity of GH3128 change with temperature.
T (K)273.15473.15573.15673.15773.15873.15973.151073.15
cpw (J/(kg·K))113.91120.21127.47137.36142.20152.84154.48159.54
λw (W/(m·K))11.3012.5614.2415.4916.7518.4219.6821.35
Table 2. Required heat flux for different outlet fuel temperatures.
Working Pressure (MPa)Outlet Fuel Temperature (K)Required Heat Flux (W/m2)
5373.1520,855
473.1555,735
573.1596,793
673.15145,355
3373.1520,895
473.1555,930
573.1597,695
673.15152,760
Table 3. Type and parameters of the Equipment.
EquipmentTypeAccuracy
PumpSP1020 Type High-Pressure Double Plunger Pump≤±1%
Heating PowerDC Power0.5%
Temperature SensorK Type Thermocouple0.4%
Pressure Difference SensorROSEMOUNT 3051CD Type Differential Pressure Transmitter0.25%
Mass Flow MeterMicro Motion Elite Type Coriolis CMF010 Mass Flow Meter0.1%
Data Acquisition SystemNI cRIO-9205≤±0.1‰
Temperature: NI 9205≤±0.12‰
Pressure, pressure difference: NI 9264≤±0.15‰
Table 4. Measurement uncertainty expressions.
MeasurementMeasurement Error ExpressionUncertainty
Mass flow σ m = σ m , s e n s o r 2 + σ p u m p 2 + σ c o n t r o l l e r 2 + σ m o d u l e 2 ±1.01%
Temperature σ T = σ T , s e n s o r 2 + σ c o n t r o l l e r 2 + σ m o d u l e 2 ±0.2%
Pressure σ p = σ p , s e n s o r 2 + σ c o n t r o l l e r 2 + σ m o d u l e 2 ±0.125%
Heat flux σ q = a Q σ Q 2 + a T σ T 2 ±0.32%
Disclaimer/Publisher’s Note: The statements, opinions and data contained in all publications are solely those of the individual author(s) and contributor(s) and not of MDPI and/or the editor(s). MDPI and/or the editor(s) disclaim responsibility for any injury to people or property resulting from any ideas, methods, instructions or products referred to in the content.

