Abstract
Under dynamic loads, such as blasting, excavation, or quarrying, rocks with fissures are the first to sustain damage, leading to instability in the engineering rock mass. To investigate the kinetic properties of fractured rocks, fractured coal mine sandstone specimens underwent impact compression tests using a dynamic–static combination SHPB (split Hopkinson pressure bar) test device at different loading rates under combined dynamic and static conditions. The damage characteristics of the specimens were analyzed from an energy point of view. The results show that under the dynamic and static combined condition, when five impact loading air pressures are used for loading at different impact rates, the trends of the dynamic stress–strain curves of prefabricated fissured rock samples under various impact pressures were discovered to be similar and were mainly categorized into three main stages of elasticity, yield, and destruction; the specimen’s dynamic compressive strength increases according to a power function relationship; as the average strain rate increases, the dynamic strain increases linearly and the dynamic modulus of elasticity increases in a quadratic relationship, all of which show a significant strain rate effect. The incident energy is a power function of the loading rate. The reflected, transmitted, and absorbed energies by the sample increase with the incident energy. The degree of the sandstone specimen fragmentation gradually grows with increasing impact loading rate and incident energy, as evidenced by a decrease in the scale of the fragments. The absorbed energy in the sample is mainly used for the deformation damage of the rock, and the more intense the fragmentation of the specimen, the more absorbed energy is required.
1. Introduction
The excavation and utilization of underground spaces will cause cracks, joints, and other defects in the underground rock mass. In spite of static loads such as self-weight stress, the blasting excavation and engineering disturbance will also cause dynamic load disturbance to the deep fractured rock mass [1]. Rock fractures and dynamic load disturbance are important parameters of the rock’s physical properties. Consequently, it is of great importance to investigate using the SHPB (split Hopkinson pressure bar) test in sandstone with different impact pressure cracks under static–dynamic coupling loading to ensure the safety of underground engineering [2].
In the past, both static and dynamic tests have been conducted on rocks by many scholars. The mechanisms of strain rate effects are discussed [3]. In terms of the influence of different shock pressures and fracture on the mechanical properties of rocks, Li et al. [4] conducted dynamic shock testing. The loading speed grows exponentially with the dynamic intensity. Wang et al. [5] found that the loading rate effect of jointed rock is obvious in a numerical experiment focusing on triaxial compression. Xiao et al. [6] performed tests on coal specimens using a range of loading rates. As the loading rate increased, it was discovered that the type of coal failure changed from tensile damage to tensile–shear composite damage. Bahaaddini et al. [7] examined the effect of joints on the rock mass through numerical simulations. Wang et al. [8] performed tests on rock-like specimens with cross-fractures at various loading speeds, and the results obtained demonstrated that the peak stress intensity of the specimens was positively correlated with the loading speed. Bobet et al. [9] investigated the crack initiation, extension, and penetration behavior of prefabricated jointed specimens. Wasantha et al. [10] investigated the coupled effect of strain rate and sandstone grain size on the mechanical properties of sandstone. Fujii et al. [11] found that the direction of crack extension in sandstone specimens was always at a slight angle to the initial direction. Kang et al. [12] performed compression tests on rocks using various static loading rates and concluded that the loading speed is the main factor affecting the peak strength. Ping et al. [13] used the SHPB testing device to investigate the sandstone samples from coal mines. The tests showed that the energy absorbed by the specimens was mainly dissipated through the damage evolution and deformation destruction of the rock. Li et al. [14] conducted single axis compression tests. The compression failure process of samples is divided into four stages: compaction, elasticity, yield, and failure, with the failure stage being shear failure. Li et al. [15] conducted compression testing on deep-buried mudstone. The greater the loading rate, the greater the strength of the mudstone rock. Selahattin [16] performed fracture toughness tests on granite to investigate the fracture mechanism and found that the loading rate increased the fracture toughness. Alam et al. [17] proposed an empirical equation for strain rate associated with a dynamic increase factor. Brown et al. [18,19] investigated the effect of different joint properties on rock unit stack specimens.
In terms of the effect of mixed dynamic and static loading for rock mechanical properties, Liu et al. [20] presented an experimental study of dynamic rock fracture behavior, analyzing how dynamic and static loads affect rock fracture damage and instabilities. Du et al. [21] performed one-dimensional combined dynamic and static loading tests on composite rock specimens and concluded that the absorption energy of rock samples decreased with the rise in axial compression. Pan et al. [22] observed that the parameters of the samples grew with the growth in dynamic load. Wang et al. [23] performed dynamic loading of water-saturated coal specimens, revealing the deformation and strength characteristics of coal samples. Wang et al. [24] carried out a numerical simulation of Hopkinson pressure bar dynamic and static loading on sandstone. In conclusion, the application of confining pressure and axial compression can inhibit the internal crack propagation of sandstone. Chen et al. [25] found that the dynamic stress–strain curve of rock samples generally has three stages: elastic stage, yield stage, and failure stage. Ren et al. [26] investigated the coal impact test under different dynamic and static combination conditions. Fan et al. [27] analyzed the damage evolution mechanism of rock through deep sandstone dynamic testing and provided a definition of the damage factor. Ma et al. [28] found that the energy absorption value of rock under impact was affected by the gap between the initial energy storage and the energy storage limit. Fang et al. [29] found that there was a good linear growth relationship between the dynamic strength growth factor and the strain rate. Dai et al. [30] noticed that there was a linear growth in the energy absorption density of rocks with varying angles of break with increasing average strain rates in both dynamic and static composite load tests. Wu et al. [31] applied dynamic loading experiments on cylindrical specimens of various aspect ratios. The dynamic peak stress was found to be exponential with the growth in the strain rate. Wang et al. [32] examined energy consumption mechanisms of red rock under a combination of static and dynamic loads. The greater the axial compression, the lower the energy utilization rate. Water also can affect the properties of fissured rocks. When water enters the interior of a rock through a fissure, the particles in the rock move irregularly in the water [33]. Tan et al. [34] conducted dynamic impact compression tests and discovered that the strength of rock reduces with growth in its water content.
Many scholars have completed a number of experiments to study the hydrostatic properties of rock at various loading rates. Nevertheless, there are fewer existing investigations on rocks’ dynamic mechanical properties under the combined effect of the static and dynamic loading rate. Microfractures within the rock can cause the rock to fracture after stretching and penetrating [35]. Therefore, dynamic compression tests were performed on fractured rocks at different impact pressures using a dynamic–static combination SHPB test set under the dynamic–static combination loading condition, and the dynamic mechanical properties and energy dissipation of the fractured rocks under the dynamic–static combination loading were investigated. This research is also significant for the development and use of underground energy sources [36,37].
2. Prefabricated Crack Specimen Preparation and SHPB Test Device
2.1. Specimen Processing and Prefabricated Crack Preparation
One of the physical properties of rocks is its inhomogeneity; consequently, natural rocks form pore spaces, fractures, laminations, and other defects during the natural formation process. We took all rock samples from the same rock mass to ensure a fair comparison of the results when conducting rock dynamic tests, depending on the test method recommended by the International Society of Rock Mechanics (ISRM) [38] and the standard approach to rock dynamic behavioral testing [39]. After core-taking, cutting, and grinding, the samples were machined to a cylindrical shape with a thickness and diameter of 50 mm. The measurements comprised prefabricated crack width d = 2 mm, length 20 mm, and the crack dip angle α = 45°. The cracks were arranged at the center of the processed samples. The positions of the pre-made fractures are illustrated in Figure 1.
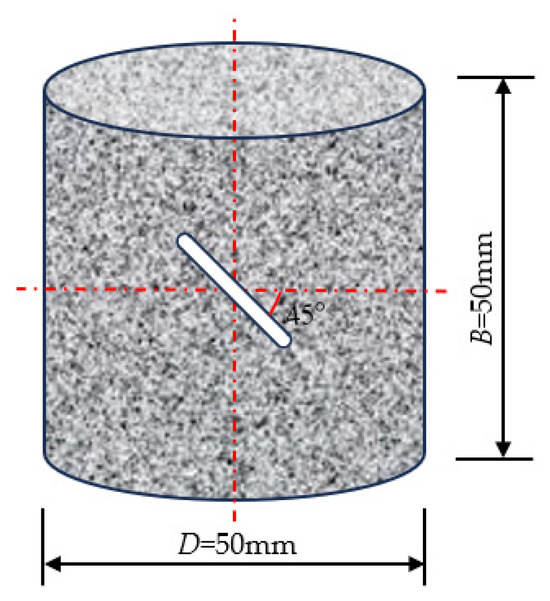
Figure 1.
Diagram of prefabricated fractured rock specimens.
X-ray diffraction (XRD) experiments were conducted on the impacted fragments of the fractured sandstone, and the resulting XRD test patterns are illustrated in Figure 2.
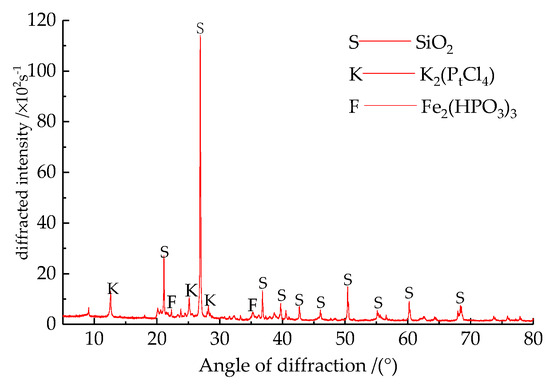
Figure 2.
XRD pattern of fissured sandstones.
Through the XRD testing of the rock, we found that the main component of the samples is quartz (SiO2), and the formulae of the other secondary minerals are K2(PtCl4) and Fe2(HPO3)3, etc.
2.2. Testing Apparatus
The equipment used was the dynamic–static combination SHPB test device. The physical diagram of the combined static and dynamic SHPB tester is illustrated in Figure 3a. Figure 3b displays a schematic diagram of the dynamic–static SHPB unit combination.
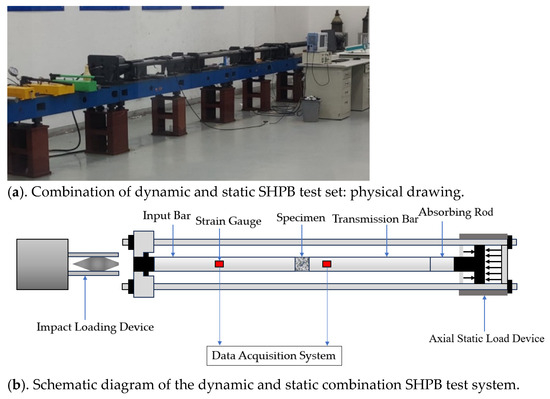
Figure 3.
SHPB test device.
The incident bar measures 2000 mm in length, while the transmission bar measures 1500 mm and the absorption bar measures 1000 mm. All bars have a diameter of 50 mm. The spindle-shaped impact bar was chosen to achieve better stress uniformity during the impact process. Every time the impact occurs, the impact bar is in the same position, maintaining a constant impact distance.
The loading diagram of the prefabricated fractured sandstone samples under dynamic and static combined loading conditions is illustrated in Figure 4. In this figure, Ps is the axial pre-applied static load schematic, and Pd is the axial impact load schematic.
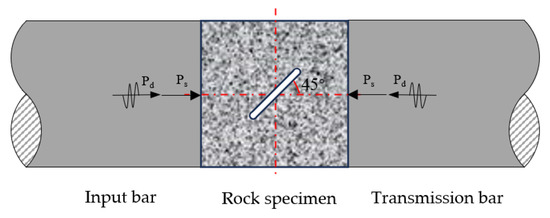
Figure 4.
Force loading diagram of the specimen.
Figure 5 shows that the transmitted stress wave is essentially the superposition of the incident and reflected stress waves. The samples achieve dynamic stress equilibrium during the loading process, which verifies the reliability of the experimental results.
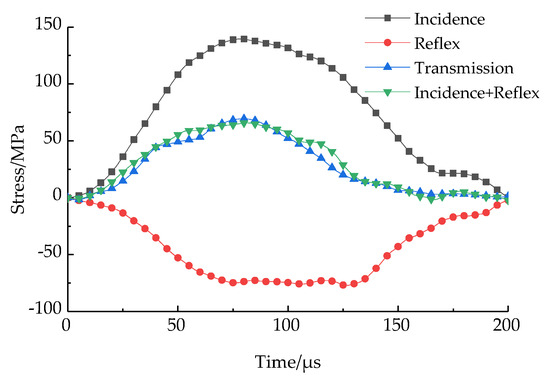
Figure 5.
Stress balance diagram of rock.
3. Experiment Results and Analyses
3.1. SHPB Test Results of Dynamic and Static Combination
To minimize the impact of rock heterogeneity on the test outcomes, we used a wave velocity meter to measure the wave velocities of samples taken from the same rock mass. Then, we selected rock samples with similar wave velocities to perform the tests. This study conducted five groups of tests with varying levels of impact air pressure, and three samples were selected from each group to carry out the tests in parallel. We averaged the experimental results and then selected two pieces of experimental data close to the average to be analyzed and processed. The experimental data with a dispersion greater than 30% were excluded.
The shock-compression test for combined dynamic and static loading was conducted on prefabricated fractured sandstone samples with 45° dip angles using the SHPB test device to measure dynamic and static combinations. The axial pre-loading static load was 1 MPa, and the impact pressure was selected at different levels of 0.3 MPa, 0.325 MPa, 0.35 MPa, 0.375 MPa, and 0.4 MPa. Three samples from each group were selected for testing, and two relatively close pieces of test data were selected. Table 1 displays the outcome of the SHPB trials.

Table 1.
Test results for prefabricated fractured rock samples.
3.2. Dynamic Stress–Strain Curve of Prefabricated Fractured Sandstone Sample
The typical dynamic stress–strain curves of prefabricated fractured rock samples with 45° inclination angles under the same axial compression and different impact pressures are illustrated in Figure 6.
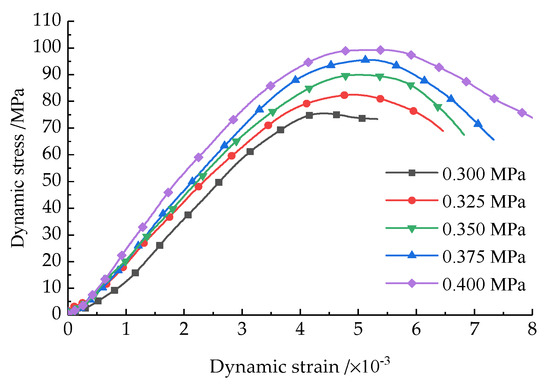
Figure 6.
Dynamic stress–strain curve sof sandstone samples with prefabricated cracks under axial compression.
From Figure 6, we can see that the trend in dynamic stress–strain curves of prefabricated fractured rock specimens under the same axial compression and different impact pressures is similar. With the growth in shock pressure, the dynamic stress–strain curves of the prefabricated fractured rock samples shift towards the upper right. The dynamic stress–strain curves of rock samples are identified in three main stages. The initial stage is the elastic stage. As time increases, the slope in the elastic stage gradually decreases. Then, the curves enter the second stage, which is the yield stage. The larger the impact pressure is, the shorter the elastic stage is and the faster the curves enter the yield stage. Then, stage three is the failure stage. After entering the yield stage, the samples are then destroyed and enter the failure stage.
3.3. Impact Velocity
In this experiment, if different air pressures are used to drive the impact bar, the impact bar will move at different velocities and then strike the incident bar. Figure 7 illustrates the variation in loading velocity with impact air pressure.
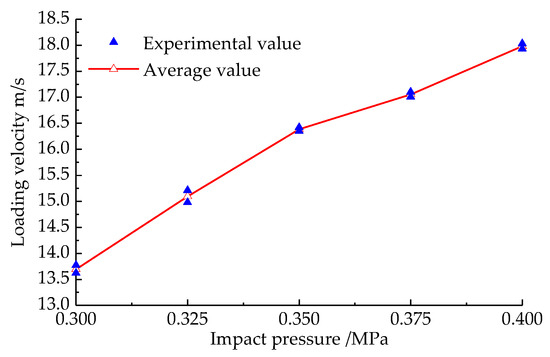
Figure 7.
Variation in loading velocity with impact air pressure.
Figure 7 indicates that the loading rate rises with increasing shock air pressure, which increases in an approximately linear manner. If the pressure of the impact air is the same, then the speed of the load will basically be the same.
3.4. Average Strain Rate of Sample
The variation in the mean strain rate of the prefabricated fractured rock samples with the impact pressure is illustrated in Figure 8.
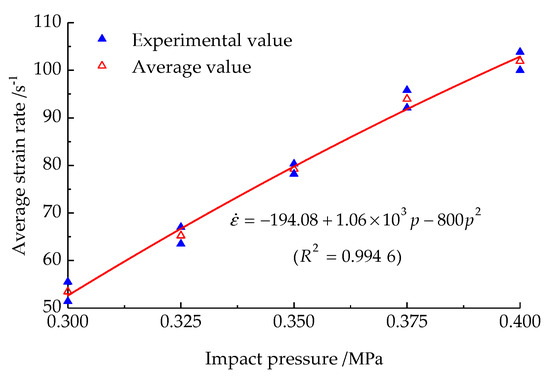
Figure 8.
The variation in average strain rate of prefabricated fractured rock specimens with impact pressure.
In Figure 8, the mean strain rate of prefabricated fractured rock specimens increases with increasing impact pressure and the growth rate of the average strain rate slows down. At 0.3 MPa impact pressure, the mean strain rate is 53.45 s−1. When the shock pressure increases to 0.4 MPa, the average strain rate is 101.9 s−1 and has increased by 90.6%.
The prefabricated fractured sandstone samples exhibit a quadratic relationship between the mean strain rate and the change in impact pressure, with a high correlation. The fitting relationship is illustrated in Formula (1).
where is the average strain rate of the prefabricated fractured rock samples; is the impact pressure.
3.5. Dynamic Compressive Strength of Sample
Figure 9 illustrates the variation in dynamic compressive strength of the prefabricated fractured rock specimens with respect to the mean strain rate.
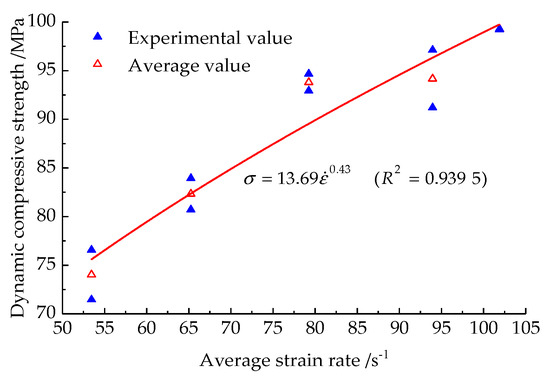
Figure 9.
Dynamic compressive strength changes in prefabricated fractured sandstone samples with mean strain rate.
Figure 9 shows that the dynamic compressive strength of the prefabricated fractured rock samples increases as the average strain rate increases, with a gradual decrease in the rate of increase. The experimental results establish that the increase in shock pressure leads to an increase in both the mean strain rate and impact velocity. Therefore, the mean strain rate and impact velocity increase, so that micro-cracks inside the sandstone samples are not cracked and expanded in time and the deformation lag phenomenon occurs; therefore, the samples are more compact, and as a result, the compressive strength increases as the mean strain rate increases.
The relationship between the dynamic compressive strength of the prefabricated fractured rock samples and the average strain rate is expressed as a power function, indicating that the dynamic compressive strength has a clear effect on the strain rate, and the fitting relationship is shown in Formula (2):
3.6. Dynamic Strain of Specimen
Dynamic strain is the deformation of an object, which not only changes when it is subjected to an external force, but also changes over time. Under the action of axial compression, the evolution in dynamic strain of the prefabricated fractured rock samples vs. the mean strain rate is illustrated in Figure 10.
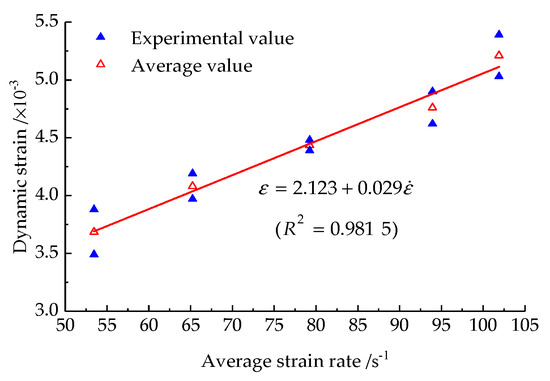
Figure 10.
The evolution in dynamic strain of prefabricated fractured rock samples vs. average strain rate.
In Figure 10, the dynamic strain of the rock samples increases with the growth in the mean strain rate, and the dynamic strain increases approximately linearly with the mean strain rate. A clear strain rate effect is demonstrated.
The dynamic strain of the prefabricated fractured sandstone samples changes linearly with the mean strain rate, and the fitting relationship is shown in Formula (3):
where ε is the dynamic strain of the prefabricated fractured rock samples.
3.7. Dynamic Elastic Modulus of Sample
Under the action of axial compression, the change in the dynamic elastic modulus of the prefabricated fractured rock samples vs. the average strain rate is illustrated in Figure 11.
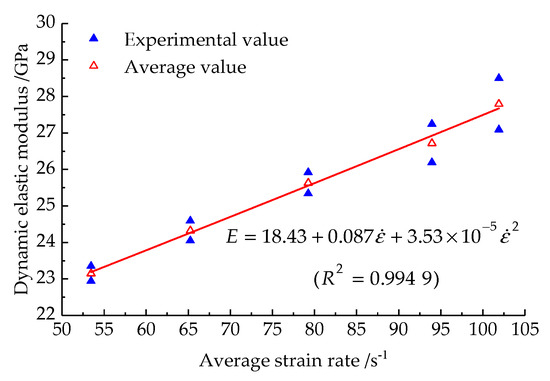
Figure 11.
The evolution in dynamic elastic modulus of prefabricated fractured sandstone samples as average strain rate.
In Figure 11, the dynamic elastic modulus of the prefabricated fractured rock samples grows with the growth in the mean strain rate. The reason is that the mean strain rate grows with the growth in impact pressure. Due to the growth in impact pressure, the interior of the sample is closer and the resistance to deformation is greater, so the dynamic elastic modulus increases.
Formula (4) shows the quadratic function relationship between the mean strain rate and the dynamic elastic modulus of the prefabricated fractured sandstone samples.
where is the dynamic elastic modulus of the prefabricated fractured sandstone specimens.
4. The Fragmentation and Energy Analysis
Dynamic deformation is the change in the shape of an object that occurs when the object is subjected to an external force. The fragments of the sample after the impact test were photographed. Figure 12 illustrates the fracture morphology of the samples under five types of impact pressures. It can be observed that as the impact pressure and incident energy increase, the degree of sandstone fragmentation gradually increases, the scale of the broken pieces reduces, and the amounts of the broken pieces rises.

Figure 12.
Impact fracture morphology of prefabricated fractured sandstone samples.
In aiming to intuitively and quantitatively describe the degree of fragmentation of rock samples, fragments of the impact test samples of sandstone samples with prefabricated cracks are screened and the mean particle size of the fragments is calculated. The results of the screening tests are illustrated in Table 2.

Table 2.
The screening results of fragments after impact failure of prefabricated fractured sandstone samples.
We have used the data collected from the incident, reflected, and transmitted waves to analyze the changes in the energy in the sample, and the energy equation is shown in Equation (5).
where WI(t), WR(t), WT(t), and WD(t) represent incident, reflected, transmitted, and sample absorbed energies, respectively; εI, εR, and εT represent incident, reflected, and transmitted strains, respectively; E0 represents the modulus of elasticity of the compression bar; while C0 represents its longitudinal wave velocity, and A0 represents its cross-sectional area.
WD(t) is the absorbed energy by the specimen, which mainly includes crushing dissipation, ejection kinetic energy, and other dissipation. Crushing accounts for about 95 percent of absorbed energy, and absorbed energy can be an approximate substitute for crushed energy.
Under axial compression, the variation of incident energy with the loading velocity of the prefabricated fractured sandstone samples is illustrated in Figure 13.
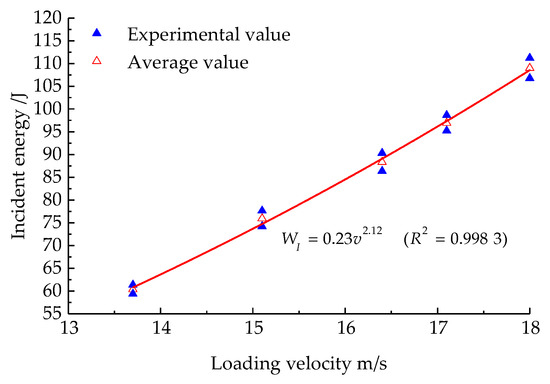
Figure 13.
The change in incident energy of prefabricated fractured sandstone samples with loading velocity.
As the impact loading rate grows, the incident energy grows, and the incident energy of the prefabricated fractured sandstone samples has a power function relationship with the loading velocity, and the fitting relationship is shown in Equation (6):
Under the action of axial compression, Figure 14 illustrates the relationships between the reflection, transmission, and absorption energies of the samples and the incident energy.
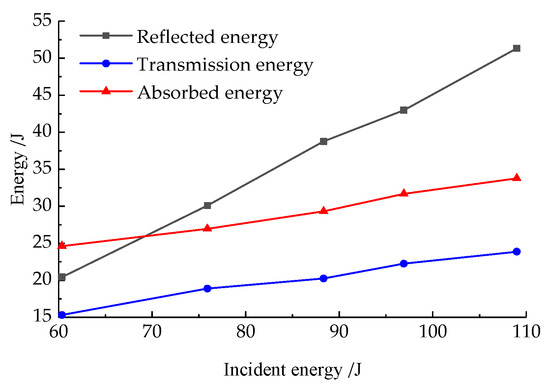
Figure 14.
The change in energy of samples with incident energy.
After impact crushing under different impact pressures, the relationship between the mean particle size of the sample fragments vs. the absorbed energy is illustrated in Figure 15.
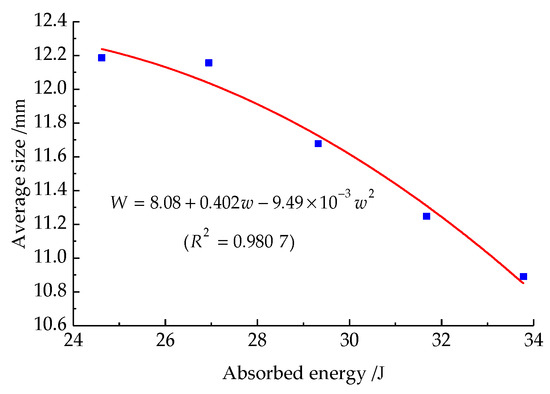
Figure 15.
The change in mean particle size of prefabricated fractured rock samples vs. absorption energy.
Figure 14 and Figure 15 show a decrease in the average particle size of the fractured rock samples after impact as the absorbed energy increases. The reflective, transmitted, and absorbed energies of the samples increase vs. the growth in incident energy. The increase in transmission energy is close to that of absorption energy, and the growth in reflected energy is larger. The reason is that the absorbed energy of the samples is mainly dissipated in the deformation and failure of the rock. Therefore, the greater the energy absorption of the samples, the greater the energy dissipated in their deformation and failure. As a result, the samples produce smaller-scale fragments and show higher rates of being broken.
The mean particle size of sandstone samples is quadratic function with the change in absorption energy. The fitting relationship is illustrated in Formula (7):
where is the average particle size of rock specimens; is the absorbed energy of the specimens.
5. Conclusions
The current method enables a more precise description of the pattern of change and development of the data. Future studies may explore the angular and length variations of the cleavage. In this paper, five loading rate impact tests under preloaded axial pressure were carried out on fissured sandstones containing 45° dips using a combined dynamic–static SHPB test device. The test analyzed the dynamic parameters of the crushed specimens, including dynamic compressive strength, dynamic strain, dynamic modulus of elasticity, strain rate, and average grain size. The energy dissipation characteristics were also examined. The following are the main findings:
- (1)
- Under static and dynamic combination conditions, the dynamic stress–strain curves of sandstone specimens were basically similar when loaded with five impact rates, which were mainly divided into three stages, which are elasticity, yielding, and damage. As the loading rate increases, the stress–strain curve of the specimen shifts to the upper right.
- (2)
- Five types of impact loading air pressure were used to drive the impact bar to accelerate the impact on the incoming bar, and the impact loading rates were 13.7 m/s, 15.1 m/s, 16.4 m/s, 17.1 m/s, and 18 m/s, respectively. The strain rate in the sandstone specimens grew from 53.5 s−1 to 101.9 s−1, with an increase of 90.6%, and the strain rate was quadratically related to the shock loading pressure.
- (3)
- Significant strain rate effects were observed on the dynamic compressive strength, dynamic strain, and dynamic modulus of elasticity of the sandstone samples. As the strain rate of the specimen increased, the dynamic compressive strength of the specimen increased from 74.02 MPa to 99.26 MPa, which was enhanced by a power function relationship; the dynamic strain increased linearly from 3.69 × 10⁻³ to 5.21 × 10⁻³; the dynamic modulus of elasticity increased quadratically from 23.15 GPa to 27.80 GPa.
- (4)
- When the loading rate increases, the incident energy increases as a power function. The sample’s reflected, transmitted, and absorbed energies all increase with the incident energy. When the incident energy grew from 60.4 J to 109 J, the reflected energy increased from 20.4 J to 51.3 J, an increase of 151.5%; transmitted energy increased from 15.3 J to 23.9 J, an increase of 56.2%; the energy absorbed by the sample increased from 24.6 J to 33.8 J, an increase of 37.4%.
- (5)
- The degree of the sandstone fragmentation gradually increases with increasing loading rate and incident energy, as evidenced by a decrease in the scale of the fragments and an increase in the number of fragments. When loaded at five impact rates, the average crushed specimen sizes were 12.19 mm, 12.16 mm, 11.68 mm, 11.25 mm, and 10.89 mm. Specimen absorption energy is mainly used for deformation damage of the rock; the more intense the specimen is broken, the more absorption energy is required.
Author Contributions
Conceptualization, Q.P.; software, S.S.; formal analysis, X.L.; investigation, S.W.; data curation, J.H.; writing—original draft, Y.X.; writing—review and editing, Y.X. All authors have read and agreed to the published version of the manuscript.
Funding
National Natural Science Foundation of China: no. 52074005 and no. 52074006; the Anhui Natural Science Foundation: no. 1808085ME134; the Anhui Postdoctoral Science Foundation: no. 2015B058.
Institutional Review Board Statement
Not applicable.
Informed Consent Statement
All participants in the study agreed.
Data Availability Statement
The corresponding author can provide the data that support the findings of this study upon request.
Acknowledgments
Thanks to the editors and experts for their valuable comments.
Conflicts of Interest
The authors declare no conflicts of interest.
References
- Yuan, L. Cracking the major scientific and technological difficulties of deep coal mining thoughts and suggestions. Sci. Technol. Rev. 2016, 34, 1. [Google Scholar]
- Wang, W.; Wang, H.P.; Wang, S.; Zhang, B.; Wang, P.; Gu, S.T. Development and application of rock mechanics experimental system with multi strain rate dynamic and static superposition. Chin. J. Rock Mech. Eng. 2023, 42, 1680–1694. [Google Scholar] [CrossRef]
- Swan, G.; Cook, J.; Bruce, S.; Meehan, R. Strain rate effects in Kimmeridge bay shale. Int. J. Rock Mech. Min. Sci. 1989, 26, 135–149. [Google Scholar] [CrossRef]
- Li, Z.Y.; Zhu, Y.H.; Song, Q.H.; Wang, P.Y.; Liu, D.Y. Dynamic mechanical properties and failure characteristics of sandstone with pre-flaws parallel to the loading direction. Sustainability 2023, 15, 3587. [Google Scholar] [CrossRef]
- Wang, T.; Elsworth, D.; He, Y.; Zhao, X.Y.; Wang, S.F.; Xu, D.P.; Lei, M. Impact of loading rate on the mechanical behavior of jointed rock. Geomech. Geophys. Geo-Energy Geo-Resour. 2023, 9, 127. [Google Scholar] [CrossRef]
- Xiao, P.; Gao, Z.; Shuang, H.Q.; Wu, M.C.; Cheng, Y.Y.; Guo, C.H. Analysis of coal fracture evolution characteristics under different loading rates. China Saf. Sci. J. 2022, 32, 65–73. [Google Scholar] [CrossRef]
- Bahaaddini, M.; Sharrock, G.; Hebblewhite, B.K. Numerical investigation of the effect of joint geometrical parameters on the mechanical properties of a non-persistent jointed rock mass under uniaxial compression. Comput. Geotech. 2013, 49, 206–225. [Google Scholar] [CrossRef]
- Wang, X.Q.; Chen, B.; Wu, S.J.; Zhao, Y.M.; Wang, Z.Z.; Dong, Z. Study on the mechanical properties of rocks with cross cracks under different loading rates. Min. Res. Dev. 2023, 43, 104–112. [Google Scholar] [CrossRef]
- Bobet, A.; Einstein, H.H. Fracture coalescence in rock-type materials under uniaxial and biaxial compression. Int. J. Rock Mech. Min. Sci. 1998, 35, 863. [Google Scholar] [CrossRef]
- Wasantha, P.L.P.; Ranjith, P.G.; Zhao, J.; Shao, S.S.; Permata, G. Strain rate effect on the mechanical behaviour of sandstones with different grain sizes. Rock Mech. Rock Eng. 2015, 48, 1883–1895. [Google Scholar] [CrossRef]
- Fujii, Y.; Ishijima, Y. Consideration of fracture growth from an inclined slit and inclined initial fracture at the surface of rock and mortar in compression. Int. J. Rock Mech. Min. Sci. 2004, 41, 1035–1041. [Google Scholar] [CrossRef]
- Kang, Y.M.; Gu, J.; Wei, M.Q. Mechanical properties and acoustic emission characteristics of soft-hard interbedded rocks under different loading rates. J. Northeast. Univ. (Nat. Sci.) 2023, 44, 399–407. [Google Scholar] [CrossRef]
- Ping, Q.; Luo, X.; Ma, Q.Y.; Yuan, P. Broken energy dissipation characteristics of sandstone specimens under impact loads. Chin. J. Rock Mech. Eng. 2015, 34, 4197–4203. [Google Scholar] [CrossRef]
- Li, Q.W.; Gao, S.L.; Huang, X. Study on damage evolution of coal samples based on loading rate effect. Saf. Coal Mines 2023, 54, 105–115. [Google Scholar] [CrossRef]
- Li, K.; Yu, W.J.; Liao, Z.; Guo, H.X.; Khamphouvanh, V.; Yang, J. A laboratory-testing-based study on mechanical properties and dilatancy characteristics of deeply buried mudstone under different stress loading rates. J. China Coal Soc. 2023, 48, 3360–3371. [Google Scholar] [CrossRef]
- Selahattin, A.; Murat, K.; Giang, D.N.; Abbas, T.; Zhang, Q.B.; Zhao, J. Dynamic response and fracture characteristics of thermally-treated granite under dynamic loading. Int. J. Rock Mech. Min. Sci. 2023, 170, 105482. [Google Scholar] [CrossRef]
- Alam, M.S.; Chakraborty, T.; Matsagar, V.; Rao, K.S.; Sharma, P.; Singh, M. Characterization of kota sandstone under different strain rates in uniaxial loading. Geotech. Geol. Eng. 2015, 33, 143–152. [Google Scholar] [CrossRef]
- Brown, E.T.; Trollope, D.H. Strength of a model of jointed rock. J. Soil Mech. Found. Div. 1970, 96, 685–704. [Google Scholar] [CrossRef]
- Brown, E.T. Strength of models of rock with intermittent joints. J. Soil Mech. Found. Div. 1970, 96, 1935–1949. [Google Scholar] [CrossRef]
- Liu, S.H.; Qin, Z.H.; Lou, J.F. Experimental study of dynamic failure characteristics of coal-rock compound under one-dimensional static and dynamic loads. Chin. J. Rock Mech. Eng. 2014, 33, 2064–2075. [Google Scholar] [CrossRef]
- Du, C.C.; Wen, S.; Kong, Q.M. Tests for dynamic mechanical properties of composite rock samples under 1-D dynamic-static combined loading. J. Vib. Shock 2021, 40, 168–178+206. [Google Scholar] [CrossRef]
- Pan, J.F.; Liu, S.H.; Yang, L.; Wang, S.W.; Zhang, C.Y. Experimental study of dynamic characteristics of coal under static and dynamic loads. J. China Univ. Min. Technol. 2018, 47, 206–212. [Google Scholar] [CrossRef]
- Wang, W.; Li, H.M.; Yuan, R.F.; Gu, H.L.; Wang, C.; Li, H.G. Micromechanics analysis and mechanical characteristics of water-saturated coal samples under coupled static-dynamic loads. J. China Coal Soc. 2016, 41, 611–617. [Google Scholar] [CrossRef]
- Wang, X.Y.; Li, Q.; Wang, W.; Zhang, M.T.; Wang, Q.Z. Numerical simulation of damage evolution of sandstone under combined dynamic and static loading. Sci. Technol. Eng. 2022, 22, 6248–6254. [Google Scholar] [CrossRef]
- Chen, J.X.; Zeng, B.Q.; Zhang, J.W. Influence of loading and unloading effect on mechanical properties of impact rock under impact load. J. China Coal Soc. 2023, 1–16. [Google Scholar] [CrossRef]
- Ren, Z.W.; Wang, J.; Ning, J.G.; Shi, X.S.; Yang, S.; Gao, M.T. Test study on mechanical response and energy evolution of coal body under dynamic and static combined loading. Min. Res. Dev. 2023, 43, 108–115. [Google Scholar] [CrossRef]
- Fan, W.B.; Zhang, J.W.; Dong, X.K.; Zhang, Y.; Yang, Y.; Zeng, W.G.; Wang, S.Y. Fractal dimension and energy-damage evolution of deep-bedded sandstone under one-dimensional dynamic and static combined loading. Geomech. Geophys. Geo-Energy Geo-Resour. 2022, 8, 177. [Google Scholar] [CrossRef]
- Ma, S.S.; Chen, W.Z.; Zhao, W.S. Experimental study on energy dissipation of granite subjected to three-dimensional coupled static and dynamic loading. J. Shandong Univ. (Eng. Sci.) 2019, 49, 95–102. [Google Scholar] [CrossRef]
- Fang, Z.H.; Ping, Q.; Zhang, H. Experimental study on mechanical properties of limestone under combined one-dimensional static and dynamic loading. J. Anhui Univ. Sci. Technol. (Nat. Sci.) 2018, 38, 36–41. [Google Scholar] [CrossRef]
- Dai, B.; Zhao, G.F.; Zhang, L.; Liu, Y.; Zhang, Z.J.; Luo, X.Y.; Chen, Y. Energy dissipation of rock with different parallel flaw inclinations under dynamic and static combined loading. Mathematics 2022, 10, 4082. [Google Scholar] [CrossRef]
- Wu, Y.Z.; Sun, Z.Y.; Fu, Y.K. Mechanical properties and energy dissipation laws of coal samples with different length-to-diameter ratios under 3D coupled static and dynamic loads. Chin. J. Rock Mech. Eng. 2022, 41, 877–888. [Google Scholar] [CrossRef]
- Wang, T.; Song, Z.P.; Yang, J.Y.; Wang, J.B.; Zhang, X.G. Experimental research on dynamic response of red sandstone soil under impact loads. Geomech. Eng. 2019, 17, 393–403. [Google Scholar] [CrossRef]
- Anna, B.; Aleksei, V.C.; Andrey, G.C.; Ralf, M. Quantifying non-ergodic dynamics of force-free granular gases. Phys. Chem. Chem. Phys. PCCP 2015, 17, 21791–21798. [Google Scholar] [CrossRef]
- Tan, B.; Xu, H.; Jin, J.F.; Yu, X. Effect of dynamic load and water content on dynamic strength and deformation of red sandstone. Min. Res. Dev. 2023, 43, 164–171. [Google Scholar] [CrossRef]
- Wong, R.H.C.; Chau, K.T.; Tang, C. Analysis of crack coalescence in rock-like materials containing three flaws part I: Experimental approach. Int. J. Rock Mech. Min. Sci. 2001, 38, 909–924. [Google Scholar] [CrossRef]
- Hui, G.; Chen, Z.X.; Wang, Y.J.; Zhang, D.M.; Gu, F. An integrated machine learning-based approach to identifying controlling factors of unconventional shale productivity. Energy 2023, 266, 126512. [Google Scholar] [CrossRef]
- Kong, X.W.; Wang, P.; Xia, Z.H.; Zhang, X.L.; Qu, L.C.; Guo, Z.K. Geological characteristics and fluid distribution of the upper devonian duvernay shale in simonette block in the western canada sedimentary basin. China Pet. Explor. 2022, 27, 93–107. [Google Scholar] [CrossRef]
- Ulusay, R. The ISRM Suggested Methods for Rock Characterization, Testing and Monitoring: 2007–2014; Springer International Publishing: Cham, Switzerland, 2015; pp. 51–68. [Google Scholar] [CrossRef]
- T/CSRME 001-2019; Technical Specification for Testing Method of Rock Dynamic Properties. Chinese Society for Rock Mechanics & Engineering: Beijing, China, 2019.
Disclaimer/Publisher’s Note: The statements, opinions and data contained in all publications are solely those of the individual author(s) and contributor(s) and not of MDPI and/or the editor(s). MDPI and/or the editor(s) disclaim responsibility for any injury to people or property resulting from any ideas, methods, instructions or products referred to in the content. |
© 2024 by the authors. Licensee MDPI, Basel, Switzerland. This article is an open access article distributed under the terms and conditions of the Creative Commons Attribution (CC BY) license (https://creativecommons.org/licenses/by/4.0/).