
A Cost-Effective Earthquake Disaster Assessment Model for Power Systems Based on Nighttime Light Information

 ,
,
Abstract
1. Introduction
2. Data and Methods
2.1. Study Area and Data
2.1.1. Remote Sensing Data
2.1.2. Earthquake Event Data
2.1.3. Other Data
2.2. Extraction of the Module Samples
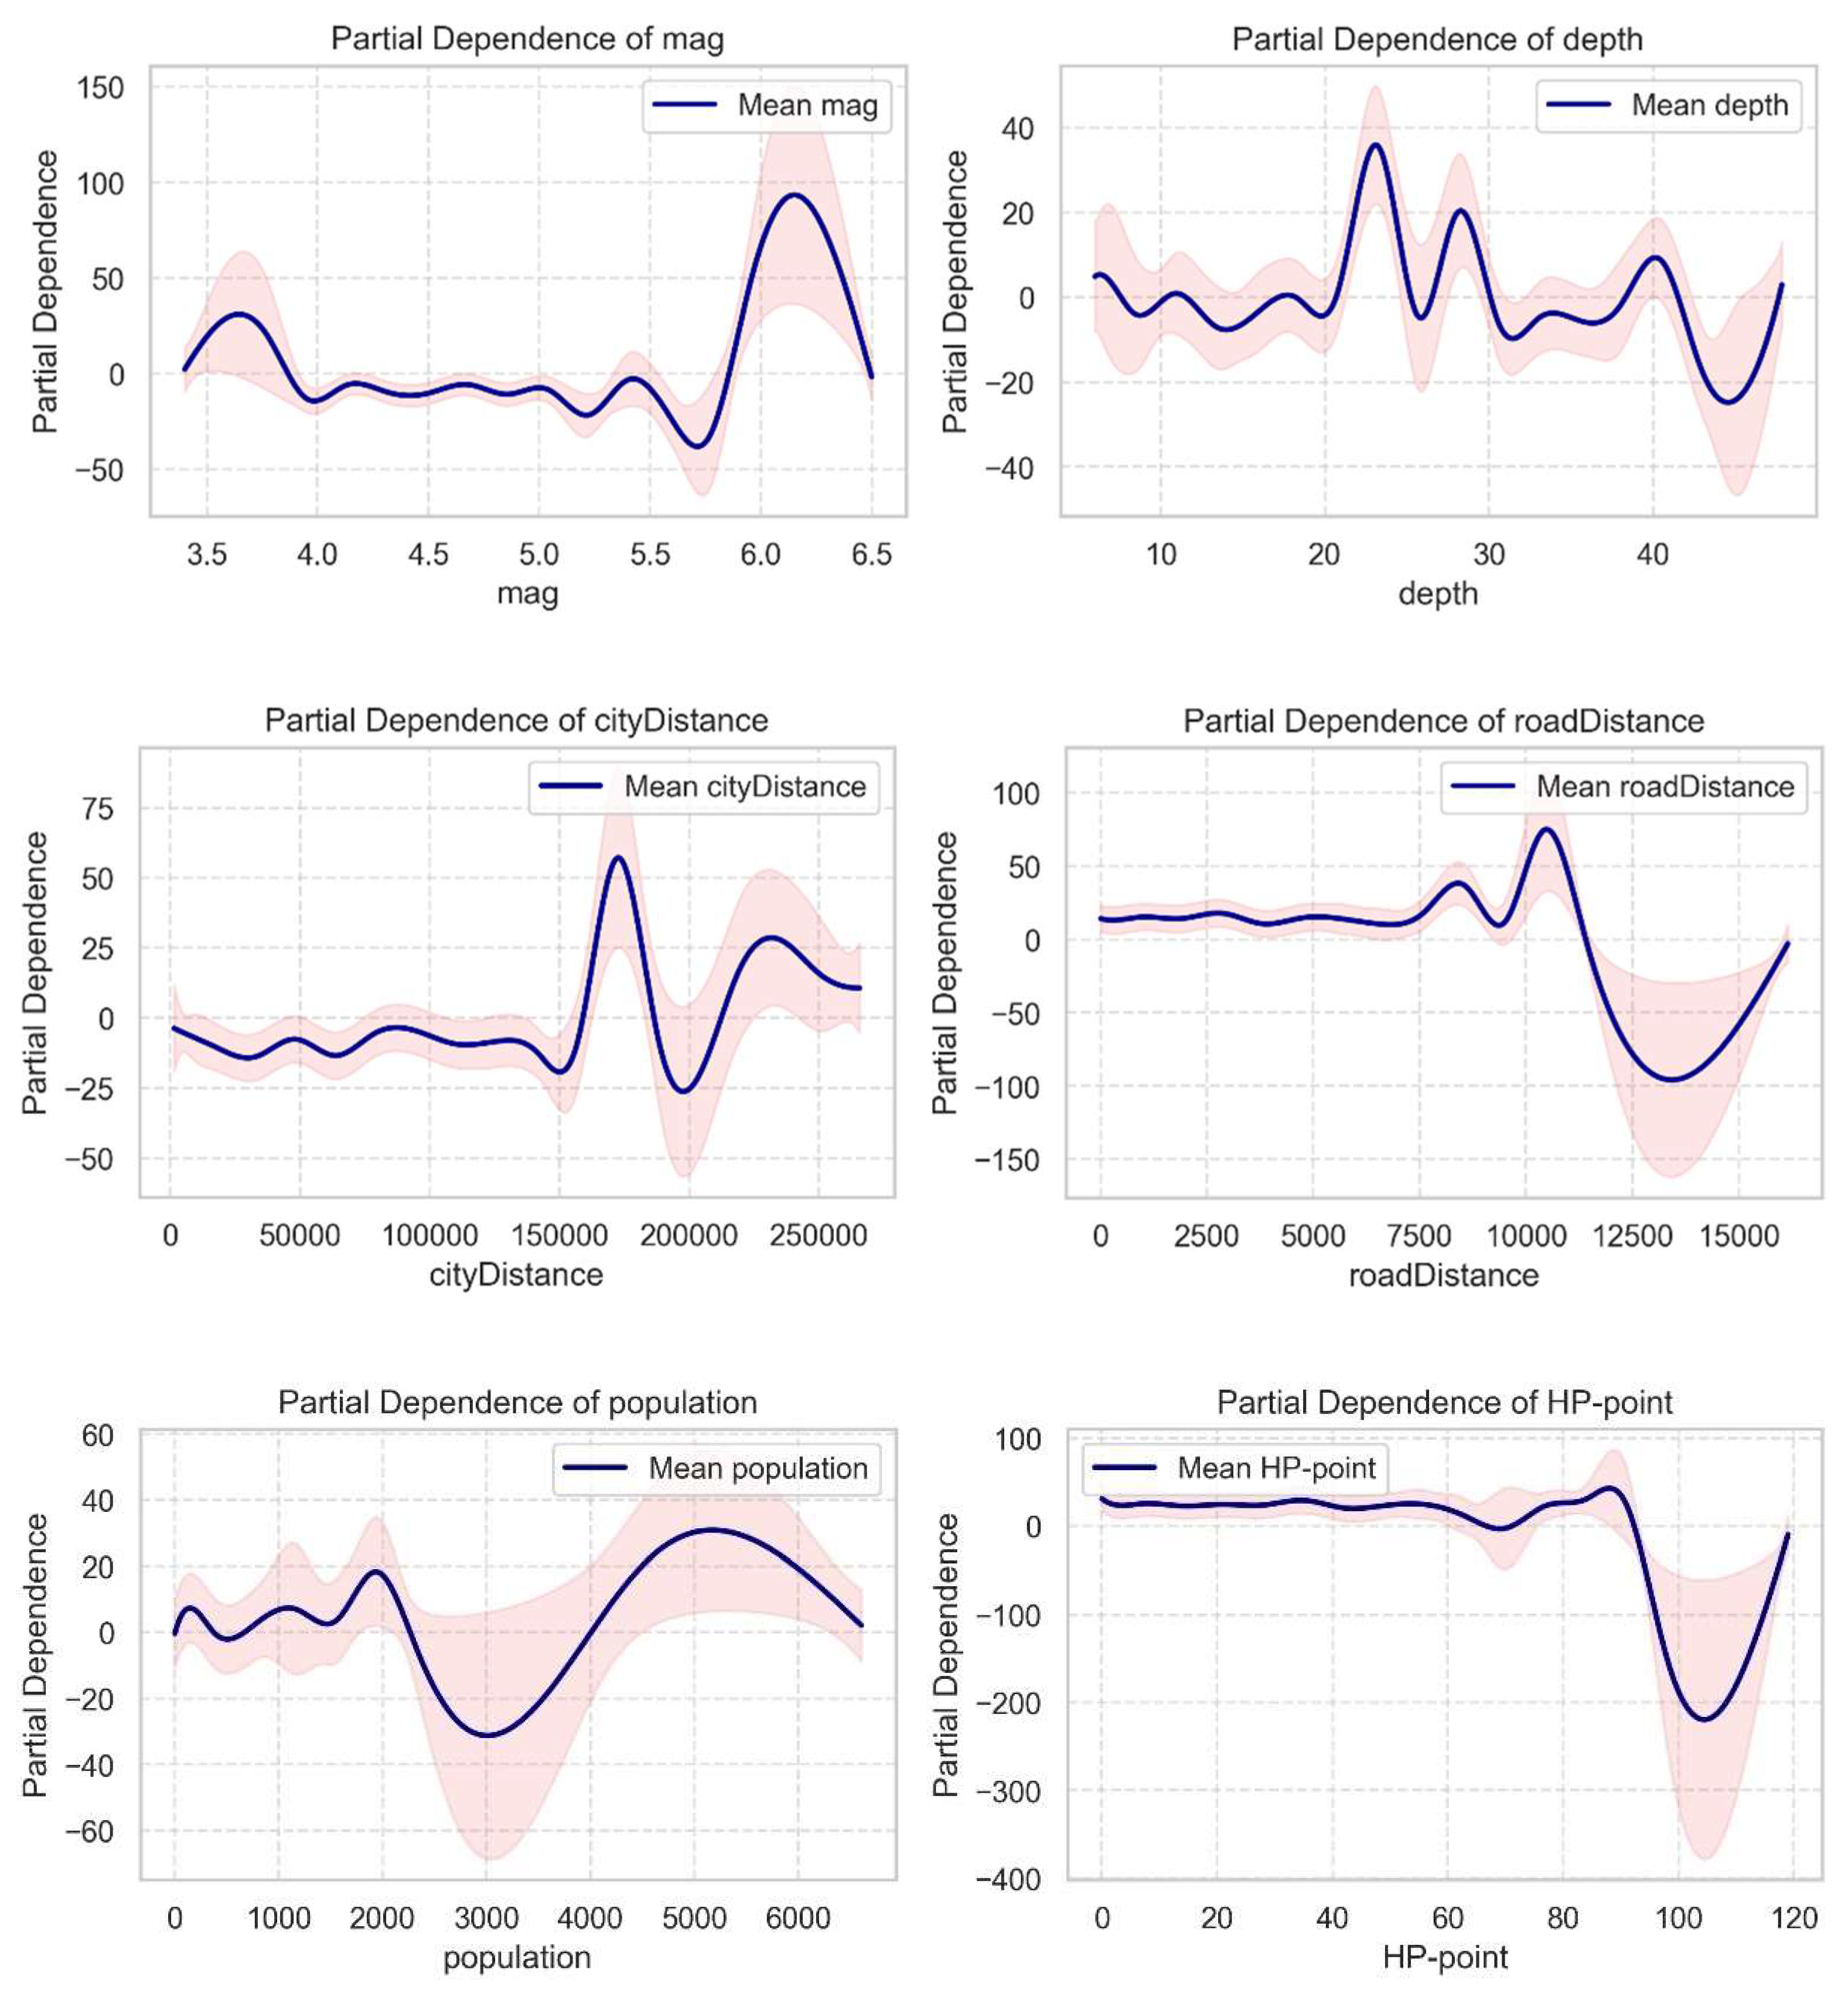
2.3. Relevance Evaluation
- (a)
- Magnitude of the earthquake (mag);
- (b)
- Depth of the earthquake (depth);
- (c)
- The closest distance from the epicenter of the earthquake to the three-level road network (roadDistance);
- (d)
- The nearest distance from the epicenter of the earthquake to the surrounding cities (cityDistance);
- (e)
- The identification of whether the time of earthquake is day or night (DorN);
- (f)
- The population within the earthquake-affected zone (population);
- (g)
- The number of human residential points within the earthquake-affected zone (HR-point).
3. Modeling and Results
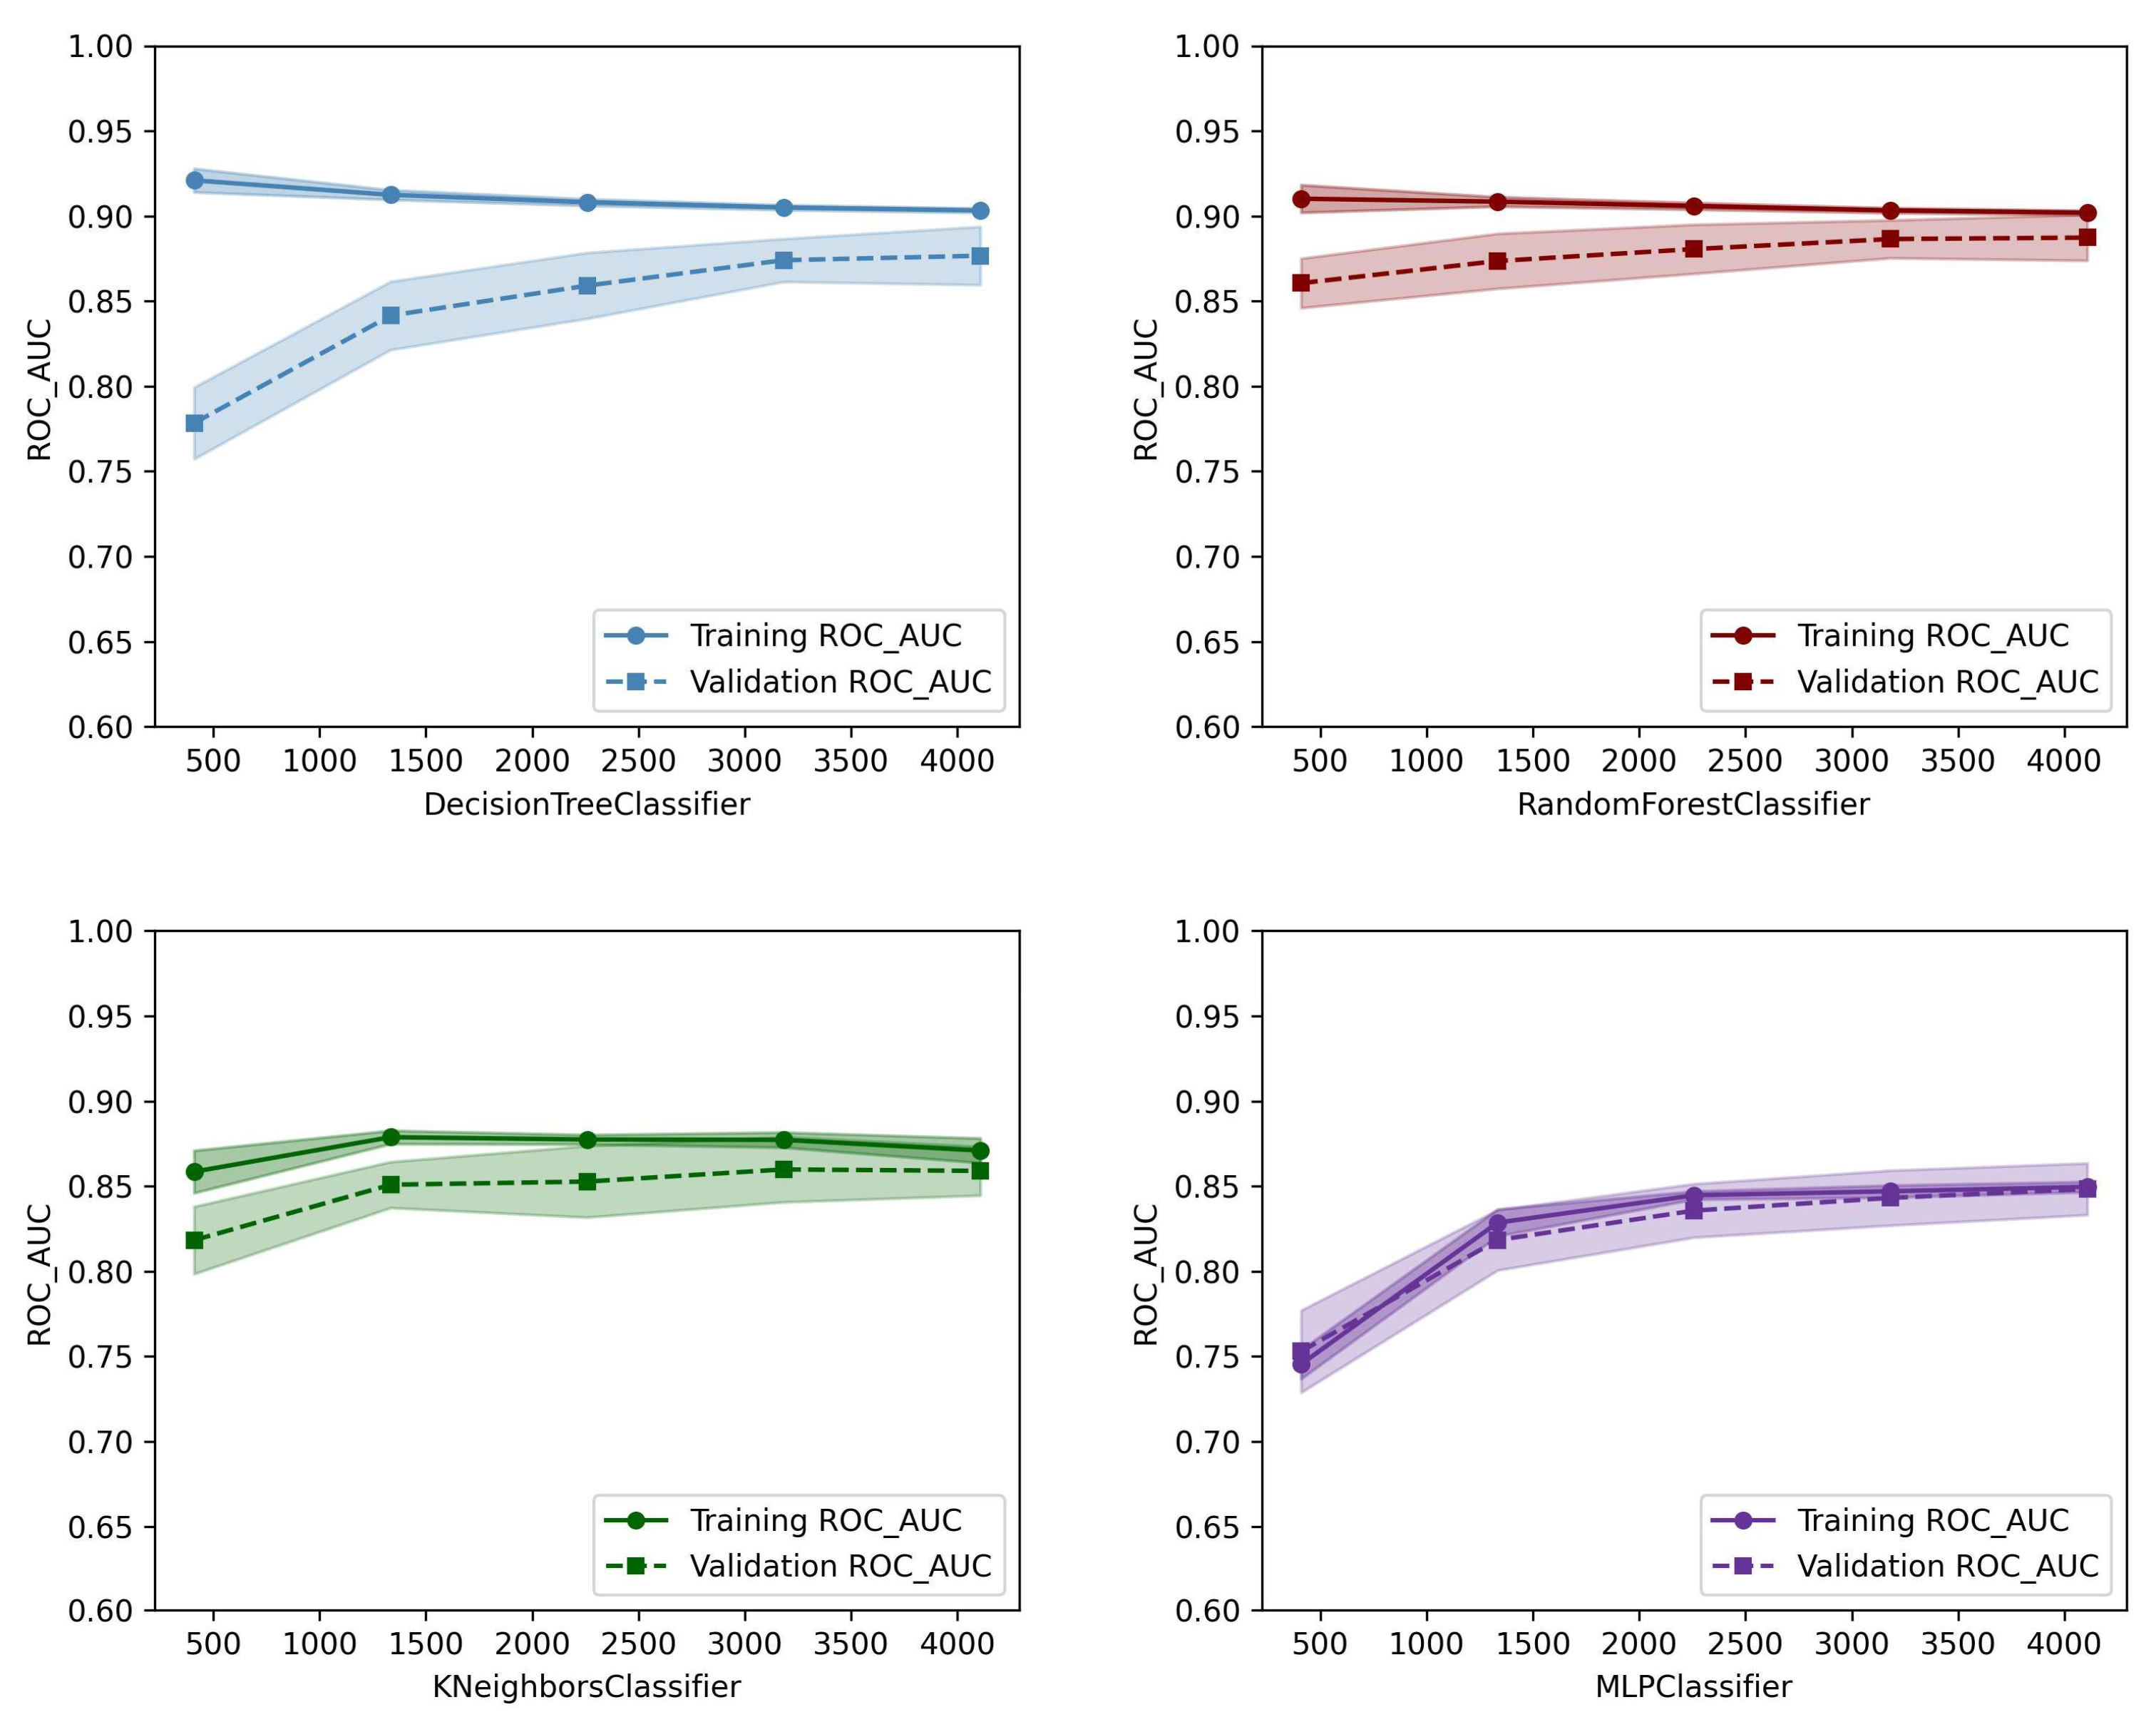
3.1. Development and Assessment of PSVE Model
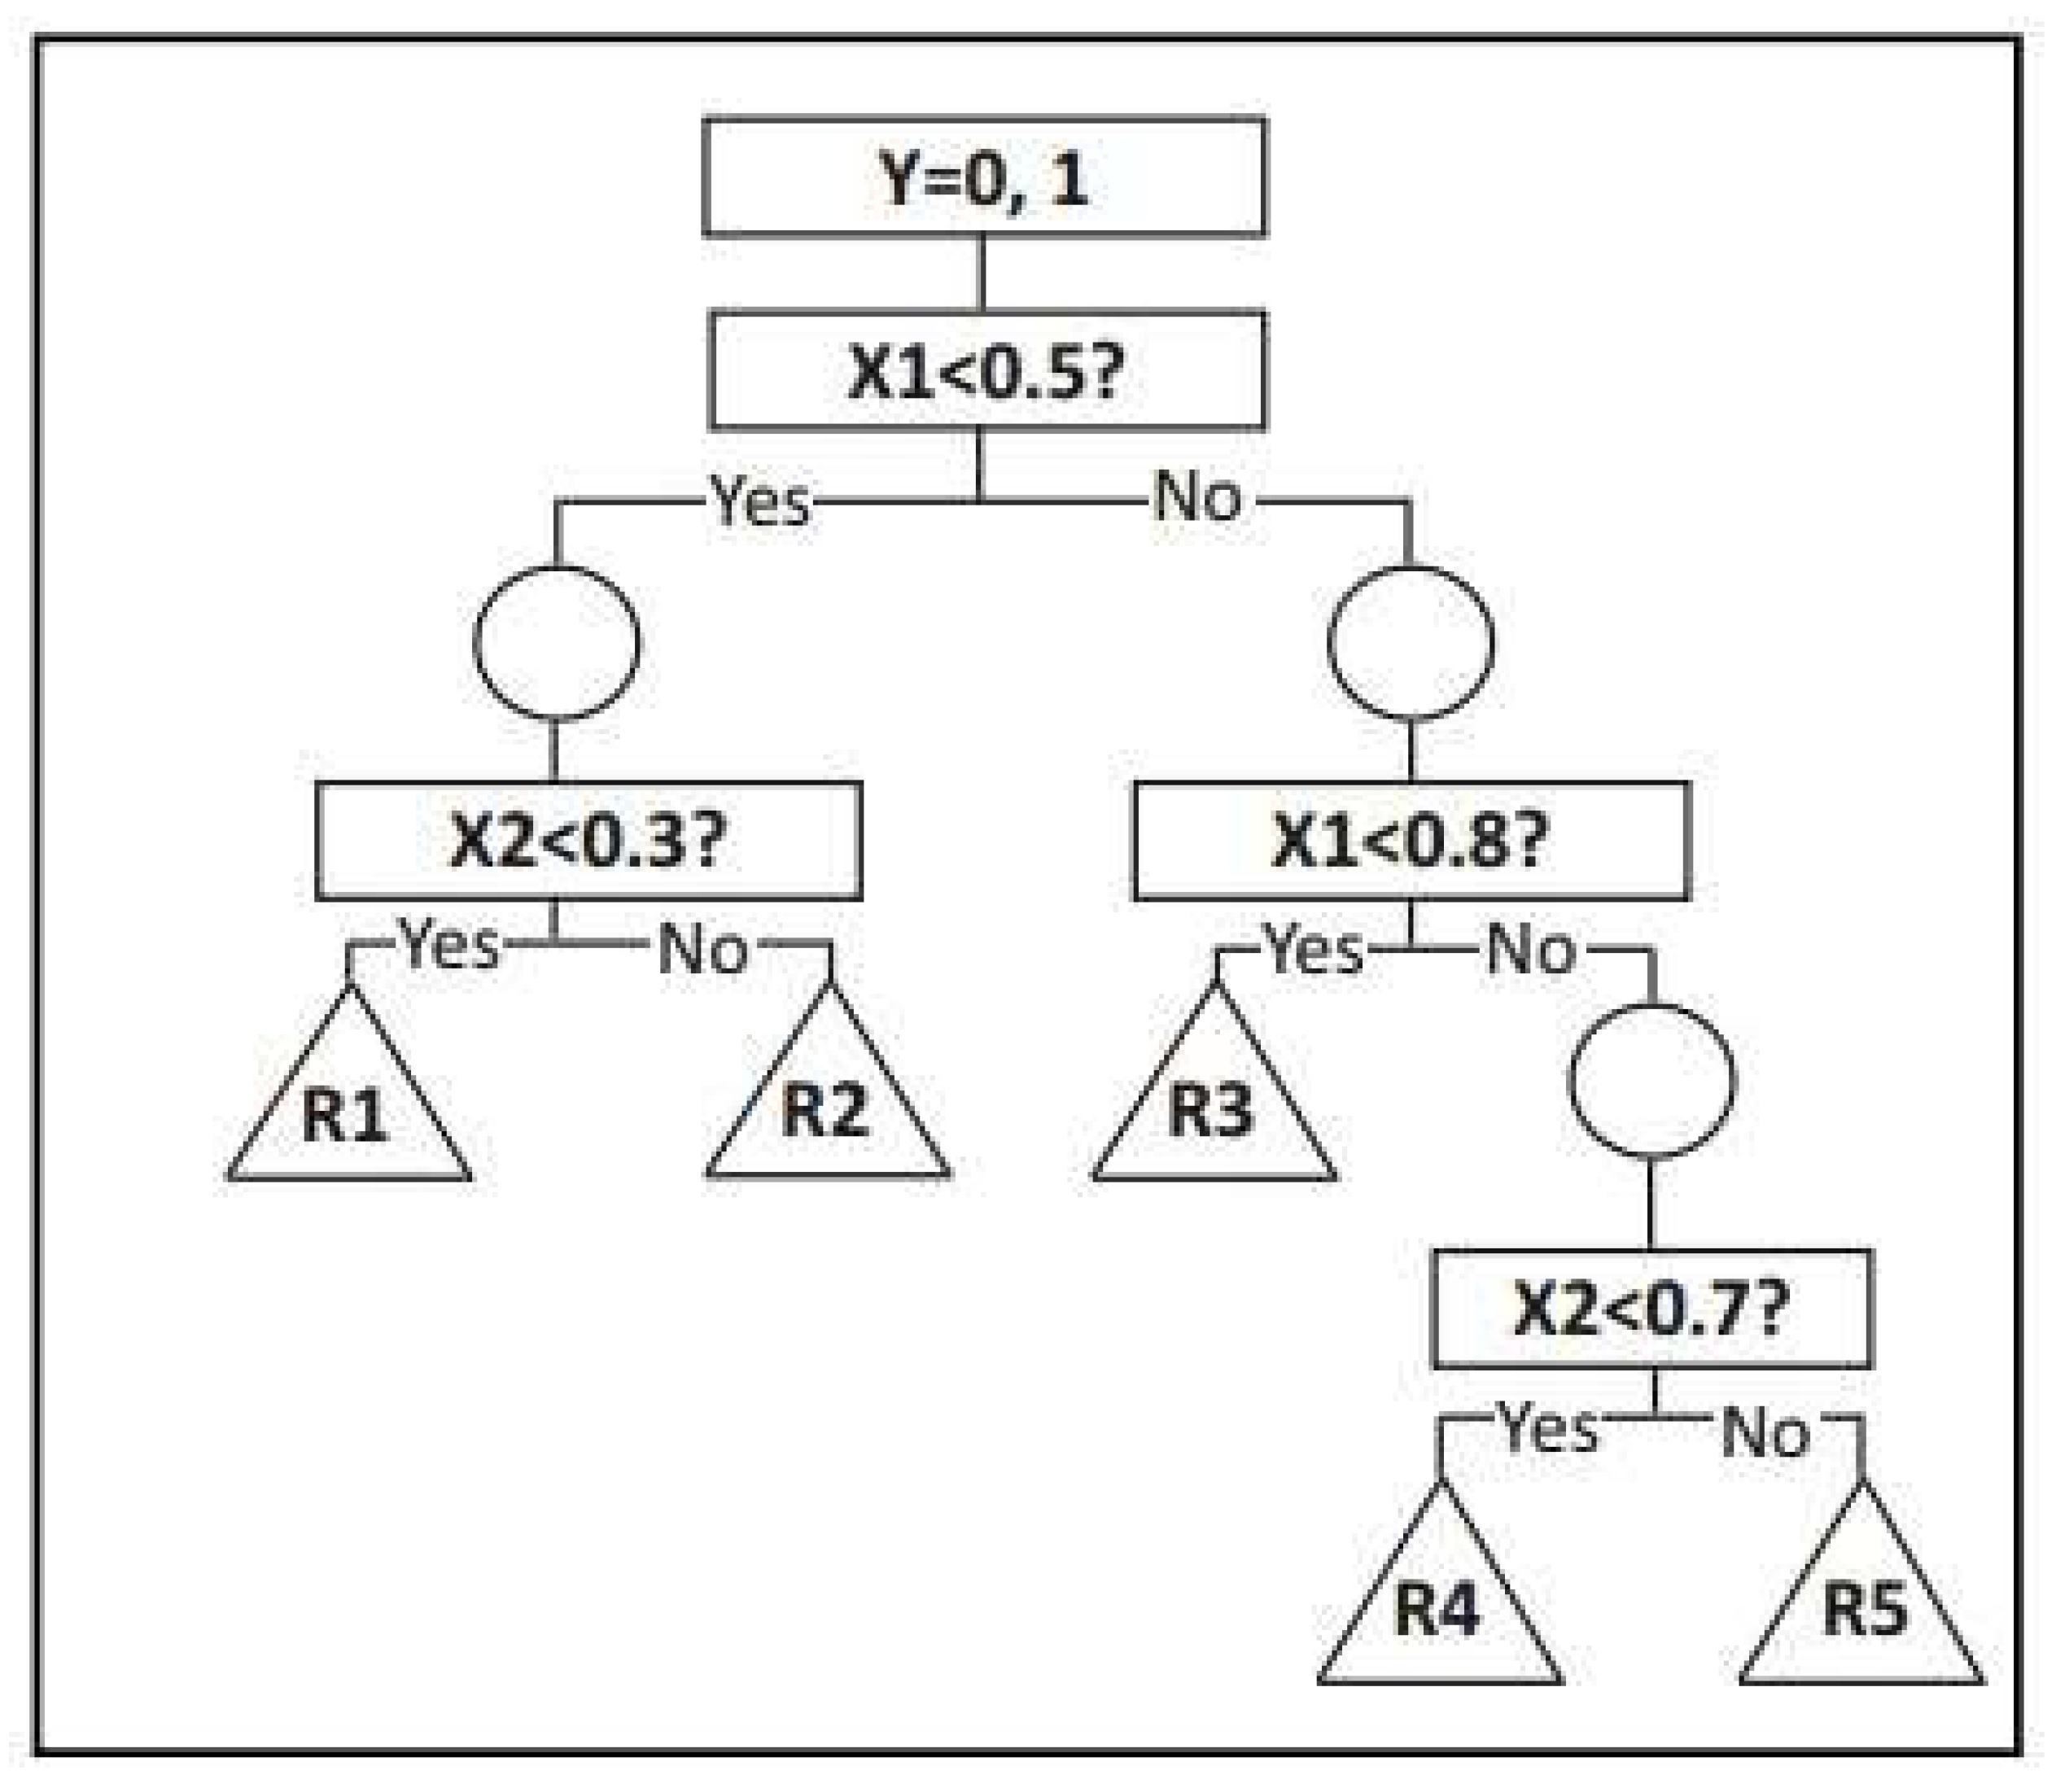
- DT is a hierarchical structure where each internal node represents an attribute-based judgment; in binary prediction tasks, the ultimate objective is to assign data points to one of two categories. The training of a decision tree specifically involves the segmentation decision of the tree. Figure 3 shows a simple decision tree model [30] consisting of a single binary target variable Y (0 or 1) and two continuous variables X1 and X2, ranging from 0 to 1. The main components of the decision tree model are nodes and branches, and the most important steps to build the model are splitting, stopping and pruning. The most important part is feature selection, which is related to the degree of “purity” of the resulting child nodes and is used to choose between different potential input variables. These features include entropy, Gini index, classification error, information gain, gain ratio, and two criteria.
- 2.
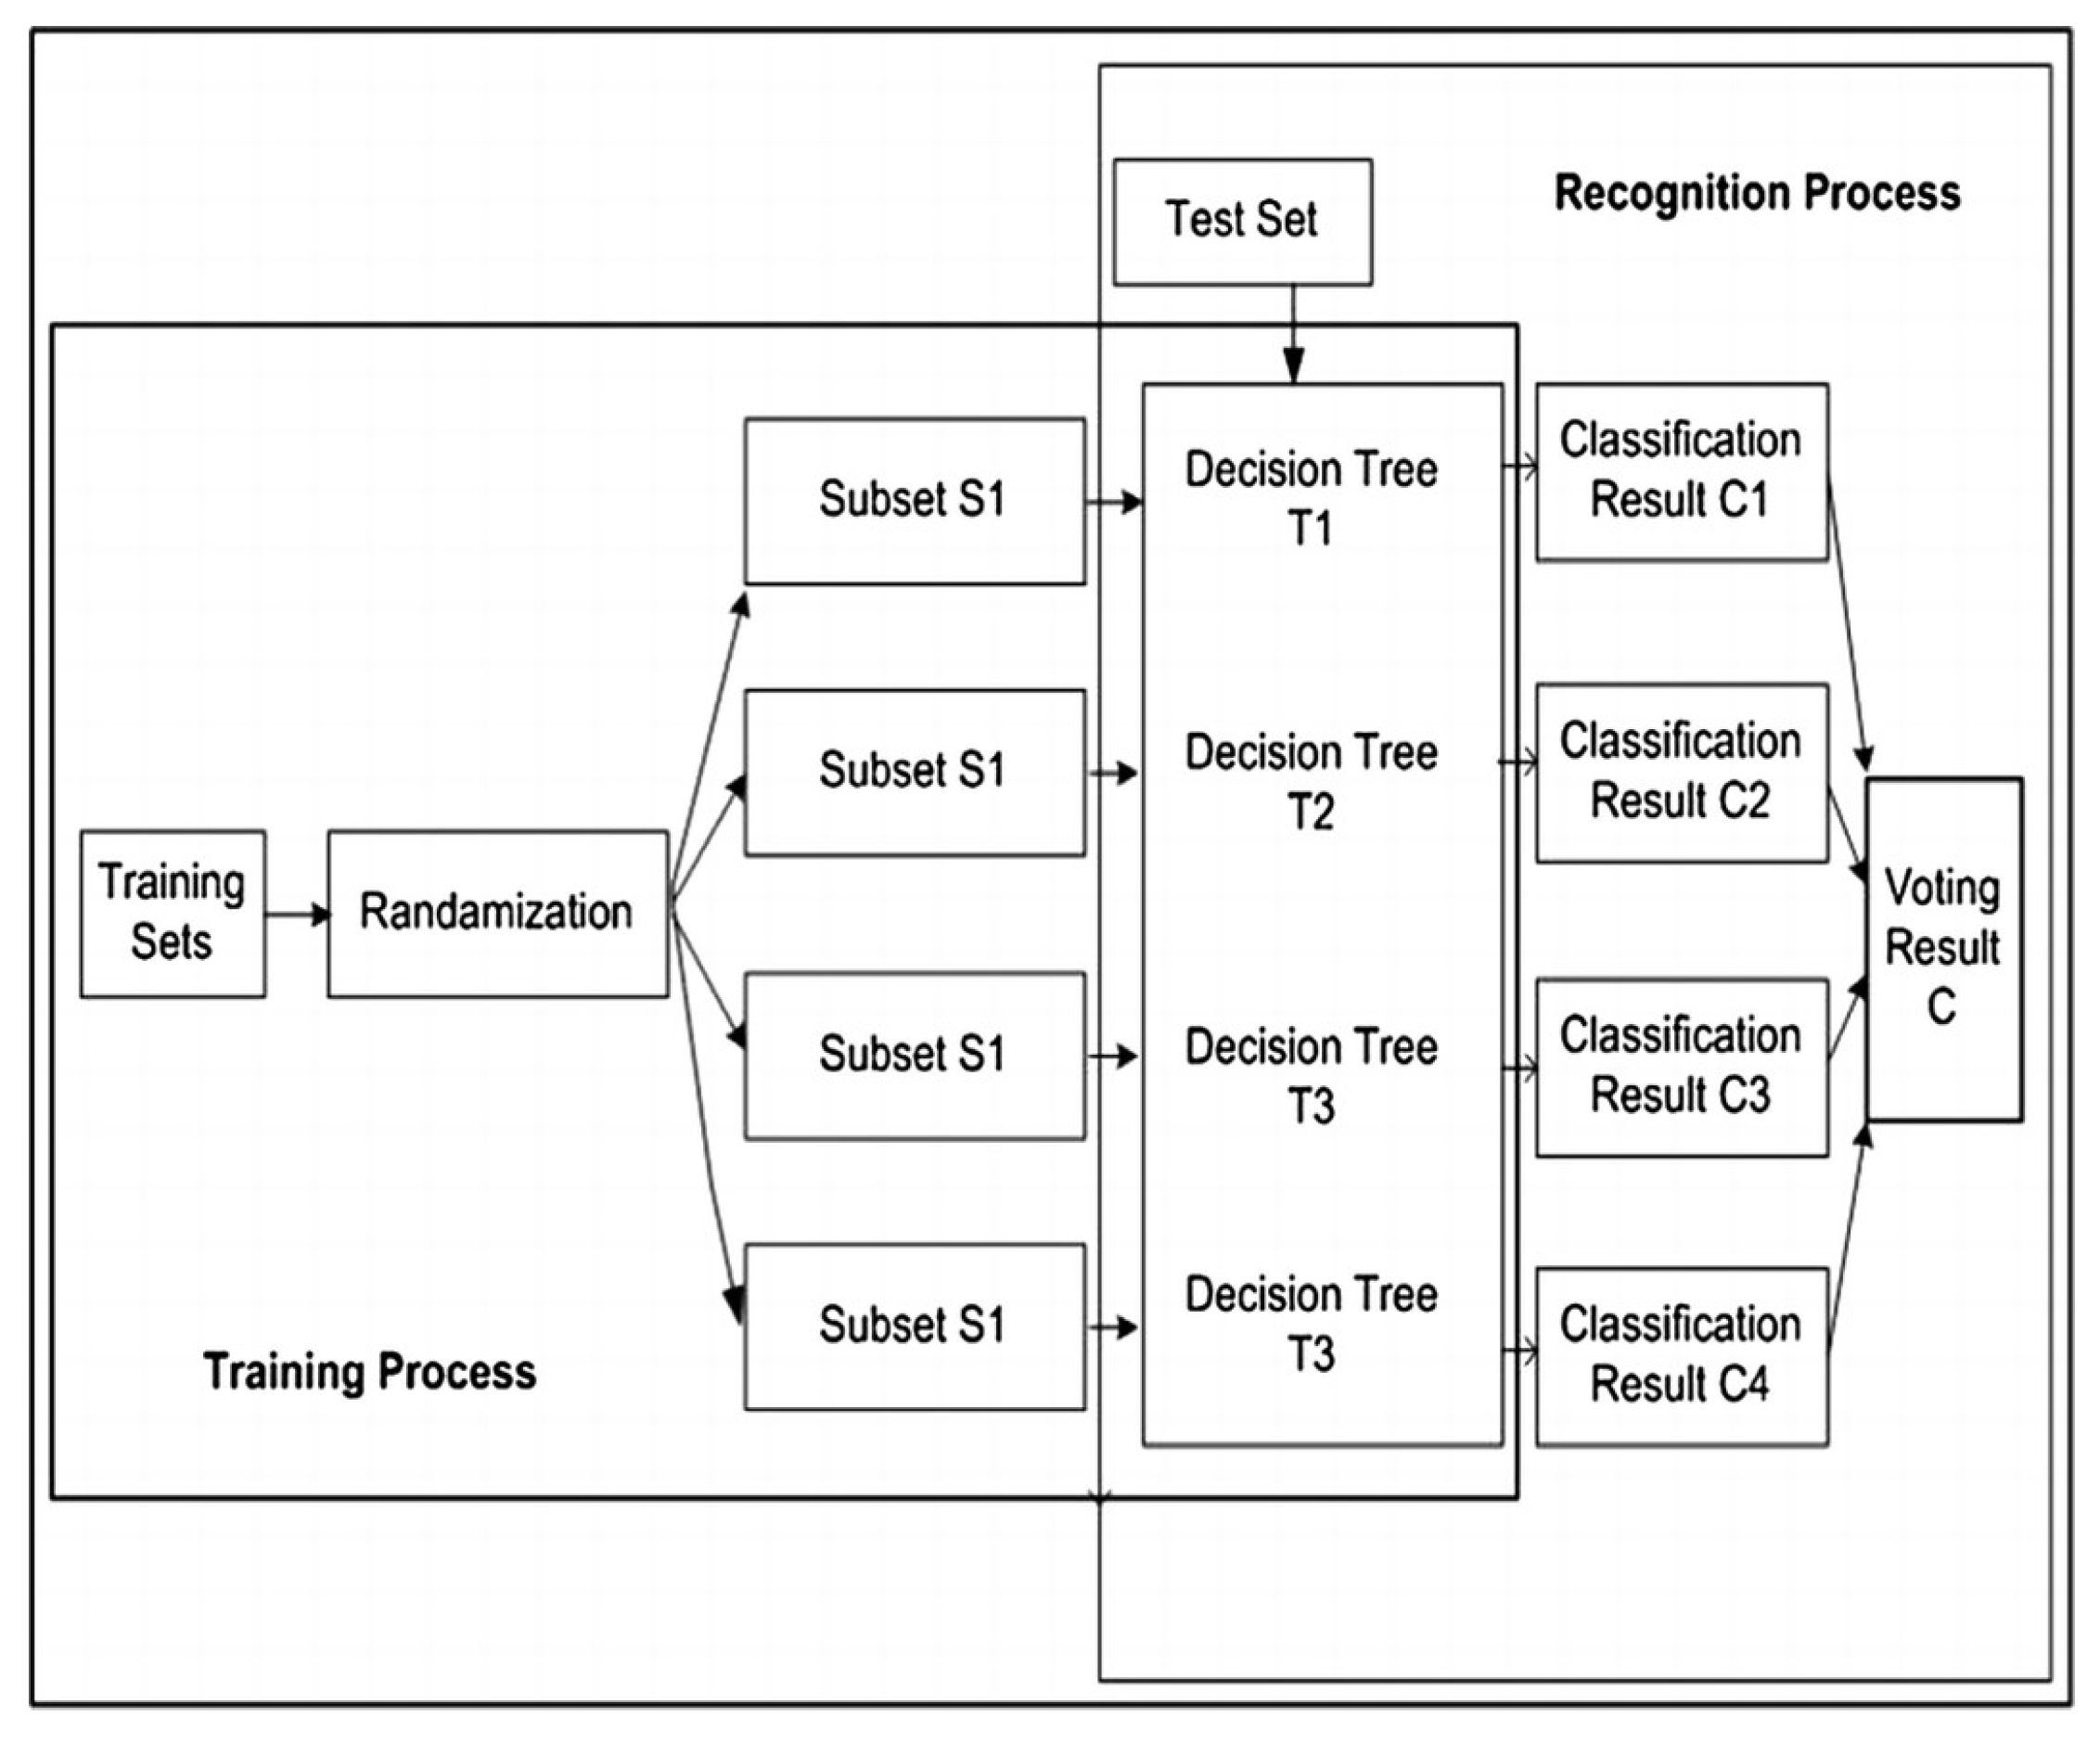
- RF is an ensemble learning algorithm based on decision trees, aiming to enhance prediction accuracy by constructing multiple decision trees and aggregating their predictions [31]. As is shown in Figure 4, it achieves this by randomly selecting subsets of features from the dataset for training individual decision trees, which may yield different prediction results. For a new data point, each tree provides a prediction result. The final classification result in random forest is determined through a voting mechanism, where the category with the highest number of votes becomes the predicted result.
- 3.
- KNN is an instance-based learning method that classifies instances by measuring distances between feature values. It does not involve explicit training but rather stores training datasets only. During prediction, given a new data point, KNN identifies the closest K points in the dataset; the classification decision is based on the distance measurement, and the formula is:
- 4.
- As shown in Figure 5, MLP refers to a feedforward artificial neural network comprising an input layer, one or more hidden layers, and an output layer; every layer consists of multiple neurons interconnected via weighted connections between adjacent layers [32]. Applying certain thresholds or activation functions at various nodes within MLP’s architecture determines its categorization assignment. MLP uses backpropagation and gradient descent to update the weights to implement the training process, which can be expressed as:
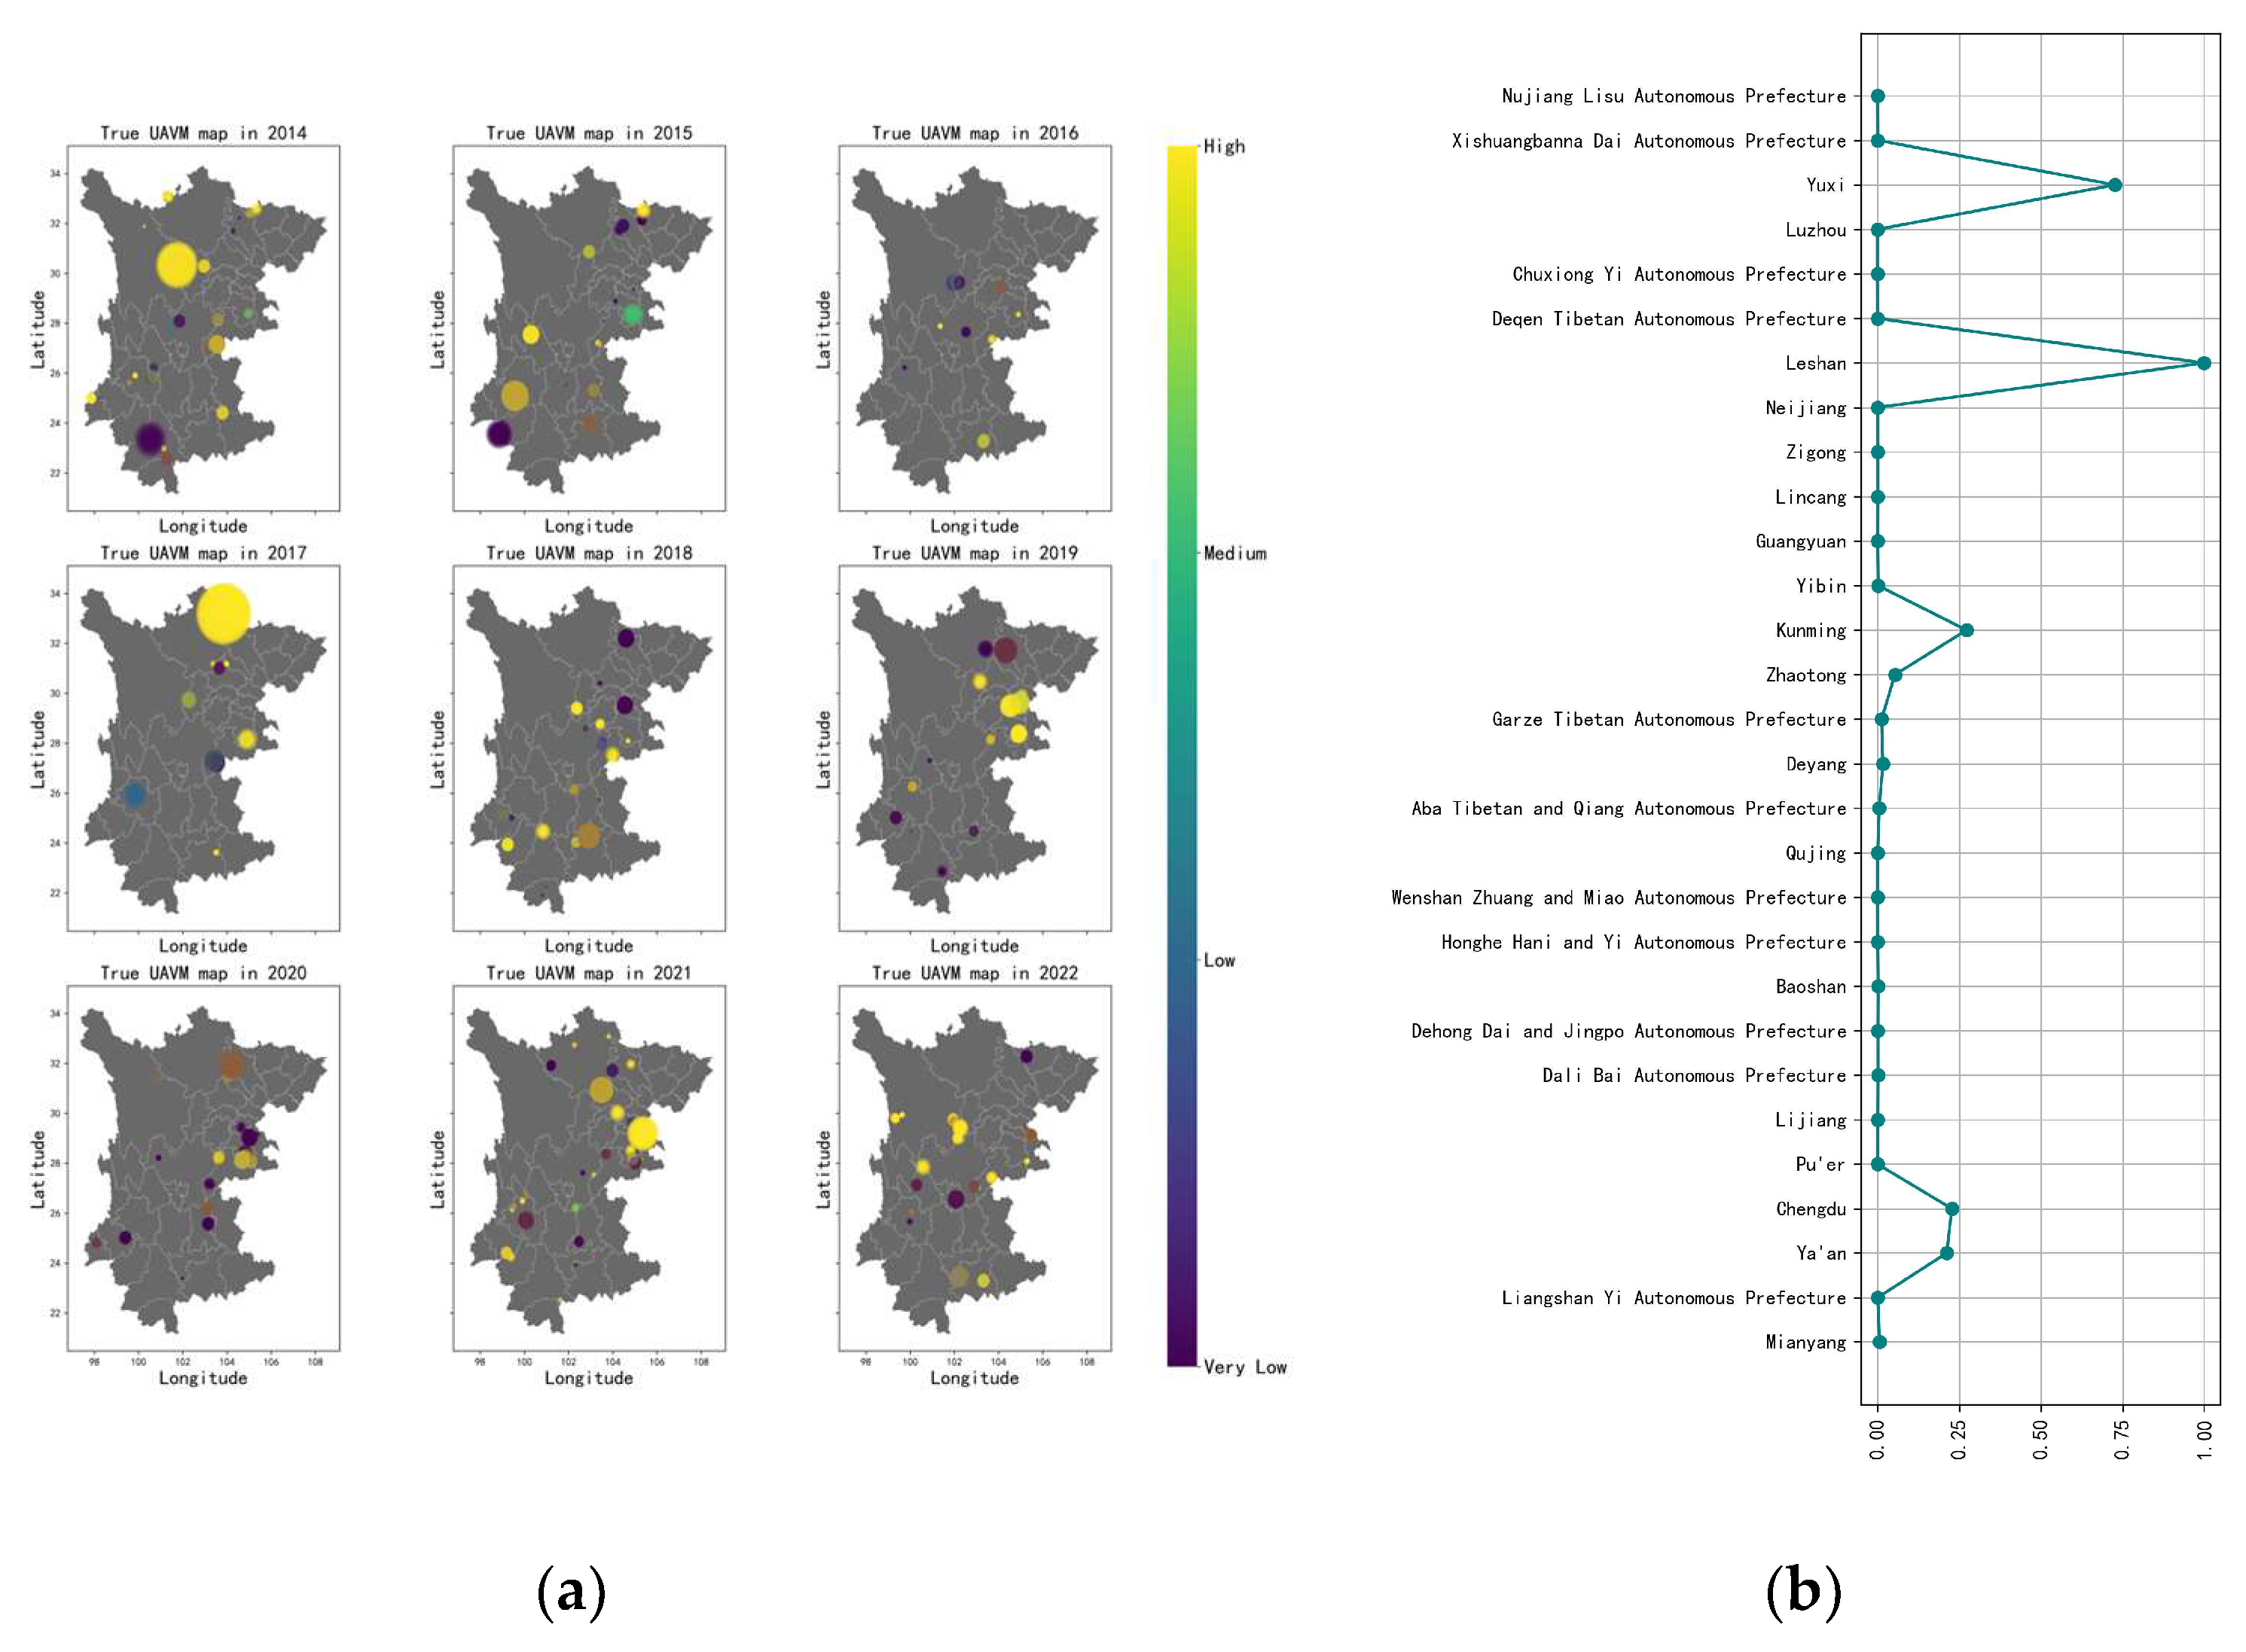
3.2. Development of the NTL Attenuation Map
4. Conclusions
Author Contributions
Funding
Institutional Review Board Statement
Informed Consent Statement
Data Availability Statement
Acknowledgments
Conflicts of Interest
References
- Zhang, B. Current Status and Future Prospects of Remote Sensing. Bull. Chin. Acad. Sci. 2017, 32, 774–784. [Google Scholar]
- Georgios, K.; Stamatios, C.; Elisabeth, K.; Irem, T.Z. Power Grid Recovery after Natural Hazard Impact; Joint Research Center: Brussels, Belgium, 2017. [Google Scholar]
- Waseem, M.; Manshadi, S.D. Electricity grid resilience amid various natural disasters: Challenges and solutions. Electr. J. 2020, 33, 106864. [Google Scholar] [CrossRef]
- Zhao, X.; Yu, B.; Liu, Y.; Yao, S.; Lian, T.; Chen, L.; Yang, C.; Chen, Z.; Wu, J. NPP-VIIRS DNB Daily Data in Natural Disaster Assessment: Evidence from Selected Case Studies. Remote Sens. 2018, 10, 1526. [Google Scholar] [CrossRef]
- Sun, Y.; Xie, J.; Wang, Y.; Chan, T.O.; Sun, Z.-Y. Mapping local-scale working population and daytime population densities using points-of-interest and nighttime light satellite imageries. Geo-Spat. Inf. Sci. 2023. [Google Scholar] [CrossRef]
- Dell’Acqua, F.; Bignami, C.; Chini, M.; Lisini, G.; Polli, D.A.; Stramondo, S. Earthquake damages rapid mapping by satellite remote sensing data: L’Aquila April 6th, 2009 event. IEEE J. Sel. Top. Appl. Earth Obs. Remote Sens. 2011, 4, 935–943. [Google Scholar] [CrossRef]
- Levin, N.; Kyba, C.C.M.; Zhang, Q.; Sánchez de Miguel, A.; Román, M.O.; Li, X.; Portnov, B.A.; Molthan, A.L.; Jechow, A.; Miller, S.D.; et al. Remote sensing of night lights: A review and an outlook for the future. Remote Sens. Environ. 2020, 237, 111443. [Google Scholar] [CrossRef]
- Gillespie, T.W.; Frankenberg, E.; Fung Chum, K.; Thomas, D. Night-time lights time series of tsunami damage, recovery, and economic metrics in Sumatra, Indonesia. Remote Sens. Lett. 2014, 5, 286–294. [Google Scholar] [CrossRef]
- Ouyang, M. Comparisons of purely topological model, betweenness based model and direct current power flow model to analyze power grid vulnerability. Chaos Interdiscip. J. Nonlinear Sci. 2013, 23, 10. [Google Scholar] [CrossRef] [PubMed]
- Bompard, E.; Pons, E.; Wu, D. Extended topological metrics for the analysis of power grid vulnerability. IEEE Syst. J. 2012, 6, 481–487. [Google Scholar] [CrossRef]
- Bompard, E.; Wu, D.; Xue, F. Structural vulnerability of power systems: A topological approach. Electr. Power Syst. Res. 2011, 81, 1334–1340. [Google Scholar] [CrossRef]
- Fan, B.; Shu, N.; Li, Z.; Li, F. Critical Nodes Identification for Power Grid Based on Electrical Topology and Power Flow Distribution. IEEE Syst. J. 2022, 17, 4874–4884. [Google Scholar] [CrossRef]
- Cardoni, A.; Cimellaro, G.; Domaneschi, M.; Sordo, S.; Mazza, A. Modeling the interdependency between buildings and the electrical distribution system for seismic resilience assessment. Int. J. Disaster Risk Reduct. 2020, 42, 101315. [Google Scholar] [CrossRef]
- Cui, H.; Qiu, S.; Wang, Y.; Zhang, Y.; Liu, Z.; Karila, K.; Jia, J.; Chen, Y. Disaster-Caused Power Outage Detection at Night Using VIIRS DNB Images. Remote Sens. 2023, 15, 640. [Google Scholar] [CrossRef]
- Liu, L.; Li, Z.; Fu, X.; Liu, X.; Li, Z.; Zheng, W. Impact of power on uneven development: Evaluating built-up area changes in Chengdu based on NPP-VIIRS images (2015–2019). Land 2022, 11, 489. [Google Scholar] [CrossRef]
- Li, S.; Cheng, L.; Liu, X.; Mao, J.; Wu, J.; Li, M. City type-oriented modeling electric power consumption in China using NPP-VIIRS nighttime stable light data. Energy 2019, 189, 116040. [Google Scholar] [CrossRef]
- Shi, K.; Yu, B.; Huang, Y.; Hu, Y.; Yin, B.; Chen, Z.; Chen, L.; Wu, J. Evaluating the ability of NPP-VIIRS nighttime light data to estimate the gross domestic product and the electric power consumption of China at multiple scales: A comparison with DMSP-OLS data. Remote Sens. 2014, 6, 1705–1724. [Google Scholar] [CrossRef]
- He, Y.; Wang, X.; Li, D.; Xie, Z.; Chai, C. Typhoon disaster damage assessment and disaster situation web visu-alization based on NPP-VIIRS nighttime light remote sensing. In Proceedings of the AIIPCC 2021: The Second International Conference on Artificial Intelligence, Information Processing and Cloud Computing, Hangzhou, China, 26–28 June 2021; pp. 1–8. [Google Scholar]
- Cuong Nhu, N.; Noy, I. Measuring the impact of insurance on urban earthquake recovery using nightlights. J. Econ. Geogr. 2020, 20, 857–877. [Google Scholar] [CrossRef]
- Bertinelli, L.; Strobl, E. Quantifying the Local Economic Growth Impact of Hurricane Strikes: An Analysis from Outer Space for the Caribbean. J. Appl. Meteorol. Climatol. 2013, 52, 1688–1697. [Google Scholar] [CrossRef]
- Wang, J.; Zhang, J.; Gong, L.; Li, Q.; Zhou, D. Indirect seismic economic loss assessment and recovery evaluation using nighttime light images–application for Wenchuan earthquake. Nat. Hazards Earth Syst. Sci. 2018, 18, 3253–3266. [Google Scholar] [CrossRef]
- Li, S.; Sun, D.; Goldberg, M.D.; Sjoberg, B.; Santek, D.; Hoffman, J.P.; DeWeese, M.; Restrepo, P.; Lindsey, S.; Holloway, E. Automatic near real-time flood detection using Suomi-NPP/VIIRS data. Remote Sens. Environ. 2018, 204, 672–689. [Google Scholar] [CrossRef]
- Elvidge, C.; Baugh, K.; Hobson, V.; Kihn, E.; Kroehl, H. Detection of fires and power outages using DMSP-OLS data. Remote Sens. Chang. Detect. Environ. Monit. Methods Appl. 1998, 123, 135. [Google Scholar]
- Proville, J.; Zavala-Araiza, D.; Wagner, G. Night-time lights: A global, long term look at links to socio-economic trends. PLoS ONE 2017, 12, e0174610. [Google Scholar] [CrossRef] [PubMed]
- Zhang, Z.; Bai, Z.; Wang, C.; Teng, J.; Lü, Q.; Li, J.; Liu, Y.; Liu, Z. The crustal structure under Sanjiang and its dynamic implications: Revealed by seismic reflection/refraction profile between Zhefang and Binchuan, Yunnan. Sci. China Ser. D Earth Sci. 2005, 48, 1329–1336. [Google Scholar] [CrossRef]
- Miller, S.D.; Straka, W.; Mills, S.P.; Elvidge, C.D.; Lee, T.F.; Solbrig, J.; Walther, A.; Heidinger, A.K.; Weiss, S.C. Illuminating the Capabilities of the Suomi National Polar-Orbiting Partnership (NPP) Visible Infrared Imaging Radiometer Suite (VIIRS) Day/Night Band. Remote Sens. 2013, 5, 6717–6766. [Google Scholar] [CrossRef]
- Elvidge, C.D.; Baugh, K.E.; Zhizhin, M.; Hsu, F.-C. Why VIIRS data are superior to DMSP for mapping nighttime lights. Proc. Asia-Pac. Adv. Netw. 2013, 35, 62. [Google Scholar] [CrossRef]
- Liao, C.; Ding, X. Nonstandard finite difference variational integrators for nonlinear Schrödinger equation with variable coefficients. Adv. Differ. Equ. 2013, 2013, 12. [Google Scholar] [CrossRef]
- Beck, N.; Jackman, S. Beyond linearity by default: Generalized additive models. Am. J. Political Sci. 1998, 42, 596–627. [Google Scholar] [CrossRef]
- Song, Y.-Y.; Ying, L. Decision tree methods: Applications for classification and prediction. Shanghai Arch. Psychiatry 2015, 27, 130. [Google Scholar]
- Parmar, A.; Katariya, R.; Patel, V. A review on random forest: An ensemble classifier. In Proceedings of the International Conference on Intelligent Data Communication Technologies and Internet of Things (ICICI) 2018, Coimbatore, India, 7–8 August 2018; pp. 758–763. [Google Scholar]
- Isa, I.S.; Saad, Z.; Omar, S.; Osman, M.K.; Ahmad, K.A.; Sakim, H.A.M. Suitable MLP Network Activation Functions for Breast Cancer and Thyroid Disease Detection. In Proceedings of the 2010 Second International Conference on Computational Intelligence, Modelling and Simulation, Bali, Indonesia, 28–30 September 2010. [Google Scholar]
- Wang, C.; Feng, K.; Zhang, H.; Li, Q. Seismic performance assessment of electric power systems subjected to spatially correlated earthquake excitations. Struct. Infrastruct. Eng. 2019, 15, 351–361. [Google Scholar] [CrossRef]
- Johnson, B.; Chalishazar, V.; Cotilla-Sanchez, E.; Brekken, T.K. A Monte Carlo methodology for earthquake impact analysis on the electrical grid. Electr. Power Syst. Res. 2020, 184, 106332. [Google Scholar] [CrossRef]
- Sarreshtehdari, A.; Elhami Khorasani, N.; Coar, M. A streamlined approach for evaluating post-earthquake performance of an electric network. Sustain. Resilient Infrastruct. 2020, 5, 232–251. [Google Scholar] [CrossRef]
- Çağnan, Z.; Davidson, R.A.; Guikema, S.D. Post-earthquake restoration planning for Los Angeles electric power. Earthq. Spectra 2006, 22, 589–608. [Google Scholar] [CrossRef]
- Cagnan, Z. Post-Earthquake Restoration Modeling for Critical Lifeline Systems; Cornell University: Ithaca, NY, USA, 2005. [Google Scholar]
- Fan, X.; Nie, G.; Deng, Y.; An, J.; Zhou, J.; Li, H. Rapid detection of earthquake damage areas using VIIRS nearly constant contrast night-time light data. Int. J. Remote Sens. 2019, 40, 2386–2409. [Google Scholar] [CrossRef]
- Kearney, M.; Porter, W. Mechanistic niche modelling: Combining physiological and spatial data to predict species’ ranges. Ecol. Lett. 2009, 12, 334–350. [Google Scholar] [CrossRef]
- Toma-Danila, D.; Armas, I.; Tiganescu, A. Network-risk: An open GIS toolbox for estimating the implications of transportation network damage due to natural hazards, tested for Bucharest, Romania. Nat. Hazards Earth Syst. Sci. 2020, 20, 1421–1439. [Google Scholar] [CrossRef]


| Name | Format | Time | Resolution | Source |
|---|---|---|---|---|
| NPP-VIIRS | Image | 2013/01/01—2023/10/31 | 500 m | NOAA |
| Earthquake catalogue | csv | 2013/01/01—2023/10/31 | None | USGS |
| Administrative division | shapefile | 2022 | 1:4,000,000 | National Basic Geographic Information Center |
| road | grid | 2022 | 1000 m | Provincial official website |
| Human residential data | shp | 2023 | 1 m | OpenStreetMap |
| LandScan dataset | TIFImage.Document | 2013–2022 | 1000 m | Oak Ridge National Laboratory |
| Statistical yearbook of urban area | excel | 2013–2022 | None | Local government official website |
| Parameter and Results | DT | RF | KNN | MLP |
|---|---|---|---|---|
| Parameter 1 | Max_depth 1: [8, 10, 12, 14, 16] | Max_depth1: [8, 10, 12, 14, 16] | N_neighbors 5: [13, 14, 15, 16, 17] | Activate 7: [‘relu’, ’ tanh’] |
| Parameter 2 | Min_samples_leaf 2: [4, 6, 8, 10, 12] | Min_samples_leaf 2: [3, 4, 5, 6, 7] | Weights 6: [‘uniform’, ‘distance’] | Hidden layer sizes 8: (10, 50, 100) |
| Parameter 3 | Min_sample_split 3: [4, 5, 6, 7, 8] | Min_sample split 3: [4, 5, 6, 7, 8] | / | Learning rate 9: [‘constant’, ‘invscaling’, ‘adaptive’] |
| Parameter 4 | / | N_estimators 4: [58, 60, 62, 64, 66] | / | Max iter 10: (500, 2000, 4000) |
| Mean deviation | 0.010 | 0.10 | 0.013 | 0.019 |
| Standard deviation | 0.011 | 0.011 | 0.011 | 0.014 |
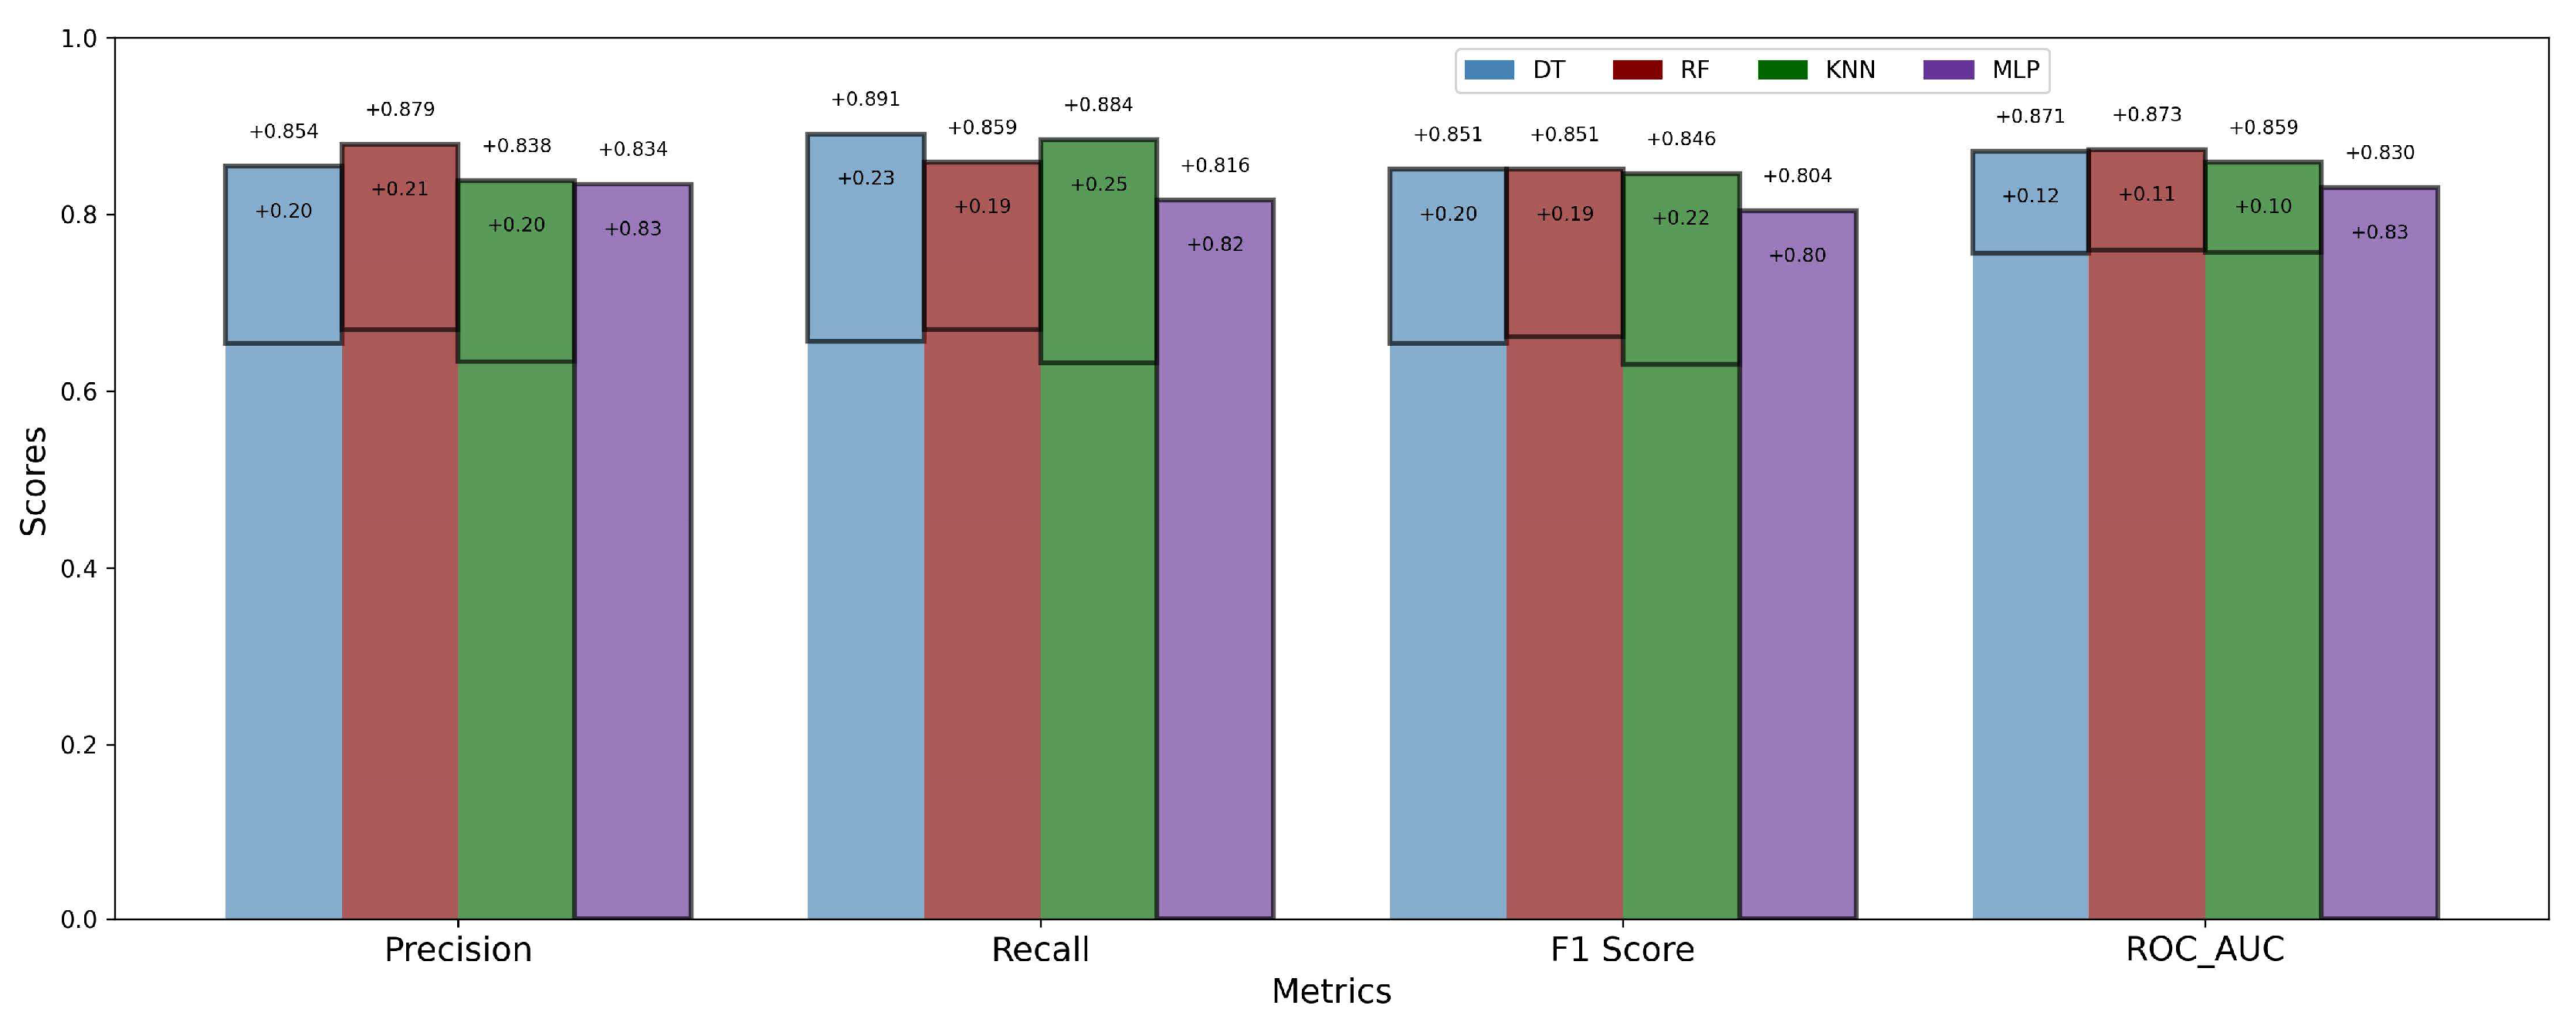
| Model | Precision | Recall | F1 Score | ROC_AUC | ||||
|---|---|---|---|---|---|---|---|---|
| w/o HT | HT | w/o HT | HT | w/o HT | w/o HT | HT | w/o HT | |
| DT | 0.654 | 0.854 | 0.656 | 0.891 | DT | 0.654 | 0.854 | 0.656 |
| RF | 0.669 | 0.879 | 0.670 | 0.859 | RF | 0.669 | 0.879 | 0.670 |
| KNN | 0.633 | 0.838 | 0.632 | 0.884 | KNN | 0.633 | 0.838 | 0.632 |
| MLP | \ | 0.834 | \ | 0.816 | MLP | \ | 0.834 | \ |
Disclaimer/Publisher’s Note: The statements, opinions and data contained in all publications are solely those of the individual author(s) and contributor(s) and not of MDPI and/or the editor(s). MDPI and/or the editor(s) disclaim responsibility for any injury to people or property resulting from any ideas, methods, instructions or products referred to in the content. |
© 2024 by the authors. Licensee MDPI, Basel, Switzerland. This article is an open access article distributed under the terms and conditions of the Creative Commons Attribution (CC BY) license (https://creativecommons.org/licenses/by/4.0/).
Share and Cite
Wang, L.; Li, Z.; Han, J.; Fan, K.; Chen, Y.; Wang, J.; Fu, J. A Cost-Effective Earthquake Disaster Assessment Model for Power Systems Based on Nighttime Light Information. Appl. Sci. 2024, 14, 2325. https://doi.org/10.3390/app14062325
Wang L, Li Z, Han J, Fan K, Chen Y, Wang J, Fu J. A Cost-Effective Earthquake Disaster Assessment Model for Power Systems Based on Nighttime Light Information. Applied Sciences. 2024; 14(6):2325. https://doi.org/10.3390/app14062325
Chicago/Turabian StyleWang, Linyue, Zhitao Li, Jie Han, Kaihong Fan, Yifang Chen, Jianjun Wang, and Jihua Fu. 2024. "A Cost-Effective Earthquake Disaster Assessment Model for Power Systems Based on Nighttime Light Information" Applied Sciences 14, no. 6: 2325. https://doi.org/10.3390/app14062325
APA StyleWang, L., Li, Z., Han, J., Fan, K., Chen, Y., Wang, J., & Fu, J. (2024). A Cost-Effective Earthquake Disaster Assessment Model for Power Systems Based on Nighttime Light Information. Applied Sciences, 14(6), 2325. https://doi.org/10.3390/app14062325