Abstract
Vortex-induced vibration (VIV) of long-span bridges can be of large amplitude, which can influence serviceability. Therefore, it is important to predict the response of vortex-induced vibration to aid the management of long-span bridges. A novel data-driven model is proposed to predict the time history of the dynamic response of VIV events. Specifically, the proposed model consists of gated recurrent unit (GRU) neural networks and the Newmark-beta method. GRU neural networks can perform accurate sequential prediction, and the Newmark-beta method can complement the physical meaning of the middle output of the proposed model. To aid the accurate prediction of the amplitude of VIV events, the proposed model employs weighted mean square error as the loss function, which can put more emphasis on the amplitude. The proposed model is validated on measured VIV events of a long-span suspension bridge. The weighted mean absolute percentage error and Pearson correlation coefficient of the trained model indicate the effectiveness of the proposed model.
1. Introduction
With the rapid development of the economy, long-span bridges as important traffic-connection links receive more and more recognition and become a developing trend in the field of transportation. With the increasing span, the structure of the bridge is of increasing flexibility and is more and more sensitive to the wind environment [1,2,3]. A long-span bridge can undergo different kinds of wind-induced loadings under various wind environments [4,5,6,7,8,9,10].
One typical wind-induced vibration is vortex-induced vibration (VIV). When the frequency of the vortex shedding generated by the wind passing through the bridge girder is close to a certain natural frequency, the vortex-excited force that is of the same frequency can stimulate the resonance of the bridge girder. VIV events have been observed on several long-span bridges, such as the Volgograd Bridge in Russia [11], the Trans-Tokyo Bay Crossing Bridge [6] in Japan and so on. Compared to the buffeting, the amplitude of the dynamic response of VIV is usually larger [9]. Although vortex-induced vibration does not necessarily lead to catastrophic consequences, it will seriously affect the fatigue life of the structure and may also lead to the loss of the expected functionality of the structure [12]. Therefore, it is of great importance to conduct research on the vortex-induced vibration of a bridge girder.
Researchers have proposed semi-empirical methods to describe vortex-induced vibrations where aerodynamic parameters are introduced to represent aerodynamic stiffness and aerodynamic damping. Typical semi-empirical theoretical models are the wake oscillator model [13,14] and the single-degree-of-freedom model [15,16]. The wake oscillator model takes the motion of the structure and the wake flow into consideration at the same time in the form of a pair of coupled equations. The single-degree-of-freedom model, on the other hand, models the vortex-induced load as the aeroelastic term in the dynamic equation, by which the corresponding expression is more intuitive and practical [17]. However, as a complex phenomenon of wind–bridge interaction, vortex-induced vibration is difficult to be modeled comprehensively using semi-empirical approaches [18]. As a complicated aerodynamic phenomenon, modeling VIV events involves modeling aerodynamic forces and the wind–bridge interaction. To predict the VIV response of a full-scale bridge using a physical model, modal and aerodynamic characteristics and the corresponding wind field are needed, which are difficult to obtain. Further, modal characteristics obtained with the finite element model can be inaccurate because of the modeling error, and aerodynamic characteristics obtained with wind-tunnel tests can be inaccurate when the real wind field is a nonuniform and has a larger Reynolds number. Therefore, physical models can have high computational demand and have difficulty in obtaining accurate predictions.
Advanced data-driven methods, on the other hand, can be an alternative. Advanced data-driven methods such as neural networks model the dynamic mechanism of the system by mining the relationship embedded in the data of the input and output [19,20]. Without the limitation of various assumptions, data-driven methods can be more flexible and more easily capture the complex mechanism such as seismic demand [21], vehicle–bridge interaction [22] and the aerodynamic system [23,24,25,26]. Some research has been conducted in the field of parameter identification. Liu et al. [27] used the standard Scanlan linear single-degree-of-freedom aerodynamic equation for modeling the vortex-induced vibration of a bridge girder. Yan et al. [28] obtained the modal characteristics and aerodynamic characteristics of the structure by minimizing the negative log-likelihood function method.
However, little research has been conducted on the prediction of dynamic responses of VIV events of full-scale bridge girders, which can aid the management of the bridge. Li et al. [12] proposed a machine learning-based method to predict the root-mean-square (RMS) value of the VIV response of prototype bridges where the support vector machine and a nonlinear autoregressive exogenous (NARX) architecture are employed. Li et al. [18] then proposed a recursive recurrent neural network model to predict the envelope of the VIV response of on-site long-span bridges.
The aforementioned research focuses on the statistics of the VIV response (root-mean-square value and the envelope), where the prediction of the time history of the VIV response is lacking. The prediction of the time history can complement the frequency-domain characteristics and the phase characteristics, which can help the understanding of the mechanism of VIV events of full-scale bridges. Therefore, there is an urgent need to propose a model to predict the time history of VIV response.
There are two main limitations of the existing machine learning-based models for handling the task. One is that existing models are black-box models, which lack interpretability, and the physical meaning of the middle output is often unclear. The black-box models have little effect on uncovering the underlying mechanisms hidden in the monitoring data. There are mainly three different approaches to embedding physical information in the machine learning model, which are introducing observational, inductive and learning biases [29,30]. Introducing observational biases relies on sufficient data to cover the input domain, introducing learning biases is usually achieved by optimizing the loss functions of relevant physics equations and introducing inductive biases is achieved through the architecture design of the model. Given a full-scale bridge, sufficient input about the wind load and accurate modal and aerodynamic characteristics are not available. Therefore, introducing inductive biases is the viable approach. In this paper, we embed the Newmark-beta method inside the model to enforce the physical meaning of the middle output to enhance interpretability. The other limitation is that mean square error (MSE) is often employed to train the models, which treats all the responses as equally important. With the amplitude occupying a small part of VIV response, the model trained with MSE may not pay enough attention to amplitude and can have difficulty in predicting the amplitude accurately.
In this paper, we propose a machine learning-based model for predicting the time history of vortex-induced vibration response, where gated recurrent unit (GRU) neural network is employed for its outstanding capacity to handle sequences. To enhance the interpretability of the model, the Newmark-beta method is introduced as a physics-based module inside the GRU neural network. With the introduced module, the physical meaning of the middle output can be predefined and discussed. A novel weighted mean square error (WMSE) loss function is employed to help the model put emphasis on the large vibrations to better predict amplitude. The remainder of this paper is as follows. The theoretical background of vortex-induced vibration, the Newmark-beta method and gated recurrent unit neural network are presented in Section 2, and details of the proposed model are also presented in Section 2. In Section 3, a description of the data that consist of VIV events of a long-span bridge is given. Experimental results and then the analysis and conclusion are presented in Section 4 and Section 5, respectively.
2. Methodology
2.1. Vortex-Induced Vibration of a Bridge Girder
Vortex-induced vibration is a classic aeroelastic behavior of fluid–structure interaction which is caused by negative aerodynamic damping and usually is of larger amplitude than buffeting. During the VIV event, the frequency of the vortex shedding generated by the wind is close to a certain natural frequency, and the corresponding vortex-excited force can stimulate the resonance of the bridge girder. During the VIV event, there is only one main significant frequency, which indicates that the VIV response can be modeled with an SDOF equation, and the classic VIV model is presented as follows [15,18]:
where and denote the modal damping and frequency, respectively; , and denote the displacement, velocity and acceleration response of the girder, respectively; denotes the aerodynamic force, which consists of motion-induced force and flow-induced force; , and denote the air density, mean wind speed and cross-flow dimension of the section, respectively; and denote the reduced frequency and frequency of the vortex shedding, respectively; , , and denote the aerodynamic parameters; denotes the mass per unit span; and denotes the normalized aerodynamic force.
2.2. Newmark-Beta Method
The Newmark-beta method is a numerical method for solving the dynamic response of a structure [31,32]. The basic procedure of the Newmark-beta method is as follows. Given the hypothesis that the acceleration varies linearly during the time interval , the velocity and displacement at time can be presented as follows:
According to the aforementioned formulas, the relationship among increments of acceleration, velocity and displacement can be presented as follows:
With the increment form of the single-degree-of-freedom dynamic equilibrium equation being
the displacement of time can be calculated as follows:
Then, the velocity and acceleration at time can be calculated accordingly.
2.3. Gated Recurrent Unit Neural Network
GRU neural network is an advanced version of recurrent neural network (RNN) which can mitigate the problem of gradient vanishing and has a better capacity to model relationships among long sequences [33,34]. Compared to analogous neural networks like LSTM (long short-term memory) neural network and attention-based neural network, it can achieve comparable performance with fewer parameters [33]. Considering the computational burden caused by the introduction of the Newmark-beta method inside the model, GRU neural network is chosen as the basic module of the proposed model. The diagram of the GRU cell is shown in Figure 1, where denotes the input at ith time interval; and represent the reset gate and update at ith time interval gate, respectively; and represent the hidden-state vector and the candidate hidden-state vector at ith time interval, respectively; and tanh, and denote the hyperbolic tangent function, sigmoid function and element-wise multiplication, respectively. The calculation inside the GRU cell can be presented as follows:
where denotes the learnable weight of the GRU cell and denotes the learnable bias of the GRU cell. As shown in the aforementioned formulas, the reset gate controls the importance of the previous hidden-state vector in the calculation of the present candidate hidden-state vector, and the update gate controls the importance of the previous hidden-state vector in the calculation of the present candidate hidden-state vector. With the introduction of the reset gate and the update gate, the information flow along the sequence can be managed more adaptively.
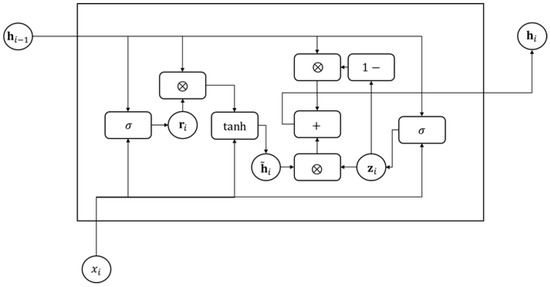
Figure 1.
The diagram of the GRU cell.
2.4. The Proposed Model
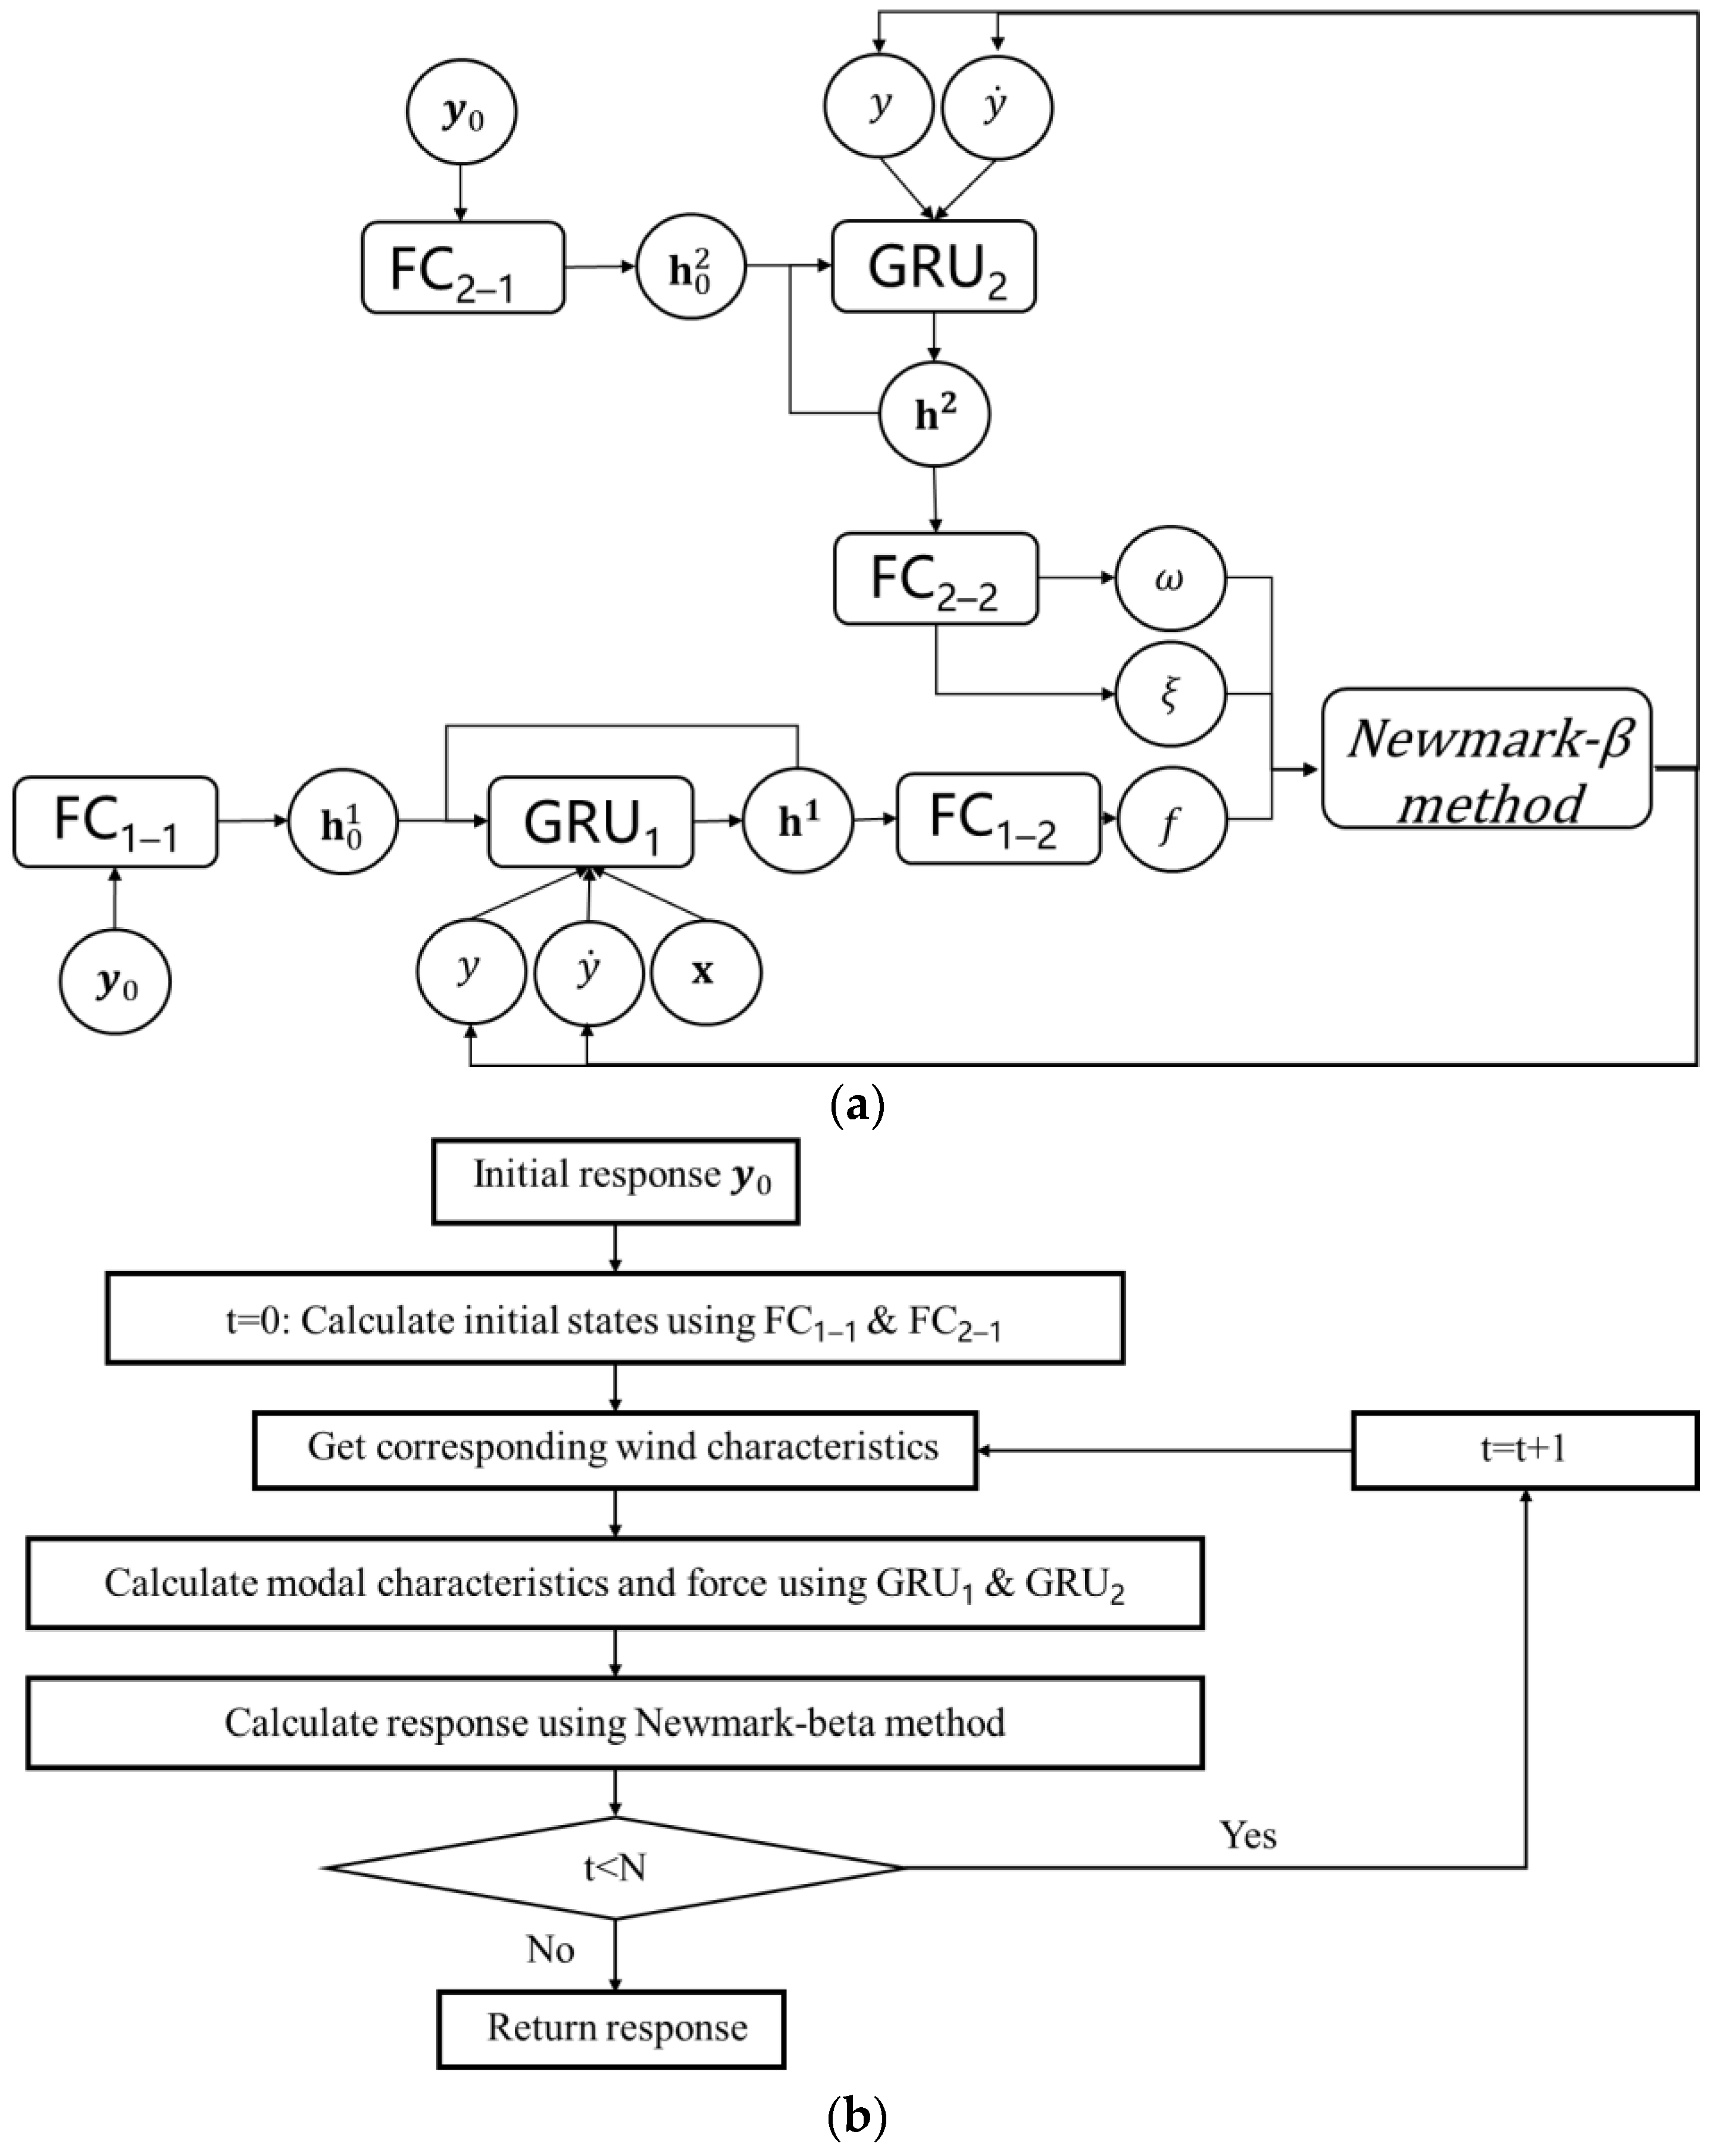
With unknown modal and aerodynamic characteristics and the corresponding aerodynamic force of a full-scale bridge, the VIV model cannot be employed to predict the VIV response. Therefore, there raises a need to employ a data-driven model as an alternative. However, the usual black-box data-driven model lacks interpretability, which demands a physics-informed architecture to enhance the physical meaning. In this paper, we propose to embed the Newmark-beta method which is a numerical method for solving dynamic equations inside the recurrent calculation of a GRU neural network, by which the GRU neural network outputs the estimated modal characteristics and the aerodynamic force and the Newmark-beta method calculates the corresponding response according to Equations (2)–(9). The diagram of the proposed model is shown in Figure 2a. As shown in Figure 2a, two GRU neural networks and four fully connected (FC) neural networks are employed in the proposed model. One GRU neural network is employed to generate the hidden-state vector of modal frequency and modal damping, and the other GRU cell is employed to generate the hidden-state vector of normalized aerodynamic force.
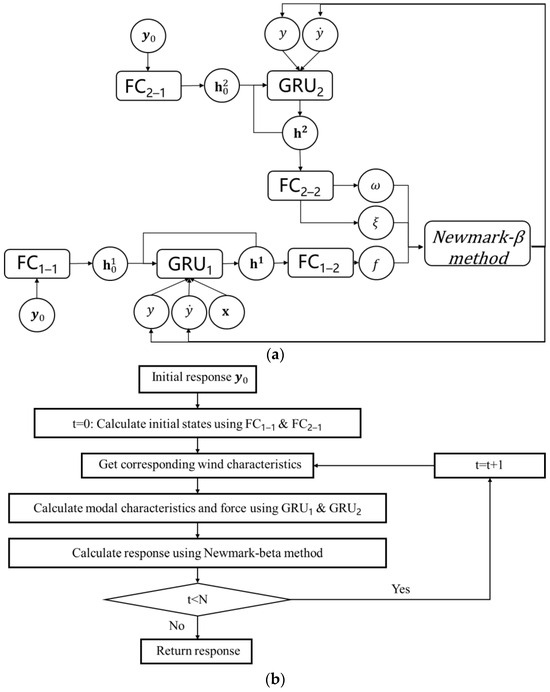
Figure 2.
The diagram and the flowchart of the proposed model: (a) the diagram of the proposed model; (b) the flowchart of the proposed model.
For the GRU neural network for modal frequency and modal damping (denoted as GRU2), only the time histories of displacement and velocity are selected as the input. The reason behind this design is that modal characteristics are not influenced by wind characteristics, and dynamic adjusting is employed to avoid error accumulation. A fully connected neural network (denoted as FC2–2) is employed to postprocess the hidden-state vector of GRU2 to output the modal frequency and modal damping. Another fully connected neural network (denoted as FC2–1) is employed to generate the initial hidden-state vector of the GRU neural network for the modal characteristics instead of a zero vector to avoid system error. The input of FC2–1 is the first few measurements of acceleration, velocity and displacement.
For the GRU neural network for normalized aerodynamic force (denoted as GRU1), the time histories of displacement, velocity and wind characteristics (such as wind speed at different sections) are selected as the input. The reason behind this design is that normalized aerodynamic force is influenced by not only wind characteristics but also the dynamic response of the bridge girder, and dynamic adjusting is employed to model the dynamic evolution of normalized aerodynamic force. A fully connected neural network (denoted as FC1–2) is employed to postprocess the hidden-state vector of GRU1 to output the normalized aerodynamic force. Another fully connected neural network (denoted as FC1–1) is employed to generate the initial hidden-state vector of GRU1 instead of a zero vector to avoid system error. The input of FC1–1 is the first few measurements of acceleration, velocity and displacement.
The calculation procedure inside the proposed model is illustrated in Figure 2a,b. Firstly, FC1–1 and FC2–1 are used to produce initial states for GRU1 and GRU2. Secondly, GRU1 and GRU2 can be used to produce hidden states, which can be postprocessed with FC2–1 and FC2–2 to obtain estimated normalized force and modal characteristics. Thirdly, the Newmark-beta method is performed to calculate the VIV response. During sequential prediction, GRU1, GRU2, FC2–1 and FC2–2 are all performed multiple times, while FC1–1 and FC2–1 are only performed in the initial state.
In the proposed model, the direct output of the neural networks is the modal characteristics and normalized aerodynamic force, and the dynamic response is the indirect output. Instead of outputting the dynamic response directly, the relationship among dynamic responses that can help prevent error accumulation can be utilized, and the interpretability of the deep learning-based model can be enhanced.
The proposed model is trained by optimizing the following loss function:
where subscript i denotes the sequence number of the sample, and n is the number of samples; subscript j denotes the sort of dynamic response, and 1, 2 and 3 represent acceleration, velocity and displacement, respectively; and and denote the measured and predicted dynamic response, respectively. The adopted loss function is a weighted form of mean square error loss, where the weight is the measured dynamic response itself plus 1. The reason behind this loss function is that the dynamic response of VIV events is of the form of a sinusoidal function, which indicates that the amplitude accounts for only a small part. Therefore, to urge the model to predict the amplitude more precisely, the weight of the larger value should be larger. Here, we adopt the form of self-weight. In addition, the 1 is employed to prevent the ignorance of the dynamic response of a small value.
3. Data Description
The proposed model is validated using the monitoring data of a long-span suspension bridge. A comprehensive monitoring system is equipped on the investigated bridge, and the layout of the sensors for wind and girder vibration which are the main concern of our study is shown in Figure 3. To monitor the wind speed, three pairs of three-dimensional ultrasonic anemometers are installed on the 1/4, 1/2 and 3/4 span of the main span, where each pair consists of an anemometer installed at the upriver side and an anemometer installed at the downriver side. The measurement range, resolution and sampling frequency of the anemometers are 0–60 m/s, 0.01 m/s and 32 Hz, respectively. To monitor the acceleration of the bridge deck, 4 sets of uniaxial accelerometers are installed on the 1/2 span of the side span and the 1/4, 1/2 and 3/4 span of the main span, where each set consists of an accelerometer at the upriver side monitoring vertical acceleration and two accelerators installed at the downriver side monitoring vertical and lateral acceleration. The measurement range, sensitivity and sampling frequency of the anemometers are ±2 g, 2.5 V/g and 50 Hz, respectively. Monitoring data from 2010 to 2015 are used to build a database of VIV events of a full-scale bridge.
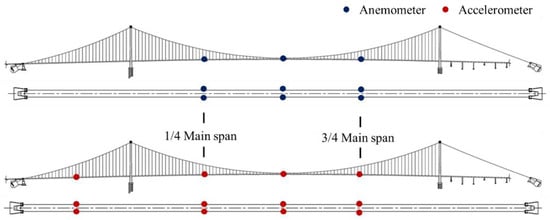
Figure 3.
The layout of equipped sensors for wind and girder vibration.
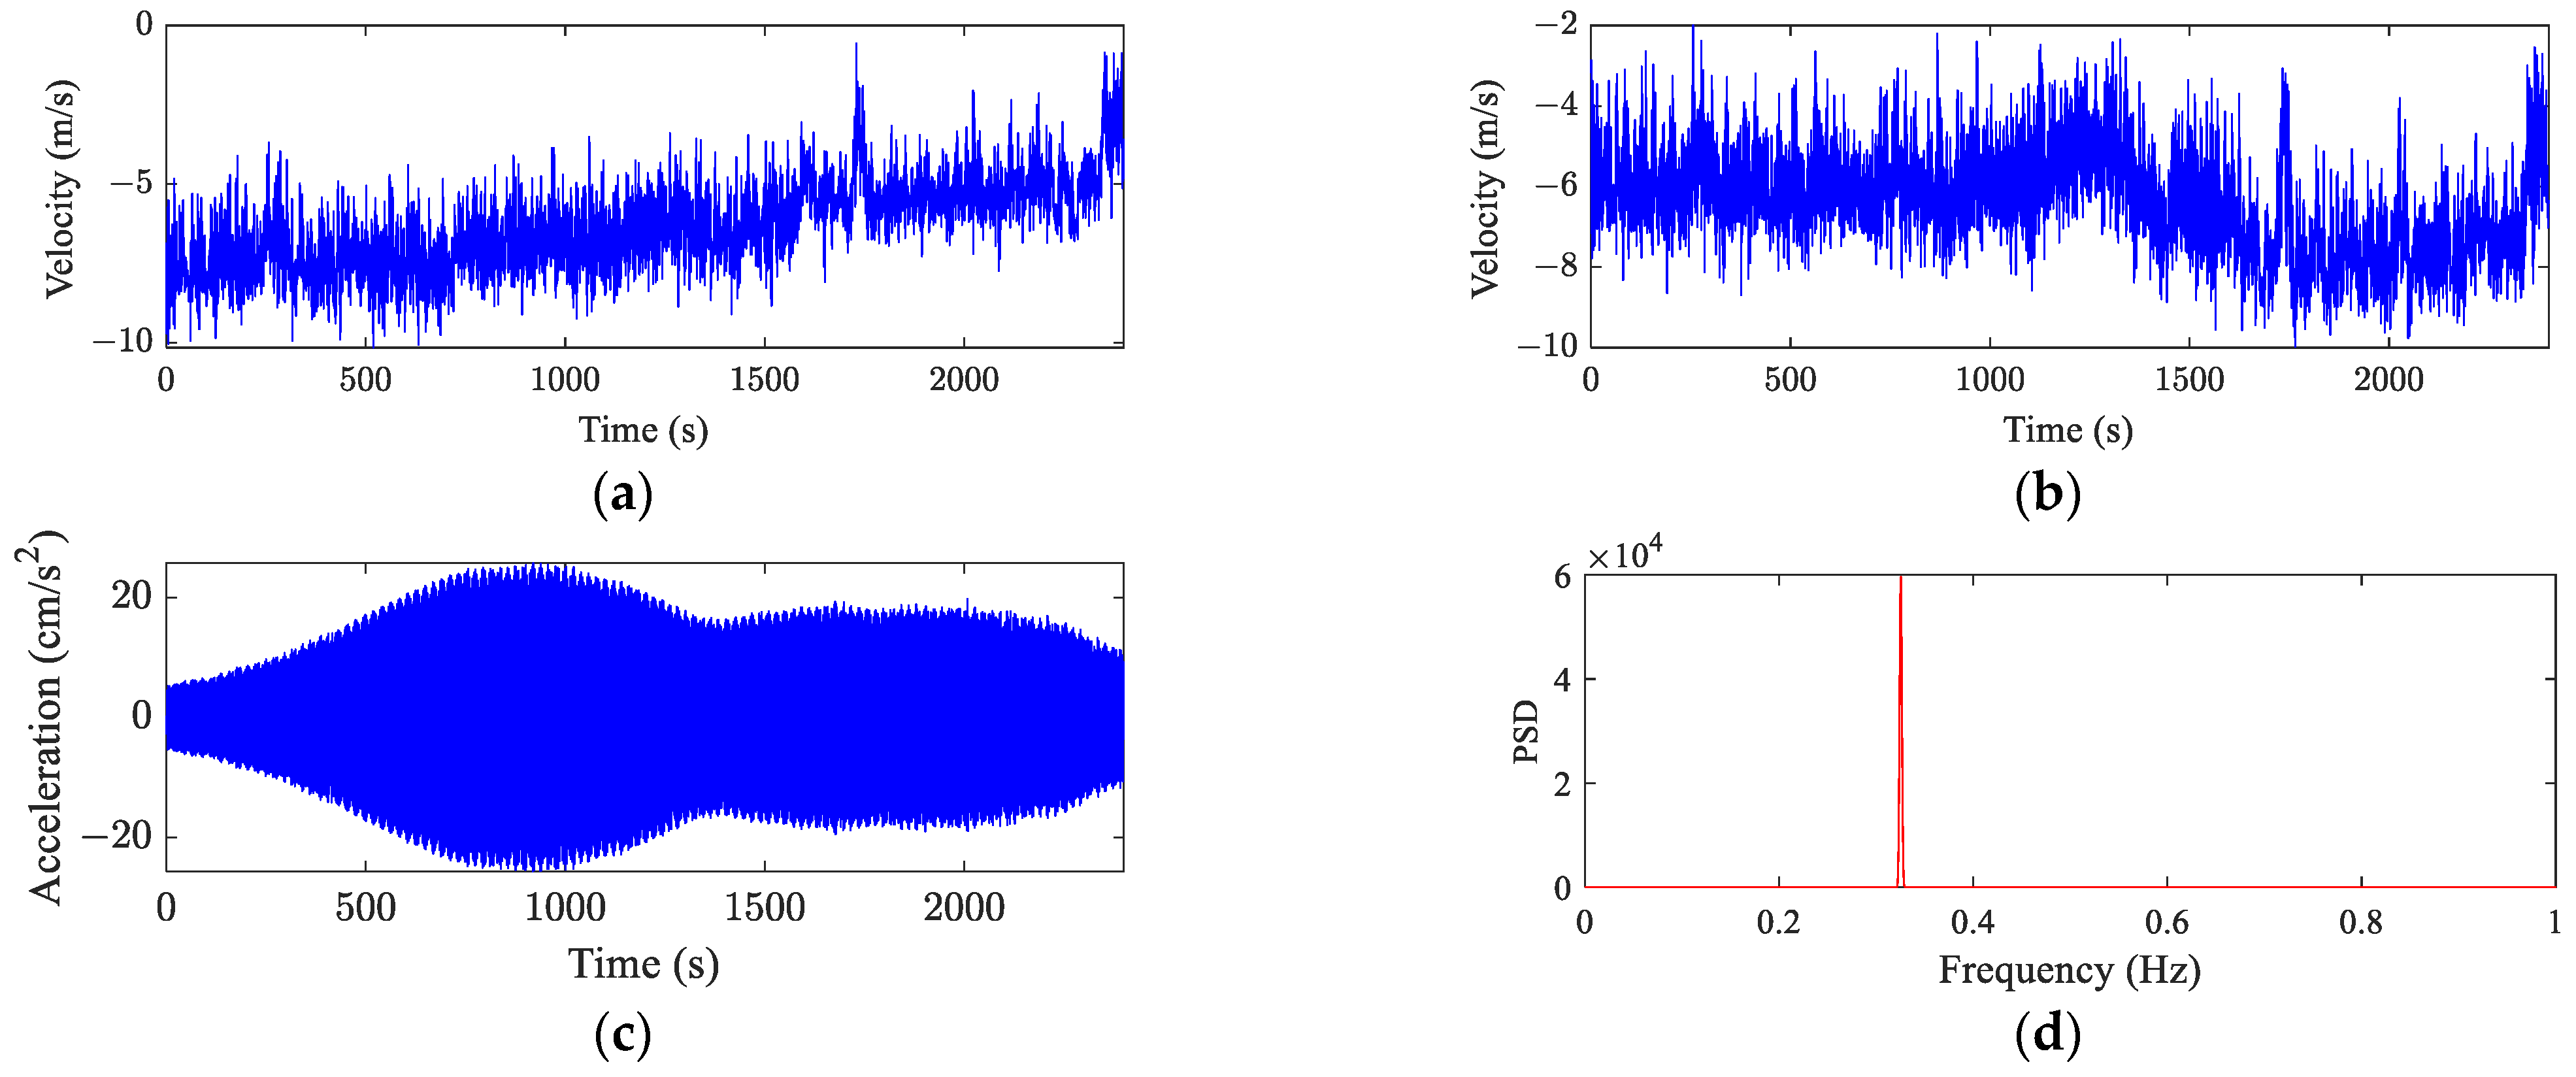
The investigated bridge has suffered from a number of vortex-induced vibration events during the last few years. The VIV events are identified with a clustering-based identification method [10,27]. In the identified VIV events, different mode frequencies are observed, which are 0.18 Hz, 0.28 Hz, 0.33 Hz, 0.38 Hz, 0.44 Hz and 0.50 Hz. Among these different modes, the number of VIV events of 0.33 Hz is 31, while the numbers of VIV events of other frequencies are all less than 15. Therefore, to take the amount of data into consideration, the monitoring data of VIV events of 0.33 Hz are collected as the dataset to validate the proposed model. A typical VIV event is shown in Figure 4, where the blue color indicates the time series and the red color indicates the power spectrum density (PSD).

Figure 4.
A typical VIV event: (a) x-direction wind component at the 1/4 span of the main span; (b) y-direction wind component at the 1/4 span of the main span; (c) time history of the vertical acceleration of 1/2 span of the main span; (d) power spectrum of the vertical acceleration of 1/2 span of the main span.
As shown in Figure 4, the power spectrum of acceleration has only one significant frequency of 0.33 Hz, and the envelope of the time history of acceleration varies slowly with time. Compared to buffeting events, VIV events tend to have larger and slowly changing amplitude. As for wind speed, it can be found that the main trend of the wind speed component also varies with time, while certain wind fluctuations are contained. The wind fluctuations may influence the model’s sensitivity to the change in the trend of wind speed. Therefore, the trend of wind speed is extracted using wavelet filtering, where a db5 wavelet is employed and the decomposition number is 10. In addition, acceleration data are filtered to eliminate other possible main frequencies other than 0.33 Hz.
The collected data are then processed as follows. For the wind speed data, the instantaneous horizontal wind speed and the angle of direction at different sections are calculated from the monitored wind components of the corresponding anemometer as follows [12,18]:
where and are the x-direction and the y-direction wind components in the horizontal plane, respectively. It should be noted that the instantaneous wind speed and the corresponding angle of direction at the 1/2 span of the main span are not used because of the influence of the main cable, and only the wind characteristics at the 1/4 and 3/4 span of the main span are used. For the girder vibration data, the vertical acceleration, lateral acceleration and torsional acceleration of different sections are calculated from the monitored acceleration components of the corresponding accelerators. It should be noted that vertical vibration is the main form of vortex-induced vibration of the investigated bridge, and the relationship among the amplitudes of vertical acceleration of different sections is similar to the modal shape of the investigated bridge. Therefore, only vertical accelerations of 1/2 span of the main span are used. The corresponding vertical velocities and displacements of different sections are calculated by integration in the frequency domain. In addition, to make the time resolution of the wind speed data consistent with that of the acceleration data, both wind speed data and acceleration data are down-sampled to 2 Hz.
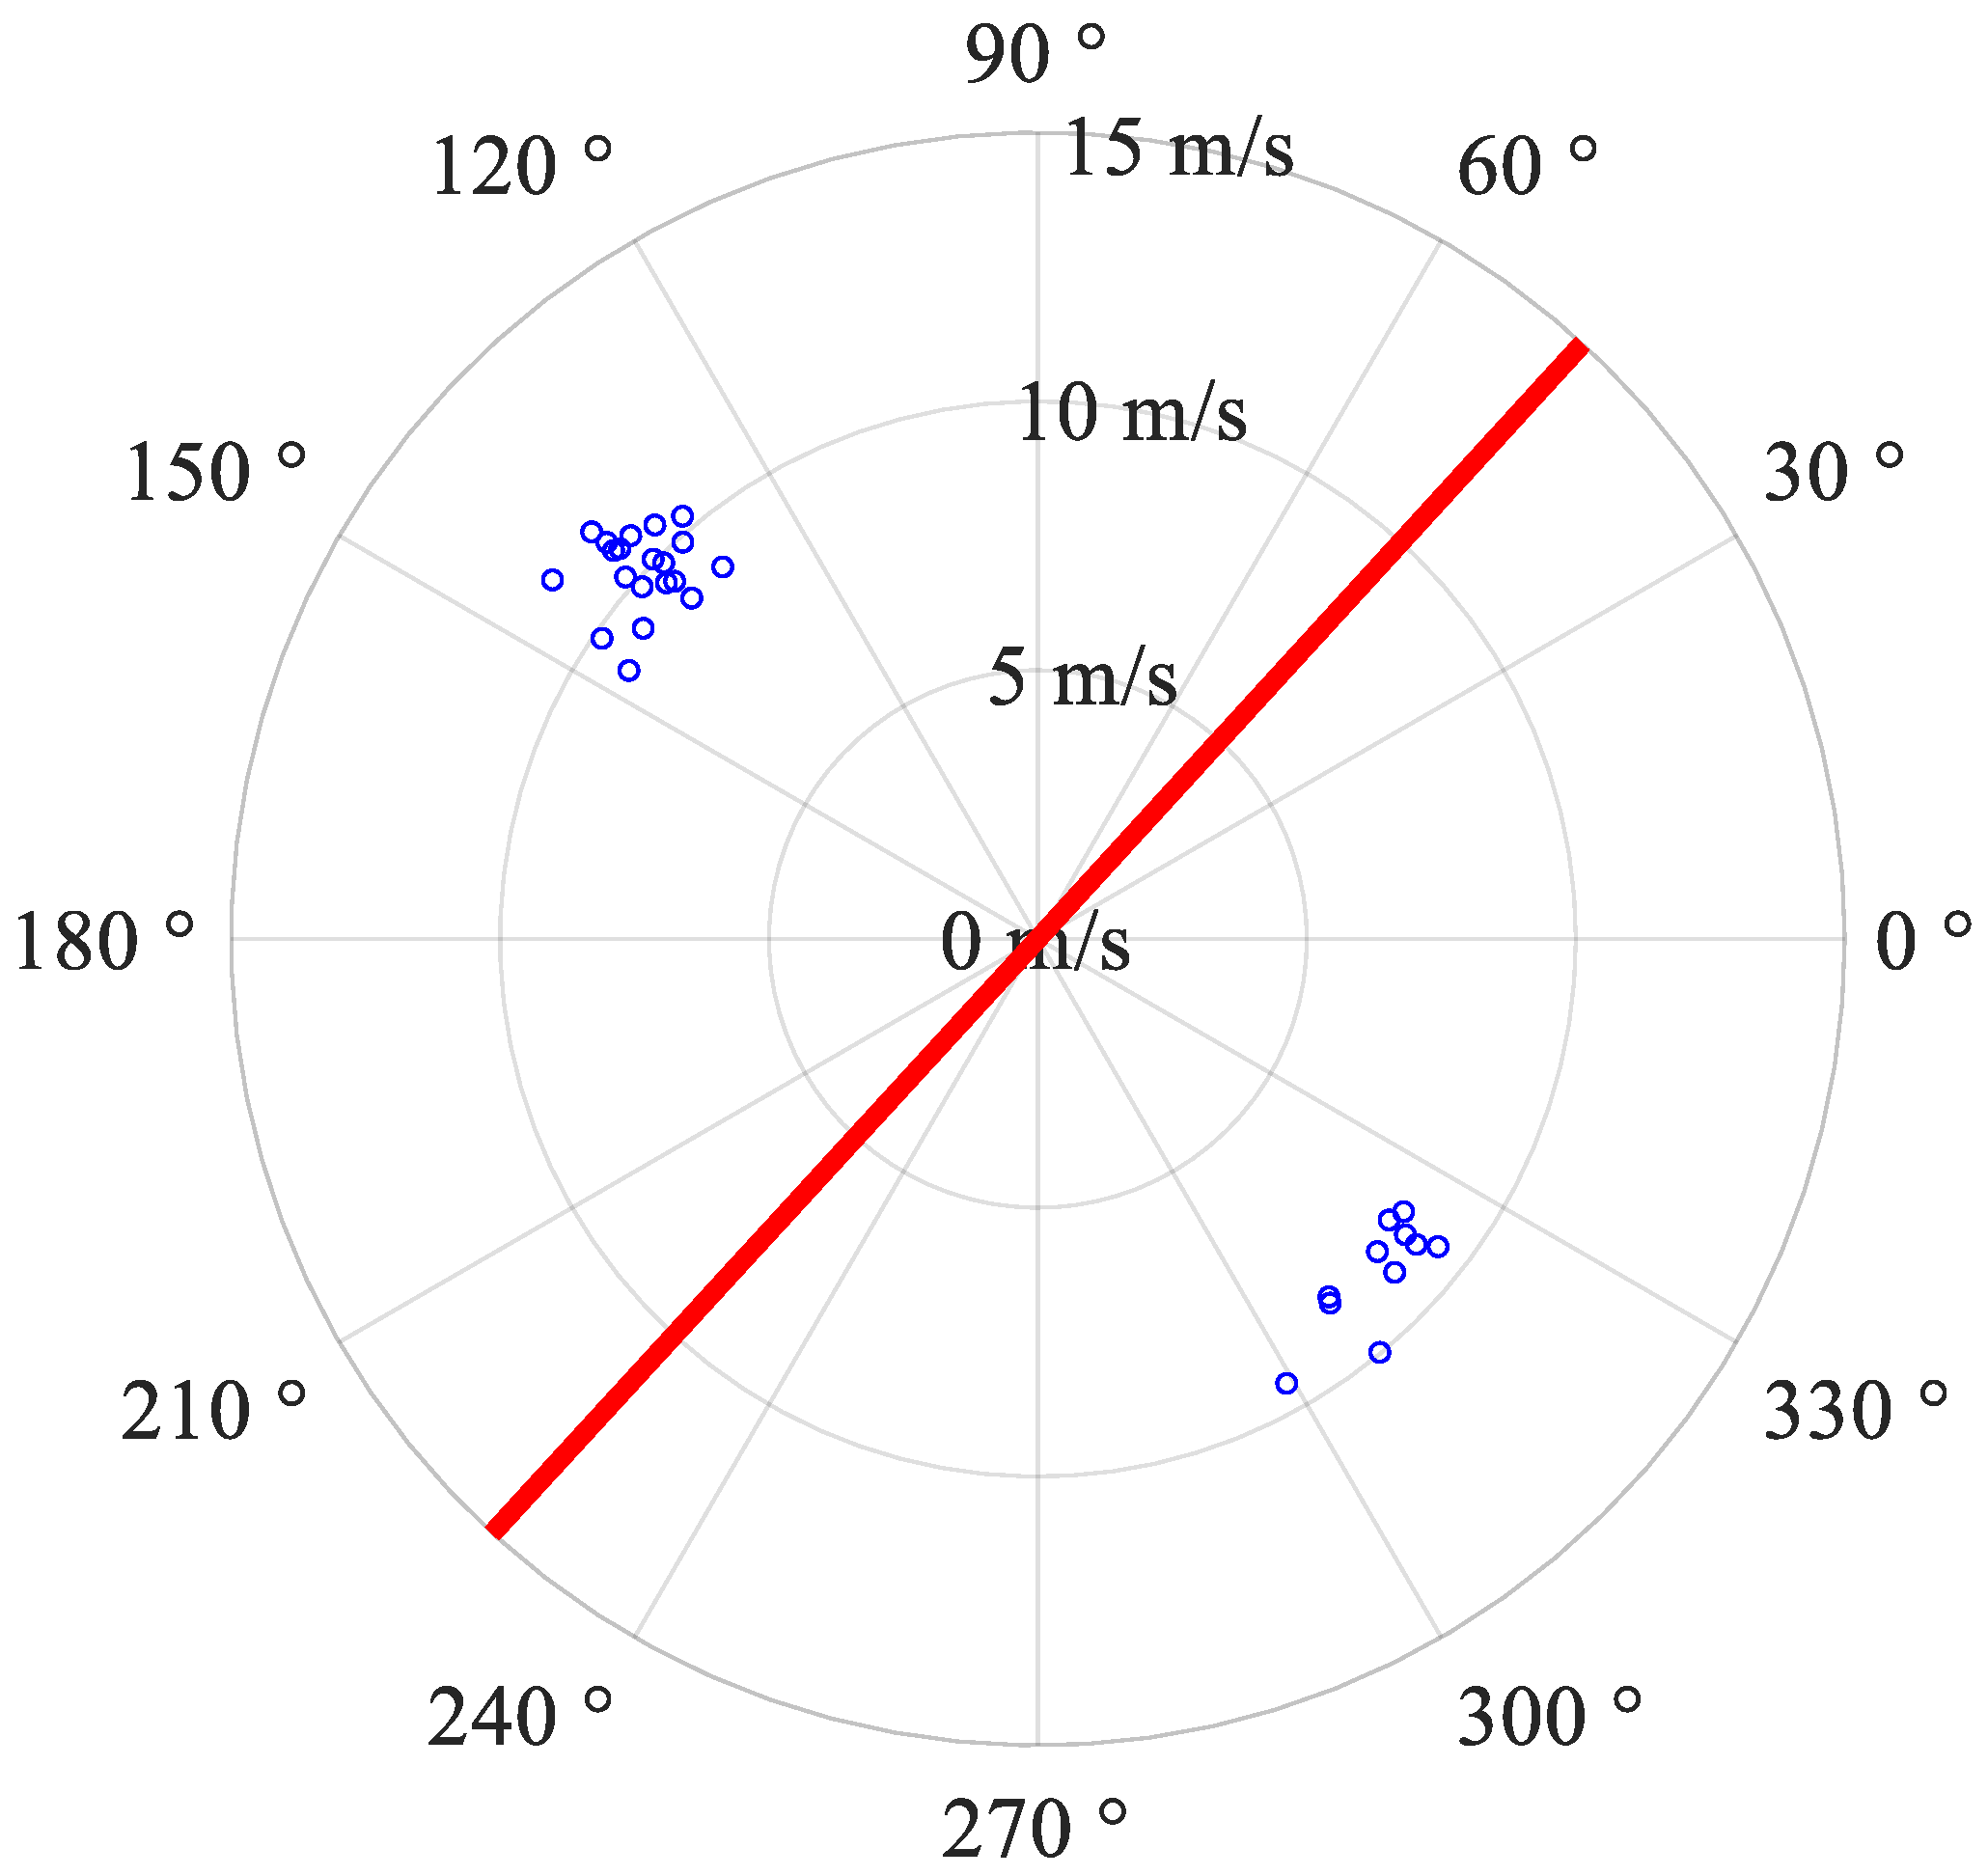
After the preprocessing, a dataset that consists of 31 VIV events of 0.33 Hz for validating the proposed model is built. The specifics of the dataset can be summarized as follows. The built dataset contains both wind characteristics and vibration characteristics. The wind characteristics consist of wind speeds and angles of direction at 1/4 and 3/4 span of the main span, and the vibration characteristics consist of vertical acceleration, velocity and displacement of 1/2 span of the main span. The time resolution of the wind characteristics and vibration characteristics is the same, which is 0.5 s. The summary of statistics of the 31 events is shown in Table 1. A wind rose plot of 31 VIV events is shown in Figure 5 (the red line is the axis of the investigated bridge), where the blue color indicates the wind characteristics and the red color indicates the bridge. Histograms of the duration time and amplitude of VIV events are shown in Figure 6.

Table 1.
The summary of statistics of the 31 events.
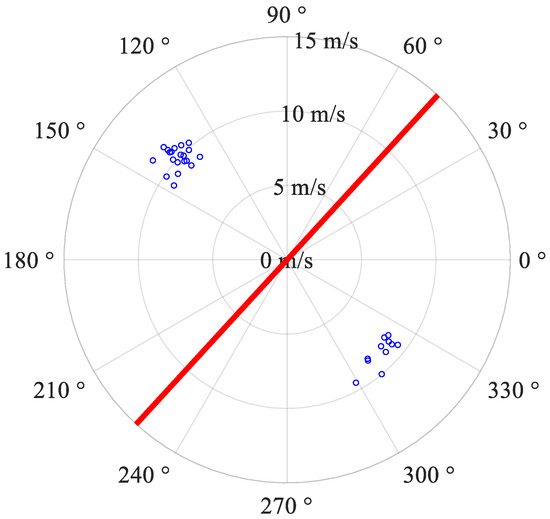
Figure 5.
Wind rose plot of VIV events.
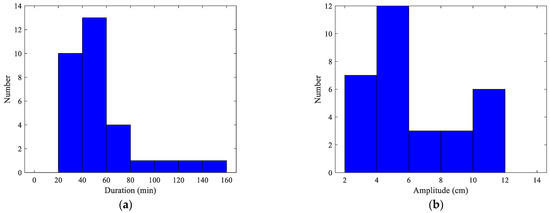
Figure 6.
Histograms of duration time and amplitude of VIV events: (a) histogram of duration time; (b) histogram of amplitude.
As shown in Table 1 and Figure 5, in these 31 events, the angle of direction of the wind is mostly perpendicular to the axis of the investigated bridge. It can also be seen that VIV events can happen under wind scenarios of either direction. The range of mean wind speed is between 8 and 12 m/s, and most mean wind speed is concentrated around 10 m/s. As shown in Table 1 and Figure 6a, the range of duration times of VIV events is between 20 to 160 min, and the duration time of most VIV events is less than 80 min. As shown in Table 1 and Figure 6b, the range of amplitudes of VIV events is between 2 to 12 cm. Both VIV events of large amplitude and those of small amplitude are possible to happen. It can be concluded that the processed dataset contains VIV events of various wind characteristics and various vibration characteristics. The data that are used to validate the proposed model consist of 31 monitored VIV events of 0.33 Hz. The dataset is randomly split by VIV event to guarantee the continuity of individual events that can have various lengths. The training set consists of 18 VIV events (97,200 data points in total), the validation set consists of 6 VIV events (50,400 data points in total) and the testing set consists of 7 VIV events (32,400 data points in total).
Four different metrics are employed to evaluate the trained model. Three of them, which are mean absolute error (MAE), root-mean-square error (RMSE) and weighted mean absolute percentage error (WMAPE), are employed to evaluate the point-to-point error. The remaining one, that is, the Pearson correlation coefficient (PCC), is employed to evaluate the sequence-to-sequence error. MAE, RMSE, WMAPE and PCC are calculated as follows:
where and are the ith measured and predicted response of VIV events, respectively; is the number of samples; and and are the mean of the measured and predicted response of VIV events, respectively. MAE, RMSE and WMAPE can all be used to evaluate the amplitude difference between the measured response and predicted response. MAE values differences equally, whereas RMSE puts more emphasis on large differences. WMAPE provides a normalized evaluation, and the weight employed in the WMAPE is used to increase the significance of the error of large amplitude. With MAE, RMSE and WMAPE being closer to 0 and PCC being closer to 1, the prediction accuracy is higher.
4. Experimental Results and Analysis
A machine learning-based model that is presented in Section 2.4 is built for predicting the dynamic response of vortex-induced vibrations of the investigated bridge. The specifics of the employed model are presented as follows. For gated recurrent unit neural networks, the dimensions of the hidden-state vectors are both 32. For fully connected neural networks for generating initial hidden-state vectors, the first five responses (including acceleration, velocity and displacement) are selected as the input. Therefore, the input dimensions of these two fully connected neural networks are 15, and the corresponding output dimensions are 32. For fully connected networks for generating normalized force and modal characteristics, their output dimensions are 1 and 2, respectively.
The choice of the length of the predicted dynamic response is a tradeoff between error accumulation and capturing the underlying patterns of the evolution of vortex-induced vibration. With a larger length, the model may suffer error accumulation, and the computational consumption can be demanding. With a small length, the model may find it difficult to capture the evolution of vortex-induced vibration over time. In this paper, the length of the predicted dynamic response is 60 (30 s). The model is trained using the adaptive moment estimation [35], while L2 regularization is introduced to help prevent overfitting. It should be noted that because of the proposed loss function, the model may put more emphasis on the acceleration, and the prediction accuracies of velocity and displacement response may be degraded. However, with the accurate prediction of the acceleration, accurate predictions of velocity and displacement can be obtained by integration in the frequency domain. Therefore, the acceleration response is the main focus of this paper, and the prediction results of the acceleration response are presented to illustrate the effectiveness of the proposed model.
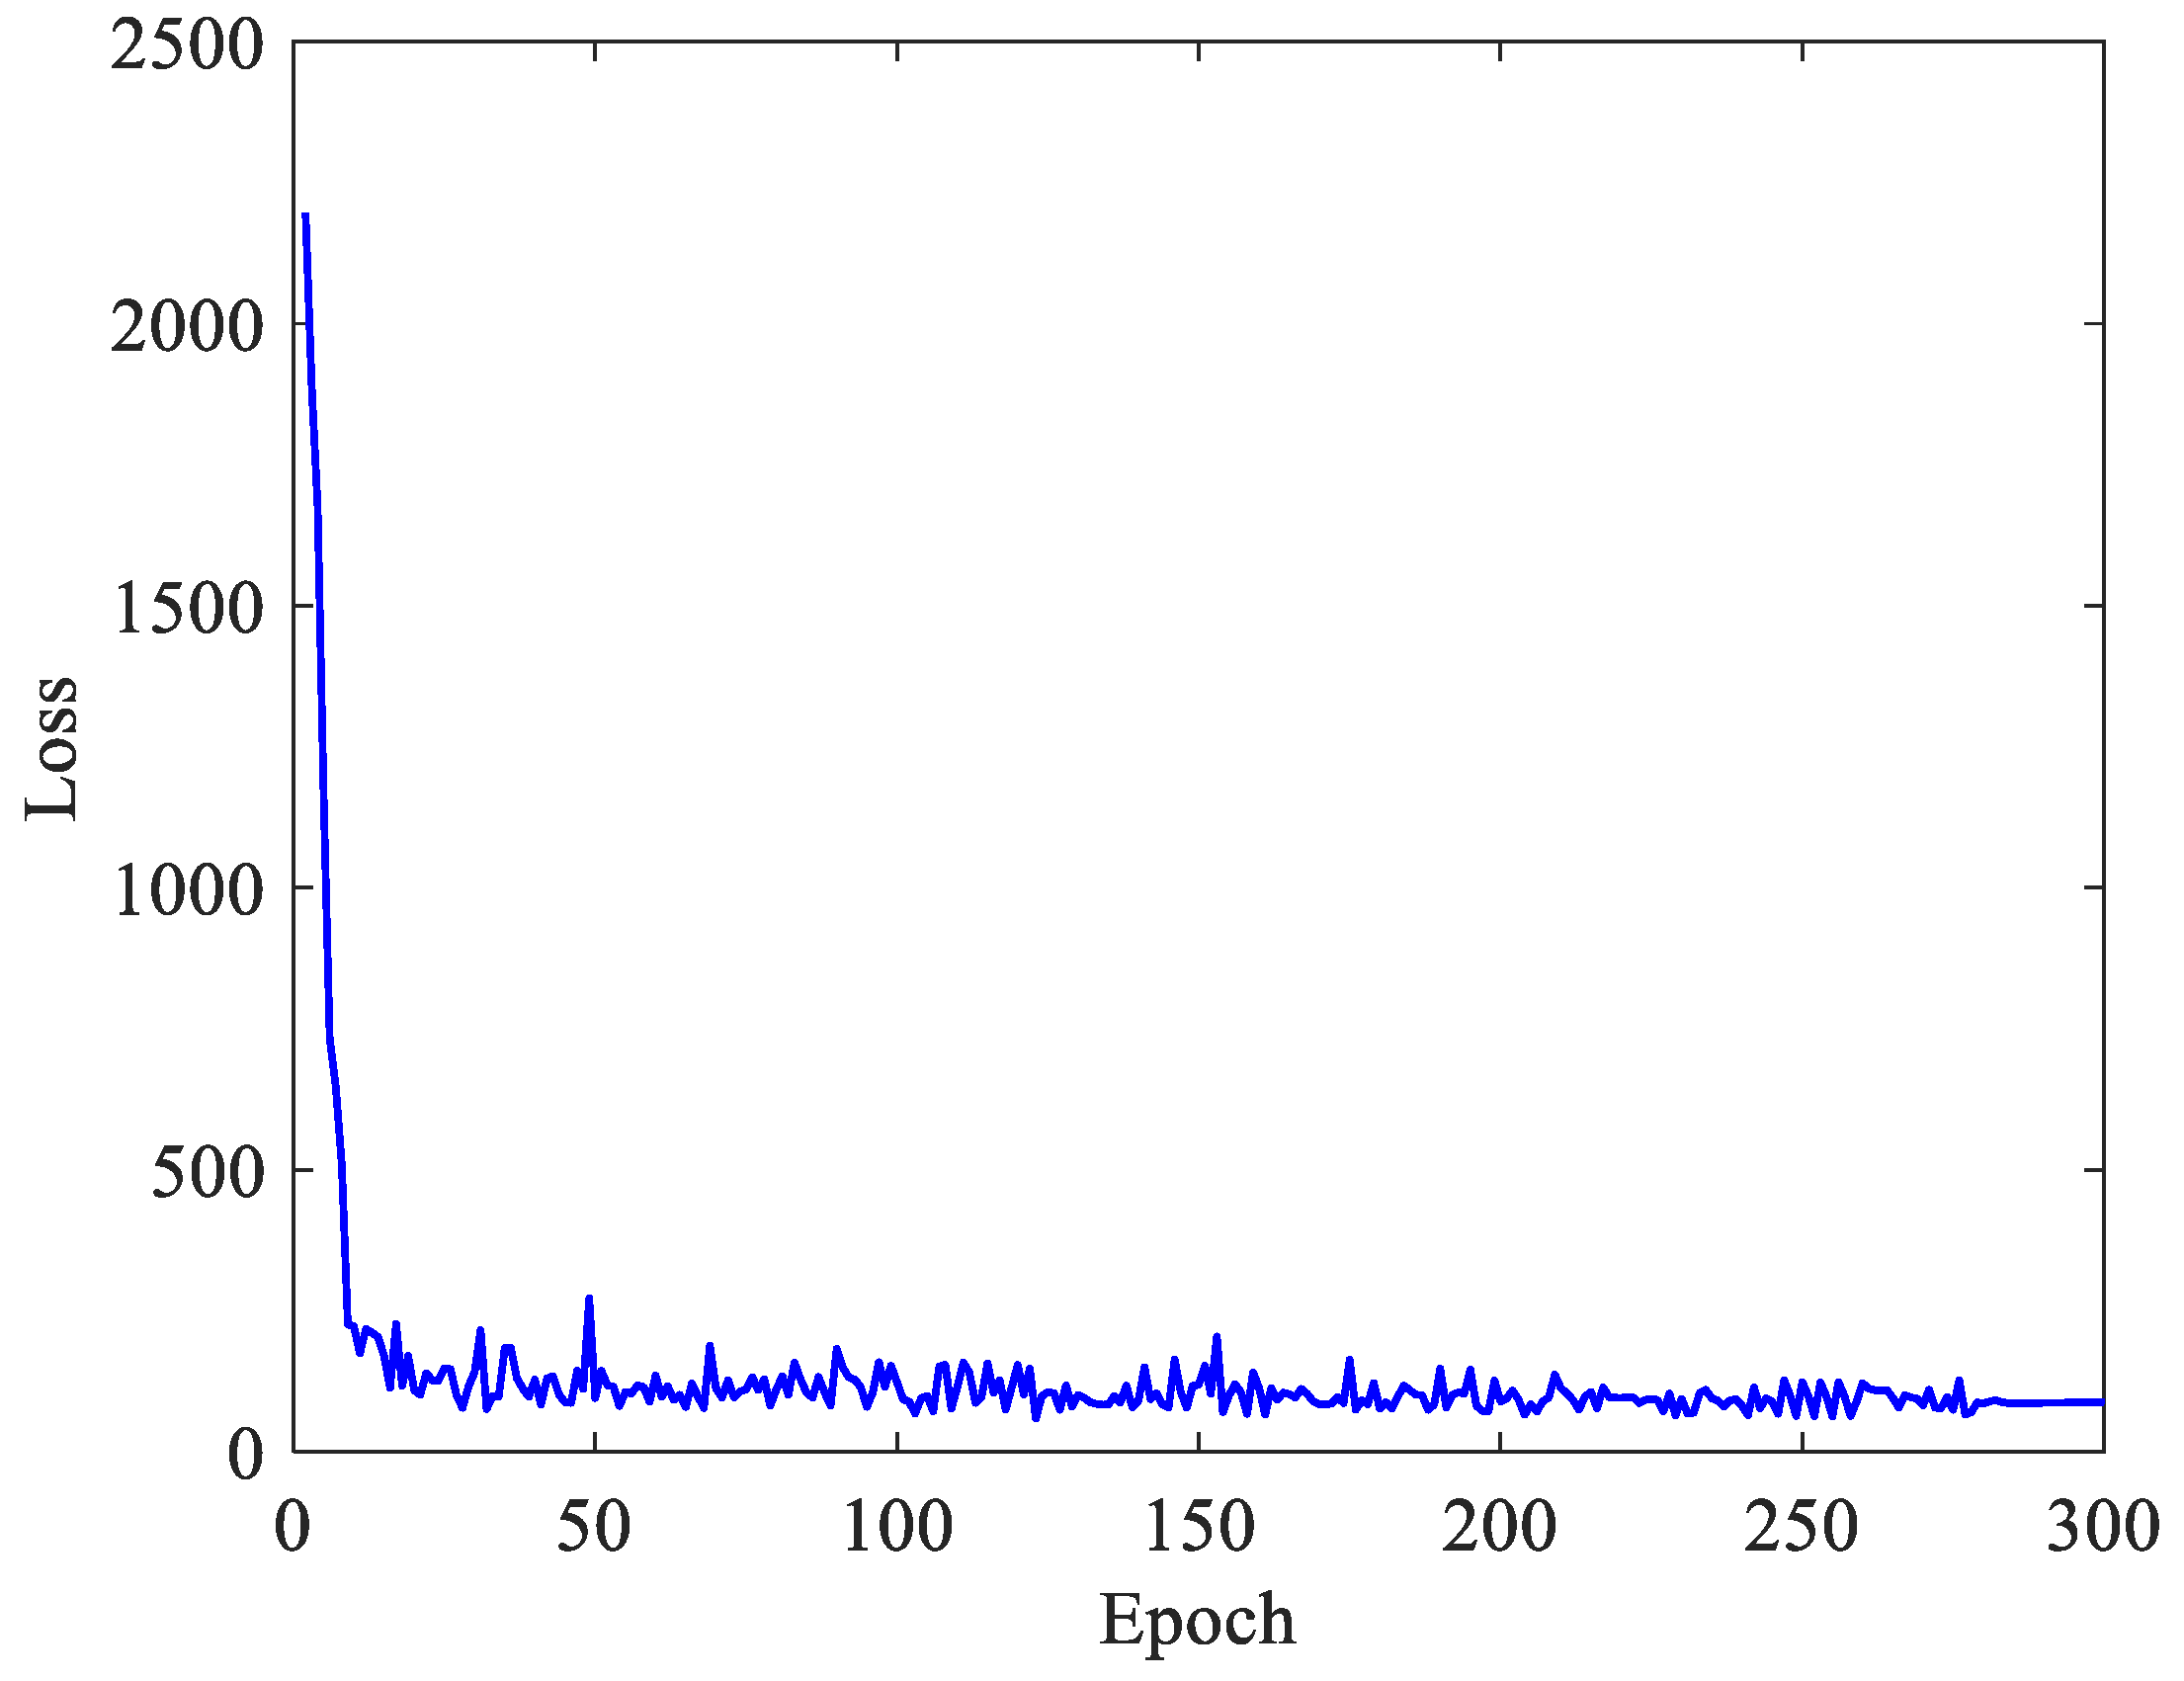
The learning curve of the proposed model is shown in Figure 7. As shown in Figure 7, the training curve is convergent, which indicates that the training process is accomplished. The performance of the trained model on the training set and the testing set is summarized in Table 2. The values of MAE, RMSE and WMAPE indicate that the prediction error is small compared to the amplitude of the acceleration response of the vortex-induced vibration, which validates that the trained model has the capacity to predict the amplitude accurately. Both the PCCs on the training set and the testing set are close to 1, which indicates that the trained model has the capacity to predict the phase accurately.
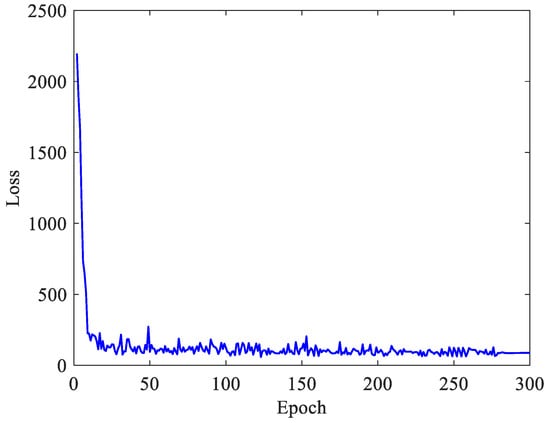
Figure 7.
The learning curve of the proposed model.
Table 2.
Performance of the proposed model on the training set and the testing set.
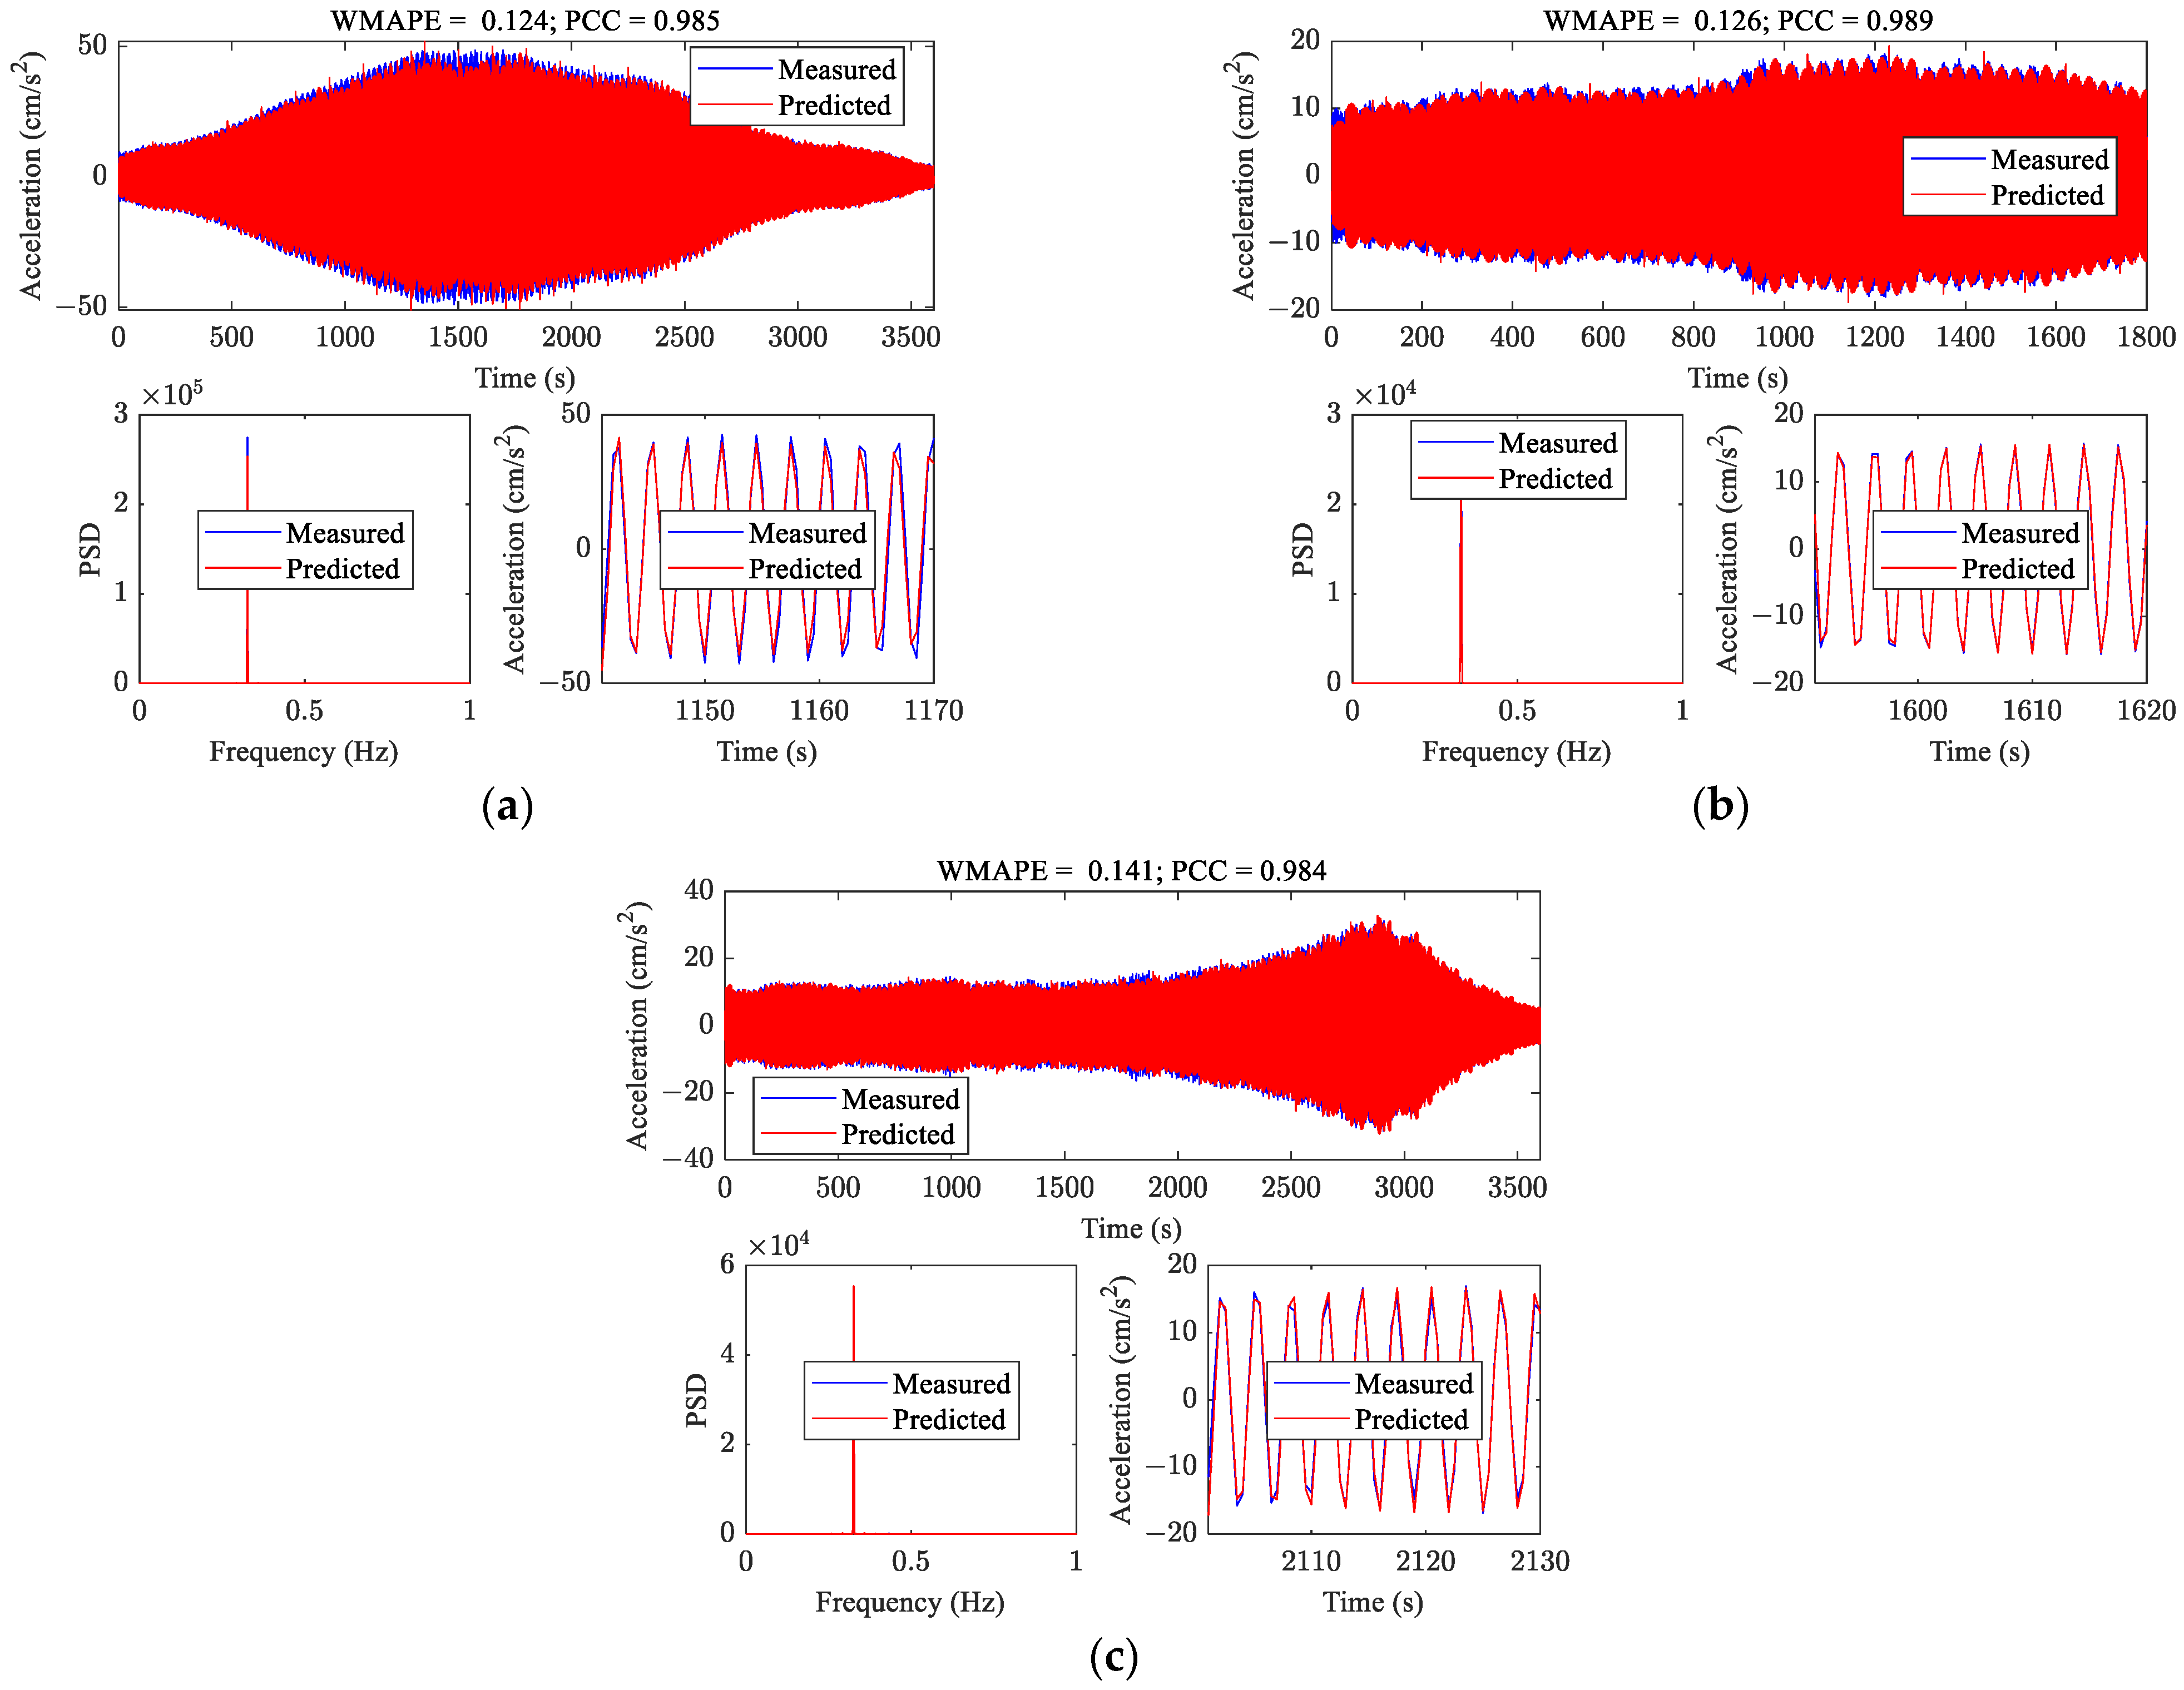
Typical predictions are presented in Figure 8. As shown in Figure 8, acceleration responses of vortex-induced vibration events of various shapes and amplitudes can be predicted accurately, which indicates the effectiveness and the practicability of the trained model. Take typical prediction III as an example: the trained model can predict the amplitude of the vortex-induced vibration of any stage accurately. The reason behind this phenomenon is the introduction of the weighted loss function. By introducing the weight, the model can put more emphasis on the large amplitude and prevent the problem of failing to predict the vortex-induced vibration of large amplitude inaccurately. It can also be seen that the evolution pattern of the phase of the measured acceleration is consistent with that of the predicted acceleration. In addition, the frequency-domain characteristics of the predicted response are consistent with those of the measured response, which indicates that the trained model can also predict the frequency-domain characteristics accurately. By predicting the time history of the VIV response of a full-scale bridge, the proposed model can provide more details about the VIV event than predicting the RMS value or the envelope of the response.

Figure 8.
Typical predictions: (a) typical prediction I; (b) typical prediction II; (c) typical prediction III.
It should be noted that the acceleration response is predicted piecewise, which is 30 s by 30 s. The trained model can be utilized to perform a long-time prediction, but the error accumulation may degrade the accuracy. A future improvement is to enhance the long-time prediction ability.
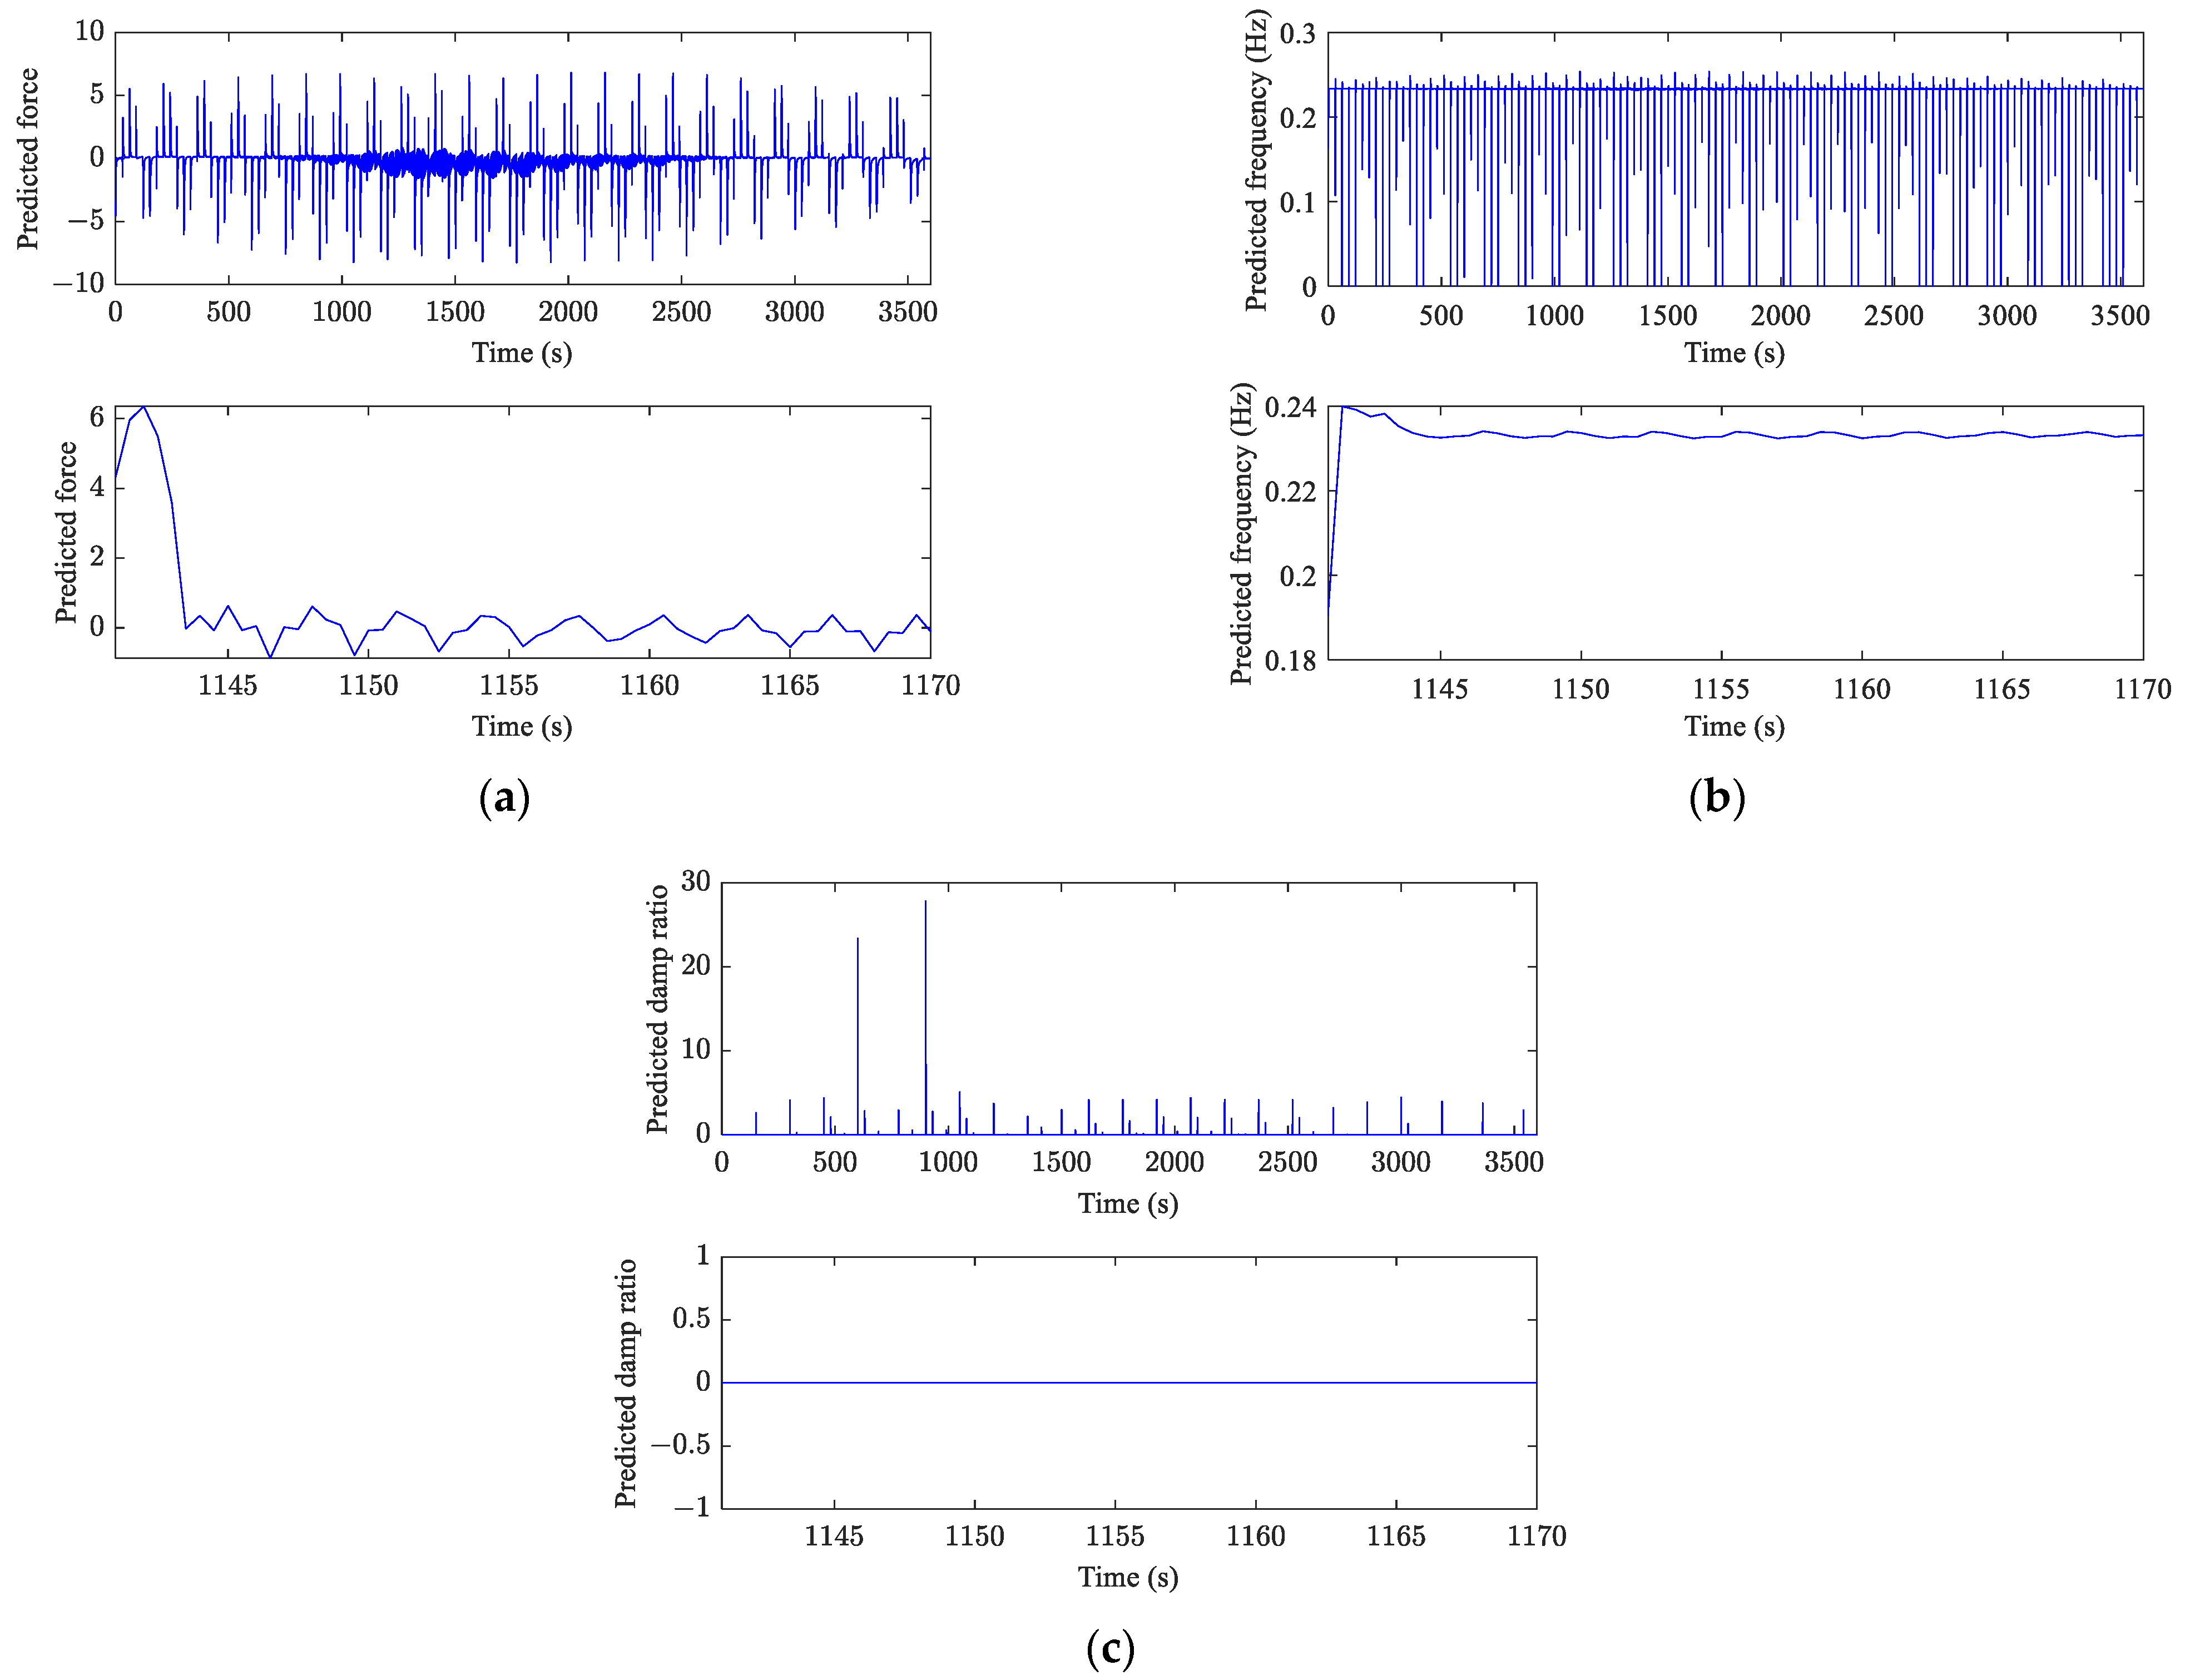
Due to the fact that there are no similar approaches for predicting the time history of VIV response, the novelty of the proposed model is discussed as follows. First of all, the interpretability of the proposed model is discussed by analyzing the middle output of the trained model. The middle outputs of typical prediction I are selected as an example and are presented in Figure 9. As shown in Figure 9, the middle outputs have a sudden change. The main reason behind this phenomenon is that the generated initial hidden-state vectors are not close enough to the ideal initial hidden-state vectors, and the inaccurate initial vector may cause the deviation of the modal characteristics and normalized force from the real ones. However, with the trained model handling the sequence, the generated modal characteristics and normalized force stabilize and represent some patterns. For the predicted frequency, it can be seen that it lies in the range between 0.2 and 0.3 Hz, which is deviated from the real modal frequency of the vortex-induced vibration. For the predicted damp ratio, it is convergent to zero, which is deviated from the real damp ratio. For the predicted force, it oscillates near zero. With the predicted frequency and predicted damp ratio deviating from the real values, it is likely that the predicted force also deviates from the real value.
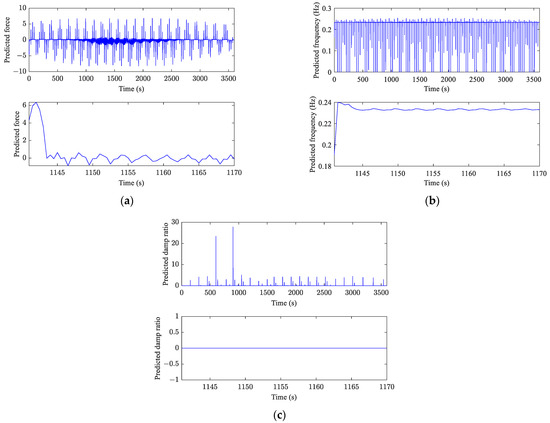
Figure 9.
Middle outputs of typical prediction I: (a) predicted force; (b) predicted frequency; (c) predicted damp ratio.
It can be concluded that the physical meaning of the middle output is not consistent with its pre-designed role. The reason behind this phenomenon is that no physical restrictions other than response measurements are put on these middle outputs. Therefore, the individual role of these middle outputs can be mispositioned. More physical restrictions are needed to enhance the interpretability of the proposed model and help the understanding of the mechanism of the vortex-induced vibration of full-scale bridges, which is another future improvement.
Secondly, the effectiveness of the weighted mean square error loss function is validated by comparing the prediction accuracy of the model trained by optimizing WMSE and that of the model trained by optimizing mean square error (MSE). It should be noted that these two models are of the same structure, and the key difference is the loss function. The summary of accuracies is shown in Table 3 and a comparison of typical VIV events is shown in Figure 10.
Table 3.
The summary of prediction accuracies.
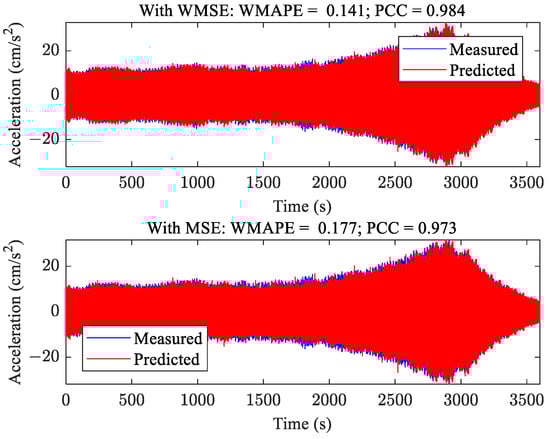
Figure 10.
Comparison of typical predictions.
As shown in Table 3, the prediction accuracy of the model trained by optimizing WMSE is higher than that of the model trained by optimizing MSE, especially for WMAPE which put more emphasis on the amplitude. As shown in Figure 1, the model trained by optimizing WMSE can predict the VIV event of large amplitude more accurately than the model trained by optimizing MSE. Therefore, it can be concluded that the WMSE can aid in the accurate prediction of the amplitude of a VIV event.
The advantages of the proposed model are as follows. First of all, the proposed model can predict the time history of VIV response, with which both the time-domain characteristics and the frequency-domain characteristics can be predicted and analyzed. Secondly, a physics-enhanced strategy is applied to construct the proposed model, with which the relationship among responses can be utilized and the physical meaning of the middle output can be complemented. Thirdly, the proposed model employs a modified version of mean square error as a loss function, with which the amplitude of VIV response can be predicted more accurately. By validating the proposed model with the monitored VIV events, some conclusions can be obtained. The proposed model can predict the time history of VIV response accurately, and there are some patterns in the middle output. The WMSE is proven to be effective in training the proposed model.
The limitations of applying the used method are as follows. First of all, because of the error accumulation, the effective length of prediction of the proposed model is limited. Therefore, the proposed model can only provide a prediction of VIV response within a small time interval. Secondly, the physical meaning of middle output is not clear because of the lack of enough physical constraints. The proposed model is not fully prepared to uncover the underlying mechanism of VIV events. Therefore, future research should focus on enhancing the capacity for long-term prediction and the interpretability of the proposed model.
The numerical cost of the proposed method consists of two parts, which are the training part and the prediction part. In the training part, the numerical cost depends on the training specifics and the amount of data, which can take hours to days. However, the training part needs only one execution. Once the model is trained, in the prediction part, the model can perform prediction within seconds.
5. Conclusions
In this paper, we propose a machine learning-based model for predicting vortex-induced vibrations of a full-scale long-span suspension bridge. Different from previous research, this paper focuses on predicting the time history of the dynamic response, with which the characteristics of amplitude, phase and frequency can then be obtained. In the proposed model, gated recurrent unit neural network is selected as the basic module for its outstanding capacity to handle sequences. Fully connected neural networks are employed to generate the initial hidden-state vectors of the GRU neural network to enhance its generalization to structures with an arbitrary initial state. The Newmark-beta method is introduced into the model to utilize the relationship among acceleration, velocity and displacement to better manage the evolution of the dynamic response and enhance the interpretability of the proposed model. A novel weighted form of mean square error loss function is proposed and applied to help the model put more emphasis on the dynamic response of large amplitude, with which the trained model can predict the vortex-induced vibration of large amplitude more accurately.
The proposed model is validated on the monitored VIV events of a long-span suspension bridge. The WMAPE and PCC of the trained model on the testing set indicate that the trained model can predict the amplitude and the phase of the dynamic response of the vortex-induced vibration accurately. Typical predictions of VIV events indicate that the trained model can make accurate predictions of VIV events of various shapes and amplitudes. Furthermore, an analysis of the physical meaning of the middle output and the effectiveness of WMSE is conducted. Middle outputs are convergent to certain patterns, but their physical meanings are deviated from the pre-designed roles, which demands the introduction of more knowledge about the underlying mechanism. WMSE is proven to be effective in training the proposed model. Future research is needed to enhance long-time prediction and interpretability.
Author Contributions
Conceptualization, Y.W., H.F. and S.L.; methodology, Y.W., H.F. and S.L.; software, H.F.; validation, Y.W., H.F., N.X., J.Z., Z.W., W.Y., Y.J. and S.L.; formal analysis, Y.W., H.F., N.X., J.Z., Z.W., W.Y., Y.J. and S.L.; investigation, Y.W., H.F., N.X., J.Z., Z.W., W.Y., Y.J. and S.L.; resources, S.L.; data curation, H.F. and S.L.; writing—original draft preparation, Y.W., H.F. and S.L.; writing—review and editing, Y.W., H.F. and S.L.; visualization, Y.W., H.F. and S.L.; supervision, S.L.; project administration, S.L.; funding acquisition, S.L. All authors have read and agreed to the published version of the manuscript.
Funding
This research was funded by the National Key Research and Development Program of China (2022YFC3005303), the Open Projects Foundation (BHSKL20-01-KF) of the National Key Laboratory of Bridge Intelligent and Green Construction, the National Natural Sciences Foundation of China (NSFC) (Grant No. 52178470), the Natural Science Foundation of Heilongjiang Province under Grant No. YQ2021E033, the Postdoctoral Scientific Research Development Fund of Heilongjiang Province under Grant No. LBH-Q20021, and Heilongjiang Touyan Team and Fundamental Research Funds for the Central Universities.
Data Availability Statement
The data presented in this study are available on request from the corresponding author. The data are not publicly available for confidentiality reasons.
Conflicts of Interest
The authors declare no conflicts of interest. The funders had no role in the design of the study; in the collection, analyses or interpretation of data; in the writing of the manuscript; or in the decision to publish the results.
References
- Chen, S.R.; Cai, C.S. Accident Assessment of Vehicles on Long-Span Bridges in Windy Environments. J. Wind Eng. Ind. Aerodyn. 2004, 92, 991–1024. [Google Scholar] [CrossRef]
- Wang, H.; Mao, J.-X.; Spencer, B.F. A Monitoring-Based Approach for Evaluating Dynamic Responses of Riding Vehicle on Long-Span Bridge under Strong Winds. Eng. Struct. 2019, 189, 35–47. [Google Scholar] [CrossRef]
- Ren, H.; Ke, S.; Dudhia, J.; Li, H. Wind Disaster Assessment of Landfalling Typhoons in Different Regions of China over 2004–2020. J. Wind Eng. Ind. Aerodyn. 2022, 228, 105084. [Google Scholar] [CrossRef]
- Fujino, Y.; Siringoringo, D. Vibration Mechanisms and Controls of Long-Span Bridges: A Review. Struct. Eng. Int. 2013, 23, 248–268. [Google Scholar] [CrossRef]
- Frandsen, J.B. Simultaneous Pressures and Accelerations Measured Full-Scale on the Great Belt East Suspension Bridge. J. Wind Eng. Ind. Aerodyn. 2001, 89, 95–129. [Google Scholar] [CrossRef]
- Fujino, Y.; Yoshida, Y. Wind-Induced Vibration and Control of Trans-Tokyo Bay Crossing Bridge. J. Struct. Eng. 2002, 128, 1012–1025. [Google Scholar] [CrossRef]
- Larsen, A.; Esdahl, S.; Andersen, J.E.; Vejrum, T. Storebælt Suspension Bridge—Vortex Shedding Excitation and Mitigation by Guide Vanes. J. Wind Eng. Ind. Aerodyn. 2000, 88, 283–296. [Google Scholar] [CrossRef]
- Li, H.; Laima, S.; Ou, J.; Zhao, X.; Zhou, W.; Yu, Y.; Li, N.; Liu, Z. Investigation of Vortex-Induced Vibration of a Suspension Bridge with Two Separated Steel Box Girders Based on Field Measurements. Eng. Struct. 2011, 33, 1894–1907. [Google Scholar] [CrossRef]
- Li, S.; Laima, S.; Li, H. Cluster Analysis of Winds and Wind-Induced Vibrations on a Long-Span Bridge Based on Long-Term Field Monitoring Data. Eng. Struct. 2017, 138, 245–259. [Google Scholar] [CrossRef]
- Liu, J.; Hui, Y.; Wang, J.; Yang, Q. LES Study of Windward-Face-Mounted-Ribs’ Effects on Flow Fields and Aerodynamic Forces on a Square Cylinder. Build. Environ. 2021, 200, 107950. [Google Scholar] [CrossRef]
- Weber, F.; Maślanka, M. Frequency and Damping Adaptation of a TMD with Controlled MR Damper. Smart Mater. Struct. 2012, 21, 055011. [Google Scholar] [CrossRef]
- Li, S.; Laima, S.; Li, H. Data-Driven Modeling of Vortex-Induced Vibration of a Long-Span Suspension Bridge Using Decision Tree Learning and Support Vector Regression. J. Wind Eng. Ind. Aerodyn. 2018, 172, 196–211. [Google Scholar] [CrossRef]
- Skop, R.A.; Griffin, O.M. A Model for the Vortex-Excited Resonant Response of Bluff Cylinders. J. Sound Vib. 1973, 27, 225–233. [Google Scholar] [CrossRef]
- Iwan, W.D.; Blevins, R.D. A Model for Vortex Induced Oscillation of Structures. J. Appl. Mech. 1974, 41, 581–586. [Google Scholar] [CrossRef]
- Ehsan, F.; Scanlan, R.H. Vortex-Induced Vibrations of Flexible Bridges. J. Eng. Mech. 1990, 116, 1392–1411. [Google Scholar] [CrossRef]
- Chen, S.S.; Zhu, S.; Cai, Y. An Unsteady Flow Theory for Vortex-Induced Vibration. J. Sound Vib. 1995, 184, 73–92. [Google Scholar] [CrossRef]
- Kim, S.; Kim, T. Machine-Learning-Based Prediction of Vortex-Induced Vibration in Long-Span Bridges Using Limited Information. Eng. Struct. 2022, 266, 114551. [Google Scholar] [CrossRef]
- Li, S.; Laima, S.; Li, H. Physics-Guided Deep Learning Framework for Predictive Modeling of Bridge Vortex-Induced Vibrations from Field Monitoring. Phys. Fluids 2021, 33, 037113. [Google Scholar] [CrossRef]
- Hu, G.; Liu, L.; Tao, D.; Song, J.; Tse, K.T.; Kwok, K.C.S. Deep Learning-Based Investigation of Wind Pressures on Tall Building under Interference Effects. J. Wind Eng. Ind. Aerodyn. 2020, 201, 104138. [Google Scholar] [CrossRef]
- Lin, P.; Hu, G.; Li, C.; Li, L.; Xiao, Y.; Tse, K.T.; Kwok, K.C.S. Machine Learning-Based Prediction of Crosswind Vibrations of Rectangular Cylinders. J. Wind Eng. Ind. Aerodyn. 2021, 211, 104549. [Google Scholar] [CrossRef]
- Lei, X.; Feng, R.; Dong, Y.; Zhai, C. Bayesian-Optimized Interpretable Surrogate Model for Seismic Demand Prediction of Urban Highway Bridges. Eng. Struct. 2024, 301, 117307. [Google Scholar] [CrossRef]
- Aloisio, A.; Contento, A.; Alaggio, R.; Quaranta, G. Physics-Based Models, Surrogate Models and Experimental Assessment of the Vehicle–Bridge Interaction in Braking Conditions. Mech. Syst. Signal Process. 2023, 194, 110276. [Google Scholar] [CrossRef]
- Wu, T.; Kareem, A. Modeling Hysteretic Nonlinear Behavior of Bridge Aerodynamics via Cellular Automata Nested Neural Network. J. Wind Eng. Ind. Aerodyn. 2011, 99, 378–388. [Google Scholar] [CrossRef]
- Mannarino, A.; Mantegazza, P. Nonlinear Aeroelastic Reduced Order Modeling by Recurrent Neural Networks. J. Fluids Struct. 2014, 48, 103–121. [Google Scholar] [CrossRef]
- Sun, L.; Shang, Z.; Xia, Y.; Bhowmick, S.; Nagarajaiah, S. Review of Bridge Structural Health Monitoring Aided by Big Data and Artificial Intelligence: From Condition Assessment to Damage Detection. J. Struct. Eng. 2020, 146, 04020073. [Google Scholar] [CrossRef]
- Flah, M.; Nunez, I.; Ben Chaabene, W.; Nehdi, M.L. Machine Learning Algorithms in Civil Structural Health Monitoring: A Systematic Review. Arch. Comput. Methods Eng. 2021, 28, 2621–2643. [Google Scholar] [CrossRef]
- Liu, P.; Chu, X.; Cui, W.; Zhao, L.; Ge, Y. Bayesian Inference Based Parametric Identification of Vortex-Excited Force Using on-Site Measured Vibration Data on a Long-Span Bridge. Eng. Struct. 2022, 266, 114597. [Google Scholar] [CrossRef]
- Yan, W.-J.; Feng, Z.-Q.; Yang, W.; Yuen, K.-V. Bayesian Inference for the Dynamic Properties of Long-Span Bridges under Vortex-Induced Vibration with Scanlan’s Model and Dense Optical Flow Scheme. Mech. Syst. Signal Process. 2022, 174, 109078. [Google Scholar] [CrossRef]
- Karniadakis, G.E.; Kevrekidis, I.G.; Lu, L.; Perdikaris, P.; Wang, S.; Yang, L. Physics-Informed Machine Learning. Nat. Rev. Phys. 2021, 3, 422–440. [Google Scholar] [CrossRef]
- Pateras, J.; Rana, P.; Ghosh, P. A Taxonomic Survey of Physics-Informed Machine Learning. Appl. Sci. 2023, 13, 6892. [Google Scholar] [CrossRef]
- Chen, D.; Yang, J.; Kitipornchai, S. Free and Forced Vibrations of Shear Deformable Functionally Graded Porous Beams. Int. J. Mech. Sci. 2016, 108–109, 14–22. [Google Scholar] [CrossRef]
- Wang, X.; Wu, S.; Yin, J.; Moradi, Z.; Safa, M.; Amine Khadimallah, M. On the Electromechanical Energy Absorption of the Reinforced Composites Piezoelectric MEMS via Adaptive Neuro-Fuzzy Inference System and MCS Theory. Compos. Struct. 2023, 303, 116246. [Google Scholar] [CrossRef]
- Chung, J.; Gulcehre, C.; Cho, K.; Bengio, Y. Empirical Evaluation of Gated Recurrent Neural Networks on Sequence Modeling. arXiv 2014, arXiv:1412.3555. [Google Scholar]
- Graves, A.; Jaitly, N. Towards End-to-End Speech Recognitionwith Recurrent Neural Networks. arXiv 2017, arXiv:1701.02720. [Google Scholar]
- Kingma, D.P.; Ba, J. Adam: A Method for Stochastic Optimization 2017. arXiv 2017, arXiv:1412.6980. [Google Scholar]


Disclaimer/Publisher’s Note: The statements, opinions and data contained in all publications are solely those of the individual author(s) and contributor(s) and not of MDPI and/or the editor(s). MDPI and/or the editor(s) disclaim responsibility for any injury to people or property resulting from any ideas, methods, instructions or products referred to in the content. |
© 2024 by the authors. Licensee MDPI, Basel, Switzerland. This article is an open access article distributed under the terms and conditions of the Creative Commons Attribution (CC BY) license (https://creativecommons.org/licenses/by/4.0/).