Article

Radiological Measurement of Sella Turcica Dimensions in Different Skeletal Patterns in Romanian Patients

by
Camelia-Alexandrina Szuhanek
1,
Anca-Patricia Uzun
1,*,
Atena Galuscan
2,
Vlad Tiberiu Alexa
2,
Liviu-Cristian Romanec
3 and
Dana-Gabriela Feştilă
4
1
Orthodontic Research Center ORTHO-CENTER, Discipline of Orthodontics I, Faculty of Dental Medicine, “Victor Babeş” University of Medicine and Pharmacy Timisoara, 9 No., Revolutiei Bv., 300041 Timisoara, Romania
2
Translational and Experimental Clinical Research Centre in Oral Health, Department of Preventive, Community Dentistry and Oral Health, “Victor Babeş” University of Medicine and Pharmacy Timisoara, 300040 Timisoara, Romania
3
Faculty of Dental Medicine, University of Medicine and Pharmacy Grigore T Popa, 700115 Iasi, Romania
4
Orthodontic Department, Faculty of Dental Medicine, University of Medicine and Pharmacy “Iuliu Hatieganu” Cluj-Napoca, 400347 Cluj-Napoca, Romania
*
Author to whom correspondence should be addressed.
Appl. Sci. 2024, 14(5), 2164; https://doi.org/10.3390/app14052164
Submission received: 15 January 2024 / Revised: 24 February 2024 / Accepted: 25 February 2024 / Published: 5 March 2024
(This article belongs to the Section Applied Dentistry and Oral Sciences)

Abstract

:
(1) Background: The purpose of this study was to evaluate the morphology and linear dimensions of sella turcica in Romanian participants from all three skeletal classes to see whether there were any differences. (2) Method: We examined 90 lateral cephalometric radiographs of patients aged 12 and older and divided them into skeletal classes I, II, and III (30 participants in each). Sella turcica linear measurements such as length, depth, and anteroposterior diameter were measured and studied. To see the nature of our data, Q–Q plots tests were performed. By examining these tests performed for each variable belonging to a particular class, it can be noted that the points are fairly well distributed along some lines, meaning that the data are normally distributed. An Anova test with Bonferroni correction was used to compare the mean values of the examined parameters between the classes. Also, to observe the correlation between our experimental data, the Pearson correlation coefficient was calculated. (3) Results: In all three skeletal classes, the average length of the sella was 8.98 mm ± 1.470, the average depth was 7.99 mm ± 1.081, and the average diameter was 10.29 mm ± 1.267. For all examined linear dimensions, there was a statistically significant difference between class I and class III subjects and between class II and class III subjects (p < 0.001). The morphology of sella turcica was found to be normal in 51.1% of instances, representing the majority across all skeletal classes. In the Romanian population, sella turcica has shown a significant amount of variation. Class III subjects had larger sella dimensions, whereas class II subjects had smaller values. (4) Conclusions: The measurements and morphology of the sella analysed in the present research can serve as standards for subsequent research concerning the sella turcica region in individuals from Romania.

1. Introduction

Lateral cephalometric radiography is a paraclinical study that orthodontists routinely use in diagnosis, treatment planning, and treatment outcome assessment [1]. Correct craniofacial skeletal analysis is dependent on recognising and finding anatomical and structural landmarks. The centre of the sella turcica is a useful reference point for determining the location of the jaw in relation to the base of the skull [2].
Previously, orthodontists would trace lateral cephalometric analysis drawings by hand on translucent tracing paper, a laborious and time-consuming task. The quality of the procedure relies on the expertise of the person performing it, and this quality can vary between different orthodontists. This inconsistency has a substantial impact on the effectiveness and precision of clinical therapy [3].
Artificial intelligence (AI), a field of study within computer science, focuses on developing and studying algorithms that can handle both basic and complex tasks, often rendered as a software product [4]. Currently, the field of medicine predominantly utilises a subset of artificial intelligence known as machine learning (ML) and, more recently, a branch named deep learning (DL), specifically a subsection of artificial neural networks (ANN) named convolutional neural networks (CNN) [5,6,7].
The use of artificial intelligence (AI) has steadily increased in the fields of medicine and dentistry in recent years. It is applied in endodontics to diagnose dental decay, periapical lesions, fissures of the roots, the degree of difficulty of the case, the efficacy of retreatment, the morphology of the root canal system, and the working length. It has been used in robotic semi-automated surgery and image-guided surgery within the field of oral and maxillofacial surgery. AI is used in dental education to generate clinical outcomes and scenarios in order to create high-quality educational environments. It is utilised for treatment planning, result simulation, analysis of radiographs, pressure points for tooth movement, and 3D aligners in orthodontics [8].
In cephalometry, automated landmark identification was first documented in the mid-1980s, but the level of inaccuracy was too significant to be applied in clinical practice [9]. As technology advanced, lateral cephalometric analyses transitioned to digital platforms, resulting in notable enhancements in terms of speed, quality, and dependability [10].
The orthodontist may choose between manually identifying each cephalometric point or allowing the software to automatically identify the landmarks. Subsequently, the computer constructs the lines and calculates the measurement values for the angles associated with these landmarks.
Most of the artificial intelligence algorithms implemented for automatic landmark tracing on lateral cephalometric radiographs exhibit a high level of accuracy. A significant number of studies reported a confidence interval within a range of 2 mm, with the mean percentage of accurately identified landmarks being over 80%. Nevertheless, in terms of clinical assessment, a localization error of up to 2 mm may be deemed acceptable for certain sites in a cephalometric examination, but not for all [11]. Precise localization of cephalometric sites A and B in the horizontal plane is essential for determining the maxillary and mandibular relations in the sagittal plane.
The pituitary gland is situated in a saddle-shaped concavity in the body of the sphenoid bone called the sella turcica. It is limited anteriorly by the tuberculum sella and posteriorly by the dorsum sellae, which is a square-shaped bone. The posterior clinoid processes are two tubercles found at the upper end of the dorsum sellae [12,13]. The anterior clinoid processes are part of the sphenoid bone’s small wings. The sella turcica is surrounded by the anterior and posterior clinoid processes [14].
The embryological development of sella turcica is linked to the development of craniofacial bone, with the anterior section emerging from neural crest cells and the posterior part forming from paraxial mesodermal cells. The sella turcica is involved in the migration of neural crest cells to the frontonasal and maxillary sites during embryological development. While fronto-nasal anomalies are connected with anomalies of the anterior wall of the sella turcica, brain development problems are associated with anomalies of the posterior wall of the sella turcica [15,16].
Any dysfunction or abnormality of the pituitary gland can express itself in a variety of ways, from affecting the form or size of the sella turcica to altering hormone secretion regulation. These disruptions can subsequently lead to growth issues like acromegaly or gigantism, galactorrhoea, amenorrhoea, hyperthyroidism, irregular periods, and Cushing’s disease [17]. In some situations, radiographs of individuals with these illnesses may show an aberrant sella region, or vice versa; patients with an abnormal sella turcica may have an undiagnosed underlying disease [18]. Kucia et al. found that children with an aberrant saddle structure, particularly those with calcifications, have a substantially higher angle of inclination of the incisors and a more distal position of the mandible’s alveolar process [15].
There are differences in the skeletal, dental, and soft-tissue characteristics among different population groups. Therefore, it is important to comprehend the cephalometric standards for each population group [19]. An assessment of the sella turcica area should be conducted to see whether there are any abnormalities in its form and size. Differences in morphology may exist, and implementing consistent criteria may aid in identifying such discrepancies. On lateral cephalometric radiography, the purpose of the study was to define the cephalometric norms for the Romanian population and to evaluate whether or not there were any variations in the size and morphology of the sella turcica in patients who had skeletal classes I, II, and III.

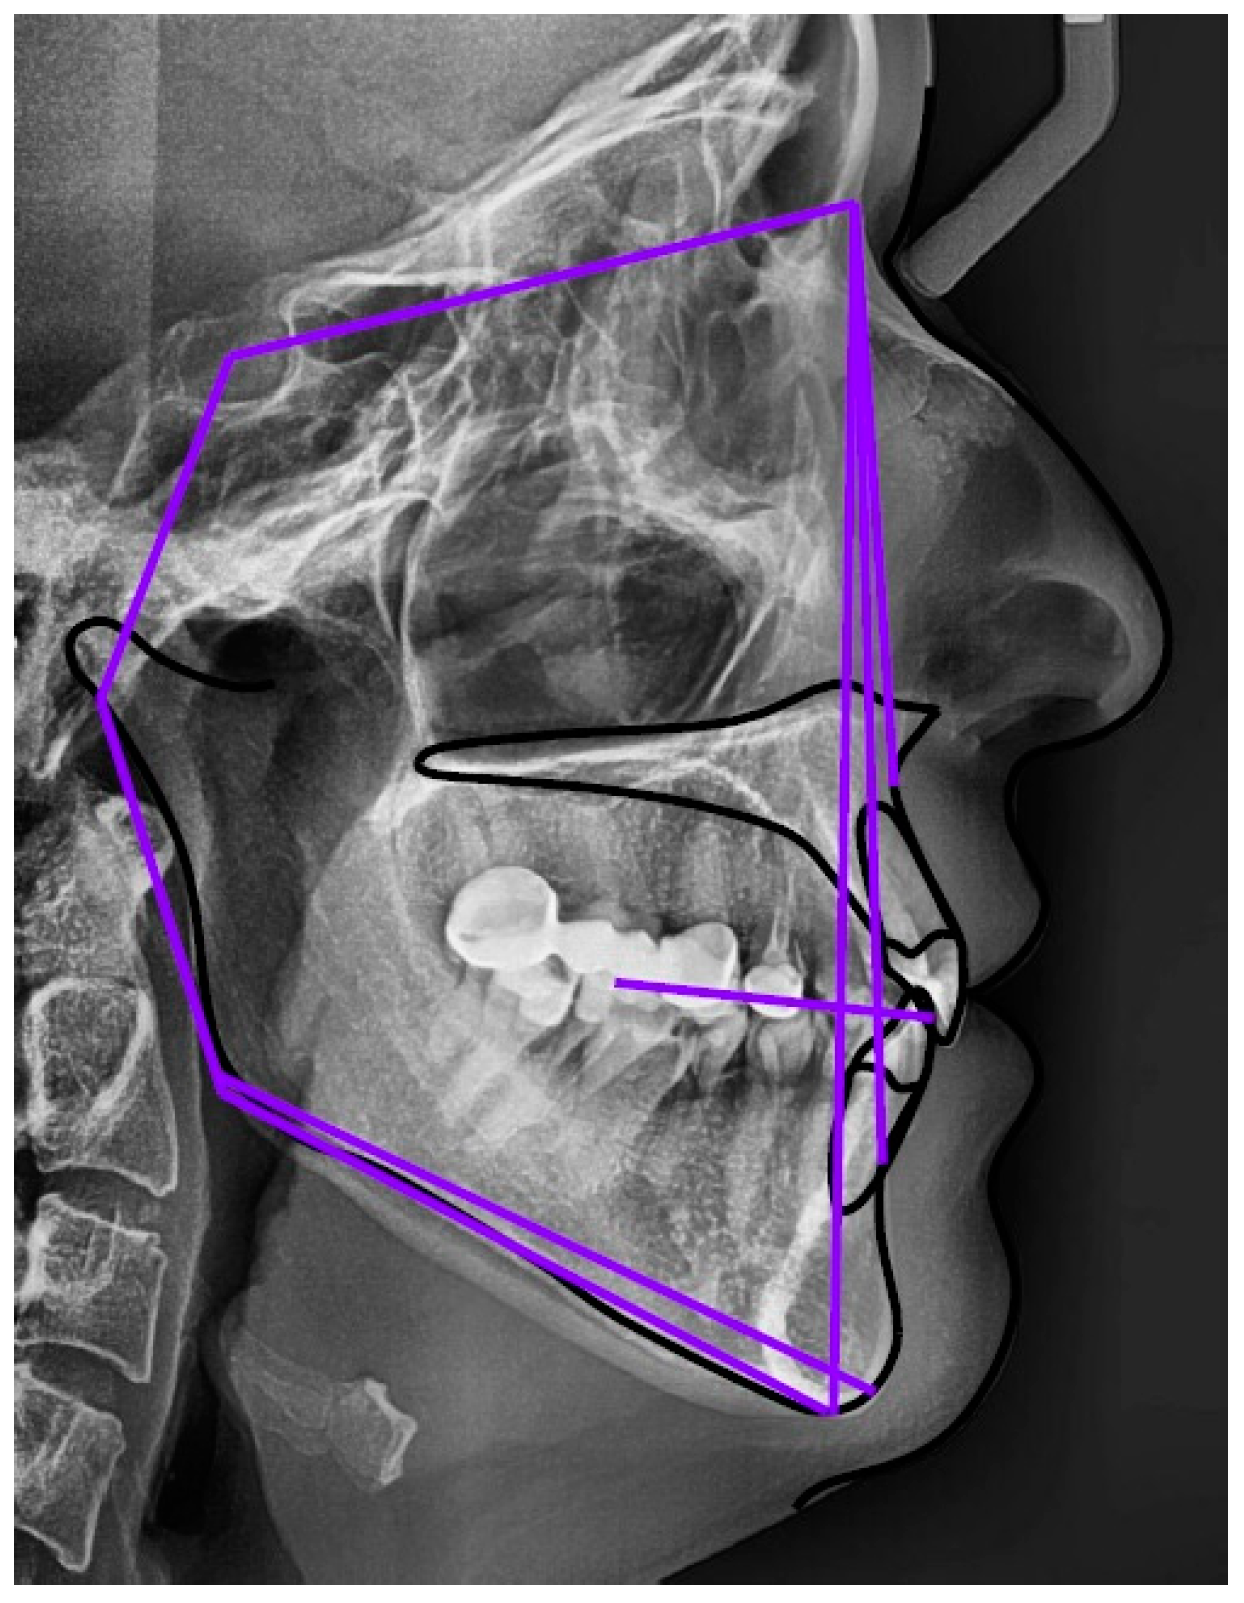
2. Materials and Methods

We examined 90 radiographs (30 from each skeletal class) from Romanian patients over the age of 12. Previous research has discovered that the morphology of the sella turcica does not change substantially after 12 years old [20] (Table A1). We did not account for patient sex in our study due to contentious findings in the existing research [20,21].
Participants who had a history of maxillofacial trauma, endocrine disorders, or patients who were taking hormonal medications or corticosteroids, those with a history of orthognathic surgery, or individuals with neurologic disturbances, syndromic or non-syndromic craniofacial clefts, were not allowed to participate in the study (Table 1).
The samples for the study were selected from patients attending the Discipline of Orthodontics I, Faculty of Dental Medicine, “Victor Babeş” University of Medicine and Pharmacy Timisoara. Each and every person who took part in the study was required to provide written informed consent. The ethical clearance was obtained from the Institutional Ethics Committee of the University of Medicine and Pharmacy “Victor Babes” in Timişoara, Romania (CECS nr.13/26.03.2021).
Teleradiographies were taken using a PaX-i3D Green (Vatech, Hwaseong, Republic of Korea) device and the same cephalostat was used in a standardised manner by qualified radiography technicians. Only radiographs of the sella turcica area with the clearest rendering were chosen. For reliable estimation of medio-sagittal distances, a scale with specified dimensions was attached to the cephalostat.

2.1. Distribution into Skeletal Classes

To determine the distribution of the subjects into a skeletal class, the following cephalometric landmarks were utilised: S—Sella; N—Nasion; point A and point B [2].
The AudaxCeph® version 6.4.18.4523 software package was used to determine the ANB angle (SNA and SNB) from the Stiener analysis (Figure 1). AudaxCeph® ph provides a completely automated cephalometric tracing system that utilises artificial intelligence and deep learning techniques. This system has demonstrated high accuracy for most landmarks, with the exception of unreliable points such as Porion and Orbitale [22]. In this study, we used AI tracing to accurately position the cephalometric points while also ensuring additional supervision from an orthodontist.
The posteroinferior angle that exists between the SN plane and the NA plane is referred to as the SNA angle. This angle determines whether the maxilla is protruded or retruded by positioning the upper jaw sagittally in relation to the base of the skull. When the SN plane and the NB plane meet, the posteroinferior angle is known as the SNB angle. This angle is used to identify the position of the mandible and determine if it is protruding or retruding.
The ANB angle quantifies the disparity between the two anterior angles and determines the anteroposterior relationship that exists between the maxilla and mandible. It is a diagnostic mark used to differentiate between various skeletal or dental classes. Patients with an ANB angle between 2° and 4° were assigned as class I, patients with an angle greater than 4° as class II, and patients with an angle less than 2° as class III, as described by Plaza et al. [23].

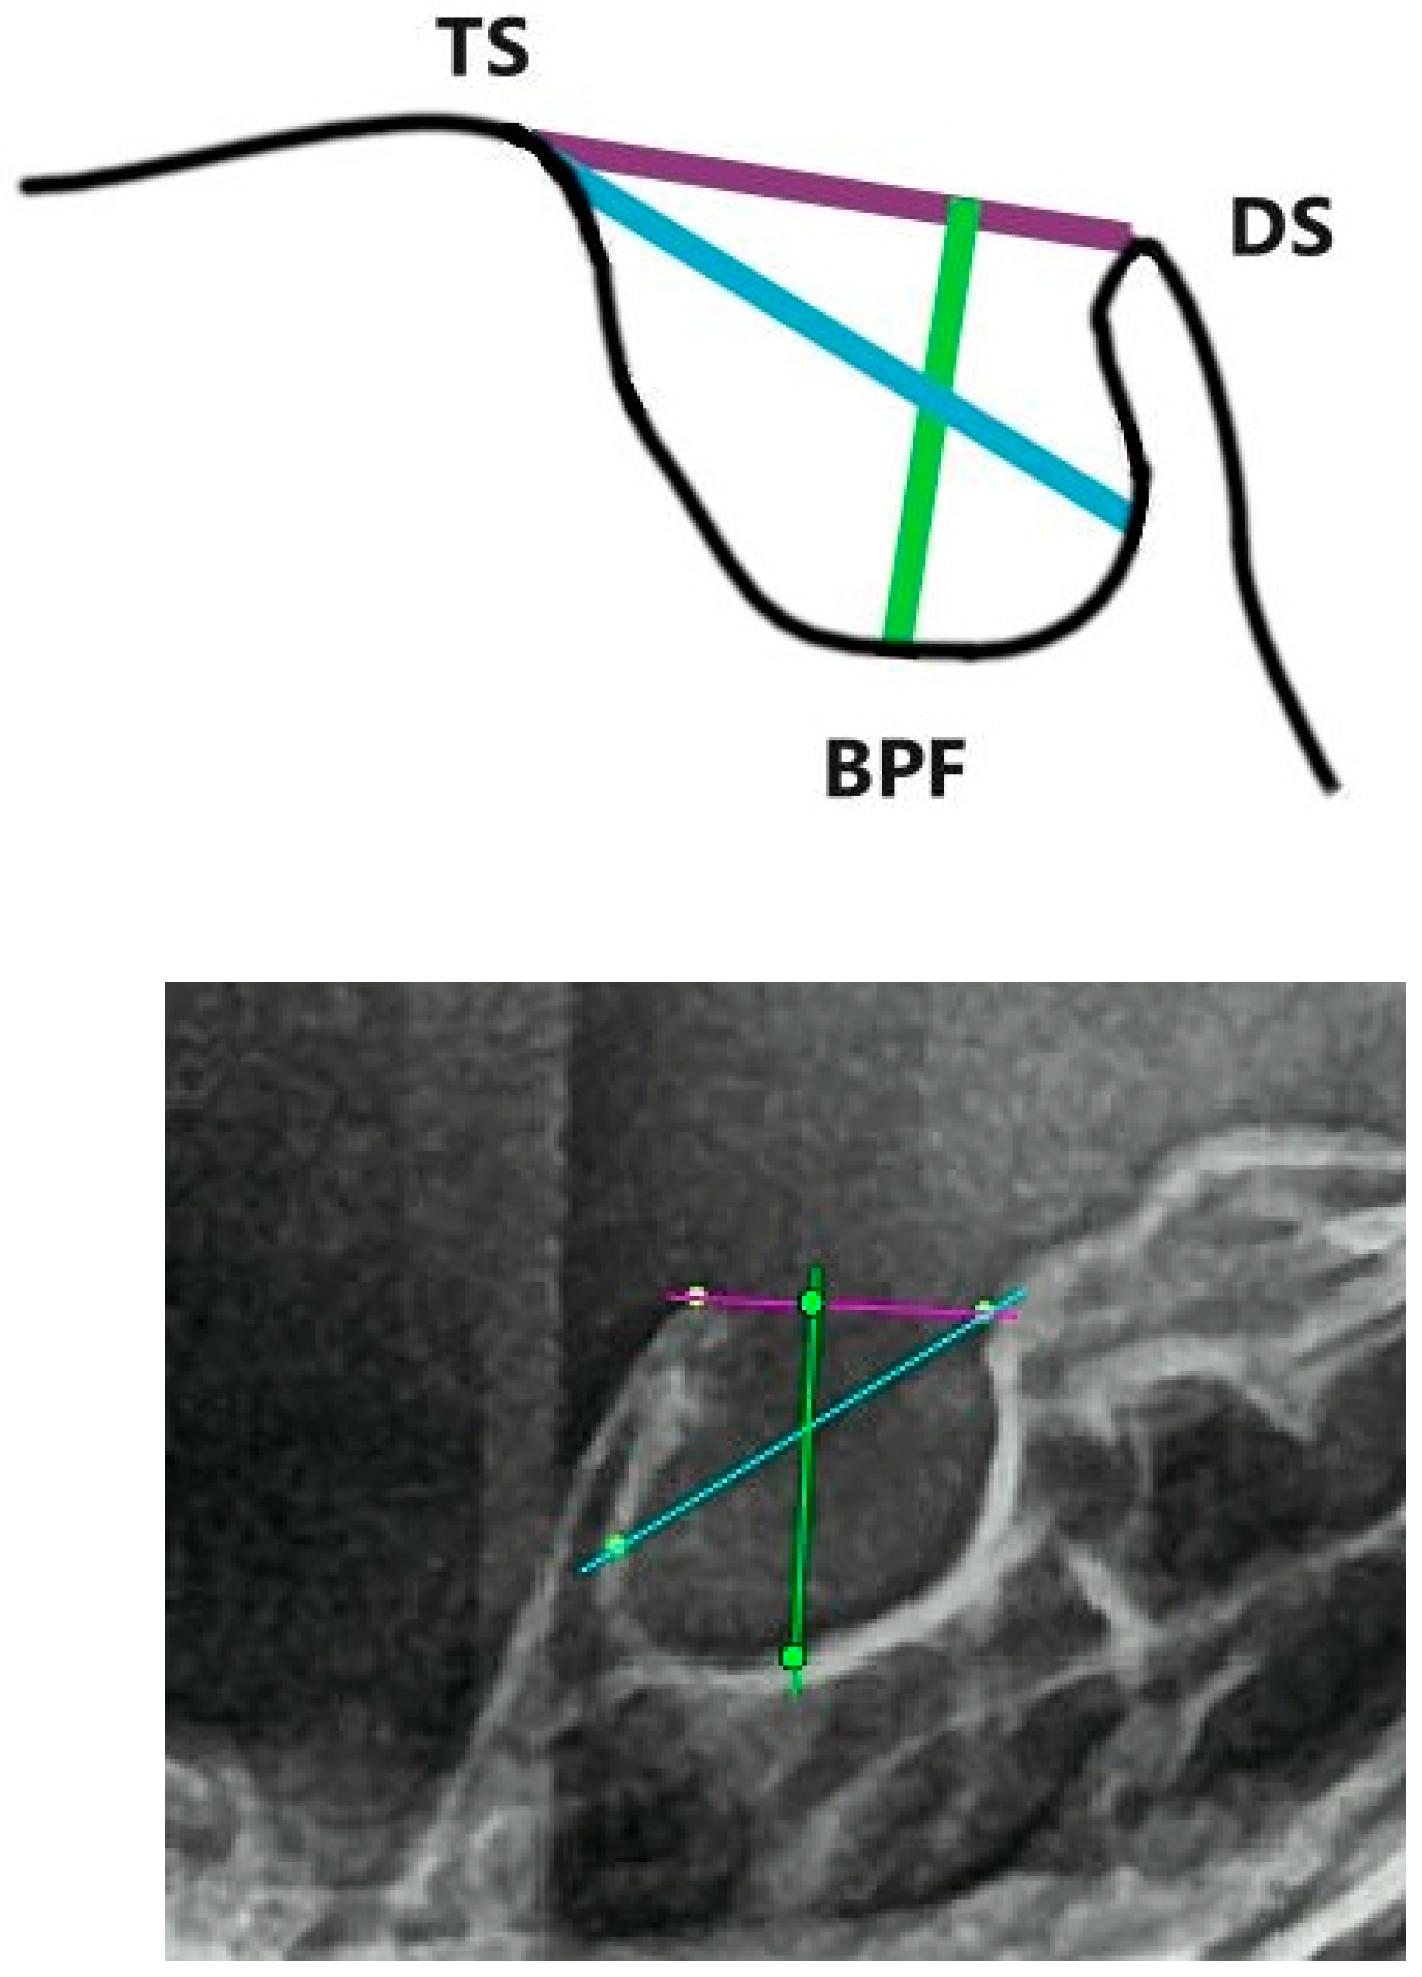
2.2. Dimensions of Sella Turcica

The dimensions of the sella turcica were measured using AudaxCeph® (Audax d.o.o., Ljubljana, Slovenia) software, utilising the method described by Silverman and Kisling [21,24].
To determine the length, we measured the distance between the tuberculum sellae and the tip of the dorsum sellae. The depth is represented by the distance between the previously drawn line and the deepest point of the pituitary fosa. The antero-posterior diameter is the line traced from the tuberculum sellae to the most posterior point on the inner wall of the dorsum sellae (Table A1) (Figure 2).

2.3. Morphology of Sella Turcica

The shape of the sella tucica was classified based on the findings of Axellson’s study, which revealed that, in addition to the typical morphology, there are five variations in the morphology of the sella [25]. The oblique anterior wall, the double contour of the floor, irregularities in the posterior region of the dorsum sellae, sella turcica bridge, and the pyramidal shape of the dorsum sellae are all examples of these variants (Figure 3).

2.4. Statistical Analysis

In order to examine the nature of our data, Q–Q plots were conducted. Upon evaluating the tests conducted for each variable in each skeletal class, we discovered that the data points were distributed uniformly along straight lines, indicating a normal distribution of the data. A one-way analysis of variance (ANOVA) test with Bonferroni correction was utilised to compare the mean values of the studied parameters across the different classes. In addition, we calculated the Pearson correlation coefficient to examine the relationship between our experimental results. All analyses were performed using R Statistical Software (v4.2.2; R Core Team 2023) and Microsoft Excel 2021 v 16.0.

3. Results

3.1. Sella Turcica Dimensions

The linear dimensions of the sella turcica, located in the area of the medio-sagittal plane, are shown in Table 2. After measuring the sella turcica in 90 cases, the average length was 8.98 mm ± 1.470, the average depth was 7.99 mm ± 1.081, and the average diameter was 10.29 mm ± 1.267. The dimensions’ minimum and maximum values were discovered in classes II and III, respectively. With a diameter of 13.94 millimetres, the sella turcica was the largest measurement that was observed in skeletal Class III. This is in contrast to the 11.68 millimetres that were observed in class I and the 11.32 millimetres that were observed in class II.

3.2. Morphology of Sella Turcica

The normal morphology of the sella turcica was observed in 46 of the 90 individuals, which was the majority (51.1%) in the study group (Table 3). Variations in the shape of the sella were present in 48.9% of the subjects: the irregular posterior wall (of the dorsum sellae) was found in 11.1% of cases, a pyramidal shape of the posterior wall was present in 10% of cases, an oblique anterior wall was found in 10% of cases, a sella turcica bridge was found in 10% of cases, and a double contour was found in 7% of cases.
Across all skeletal classes, the normal morphology of the sella was the most prevalent. The pyramidal shape of the posterior wall was more frequently encountered in those belonging to class II compared with those belonging to class III (Figure 4). Class III individuals were more likely to have an irregular posterior wall and sella bridging. There was no significant difference between sella turcica shapes and skeletal classes.

3.3. Statistical Analysis of the Experimental Data

In the first step, all data (length, diameter, and depth) belonging to each class were analysed using Q–Q plots tests, with the aim of seeing the nature of their distribution. In Figure 5, we can see the Q–Q plots tests, performed for length for each of the classes I, II, and III, respectively. Examining these graphs, we can see that most of the points are linearly distributed, which clearly indicates a normal distribution of the respective data. The same can be seen for diameter (Figure 6) and depth (Figure 7), for each of the three classes separately.
From In Figure 5, it can be seen that almost all the points are arranged on a straight line, with some minor fluctuations. Thus, we can conclude that they are approximately normally distributed when examining the length of the sella turcica.
The same type of arrangement, along a line, can be seen both in Figure 6, for diameter, and in Figure 7, for depth. Thus, all the data associated with the linear dimensions belonging to classes I, II, and III, respectively, follow an approximately normal distribution.
Multiple Student’s T-tests were used to see if there was a correlation between skeletal class and the linear dimensions of the sella turcica. For all evaluated linear dimensions, Table 4 confirms a statistically significant difference between class I and class III individuals, respectively, class II and class III (p < 0.001). There was no significant difference in the linear dimensions of cases from skeletal groups I and II (p = 0.133; p = 0.138; p = 0.567).
However, since three skeletal classes were used, a statistical analysis between three different groups requires the use of an ANOVA test along with a Bonferroni correction. This type of test can tell us if there is a statistical difference between the three classes used. The reason for using a Bonferroni correction is that, normally, for the three classes (which involve n = 3 tests), using a significance level α = 0.05, we would obtain a large degree of error:
1 − (1 − α)n = 14.26%
thus obtaining irrelevant results for rejecting the null hypothesis.
Thus, following the Anova test with Bonferroni correction, it was concluded that the p-values are much lower than those of the pre-specified significance level (α = 0.05) (Table 4).
For all evaluated linear dimensions, Table 4 confirms a statistically significant difference between the length, diameter, and depth of all three classes, due to the fact that a very small p-value was obtained (below 0.001) compared to the value of the significance level α. In other words, the means obtained for all three classes are not the same. Thus, we can conclude that our experimental study is statistically significant.
One of the limitations of the Bonferroni correction or any other test for controlling family-wise error rate (FWER) is if there are a large number of tests or if the test statistics are positively correlated. Thus, in order to test whether our data are positively correlated, the Pearson correlation coefficient was calculated for length, diameter, and depth corresponding to all combinations of classes. These results are presented in Table 5 and indicate the correlation between the data. For example, a positive correlation can be found for all experimental data in classes II and III, respectively. For other class combinations, there are also values quite close to zero, for example, length and depth between classes I and III and diameter and depth between classes I and II, showing a relatively weak correlation between the experimental data. Taking these values into account, we tend to believe that there is a statistical difference between the classes.

4. Discussion

Extensive studies on the size of the sella turcica have been published using various measuring methods. The mean length values that have been reported are 8.13 mm in the Shrestha G.K. study, 8.4 mm in the Motwani study, 9.1 mm in the Sathyanarayana HP study, 9.74 mm in the Öktem study, 10.3 mm in the Alkofide study, 11.3 mm in the Shah AM study, and 12 mm in the Ouaknine and Hardy study [20,26,27,28,29,30,31]. In the current study, the length varied from 6.12 mm (the lowest) to 12.45 mm (the highest), with a mean of 8.98 mm.
The mean height in Ouaknine and Hardy’s and Nagaraj T’s studies was 8 mm, which was similar to our findings [31,32]. In Motwani’s study, the mean height was 6.06 mm, while in Shrestha G.K.’s study, it was 7.3 mm [26,27]. Alkofide and Shah’s research revealed heights greater than 10.3 mm and 9.9 mm, respectively [20,30].
In this study, the anteroposterior diameter ranged from 8.96 mm to 13.94 mm, with an average of 10.29 mm. Similar diameters were discovered in the research of Filipovie and Motwani, 10.9 mm and 9.94 mm, respectively [27,33]. The findings were not consistent with those of Nagaraj, Alkofide, and Shah, whose values were higher [20,30,32].
There is a little discrepancy between the results discovered in our study and those found in other studies; however, these discrepancies can be linked to different measurement methods and ethnicities, as our study was conducted on Romanian participants.
Few studies have examined the link between sella turcica size and skeletal class. In this study, a significant difference was observed between participants in classes II and III in all three dimensions and those in classes I and II in length. An increase in size appears to be more common in class III participants, whereas a decrease in size tends to be more common in class II or class I subjects. The anteroposterior diameter was increased in class III patients and reduced in class II patients from Saudi Arabia, Serbia, and South India, according to Alkofide EA, Filipovi G et al., and Sathyanarayana [20,28,33]. Marsan and Shah AM et al. found no association between the size of the sella turcica and different skeletal classes [30,34].
According to the findings of this research, 51% of the participants had a normal sella turcica. Other variations were found in 48.9% of situations. In his study, Alkofide documented the normal morphology of the sella turcica in 67% of subjects [20]. In both studies, the most common variation was irregularity of the sella’s posterior wall (11%). Also, the percentage of individuals with an anterior oblique wall was comparable in both studies. The pyramidal shape was more common in the current study. In prior studies, the prevalence of sella bridge ranged from 4.6% to 11.1% in healthy individuals [32,35]. In the current study, 10% of individuals had a sella bridge. A total of 1.1% of patients in the investigation conducted by Alkofide exhibited a sella turcica bridge [20]. Becktor et al. conducted a study in which they observed that sella turcica bridge was present in 18.6% of the patients diagnosed with severe craniofacial disorders [36]. A sella turcica bridge was observed in 13% of the patients that underwent an examination of the morphology and dimension of the sella turcica in patients afflicted with Williams’s syndrome, as reported by Axelsson et al. [25]. The incidence of sella turcica bridge is greater among adolescents with dental anomalies, according to Leonardi et al. [37]. Abdel-Kader conducted an assessment of the incidence of sella turcica bridges among orthodontic treatment candidates and determined their prevalence to be 3.74% [38].
Patient sex was not accounted for in this study. Sathyanarayana discovered a statistically significant difference in length and diameter between the sexes, whereas Axelsson discovered a statistically significant difference in length between males and females in their study [25]. Alkofide, Shrestha, Oktem, Nagaraj, and Shah found no significant difference between males and females [20,26,29,30,32]. According to Silverman’s study, the dimensions of the sella turcica are generally equivalent across sexes after the pubertal development spurt, which occurs around 2–3 years later in males than in females [21].
Canigur Bavbek and Dincer conducted a study that found diabetic patients had a reduced prevalence of normal sella morphology compared to healthy individuals. Nevertheless, our research excluded individuals with endocrine diseases and established age limitations for the study participants in order to assess the measurements [39].
Linear dimensions (length, diameter, and depth) can be used to predict pituitary gland size. When a large sella is observed on lateral cephalometric radiographs, it may be clinically significant. It should be taken into consideration that several studies have shown that the height of the gland is often 2 mm less than the depth of the sella turcica when measuring its size. This suggests that the gland does not completely occupy the entirety of the volume of the sella turcica [31]. There are a number of disorders that have been associated with an enlarged sella turcica. These conditions include, but are not limited to, meningioma, primary hypothyroidism, prolactinoma, mucocele, Turner syndrome, Trisomy 21, gigantism, acromegaly, empty sella syndrome, adenomas, and Nelson syndrome. In contrast, primary hypopituitarism and Sheehan’s syndrome are associated with a smaller size of the sella turcica, despite the fact that the condition is less prevalent [40,41]. In order to differentiate between an abnormal condition and normal developmental patterns, it is important for the orthodontist or general practitioner to have a good understanding of the structure of the sella turcica.
The limitations of this study are due to the fact that measurements were taken using lateral cephalometric radiographs, which only provide a two-dimensional image. Nevertheless, it is important to bear in mind that the depiction of an abnormality system in two dimensions does not truly convey comprehensive details regarding its three-dimensional configuration. A limitless variety of three-dimensional sizes and shapes can produce the same two-dimensional radiographic image, which is a well-established mathematical principle inherent to two-dimensional radiography. CBCT or a different form of three-dimensional imaging technology might be used in later research in order to ascertain the volume of the sella turcica and provide a more comprehensive image. Additional research conducted at multiple centres using larger sample sizes has the potential to enhance the precision of the acquired data and standards. Further studies can be conducted to ascertain whether a correlation exists between the sella turcica dimensions and the age or sex of the participants.

5. Conclusions

  • The average length was 8.98 mm ± 1.470, the average depth was 7.99 mm ± 1.081, and the average diameter was 10.29 mm ± 1.267.
  • The smallest dimensions were found in skeletal class II: length 6.12 mm, diameter 6.77 mm and depth 5.69 mm.
  • The maximum dimensions were identified in class III, with length 12.45 mm, diameter 13.94 mm and depth 10.56 mm.
  • The Q–Q plots, together with the Anova tests with Bonferroni correction and the procedure for calculating the Pearson correlation coefficient, indicate that our results are statistically significant and can be used in the clinical practice of dentistry.
  • The morphology of the sella turcica varies greatly. This study found that 51.1% of its participants had a normal sella turcica, representing the majority across all three skeletal classes.
  • The findings of the study on the shape and size of the sella turcica can be used as a reference for future research on the morphology of the sella turcica pertaining to a Romanian population.

Author Contributions

Conceptualization, C.-A.S.; methodology, A.-P.U.; formal analysis, V.T.A.; resources, A.-P.U. and L.-C.R.; data curation, A.G. and D.-G.F.; writing—original draft preparation, A.-P.U.; supervision, C.-A.S. All authors have read and agreed to the published version of the manuscript.

Funding

This research has received funding for publication expenses from University of Medicine and Pharmacy “Victor Babeş” Timisoara, 9 No., Revolutiei Bv., 300041 Timisoara, Romania.

Institutional Review Board Statement

The study was conducted in accordance with the Declaration of Helsinki and approved by the Institutional Ethics Committee of University of Medicine and Pharmacy “Victor Babes” Timişoara, Romania (CECS nr.13/26.03.2021).

Informed Consent Statement

Informed consent was obtained from all subjects involved in the study.

Data Availability Statement

The data presented in this study are available on request from the corresponding author and can be provided as cephalometric analysis in AudaxCeph®. The data are not publicly available due to privacy concerns.

Acknowledgments

We thank Alexandru-Bogdan Brad for the help provided for the Q–Q plots and ANOVA test, and Romina Bita for the help provided with Visualisation. Both individuals have given consent to have their work present in the article.

Conflicts of Interest

The authors declare no conflicts of interest.

Appendix A

Table A1. Dimensions of the sella turcica measured in the 90 lateral cephalometric radiographs assigned in the 3 skeletal classes.
Class ILengthDiameterDepthClass IILengthDiameterDepthClass IIILengthDiameterDepth
19.0610.677.5616.928.798.16110.3911.137.03
28.9710.147.9211.3910.837.45211.7912.026.61
37.210.317.6138.289.848.4310.2211.818.83
49.4311.128.148.019.865.6949.110.988.43
59.3111.548.07510.159.286.7359.2511.68.62
68.369.948.7169.339.967.83610.9413.2710.56
79.1310.446.4877.158.068.2679.5411.199.3
88.319.236.5287.549.618.0489.1312.59.73
97.566.866.497.558.17.18910.3410.4710.38
108.349.298.23107.858.127.271011.212.29.99
117.9210.16.64116.128.688.181110.6310.127.45
127.388.767.33126.279.338.01128.110.6410.37
139.319.666.45139.4910.377.11139.168.968.56
148.538.677.29147.359.927.781410.211.539.51
158.4811.17.51159.1710.677.581512.4511.759.43
169.878.846.06166.948.57.32169.0410.318.63
177.7110.429.36177.8510.287.21712.2312.269.17
187.819.816.56187.699.337.3188.8410.18.23
199.4210.149.04197.5610.218.06199.7710.778.39
206.848.666.73207.4510.436.682011.6212.366.96
219.911.688.59216.836.776.15219.410.518.17
2210.2110.758.05227.069.838.412210.7511.637.73
236.8710.038.72238.219.897.723109.76.43
248.679.57.88249.9410.548.652411.8413.9410.36
257.099.667.9258.7710.757.77258.7210.389.06
2610.511.047.41269.7111.327.752610.7411.897.16
278.7611.198.29279.199.238.022711.912.349.44
287.399.999.22286.439.68.022810.4710.858.9
298.399.086.79298.169.996.932910.4111.0710.11
309.3310.299.07309.568.987.093010.8411.978.88

References

  1. Nielsen, I.L. Cephalometric Analysis: History and Clinical Application. Taiwan J. Orthod. 2022, 34, 1. [Google Scholar] [CrossRef]
  2. Basavaraj, S.P. An Atlas on Cephalometric Landmarks; JP Medical Ltd.: Tokyo, Japan, 2013; pp. 3–69. [Google Scholar]
  3. Cohen, A.M.; Ip, H.H.; Linney, A.D. A preliminary study of computer recognition and identification of skeletal landmarks as a new method of cephalometric analysis. Br. J. Orthod. 1984, 11, 143–154. [Google Scholar] [CrossRef]
  4. Russell, S.J.; Norvig, P. Artificial Intelligence: A Modern Approach, 3rd ed.; Prentice Hall: Hoboken, NJ, USA, 2010; pp. 64–112, 234–436, 610–859, 928–934. [Google Scholar]
  5. James, G.; Witten, D.; Hastie, T.; Tibshirani, R. An Introduction to Statistical Learning with Applications in R; Springer: New York, NY, USA, 2013. [Google Scholar]
  6. Goodfellow, I.; Bengio, Y.; Courville, A. Deep Learning, 1st ed.; MIT Press: Cambridge, MA, USA, 2016. [Google Scholar]
  7. Nielsen, M.A. Neural Networks and Deep Learning; Determination Press: San Francisco, CA, USA, 2015; Available online: http://neuralnetworksanddeeplearning.com/ (accessed on 22 February 2024).
  8. Agrawal, P.; Nikhade, P. Artificial Intelligence in Dentistry: Past, Present, and Future. Cureus 2022, 14, e27405. [Google Scholar] [CrossRef] [PubMed]
  9. Durão, A.P.R.; Morosolli, A.; Pittayapat, P.; Bolstad, N.; Ferreira, A.P.; Jacobs, R. Cephalometric landmark variability among orthodontists and dentomaxillofacial radiologists: A comparative study. Imaging Sci. Dent. 2015, 45, 213–220. [Google Scholar] [CrossRef]
  10. Uysal, T.; Baysal, A.; Yagci, A. Evaluation of speed, repeatability, and reproducibility of digital radiography with manual versus computer-assisted cephalometric analyses. Eur. J. Orthod. 2009, 31, 523–528. [Google Scholar] [CrossRef] [PubMed]
  11. Kiełczykowski, M.; Kamiński, K.; Perkowski, K.; Zadurska, M.; Czochrowska, E. Application of Artificial Intelligence (AI) in a Cephalometric Analysis: A Narrative Review. Diagnostics 2023, 13, 2640. [Google Scholar] [CrossRef] [PubMed]
  12. Cederberg, R.; Benson, B.; Nunn, M.; English, J. Calcification of the interclinoid and petroclinoid ligaments of sella turcica: A radiographic study of the prevalence. Orthod. Craniofac. Res. 2003, 6, 227–232. [Google Scholar] [CrossRef]
  13. Hasan, H.A.; Alam, M.K.; Yusof, A.; Mizushima, H.; Kida, A.; Osuga, N. Size and morphology of sella turcica in Malay populations: A 3D CT study. J. Hard Tissue Biol. 2016, 25, 313–320. [Google Scholar] [CrossRef]
  14. Gibelli, D.; Cellina, M.; Gibelli, S.; Panzeri, M.; Oliva, A.G.; Termine, G.; Sforza, C. Sella turcica bridging and ossified carotico-clinoid ligament: Correlation with sex and age. Neuroradiol. J. 2018, 31, 299–304. [Google Scholar] [CrossRef]
  15. Kucia, A.; Jankowski, T.; Siewniak, M.; Janiszewska-Olszowska, J.; Grocholewicz, K.; Szych, Z.; Wilk, G. Sella turcica anomalies on lateral cephalometric radiographs of Polish children. Dentomaxillofacial Radiol. 2014, 43, 20140165. [Google Scholar] [CrossRef]
  16. Miletich, I.; Sharpe, P.T. Neural crest contribution to mammalian tooth formation. Birth Defects Res. Part C Embryo Today Rev. 2004, 72, 200–212. [Google Scholar] [CrossRef] [PubMed]
  17. Pisaneschi, M.; Kapoor, G. Imaging of the sella and parasellar region. Neuroimaging Clin. N. Am. 2005, 15, 203–219. [Google Scholar] [CrossRef] [PubMed]
  18. Alkofide, E.A. Pituitary adenoma: A cephalometric finding. Am. J. Orthod. Dentofac. Orthop. 2001, 120, 559–562. [Google Scholar] [CrossRef] [PubMed]
  19. Kavitha, L.; Karthik, K. Comparison of cephalometric norms of caucasians and non-caucasians: A forensic aid in ethnic determination. J. Forensic Dent. Sci. 2012, 4, 53–55. [Google Scholar] [PubMed]
  20. Alkofide, E.A. The shape and size of the sella turcica in skeletal Class I, Class II, and Class III Saudi subjects. Eur. J. Orthod. 2007, 29, 457–463. [Google Scholar] [CrossRef] [PubMed]
  21. Silverman, F.N. Roentgen standards fo-size of the pituitary fossa from infancy through adolescence. Am. J. Roentgenol. Radium Ther. Nucl. Med. 1957, 78, 451–460. [Google Scholar]
  22. Ristau, B.; Coreil, M.; Chapple, A.; Armbruster, P.; Ballard, R. Comparison of AudaxCeph®’s fully automated cephalometric tracing technology to a semi-automated approach by human examiners. Int. Orthod. 2022, 20, 100691. [Google Scholar] [CrossRef]
  23. Plaza, S.P.; Reimpell, A.; Silva, J.; Montoya, D. Relationship between skeletal Class II and Class III malocclusions with vertical skeletal pattern. Dental Press J. Orthod. 2019, 24, 63–72. [Google Scholar] [CrossRef]
  24. Kisling, E. Cranial Morphology in Down’s Syndrome: A Comparative Roentgenencephalometric Study in Adult Males; Munksgaard: Copenhagen, Denmark, 1966. [Google Scholar]
  25. Axelsson, S.; Storhaug, K.; Kjaer, I. Post-natal size, and morphology of the Sella turcica. Longitudinal cephalometric standards for Norwegians between 6 and 21 years of age. Eur. J. Orthod. 2004, 26, 597–604. [Google Scholar] [CrossRef] [PubMed]
  26. Shrestha, G.K.; Pokharel, P.R.; Gyawali, R.; Bhattarai, B.; Giri, J. The morphology and bridging of the sella turcica in adult orthodontic patients. BMC Oral Health 2018, 18, 45. [Google Scholar] [CrossRef] [PubMed]
  27. Motwani, M.B.; Biranjan, R.; Dhole, A.; Choudhary, A.B.; Mohite, A. A Study to Evaluate the Shape and Size of Sella turcica and Its Correlation with the Type of Malocclusion on Lateral Cephalometric Radiographs. IOSR J. Dent. Med. Sci. 2017, 16, 126–132. [Google Scholar] [CrossRef]
  28. Sathyanarayana, H.P.; Kailasam, V.; Chitharanjan, A.B. The Size and Morphology of Sella Turcica in Different Skeletal Patterns among South Indian Population: A Lateral Cephalometric Study. J. Indian Orthod. Soc. 2013, 47 (Suppl. S4), 266–271. [Google Scholar] [CrossRef]
  29. Öktem, H.; Tuncer, N.I.; Şençelikel, T.; Bağcı, Z.; Cesaretli, S.; Arslan, A.; Gürsel, I.T.; Değirmenci, B. Sella turcica variations in lateral cephalometric radiographs and their association with malocclusions. Anatomy 2018, 12, 13–19. [Google Scholar] [CrossRef]
  30. Shah, A.M.; Bashir, U. The Shape and Size of the Sella Turcica in Skeletal Class I, II & III patients, presenting at Islamic International Dental Hospital, Islamabad. Pak. Oral Dent. J. 2011, 1, 104–110. [Google Scholar]
  31. Ouaknine, G.E.; Hardy, J. Microsurgical anatomy of the pituitary gland and the sellar region: The pituitary Gland. Am. Surg. 1987, 53, 285–290. [Google Scholar] [PubMed]
  32. Nagaraj, T.; Shruthi, R.; James, L.; Keerthi, I.; Balraj, L.; Goswami, R.D. The size and morphology of sella turcica: A lateral cephalometric study. J. Med. Radiol. Pathol. Surg. 2015, 1, 3–7. [Google Scholar] [CrossRef]
  33. Filipovie, G.; Burie, M.; Janoševie, M.; Stošie, M. Radiological measuring of sella turcica’s size in different malocclusions. Acta Stomatol. Naissi 2011, 27, 1035–1042. [Google Scholar] [CrossRef]
  34. Marsan, G.; Oztas, E. Incidence of bridging and dimensions of Sella turcica inclass I and class III Turkish adult female patients. World J. Orthod. 2009, 10, 99–103. [Google Scholar]
  35. Abdullah, I.M.; Mohammed, L.K. Normal and Abnormal Variations of Sella Turcica in Three Facial Types of Adolescent Iraqi Samples. Med. J. Babylon 2015, 12, 653–660. [Google Scholar]
  36. Becktor, J.P.; Einersen, S.; Kjaer, I. A sella turcica bridge in subjects with severe craniofacial deviations. Eur. J. Orthod. 2000, 22, 69–74. [Google Scholar] [CrossRef]
  37. Leonardi, R.; Barbato, E.; Vichi, M.; Caltabiano, M. A sella turcica bridge in subjects with dental anomalies. Eur. J. Orthod. 2006, 28, 580–585. [Google Scholar] [CrossRef] [PubMed]
  38. Abdel-Kader, H.M. Sella turcica bridges in orthodontic and orthognathic surgery patients. A retrospective cephalometric study. Aust. Orthod. J. 2007, 23, 30–35. [Google Scholar] [CrossRef] [PubMed]
  39. Canigur Bavbek, N.; Dincer, M. Dimensions and morphologic variations of sella turcica in type 1 diabetic patients. Am. J. Orthod. Dentofac. Orthop. 2014, 145, 179–187. [Google Scholar] [CrossRef] [PubMed]
  40. Tekiner, H.; Acer, N.; Kelestimur, F. Sella turcica: An anatomical, endocrinological, and historical perspective. Pituitary 2015, 18, 575–578. [Google Scholar] [CrossRef]
  41. Mansour, A.A.; Alhamza, A.H.A.; Almomin, A.M.S.A.; Zaboon, I.A.; Alibrahim, N.T.Y.; Hussein, R.N.; Kadhim, M.B.; Alidrisi, H.A.Y.; Nwayyir, H.A.; Mohammed, A.G.; et al. Spectrum of Pituitary disorders: A retrospective study from Basrah, Iraq. F1000Research 2018, 7, 430. [Google Scholar] [CrossRef]
Figure 1. The Steiner analysis was used to determine the anteroposterior relationship of the maxilla to the mandible. Purple line represents the distances between Sella—Nasion, Nasion—Point A, and Nasion—Point B. The black line represents the outline of the Maxilary, Mandible and central upper incisor and lower incisor.
Applsci 14 02164 g001
Figure 2. This image displays the usual structure of the sella turcica, along with lines that can be used to measure its dimensions. Abbreviations: TS, tuberculum sella; DS, dorsum sella; BPF, base of pituitary fossa. The purple line depicts the sella’s length, the blue line its diameter, and the green line its depth.
Applsci 14 02164 g002
Figure 3. The different morphological variations of the sella turcica: (A) normal, (B) oblique anterior wall, (C) double contour, (D) irregular posterior wall, (E) sella turcica bridge, (F) pyramidal shape.
Applsci 14 02164 g003
Figure 4. The frequency distribution of various sella turcica morphologies in the three skeletal classes.
Applsci 14 02164 g004
Figure 5. Q–Q plots for the length, for each of the classes I, II, and III, respectively.
Applsci 14 02164 g005
Figure 6. Q–Q plots for the diameter, for each of the classes I, II, and III, respectively.
Applsci 14 02164 g006
Figure 7. Q–Q plots for the depth, for each of the classes I, II, and III, respectively.
Applsci 14 02164 g007
Table 1. Inclusion and exclusion criteria.
InclusionExclusion
Age over 12 yearsCraniofacial cleft (syndrome or non-syndrome related)
Romanian nationalityHistory of orthognathic surgery
A clear rendering of sella turcicaHistory of maxillofacial trauma
Patients willing to participate in the studyHistory of neurologic disturbances
Endocrine disorders
Hormonal treatment
Corticosteroid treatment
Table 2. Characteristics of sella turcica in different skeletal classes.
Skeletal ClassNumberMeanStandard DeviationStandard Error of the Mean95% Confidence Interval for MeanMinimumMaximum
Lower BondUpper Bond
LengthClass I308.530.9900.1808.188.886.8410.5
Class II308.131.2640.2307.678.586.1211.39
Class III3010.301.1150.2039.9010.698.112.45
Total908.981.470 7.1310.846.1212.45
DiameterClass I309.961.0080.1849.6010.326.8611.68
Class II309.560.9800.1799.219.916.7711.32
Class III3011.341.0540.19210.9611.718.9613.94
Total9010.291.267 8.16512.416.7713.94
DepthClass I307.680.9340.1707.3478.016.069.36
Class II307.550.6690.1227.3177.795.698.65
Class III308.741.1530.2108.3349.166.4310.56
Total907.991.081 6.3439.645.6910.56
Table 3. Frequency of the various sella turcica morphologies.
FrequencyPercentage
Normal4651.1%
Oblique anterior wall910%
Double contour77.77%
Irregular posterior wall1011.11%
Sella turcica bridge910%
Pyramidal shape910%
Table 4. The p-values obtained using the Anova test with Bonferroni correction, for all skeletal classes.
Skeletal ClassNumberMean ± Standard DeviationComparison between Skeletal ClassesStudents t-Test
p Value
ANOVA with Bonferroni Correction
LengthClass I308.53 ± 0.990Class I and Class II0.1381.049 × 10−10
(<0.001)
Class II308.13 ± 1.264Class I and Class III<0.001
Class III3010.30 ± 1.115Class II and Class III<0.001
DiameterClass I309.96 ± 1.008Class I and Class II0.1333.89 × 10−9
(<0.001)
Class II309.56 ± 0.980Class I and Class III<0.001
Class III3011.34 ± 1.054Class II and Class III<0.001
DepthClass I307.68 ± 0.934Class I and Class II0.5675.24 × 10−6
(<0.001)
Class II307.55 ± 0.669Class I and Class III<0.001
Class III308.74 ± 1.153Class II and Class III<0.001
Table 5. The Pearson correlation coefficient, calculated for length, diameter, and depth corresponding to all combinations of classes.
DimensionsClassesThe Pearson Coefficient
Length Class I
and Class II
0.213803
Diameter0.041007
Depth−0.0275
Length Class I
and Class III
−0.03701
Diameter0.102483
Depth−0.04229
Length Class II
and Class III
0.359194
Diameter0.252937
Depth0.110141
Disclaimer/Publisher’s Note: The statements, opinions and data contained in all publications are solely those of the individual author(s) and contributor(s) and not of MDPI and/or the editor(s). MDPI and/or the editor(s) disclaim responsibility for any injury to people or property resulting from any ideas, methods, instructions or products referred to in the content.

