1. Introduction
Infectious laryngotracheitis (ILT) is an economically concerning disease in the poultry industry. This highly contagious disease is caused by Gallid alphaherpesvirus type 1 (GaHV-1), commonly known as infectious laryngotracheitis virus (ILTV) [
1]. ILT is characterized by severe dyspnea, cough, and rales, while the sub-acute form is characterized by nasal and ocular discharge, tracheitis, conjunctivitis, and mild rales [
2]. Chickens of all ages are prone to contracting the disease, although chickens older than 3 weeks are more susceptible to ILTV.
For the detection of ILT, a laboratory diagnosis is required, as other diseases cause similar clinical symptoms and lesions, such as infectious bronchitis, Newcastle disease, and avian influenza [
3]. The following different methods are available for diagnosing ILT: (i) a histopathological examination of the formation of syncytial cells and tracheal epithelial cells, with the development of pathogenic intranuclear inclusion bodies, necrosis, and hemorrhage [
2], (ii) a commercial Enzyme-Linked Immunosorbent Assay (ELISA) for the detection of antibodies against the ILT virus [
1] (iii) DNA detection methods for the ILT virus. Molecular techniques for ILTV detection include Polymerase Chain Reaction (PCR), real-time PCR, nested PCR, multiplex PCR, in situ hybridization, and PCR followed by Restriction Fragment Length Polymorphism (RFLP) [
4].
The symptoms of laryngotracheitis, like other diseases, influence the vocalization and behaviour of animals by modifying their calls due to coughing [
5]. ILT vaccination generates stress in animals due to the process itself: the hens are manually removed one by one from the cage to administer an eye drop vaccine. Additionally, side effects such as breathing problems may develop in the following days. This combination of stress and side effects can be recorded as a biological response, using hen calls.
New bioacoustic precision livestock farming (PLF) techniques offer the possibility of automatically tracking and monitoring the behavior of poultry through its calls [
6]. Some applications of bioacoustic PLF techniques in chickens are as follows: the identification of acoustic parameters for estimating the welfare of broiler chickens [
7], the automatic detection of flapping, purring, coughing, and crowing with 60 acoustic classification features [
8], stress detection in broiler chickens using acoustic features for voice quality assessment and vocal emotion recognition [
9], the detection of symptoms of respiratory diseases in poultry through the cepstral coefficient of mel frequency [
5], and the acoustic features of the vocalization signal in poultry to identify and monitor bronchitis and Newcastle disease [
10].
This work aims to use PLF technology to characterize the vocalization of hens on a commercial farm before and after the administration of the ILT vaccine, and during their reactions to the ILT vaccine, as well as to identify and analyze the most important features for automatic detection. A second objective is to quantify the effectiveness of a treatment that reduces the vaccination reaction in the animal. The research objectives are designed to answer the following research question: can the vocalizations of hens be utilized to detect and quantify their vaccine response? This is based on the hypothesis that vocalisations in poultry encode information about their welfare status, and the side effects of vaccination generate discomfort that should be detectable through animal calls.
This objective is achieved by capturing the vocalizations emitted by two groups of hens from a commercial farm: a control group, composed of vaccinated hens, and a group of vaccinated hens to which the anti-inflammatory product was administered. The data was processed to extract the 13 Mel-frequency cepstral coefficients (MFCC1-13), the spectral centroid (centroid), and the number of vocalizations (vocalNum) features. A visual inspection was performed to find stress-related patterns in the periods before, during, and after the vaccination reaction. Furthermore, to automatically detect reactions and identify the most important acoustic features, different machine learning algorithms were used. Detecting reactions in real time through acoustics and understanding variations in calls can improve animal management and animal welfare. Additionally, the performance of an administered product can be determined by monitoring the percentage of animal reaction classifications.
This paper is structured as follows. The above introduction is used as framework of this project and is detailed in
Section 1. The technical specification of this project is detailed in
Section 2.1 and the methods used, audio pre-processing, feature extraction, data campaign, and machine learning models are detailed in
Section 2.2. The experiments and results are detailed in
Section 3. A discussion of the key aspects is detailed in
Section 4 and the conclusion of the experiments and a discussion of future work can be found in
Section 5.
2. Material and Methods
This section describes the non-invasive PLF equipment used in the hen farm under study, the method used to detect and extract animal vocalizations, the characterization of their calls during the vaccine reaction, and, finally, the machine learning algorithms used to automate the detection of reactions.
2.1. Material
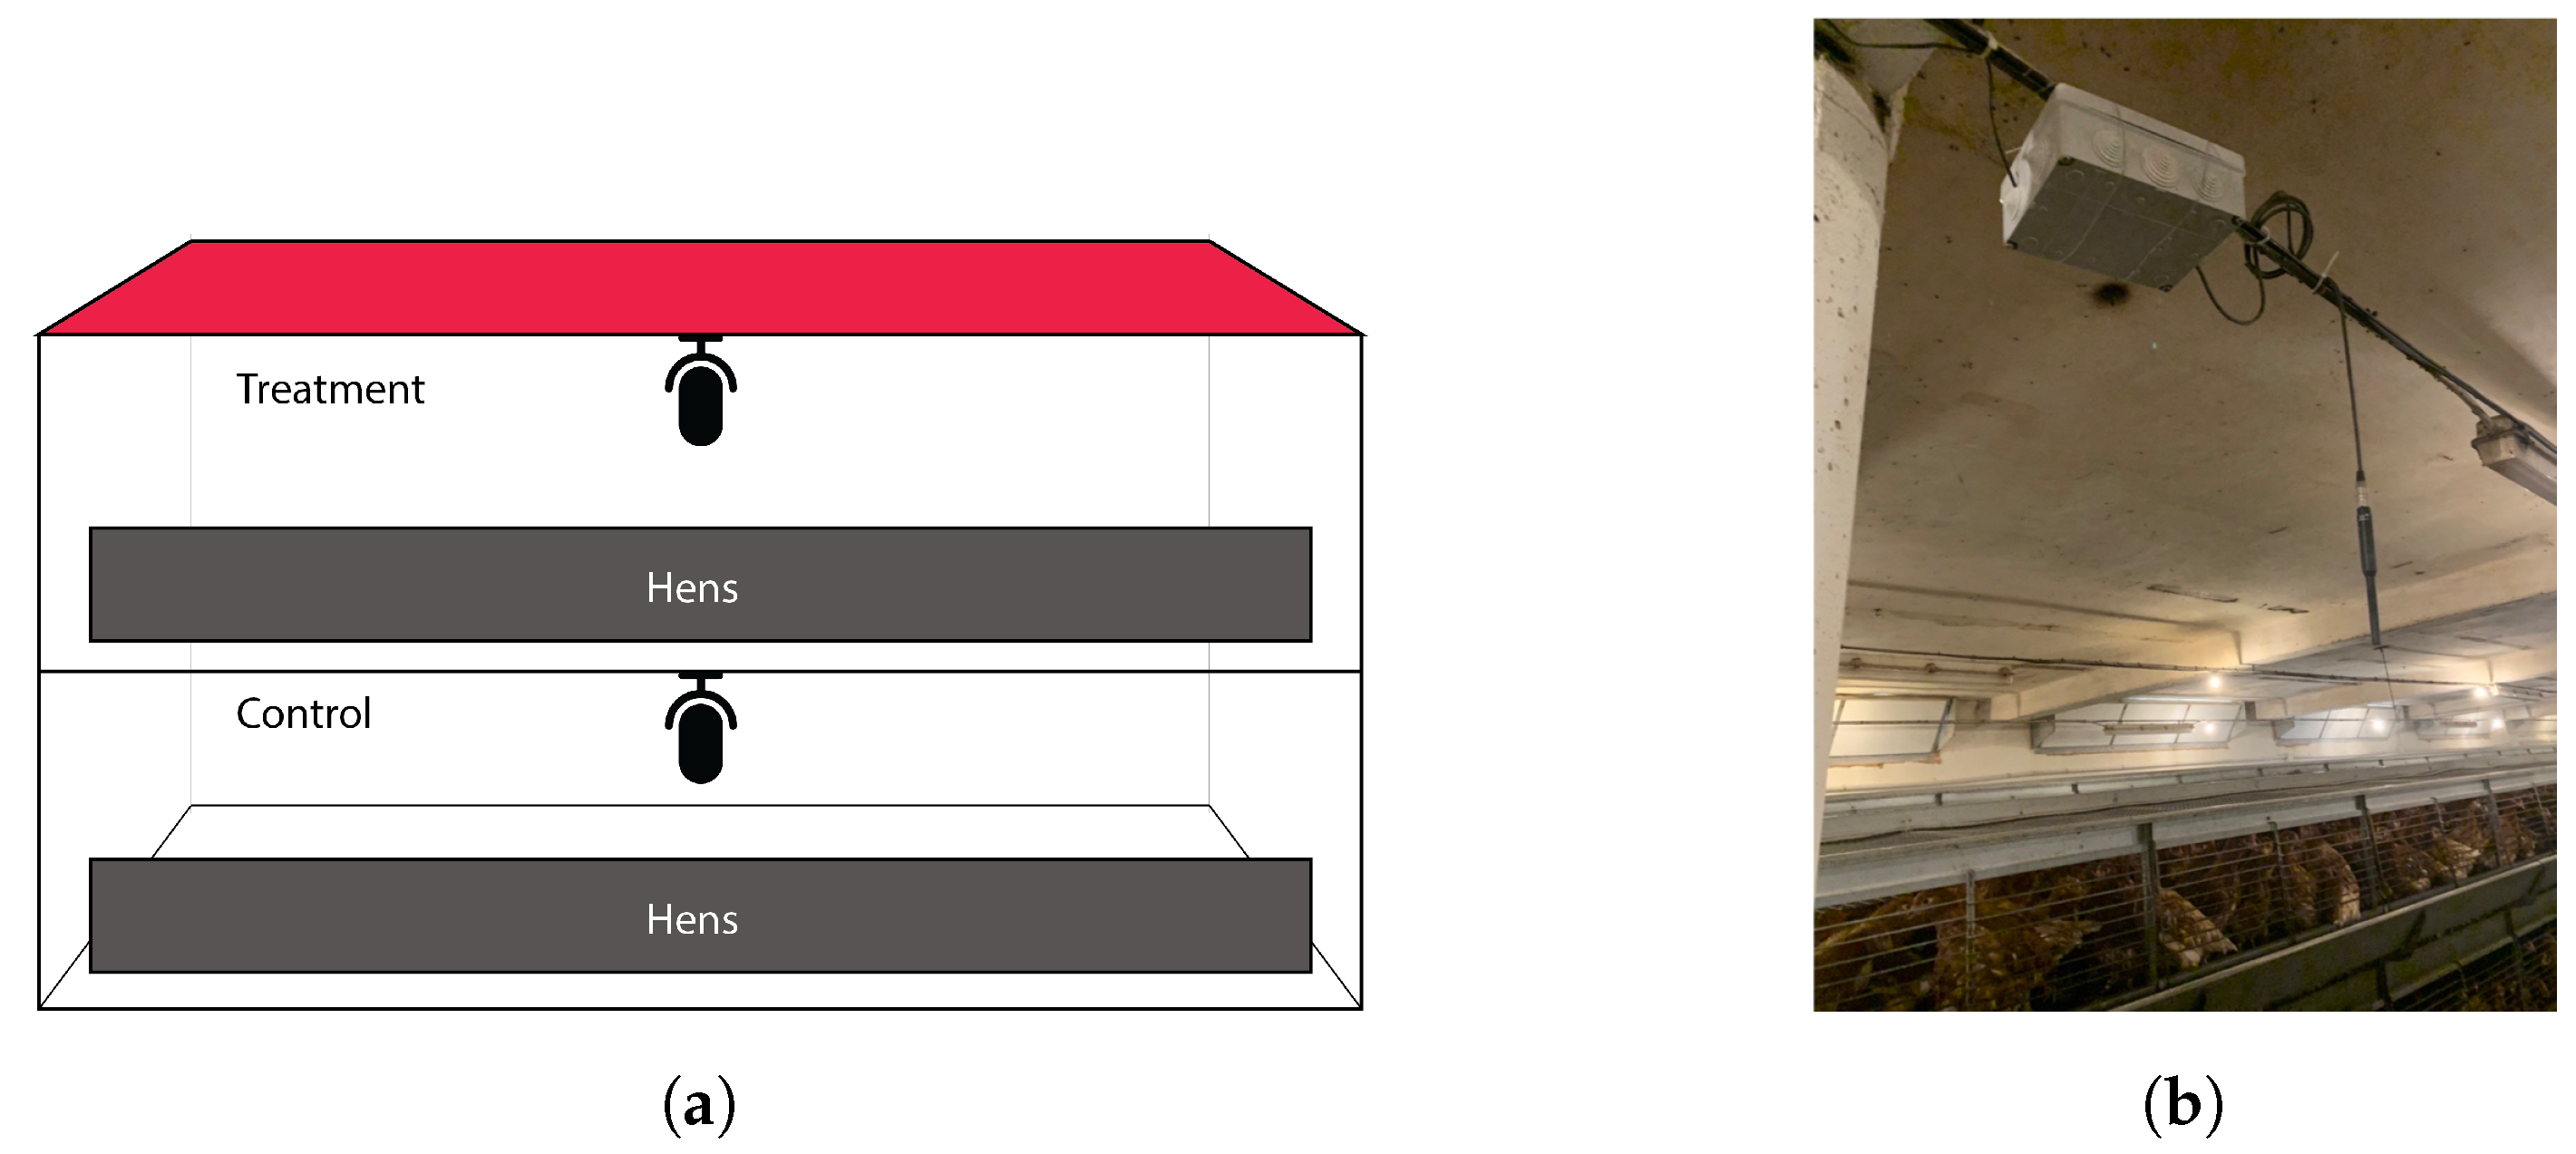
A Mediterranean chicken farm located in Jesús, southern Catalonia (Spain) was selected for the acoustic recording campaign. The farm is part of Avigan Terralta’s production facilities for the breeding of future laying hens (
www.avigan.es (accessed on 22 September 2023)). The rearing farm consisted of two identical houses (one on top of each other) with 45,000 semi-heavy layers with brown egg-laying ability, from the Hy-Line Brown genetics [
11], as shown in
Figure 1a. The hens were raised for 18 weeks, starting from the first day of life, and were exposed to artificial light daily from 5 a.m. to 10 p.m. At the tenth week, the birds were vaccinated with the ILT eye drop vaccine. The vaccination process, performed manually, lasted a total of three days.
The objective of this study was to record the vocalization of birds before, during, and after the administration of the ILT vaccine, to monitor the changes in the vocalizations of the animals. The data collection campaign of this study took place from 28 November to 10 December 2022, and day zero is referred as the vaccination day.
To certify measurement equivalence, two identical sensors, each placed in a farm house, were used to collect raw sound with non-invasive equipment. The distance and architectural barriers between the two sensors prevented possible interference between the calls of both experimental groups due to simultaneous recording. The farmhouses were built with brick and cement walls on both sides, with the ground floor and first floor being totally independent and separated by a roof made of beams and concrete, with a paved floor. The height of each floor was 3 m.
Acoustic data was collected continuously from each house using a Superlux ECM999 measurement condenser microphone with a frequency response of 20–20 kHz and a sensitivity of −37 dBV/Pa [
12]. The sensor was placed in the center of the animal house, 0.5 m from the ceiling. The analog signal was connected to a Behringer U-Phoria UM2 digital audio interface [
13], which digitized the data and allowed it to be recorded by a mini computer using a Python script [
14]. Recording hardware was placed in an IP65 junction box hung from the ceiling, as shown in
Figure 1b. The system was programmed to record 15 min files with a sampling rate of 22.05 kHz, which were archived with flac compression [
15]. Similar recording systems have been implemented by the authors in previous studies [
16,
17,
18] to characterize broiler calls in both hatcheries and farms, and to identify
-related acoustic indicators.
The characteristics of this herd, with two identical houses with the same environmental and management conditions, provide a suitable environment to validate the effectiveness of a product that reduces vaccination reactions. The hens were divided into two groups: a control group (CR) of vaccinated hens, located on the ground floor of the farm, and a treatment group (TX) of vaccinated hens with the anti-inflammatory product administered, which were located on the first floor. The complementary feed administered after vaccination in liquid form was composed of natural products, including Camellia sinensis, Cynara scolymus, cinnamaldehyde, carvacrol, citral, tannins, and Capsicum oleoresin.
2.2. Methods
During the study, a non-invasive method was applied to record and analyze animal calls, incorporating audio pre-processing, feature extraction, data campaign labeling, and machine learning models, trained on raw data to model hen calls in reaction to the vaccine.
2.2.1. Audio Pre-Processing
Farm environments are surrounded by machines that generate a lot of noise, such as fans, feeders, and drinkers, among others, which impact the daily life of the farm [
19]. This noise can be found in raw recordings along with bird vocalizations, so audio processing is needed to remove it, in order to be able to analyze animal calls more clearly. The vocal range of the hens was obtained after analyzing different recorded spectrograms of the calls using Audacity [
20]. Hens vocalize between 2 kHz and 5 kHz. To isolate their vocalizations, raw audio was filtered using two Butterworth filters [
21] in a Python script [
14] with the SciPy library [
22]. The filter configuration was an order 10 Butterworth low-pass filter with a cutoff frequency of 1 kHz and an order 10 Butterworth high-pass filter with a cutoff frequency of 6 kHz. Subsequent listening to the filtered audio confirmed that, with this configuration, the recorded sounds came mainly from animal calls.
2.2.2. Audio Feature Extraction
Bird calls obtained after filtering the raw audio contained information about the animals’ expression and well-being. Audio features were extracted from hen calls to parameterize the vocalizations, using the Librosa Python library [
23]. In this study, fifteen acoustic features were calculated and analyzed in the time and frequency domain, according to previous uses in the literature, as cited below.
vocalNum is a temporal feature that counts the number of calls detected per minute. According to Curtin et al. [
24], a high number of calls (from 160 to 250 vocalisations in 45 min) can be an indicator of stress.
Centroid is a frequency feature that identifies the centre of mass of the spectrum [
25]. Previous studies by the authors suggest a relationship between vocal frequency and feed intake in commercial broiler farms [
16].
Mel Frequency Cepstral Coefficients (MFCC) 1–13 [
26] are widely used frequency features that indicate the amount of energy compressed in a frequency region using a Mel filter bank. Although the main use of MFCCs has been to process characteristics of human speech, such as Automatic Speech Recognition (ASR) [
27], emotion [
28], or feelings [
29] recognition, they have also demonstrated their effectiveness in extracting information from chicken singing, as in [
17], where MFCCs 3, 4, and 6 highlighted a high correlation with the effects of
variation.
2.2.3. Data Campaign and Labeling
In this work, two datasets were created for the CR and TX groups. Both archives contained poultry vocalization information with parameter values: MFCC1 to MFCC13, centroid and vocalNum for each 15 min of the study, resulting in 1255 samples. vocalNum is a parameter that depends on the number of animals. By using two identical houses with the same number of animals, this acoustical feature can be compared between CR and TX datasets. Furthermore, the following additional information was added to the bioacoustic data to filter the data in the experiments: (i) reference to the day of vaccination, (ii) date of the measurement, (iii) day/night period of the day, and (iv) reaction label.
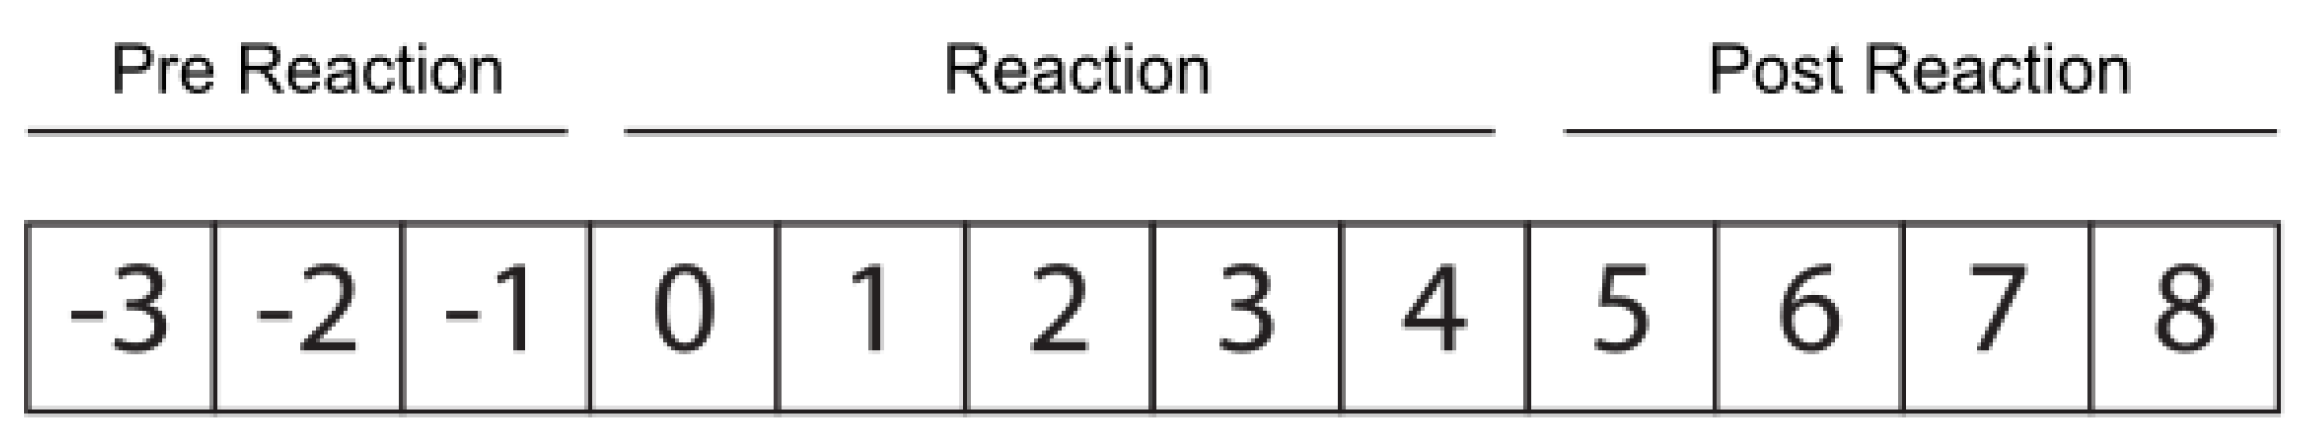
The reaction label indicates whether the animal is going through the following periods: (i) pre-reaction: days before vaccination, −3 to −1 inclusive; (ii) reaction: day of vaccination (considered day 0), with the four days after the vaccination included; (iii) post-reaction: days following the end of the vaccination reaction, from 5 to 8, inclusive (see
Figure 2). The duration of the reaction process was selected based on the farmers’ knowledge, after daily physical inspections of the animals.
2.2.4. Machine Learning Models
Machine learning models can automatically identify patterns and find non-linear relationships between input parameters and their output. In this work, models were trained to identify the vocal reaction of hens to the vaccine on a real farm. The early detection of a vaccination reaction can help mitigate its effect and reduce the levels of stress caused to animals.
In this work, the following main basic models were tested: linear models [
30], support vectors machine [
31], stochastic gradient descent [
32], nearest neighbors [
33], Gaussian processes [
34], cross decomposition [
35], naive Bayes [
36], decision trees [
37], and ensemble methods [
38]. All these models are available from the open-source Python library scikit-learn [
39]. The classification models were trained to find the best algorithm to model the control group (CR) dataset. The Python LazyPredict library [
40] was used to fit and evaluate all algorithms. The classification of model outputs was binary: reaction or non-reaction (including pre-reaction and post-reaction).
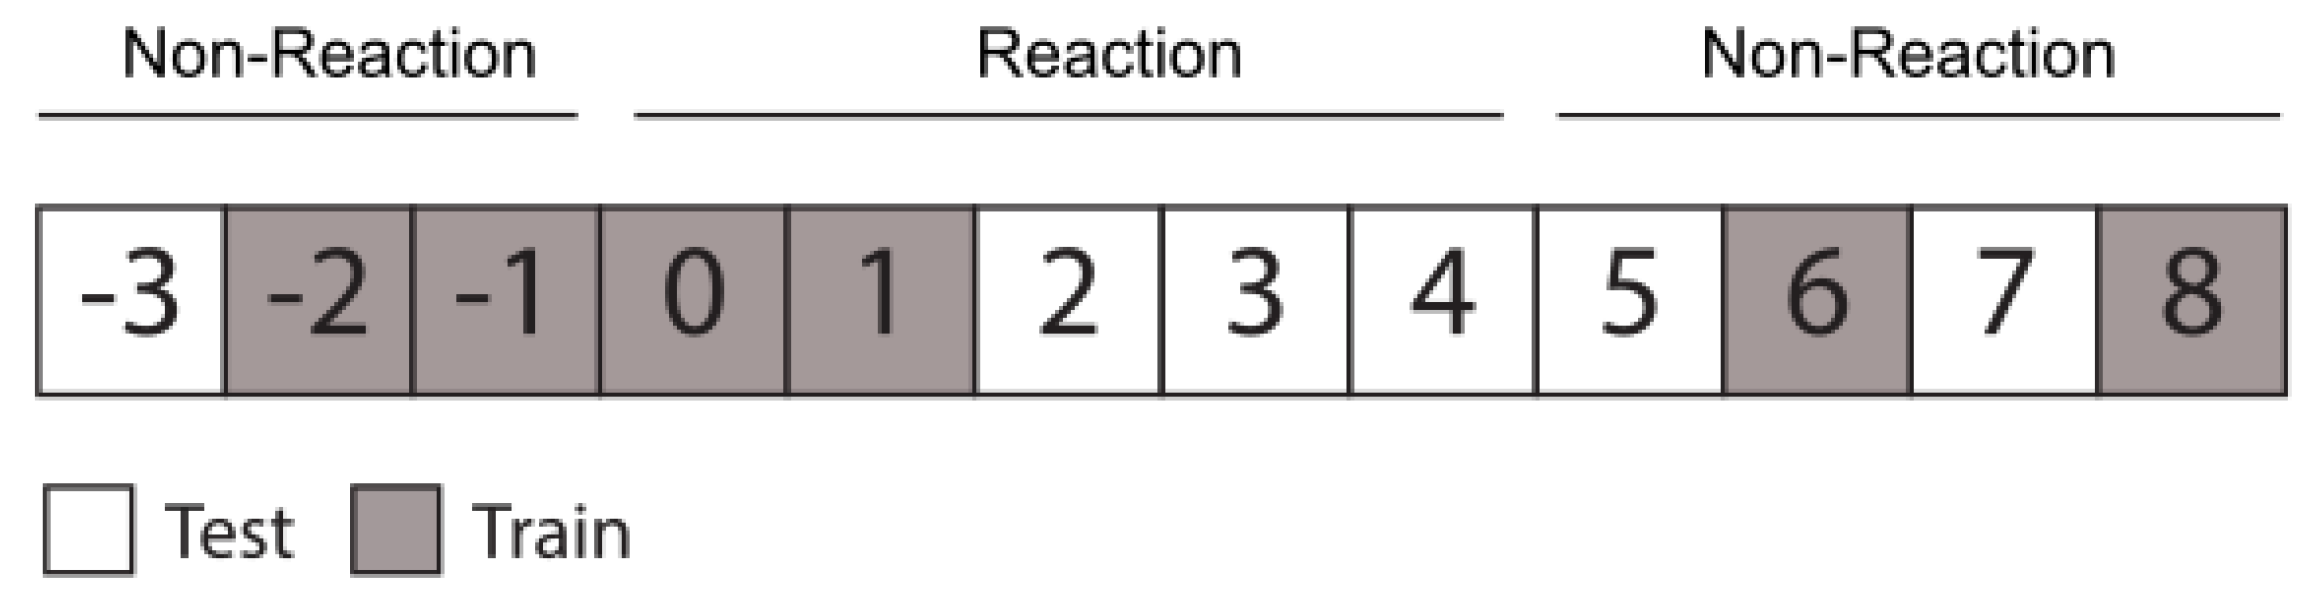
The CR dataset was split into a training and test group, as indicated in
Figure 3. As shown in
Figure 2, the reaction class was trained on days 0 and 1, and tested on days 2, 3, and 4, while the non-reaction class (non-reaction and post-reaction) was trained on days −2, −1, 6, and 8, and tested on days −3, 5, 7. The TX group dataset was used to evaluate the model created with the control group, in order to determine if samples were classified as reaction or not.
The performances of the models were measured using metrics such as accuracy, balanced accuracy, receiver operating characteristic (ROC), area under the ROC (AUC), and F1 score. The best model found was thoroughly analyzed, after tuning the parameters, in order to observe the confusion matrix and temporal prediction for test days and to evaluate the dataset.
3. Experiments and Results
This section describes the evolution of the centroid and vocalNum features to evaluate the stress caused by vaccination, find the best model starting from vocalization, identify the most important parameters, and evaluate the performance of a natural product aimed at reducing hens’ vaccination reactions.
3.1. Visualisation of Centroid and VocalNum Features
Information encoded in animals’ calls can be used to detect stress. In poultry, the most important features related to stress are the number of vocalizations per unit of time (vocalNum) [
24,
41,
42] and the centroid, indicating the center of mass of the call [
16].
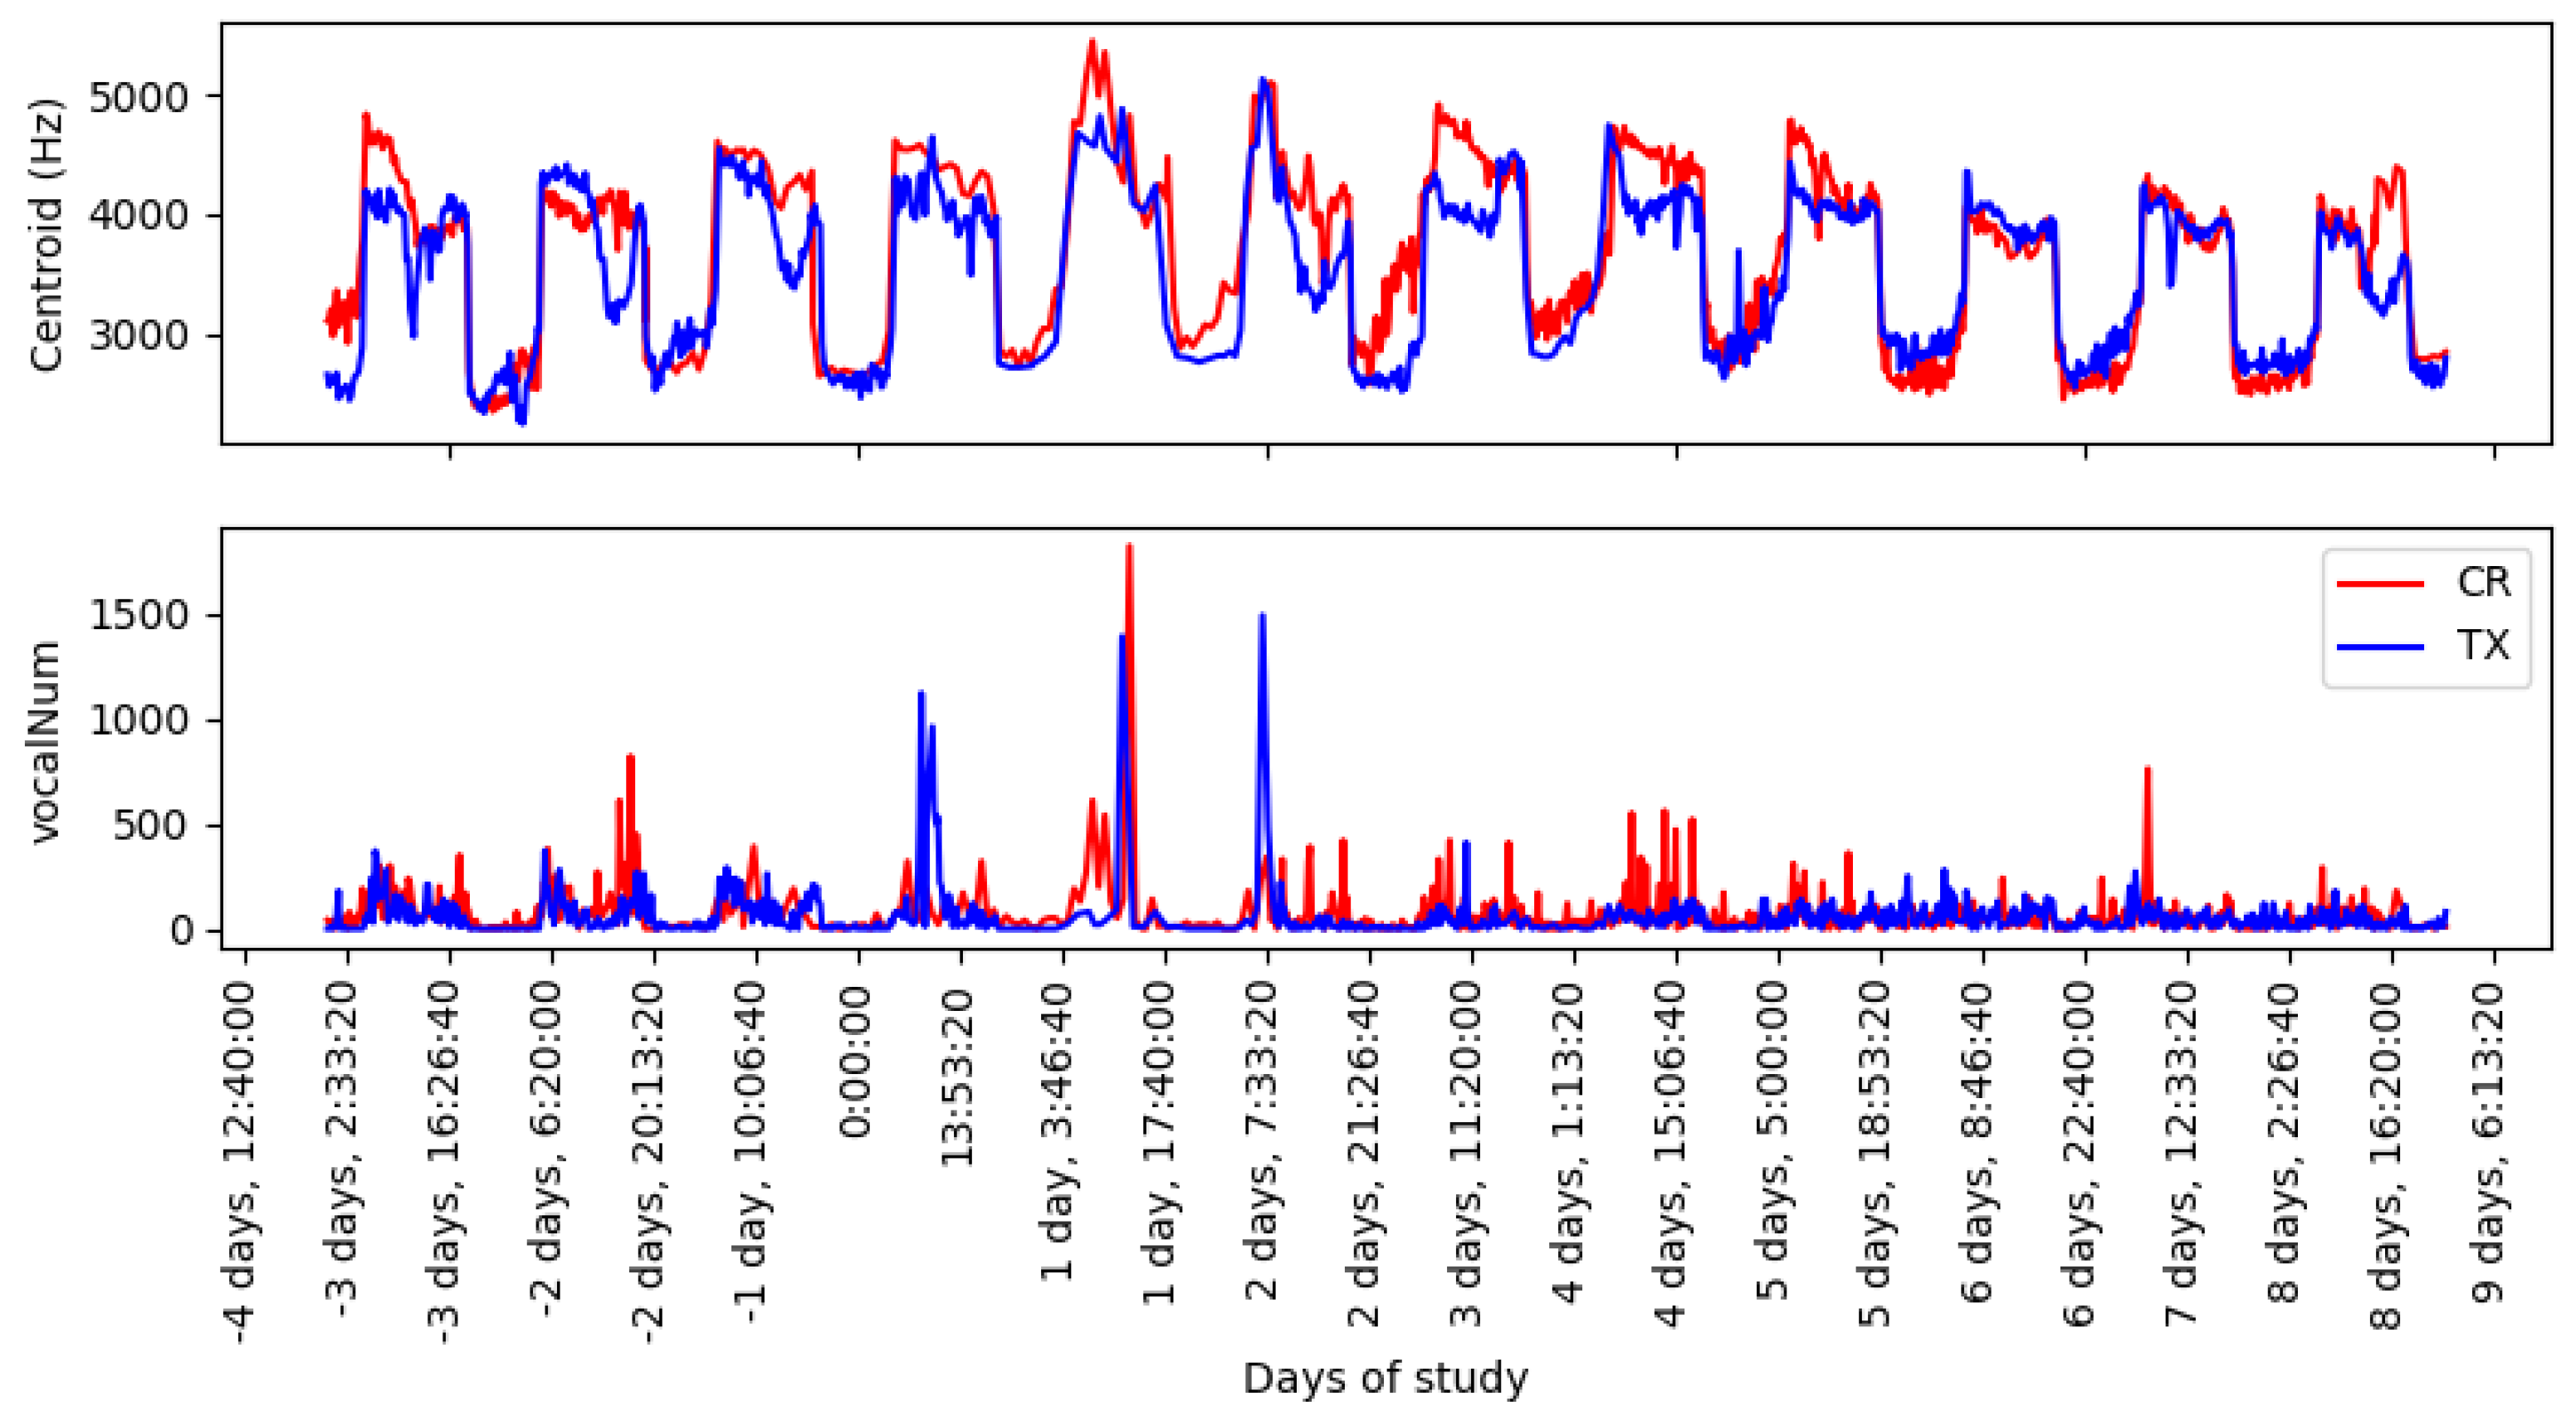
Figure 4 shows the evolution over time, starting from three days before vaccination, and the continuous monitoring of the animals up to eight days after vaccination. The centroid plot shows a periodic pattern between days, showing differences between daylight (higher values) and night-time (lower values). From day 0 to day 5 after vaccination, there is a difference between the curve of the control group and that of the treatment group, where CR obtained maximum values during the day and night, compared to TX. The vocalNum graph shows peak values above 1000 for days 0, 1, and 2 of vaccination for both groups. Similar values of vocalization counts can be found before and after vaccination.
Looking at the periodic pattern in
Figure 5, which was dependent on the light cycle, a deeper analysis was performed by filtering the data between the light range (all day, light, and night) and the block (no reaction, reaction, and post-reaction), to find the interval in which the vaccine reaction was most evident.
Table 1 shows the means and standard deviations of intervals and blocks. A reduced standard deviation and mean data value were observed for all acoustic features during the night-time period, regardless of the group to which the samples belonged. The values obtained after filtering the data for all daytime intervals were more similar than for night-time. Furthermore, higher centroid values were found in the reaction block, as shown graphically in
Figure 4. This observed increase in centroid values in the reaction block was greater in the CR group than in the TX. A statistical analysis of mean differences by feature and blocks was performed, to determine whether vocal differences during vaccine reaction were significantly different due to the treatment offered.
3.2. Statistical Analysis of Centroid and VocalNum Features
The data used for the statistical analysis were collected simultaneously in two different locations; therefore, each group of data can be considered independent. Furthermore, according to the Shapiro–Wilk test [
43], the data did not come from populations with a normal distribution. Since the normality criterion was not met, Leven’s test was performed to find significant evidence (for
0.05) that the variances were different between the two populations [
44]. Finally, a
t-test with Welch’s correction (due to differences in variances) was performed, to determine whether or not the mean acoustic features between the groups differed. The statistical analysis was performed in Python [
14] using the library Scipy [
22] and Pingouin [
45].
Table 2 shows the mean difference between control and treatment by feature, block, interval, and statistical
p-value. The centroid had the highest mean differences for all intervals in the reaction block. The maximum mean difference at night in the reaction block was 465.60 Hz, which also was the strongest significant difference, specifically 2.41 ×
. Furthermore, the greatest significant difference in vocalNum was found at night during the reaction block, with a
p value of 1.43 ×
. Post-reaction vocalizations were more similar between groups with fewer differences, compared to the pre-reaction interval.
3.3. Machine Learning Algorithms
The significant statistical differences observed at night during the reaction block, and the mean differences observed between blocks, suggest that the data could be automatically classified with machine learning models. Different algorithms of SciKit-Learn [
39] (linear models, support vector machines, stochastic gradient descent, nearest neighbors, Gaussian processes, cross decomposition, naive Bayes, decision trees, and ensemble) were tested to find the best-fitting model to the control dataset, classifying between reaction and non-reaction classes. To obtain best performance models, acoustic features were identified from the literature and the choice of parameters was verified using feature importance algorithms, to ensure that the features were related to vocal vaccine reaction. A range of algorithms were trained with different dataset size to ensure data quality and quantity, as follows: (i) all the recorded samples, (ii) night interval samples, and (iii) daily interval samples. The best accuracy results were obtained with only the night interval data, as it had a smaller standard deviation and larger mean differences between blocks. Finally, the most accurate model was hyperparameter-tuned using grid search, to adjust the model in order to achieve the best classification results.
Table 3 shows the top three classifiers obtained after executing the Lazzy predict [
40] in a Python environment with the control dataset. The models in
Table 3 are sorted in descending order, showing the best performing algorithm in the first row. Gaussian Naive Bayes (Gaussian NB) was the model with the best balanced accuracy of 0.79 and an F1 score of 0.80, and will be analyzed further. The other models are at a considerable distance behind in terms of performance (+0.8 points in accuracy).
3.3.1. Permutation Importance of Audio Features in Gaussian Naive Bayes
Gaussian Naive Bayes (Gaussian NB) is a probabilistic classifier that applies Bayes’ theorem with the assumption of naive independence between features [
46]. It is assumed that the values associated with each feature are distributed according to a Gaussian distribution [
47].
Gaussian NB was the algorithm that best modeled the study’s control dataset. A model inspection technique (permutation feature) [
48] was performed to infer how much the model depends on each feature and to obtain the most important acoustic features, in order to discriminate whether there was a vaccination reaction or not.
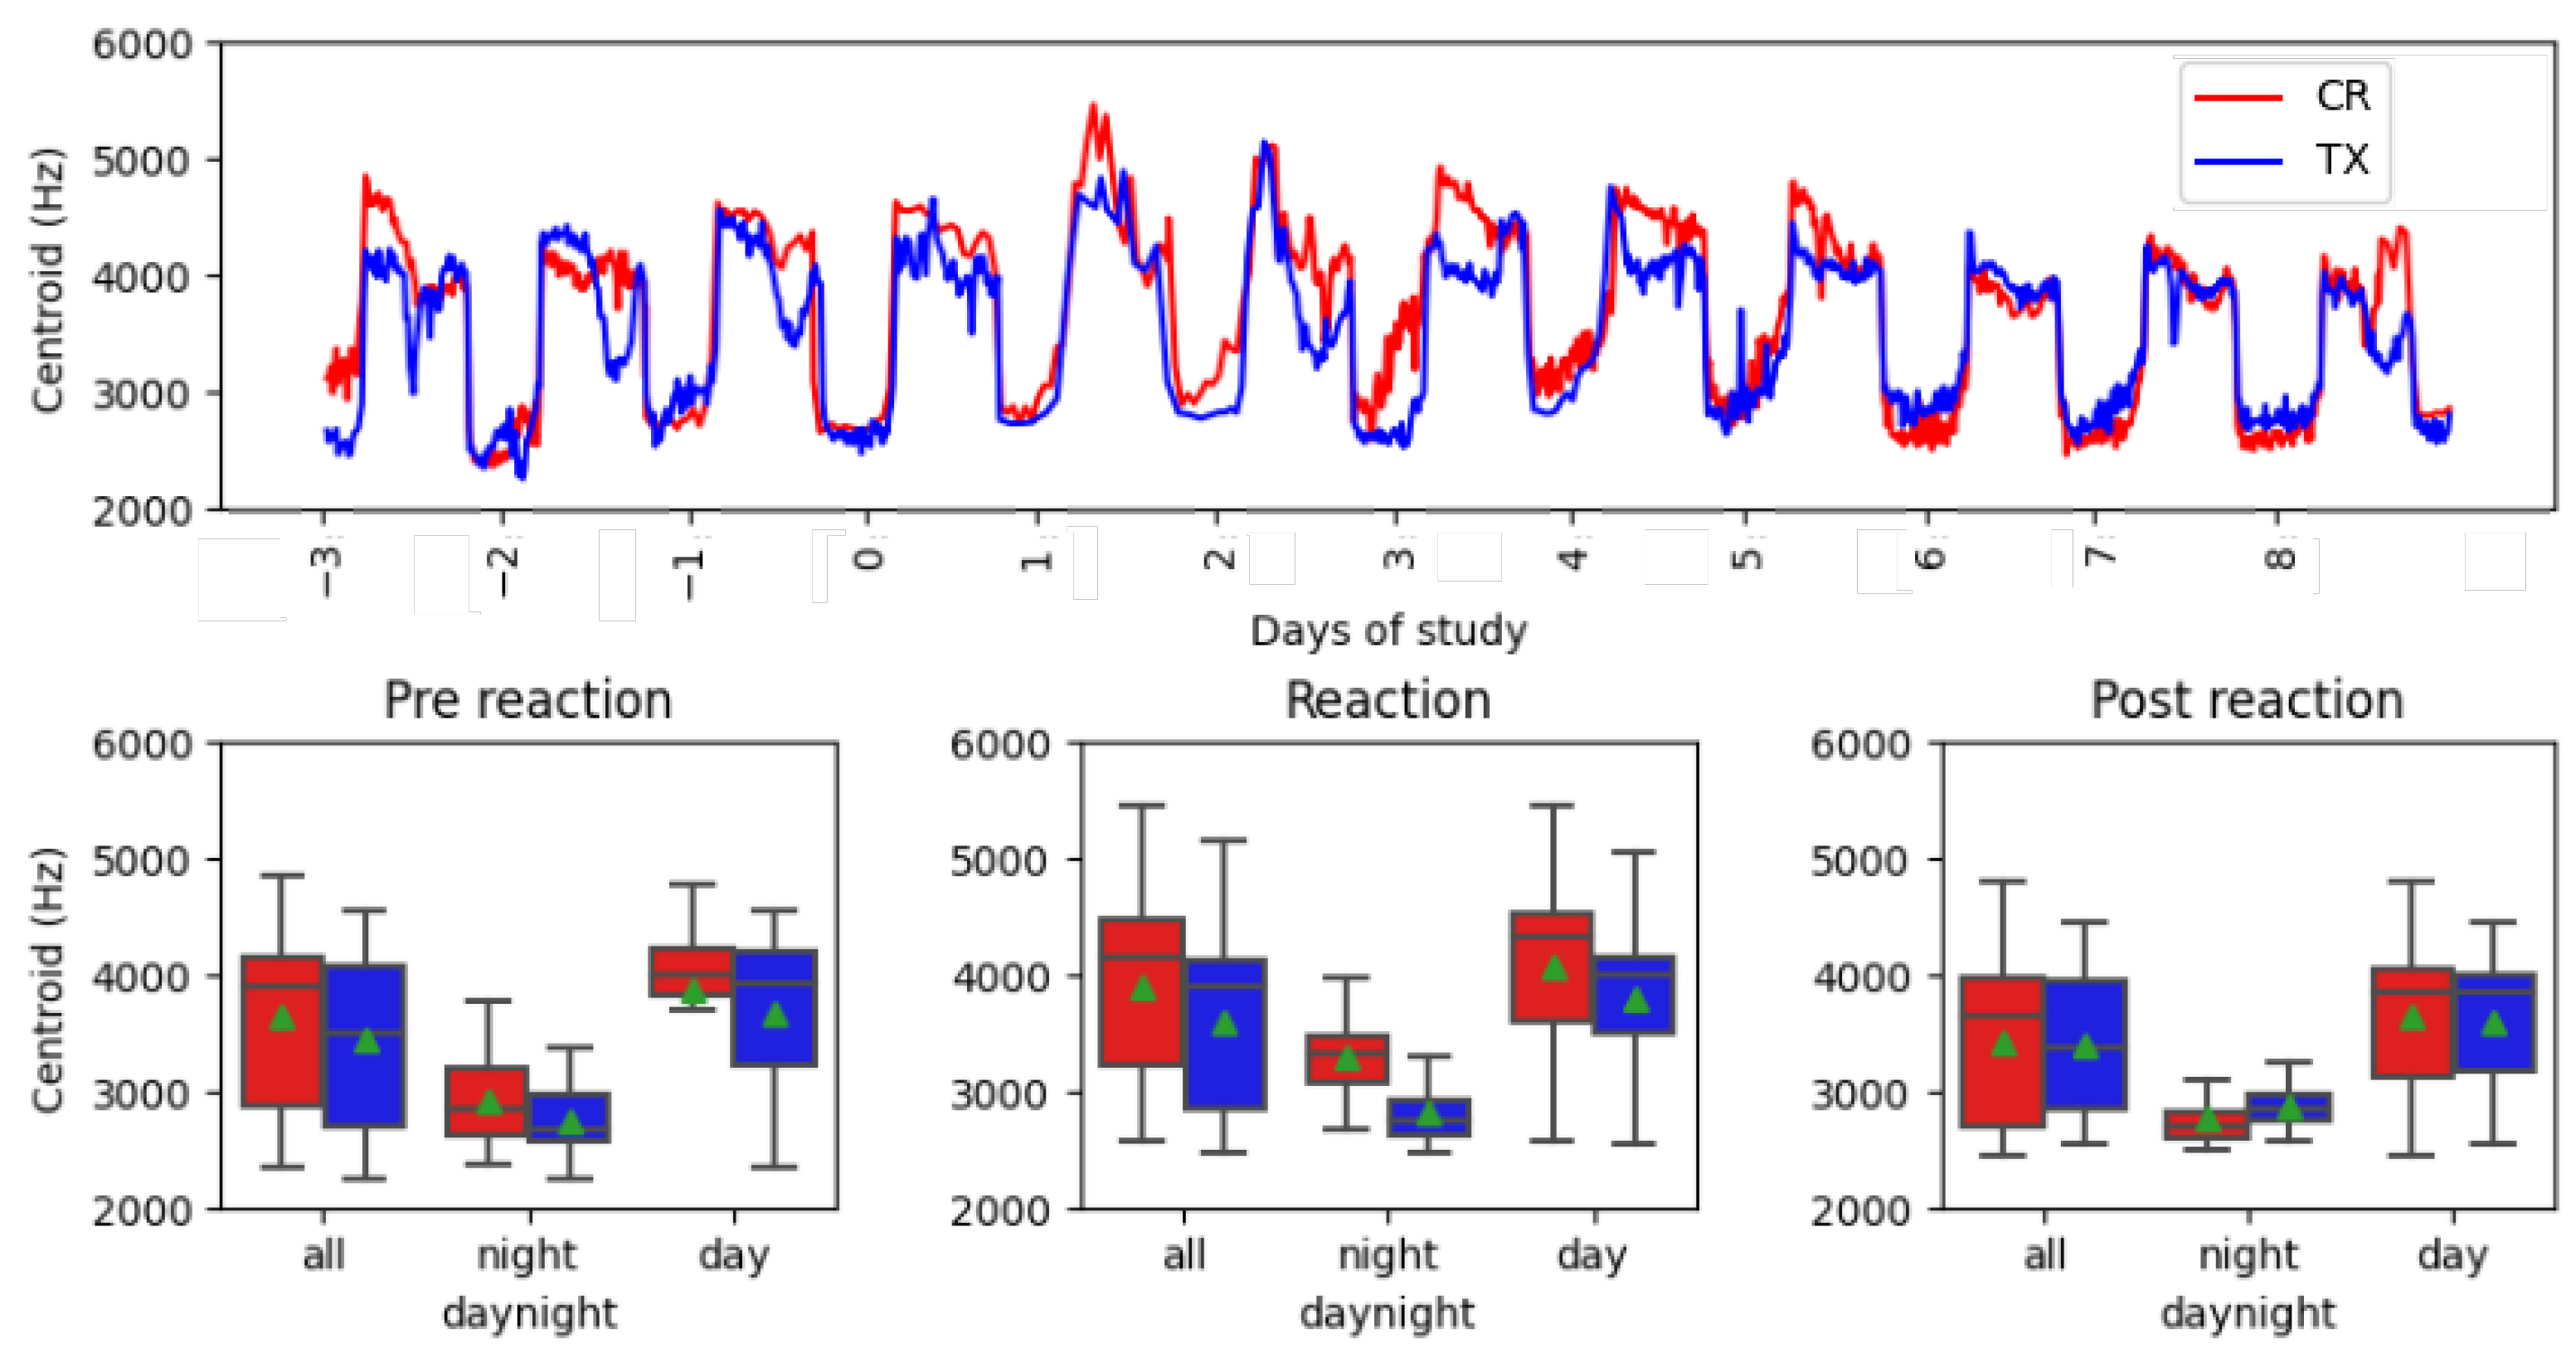
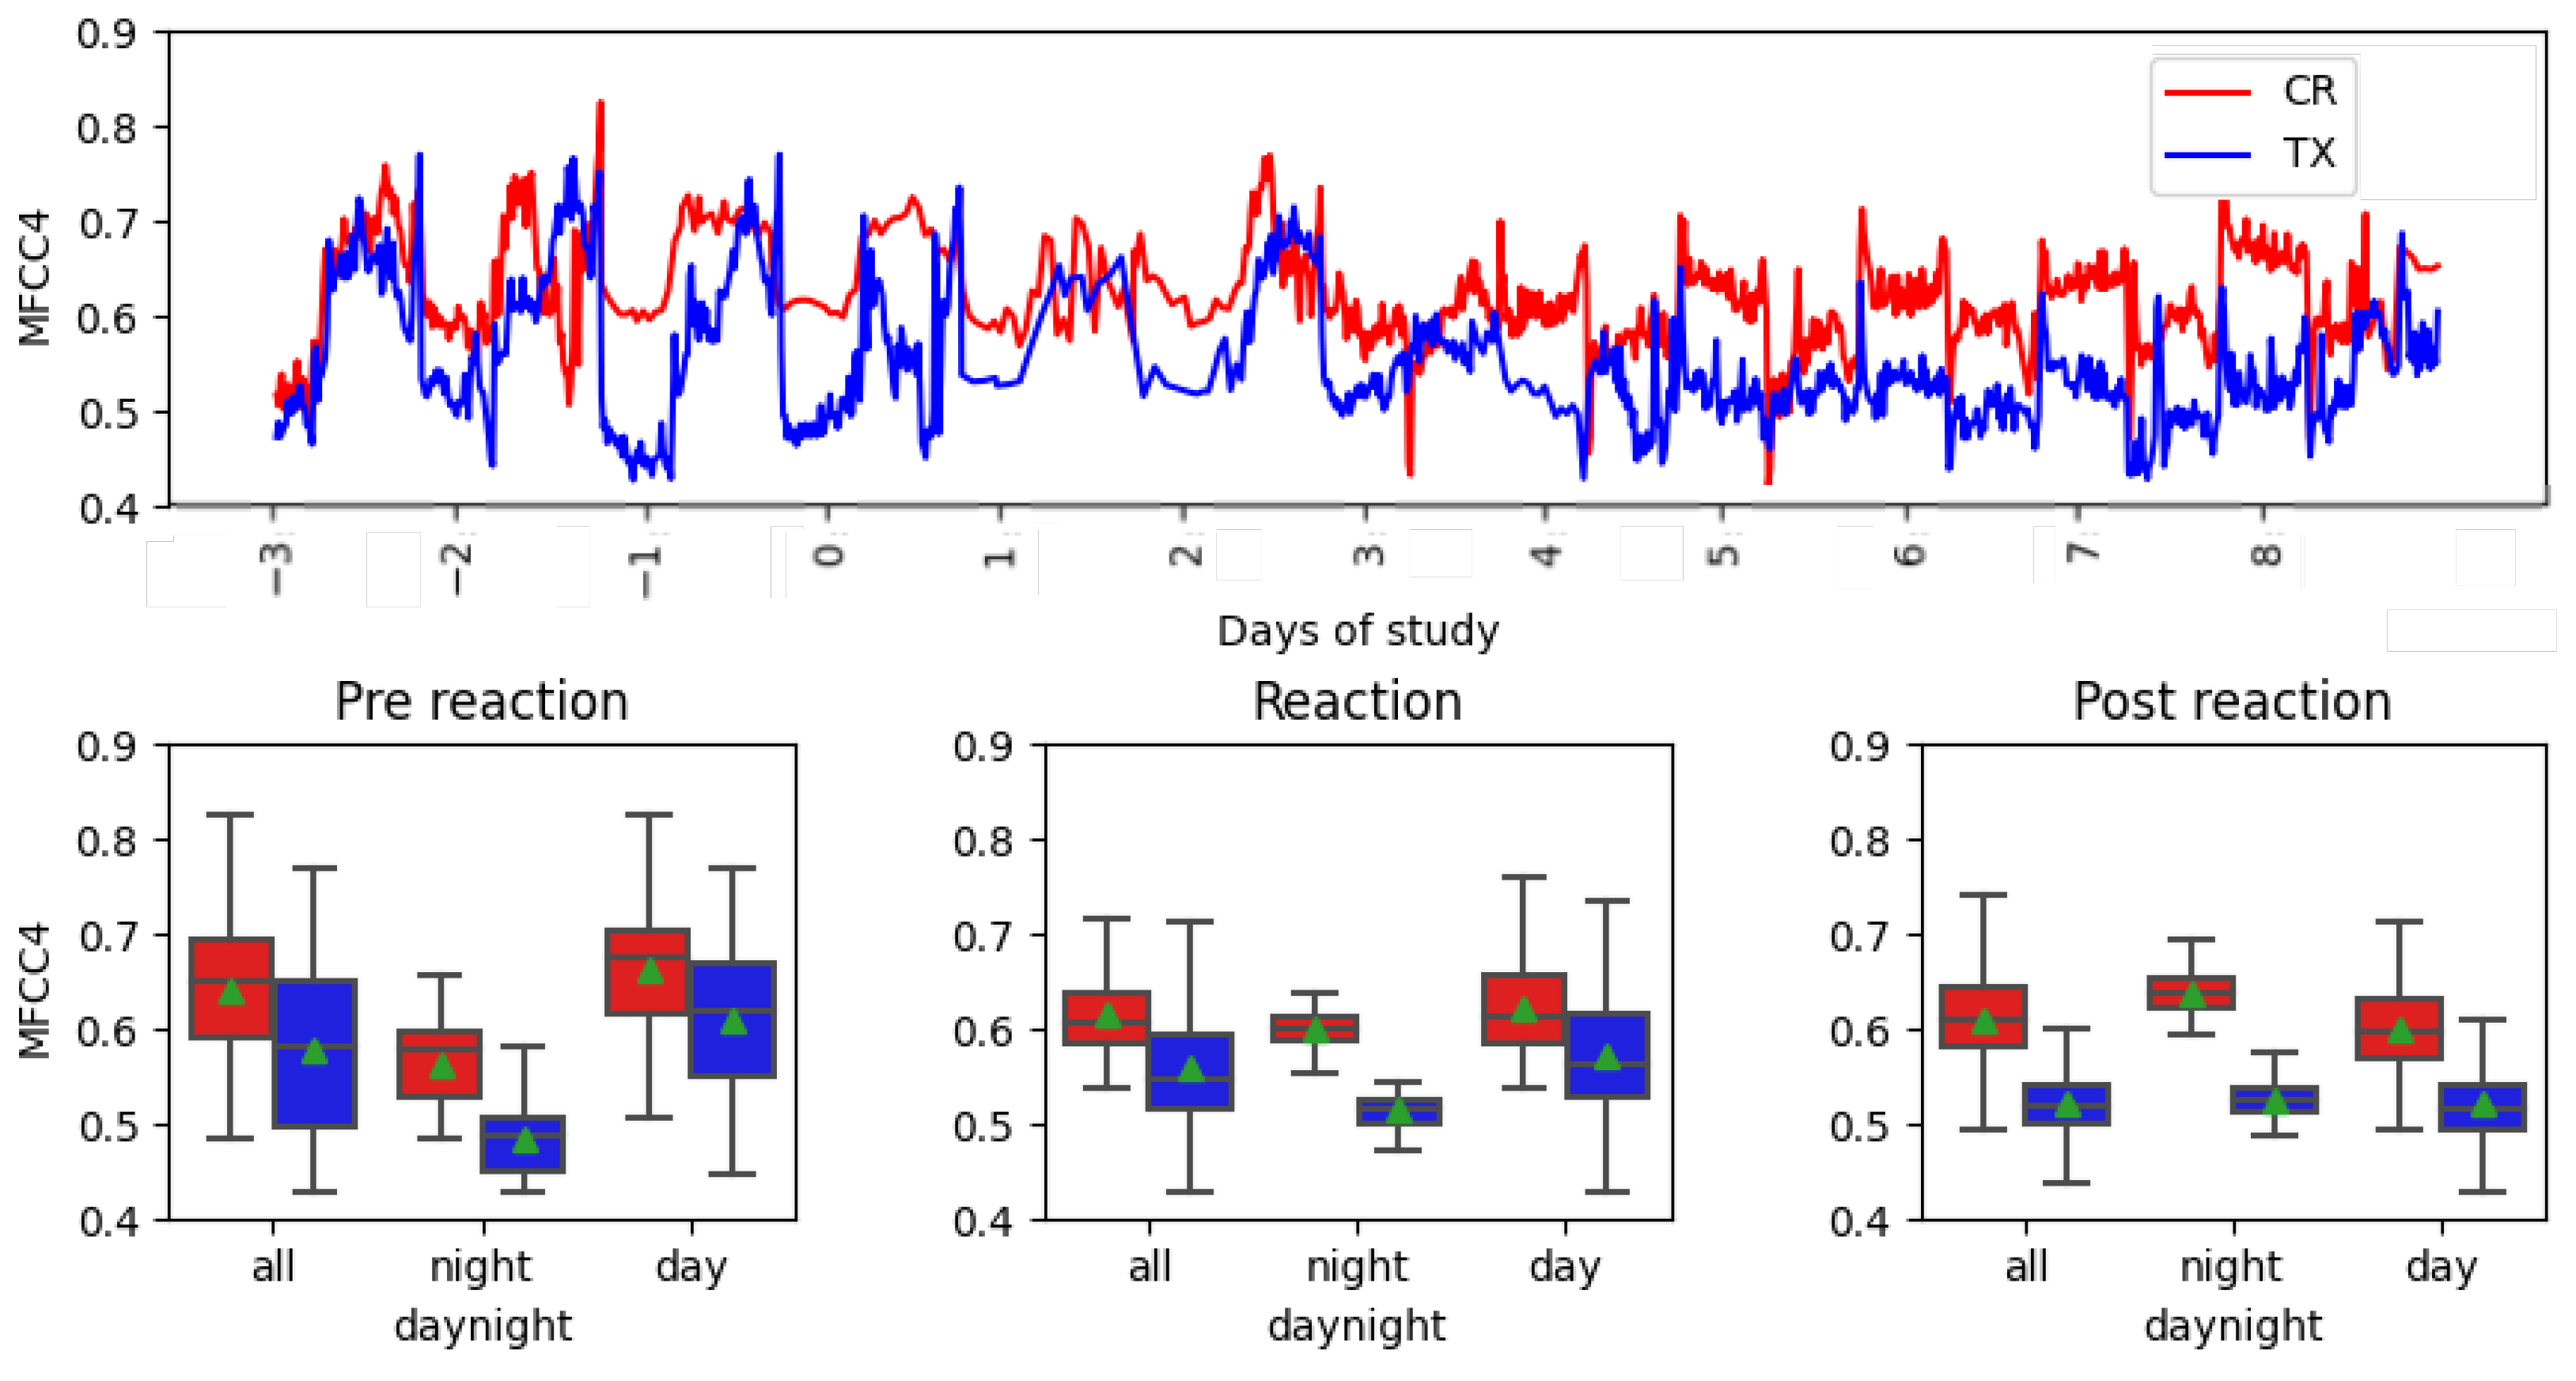
Table 4 shows the descending order list of the most important features for modeling data with the Gaussian NB algorithm. Centroid and MFCC4 are the most important features, at a great distance away from the following feature, MFCC1.
Figure 5 and
Figure 6 show the temporal evolution of these features and boxplots.
Figure 5 shows the values of the centroid feature under study. As noted above, the results in the overnight boxplot had similar mean and median values between 2700 and 3200 Hz, and were lower in both groups compared with other intervals, where values were between 3400 and 4200 Hz. Furthermore, night intervals had a lower standard deviation, between 150 and 350 Hz, than other intervals with compressed deviation, between 500 and 717 Hz. The evolution of the time series showed the maximum peak values on days 1 and 2 after vaccination administration in both groups. The most similar curves were found in the post-reaction interval from days 5 to 8 compared with the reaction days, with maximum peaks and greatest differences between the curves.
Figure 6 shows the values of the MFCC4 feature under study. The treatment curve in the time series showed some differences after the day of vaccination, narrowing the range of values. Additionally, the control curve had less variation between intervals. In the box-plots, a reduced deviation between the reaction and post-reaction can be observed, compared to the first interval. A reduced standard deviation was observed during the night interval. MFCC4 shows the difference between non-reaction and reaction.
3.3.2. Vaccine Reaction Detection
The detection of vaccine reaction through sound capture can improve animal welfare, through the adoption of corrective measures taken by the farmer. Gaussian NB was the selected algorithm to detect the vaccine reaction during the night interval, due to its performance.
Table 5a shows the binary classification results of the Gaussian NB reaction and non-reaction models, using the test data of the control dataset (see the splitting procedure in
Figure 3). The non-reaction class was the best ranked, with a F1 of 0.83, followed by the reaction class with an F1 score of 0.76. The weighted mean F1 of the model was 0.80.
Figure 7 shows the Gaussian NB-normalized confusion matrix of the test results, where more reaction samples (0.29) are identified as non-reaction than reaction.
After fitting the model with the control dataset, which included samples of both reaction and non-reaction, the trained algorithm was evaluated using the full treatment dataset.
Table 5b shows the results of the model evaluation with the treatment group. The non-reaction class was classified with an F1 score of 0.99, indicating that the majority of samples were recognized as non-reacting.
The prediction output of the Gaussian NB classifier was also time-related as time-synced samples were obtained, to identify periods of misclassification, or to detect days with increased detection of vaccine reactions.
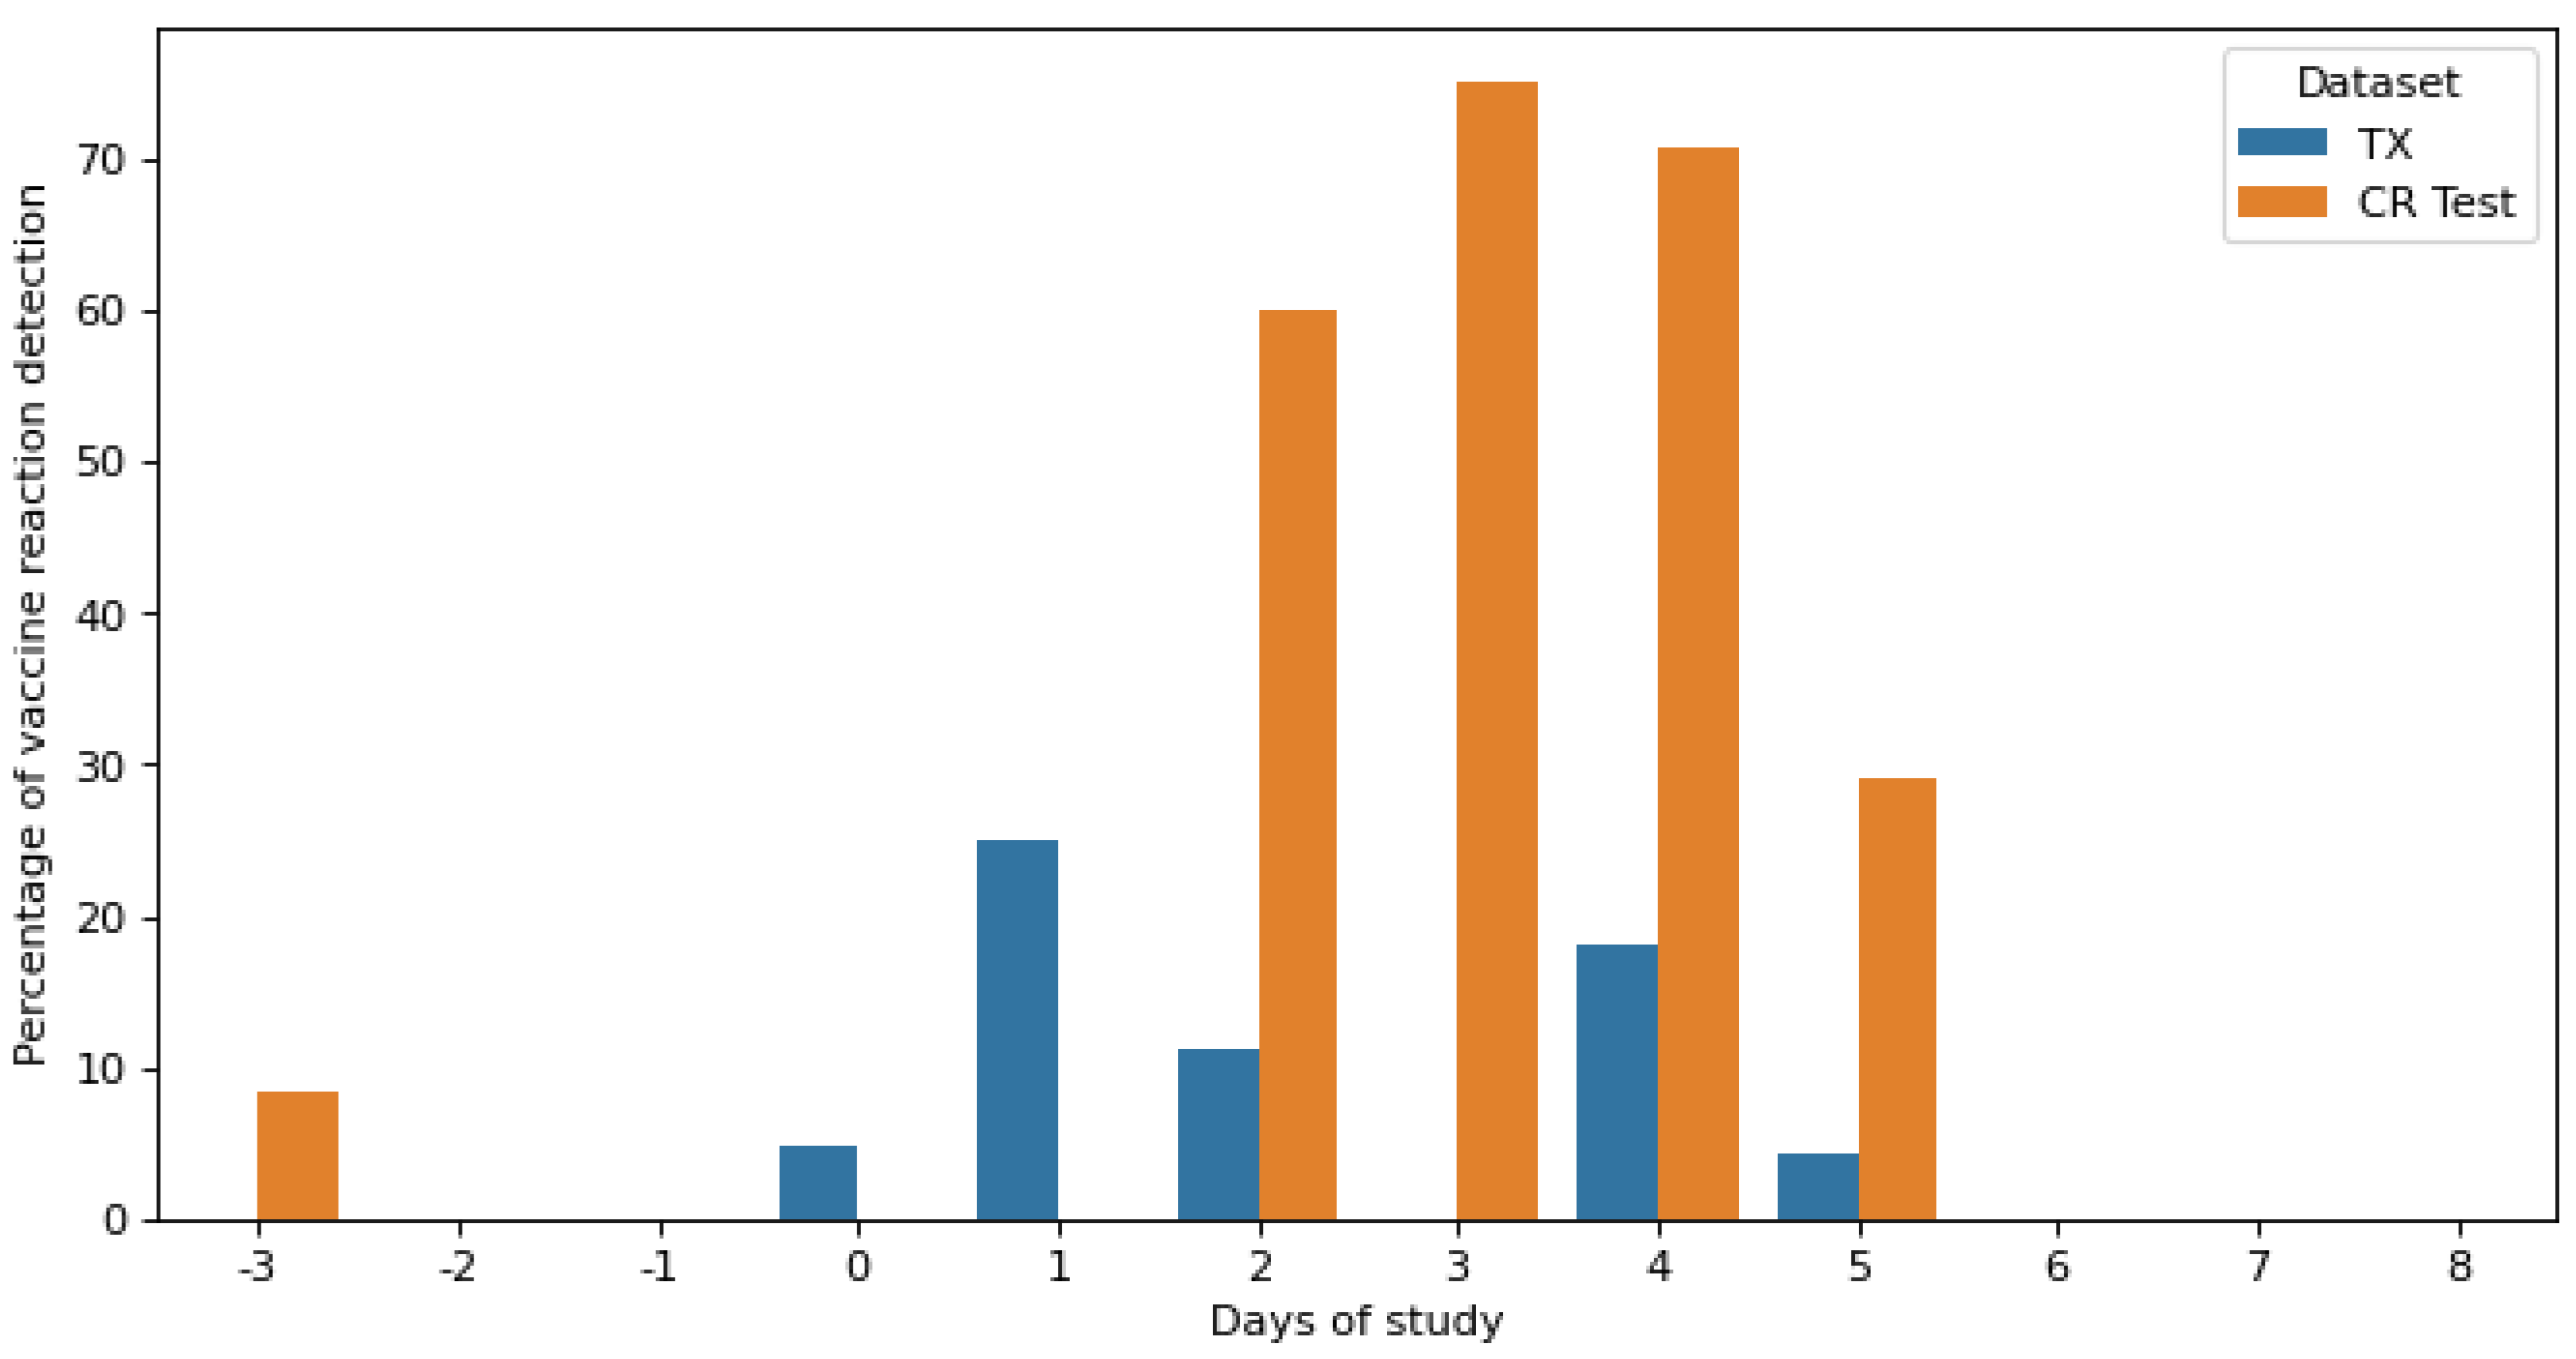
Figure 8 shows the daily vaccine reaction detection rate of the Gaussian NB classifier for the testing and validation datasets. The percentage was calculated as the sum of all prediction classifications as class reactions per day, divided by the total number of samples for each day. The test dataset contained samples from day −3 of the pre-reaction phase, days 2 to 4 of the reaction phase, and days 5 and 7 of the post-reaction phase. Additionally, the evaluation dataset contained samples from the entire experiment, from day −3 to day 8.
In the test dataset, there was a 10% misclassification in reaction class on day −3. Day 7 was correctly classified as no reaction. On the 5th day after vaccination, the last of the reaction phase, a small reaction was still found, equal to 30%. Higher reactions were observed on days 2, 3, and 4, achieving maximum detection on day 3, with approximately 75% values.
In the validation dataset, there was a 5% misclassification in reaction class on day −1, while reaction detection between day 0 and day 4 was significantly reduced to that detected in the test dataset. It was also observed that day 5 after vaccination administration was the last day with a reaction detection reduced to 5%.
4. Discussion
This work aims to use PLF technology to characterize the vocalization of hens on a commercial farm before, after, and during their reactions to the ILT vaccine, and to identify and analyze the most important features of automatic detection. A second objective is to quantify the effectiveness of a treatment that reduces the aforementioned vaccination reaction in the animal.
The centroid and vocalNum are stress-related acoustic features. In
Figure 4, the centroid feature showed an increase in value on the day of vaccination and throughout the next four days. Furthermore, the maximum peak values of vocalNum were found in the first three days of the vaccination reaction. Higher values in the reaction period suggest the presence of stress caused by manual vaccination with eye drops, and the presence of vaccination side effects. An analysis during daylight, night-time, and throughout the day showed that the night-time interval presented a lower data deviation (
Table 1), due to less interference from the surrounding machinery, which allowed for clearer recordings of vocalizations. Furthermore, mean differences between CR and TX groups were found at night, resulting in smaller
p-values (
Table 2). The minimum
p-values of the entire analysis were found in the reaction phase block, as follows: 2.41 ×
centroid at night and 1.42 ×
vocalNum at night. These important statistical differences could be due to the effect of the administration of the product to TX, as this was the only difference between the two groups.
The higher mean value differences obtained in the reaction block for the centroid feature suggested the possibility of automating vaccine reaction detection. Of all the algorithms tested, Gaussian Naive Bayes performed best, with an F1 score and accuracy above 0.80 (
Table 3). The performance of this model is acceptable for vaccine reaction detection. Analyzing the permutation importance of the Gaussian NB algorithm, the two most important features, according to the algorithm, were the centroid, at a value of 0.14, and MFCC4, with a value of 0.10. According to previous publications by several authors of this paper, these features are also used in poultry to indicate food intake, namely the centroid feature [
16] and MFCC4, with high concentrations of
[
17]. This is in contrast with to the vocalNum parameter, which is also recognized as identifying stress, but only detected a few peak vaccine reaction side effects in hens during the initial three days of administration, making it a less effective feature.
The Gaussian NB classification model was fitted with training data and tested with the CR dataset.
Table 5a and
Figure 7 show that the non-reaction class was better classified, with an F1 score of 0.83, than the reaction class, which had an F1 score of 0.76. The superior classification of the non-reaction class may be attributed to the ease of labeling periods without reactions, as reaction intervals could vary in intensity levels depending on animal welfare, leading to potential misclassifications. When testing the treatment dataset with the trained model of the control group (see
Table 5b), it was observed that the TX data was predominantly classified as non-reactive (with an F1 score of 0.99) over the 12 days of the study. The algorithm detected the effectiveness of the product in alleviating respiratory problems, as it classified samples after vaccination (from day 0 onwards) as non-reactive.
By calculating the daily detection rate of the vaccine reaction,
Figure 8 for the test data shows that the maximum vaccine detection above 75% was found on day 3 after vaccination. Furthermore, on day 5, which was classified as non-reactive, 30% of reactions were still detected, as some side effects of the vaccine were still present, although very reduced. Punctual errors in the classifications were found on day −3, which corresponded to less than 10%. The validation dataset showed reduced percentage values of vaccine reaction compared to test predictions, due to the efficacy of the treatment product.
Other literature published on precision livestock farming methods for poultry health classification and monitoring showed similar accuracy to the results discussed. Mahdavian et al. [
10] classified other respiratory diseases, such as bronchitis, with an 83% accuracy value, using wavelet entropy, on the third day after inoculation and classified Newcastle disease with 78% accuracy, using MFCCs, on the fourth day after incoulation. Carroll et al. [
5] detected gurgling noises, a distinct symptom of respiratory diseases in poultry, also using MFCCs and obtained a 73.4% accuracy value and a 51.4% recall value. Jakovljević et al. [
9] detected stress on broiler farms during the first four weeks of life, and the accuracy of the classification varied between 63% and 83%, depending on the animal age.
The following limitations on vaccine reaction detection were encountered during the study. The size of the dataset was limited by the commercial farm’s availability to perform experimental testing and the animal production cycle. The reactions of the hens were limited to the side effects of the administered vaccine experienced in a single data campaign. Nonetheless, management and external conditions were kept constant, in order to be able to compare the results obtained by the two houses. The models could not be tested in real time during a known reaction period by the farmer, to compare results between automated and manual monitoring, due to the need to collect the data to generate the algorithms.
5. Conclusions and Future Work
The results previously discussed answer the research question. The ILT vaccine, administered manually to hens as eye drops, represents a stressful procedure that can be detected and quantified through acoustic parameters, especially at night, when the data is collected with a lower standard deviation.
The automatic detection of hens’ vaccine reactions was possible via the Gaussian Naves Bayes algorithm, with an accuracy value and an F1 score of 0.80. The non-reaction label was better classified, with an F1 score of 0.83, than the reaction label, with an F1 score of 0.76. Due to the fact that the reaction to vaccination was not constant over time, it was more difficult to classify and was observed with a difference of 0.08 in the F1 score. On the third day after vaccination, maximum detection of the vaccine reaction was found in 70% of daily samples. Furthermore, the most important features, according to Gaussian NB, for detecting a reaction were the centroid and MFCC4. These findings strengthened the ability of the centroid feature to detect stress through vocalizations. Finding direct relations between acoustic feature centroids, in reaction and non-reaction periods, in addition to the non-linear relations found by the Gaussian NB algorithms, supports the hypothesis that hens’ vocalisations encode their welfare status and achieves the first objective of characterising hens’ vocalisations.
Natural products with an anti-inflammatory capacity that reduce the symptoms respiratory disorders and vaccination side effects can be tested for effectiveness using a non-invasive acoustic system. The product tested in this work was classified, with an F1 score equal to 0.99, as the non-reaction class of the fitted model. Less than 25% of samples were classified as reacting from day 0 to day 4 after the vaccine, demonstrating the effectiveness of the product in reducing vaccine side effects. This method also validates the efficiency of the product, while detecting the vaccine reaction if it is present, thereby achieving the second objective.
Future efforts will concentrate on expanding the control dataset to include various vocalisations associated with different commercial vaccine brands, seasons of the year, and farm locations, in order to develop a more comprehensive and well-suited model, thereby enabling real-time warnings to farmers for enhanced animal welfare.
Author Contributions
G.J.G.-P. led the fieldwork, collecting the audio data and processing the dataset, handled the software, and participated in writing the paper. R.M.A.-P. and I.I. supported the machine learning section and participated in writing and reviewing the paper. S.R. supported the investigation and methodology and reviewed the paper. T.P.M. supported the field work, reviewed the paper, was the project administrator and organised the funding acquisition. J.C.C. suggested part of the study and reviewed the paper. All authors have read and agreed to the published version of the manuscript.
Funding
This research was cofinanced by Cealvet SLu and the Euro Founding Eurostars project E114423—ITAM.
Institutional Review Board Statement
Ethical review and approval were waived for this study, due to the use of a non-invasive sound pickup method, installed in compliance with bio-security standards. Animal conditions, management, and product administration are productively used prior to this study by the poultry farmer and certified.
Informed Consent Statement
Not applicable.
Data Availability Statement
Data are contained within the article.
Acknowledgments
The authors would like to thank Avigan Terralta company poultry company, producing laying hens and day-old chicks for the consumer industry, for the use of their facilities and animals.
Conflicts of Interest
The authors declare no conflicts of interest.
Abbreviations
The following abbreviations are used in this manuscript:
| ILT | Infectious Laryngotracheitis |
| ILTV | Infectious Laryngotracheitis Virus |
| PCR | Polymerase Chain Reaction |
| RFLP | Restriction Fragment Length Polymorphism |
| ELISA | Enzyme-Linked Immunosorbent Assay |
| PLF | Precision Livestock Farming |
| CR | Control Group |
| TX | Treatment Group |
| MFCC | Mel Frequency Cepstral Coefficients |
| ML | Machine Learning |
| ROC | Receiver Operating Characteristics |
| AUC | Area Under the ROC |
| NB | Naive Bayes |
References
- Ou, S.C.; Giambrone, J.J. Infectious laryngotracheitis virus in chickens. World J. Virol. 2012, 1, 142. [Google Scholar] [CrossRef] [PubMed]
- Hidalgo, H. Infectious laryngotracheitis: A review. Braz. J. Poult. Sci. 2003, 5, 157–168. [Google Scholar] [CrossRef]
- Abbas, F.; Andreasen, J.R., Jr. Comparison of diagnostic tests for infectious laryngotracheitis. Avian Dis. 1996, 40, 290–295. [Google Scholar] [CrossRef] [PubMed]
- Kirkpatrick, N.C.; Mahmoudian, A.; O’Rourke, D.; Noormohammadi, A.H. Differentiation of infectious laryngotracheitis virus isolates by restriction fragment length polymorphic analysis of polymerase chain reaction products amplified from multiple genes. Avian Dis. 2006, 50, 28–33. [Google Scholar] [CrossRef] [PubMed]
- Carroll, B.T.; Anderson, D.V.; Daley, W.; Harbert, S.; Britton, D.F.; Jackwood, M.W. Detecting symptoms of diseases in poultry through audio signal processing. In Proceedings of the 2014 IEEE Global Conference on Signal and Information Processing (GlobalSIP), Atlanta, GA, USA, 3–5 December 2014; pp. 1132–1135. [Google Scholar] [CrossRef]
- Li, N.; Ren, Z.; Li, D.; Zeng, L. Automated techniques for monitoring the behaviour and welfare of broilers and laying hens: Towards the goal of precision livestock farming. Animal 2020, 14, 617–625. [Google Scholar] [CrossRef]
- Pereira, E.M.; Nääs, I.d.A.; Garcia, R.G. Identification of acoustic parameters for broiler welfare estimate. Eng. Agrícola 2014, 34, 413–421. [Google Scholar] [CrossRef]
- Tao, W.; Wang, G.; Sun, Z.; Xiao, S.; Wu, Q.; Zhang, M. Recognition Method for Broiler Sound Signals Based on Multi-Domain Sound Features and Classification Model. Sensors 2022, 22, 7935. [Google Scholar] [CrossRef] [PubMed]
- Jakovljević, N.; Maljković, N.; Mišković, D.; Knežević, P.; Delić, V. A Broiler Stress Detection System Based on Audio Signal Processing. In Proceedings of the 2019 27th Telecommunications Forum (TELFOR), Belgrade, Serbia, 26–27 November 2019; pp. 1–4. [Google Scholar] [CrossRef]
- Mahdavian, A.; Minaei, S.; Marchetto, P.M.; Almasganj, F.; Rahimi, S.; Yang, C. Acoustic features of vocalization signal in poultry health monitoring. Appl. Acoust. 2021, 175, 107756. [Google Scholar] [CrossRef]
- Hy-Line Brown Commercial Layers. Management Guide; Hy-Line Brown Commercial Layers: West Des Moines, IA, USA, 2018. [Google Scholar]
- Superlux ECM 999. Available online: http://www.superlux.com.tw/index.do (accessed on 21 February 2022).
- Beheringuer U-Phoria UM2. Available online: https://www.behringer.com/behringer/product?modelCode=P0AVV (accessed on 21 February 2022).
- Van Rossum, G.; Drake, F.L., Jr. Python Reference Manual; Centrum voor Wiskunde en Informatica: Amsterdam, The Netherlands, 1995. [Google Scholar]
- Foundation, X. FLAC Format. Available online: https://xiph.org/flac/ (accessed on 20 May 2022).
- Ginovart-Panisello, G.J.; Alsina-Pagès, R.M.; Sanz, I.I.; Monjo, T.P.; Prat, M.C. Acoustic Description of the Soundscape of a Real-Life Intensive Farm and Its Impact on Animal Welfare: A Preliminary Analysis of Farm Sounds and Bird Vocalisations. Sensors 2020, 20, 4732. [Google Scholar] [CrossRef]
- Ginovart-Panisello, G.J.; Iriondo Sanz, I.; Panisello Monjo, T.; Riva, S.; Garriga Dicuzzo, T.; Abancens Escuer, E.; Alsina-Pagès, R.M. Trend and Representativeness of Acoustic Features of Broiler Chicken Vocalisations Related to CO2. Appl. Sci. 2022, 12, 10480. [Google Scholar] [CrossRef]
- Ginovart-Panisello, G.J.; Riva, S.; Monjo, T.P.; Alsina-Pages, R.M. Changes in the characterization of newborn bird vocalisations during first 48-h of life-hours. In Proceedings of the EURONOISE 2021, Online, 25–27 October 2021. [Google Scholar]
- Ginovart-Panisello, G.J.; Alsina-Pagès, R.M. Preliminary Acoustic Analysis of Farm Management Noise and Its Impact on Broiler Welfare. Proceedings 2020, 42, 83. [Google Scholar]
- Audacity. Available online: https://www.audacityteam.org/ (accessed on 20 September 2019).
- Katiyar, A.M. Design of butterworth and chebyshev1 lowpass filter for equalized group delay. Int. J. 2012, 2, 524–528. [Google Scholar]
- Virtanen, P.; Gommers, R.; Oliphant, T.E.; Haberland, M.; Reddy, T.; Cournapeau, D.; Burovski, E.; Peterson, P.; Weckesser, W.; Bright, J.; et al. SciPy 1.0: Fundamental Algorithms for Scientific Computing in Python. Nat. Methods 2020, 17, 261–272. [Google Scholar] [CrossRef]
- McFee, B.; Raffel, C.; Liang, D.; Ellis, D.P.; McVicar, M.; Battenberg, E.; Nieto, O. librosa: Audio and music signal analysis in python. In Proceedings of the 14th Python in Science Conference, Austin, TX, USA, 6–12 July 2015; Volume 8, pp. 18–25. [Google Scholar]
- Curtin, R.R.; Daley, W.; Anderson, D.V. Classifying broiler chicken condition using audio data. In Proceedings of the 2014 IEEE Global Conference on Signal and Information Processing (GlobalSIP), Atlanta, GA, USA, 3–5 December 2014; pp. 1141–1144. [Google Scholar]
- Klapuri, A.; Davy, M. Signal Processing Methods for Music Transcription; Springer: New York, NY, USA, 2007. [Google Scholar]
- Rabiner, L.; Schafer, R. Theory and Applications of Digital Speech Processing; Prentice Hall Press: Hoboken, NJ, USA, 2010. [Google Scholar]
- Li, J.; Deng, L.; Haeb-Umbach, R.; Gong, Y. Chapter 1—Introduction. In Robust Automatic Speech Recognition; Li, J., Deng, L., Haeb-Umbach, R., Gong, Y., Eds.; Academic Press: Oxford, UK, 2016; pp. 1–7. [Google Scholar] [CrossRef]
- Kishore, K.K.; Satish, P.K. Emotion recognition in speech using MFCC and wavelet features. In Proceedings of the 2013 3rd IEEE International Advance Computing Conference (IACC), Ghaziabad, India, 22–23 February 2013; pp. 842–847. [Google Scholar]
- Lalitha, S.; Geyasruti, D.; Narayanan, R.; Shravani, M. Emotion Detection Using MFCC and Cepstrum Features. Procedia Comput. Sci. 2015, 70, 29–35. [Google Scholar] [CrossRef]
- Chambers, J.M. Linear models. In Statistical Models in S; Routledge: Oxfordshire, UK, 2017; pp. 95–144. [Google Scholar]
- Pisner, D.A.; Schnyer, D.M. Chapter 6—Support vector machine. In Machine Learning; Mechelli, A., Vieira, S., Eds.; Academic Press: Cambridge, MA, USA, 2020; pp. 101–121. [Google Scholar] [CrossRef]
- Ketkar, N.; Ketkar, N. Stochastic gradient descent. In Deep Learning with Python: A Hands-On Introduction; Apress: Berkeley, CA, USA, 2017; pp. 113–132. [Google Scholar]
- Kramer, O.; Kramer, O. K-nearest neighbors. In Dimensionality Reduction with Unsupervised Nearest Neighbors; Springer: Berlin/Heidelberg, Germany, 2013; pp. 13–23. [Google Scholar]
- Seeger, M. Gaussian processes for machine learning. Int. J. Neural Syst. 2004, 14, 69–106. [Google Scholar] [CrossRef]
- Wegelin, J.A. A Survey of Partial Least Squares (PLS) Methods, with Emphasis on the Two-Block Case; Technical Report 371; University of Washington: Seattle, WA, USA, 2000. [Google Scholar]
- Webb, G.I.; Keogh, E.; Miikkulainen, R. Naïve Bayes. Encycl. Mach. Learn. 2010, 15, 713–714. [Google Scholar]
- De Ville, B. Decision trees. Wiley Interdiscip. Rev. Comput. Stat. 2013, 5, 448–455. [Google Scholar] [CrossRef]
- Dietterich, T.G. Ensemble methods in machine learning. In Proceedings of the International Workshop on Multiple Classifier Systems, Cagliari, Italy, 21–23 June 2000; pp. 1–15. [Google Scholar]
- Pedregosa, F.; Varoquaux, G.; Gramfort, A.; Michel, V.; Thirion, B.; Grisel, O.; Blondel, M.; Prettenhofer, P.; Weiss, R.; Dubourg, V.; et al. Scikit-learn: Machine Learning in Python. J. Mach. Learn. Res. 2011, 12, 2825–2830. [Google Scholar]
- Lazzy Predict. Available online: https://lazypredict.readthedocs.io/en/latest/ (accessed on 20 July 2022).
- van den Heuvel, H.; Youssef, A.; Grat, L.M.; Neethirajan, S. Quantifying the Effect of an Acute Stressor in Laying Hens using Thermographic Imaging and Vocalisations. bioRxiv 2022. bioRxiv:2022.07.31.502171. [Google Scholar] [CrossRef]
- Collias, N.E. The Vocal Repertoire of the Red Junglefowl: A Spectrographic Classification and the Code of Communication. Condor 1987, 89, 510–524. [Google Scholar] [CrossRef]
- Shapiro, S.S.; Wilk, M.B. An Analysis of Variance Test for Normality (Complete Samples). Biometrika 1965, 52, 591–611. [Google Scholar] [CrossRef]
- Schultz, B.B. Levene’s Test for Relative Variation. Syst. Biol. 1985, 34, 449–456. [Google Scholar] [CrossRef]
- Vallat, R. Pingouin: Statistics in Python. J. Open Source Softw. 2018, 3, 1026. [Google Scholar] [CrossRef]
- Hemachandran, K.; Tayal, S.; George, P.M.; Singla, P.; Kose, U. Bayesian Reasoning and Gaussian Processes for Machine Learning Applications; CRC Press: Boca Raton, FL, USA, 2022. [Google Scholar]
- Jahromi, A.H.; Taheri, M. A non-parametric mixture of Gaussian naive Bayes classifiers based on local independent features. In Proceedings of the 2017 Artificial Intelligence and Signal Processing Conference (AISP), Shiraz, Iran, 25–27 October 2017; pp. 209–212. [Google Scholar] [CrossRef]
- Breiman, L. Random forests. Mach. Learn. 2001, 45, 5–32. [Google Scholar] [CrossRef]
| Disclaimer/Publisher’s Note: The statements, opinions and data contained in all publications are solely those of the individual author(s) and contributor(s) and not of MDPI and/or the editor(s). MDPI and/or the editor(s) disclaim responsibility for any injury to people or property resulting from any ideas, methods, instructions or products referred to in the content. |
© 2024 by the authors. Licensee MDPI, Basel, Switzerland. This article is an open access article distributed under the terms and conditions of the Creative Commons Attribution (CC BY) license (https://creativecommons.org/licenses/by/4.0/).


 ,
, 


