Featured Application
This research highlights the implementation of a novel sensing approach allowing for geomechanics insights in rock bolt performance and behaviour; recent advancements in the technique are also presented.
Abstract
An often-utilized solution in terms of providing support to underground excavation, the fully grouted rebar rock bolt system presents optimization potential due to existing technological limitations in capturing and understanding its composite system response. In order to address these limitations, the development and application of Distributed Optic Fiber Sensing (DOS) allows for continuous strain monitoring (at a spatial resolution of 0.65 mm utilizing the technique defined herein) across a full spectrum of loading. A robust laboratory investigation was conducted featuring 24 rock bolt specimens. This examined the effects of two selected independent variables: rib spacing (from 13 mm to 68 mm) and grout annulus (from 7.7 mm to 22.8 mm). This body of research provides valuable insight into the performance of grouted rebar rock bolts and the effects of the selected parameters (rib spacing and size of the grout annulus), while also highlighting an advanced monitoring technique. Results indicated that rib spacing was a negative predictor of bond performance. No definite conclusions were drawn in terms of the effect of the size of grout annulus; however, findings provide limited support for an optimal sizing in relation to rib height. The results were also compared to analytic and numerical models. These insights can aid in calibrating and validating numerical models, and improve monitoring and rock bolt design within the overall goal of improving and optimizing ground support design arrangements.
1. Introduction
Conditions in modern tunnelling are demanding, as work is often being completed in unfavourable or unpredictable ground conditions along with stringent displacement tolerances and/or settlement requirements. This has driven a need for optimization of the support element and of the overall tunnel support regime. One such support element that is used extensively in underground works [1,2] and has the potential for further optimization is the fully grouted rebar rock bolt. Understanding of the composite system has been hampered by technological limitations. The use of conventional strain gauge monitoring not only limits spatial resolution of the collected data but also discourages the use of full-scale specimens during testing [3,4,5,6,7,8,9]. Short specimens are often utilized, as it allows researchers to assume the transfer stress to be uniform over the length [10,11]. There is ample evidence to suggest that there is a shift in transfer stress behaviour with short- to full-length specimens [9], and this can be seen in Figure 1. In order to address this limitation, a solution was further developed by Vlachopoulos (and associated industrial partners) through an innovative methodology of strain sensing [12]. This methodology uses Rayleigh Optical Frequency Domain Reflectometry (ROFDR), which provides an unprecedented spatial resolution of 0.65 mm for ground support elements without the conformance issue when using strain gauges. This research looks to create a better understanding of the individual and combined effects of ground support, with a focus on rock bolting. This has been achieved using the Distributed Optical Fiber Sensing (DOS) technique and ensuing methodology that has been employed in multiple investigations across a spectrum of scales. The testing has included in situ and laboratory investigations, while also being complemented with numerical modelling (as highlighted in Figure 1).
This methodology has allowed for various detailed investigations into the parameters which effect rock bolt behaviour. Findings pertaining to the effects of grouting material, embedment length and confining material have previously been conducted [9]. Rib spacing and grout annulus (the thickness of grout between the bar and the confining medium) were selected for investigation, as they have both been seen to influence performance through their effects on mechanical interlock. Both have the potential for additional insight to be gleaned from the use of fiber optic sensor monitoring. Limitations seen in the current body of literature are the lack of full-scale embedment length testing and limited spatial resolution of collected strain data [3,4,5,6,7,11,13,14]. This is significant as full-scale testing with a 1:1 geometric scale allows for the most reliable research and the closest approximation to field conditions [15]. To address the gap, a robust parametric analysis featuring 24 full-scale specimens was conducted. This was paired with additional investigations, numerical models were constructed and existing analytical models were compared to collected strain data [11,16].
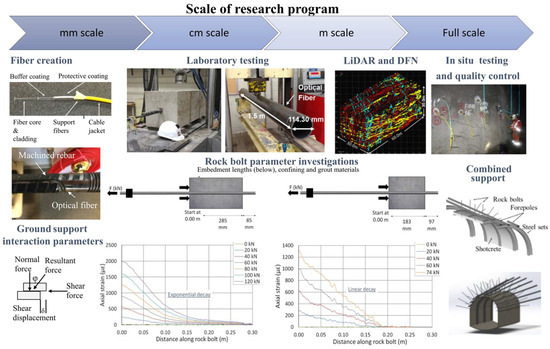
Figure 1.
Research program from 2012 to today, depicting scale and ensuing investigations, including key findings such as linear vice exponential decay seen in short- and full-length specimens represented in the bottom centre graphs [9,17,18].
2. Materials and Methods
2.1. Monitoring Development and Implementation
The utilization of a combination of global and component monitoring has been well explored in other published work from our research group [9,19,20,21] and will only be briefly summarized herein, with additional details on changes given. Displacements and applied load are captured through a combination of Linear Variable Differential Transformers (LVDTs) and the Material Testing System’s (MTS) actuator and load cell. Component monitoring was accomplished through the use of fiber optic sensors. Fiber optic sensors offer numerous benefits over the traditional strain gauges used in other research [22,23,24,25]. The studies that utilize traditional strain gauges experience limitations because each individual sensor requires two wires to pass the current through [26]. This limits the number of sensors which can be used without presenting conformance issues due to the inference of all the wiring required. Fiber optics present a solution to this as they offer a spatial resolution of 0.65 mm and only require one fiber for the monitoring of the entire specimen. These sensors are made by our research group in the laboratory and installed within grooves biaxially to capture the axial response of the members. This technique leverages Rayleigh Optical Frequency Domain Reflectometry (ROFDR), in which cross-correlation from elastic scattering produced by a tunable light can produce strain results [27,28] utilizing a Luna ODiSI-B analyzer. This methodology is able to produce a 0.65 mm spatial resolution of the purely axial response of the component for which it is affixed. This research effort is novel due to a few changes being made to optimize the implementation of the fiber optic sensors. The fiber was installed along the longitudinal rib instead of the transverse ribs to prevent conformance issues as the transverse rib is key to the mechanical interlock. The fiber was also debonded along the unsupported length (the length between the loading and the embedment length) and slightly into the specimen (2.5 cm) to prevent premature failure of the sensor during yielding and conical grout failure. This was accomplished by covering the grooves with a thin layer of tape and epoxy such that the fiber could move freely. Due to this debonding, results are not present for the first 7.5 cm, to account for both the debonding in the conical grout failure potential region, and activation length of the fiber. This was confirmed as 50 mm from the conducted tensile testing and was found to be similar with other conducted research [29]. This tensile test was conducted utilizing a rebar specimen from the laboratory investigation, with 6 strain gauges paired and one length of DOS. The specimen was brought to yield and the results between the instruments were compared. This can be seen in Figure 2.
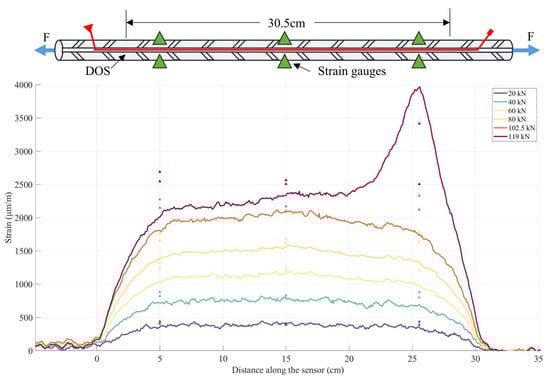
Figure 2.
Results from the tensile test for strain activation length of the fiber with comparison to strain gauges.
Fiber was also installed on the outside of the pipe to capture the dilation behaviour of the confining medium. This was done in a similar biaxial manner but aligned perpendicularly to the longitudinal ribs of the rebar. This orientation was selected because the longitudinal rib region should have the lowest dilation as this rib does not generate outward force through mechanical interlock. The full suite of instrumentation used to monitor specimen behaviour can be seen in Figure 3. A summary of the selected instrumentations and their accuracy can be found in Table 1.
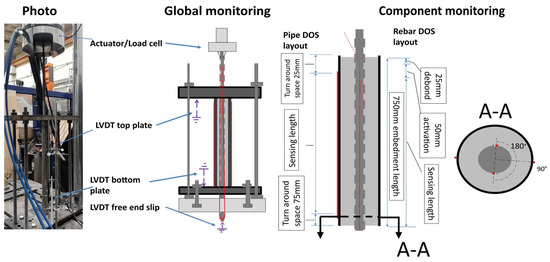
Figure 3.
The complete layout of the monitoring plan, including schematic views of global and component monitoring and cross-sectional layout of the DOS; not to scale.

Table 1.
Summary of instrumentation [30,31,32,33].
2.2. Laboratory Testing Methodology
For the two selected variables, a parameter analysis was conducted. Rib spacings were selected according to what was achievable by mechanically altering (removing ribs from) a standard Grade 60 #6 (19.05 mm nominal diameter) bar [34]. The selection of such spacing was seen in other research and fabrication was accomplished in a similar manner [7]. To confine the specimens, steel pipes were used. This is often done to replicate rock due to its practicality [7,13,35]. Grout annulus was selected by viewing the commercially available size of pipes while aiming to maintain a radial stiffness of around 1600 MPa/mm, which is equivalent to limestone or granite [35,36]. These selected independent variables can be seen visually in Figure 4, along with the chosen labelling convention. This formed a 4 × 5 parametric analysis, where an additional 4 control or repeated specimens were used. The full laboratory testing program can be seen in Table 2. All specimens were grouted using a 40% w/c cement grout. This value was selected as it is commonly featured in research and is within the standard range used by industry [5,35,37,38,39,40,41]. The embedment length of 750 mm (anchorage length) was selected as previous research [36] had indicated that this would be sufficient to achieve rebar necking as the primary failure mechanism. This was done so that active embedment length at full loading could be observed.
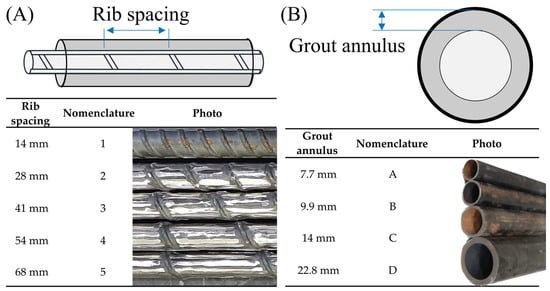
Figure 4.
Specimen selection and nomenclature: (A) rib spacing, (B) grout annulus.
Table 2.
Full laboratory parametric analysis of rib spacing and grout annulus.
During the first round of testing significant air voids were observed. To address this, various grouting methods were tested with clear PVC pipes to identify the formation of any voids. With the insights gleaned during this protocol, a methodology was implemented from the remainder of the test specimen and no large voids were observed. These specimens were created by pumping grout through a commercially available grout pump (Kenrich’s Gp-1). Specimens were pumped through the bottom from a hose barb and then externally vibrated. To confirm that air was not entrapped due to pumping, the density from the non-pumped cylinders were compared to the bulk density of the grout collected from the specimens after testing. This density comparison can be seen in Table 3. A detailed investigation of material properties was conducted through a literature review and also from a series of laboratory testing. The summary of material properties can be seen in Table 4.
Table 3.
Grouting methodology density comparison.
Table 4.
Summary of material properties.
The testing procedure for all the specimens was conducted in the same manner. This setup was very similar to other research conducted from our research group and aimed to simulate the anchorage length of the rock bolt in a similar manner to the methodology employed for in situ testing (ASTM D4435) [9,49]. The specimens were set into the bearing rig, which can be seen in Figure 3. Then, the instruments were placed and it was verified that they were functioning. Load was applied via a Material Testing System (MTS) hydraulic grip using displacement control set to 1 mm/min. Testing was conducted until material failure was evident or a significant slip had occurred (<10 cm). Testing commenced with a verbal countdown and simultaneous start of the loading and all the data acquisition units (DAQs).
2.3. Modelling Development and Employment Methodology
2.3.1. Analytical Modelling
The methodology of strain capture created by this research group allows for unparalleled comparison to existing analytical models. One of the older but widely used models was presented by Li and Stillborg [16,23,37]. The simplified version, which can be seen in Equation (1), was compared. A modern method which aimed to present an easily applicable formula will also be compared. This model was presented by Ma [11] and can be seen in Equation (3). Inherently, neither model captures alternative rib spacing; however, Ma’s model does include the effects of grout annulus. These presented models will be compared to all collected strain data at 10, 50 and 100 kN to understand their performance across a wide range of loading.
where α is a dimensionless parameter related to the deformation properties of the grout and the rock, Equation (2):
Eb is the modulus of elasticity of the bolt, taken as the theoretical value of 200 GPa;
Gr is the shear modulus of the confining medium, Gr = 77.5 GPa, from theoretical values of Young’s modulus (200 GPa) and Poisson’s ratio (0.29);
Gg is the shear modulus of the grout, calculated for E and v, which were obtained from cement testing (GPa);
X is the distance divided by the bolt radius (m/m);
is the theoretical strain at the loading point (mm/mm);
dg is the diameter of the borehole, taken as the inner diameter of the pipe (m);
db is the diameter of the bolt (m);
do is the diameter of the circle of influence of the rock bolt in the rock, such that outside of this diameter the influence of the bolt disappears (a representative value of ten times the dg was used, as per [16] (m))
where,
a and b coefficients determined from testing (mm);
E is the modulus of elasticity of the bolt, taken as 200 GPa;
PMax is the maximum applied load (kN), or if unavailable the expected max;
P is the loading force (kN);
L is the total length of the grouted bolt (mm);
db is the diameter of the bolt (mm);
x is the distance along the bolt (mm);
is the secant stiffness taken at 100 kN with displacement from DOS (kN/mm).
2.3.2. Numerical Modelling
To support this research investigation, a 3D finite element analysis (FEA) of a rock bolt was conducted. The aim of the model was to create a better representation of observed laboratory behaviour. Our research group previously utilized a 2D model in RS2 [50], but we struggled to capture the response of full-length members [18]. Although the short embedment model (100 mm) performed well, when the length increased to 500 mm, the model did not accurately match the collected results. This is because there is a shift between linear and exponential decay, as seen in the laboratory results [9], which was not captured by the model. For the RS2 model, the joint’s strength and stiffness are explicitly defined; therefore, to improve the model a frictional contact model was utilized, which defines the interaction of the two bodies by interpreting the interaction of the two surfaces where they can slide and separate. This preliminary investigation to utilizing this joint definition was conducted on ANSYS. For these purposes, a 3D linear elastic solution was developed and compared to laboratory collected results. The methodology, results and recommendations are provided. Although not within the scope of this investigation, when an understanding of the behaviour is established, laboratory-collected parameters can be integrated into excavation modelling software, which ultimately leads to better representation [51].
This modelling was split into three stages. Models of 100 mm, 250 mm, 500 mm and 750 mm (featuring two different rib spacings) were analyzed. Each stage features the creation of a small, ribbed section to establish and verify meshing, loading, boundary conditions and contact analysis. All stages of the model featured three materials: the bolt, the grout and the confining pipe. The selected material properties can be seen in Table 5. Load was applied to the bolt and load was transferred through material contact, as shown in Figure 3. The bearing rig utilized in the laboratory testing was represented by a boundary condition. Due to the elastic loading, no failure of the material should occur and no cracking can occur as this model utilizes a constitutive relationship that is linear elastic. Due to this, it was expected that the movement of the rebar will be associated with dilation of the grout and pipe, where high stress will be seen at the grout–rebar interface. Models were created over various lengths to compare their behaviour against previous models and existing laboratory results [18], and to results collected during this investigation. The coefficient of friction between the rebar and the grout was set at 0.57 [52] and the contact between the pipe and the grout was modelled as a bonded contact as typically minimal movement occurs at this interface both in the laboratory and in the field [13,18]. The models were generated in SolidWorks [53] using geometric simplifications, which were investigated. Solid modelling was conducted to capture the gradient stress response through the thickness of the materials. Taking advantage of the symmetry, a half model was built along the longitudinal axis. The materials were meshed with higher-order tetrahedral and brick elements (Solid186, Solid 187, load applied using Surf 154 and contact surfaces were Targe170 and Conta174). Mesh sizing was selected by convergence studies and optimized by splitting materials into sections in which meshing size matched the complexity. Contact was conducted using an unsymmetrical interface and an augmented LaGrange method, with a stiffness factor of 3 for the frictional (grout–rebar contact) and 10 for bonded (and 15 for later models). The models were run as static non-linear analyses. Load steps were utilized both to collect results at specific loads and to aid in convergence. However, pre-tensioning was not required to aid in convergence due to the model constraints and construction method. Weak springs were turned off and large deflections were left on. An iterative solver was used.
Table 5.
Selected material properties for numerical modelling.
2.4. Data Analysis Methodology
In order to capture the effects of rib spacing and grout annulus, data from the component monitoring provided by the DOS, global data, and post-testing observations were combined. This methodology has been utilized previously [54] by this group. Additional investigation will be described. The embedment length selected for testing was based on previously conducted research [18]. However, with modification to the monitoring technique strain response in the embedment length at loading, post yield was captured. This meant some of the specimens became fully active prior to ultimate loading; so to quantitively capture bond performance, the load required to fully mobilize the embedment length (LRFM) was collected. This process can be seen visually in Figure 5. Additionally, to provide further insights on the effects of the parameters on the bond performance, shear displacement curves were also calculated [10,23,55,56,57]. This process is depicted visually in Figure 6. These formulas are essentially describing the derivative and integrals for a given distance (x) and an applied load (F). These shear displacement plots were generated by calculating the axial displacement for each position X and plotting it against the average shear stress over a 2.5 cm length (to help with noise). This was done at 10 kN intervals for loading in the elastic range.
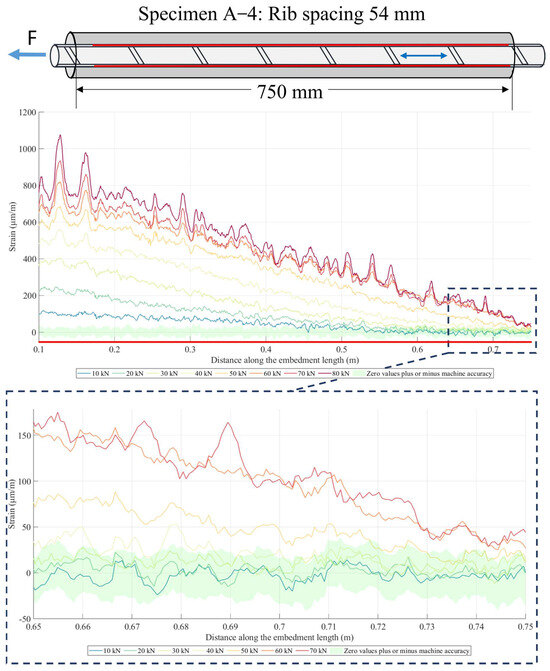
Figure 5.
Demonstrating selection of Load Required to Fully Mobilize the Embedment Length (LRFM); the example shown is specimen A-4.
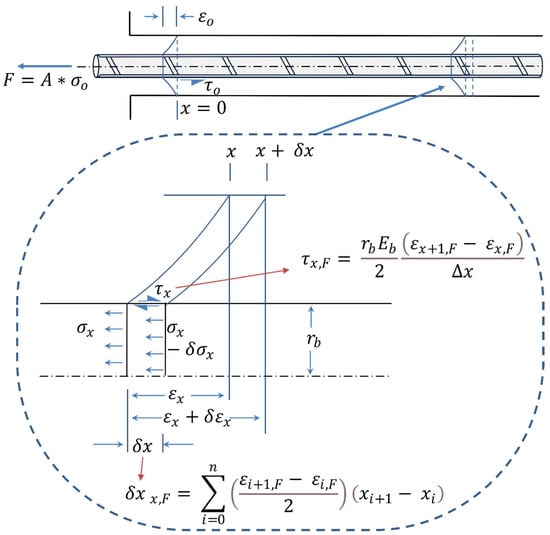
Figure 6.
Shear and displacement from axial strain depiction modified after [30,31,32,33].
To explore the effects of the three independent variables (rib spacing, grout annulus and compression strength of grout) multiple linear regression was conducted. This analysis does not attempt to provide generalizations, but to present the significance and relationship of the independent variables to the selected dependent variables. The dependent variables selected were LFRM and initial tangent stiffness. The first step of this analysis evaluated general linearity and unusual cases using a series of scatter plots. During this stage, grout annulus showed very little relation to the dependent variables and was not significant (p = 0.53 and p = 0.17); therefore, it was removed from the analysis. This analysis was conducted using JASP software (0.14.1) [58] with guidance in reporting and analysis from Buchanan [59]. It should be noted that the presented results have the following limitations: a lack of variability in grout strength, few repeated specimens and a small sample size.
3. Results and Discussion
3.1. Findings Related to the Performance of DOS for Rock Bolt Monitoring
Part of the research effort was to further explore the capabilities and limitations of the use of the DOS as a tool for both in situ and laboratory investigations. As explored above, through tensile testing, the performance of the fiber for the application of capturing a full spectrum of loading was investigated, and results of the activation length was incorporated into the monitoring plan. This monitoring plan had a success rate of 75% for specimens under excess plastic loading (>160 kN) approaching ultimate state, and 43% survived shank failure. This allowed for observation of strain attenuations and insights into the active embedment length beyond bolt yielding. During this initial tensile testing, repeatability and performance at low level strains were also investigated to provide confidence in reported active embedment length observations. Even at loads below 1 kN (loads of 0.25 kN, 0.5 kN and 0.75 kN) with expected strain well below the accuracy of the sensor (expected strain is 4.6 με with the machine listed accuracy being +/− 25 με), the location of the start or end of the sensor was still clear. The largest positional difference between the actual location in which the sensor is no longer bonded and where it was perceived in the data was 13 mm. Repeatability was also inspected by looking at multiple scans (20 to 30 scans at 4 random times) under no load for two randomly selected 5 cm lengths. Range, average and standard deviation were inspected. The largest shift in average was 8.4 µε and 0.4 µε for each segment. The largest range from the mean observed was 24.8 µε and the largest standard deviation was 12.6 µε. These results provided further confidence in the ability to detect and discern between low and zero loads.
The use of fiber optics as a quality control instrument in a monitoring plan has been highlighted by research conducted in this group [18]. The need for verification of ground support performance is required due to grouting issues such as gloving [60]. This is often addressed through proof loading, in which the use of DOS can enhance insights provided to operators [55]. Due to an issue with the grout pump used for the first round of specimen creation, the opportunity to highlight this enhanced insight was provided. In Specimen B-1-I there was a large air void roughly 20 cm in size located 40 cm into the embedment length. Because of this void, the same condition was retested with Specimen B-1-ii. When viewing the two displacement load profiles, it is not evident that one failure is due to grout shearing because of the reduced grout. However, when viewing the strain results from the DOS, the presence of the voids is apparent. This can be seen in Figure 7. Due to the void’s location, it generally did not appear to have significant effects on the strain attenuation. This is likely because there was still some grout present, which was able to transfer load until its capacity was reached and the void become apparent. This exemplifies some of the additional insight gleaned from this cost-effective monitoring solution.
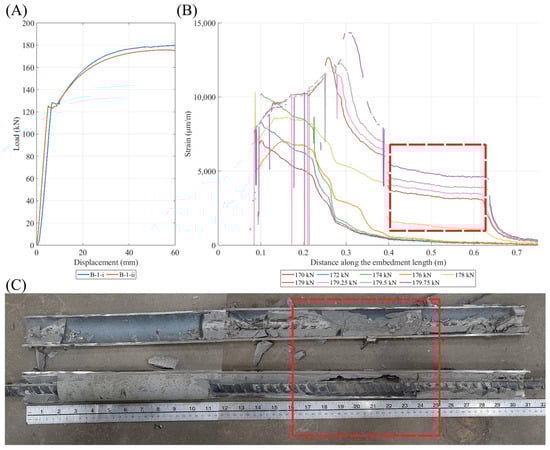
Figure 7.
(A) Load-stroke displacement of both specimens; (B) strain response of specimen B-1-i, highlighting clear voiding; (C) B-1-i post-test analysis shows voids in line with strain results.
3.2. Effect of Ribs
Often, rock bolts utilize rebar, as the presence of their deformation improves performances via mechanical interlock [61,62,63,64]. To further explore this effect, 5 specimens were prepared and tested. Differences in strength and secant stiffness between the manufactured smooth bar were observed. Improved strength was seen with the presence of roughness and ribs, in line with other research. It was also noted that the rib specimens had lower secant stiffness. Although residual strength per unit length of the sanded smooth bars in the two annuli of B and A were not very large, there was a 72 kN difference in peak strength for grout annulus A observed. It should, however, be noted that these bars were smoothed by hand and could feature a slight difference in roughness, and that there existed a void in the grout for specimen B-6.
With the application of DOS, the effects of the presence of roughness and ribs can be explored further. Benefits in bond performance were clearly seen when comparing strain attenuation profiles. However, interestingly, this was not the case for loads below 30 kN. This can be seen in Figure 8. Dilation effects were also observed where, at a higher load ribbed bars generated more dilation (at a load of 10 kN, the smooth bar generated more dilation than the rough bar). This high dilation is in line with the expected behaviour of the load transfer achieved through mechanical interlock. Viewing pre- and post-peak results of specimens B-1-I and B-6 again highlights the presence of dilation. Where the pipe is generally being compressed by forces transferred from the bar, however, dilation generates tension which then reduces the overall compression seen in the fiber positioned longitudinally on the outside of the pipe. In line with the expectation that mechanical interlock is responsible for a significant portion of strength, an evident change in response in the pipe pre- and post-peak for the ribbed bar when compared to the hand smoothed bar was observed. This can be seen in Figure 9.
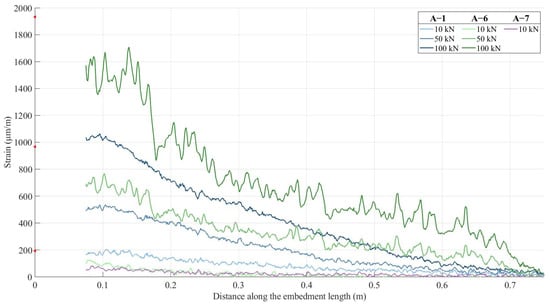
Figure 8.
Strain profile of A-1 (ribbed bar), vs. A-6 (sanded smooth) and A-7 (manufactured smooth bar) at various loads; red arrows show theorical strain at zero.
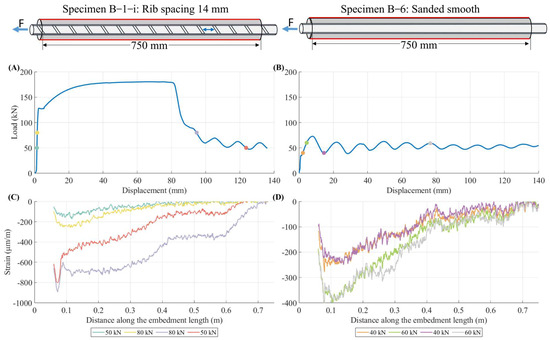
Figure 9.
Ribbed vs. smooth bar performance, highlighting the effects of ribs on load transfer mechanism. (A) Load displacement plot of B-1-i, (B) load displacement plot of B-6, (C) strain on the pipe of B-1-i, (D) strain on the pipe of B-6.
This investigation also allows an understanding of the limitation of the selected process for creating the rib spacings. The manufactured smooth bar had much lower strength when compared to rebar which was sanded smooth (145 kN vs. 12 kN). This is most likely due to either a change in friction between the two specimens or uneven sanding, leading to mechanical interlock. Due to this, it should be noted that specimens created through traditional manufacturing would likely have reduced bond performance when compared to the presented results, with the amount varying depending on end tolerances and coating. This is similar to the effect of rust seen on the strength capability of bolts [63]. However, once cracking in the grout occurs, this effect would be minimal for mechanical interlock of ribbed bars.
3.3. Effects of Rib Spacing
During testing, three failure modes were observed. Specimens failed in the rebar shank, failed at the grout–rebar interface (pullout) and failed due to the pipe crushing (a result of pipe properties and grouting methodology). The majority of specimens reached rebar shank failure, as was the intention of the study. Specimen B-1-I and D-1 failed by pullout. However, for specimen B-1-I the large grout void was likely a factor in this. The failure of D-1 was also not indicative of the effects of the independent variables, as it experienced failure at the highest load of all specimens in grout annulus D (22.8 mm). This is likely due to a reduction in the area of the bolt during the rib removal process. As more ribs were removed, the reference of the original cross-section became further away and thus visually harder to match. The amount of diameter reduction to achieve the lowest value of the maximum applied load is approximately 2%; given the methodology employed, this is a reasonable explanation.
Another global parameter which is often investigated, as it is important to design and use, is the stiffness. In agreement with other conducted research on smaller embedment lengths, rib spacing was found to be a negative predictor of initial stiffness [7]. Across all four selected grout annuli, it was seen that with increased rib spacing a decrease in stiffness was generally observed. An example from grout annulus A (7.7 mm) can be seen in Figure 10. This effect was strongest in annulus B (9.9 mm). However, in the largest annuli, C and D (14 mm and 22.8 mm), this was less pronounced, except in specimen C-1 which was very stiff when compared to the others. This figure also highlights the general behaviours of the specimens, with most experiencing elastic loading, a brief plastic phase, strain hardening, then rupture. The testing and loading for specimens A1–A5 were ended prematurely due to the confining pipe yielding at the grout injection hole. Specimen A6 begin sliding prior to the yielding of the pipe. Specimens that began to slide generally exhibited a sinusoidal strain-softening phase which eventually reached a residual state. An example of a specimen reaching this residual state can be seen in Figure 9. It is believed that this sinusoidal pattern is a function of the deformation-based control of the MTS. Specimen A7 went from elastic loading to grout failure and then sliding.
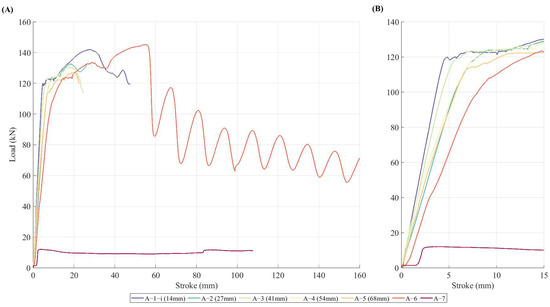
Figure 10.
Load stroke response of various rib spacing in grout annulus A (7.7mm). (A) Full test range, (B) zoomed in of the initial 15mm of stroke.
Multilinear regression was conducted to afford additional insights into the qualitative observation. No outliers were found, but a slight degree of non-linearity was observed. All assumptions of independence of observation, homoscedasticity, normality and additivity were found to be met, except homoscedasticity. To address this, a robust regression was run (bootstrapping, 5000 bootstraps and 95% confidence, JASP defaults) [65]. The multiple regression model, Equation (7), statistically significantly predicts initial tangent stiffness F (2,17) = 33.002 p < 0.001, adj. R2 = 0.77. Coefficients can be found in Table 6. This again showed that rib spacing negatively predicts initial tangent stiffness. Both the average unconfined compress strength (UCS) of the grout and rib spacing were statistically significant. Secant stiffness at peak loading did not have a clear trend in relation to rib spacing, but appeared to be related to the maximum applied load. However, this is likely a product of the rib removal process and the effects of reduced area.
Table 6.
Coefficients for predicting stiffness and robust analysis results.
Similar to the exploration of the effects of ribs, the strain attenuation patterns can be compared across the various grout annuli. Across all grout annuli, a reduction in bond performance was seen with increased rib spacing. This was observed by the strain being less effectively attenuated, and the attenuation rate appearing more linear, suggesting weaker bond performance. With increased rib spacing there also appeared to be more variance along the strain profile, which is logical as with increased rib spacing the locations of mechanical interlock are further apart. An example of this can be found in Figure 11, which highlights results from annuli size A and B from loading at 90 kN. For the given annuli, it can be seen that the specimens with smaller rib spacing generally attenuated strain better. This is also true in annulus B, in which a large dichotomy exists between the altered and the unaltered bars. There are some exceptions to the general trend, where typically certain rib spacing may perform better than others in specific load ranges. For example, the 41 mm rib spacing in grout annulus A (7.7 mm) which attenuated stress the best for loads under 40 kN.
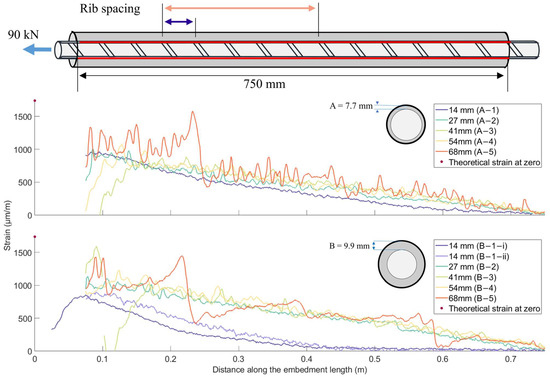
Figure 11.
Rib spacing comparison across grout annulus A (top) and B (bottom) at 90kN; red dots show theorical strain at zero.
Utilizing LFRM, multiple linear regression confirmed this reduction in bond performance where rib spacing was seen as a negative predictor and the average grout strength was a positive predictor; see Equation (8). This relationship was seen as statistically significant where LRFM F (2,17) = 26.37, p < 0.001, adj. R2 = 0.73). The regression coefficients and standard errors can be found in Table 7. All required assumptions were found to be met; however, there was a degree of non-linearity. This non-linearity is logical as, if we examine either limit of rib spacing, it approaches a smooth bar. Therefore, caution should be used if the range of inputs are outside of the dataset used to form this model.
Table 7.
Coefficients for predicting LRFM.
These strain data can also be explored through shear displacement profiles. When exploring these profiles, although the general patterns were similar, there seemed to be effects of increased rib spacing. Specifically with increased rib spacing, higher values of maximum shear stress developed, shear stress developed slower (higher levels of axial displacement required) and great variance was observed. An example of this can be seen below in Figure 12. This shows the response of specimens D-1, D-3 and D-5, and was selected as it most clearly shows these observed patterns. This observation is in line with first principles and others’ findings, such that the delay in the development of shear stress is consistent with trends in initial stiffness and with a decreased number of ribs, the stress per rib would have to be higher while also driving the variance. The strain on the pipe was also explored under the assumption that with increased rib spacing greater levels of dilation would occur; however, no conclusive findings could be drawn from the collected results.
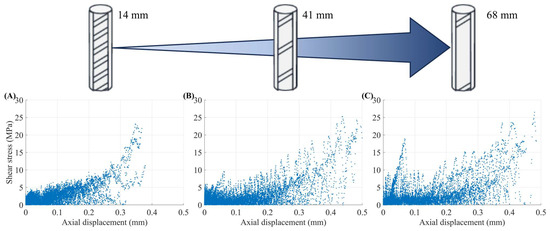
Figure 12.
Effects of rib spacing on the shear stress and displacement profiles: (A) specimen D-1, (B) specimen D-3, (C) specimen D-5.
This overall negative bond performance was not in line with tests conducted on shorter embedment lengths [7,63,64,66]. However, differences in confining medium properties and grout material may offer alternative explanations for these differences in findings. In one study which featured comparable confinement stiffness [7] they did find an increase in strength with increased rib spacing but it was not significant. This suggests a possible third variable to this relationship, which would require additional investigation.
3.4. Effects of Grout Annulus
The laboratory results were also cross analyzed to explore the effects of grout annulus. In a similar manner, global and component behaviour was examined. When comparing the strength and failure modes of the specimens, which can be seen below in Table 8, it was observed that specimen D-1 failed in grout as opposed to shank. Visual inspection of the failure in the grout seemed to visually correspond to a reduction of confinement of the specimen, with cracking patterns resembling dilation slips failure; this can be seen in Figure 13. Figure 13 also highlights the observation of other cracking observed in specimens. Specimen B-1-i and C-1 both had large voids and thus should have resulted in lower strength because of the reduction of bond length, and specimen B-1-ii failed in shank at similar loads. This suggests that a reduction in bond strength can be associated with very large grout annuli. In line with the literature [67,68], it was expected that with increased grout annulus there would be a decrease in stiffness. However, no clear trends were observed across the data. Regression analysis could not be conducted as there were insufficient trends. When examining rib spacing 1, the axial deformation of the bar at 100 kN, B and C grout annuli (sizes) were stiffest.
Table 8.
Summary of collected data the unaltered bar in various grout annuli.
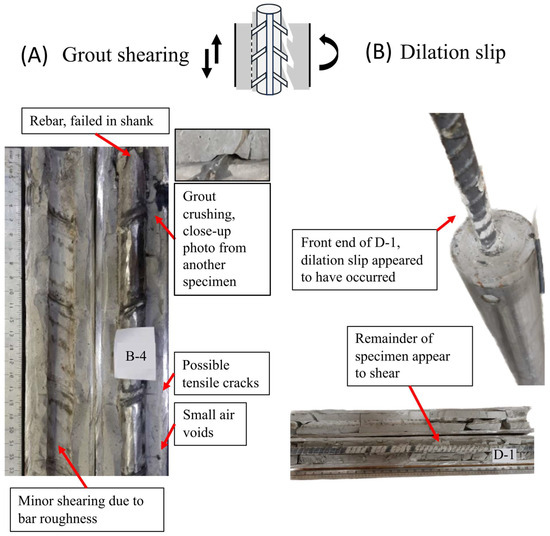
Figure 13.
Grout–rebar interface failures: (A) grout shearing and (B) dilation slip.
Although there were no clear trends when examining the effect of grout annulus on bond performance across the data and multiple linear regression of LRFM could not be conducted, there was some support for a trend with the unaltered commercially available bars. When analyzing the strain profiles, it appeared that the unaltered rebar in B and C grout annulus performed better than the smaller and larger annuli. These can be seen visually in Figure 11, comparing annulus A to B. For smaller loads, grout annulus A and D were more similar (this departure could potentially be caused by effects related to pipe deformation of the small pipe). Interestingly, beyond yield, it generally appeared that grout annulus C attenuated strain better than annulus B; this appeared to be caused by less rebar–grout debonding. However, when examining the strain at the free end, and the LRFM specimens in the grout, annulus B had better performance. However, the effects of the grout void could have impacted these results. When examining the shear profiles, A and D seemed to activate later and have lower values of shear stress even at higher displacement. Specimen B-1-I had the highest shear stress. This can be seen in Figure 14.
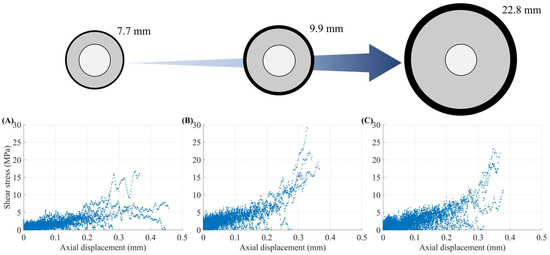
Figure 14.
Effects of grout annulus on the shear stress and displacement profiles: (A) specimen A-1, (B) specimen B-1-ii, (C) specimen D-1.
In summary, there was some support for the theory that the bond performance of an unaltered rebar could be increased with increased grout annuli within a set range. Performance effects of increased stiffness, higher LRFM and better strain attenuation were observed with the unaltered bar. This range of grout annulus sized at 8.4× and 11.9× average rib height agrees with the finding of numerical modelling by Yokota, which suggested 9 times to 12 times rib height [69] and other research which suggested the benefits of increased grout annuli [5,9,70]. It should be noted that these trends were not seen globally across all the tested rib spacings. However, other selected research has shown that modifying the rebar–grout interface by wrapping the rebar with an additional rod does have an optimal hole diameter, suggesting that such a trend could exist for other alternative geometries [70].
3.5. Model Results, Comparison and Discussion
3.5.1. Analytical Model Analysis
To compare the results of the physical testing program to analytical models, comparison plots at 10, 50 and 100 kN were prepared for all 24 specimens. An example of this can be seen below, in Figure 15. Both selected models were generally exponential, matching what was largely seen across the data. It was seen that Ma’s model [11] tended to provide a better fit to the data but was underpredicted in the attenuation rate resulting in higher strain compared to laboratory data at the same length along the specimens. Opposite to this was Li’s [16] model, which was over-predictive in the attenuation rate of the strain. When examining the model’s fits to laboratory data across changes of the independent variables, Ma’s model appeared to have improved fit with increased rib spacing.
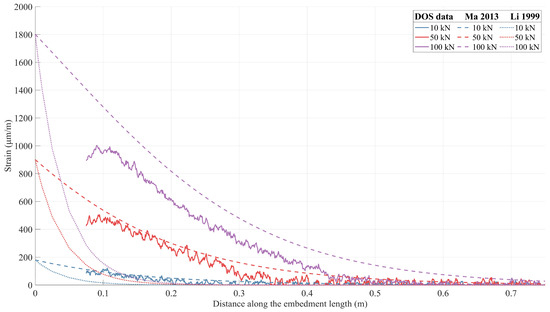
Figure 15.
Example of analytical models [11,16] versus collected data for specimen B-1-ii.
3.5.2. Numerical Modelling Results and Analysis
The overall response of the numerical model was consistent with the expected and observed behaviour of laboratory specimens. Specifically, it was observed that as the rebar is pulled axially, the bar elongates and slightly contracts. This displacement reduces as the distance from the loading position increased. This is because the ribs transfer the load to the grout and causes a slight dilation. This behaviour was congruent with their material properties and their interaction mechanics. It was also noted that the shorter models deformed more than the longer embedment length ones did. This was also seen in the laboratory specimens [9]. It was found that the RS2 models created by our group for the longer length specimen such as 500 mm and longer were found to be over-predictive and did not match the general trends observed in physical testing. Despite a shift in strain attenuation pattern between the short and longer lengths not being observed in the RS2 model, it was successfully seen in the ANASYS contact model. During the first stage of the model, results were very close to physical testing. For the 100 mm and the 500 mm, the model performed very well, with the largest difference being ~15% (taken visually as original data were not available). However, generally the results were much closer. Although the 250 mm did display the correct pattern, it was over-predictive on the attenuation rate showing much greater strain departure when compared to the other models. This iteration of the model for the 750 mm standard rebar and altered bar (Stage 2.1 and Stage 3.1) did not perform as well as the smaller models (Stage 1 series models) and there was a greater difference between model and laboratory strain results. However, the global strain attenuation pattern matched much better when compared with the collected laboratory results, which can be seen below in Figure 16. The results are most similar to the specimen 750CP and can produce very close results for 10 kN and to some extent 50 kN when the front is manually debonded. The possibilities of the differences could exist within the limitation of the model but also analysis of the strain data, there could be debonding of the section in this specimen as there is the appearance of a near-zero slope front section, which if present would lead to higher strain values along the embedment length. These initial findings suggest that a ANASYS provides a closer representation than the model using RS2. Additionally, further parametric analysis, calibration, and proper grout representation could be conducted to further improve the model ability to match the laboratory data.
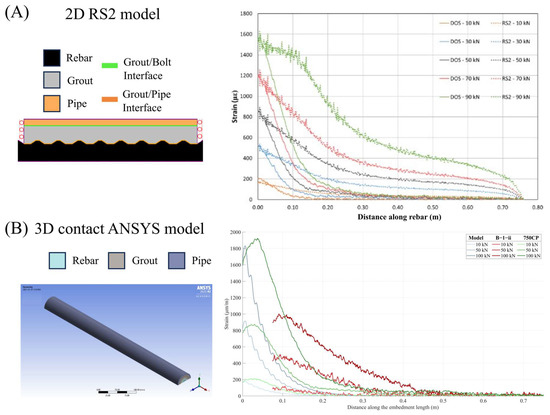
Figure 16.
Comparison of model performance: (A) 2D model [18], (B) 3D contact model.
It was seen that the model responded similarly to the physical results when rib spacing was increased. Increased rib spacing resulted in greater variance along the profile and a decrease in strain attenuation. The comparison between both 750 mm models (Models 2.1, 3.1) at 10 and 50 kN can be seen in Figure 17. The model also showed a greater level of dilation, which was in agreement with the literature but was not observed in this laboratory investigation. In summary, it appears that this methodology shows promise to not only capture the general response of the system but also capture the effects of parametric changes without fitting.
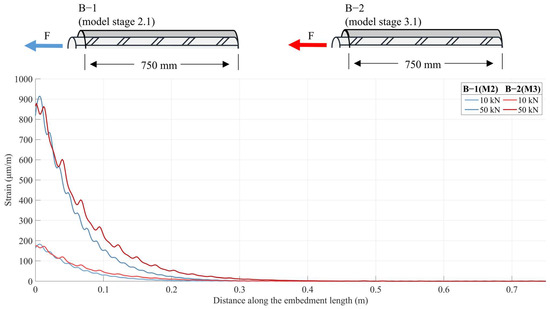
Figure 17.
Strain attention of various rib spacings at 10 and 50 kN (stage 2.1 and 3.1 models).
3.5.3. Discussion of Numerical Model Design
Confirmation of sufficient meshing sizes was not possible with standard convergence studies due to the appearance of hot spots likely caused by contact singularity. Even with geometric refinement and the inclusion of 0.25 mm fillets, meshing studies did not converge. However, when looking at the overall stress distribution and strain response in the centre of the specimen, confidence in both the meshing and geometrical simplification was achieved. The comparison of stress between the two models can be seen in Figure 18. Furthermore, as the main objective was the strain response, this was also compared between the two models; the largest difference between them was found to be 3%. To confirm this sufficient meshing with the larger models, an additional second verification was conducted. The 250 mm and 750 mm of the alternated bars were both investigated. For the 250 mm between the coarse and finer (117 k to 147 k nodes), there was a 0.16% difference in deflection, with the 750 mm having a similar level of consistency.
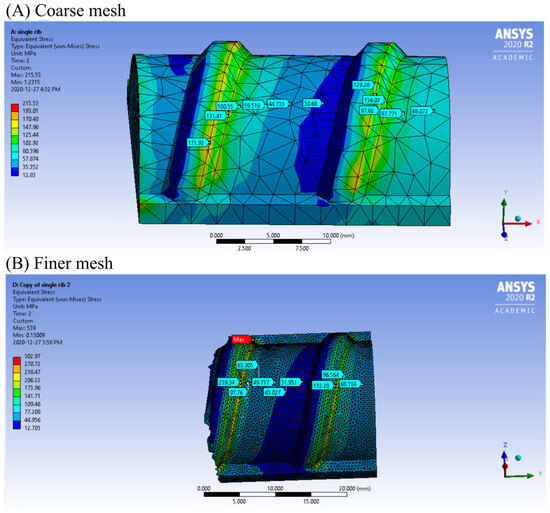
Figure 18.
Equivalent (von Mises) stresses (MPa) for (A) the 13 k mesh and (B) the 236 k mesh 2 rib model.
Another important factor for investigation is the contact normal stiffness factor. Generally, with increased normal stiffness the penetration will decrease, while contact pressure, stress and iterations to solve will increase. Values were selected by conducting convergence studies, with the first-stage models being 10 for the pipe grout contact and 3 for the grout rebar contact; however, this was increased to 15 for the pipe grout contact. Convergence models were generally in line with the stated expected response. However, in the first-stage model, maximum stress in other bodies (not the ones found at the contact interface) decreased with increased rebar–grout contact pressure, and the pipe grout seemed to peak at a normal stiffness factor of 10. These selected values are in line with expected contact behaviour where the pipe-grout is bonded and the grout rebar is frictional.
To ensure boundary and load conditions were properly represented, investigation into their response and effects on results was explored. The application of load was very closely represented to the laboratory condition, in the laboratory loading was achieved with a hydraulic grip ~20 cm from the front of the pipe and in the numerical model this was represented as the load was applied across the entire surface area of the front of the rebar in the numerical model. To keep the model efficient, the bearing plate used to hold the specimen in place was represented by a boundary condition that was applied across the top face of the pipe to constrain the X (plane of loading). The Y component was constrained by the plane of symmetry of the model. In the laboratory, specimens were restrained in the Z and Y by the friction between the pipe and the bearing plate. This could be represented as an additional friction contact surface. To simplify this, a plane of symmetry was created on the pipe and the Z was constrained on the edge which would interface with the pipe. The boundary conditions created slightly less confinement on the top of the pipe than the actual specimen, but was selected this way with consideration that the frictional force would be proportional to the applied load and with expected grout conical failure, very little force would be transferred in this region. When analyzing the load response of 20 kN of loading, the X boundary condition reaction forces were directly equal to the applied load. Reactionary forces in the other planes at the X and Z boundary condition were either small (~4% and ~2%) or zero. These results were in line with the expected response of the system. To understand the effects of making the model freer than the physical testing, another model was run but with the entire face of the pipe constrained in all directions. When comparing the models, a reduction of maximum stress of 3% and a reduction of the maximum total displacement of 8% was observed. Despite this large change in displacement, there was little effect on the strain profile in terms of shape and magnitude.
In the stage 1 models, the longitudinal ribs were left unaltered but in the subsequent stages the longitudinal rib was grooved to better match the laboratory specimen. These grooves were made slightly deeper than the actual specimen’s so that they were flush with the rest of the geometry to avoid thin geometries. To understand the effect of the inclusion or omission of the rib, model 2.1 was run both with and without the grooves. A large difference (~9%) around the front was noted but this difference converged further along with the rebar. This comparison confirmed the decision to include the grooves as it does affect the strain profile.
Materials were generally taken from either experimental collected values or literature values for the given materials. The only material modification was a reduction in grout stiffness. A ratio from the curve fitting efforts was utilized [18,71]. To understand the impact of this factor a model was run with both unmodified and adjusted values. In line with expected behaviour, strain attenuated quicker. This led to the model being even more over predictive when compared to the laboratory result. This directly leads to the largest limitation and source of error for this iteration of the model. The grout was modelled as linear elastic; however, it is clear from the laboratory results that cracking occurs and these should be included in subsequent models. This would result in greater displacement, with a plastic softening effect with increased loading. Future efforts could also include full plasticity representation, sensitivity analysis for friction values taken from literature as well as other material properties to understand their effects on results and the use of an axisymmetric model could be explored.
4. Conclusions
A robust laboratory investigation was conducted in order to better understand the effects of ribs, rib spacing and grout annulus on rebar rock bolt performance, as well as complementary modelling development and analysis. This was achieved through the development and employment of an advanced strain-sensing methodology using fiber optics.
This research investigated the effect of rib spacing on the activation length, stress attenuation pattern and general behaviour of fully grouted rock bolts for ground support purposes. From the strain data that were produced and collected by the DOS and other supporting instrumentation, it was seen that rib spacing and ribs had a large effect on the general behaviour of the grouted rock bolt systems. Selected investigations concerning themselves with rib spacing presented in literature have shown that with increased rib spacing, better bond strength can be achieved. However, it should be noted that this research was only done on small embedment lengths and generally in very stiff confining mediums. Findings from this current research program highlight that such trends may not extend to less stiff rock or longer embedment lengths. In agreement with the literature, it was determined that stiffness decreased with increased rib spacing. Strain profiles generally showed the following with increase rib spacing: strain was attenuated less effectively, suggesting a reduction of bond performance, with increased rib spacing strain attenuation appeared more linearly suggesting weaker mechanical interlock and, more variance along the strain profile as was observed. These considerations should be explored further prior to in situ implementation by industry. Design engineers should carefully study the predicted loading applied to their support systems that consider grouted rock bolts. They should also pre-determine the amount of displacement that is expected to occur based on the ground conditions in order to make appropriate design decisions. This will allow for informed decisions on the specifications associated with the bolts chosen for a particular project. The implementation of the DOS technique highlighted within this research can also provide geo-professionals with insight into the performance and behaviour of the support elements in situ in a true observation approach.
Despite the wide range of annuli tested, no continuous trends were seen across rib spacings. Although limited, selected support was seen that may support the hypothesis that a grout annulus of 9 to 12 times rib height is optimal. The large negative effects found in some of the cited literature were not observed in the testing that was presented herein. Other researchers speculated that these effects were caused by installation methods and not material behaviour. The findings of this research support this theory.
This research looked to generate nominally identical (to the laboratory experiments) numerical models that are capable of representing the behaviour of full-length specimens, and compare the model results against experimental results. It was found that modelling using a contact analysis provided a better representation of observed laboratory behaviour of longer embedment length specimens and was able to reproduce a similar effect with increased rib spacings. Specifically, the numerical model was able to capture exponential strain decay, as is seen in experimental results. This is significant as this was not captured in the previous models which used model interactions as joints.
This investigation provided further proof of concept of using such methodology for quality control purposes. This novel methodology was also leveraged to provide greater insights into factors which define the performance and behaviour of fully grouted rebar rock bolts.
In this research, we continue to investigate and refine the monitoring of ground support and ground support parameters, with the goal of supporting long-term monitoring, numerical representation, and optimization. Noted key observations should not only be considered in future research, but by practitioners; as this novel approach provides greater insights into the geo-mechanical behaviours of fully grouted rebar rock bolts.
Author Contributions
Conceptualization, K.S.M. and N.V.; methodology, K.S.M. and N.V.; software, K.S.M.; validation, K.S.M.; formal analysis, K.S.M.; investigation, K.S.M.; resources, N.V.; data curation, K.S.M.; writing—original draft preparation, K.S.M.; writing—review and editing, N.V.; visualization, K.S.M.; supervision, N.V.; project administration, N.V.; funding acquisition, N.V. All authors have read and agreed to the published version of the manuscript.
Funding
This research was funded by the Canadian Department of National Defence (DND), The RMC Green Team Military GeoWorks Lab, and the National Sciences and Engineering Research Council (NSERC) of Canada.
Data Availability Statement
The raw data supporting the conclusions of this article will be made available by the authors on request.
Acknowledgments
The authors would like to acknowledge Bradely Forbes, who was pivotal in developing this technique, provided guidance in its application and was involved in laboratory investigation design. We would also like to acknowledge our industrial partners. Laboratory support was provided by Vincent Trinidad, Dexter Gaskin, Steve Vanvolkingburgh and John Shaw. The Royal Military College of Canada (RMC) is situated on the traditional territory of the Huron Wendat, the Anishinaabeg and the Haudenosaunee Peoples. We acknowledge the significance of these lands to the Indigenous peoples who lived and who continue to live upon it, and we express our gratitude to be able to live and learn here.
Conflicts of Interest
The authors declare no conflicts of interest.
References
- Stillborg, B. Professional Users Handbook for Rock Bolting; Trans Tech Publications: Clausthal-Zellerfeld, Germany, 1986. [Google Scholar]
- Kömürlü, E.; Kesimal, A. Rock Bolting from Past to Present in 20 Inventions. J. Undergr. Resourc. 2016, 9, 69–85. [Google Scholar]
- Pile, J.; Bessinger, S.; Mark, C.; Tadolini, S.C. Short-encapsulation pull tests for roof bolt evaluation at an operating coal mine. In Proceedings of the 22nd International Conference on Ground Control in Mining, Waterflow, NM, USA, 1 July 2003; pp. 226–232. [Google Scholar]
- Aziz, N. An Update of Roof Bolt Research at the University of Wollongong. In Coal Operators’ Conference; University of Wollongong: Wollongong, Australia, 2004; pp. 215–224. [Google Scholar]
- Ghazvinian, A.H.; Rashidi, M. Study of the Effect of Ratio of Hole Diameter to Rock Bolt Diameter on Pullout Capacity of Fully Grouted Rock Bolts. J. Rock Mech. Tunn. Tech. 2010, 16, 11–18. [Google Scholar]
- Cao, C.; Nemcik, J.; Aziz, N.; Ren, T. Analytical study of steel bolt profile and its influence on bolt load transfer. Int. J. Rock Mech. Min. Sci. 2013, 60, 188–195. [Google Scholar] [CrossRef]
- Wu, T.; Cao, C.; Han, J.; Ren, T. Effect of bolt rib spacing on load transfer mechanism. Int. J. Min. Sci. Technol. 2017, 27, 431–434. [Google Scholar] [CrossRef]
- Shang, J.; Yokota, Y.; Zhao, Z.; Dang, W. DEM simulation of mortar-bolt interface behaviour subjected to shearing. Constr. Build. Mater. 2018, 185, 120–137. [Google Scholar] [CrossRef]
- Vlachopoulos, N.; Cruz, D.; Forbes, B. Utilizing a novel fiber optic technology to capture the axial responses of fully grouted rock bolts. J. Rock Mech. Geotech. Eng. 2018, 10, 222–235. [Google Scholar] [CrossRef]
- Benmokrane, B.; Chennouf, A.; Mitri, H.S. Laboratory evaluation of cement-based grouts and grouted rock anchors. Int. J. Rock Mech. Min. Sci. 1995, 32, 633–642. [Google Scholar] [CrossRef]
- Ma, S.; Nemcik, J.; Aziz, N. An analytical model of fully grouted rock bolts subjected to tensile load. Constr. Build. Mater. 2013, 49, 519–526. [Google Scholar] [CrossRef]
- Vlachopoulos, N.; Forbes, B.; Oke, J.; Hyett, A.J. The development of a distributed optical sensing technique to monitor forepole temporary support elements employed within an Umbrella Arch system. In Proceedings of the EUROCK, International Symposium, Vigo, Spain, May 2014; pp. 1099–1104. [Google Scholar] [CrossRef]
- Cao, C. Bolt Profile Configuration and Load Transfer Capacity Optimisation. Ph.D. Thesis, University of Wollongong, Wollongong, Australia, 2012. [Google Scholar]
- Blümel, M.; Schweger, H.F.; Golser, H. Effect of rib geometry on the mechanical behaviour of grouted rock bolts. In World Tunnelling Congress ’97; Balkema: Rotterdam, The Netherlands, 1997; p. 6. [Google Scholar]
- Korzeniowski, W.; Skrzypkowski, K.; Herezy, Ł. Laboratory method for evaluating the characteristics of expansion Rock bolts subjected to axial tension. Walter de Gruyter GmbH. Arch. Min. Sci. 2015, 60, 209–224. [Google Scholar] [CrossRef]
- Li, C.; Stillborg, B. Analytical models for rock bolts. Int. J. Rock Mech. Min. Sci. 1999, 36, 1013–1029. [Google Scholar] [CrossRef]
- Vlachopoulos, N. Sensing the Ground: The Use of Distributed Optical Sensing for Monitoricng the Ground as well as for Support in Underground Excavations, Unpublished Presentation. 2017. Unpublished work.
- O’Connor, T. The Geo-Mechanical Response of Axially Loaded Fully Grouted Rock Bolts Utilizing Distributed Fiber Optic Technology–Draft; RMC: Kingston, ON, Canada, 2020; Unpublished work. [Google Scholar]
- O’Connor, T.; Vlachopoulos, N.; Diederichs, M.S.; Forbes, B. The Axial Response of Fully Grouted Rock Bolts Using a Distributed Fiber Optic Sensor Technique. In Proceedings of the 72nd Annual Conference of the Canadian Geotechnical Society, St John’s, NL, Canada, 29 September–2 October 2019. [Google Scholar]
- Forbes, B.; Vlachopoulos, N.; Hyett, A.J.; Diederichs, M.S. A new optical sensing technique for monitoring shear of rock bolts. Tunn. Undergr. Space Technol. 2017, 66, 34–46. [Google Scholar] [CrossRef]
- Vlachopoulos, N.; Forbes, B.; Oke, J.; Hyett, A. The Development of a Technique in order to Measure the Distributed Optical Sensing of a Forepole temporary support element employed within an Umbrella Arch System. In Proceedings of the 2014 ISRM European Rock Mechanics Symposium (EUROCK 2014), Vigo, Spain, 27–29 May 2014. [Google Scholar]
- Signer, S.P. Field Verification of Load Transfer Mechanics of Fully Grouted Roof Bolts; United States Department of the Interior: Spokane, WA, USA, 1990.
- Farmer, I.W. Stress distribution along a resin grouted rock anchor. Int. J. Rock Mech. Min. Sci. 1975, 12, 347–351. [Google Scholar] [CrossRef]
- Chen, Y. Experimental study and stress analysis of rock bolt anchorage performance. J. Rock Mech. Geotech. Eng. 2014, 6, 428–437. [Google Scholar] [CrossRef]
- Li, F.; Quan, X.; Jia, Y.; Wang, B.; Zhang, G.; Chen, S. The experimental study of the temperature effect on the interfacial properties of fully grouted rock bolt. Appl. Sci. 2017, 7, 327. [Google Scholar] [CrossRef]
- Hoffmann, K. An Introduction to Stress Analysis and Transducer Design using Strain Gauges. HBM Test Meas. 2012, 257. Available online: https://www.hbkworld.com/en/knowledge/resource-center/articles/strain-measurement-basics/strain-gauge-fundamentals/reference-literature-on-measurements-using-strain-gauges (accessed on 30 December 2023).
- Bao, X.; Chen, L. Recent Progress in Distributed Fiber Optic Sensors. Sensors 2012, 12, 8601–8639. [Google Scholar] [CrossRef]
- Froggatt, M.; Moore, J. High-spatial-resolution distributed strain measurement in optical fiber with Rayleigh scatter. Appl. Opt. 1998, 37, 1735–1740. [Google Scholar] [CrossRef]
- Weisbrich, M.; Holschemacher, K.; Bier, T. Comparison of different fiber coatings for distributed strain measurement in cementitious matrices. J. Sensors Sens. Syst. 2020, 9, 189–197. [Google Scholar] [CrossRef]
- Linear Position Sensors; Penny+Giles Controls Ltd.: Dorset, UK, 2012.
- MTS. Series 661 High Capacity Force Transducers; MTS: Eden Prairie, MN, USA, 1996. [Google Scholar]
- MTS. Series 244 Actuators Product Information; MTS: Eden Prairie, MN, USA, 2008. [Google Scholar]
- Luna. ODiSI-B Datasheet Rev.13; Luna: Blacksburg, VA, USA, 2017; pp. 1–2. [Google Scholar]
- A615/A615M-12; Standard Specification for Deformed and Plain Carbon-Steel Bars for Concrete Reinforcement. ASTM: West Conshohocken, PA, USA, 2012.
- Hyett, A.J.; Bawden, W.F.; Reichert, R.D. The effect of rock mass confinement on the bond strength of fully grouted cable bolts. Int. J. Rock Mech. Min. Sci. 1992, 29, 503–524. [Google Scholar] [CrossRef]
- O’Connor, T.; Vlachopoulos, N.; Diederichs, M.S.; Forbes, B. Grout Comparison for Fully Grouted Rock Bolts using Distributed Fiber Optic Sensors. In Proceedings of the 54th US Rock Mechanics/Geomechanics Symposium, Golden, USA, 28 June–1 July 2020; Curran Associates Inc.: Red Hook, NY, USA, 2020; pp. 1723–1730, ISBN 978-1-7138-1890-8. [Google Scholar]
- Li, C. Rock Bolting: Principles and Applications; Butterworth-Heinemann: Oxford, UK, 2017. [Google Scholar] [CrossRef]
- Kilic, A.; Yasar, E.; Atis, C.D. Effect of bar shape on the pull-out capacity of fully-grouted rockbolts. Tunn. Undergr. Space Technol. 2003, 18, 1–6. [Google Scholar] [CrossRef]
- Moosavi, M.; Jafari, A.; Khosravi, A. Bond of cement grouted reinforcing bars under constant radial pressure. Cem. Concr. Compos. 2005, 27, 103–109. [Google Scholar] [CrossRef]
- Li, C.C.; Kristjansson, G.; Høien, A.H. Critical embedment length and bond strength of fully encapsulated rebar rockbolts. Tunn. Undergr. Space Technol. 2016, 59, 16–23. [Google Scholar] [CrossRef]
- Forbes, B.; Vlachopoulos, N.; Hyett, A.J. The application of distributed optical strain sensing to measure the strain distribution of ground support members. Facets 2018, 3, 195–226. [Google Scholar] [CrossRef]
- A106/A106M-10; Standard Specification for Seamless Carbon Steel Pipe for High-Temperature Service. ASTM: West Conshohocken, PA, USA, 2010.
- Gelson, L. ASTM A106 Properties (Chem., Mech. & Rankings). Materials Blog. Available online: https://materials.gelsonluz.com/2020/09/astm-a106-properties-chem-mech-rankings.html (accessed on 30 December 2023).
- A795/A795M-13; Standard Specification for Black and Hot-Dipped Zinc-Coated (Galvanized) Welded and Seamless Steel Pipe for Fire Protection Use. ASTM: West Conshohocken, PA, USA, 2020.
- Matweb. Overview of Materials for Medium Carbon Steel. Available online: http://www.matweb.com/search/DataSheet.aspx?MatGUID=098700ed63b24b14bd3bfdbec937489f (accessed on 20 May 2021).
- Matweb. AISI 12L14 Steel, Cold Drawn, 19–38 mm Round. Available online: http://www.matweb.com/search/DataSheet.aspx?MatGUID=e4a48445c6994e629167c577d73df5fe&ckck=1 (accessed on 21 May 2021).
- C39/C39M-20; Standard Test Method for Compressive Strength of Cylindrical Concrete Specimens. ASTM: West Conshohocken, PA, USA, 2020; pp. 1–7.
- C496/C496M-17; Standard Test Method for Splitting Tensile Strength of Cylindrical Concrete Specimens. ASTM: West Conshohocken, PA, USA, 2017.
- D-4435-13e1; Rock Bolt Anchor Pull. ASTM: West Conshohocken, PA, USA, 2013.
- Rocscience. RS2 Introduction. 2020. Available online: https://www.rocscience.com/help/rs2/tutorials/01_introduction_to_modeling.html (accessed on 21 September 2022).
- Ma, S.; Nemcik, J.; Aziz, N. Simulation of fully grouted rockbolts in underground roadways using FLAC2D. Can. Geotech. J. 2014, 51, 911–920. [Google Scholar] [CrossRef]
- Rabbat, B.G.; Russell, H.G. Friction Coefficient of Steel on Concrete or Grout. J. Struct. Eng. 1985, 111, 505–515. [Google Scholar] [CrossRef]
- Solidworks. Introduction to Solidworks. 2014. Available online: https://files.solidworks.com/pdf/introsw.pdf (accessed on 21 September 2022).
- Vlachopoulos, N.; Forbes, B.; Cruz, D. The Use of Distributed Optical Sensing Techniques for Ground Support; Not all Fiber Optic Methods are Similar. In Proceedings of the 70th Annual Conference of the Canadian Geotechnical Society Geo, Ottawa, ON, Canada, 1–4 October 2017. [Google Scholar]
- Forbes, B. High Spatial Resultion Measurement of Tendon Reinforcement in Underground Construction Works; Queen’s University: Kingston, ON, Canada, 2019. [Google Scholar]
- Martin, L.B. Theoretical and Experimental Study of Fully Grouted Rockbolts and Cablebolts under Axial Loads; Ecole Nationale Supérieure des Mines de Paris: Paris, France, 2012. [Google Scholar]
- Ren, F.F.; Yang, Z.J.; Chen, J.F.; Chen, W.W. An analytical analysis of the full-range behaviour of grouted rockbolts based on a tri-linear bond-slip model. Constr. Build. Mater. 2010, 24, 361–370. [Google Scholar] [CrossRef]
- Gross-Sampson, M. Statistical Analysis in JASP: A Guide for Students. 2018. Available online: https://jasp-stats.org/2018/09/13/a-new-manual-for-jasp/ (accessed on 13 September 2021).
- Buchanan, E.; Hopke, T. Donaldson Undergraduate Statistics with JASP. 2018. Available online: https://osf.io/t56kg/ (accessed on 21 June 2021).
- Canbulat, I.; Wilkinson, A.; Prohaska, G. Roof Bolting Guidelines in Sotuh African Collieries; Groundwork Consulting Ltd.: Johannesburg, South Africa, 2016. [Google Scholar]
- Fabjanczyk, M.W.; Tarrant, G.C. Load transfer mechanisms in reinforcing tendons. In Proceedings of the 11th International Conference on Ground Control in Mining, Wollongong, Australia, 7–10 July 1992; pp. 212–219. [Google Scholar]
- Hamad, B.S. Bond strength improvement of reinforcing bars with specially designed rib geometries. ACI Struct. J. 1995, 92, 3–13. [Google Scholar] [CrossRef]
- Aziz, N.; Webb, B. Study of Load Transfer Capacity of Bolts Using Short Encapsulation Push Test. In Proceedings of the Coal Operators’ Conference, Wollongong, Australia, 12–14 February 2003; pp. 72–80. [Google Scholar]
- Zhao, X.Z.; Zhang, H.W.; Cao, C.; Zhang, M.; Zhang, H.D.; Han, J. Optimisation of bolt rib spacing and anchoring force under different conditions of surrounding rock. Rock Soil Mech. 2018, 39, 1263–1271. [Google Scholar]
- Fields, A. Robust Regression. In Discovering Statistics Using IBM SPSS Statistics, 4th ed.; Sage Publictions: Thousand Oaks, CA, SA, 2013; pp. 350–352. [Google Scholar]
- Aziz, N.; Nemcik, J.; Cao, C.; Jalalifar, H. Bolt profile configuration and load transfer capacity optimisation. In Proceedings of the 28th International Conference Ground Control Mining ICGCM, Morgantown, WV, USA, 28–30 July 2009; pp. 48–52. [Google Scholar]
- Ulrich, B.F.; Wuest, W.J.; Stateham, R.M. Relationship betweens Annulus Thickness and the Integrity of Resin-Grouted Roof Bolts; U.S. Department of Energy Office of Scientific and Technical Information: Oak Ridge, TN, USA, 1989.
- Tadolini, S. The effects of reduced annulus in roof bolting performance. In Proceedings of the 17th International Conference on Ground Control in Mining, Morgantown, WV, USA, 4–6 August 1998; pp. 230–236. [Google Scholar]
- Yokota, Y.; Zhao, Z.; Shang, J.; Nie, W.; Date, K.; Iwano, K.; Okada, Y. Effect of bolt configuration on the interface behaviour between a rock bolt and bond material: A comprehensive DDA investigation. Comput. Geotech. 2019, 105, 116–128. [Google Scholar] [CrossRef]
- Skrzypkowski, K.; Korzeniowski, W.; Zagórski, K.; Zagórska, A. Flexibility and Load-Bearing Capacity of Roof Bolting as Functions of Mounting Depth and Hole Diameter. Energies 2019, 12, 3754. [Google Scholar] [CrossRef]
- Vlachopoulos, N.; Su, Y. Numerical Modelling of Fully Grouted Rock Bolts Using a 2D Finite Element Method. In Proceedings of the GeoVirtual 2020, Online, 14–16 September 2020. [Google Scholar]
Disclaimer/Publisher’s Note: The statements, opinions and data contained in all publications are solely those of the individual author(s) and contributor(s) and not of MDPI and/or the editor(s). MDPI and/or the editor(s) disclaim responsibility for any injury to people or property resulting from any ideas, methods, instructions or products referred to in the content. |
© 2024 by the authors. Licensee MDPI, Basel, Switzerland. This article is an open access article distributed under the terms and conditions of the Creative Commons Attribution (CC BY) license (https://creativecommons.org/licenses/by/4.0/).