
Determination of Effective Parameters for Hydropower Plants’ Energy Generation: A Case Study


Abstract
1. Introduction
2. Materials and Methods
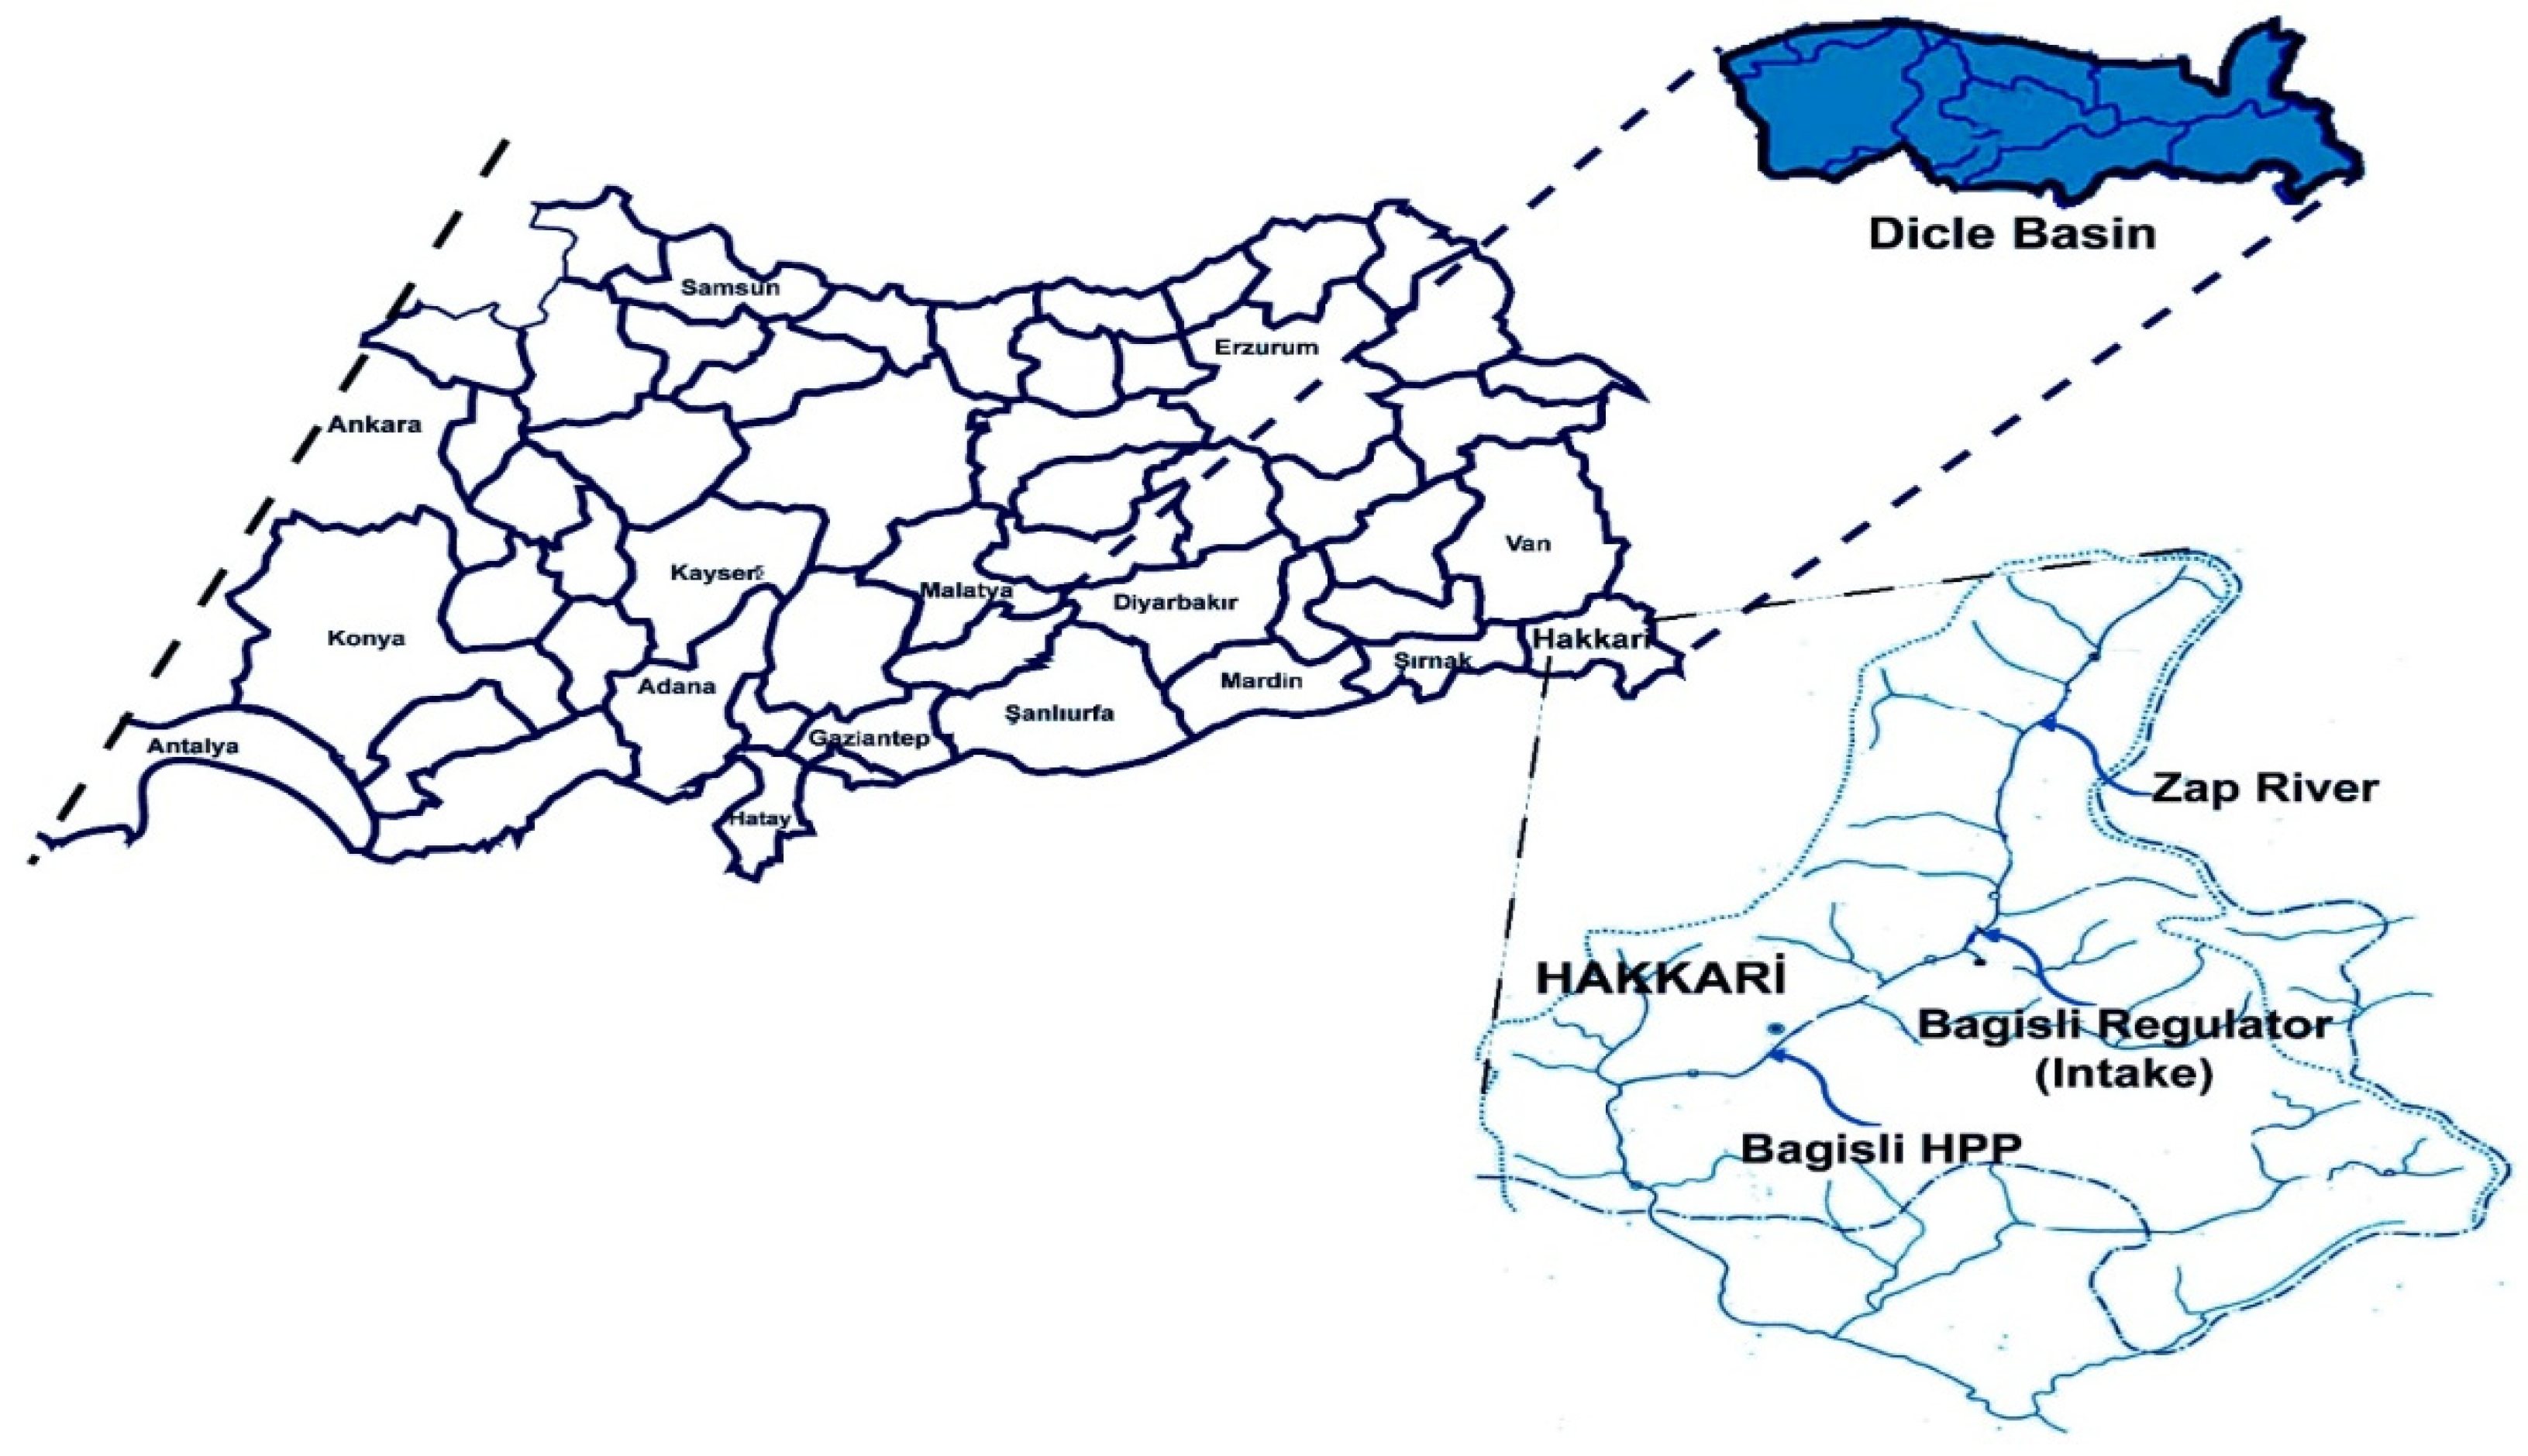
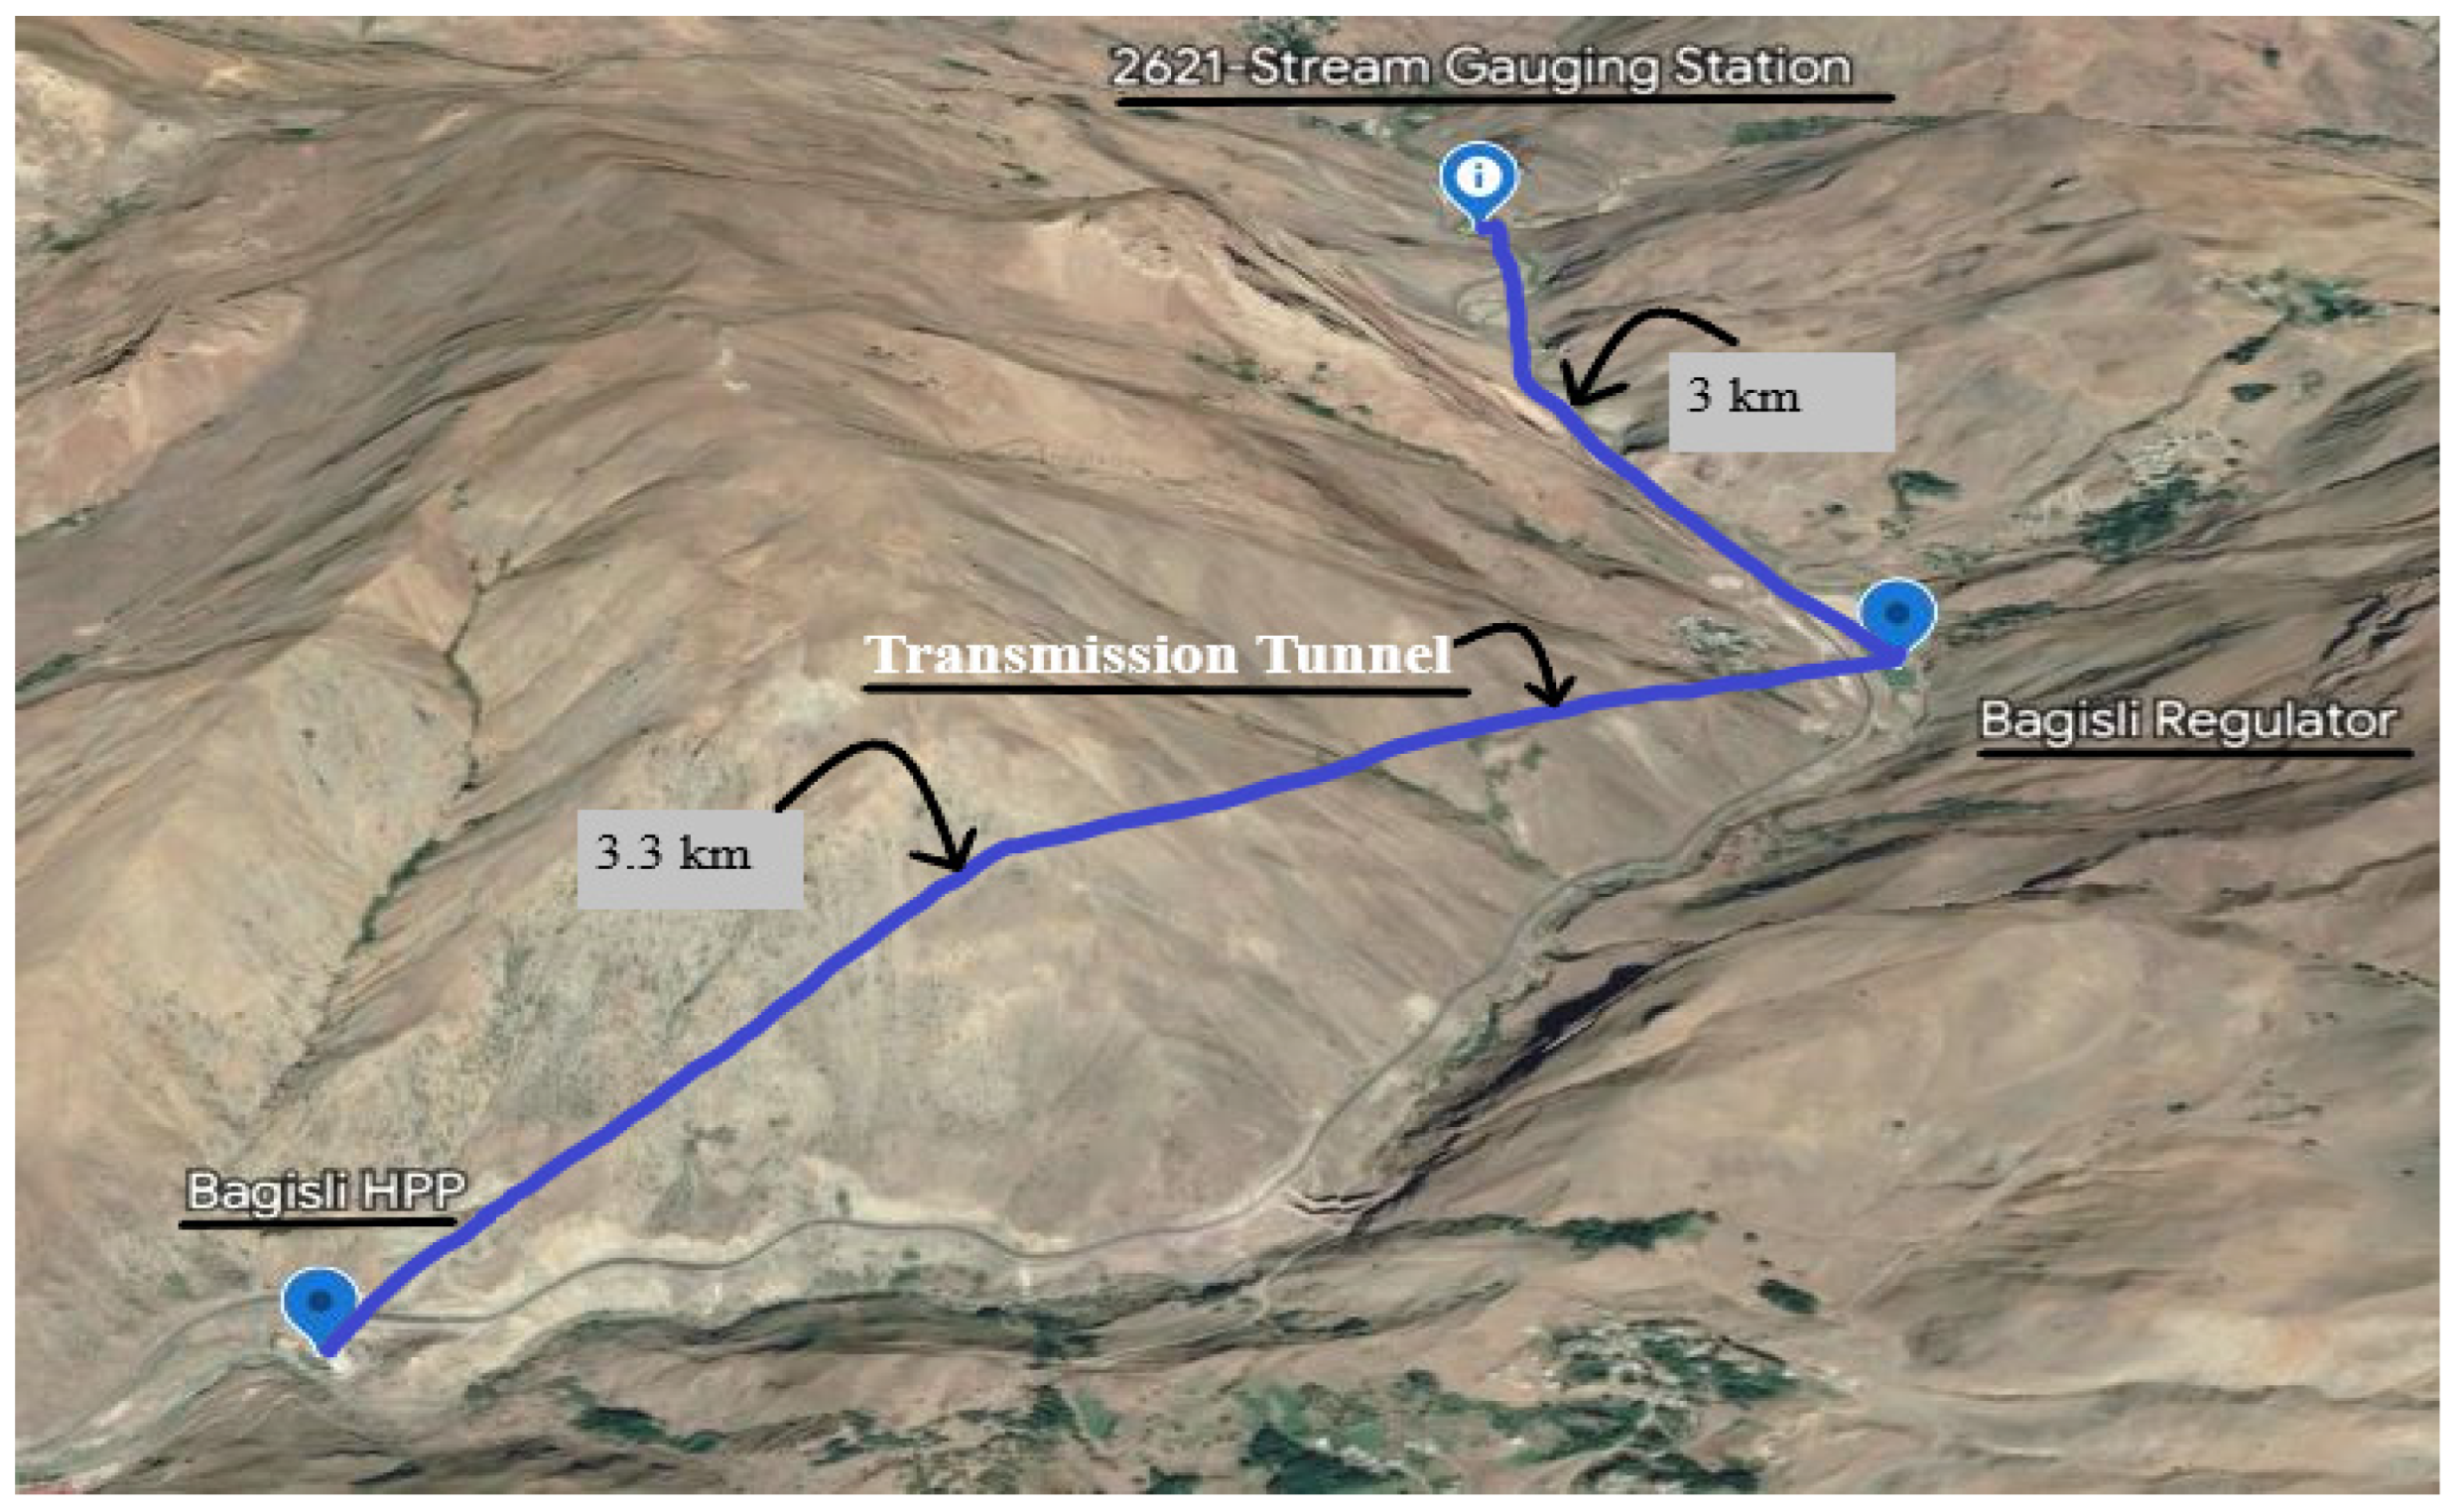
Characterization of Studied Area
3. Data Collection
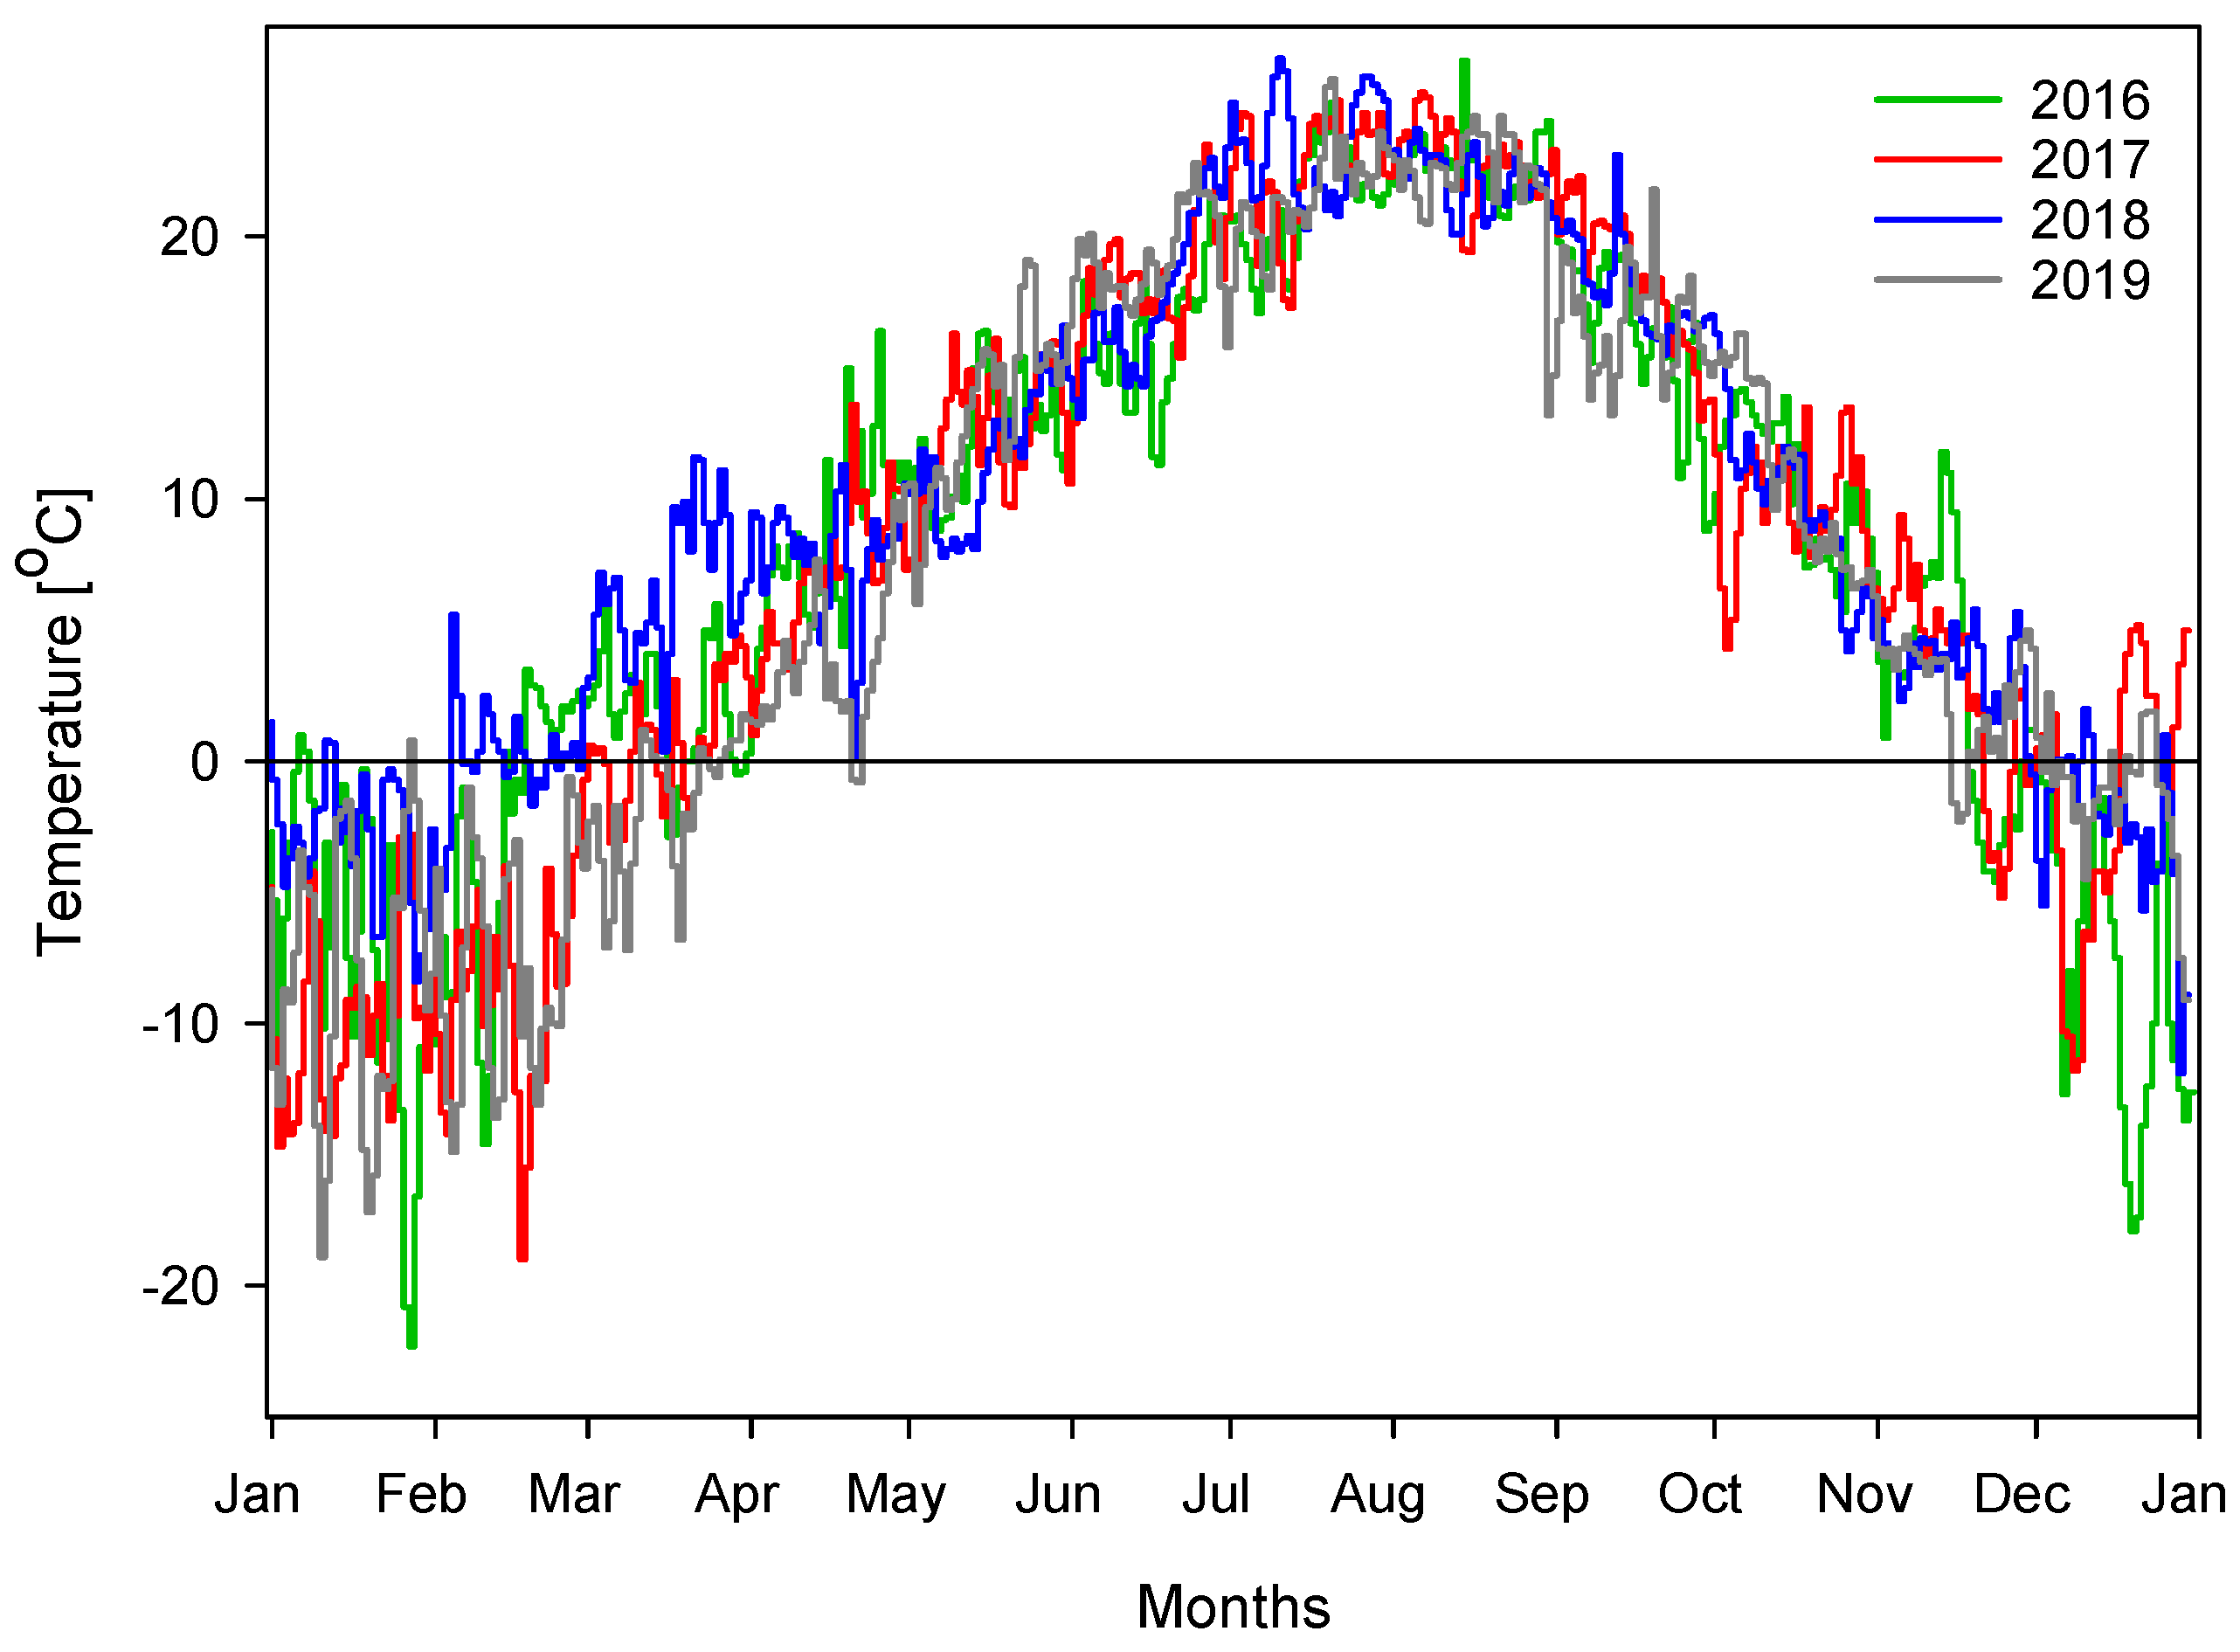
3.1. Temperature
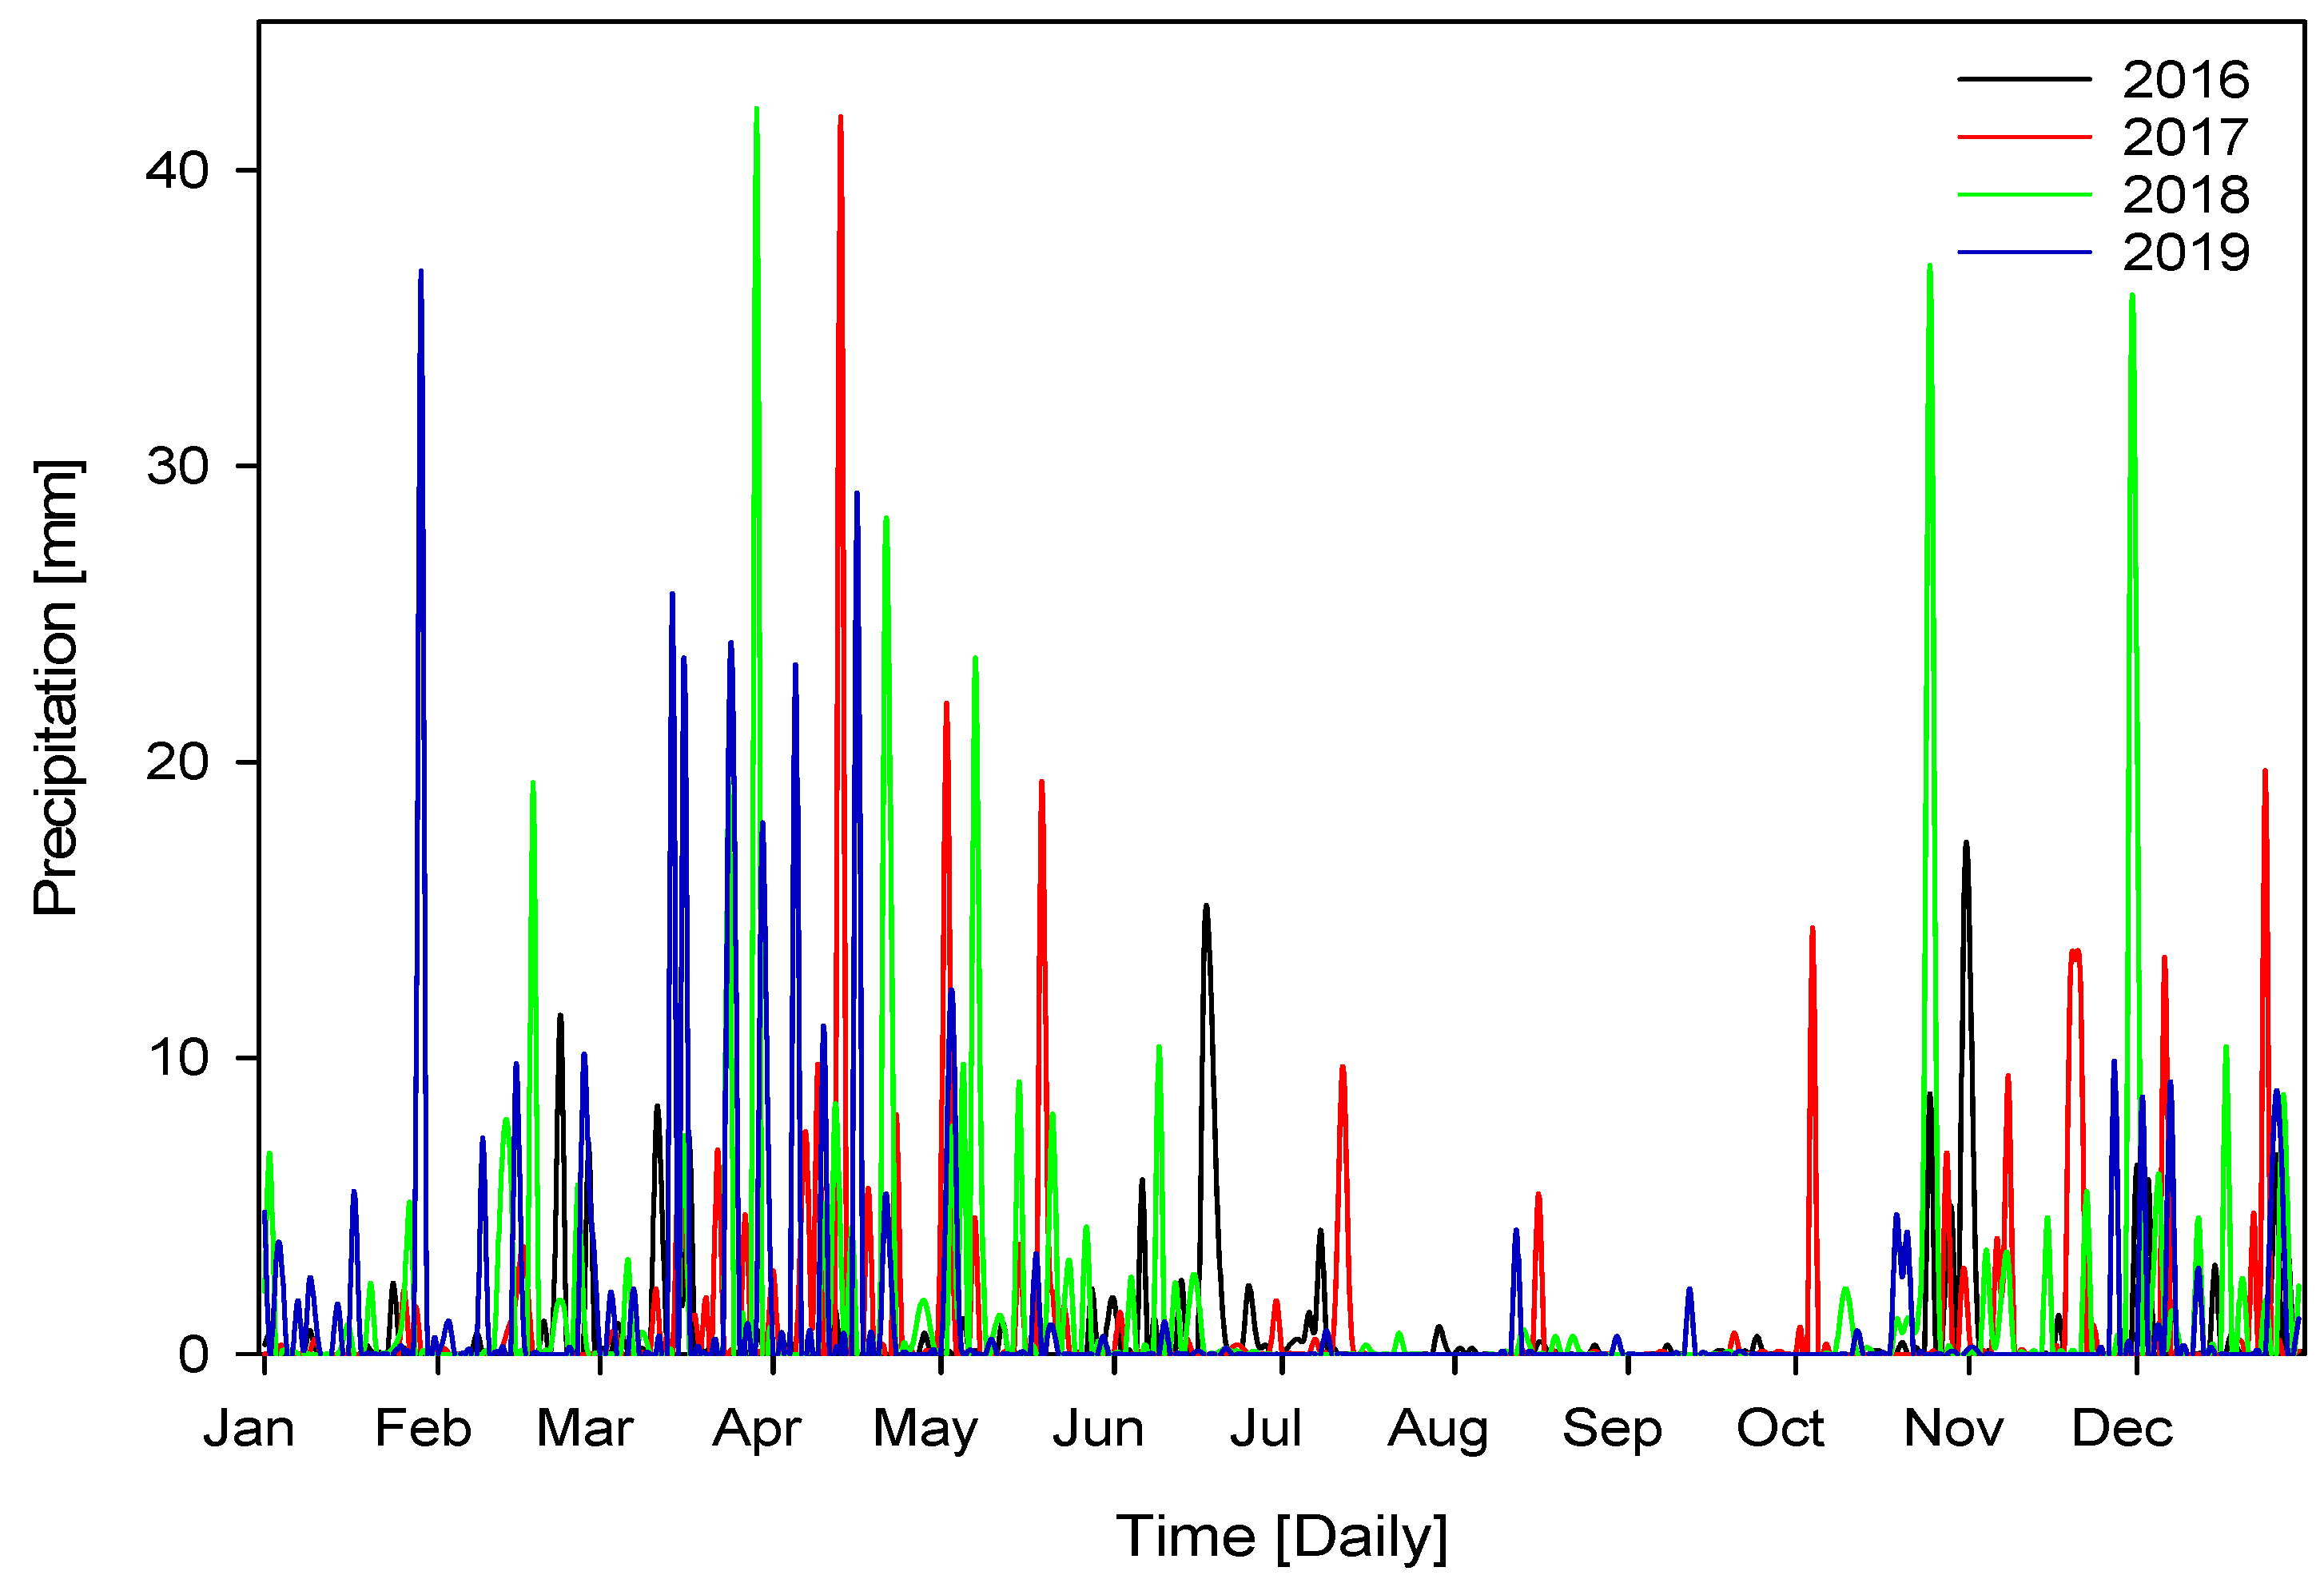
3.2. Precipitation
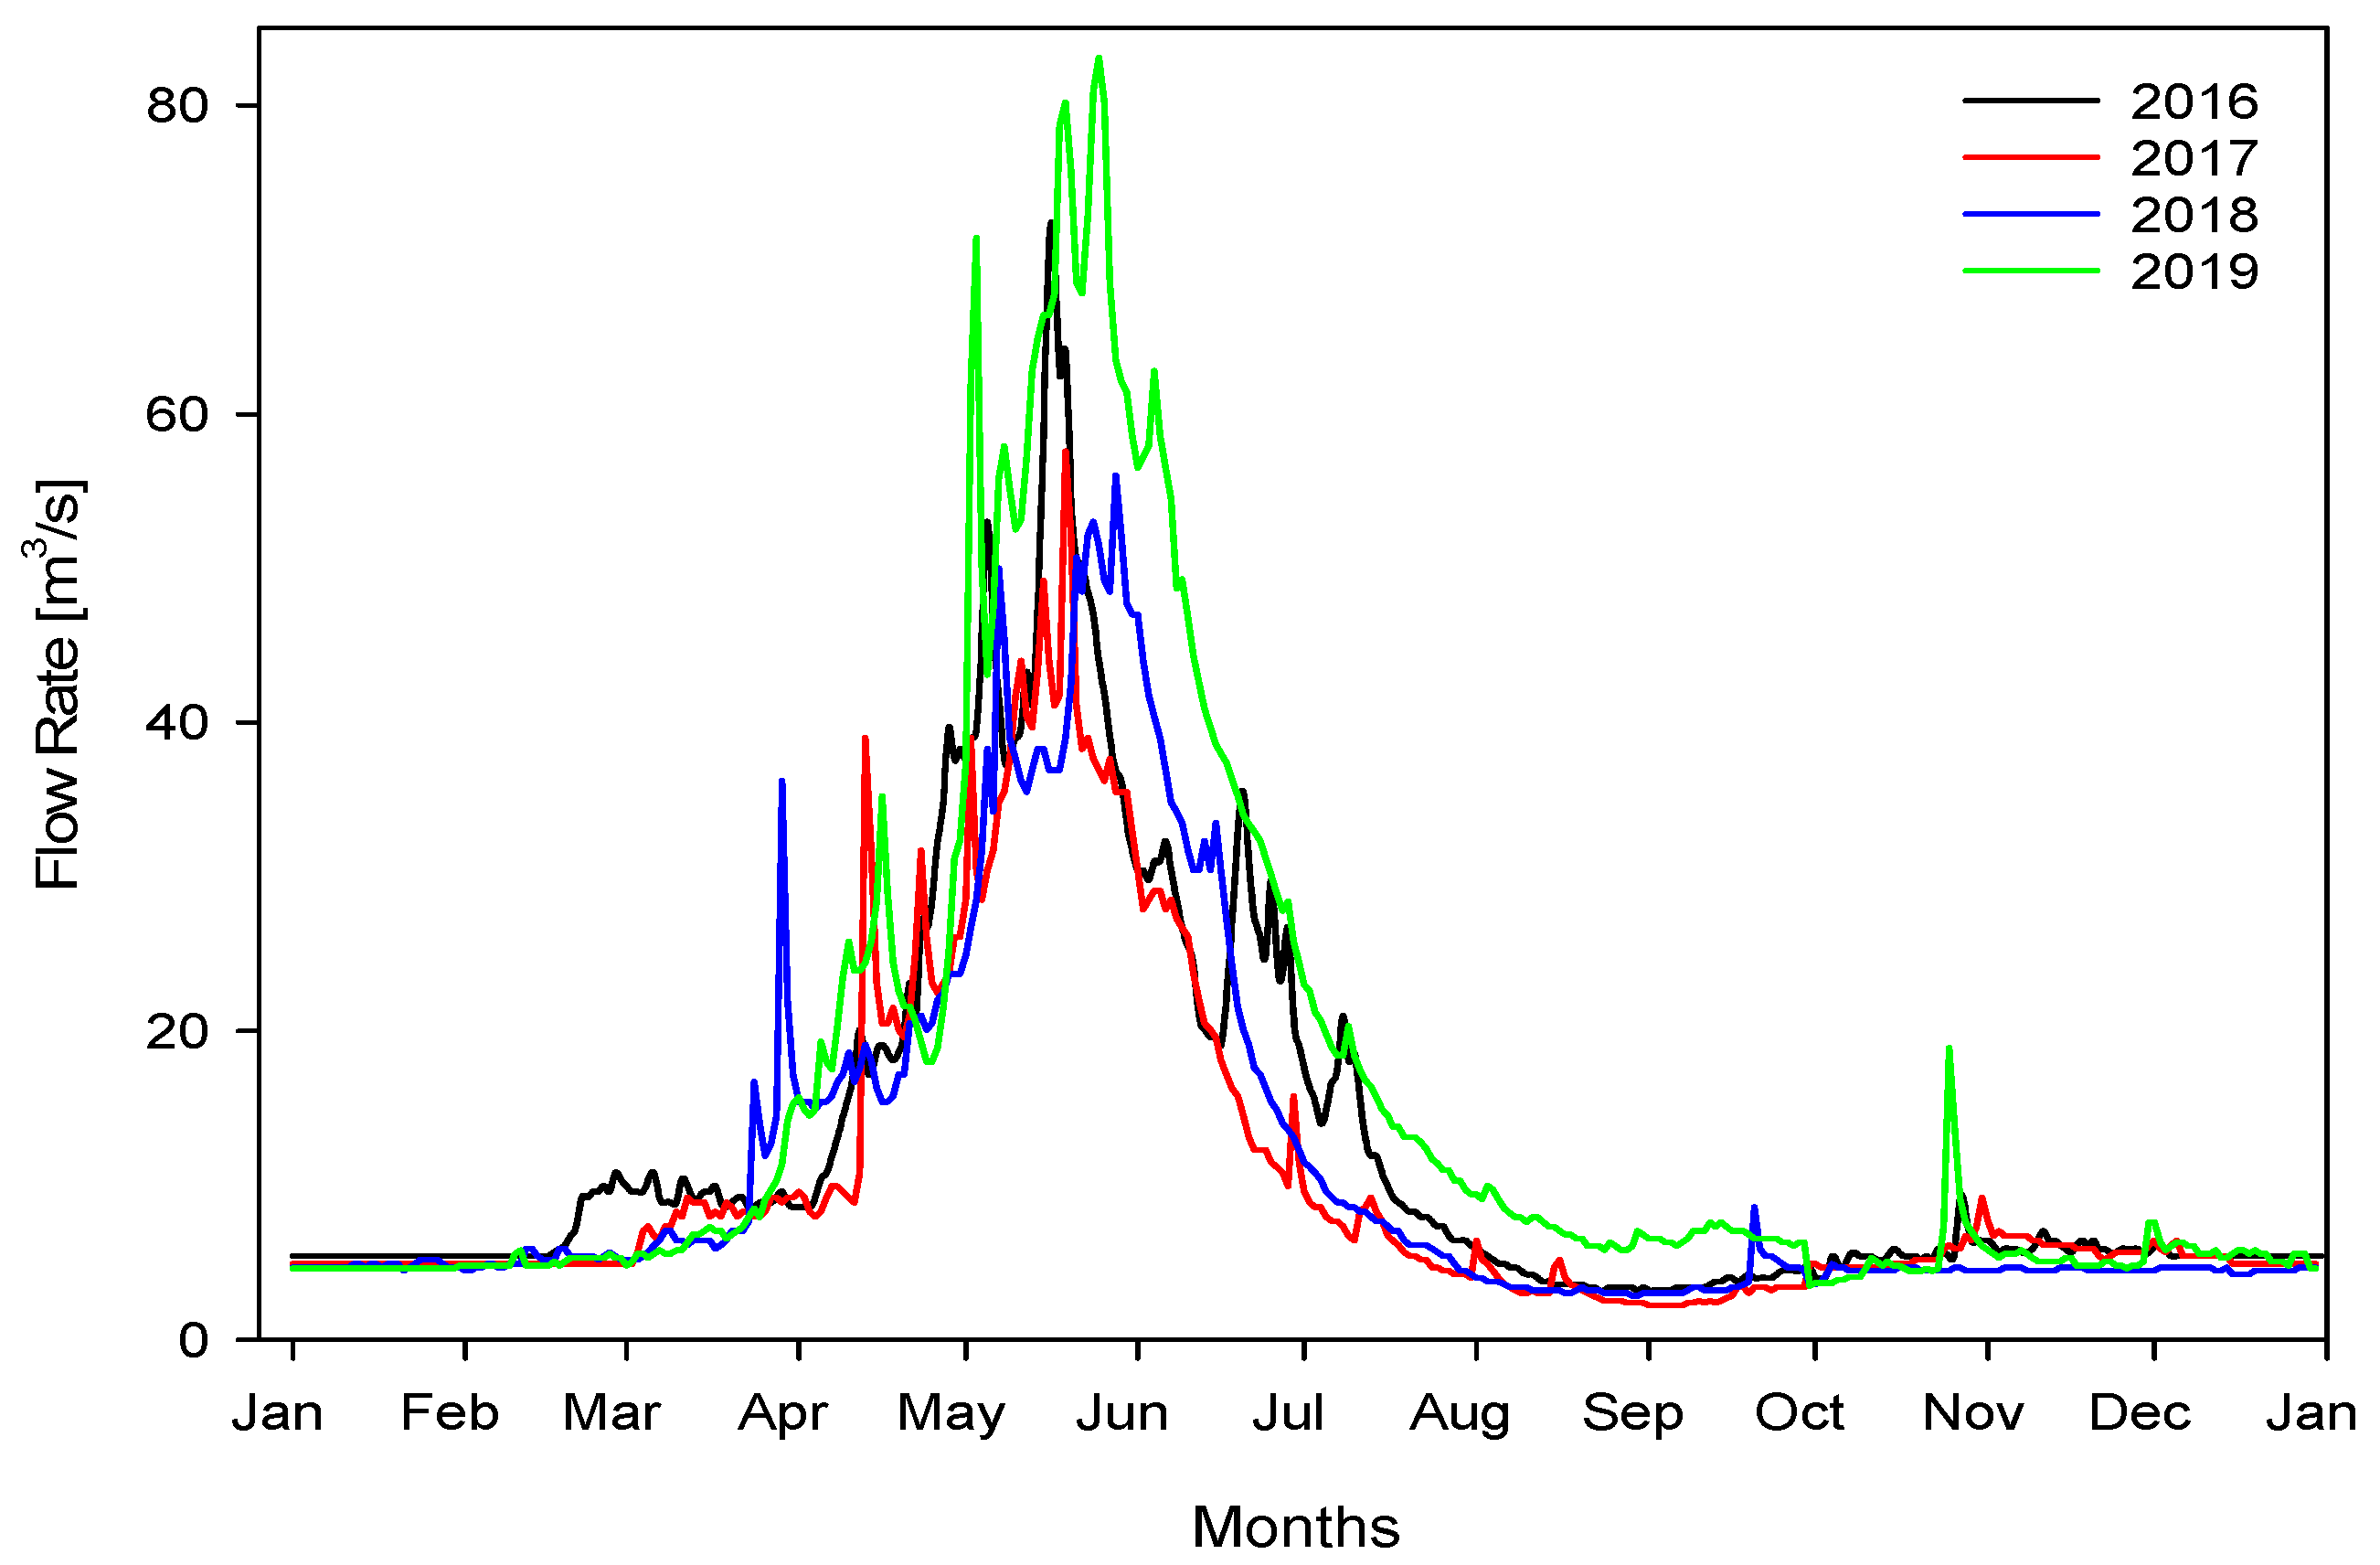
3.3. Flow Rate
3.4. Energy Generation
4. Results and Discussion
4.1. Energy Generation vs. Temperature
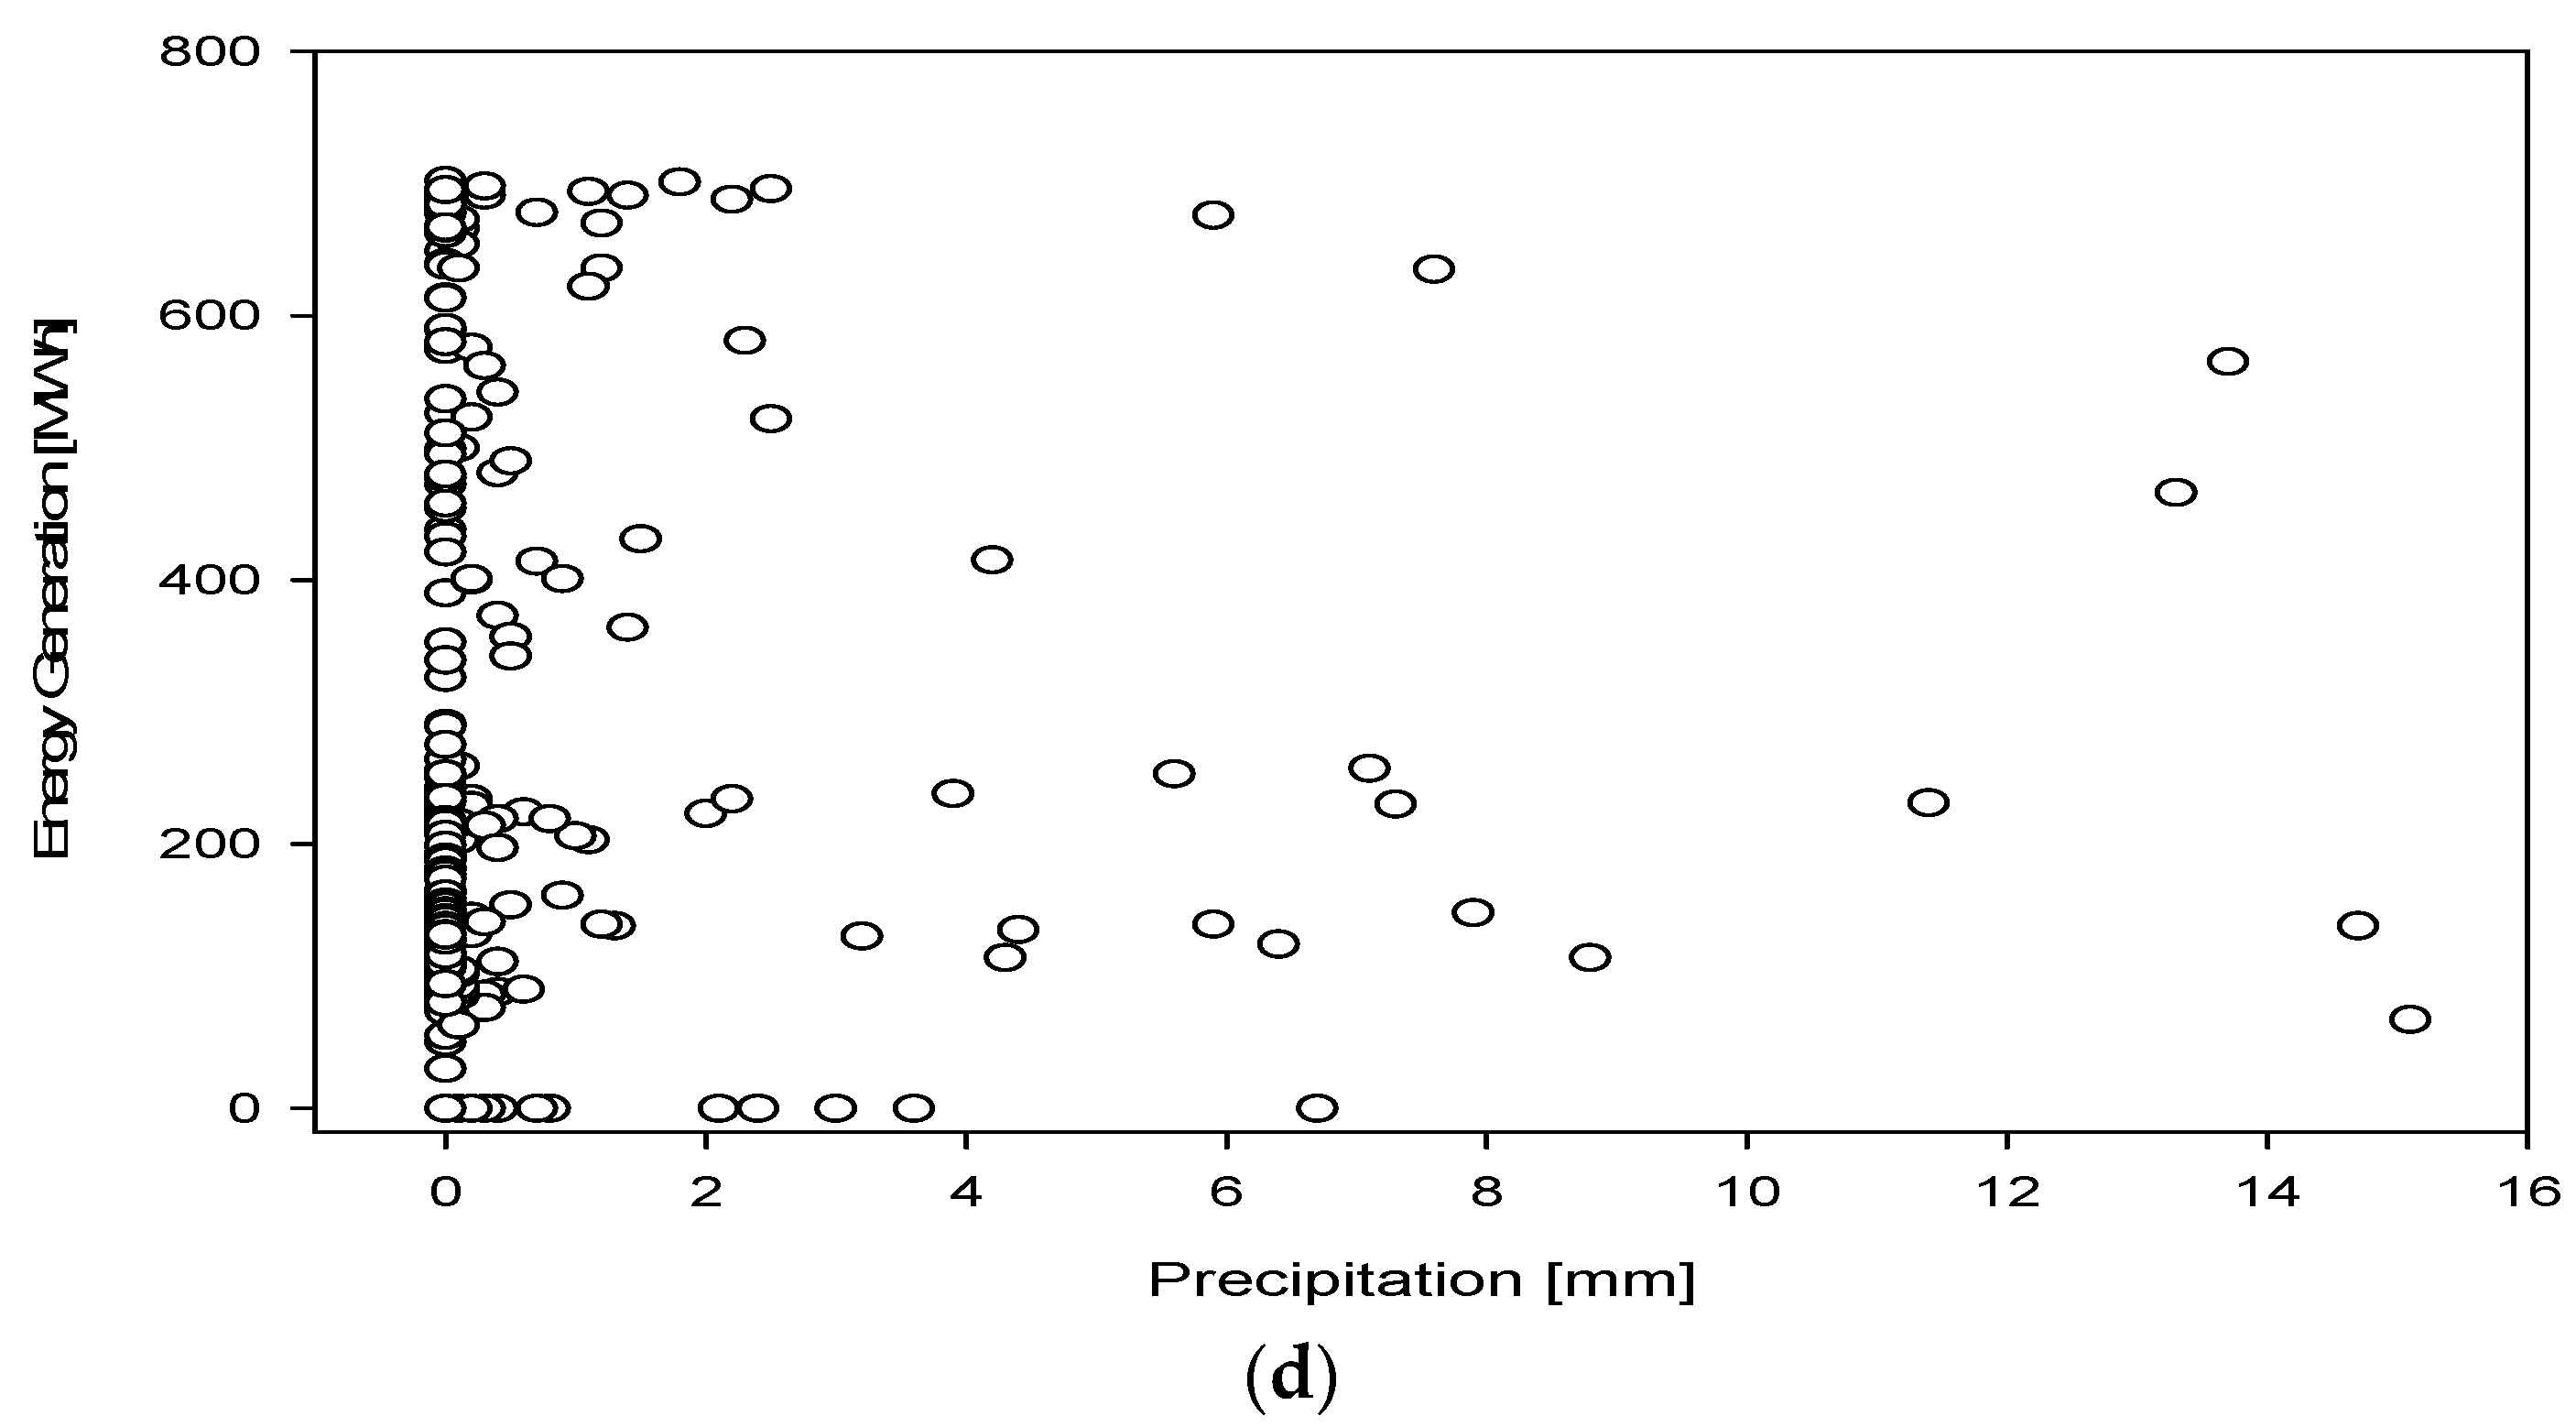
4.2. Energy Generation vs. Precipitation
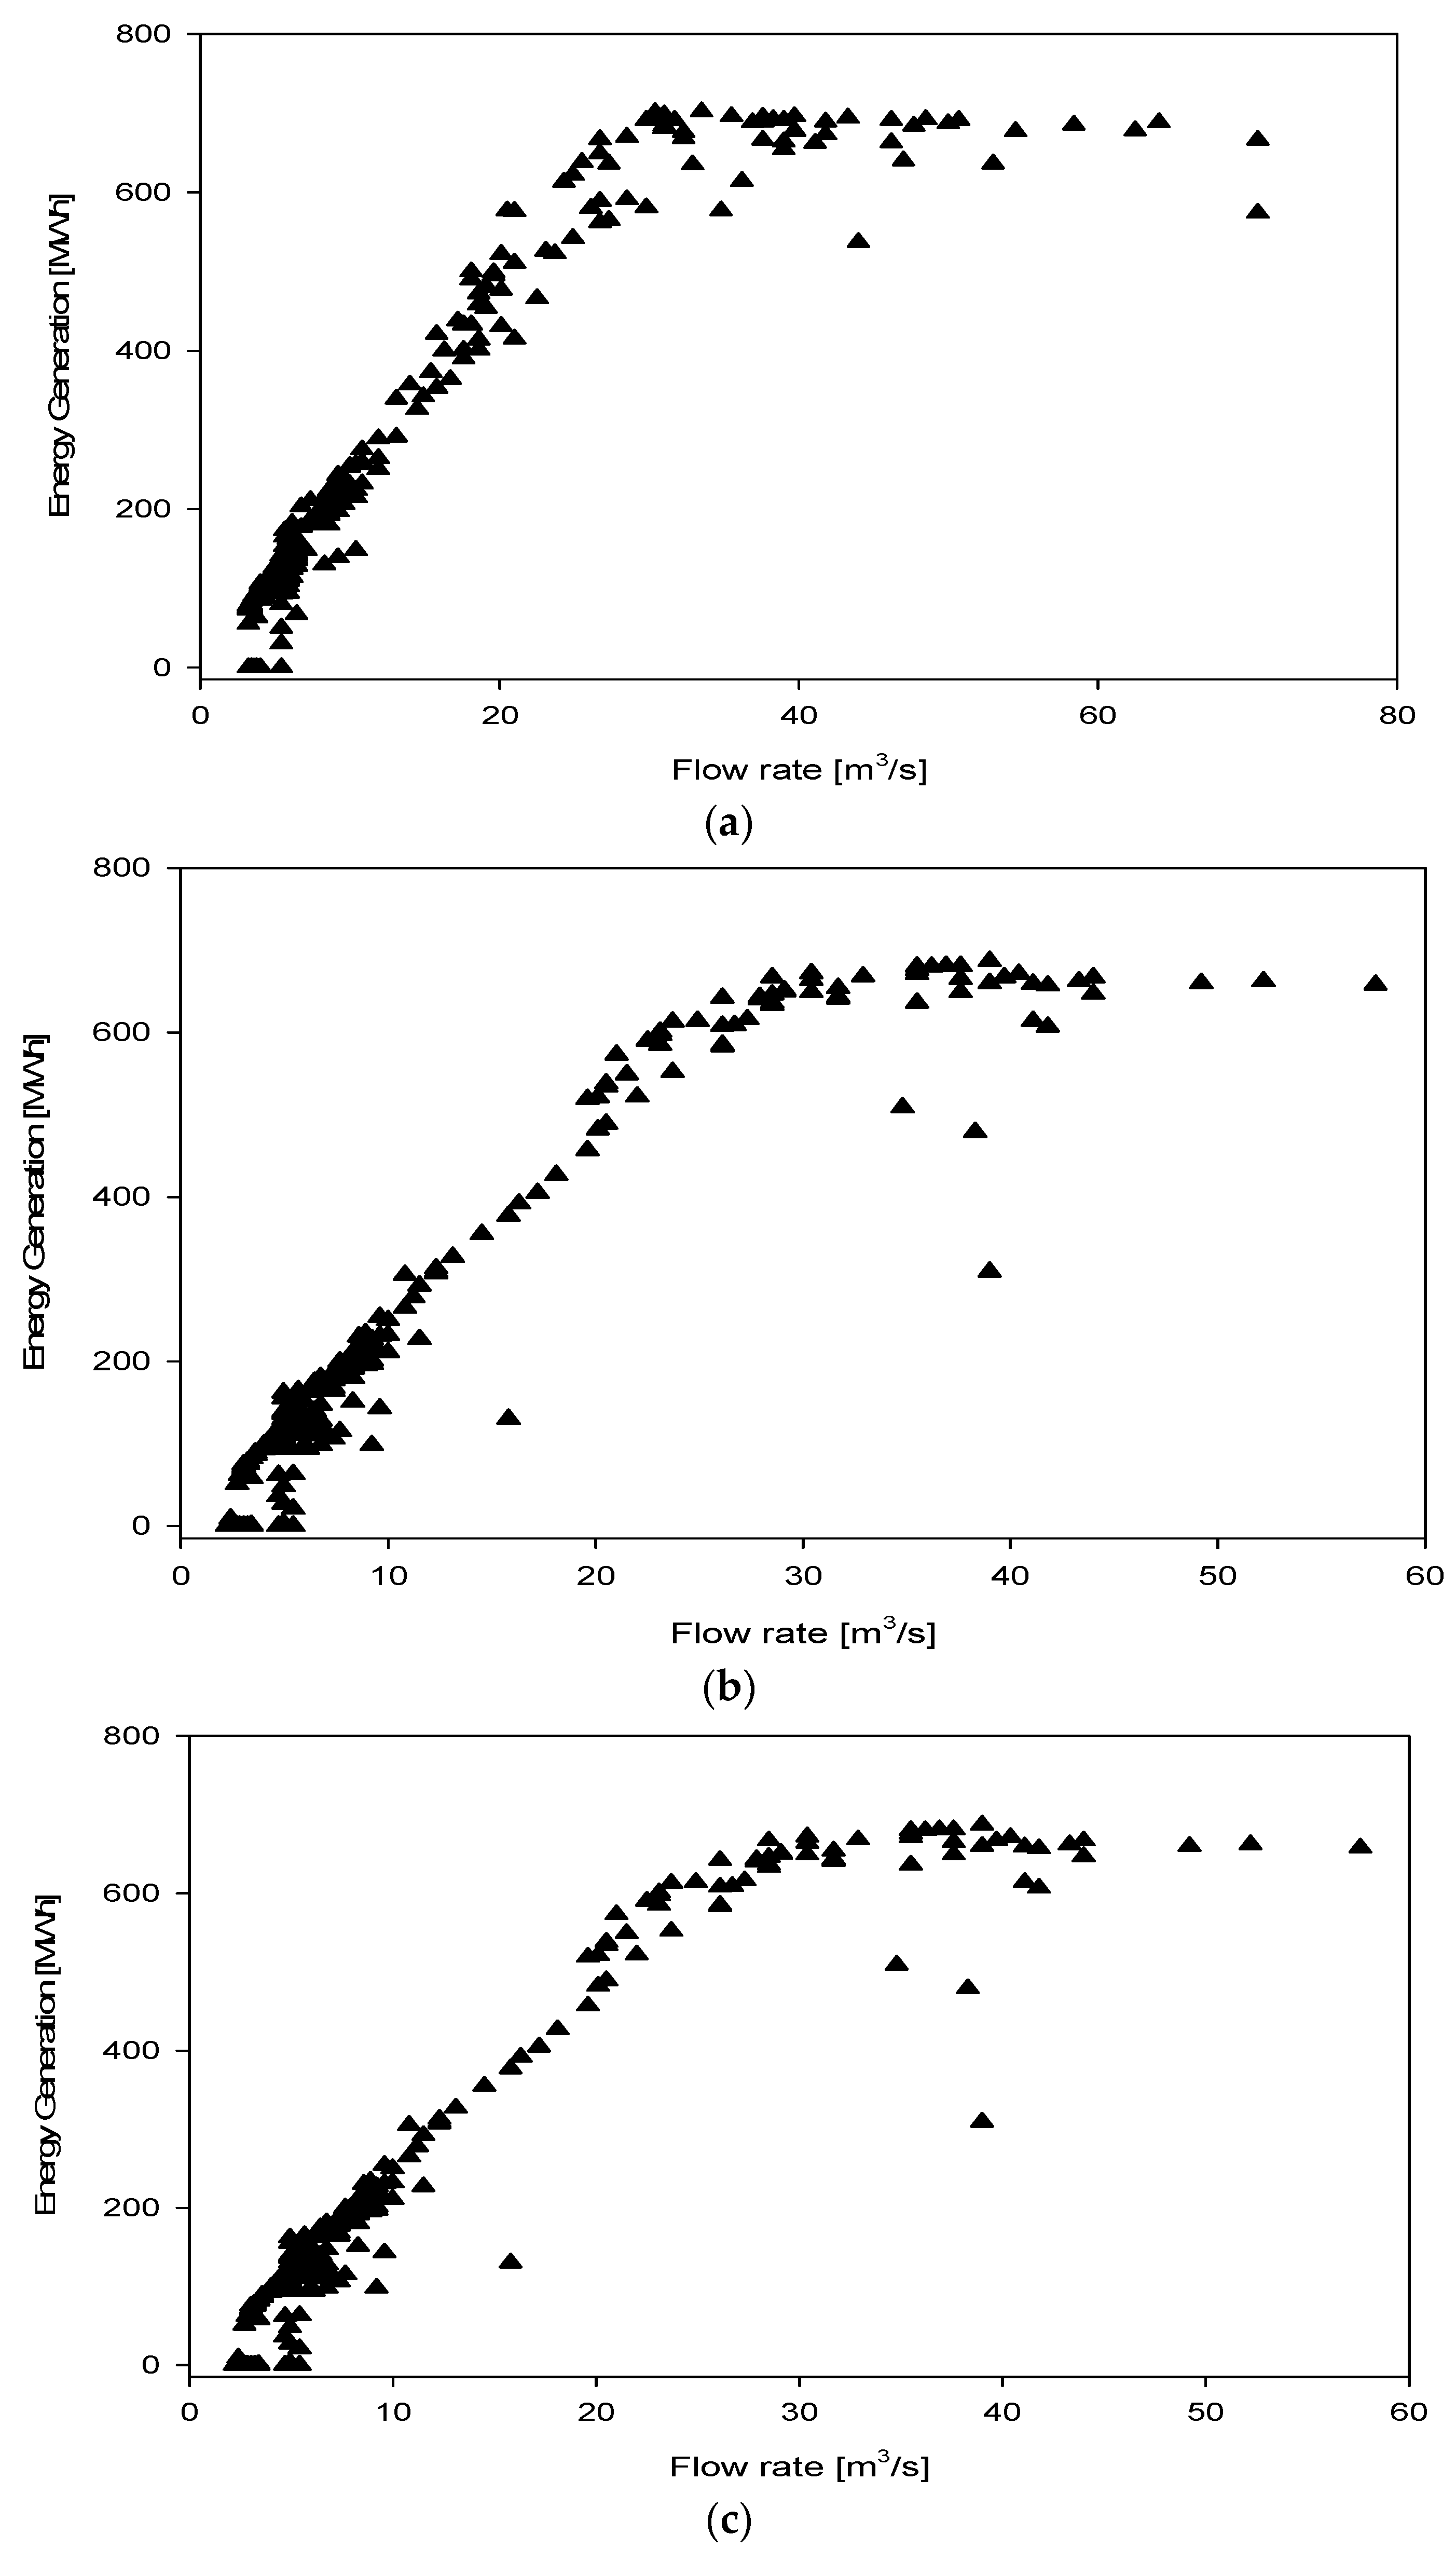
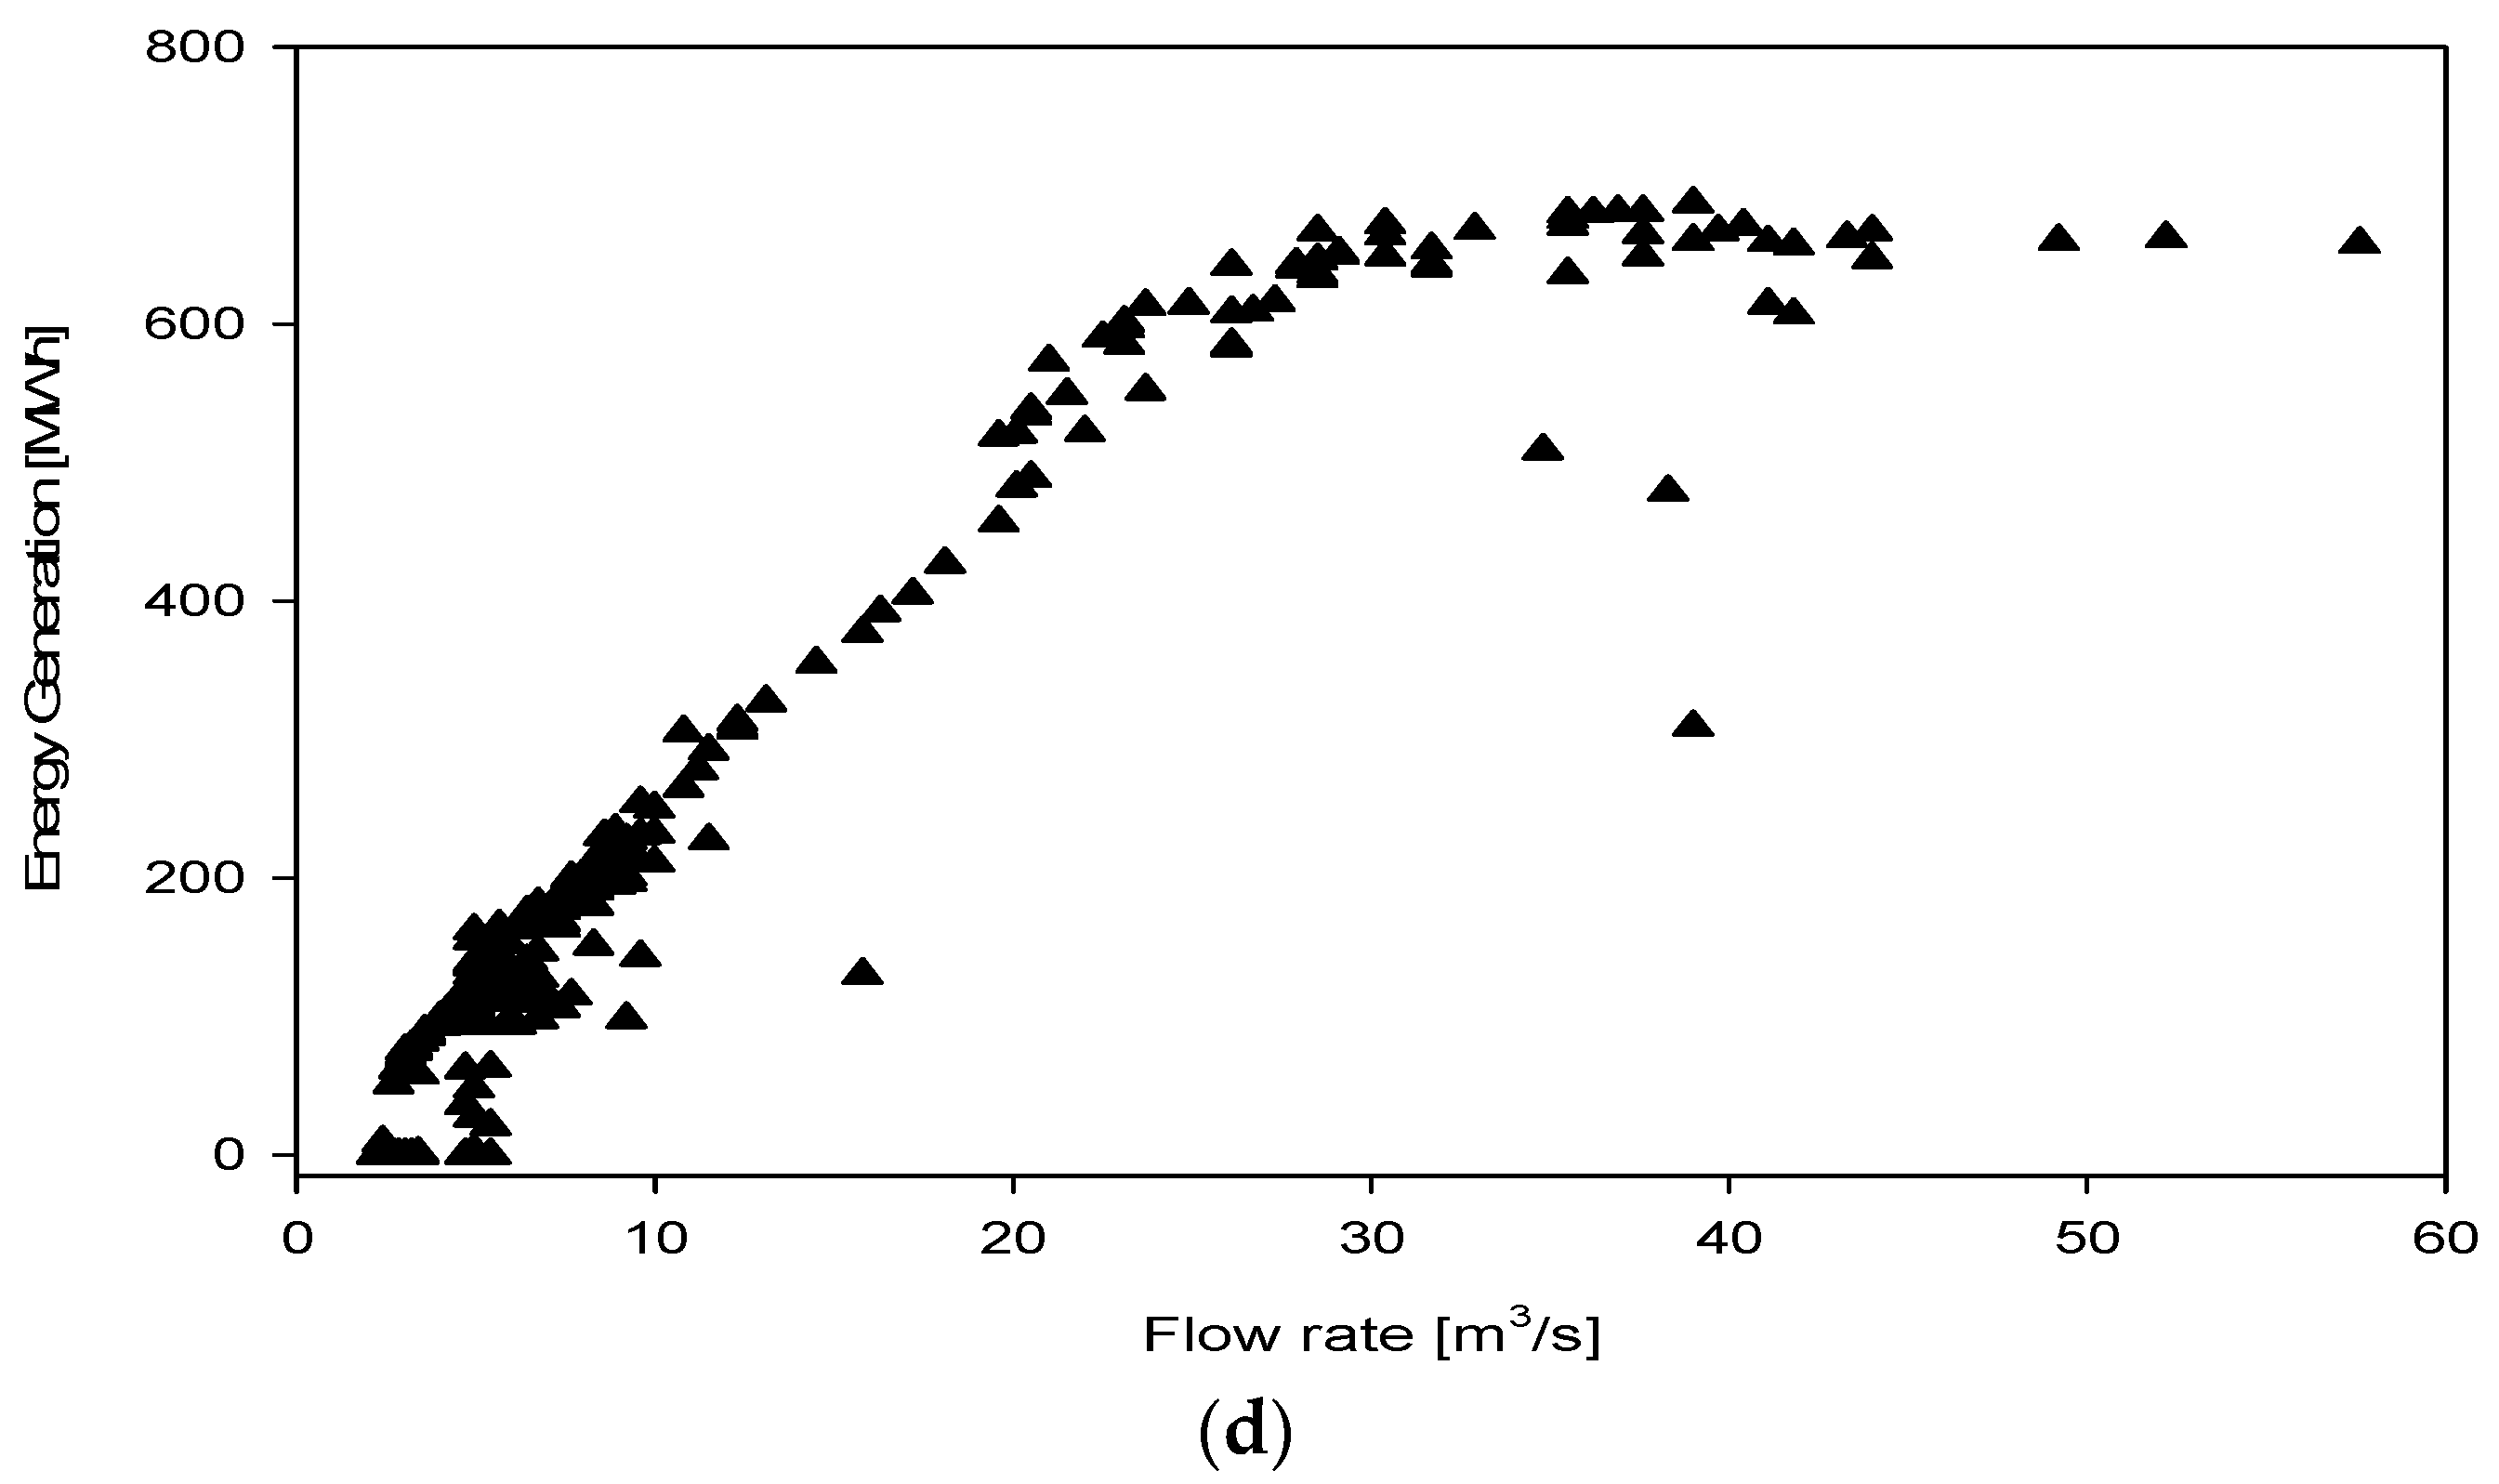
4.3. Energy Generation vs. Flow Rate
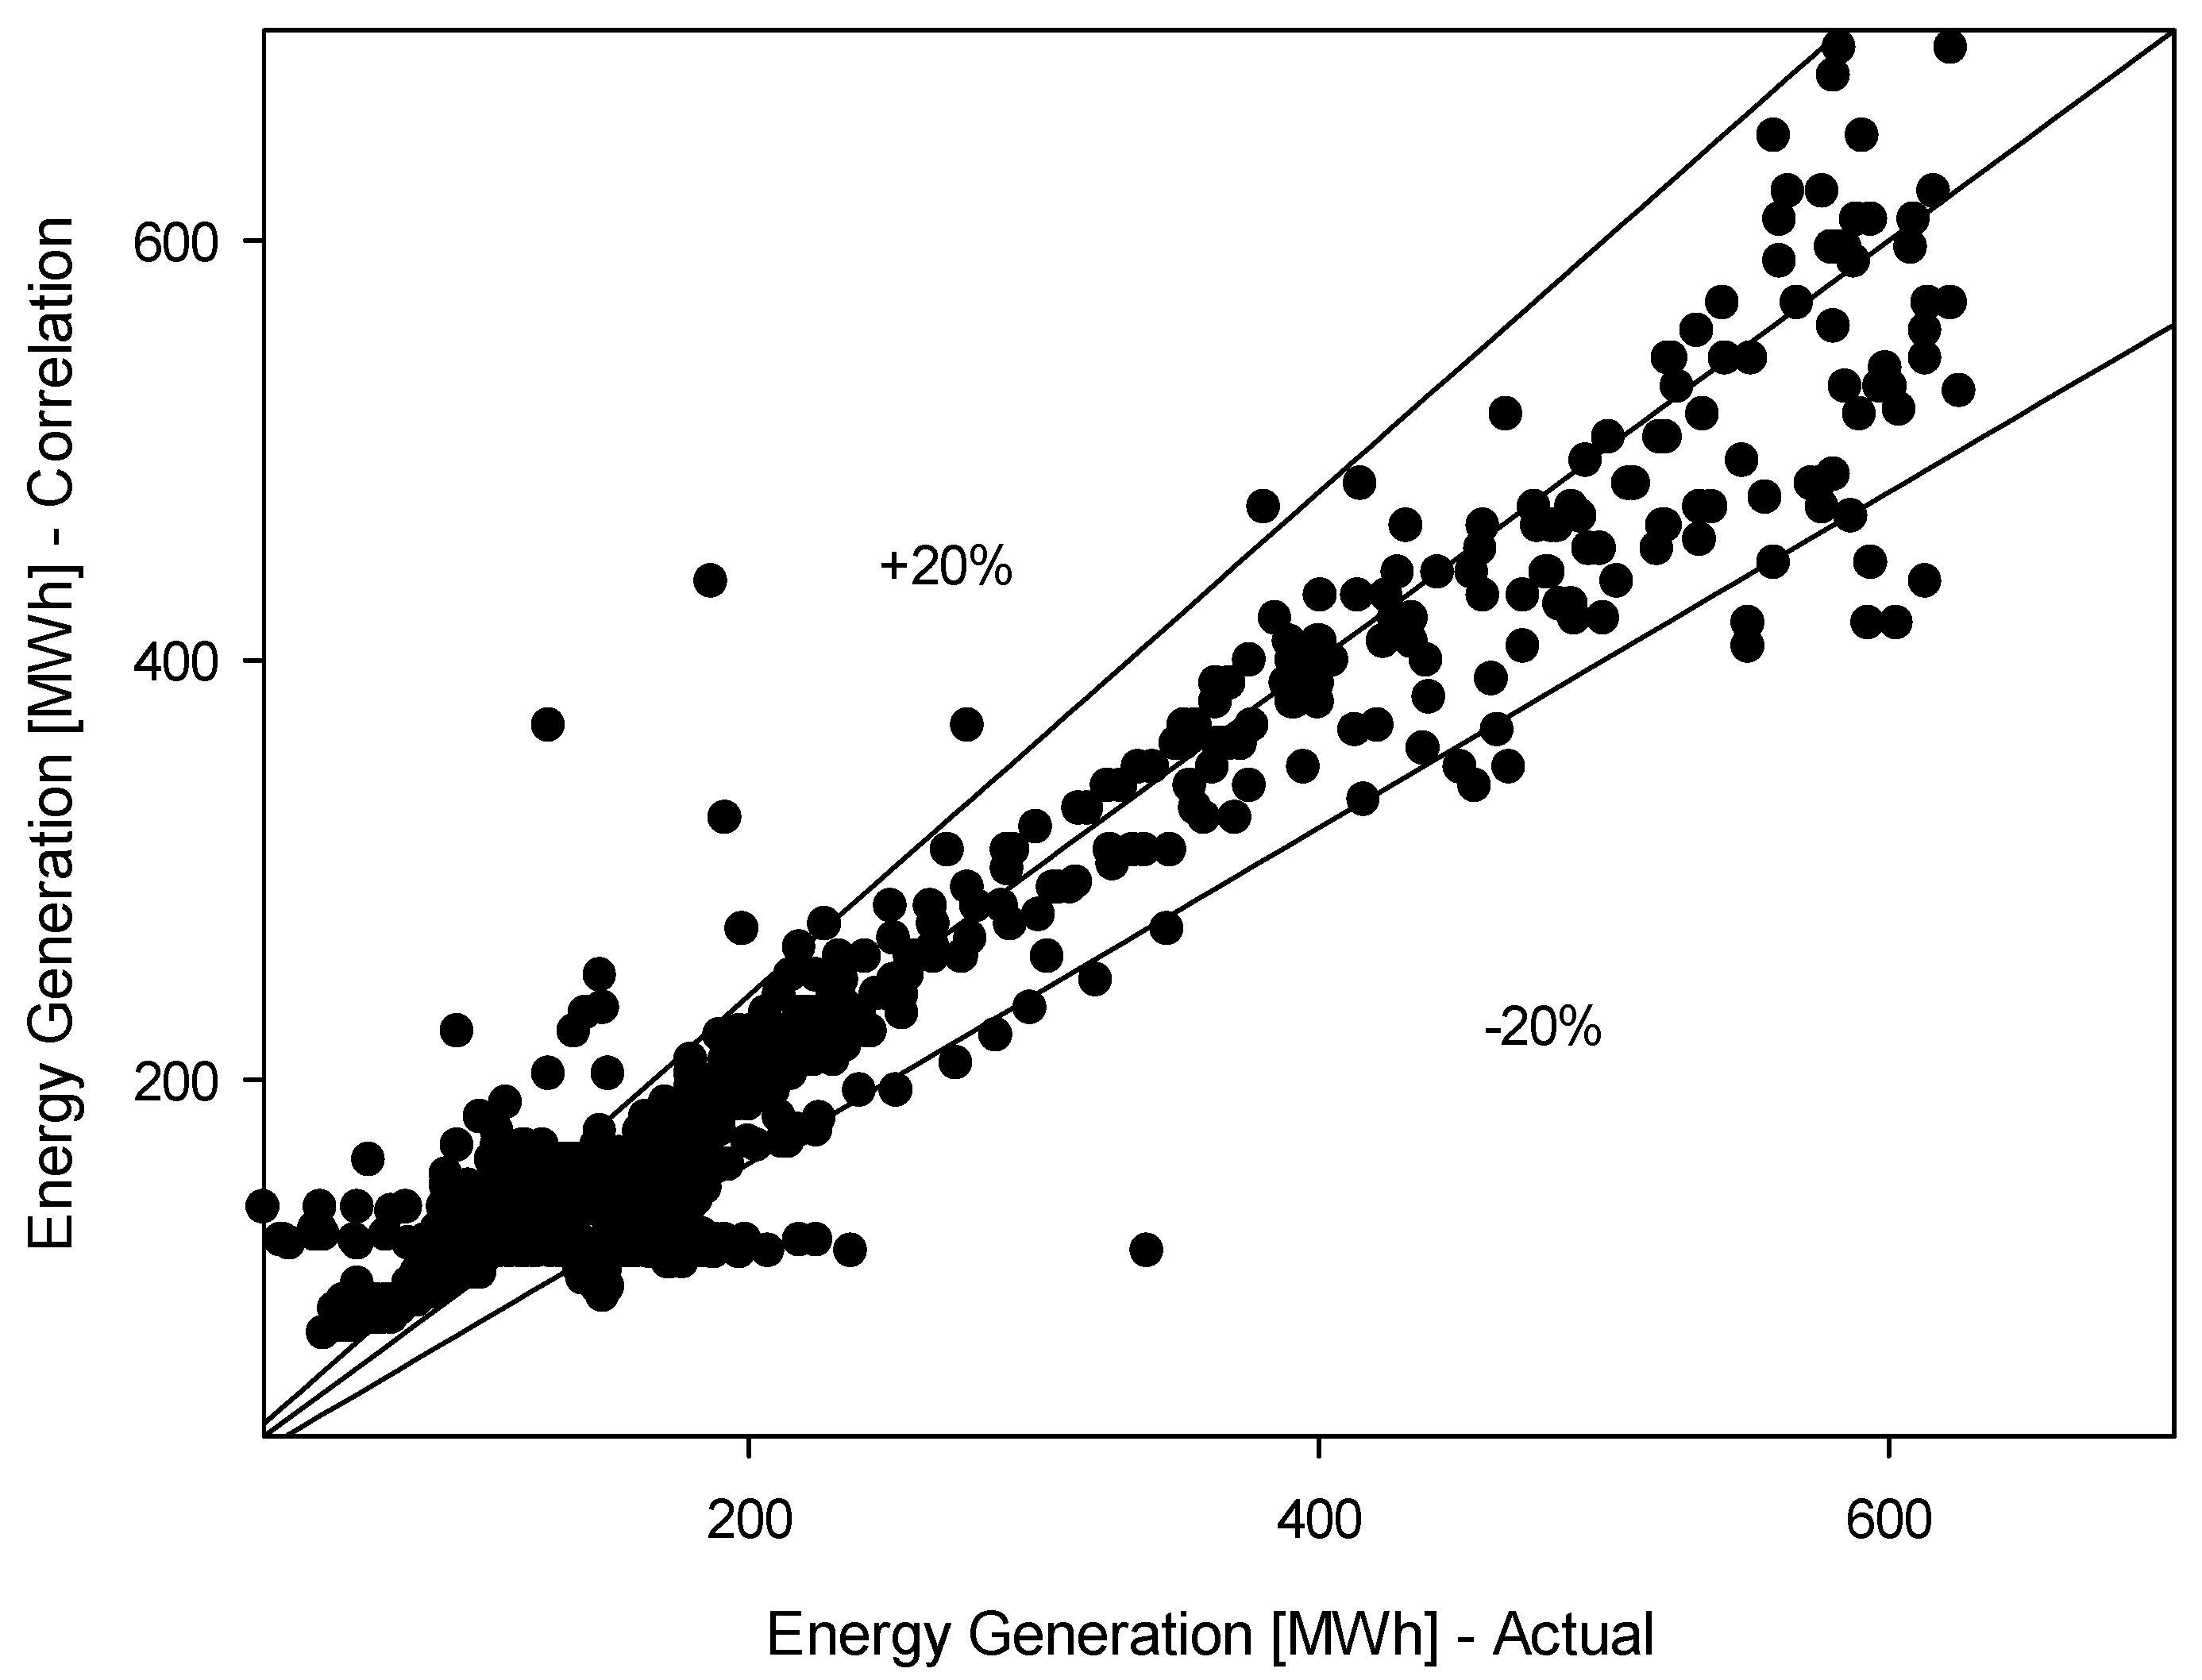
4.4. Correlation Development
5. Conclusions
- (a)
- There exists an apparent relationship between flow rate and energy generation. However, in the presence of high flow rates that exceed the design flow rate of 31.24 m3/s, the energy generation of hydropower plants reaches its highest limit.
- (b)
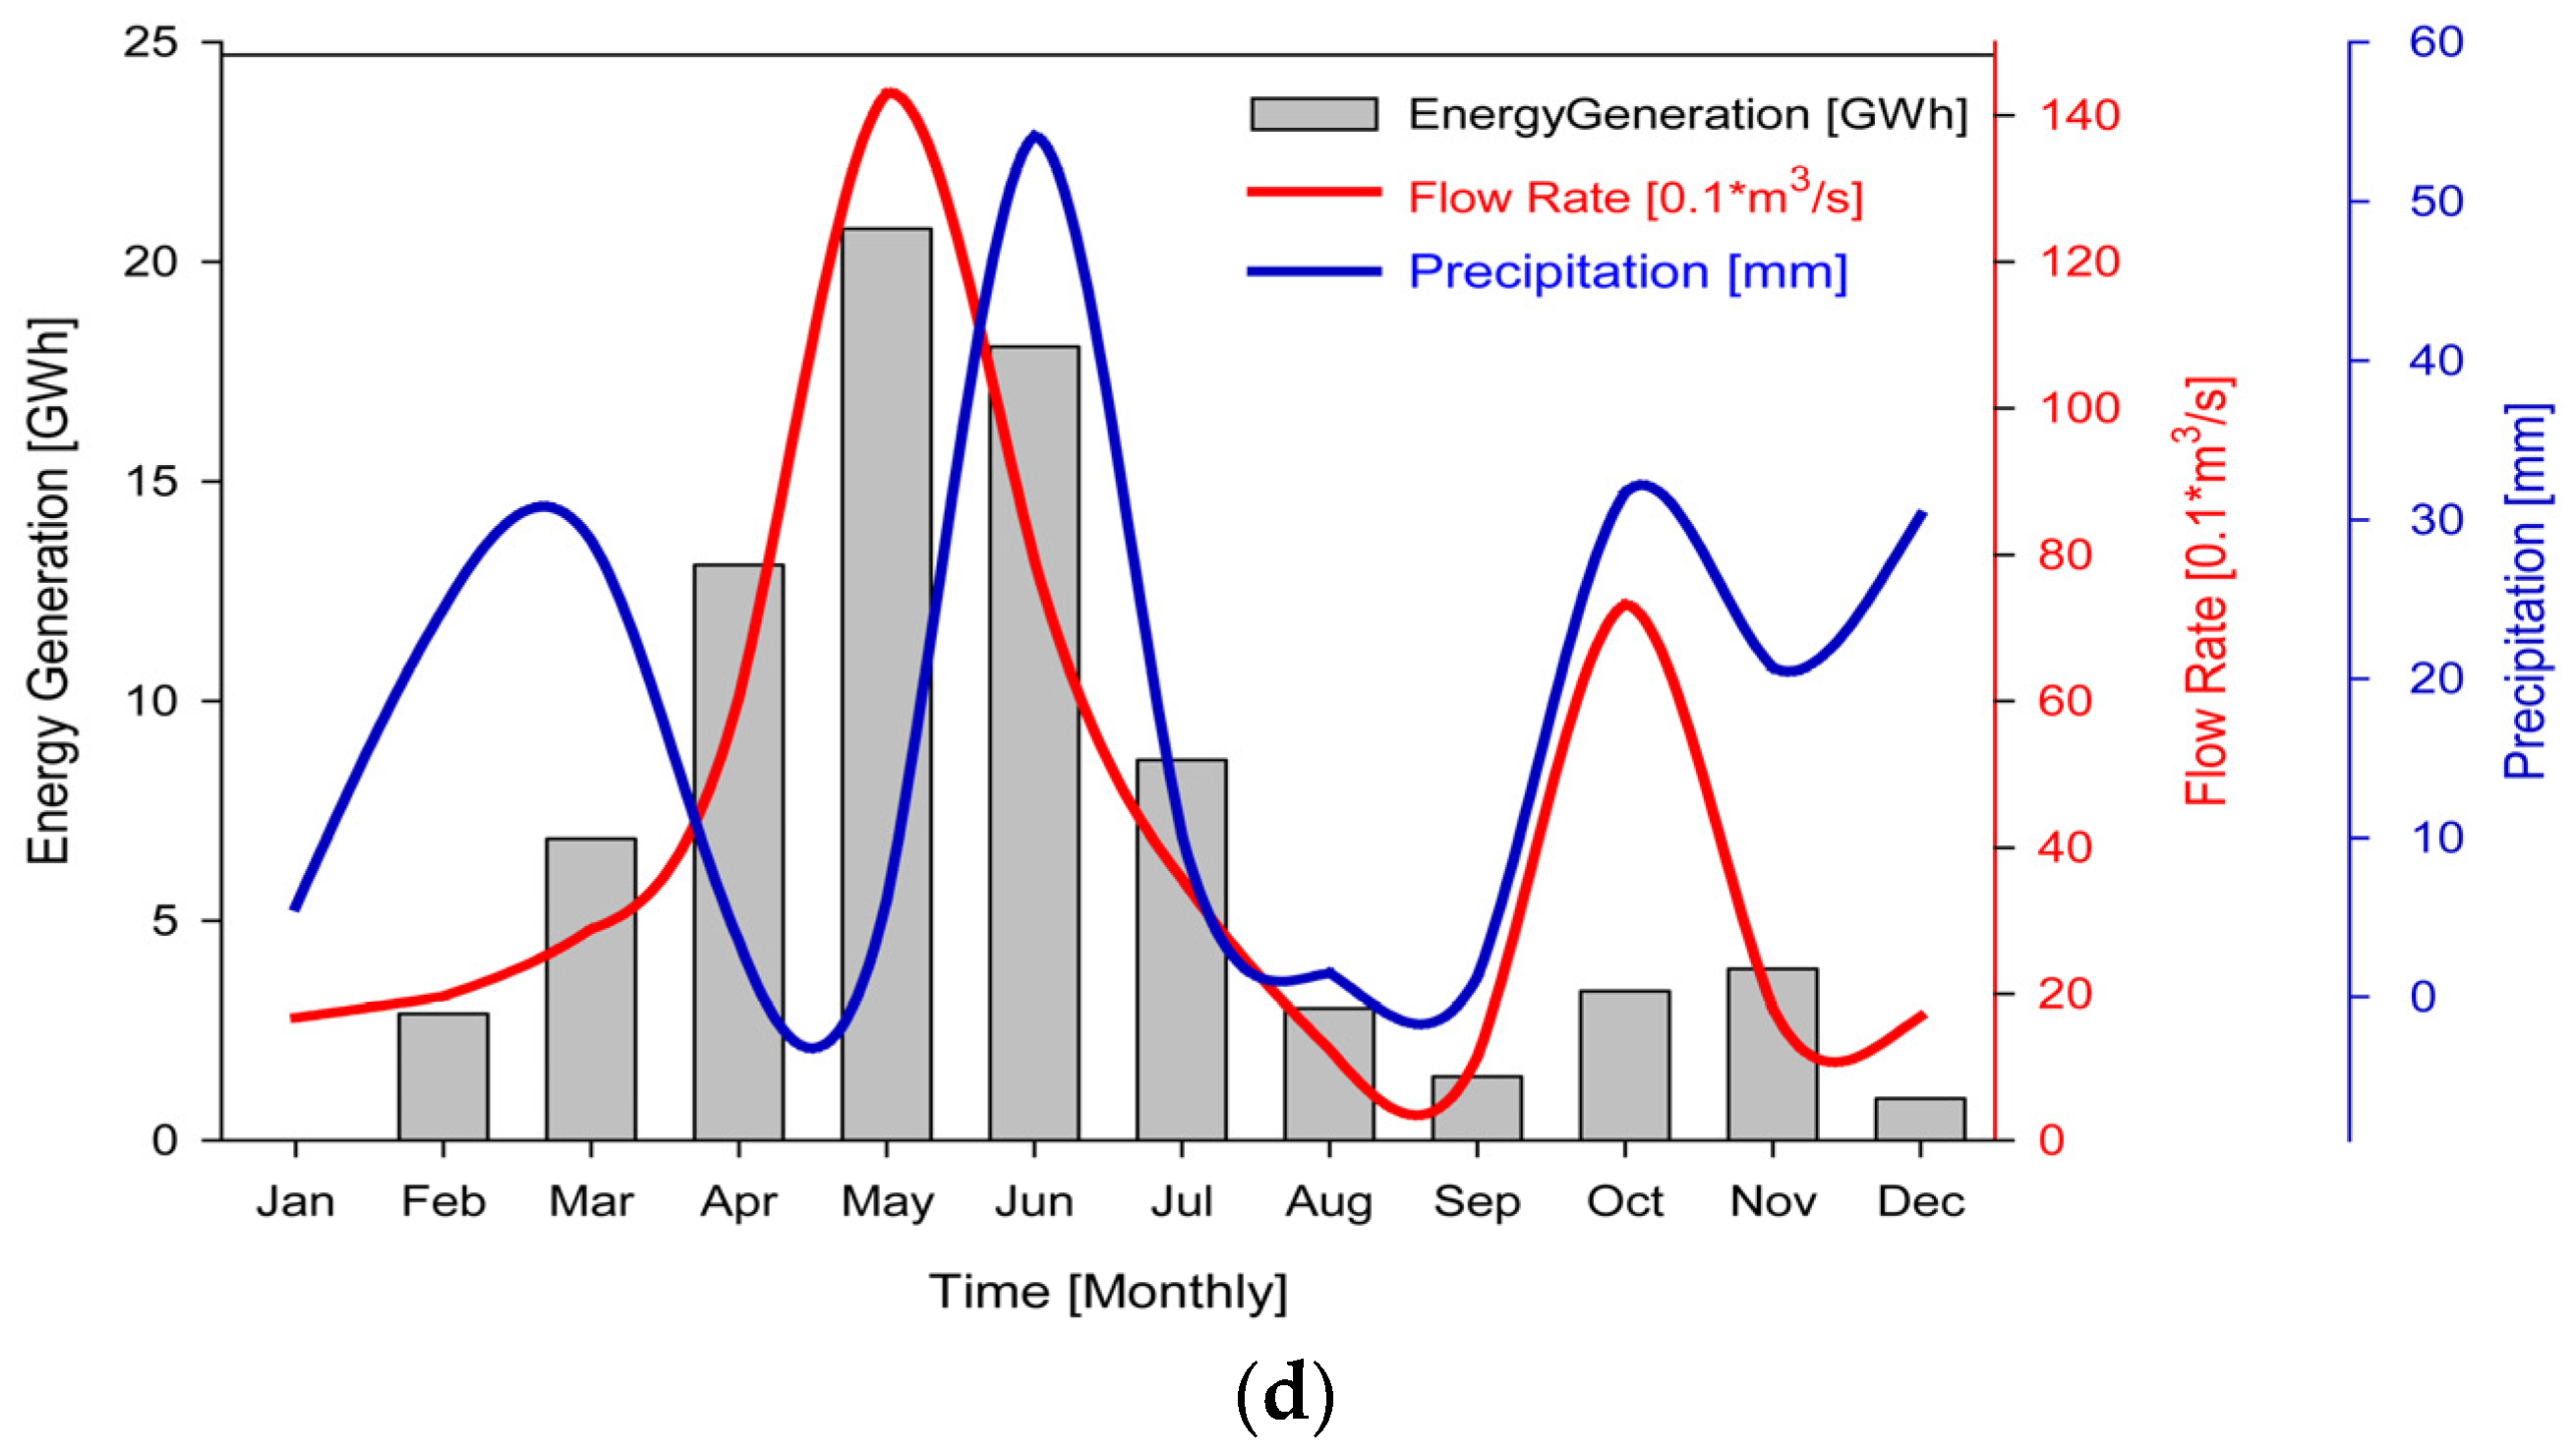
- The peak value of flow rate occurs during the spring season, composed of March–June, after the existence of the peak value of precipitation, which has a shifting pattern, and then energy generation likewise attains its maximum value during the same time interval. However, in the rest of the months, these exhibit distinct behaviors.
- (c)
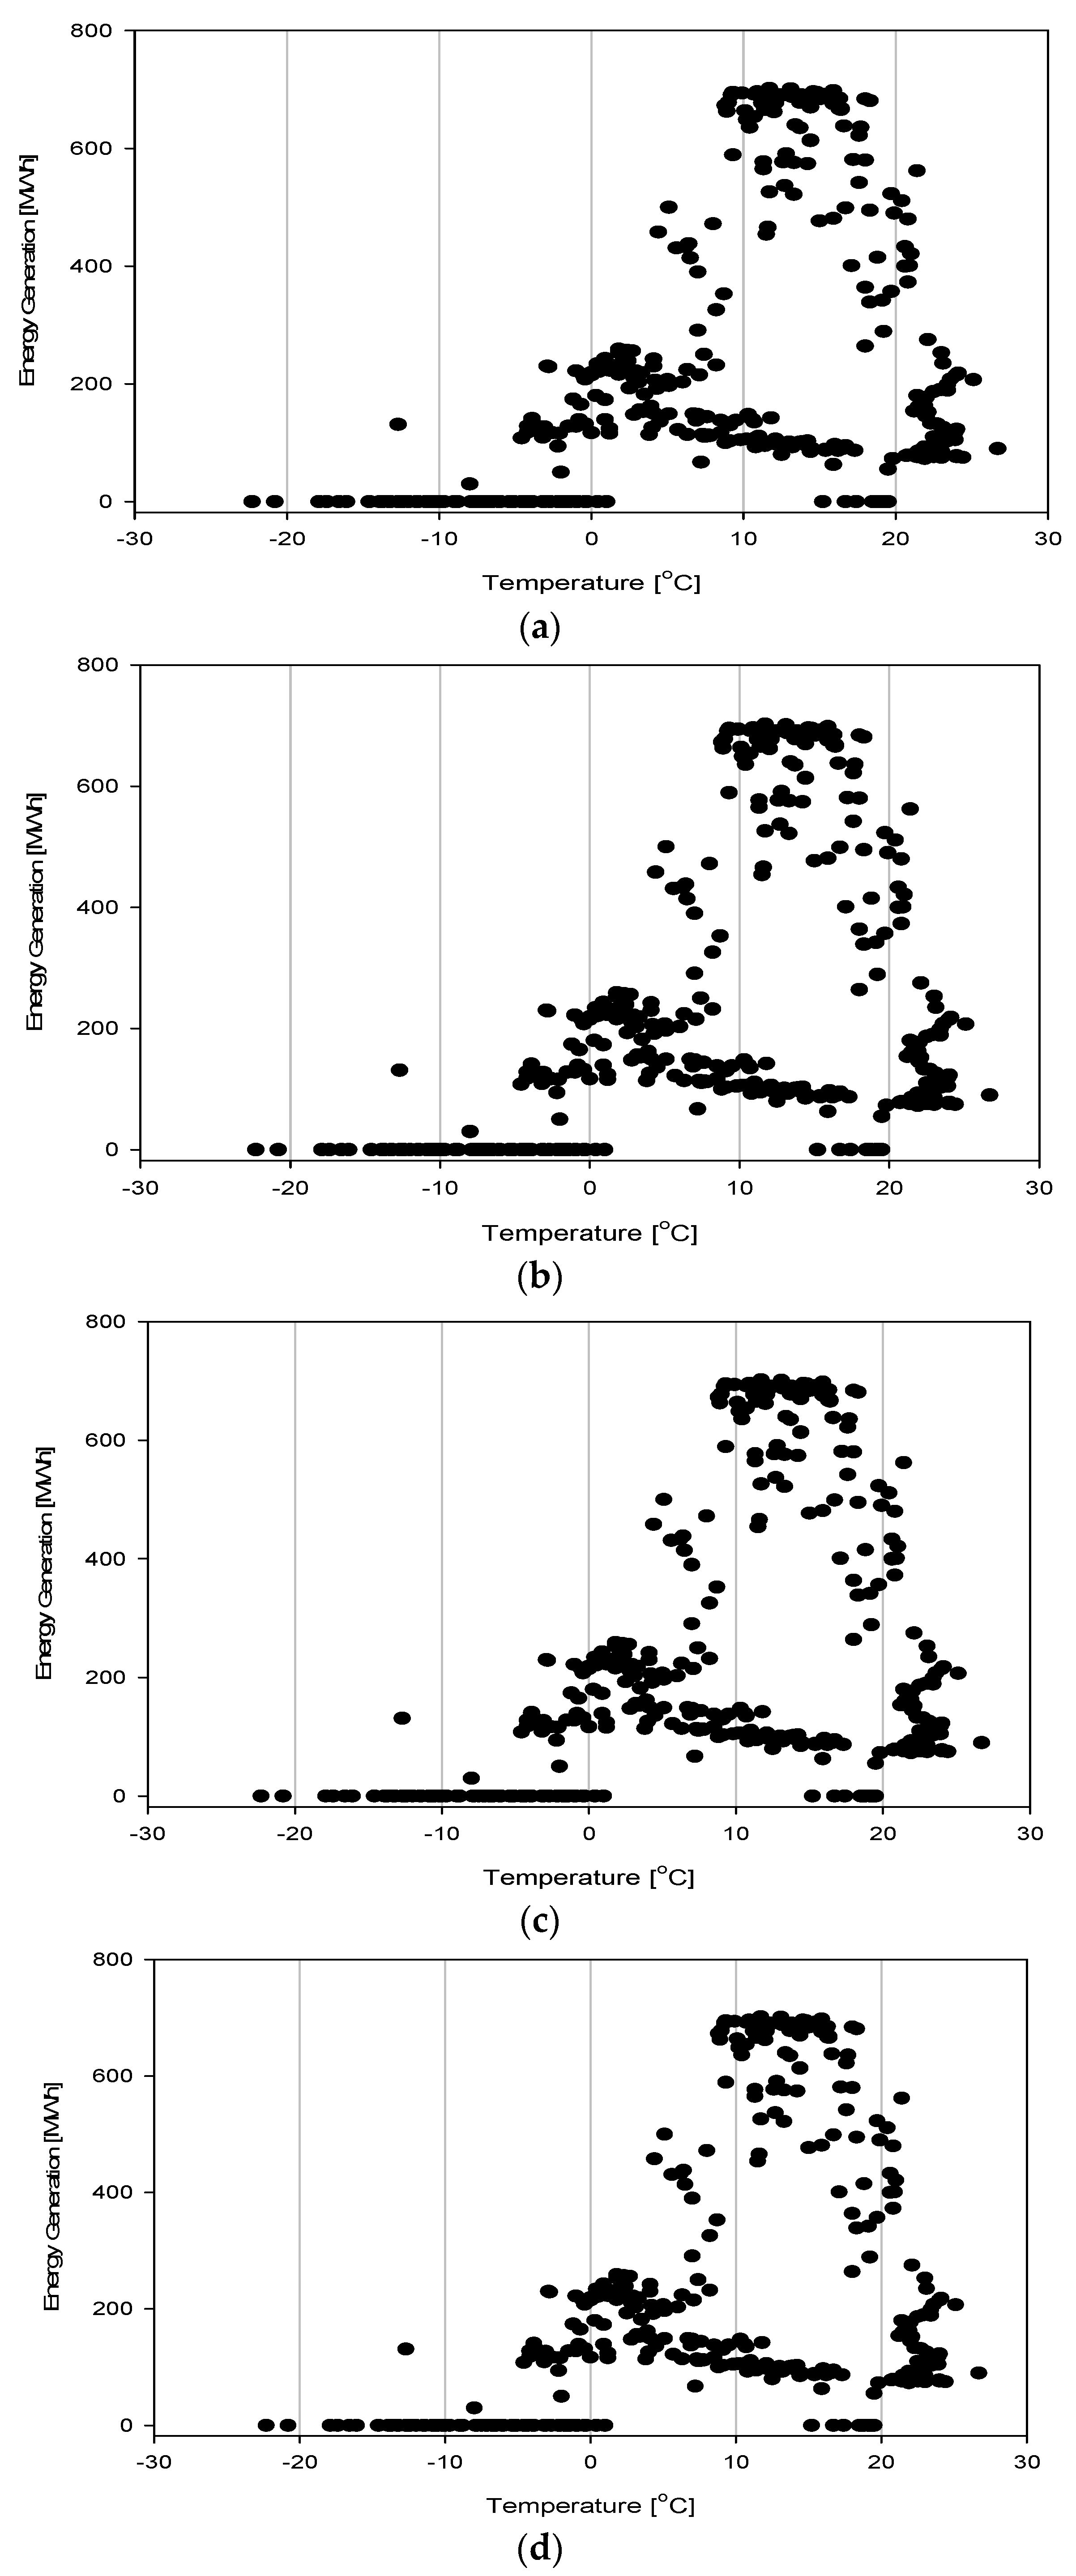
- The effect of air temperature variation on energy generation can be divided into three sections: the effect of cold–low temperatures, warmer temperatures, and high temperatures. While cold–low and high temperatures have adverse effects on energy generation in terms of freezing and evaporation of water stored in the regulator or flowing in the river, respectively, warm temperatures support an increase in the snowmelt rate occurring in the mountains, which results in an augmentation in the flow rate of the river.
- (d)
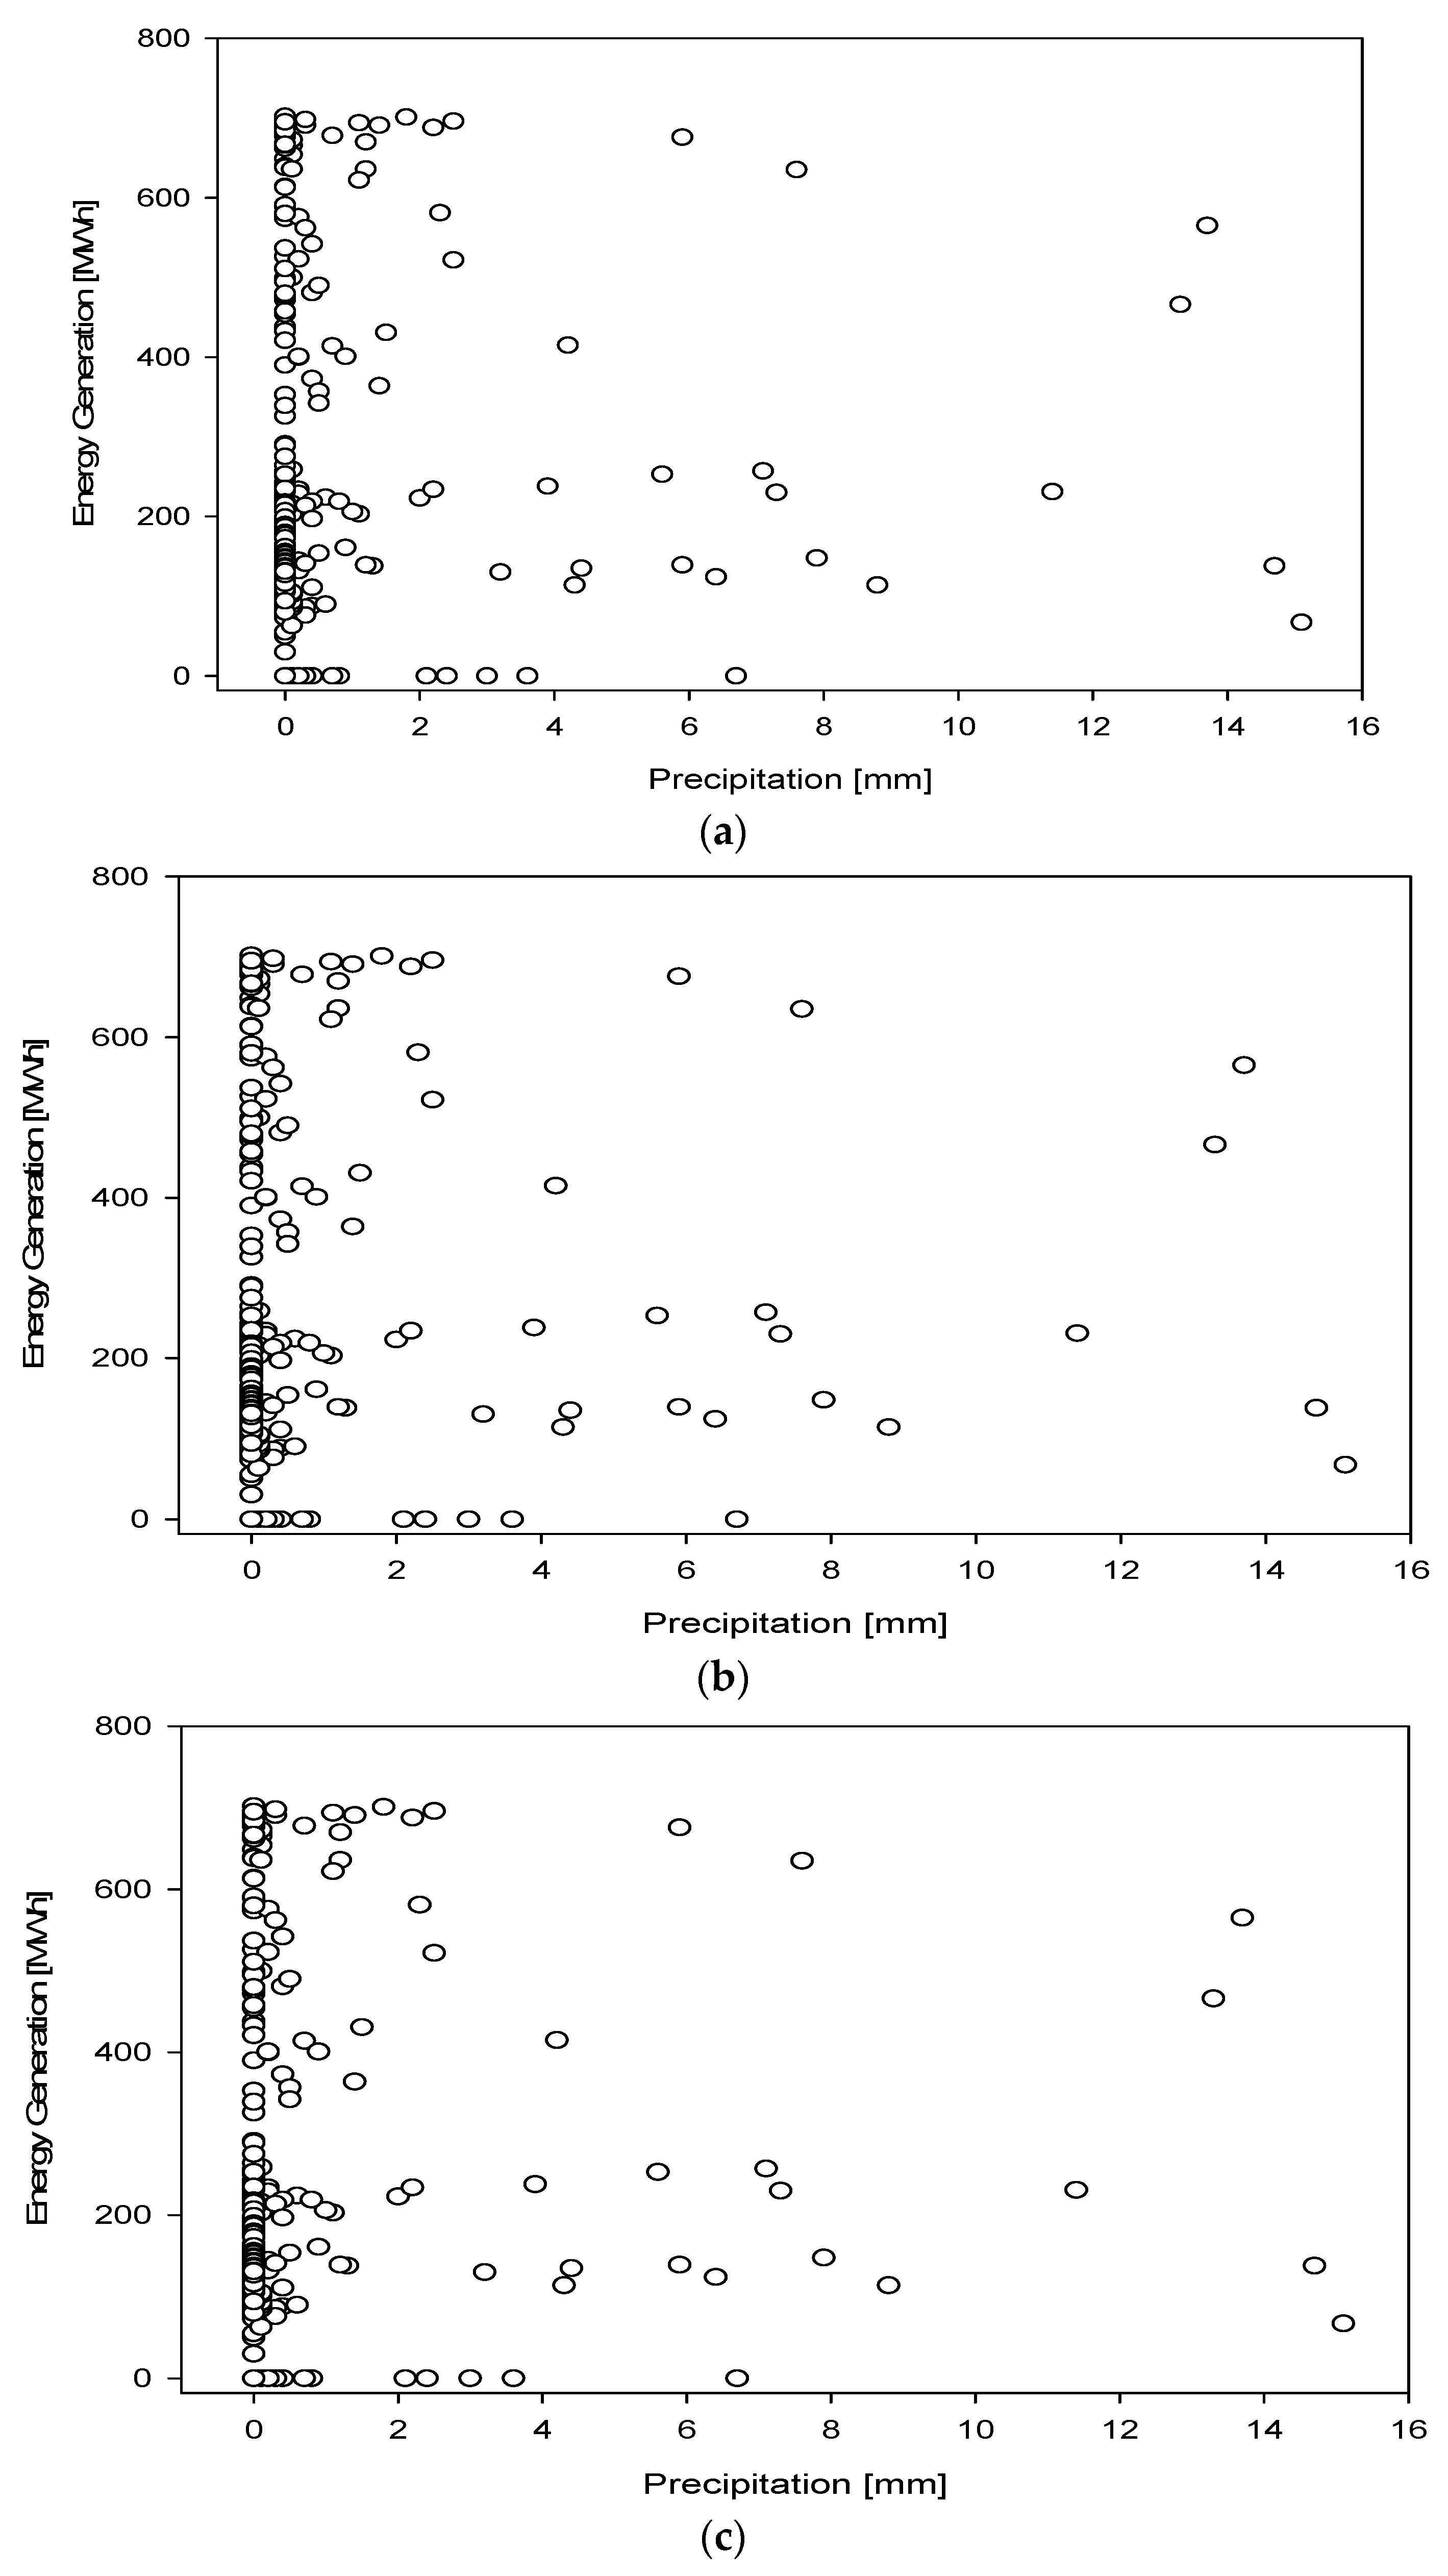
- There is no discernible correlation between daily precipitation and daily energy output. This finding does not imply the absence of a relationship between precipitation and energy output; as it was mentioned previously, monthly mean data trends of energy generation and precipitation have a strict relationship. The year with the greatest energy generation, as shown in this study, was 2019, coinciding with the year in which the highest precipitation levels were recorded.
- (e)
- A novel linear correlation with an R2 value of 0.89 has been obtained between the long-term daily flow rate data and the daily energy output of the hydropower plant under investigation. The energy generation values generated via the implementation of the suggested correlation were compared to the actual energy generation values, and we observed that the equation’s deviation band falls within the range of ±20%.
Funding
Institutional Review Board Statement
Informed Consent Statement
Data Availability Statement
Conflicts of Interest
References
- Balkhair, K.S.; Rahman, K.U. Sustainable and economical small-scale and low-head hydropower generation: A promising alternative potential solution for energy generation at local and regional scale. Appl. Energy 2017, 188, 378–391. [Google Scholar] [CrossRef]
- Karakoyun, Y.; Dönmez, A.H.; Yumurtacı, Z. Comparison of environmental flow assessment methods with a case study on a runoff river–type hydropower plant using hydrological methods. Environ. Monit. Assess. 2018, 190, 1–15. [Google Scholar] [CrossRef] [PubMed]
- Fung, C.F.; Lopez, A.; New, M. (Eds.) Modelling the Impact of Climate Change on Water Resources; John Wiley & Sons: Hoboken, NJ, USA, 2011. [Google Scholar]
- Giannakopoulos, C.; Le Sager, P.; Bindi, M.; Moriondo, M.; Kostopoulou, E.; Goodess, C.M. Climatic changes and associated impacts in the Mediterranean resulting from a 2 C global warming. Glob. Planet. Chang. 2009, 68, 209–224. [Google Scholar] [CrossRef]
- Tarroja, B.; AghaKouchak, A.; Samuelsen, S. Quantifying climate change impacts on hydropower generation and implications on electric grid greenhouse gas emissions and operation. Energy 2016, 111, 295–305. [Google Scholar] [CrossRef]
- Cox, P.M.; Betts, R.A.; Collins, M.; Harris, P.P.; Huntingford, C.; Jones, C.D. Amazonian forest dieback under climate-carbon cycle projections for the 21st century. Theor. Appl. Climatol. 2004, 78, 137–156. [Google Scholar] [CrossRef]
- Minville, M.; Brissette, F.; Krau, S.; Leconte, R. Adaptation to climate change in the management of a Canadian water-resources system exploited for hydropower. Water Resour. Manag. 2009, 23, 2965–2986. [Google Scholar] [CrossRef]
- Li, W.; Fu, R.; Dickinson, R.E. Rainfall and its seasonality over the Amazon in the 21st century as assessed by the coupled models for the IPCC AR4. J. Geophys. Res. Atmos. 2006, 111, D0211. [Google Scholar] [CrossRef]
- Salazar, L.F.; Nobre, C.A.; Oyama, M.D. Climate change consequences on the biome distribution in tropical South America. Geophys. Res. Lett. 2007, 34, L09708. [Google Scholar] [CrossRef]
- Chandramowli, S.N.; Felder, F.A. Impact of climate change on electricity systems and markets—A review of models and forecasts. Sustain. Energy Technol. Assess. 2014, 5, 62–74. [Google Scholar] [CrossRef]
- Mideksa, T.K.; Kallbekken, S. The impact of climate change on the electricity market: A review. Energy Policy 2010, 38, 3579–3585. [Google Scholar] [CrossRef]
- Schaeffer, R.; Szklo, A.S.; de Lucena, A.F.P.; Borba BS, M.C.; Nogueira LP, P.; Fleming, F.P.; Troccoli, A.; Harrison, M.; Boulahya, M.S. Energy sector vulnerability to climate change: A review. Energy 2012, 38, 1–12. [Google Scholar] [CrossRef]
- Schaefli, B.; Hingray, B.; Musy, A. Climate change and hydropower production in the Swiss Alps: Quantification of potential impacts and related modelling uncertainties. Hydrol. Earth Syst. Sci. 2007, 11, 1191–1205. [Google Scholar] [CrossRef]
- Gunderson, I.; Goyette, S.; Gago-Silva, A.; Quiquerez, L.; Lehmann, A. Climate and land-use change impacts on potential solar photovoltaic power generation in the Black Sea region. Environ. Sci. Policy 2015, 46, 70–81. [Google Scholar] [CrossRef]
- Hamududu, B.; Killingtveit, A. Assessing climate change impacts on global hydropower. In Climate Change and the Future of Sustainability; Apple Academic Press: Burlington, ON, Canada, 2017; pp. 109–132. [Google Scholar]
- Majone, B.; Villa, F.; Deidda, R.; Bellin, A. Impact of climate change and water use policies on hydropower potential in the south-eastern Alpine region. Sci. Total Environ. 2016, 543, 965–980. [Google Scholar] [CrossRef]
- Teotónio, C.; Fortes, P.; Roebeling, P.; Rodriguez, M.; Robaina-Alves, M. Assessing the impacts of climate change on hydropower generation and the power sector in Portugal: A partial equilibrium approach. Renew. Sustain. Energy Rev. 2017, 74, 788–799. [Google Scholar] [CrossRef]
- Bartos, M.D.; Chester, M.V. Impacts of climate change on electric power supply in the Western United States. Nat. Clim. Chang. 2015, 5, 748–752. [Google Scholar] [CrossRef]
- Höltinger, S.; Mikovits, C.; Schmidt, J.; Baumgartner, J.; Arheimer, B.; Lindström, G.; Wetterlund, E. The impact of climatic extreme events on the feasibility of fully renewable power systems: A case study for Sweden. Energy 2019, 178, 695–713. [Google Scholar] [CrossRef]
- Liu, X.; Tang, Q.; Voisin, N.; Cui, H. Projected impacts of climate change on hydropower potential in China. Hydrol. Earth Syst. Sci. 2016, 20, 3343–3359. [Google Scholar] [CrossRef]
- Senni, C.C.; Goel, S.; von Jagow, A. Economic and financial consequences of water risks: The case of hydropower. Ecol. Econ. 2024, 218, 108048. [Google Scholar] [CrossRef]
- Zhong, R.; Zhao, T.; He, Y.; Chen, X. Hydropower change of the water tower of Asia in 21st century: A case of the Lancang River hydropower base, upper Mekong. Energy 2019, 179, 685–696. [Google Scholar] [CrossRef]
- Da Cunha, L.V.; De Oliveira, R.P.; Nascimento, J.; Ribeiro, L. Impacts of climate change on water resources: A case-study for Portugal. IAHS Publ. 2007, 310, 37. [Google Scholar]
- Van Vliet, M.T.; Donnelly, C.; Strömbäck, L.; Capell, R.; Ludwig, F. European scale climate information services for water use sectors. J. Hydrol. 2015, 528, 503–513. [Google Scholar] [CrossRef]
- García-Ruiz, J.M.; López-Moreno, J.I.; Vicente-Serrano, S.M.; Lasanta–Martínez, T.; Beguería, S. Mediterranean water resources in a global change scenario. Earth-Sci. Rev. 2011, 105, 121–139. [Google Scholar] [CrossRef]
- Medeiros, S.E.L.; Nilo, P.F.; Silva, L.P.; Santos CA, C.; Carvalho, M.; Abrahão, R. Influence of climatic variability on the electricity generation potential by renewable sources in the Brazilian semi-arid region. J. Arid Environ. 2021, 184, 104331. [Google Scholar] [CrossRef]
- Ceribasi, G.; Ceyhunlu, A.I.; Wałęga, A.; Młyński, D. Investigation of the Effect of Climate Change on Energy Produced by Hydroelectric Power Plants (HEPPs) by Trend Analysis Method: A Case Study for Dogancay I–II HEPPs. Energies 2022, 15, 2474. [Google Scholar] [CrossRef]
- Yu, P.S.; Yang, T.C.; Kuo, C.M.; Chou, J.C.; Tseng, H.W. Climate change impacts on reservoir inflows and subsequent hydroelectric power generation for cascaded hydropower plants. Hydrol. Sci. J. 2014, 59, 1196–1212. [Google Scholar] [CrossRef]
- Wagner, T.; Themeßl, M.; Schüppel, A.; Gobiet, A.; Stigler, H.; Birk, S. Impacts of climate change on stream flow and hydro power generation in the Alpine region. Environ. Earth Sci. 2017, 76, 1–22. [Google Scholar] [CrossRef]
- Mohor, G.S.; Rodriguez, D.A.; Tomasella, J.; Júnior JL, S. Exploratory analyses for the assessment of climate change impacts on the energy production in an Amazon run-of-river hydropower plant. J. Hydrol. Reg. Stud. 2015, 4, 41–59. [Google Scholar] [CrossRef]
- Markoff, M.S.; Cullen, A.C. Impact of climate change on Pacific Northwest hydropower. Clim. Change 2008, 87, 451–469. [Google Scholar] [CrossRef]
- Novitasari, D.; Hadi, S.P.; Budiarto, R. The climate and land-use changes impact on water availability for hydropower plants in Indonesia. Energy Strategy Rev. 2023, 46, 101043. [Google Scholar] [CrossRef]
- Yulistiyanto, B.; Hizhar, Y.; Lisdiyanti, L. Effect of flow discharge and shaft slope of archimides (screw) turbin on the micro-hydro power plant. Dinamika Teknik Sipil. 2012, 12, 1. [Google Scholar]
- Ismael, P. Determining the Hydrological Characteristics of the Greater Zap River Basin by G.I.S. Master’s Thesis, University of Gaziantep, Gaziantep, Türkiye, 2013. [Google Scholar]
- State Hydraulic Works. Available online: https://dsi.gov.tr/ (accessed on 10 May 2023).
- Mercan, B. Orta Ölçekli Hidroelektrik Enerji Tesislerinin İncelenmesi İçin Örnek Bir Çalişma-Bağişli Regülatörü ve HES. Ph.D. Thesis, Istanbul Technical University, Istanbul, Turkey, 2014. [Google Scholar]
- Turkish State Meteorological Service. Available online: https://www.mgm.gov.tr/eng (accessed on 11 February 2023).
- Energy Markets Operator Company. Available online: https://seffaflik.epias.com.tr/transparency/ (accessed on 15 March 2023).
- Hammid, A.T.; Sulaiman MH, B.; Abdalla, A.N. Prediction of small hydropower plant power production in Himreen Lake dam (HLD) using artificial neural network. Alex. Eng. J. 2018, 57, 211–221. [Google Scholar] [CrossRef]
- Paltán, H.A.; Pant, R.; Braeckman, J.P.; Dadson, S.J. Increased water risks to global hydropower in 1.5 °C and 2.0 °C Warmer Worlds. J. Hydrol. 2021, 599, 126503. [Google Scholar] [CrossRef]
- Linder, K.P.; Gibbs, M.J.; Inglis, M.R. Potential Impacts of Climate Change on Electric Utilities; New York State Energy Research and Development Authority Report 88-2; OSTI: Washington, DC, USA, 1987.


| Location | Zap River/Hakkari/Turkey |
|---|---|
| Installed Capacity | 30 MW |
| Energy Generation [Est.] | 100 GWh |
| Plant Components | Regulator |
| Transmission Tunnel | |
| Penstock | |
| Power house | |
| Transmission Tunnel | 3.3 km |
| Turbine Type | Francis (horizontal) ∗ 3 |
| Turbine Power | 10.1 MW (each) |
| Turbine Efficiency | 0.91 |
| Net head | 108.3 m |
| Design Flow | 31.24 m3/s |
| Mean Flow | 15.16 m3/s |
Disclaimer/Publisher’s Note: The statements, opinions and data contained in all publications are solely those of the individual author(s) and contributor(s) and not of MDPI and/or the editor(s). MDPI and/or the editor(s) disclaim responsibility for any injury to people or property resulting from any ideas, methods, instructions or products referred to in the content. |
© 2024 by the author. Licensee MDPI, Basel, Switzerland. This article is an open access article distributed under the terms and conditions of the Creative Commons Attribution (CC BY) license (https://creativecommons.org/licenses/by/4.0/).
Share and Cite
Karakoyun, Y. Determination of Effective Parameters for Hydropower Plants’ Energy Generation: A Case Study. Appl. Sci. 2024, 14, 2069. https://doi.org/10.3390/app14052069
Karakoyun Y. Determination of Effective Parameters for Hydropower Plants’ Energy Generation: A Case Study. Applied Sciences. 2024; 14(5):2069. https://doi.org/10.3390/app14052069
Chicago/Turabian StyleKarakoyun, Yakup. 2024. "Determination of Effective Parameters for Hydropower Plants’ Energy Generation: A Case Study" Applied Sciences 14, no. 5: 2069. https://doi.org/10.3390/app14052069
APA StyleKarakoyun, Y. (2024). Determination of Effective Parameters for Hydropower Plants’ Energy Generation: A Case Study. Applied Sciences, 14(5), 2069. https://doi.org/10.3390/app14052069