3.1. FAME Selection
Table 2 reports the value of Hansen and Teas parameters for the FAME shown in
Table 1. The increment in the CH
2 groups within the ester molecule directly associates with an increase in the dispersion solubility parameter (δD) due to heightened van der Waals intermolecular forces. Moreover, distinct structural features intrinsic to different fatty acid esters result in further disparities. Factors such as chain length, levels of unsaturation, and branching exert substantial influence over the overall properties of FAME.
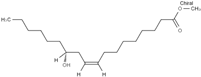
The CCOO group, constituting a minor fraction of the molecule, exhibits a limited dipole moment and minimal capacity to engage in hydrogen bond formation. Consequently, slight variations in the δP and δH values are observable, such as in the comparison between methyl caprylate and methyl linoleate. However, an exception arises with ricinoleate, which contains a hydroxyl group at C-12, resulting in notably higher δP and δH values compared to other esters.
Table 3 displays the relative energy difference (RED) of FAME shown in
Table 2, calculated using white spirit as reference.
As the affinity for the miscibility of the two substances decreases, RED numbers increase. RED = 0 signifies that solvent 1 can replace solvent 2; RED < 1 indicates compatibility between the two solvents; and RED > 1 suggests their incompatibility. Methyl Caproate and Methyl Ricinoleate are incompatible with ligroin and white spirit.
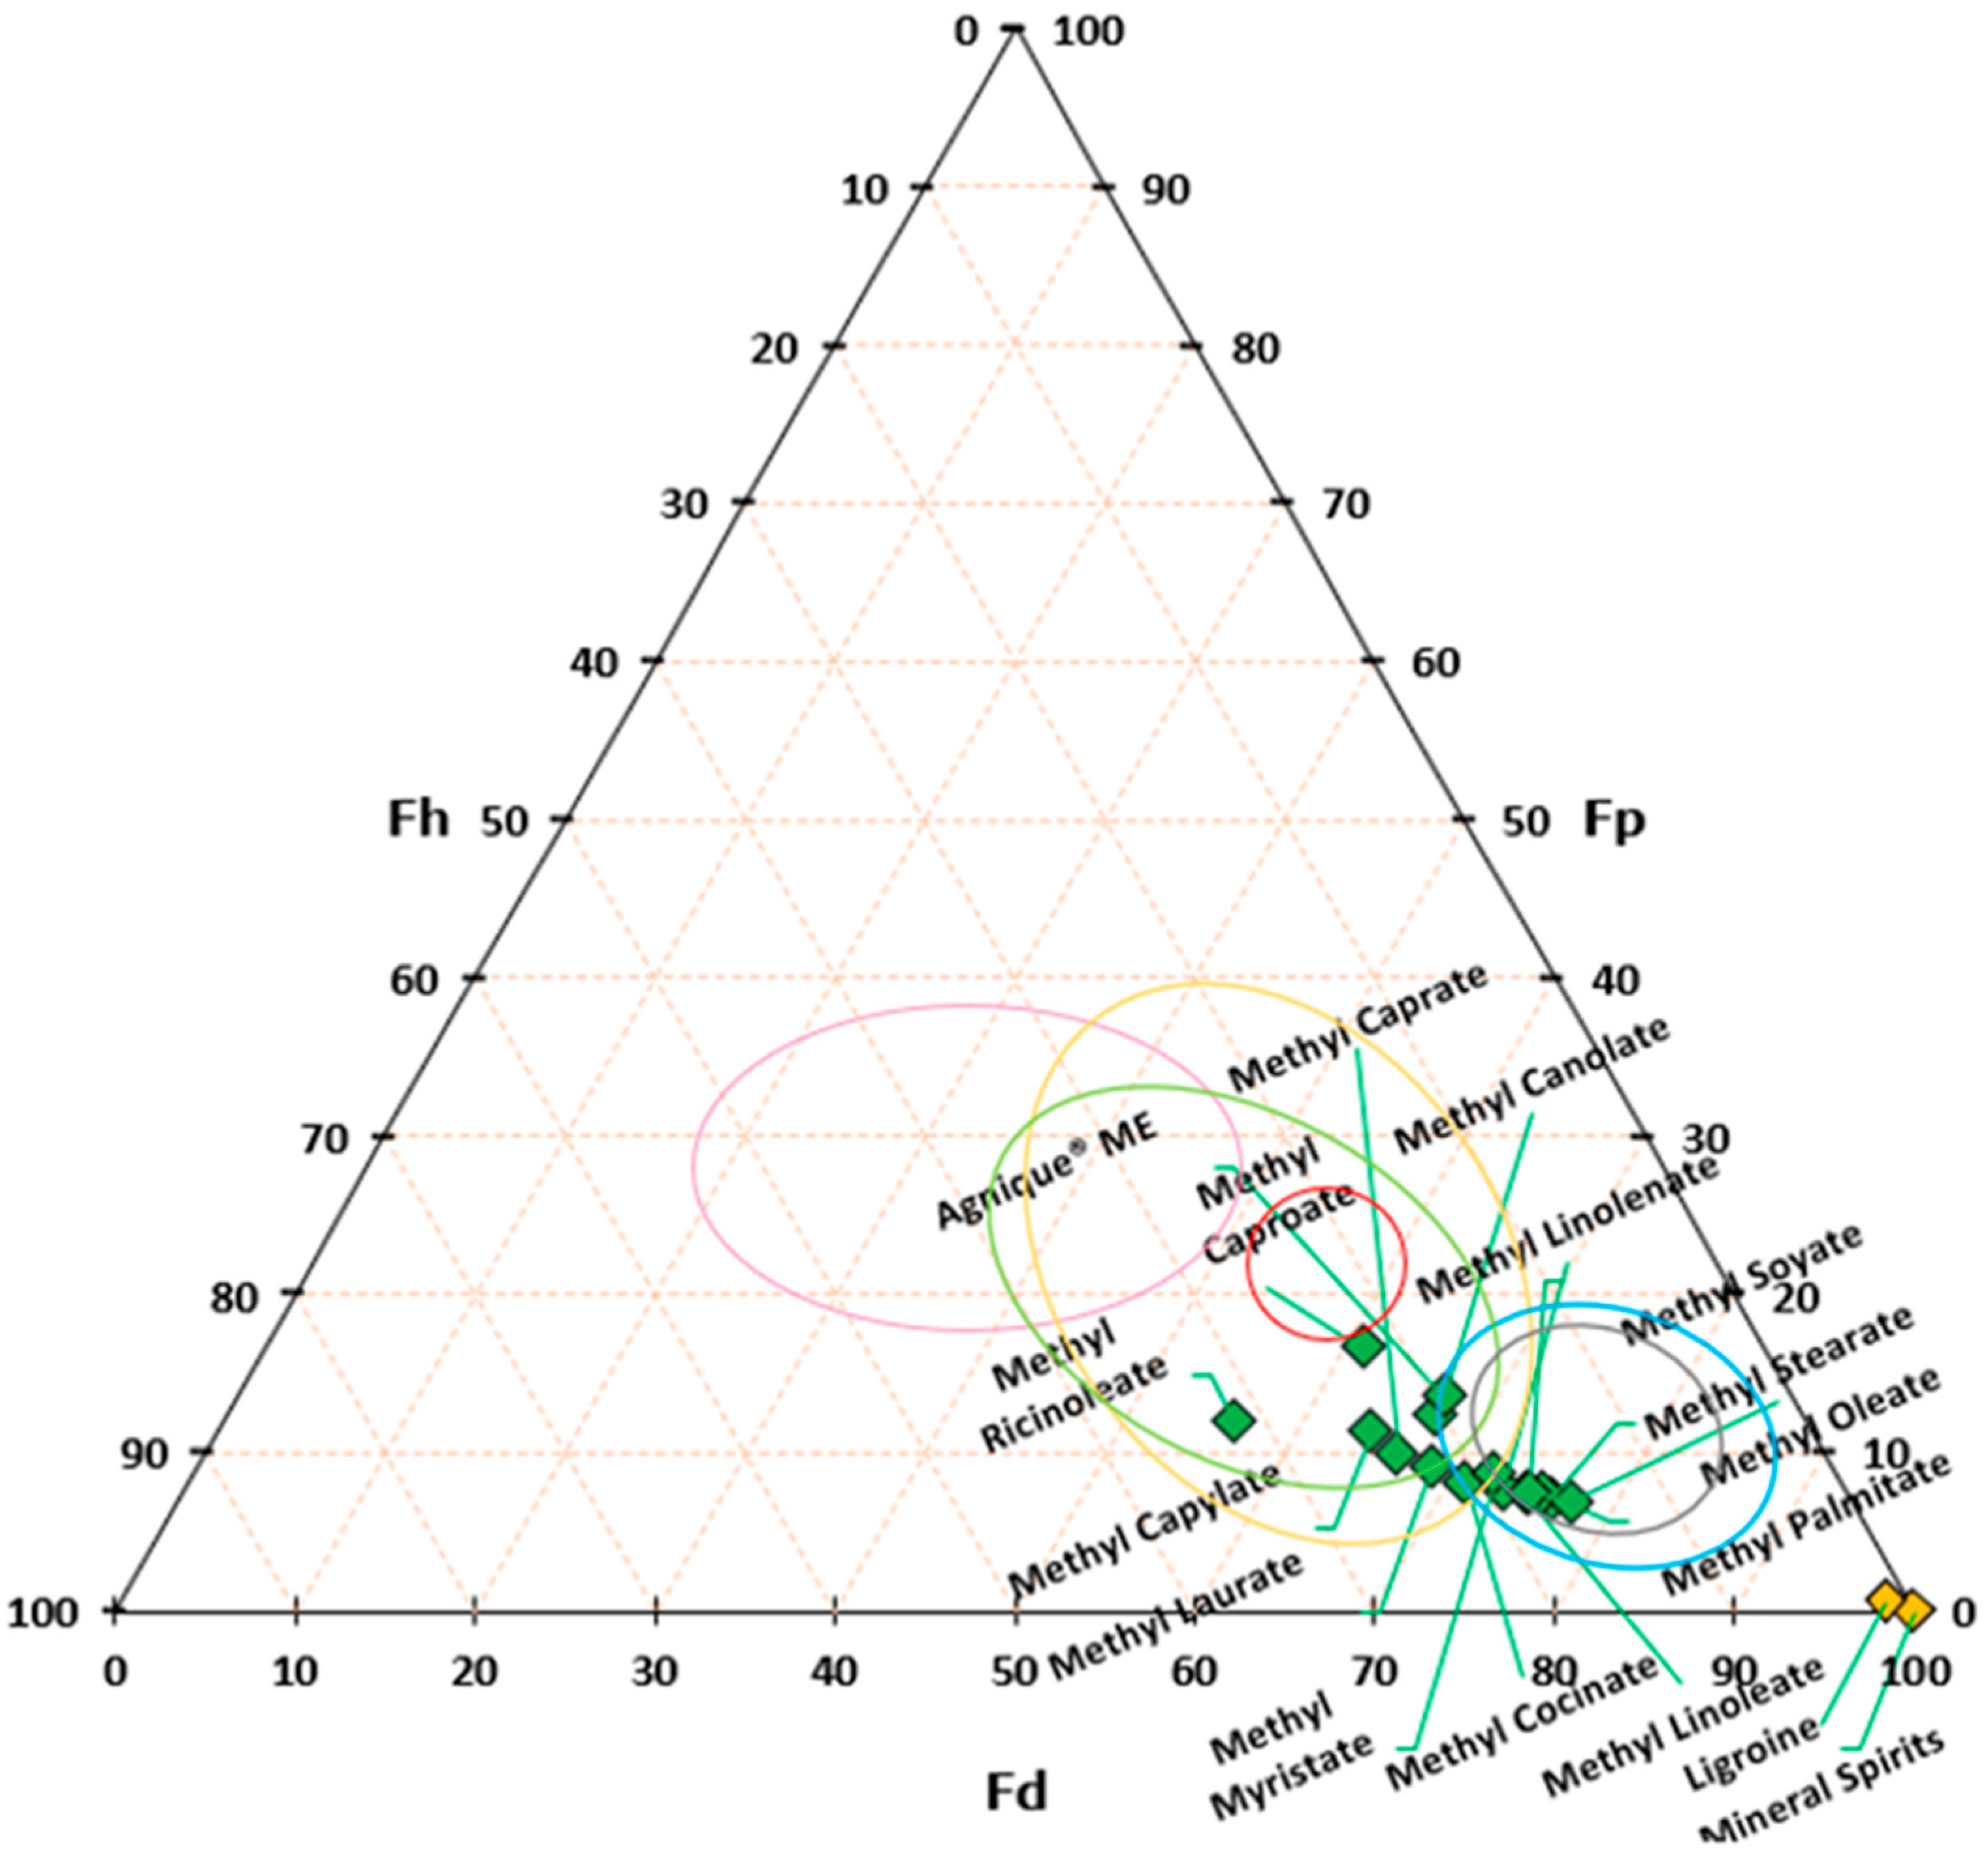
Figure 3 plots the tested solvents on the Teas chart. On the same Teas’ diagram, the area of solubility for different materials used in cultural heritage applications is reported.
For the experiment, we selected FAME readily available in the market based on the RED value; a progressively lower affinity toward white spirit was observed (at a value of 0.1).
Table 4 lists the FAME used in the experimentation and the name assigned to each gel formulation.
3.2. Visible (Vis) and Ultraviolet (UV) Light Imaging
The observations of the painted canvases allow for the definition of different response to the UV-vis imaging. The untreated canvases revealed visible brush strokes. Under ultraviolet light, the oil-painted canvas exhibited a subtle fluorescence indicative of oil aging, as discussed by Cairns et al. [
34], while canvases painted with acrylic showed no fluorescence [
35].
Under visible light, microcrystalline wax displayed an opaque appearance, while Regalrez 1094 varnish exhibited a glossy appearance. In ultraviolet light, neither displayed any fluorescence response, which was attributed to the marker’s presence (Fe
3O
4). All cleaning areas exhibited varnish residues.
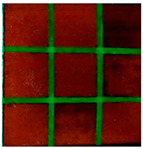
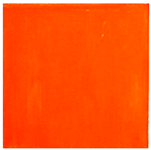
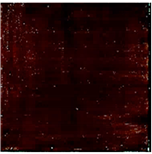
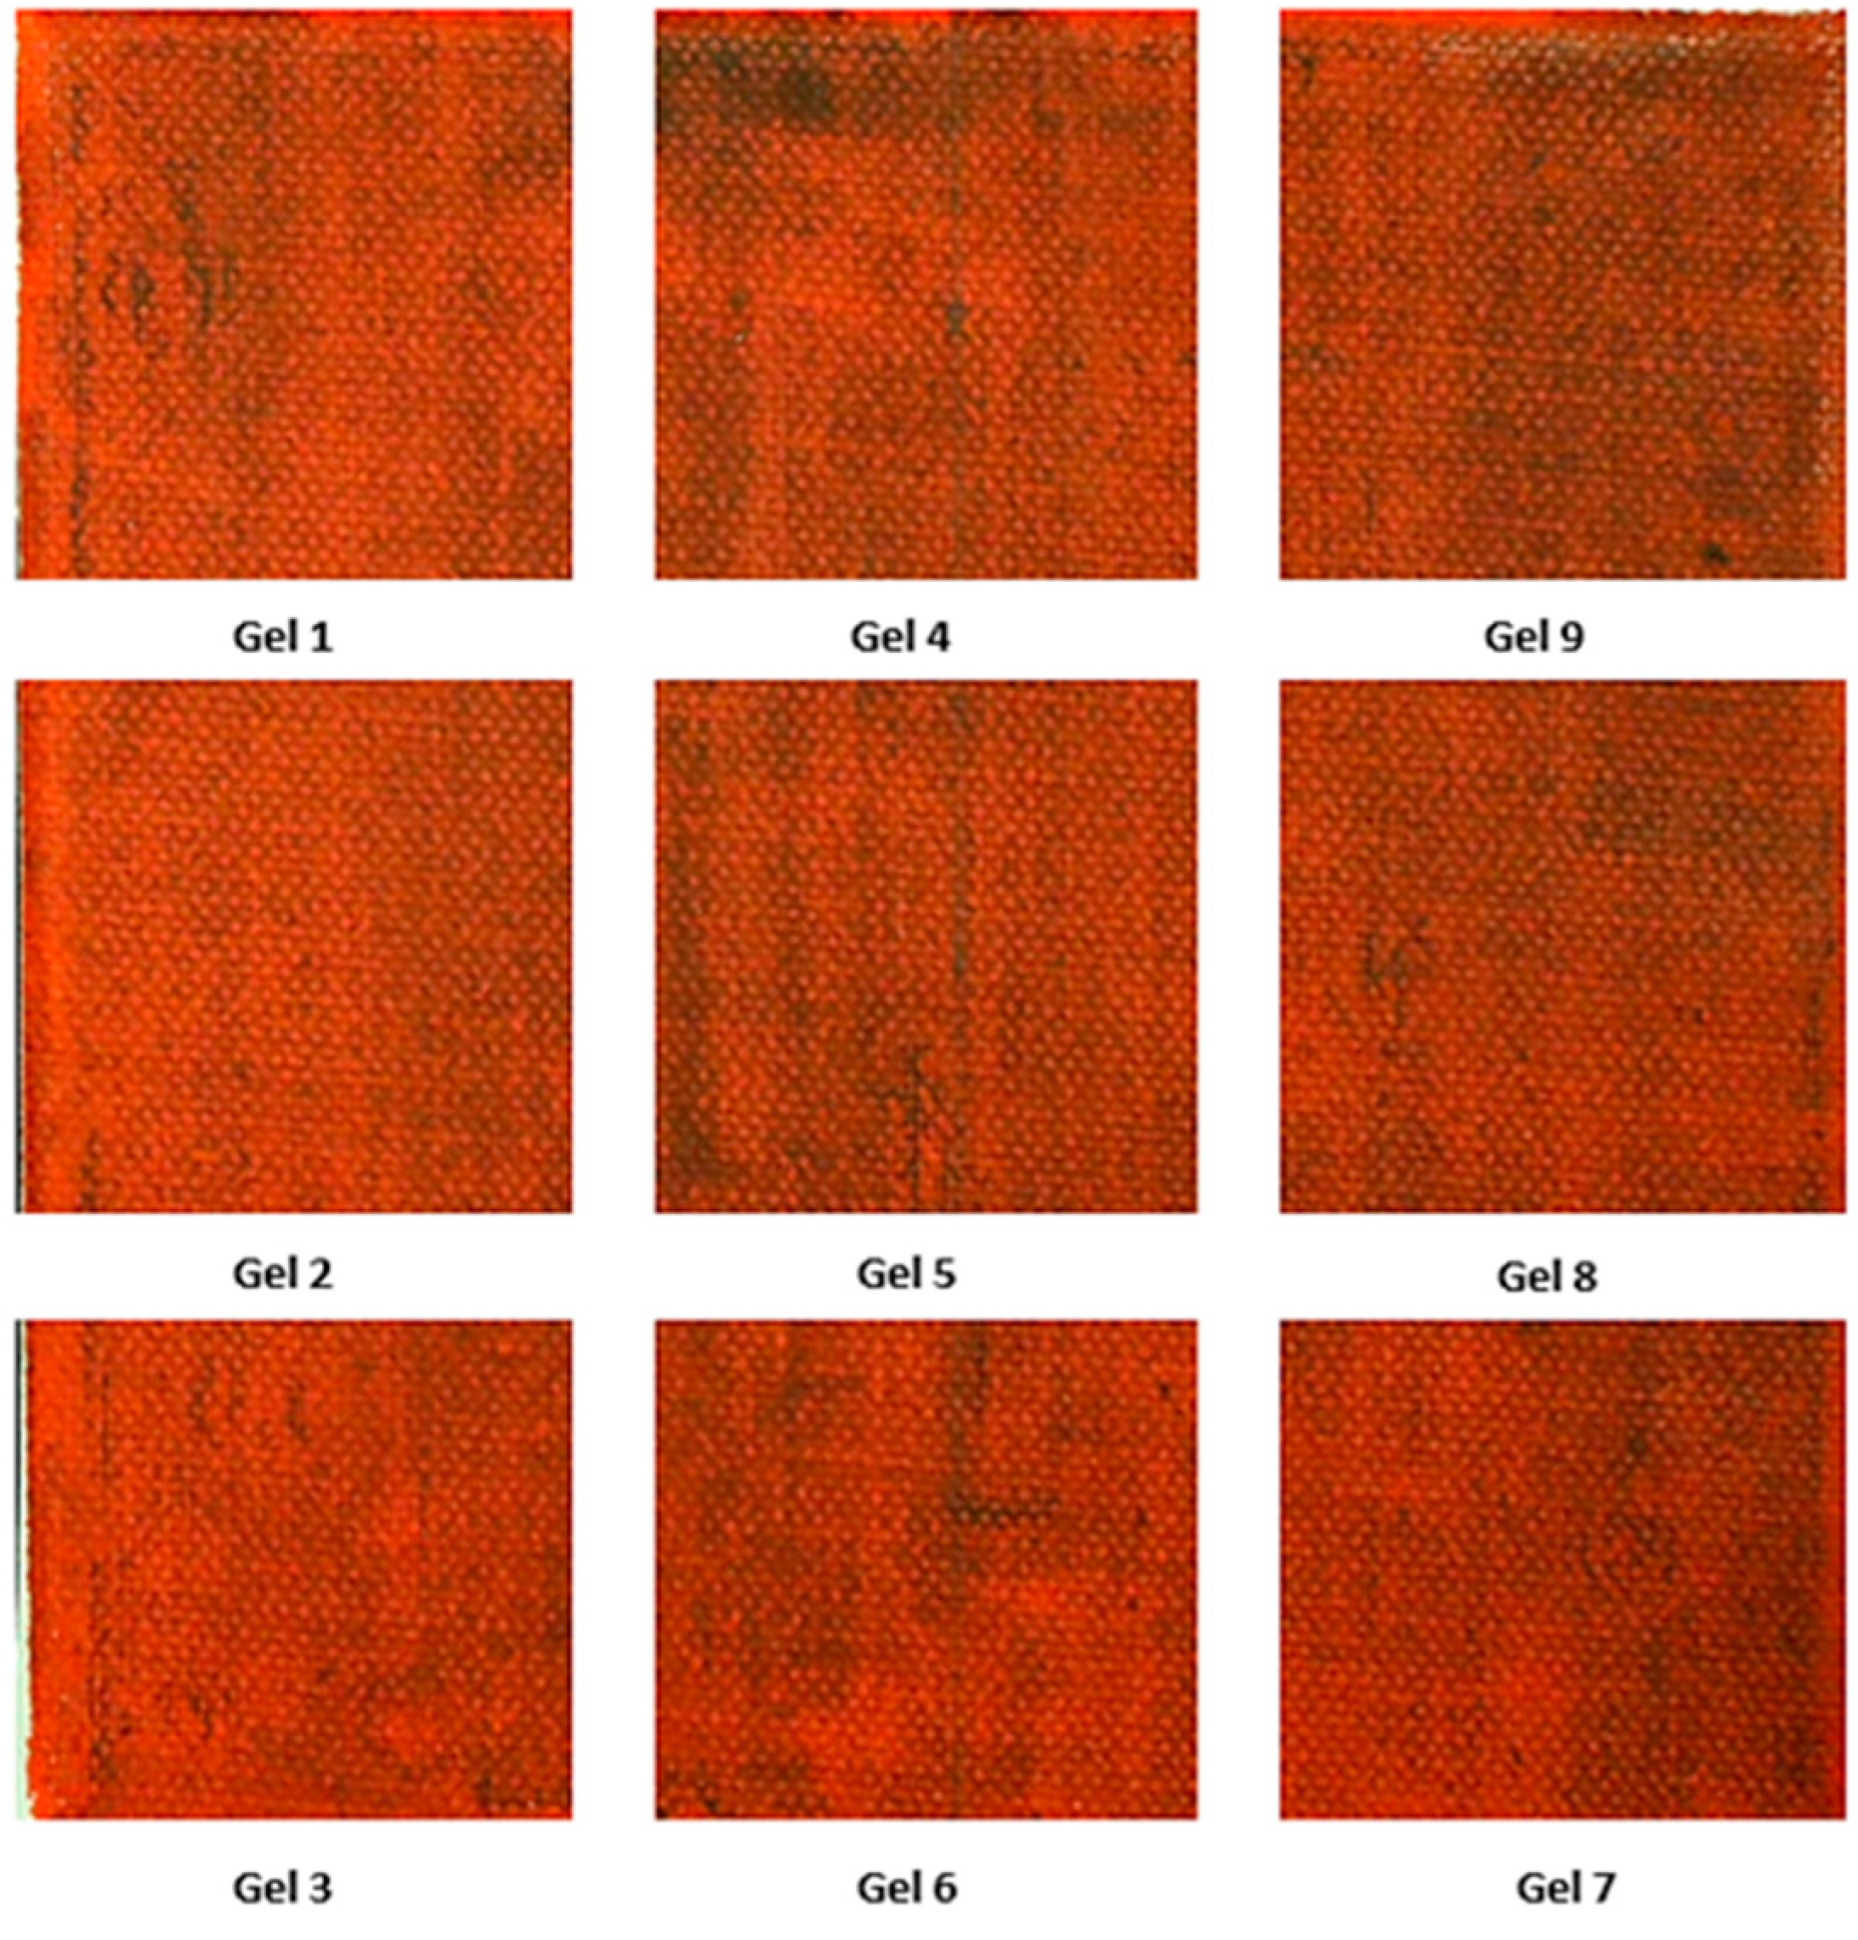
Table 5 presents the images acquired for the oil-based canvases. Gel 3 emerged as the most effective cleaning agent for both microcrystalline wax and Regalrez varnish. It resulted in a level of cleanliness comparable to ligroin for the wax and superior to white spirit for Regalrez 1094.
In the evaluation of acrylic canvases (
Table 6), all tested gels obtained poorer cleaning outcomes in the designated areas. This outcome might be attributed to a potential interaction between the varnishes and the paint layers, influencing the efficacy of the cleaning process.
Figure 4 shows the percentages of residual black aspect after the cleaning treatment for the various treated areas. The images confirm the result obtained with the macroscopical observations, establishing Gel 3 as the most effective treatment. Based on the percentage of black aspect remaining, the following order for the removal of microcrystalline wax on both oil and acrylic paint layers can be established:
Regarding the removal of Regalrez 1094 varnish (
Figure 5), the following order can be established based on the percentage of remaining black substance after cleaning treatment:
3.3. Digital Microscope Observations
Utilizing optical microscopy, the experiment enabled the evaluation of various gels’ cleaning effectiveness and the exploration of potential interactions with the substrate. It is important to highlight that the application of reference solvents in gel formulation resulted in a reduced solvent action compared to their liquid state.
Regarding the oil-painted canvas (
Table 7), observations yielded a solvent power ranking for the removal of microcrystalline wax as follows: Gel 3 > Gel 4 > Gel 1 > Gel 2 > Gel 5 = Gel 6 > Gel 7 > Gel 8 > Gel 9.
For the canvases coated with acrylic layers (
Table 8) and treated with microcrystalline wax, Gel 3 demonstrated the most effective removal of the coating, while Gel 9 showed no efficacy. Visible residues were observed with Gel 5, Gel 1, Gel 6, and Gel 2, whereas Gel 8 and Gel 7 exhibited partial residue removal.
Regarding the acrylic canvases coated with Regalrez 1094 varnish, the established order is as follows:
The application of all the different FAME gels on acrylic surfaces unveiled distinct interaction with the substrate. Conversely, no discernible interactions were noted on the oil-painted surface.
3.4. Spectrocolorimetric Analysis
To evaluate the cleaning effectiveness, spectrocolorimetric analyses were carried out before and after the cleaning test to determine whether the color of the surface had returned to the color measured before cleaning.
Figure 6 reports the total chromatic variation (ΔE). The areas represent zones that are cleaned, partially cleaned, or marked by varnish residues; consequently, the standard deviation associated to the measurements is high and thus not reported.
The data highlight that for all cleaning systems used, the colour values of the cleaned surface and the painted surface differ. This difference is significant for canvases painted with acrylic; for oil-painted canvases, however, some cleaning systems achieve ΔE values < 5, making the differences imperceptible to the human eye [
36].
For the acrylic-painted and wax-finished canvas, the area treated with Gel 3 presents the greatest disparity relative to the coated canvas and the smallest difference compared to the canvas surface covered only with the acrylic paint layer.
The ratio between the ΔE, representing the difference between the dirty surface and the surface of canvas with only the acrylic varnish on ΔE of the surface cleaned with Gel 3 of the acrylic-painted canvas coated with microcrystalline wax, is 0.4. Below is this ratio calculated for other gels:
The lower this ratio, the more the surface appearance is akin to that of the original painted canvas. The most effective cleaning treatments were executed using Methyl Stearate and Methyl Palmitate FAME, which provided superior results compared to ligroin gel.
Upon examining the oil-painted canvas (also coated with microcrystalline wax) and analysing the data through the same ratio, the following order can be defined: Gel 1 = Gel 3 = Gel 4 (v = 0.4) < Gel 2 (v = 0.6) < Gel 5 = Gel 6 (v = 0.7) < Gel 7 (v = 1.1) < Gel 8 (v = 1.3) < Gel 9 (v = 5.3). These data facilitate the superior cleaning capability of all the experimental systems for the oil-painted canvas relative to the same treatment performed on the acrylic-painted canvas. Considering the results obtained in the cleaning of the Regalrez 1094 varnish covering the acrylic paint layer, the relationship between the chromatic variations of the cleaned area with respect to the painted canvas and the chromatic variations relative to the varnish layer defines the following cleaning order:
A greater cleaning effect of the various FAME tested was observed following application of the Regalrez 1094 varnish over the oil paint layer. All the tested Gels present a v ratio < 0.3, apart from Gel 6 and Gel 9.
3.5. FTIR-ATR
The main peaks in the FTIR spectra of the painting sample surfaces are listed in
Table 9. C–H stretching vibrations of the –CH
3 and –CH
2 groups were located in the 2950–2800 cm
–1 area. The C=O double bond stretching vibration of carbonyl groups was present around 1745 cm
–1. The peaks in the 1470–1200 cm
–1 area are associated with the CH bending of CH
2 and CH
3. Due to CH
2 rocking vibration and C–O ester group stretching vibration, the fingerprint region was located between 1250 and 700 cm
–1.
The FTIR spectra (
Figure 7) acquired from Methyl caprate, Methyl laurate, Methyl myristate, and Methyl oleate show the same characteristic peaks at 2921, 2852, 1458, 1434, 1358, 1239, 1195, 1169, 1009, 719, 711, and 700 cm
−1. Similarly, the Methyl palmitate, Methyl stearate, and Agnique ME have peaks at 2951, 2914, and 2847 cm
−1, albeit with different intensity to the first, while in the Methyl stearate the peak at 1741 cm
−1 was not present. Methyl stearate and Agnique ME have peaks at 1471, 1462, 1343, 1279, 1241, 1446, 1109, 1059, 1023, 964, 839, 731, and 718 cm
−1. Methyl palmitate was instead characterized by numerous peaks in the region between 1500 and 1000 cm
−1; specifically, the peaks were at 1472, 1462, 1434, 1381, 1309, 1286, 1264, 1241, 1219, 1196, 1167, 1099, 883, 729, and 719 cm
−1.
Regarding the coatings, some variation in the IR spectrum after the aging process was observed only for Regalrez 1094. In particular, the aged Regalrez spectrum is characterized by increasing absorption of the hydroxyl region between 3650 and 3050 cm
−1, suggesting the formation of new O–H bonds. Furthermore, a new absorption band appears at 1712 cm
−1 with the appearance of new C=O bonds. Additionally, there is a slight increase in absorption at 1200 cm
−1, indicating the appearance of C–O bonds. These structural changes suggest that upon irradiation, the hydrogenated hydrocarbon resin undergoes photo-oxidation with the generation of new oxidation products. There is an observable decrease in absorption for the C–H stretching and bending regions, 3000–2750 cm
−1 and 1500–1400cm
−1, respectively. It is uncertain exactly why these bands decrease so much in intensity, but it could be related to photo-oxidation of the material [
37].
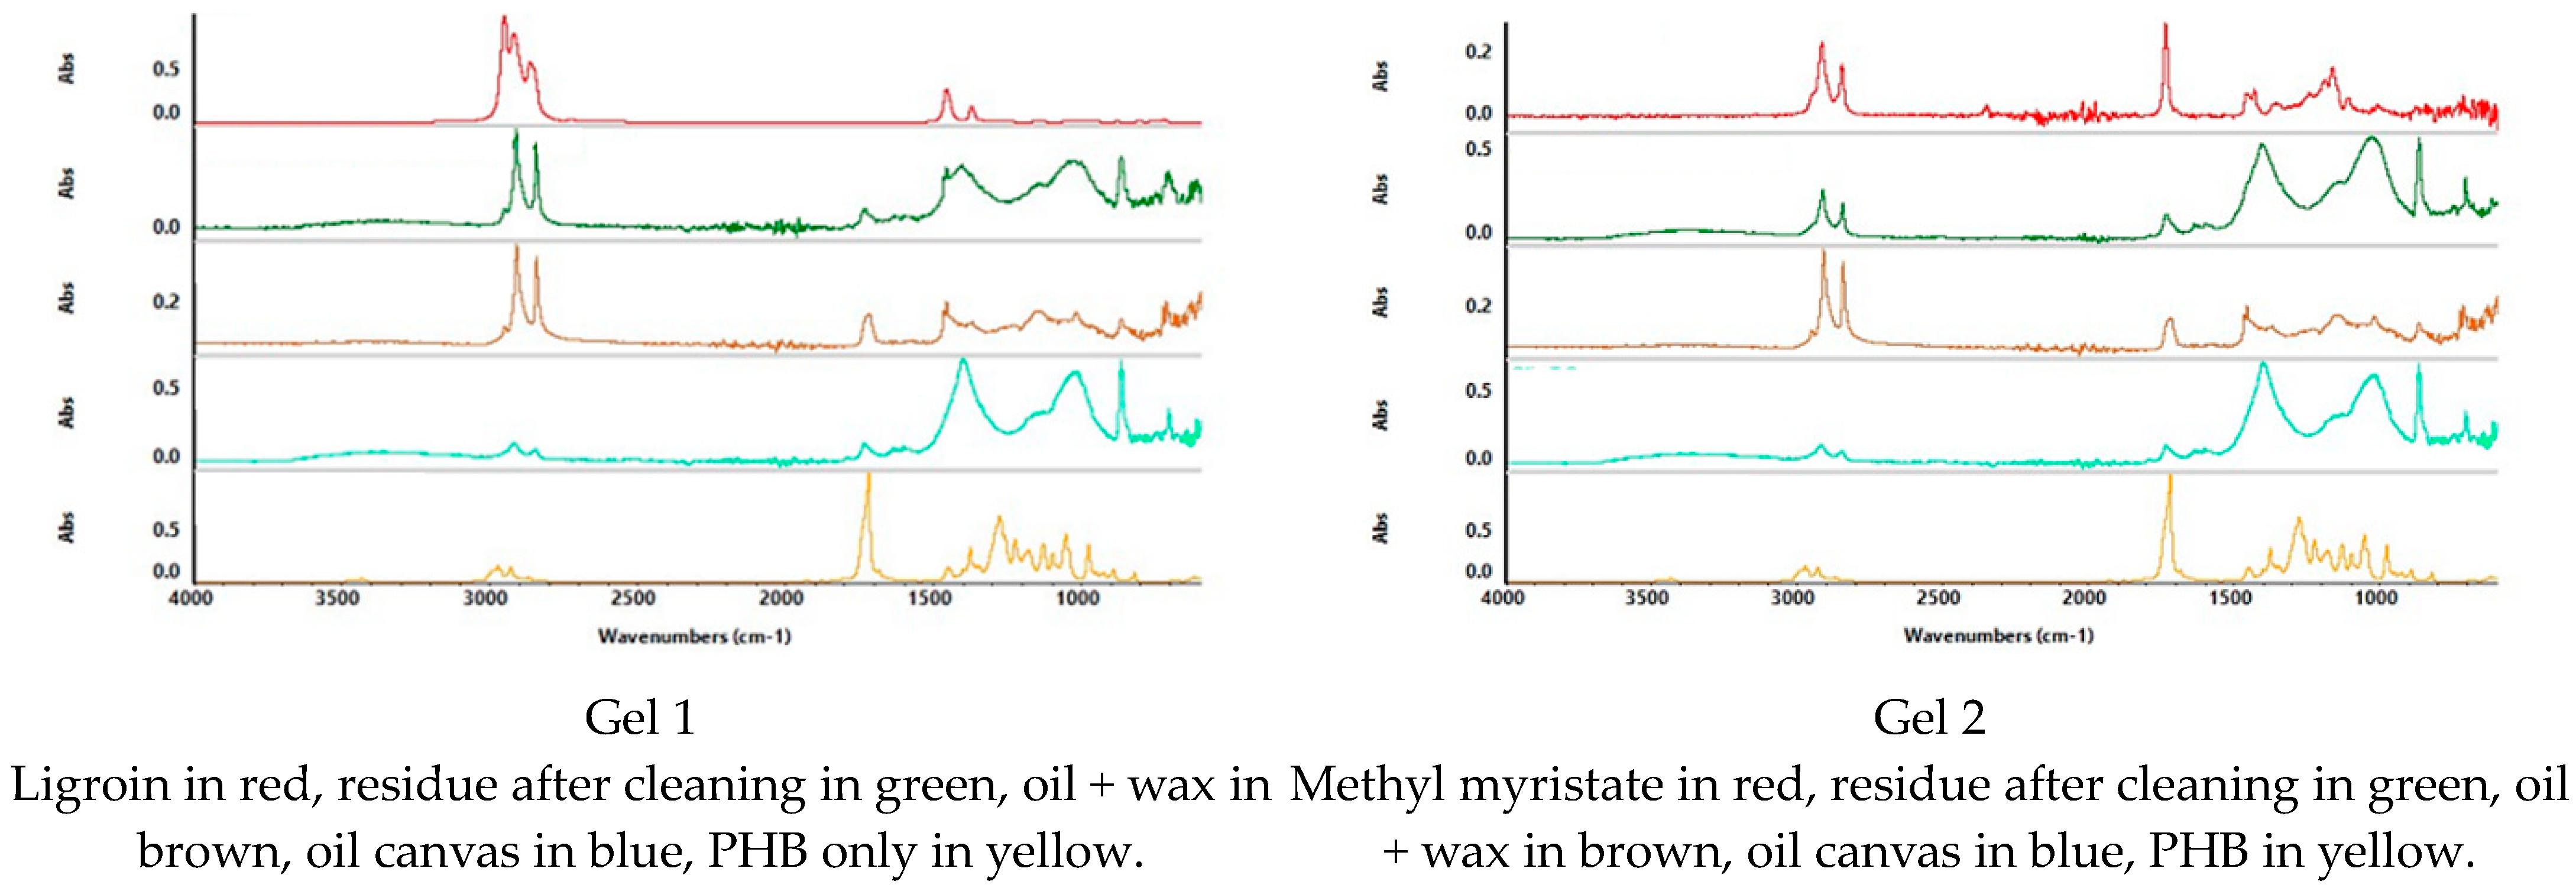
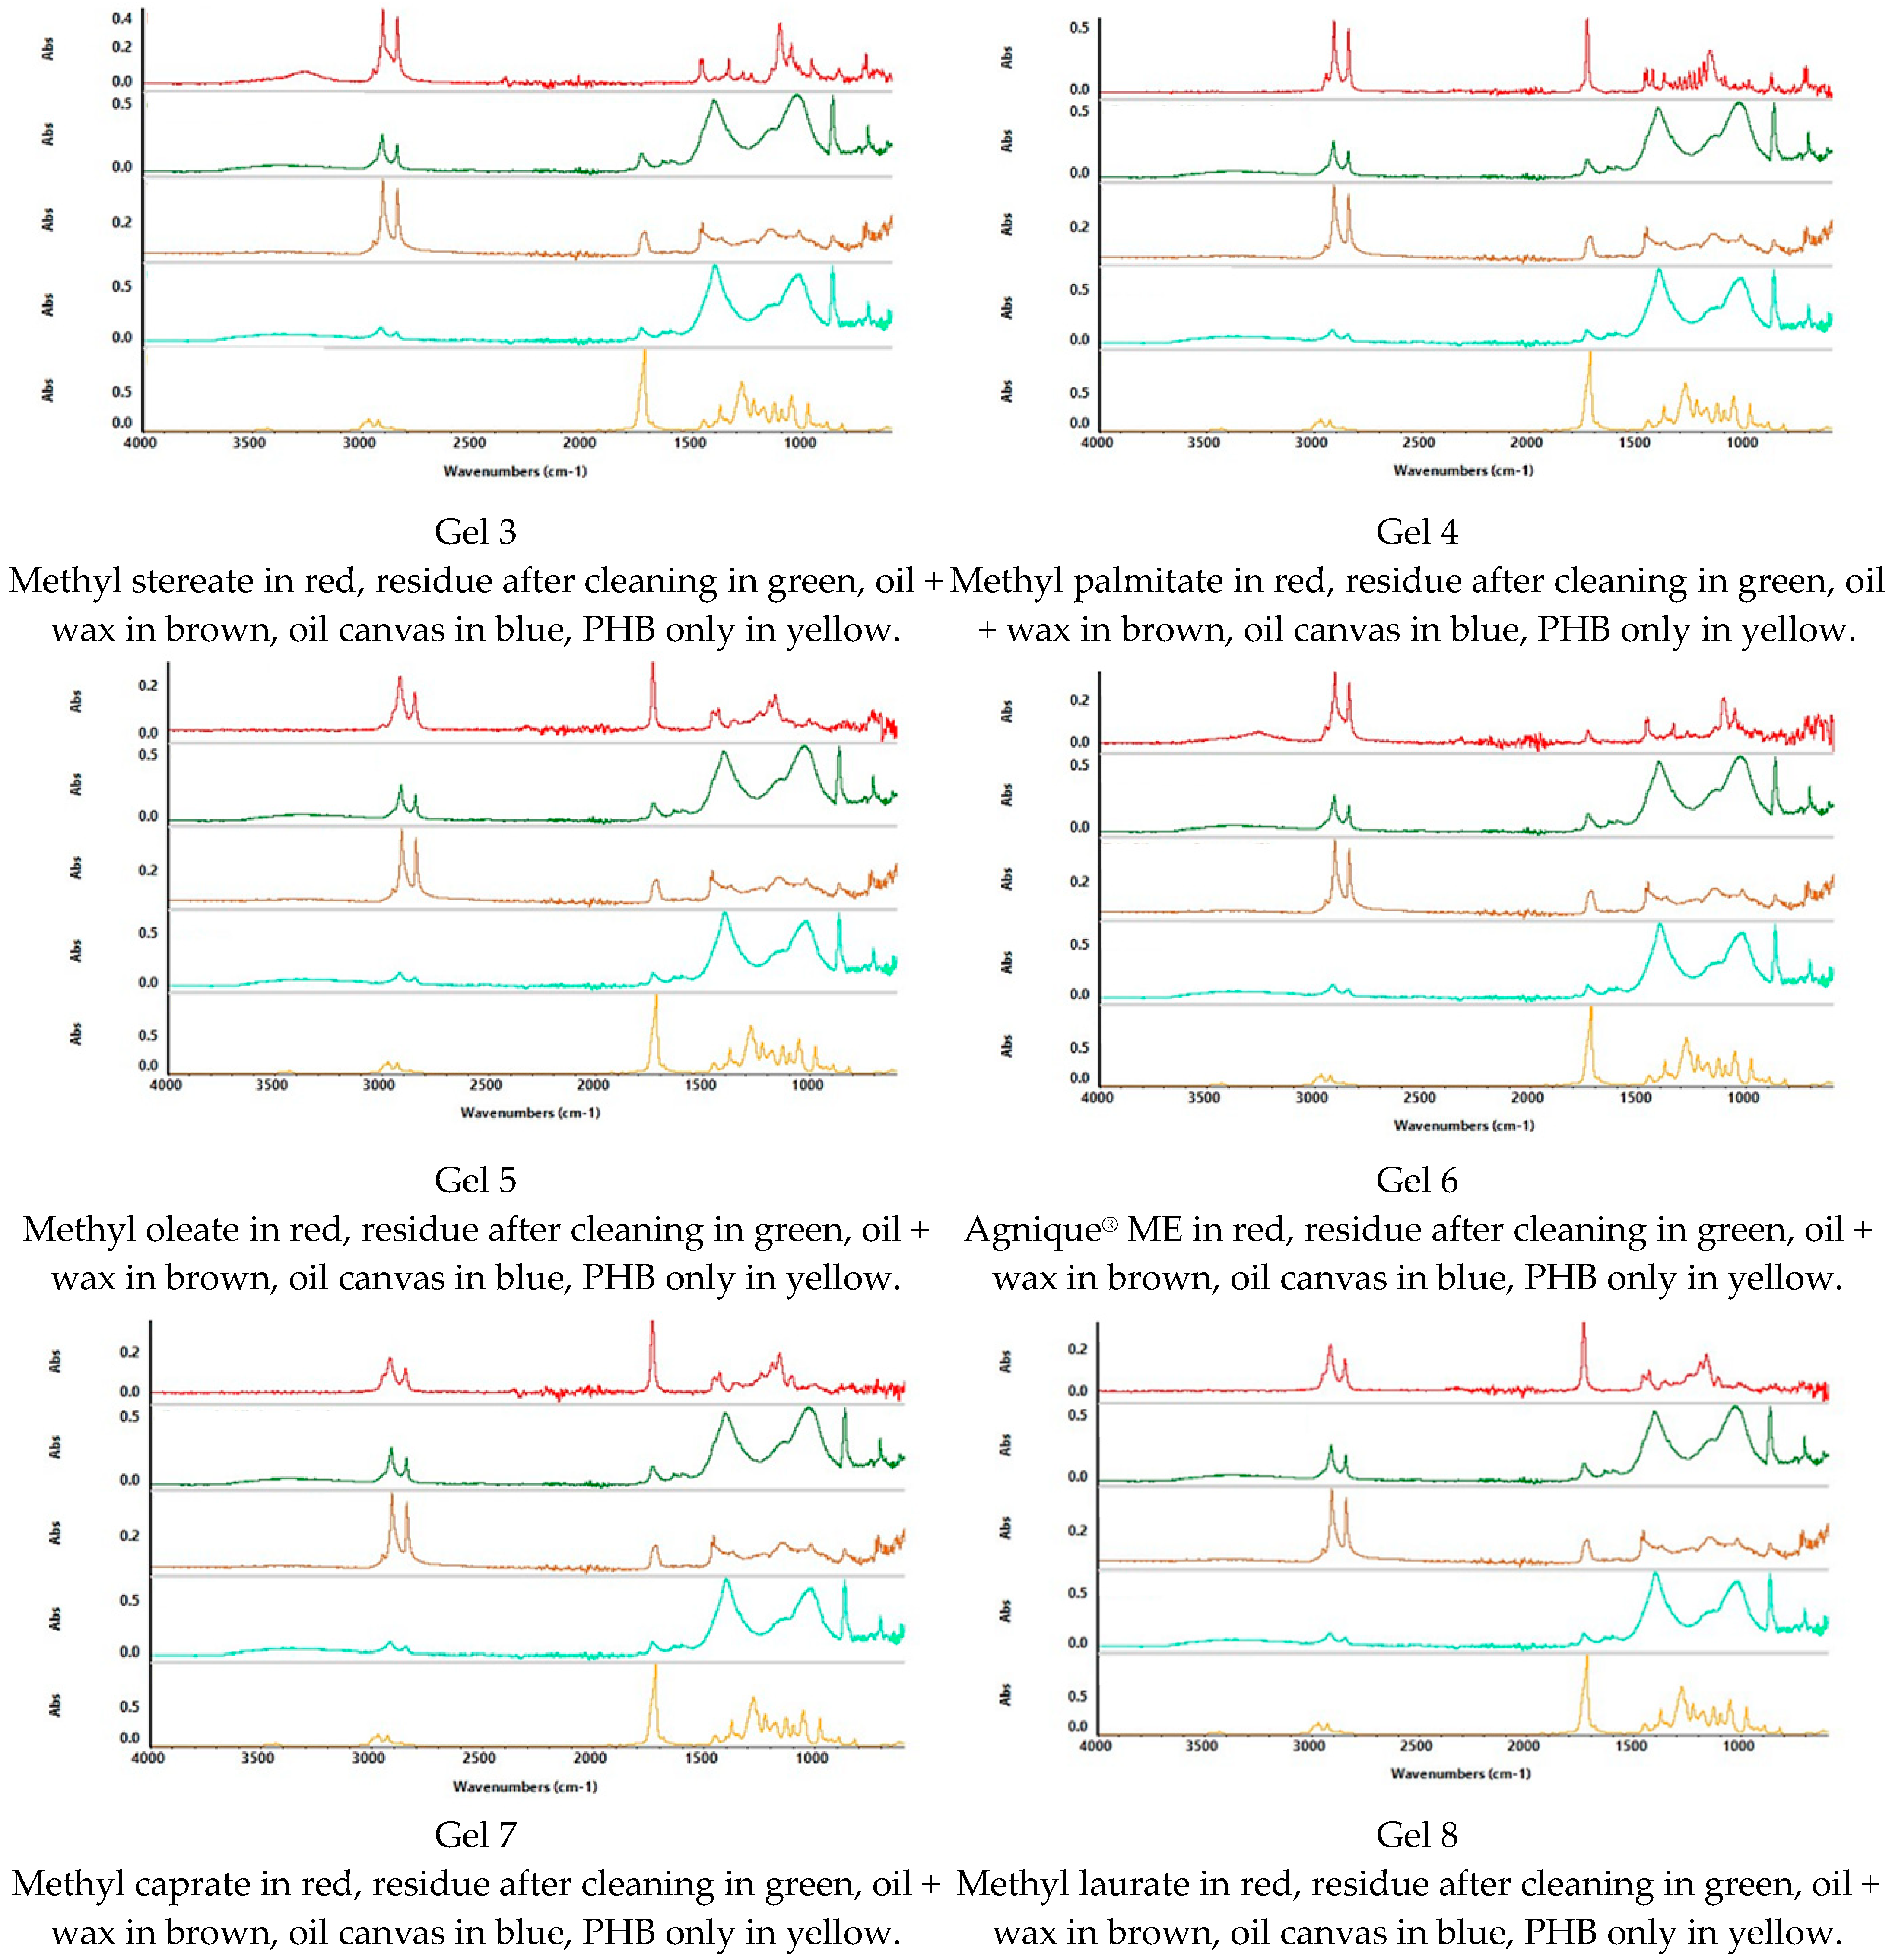
To define the presence of residue of FAME gels, spectra were acquired on the cleaned canvases; on the coated canvases, on the canvases after the cleaning treatment, and on the spectra of all the solvents and the polymer used for the formulation of the gels (PHB) (
Figure 8,
Figure 9,
Figure 10 and
Figure 11).
Considering the overlap of the same peaks relative to functional groups present in all the substances, to define FAME gel residues, more consideration was given to the “Fingerprint” region. This region represents peculiar characteristics of the substance, while the other regions of the spectra are related to functional groups that may be present in different kinds of molecules; in this study, this was the case for the non-polar coating and the FAME. To evaluate the presence of the polymer PHB, the peaks at 1280 cm−1 and 1057 cm−1 were searched in the spectrum acquired on the canvas after the cleaning treatment. For the FAME, specific peaks were taken into consideration.
For example, the spectra acquired on the canvas prepared with an acrylic layer coated with Regalrez 1094 varnish and treated with Gel 3 show no presence of the PHB peaks (1280–1057 cm−1) nor the FAME (Methyl stearate, in this case) peak at 1239 cm−1. The peaks at 2917–2848 cm−1 in the spectrum collected after the cleaning treatment, were attributed to the presence of some residue of Regalrez 1094 on the painted canvas.
The collected spectra after the cleaning are characterized by the presence of some residues of the Regalrez 1094 varnish or microcrystalline wax on the surface, defined by the following peaks: 2916–2848 cm−1 for the microcrystalline wax and 2917–2848 cm−1 for the Regalrez 1094 varnish.
However, for all the different cleaning treatments, no peaks related to gel or FAME were found.


 ,
, 


