Article

Toughness of Natural Hydraulic Lime Fibre-Reinforced Mortars for Masonry Strengthening Overlay Systems

by
João A. P. P. Almeida
*,
Joaquim A. O. Barros
and
Eduardo N. B. Pereira
*
Institute for Sustainability and Innovation in Structural Engineering (ISISE), Institute of Science and Innovation for Bio-Sustainability (IB-S), Department of Civil Engineering, University of Minho, 4800-058 Guimarães, Portugal
*
Authors to whom correspondence should be addressed.
Appl. Sci. 2024, 14(5), 1947; https://doi.org/10.3390/app14051947
Submission received: 15 January 2024 / Revised: 20 February 2024 / Accepted: 23 February 2024 / Published: 27 February 2024
(This article belongs to the Special Issue Advances in Cement-Based Materials)

Abstract

:
Masonry structures are susceptible to damage and collapse due to seismic actions, a problem in many urban areas. To address this issue, researchers are studying the use of fibre-reinforced mortars as overlay strengthening systems. This study assessed the use of synthetic polyacrylonitrile (PAN) fibres as reinforcement of natural hydraulic lime mortar, focusing on their influence on fresh behaviour and mechanical properties. Natural hydraulic lime (NHL) was chosen for its compatibility with typical older ceramic and natural stone structural masonry and contemporary ceramic brick infill masonry substrates, as well as for the sustainability benefits. The study also assessed the contribution of the PAN fibres to toughness enhancement in the developed formulations. The fresh behaviour of fibre-reinforced mortar (FRM) was found to be adequate for applications with fibre volume fractions below 0.50%. The compressive and flexural strengths were affected differently by the increase in fibre volume fraction, with compressive strength decreasing and flexural strength increasing. The maximum compressive strength of 13.3 MPa was obtained for 0.25% of fibres, while for flexural strength a maximum of 6.70 MPa was achieved with 1.00% of fibres. The compressive and flexural toughness, related to the post-cracking responses, increased with the fibre fraction, and even for fractions as low as 0.25%, an important increment of the capacity to dissipate energy was achieved.

1. Introduction

The effect of seismic actions on masonry structures is problematic in a significant number of worldwide urban areas. The devastating effects of these actions are highlighted by several authors for the cases of infill and structural masonry [1,2,3].
The development and characterization of masonry overlay strengthening systems based on the use of composite materials has been recently showing promising results. Depending on the type of matrix, these composite materials can be divided into two main groups; cementitious [4,5,6,7,8] and polymeric [9]. Both show clear advantages when applied to infill and structural masonry elements that are vulnerable to seismic actions. Their main contributions are the increase in the load carrying capacity and energy dissipation ability, without significantly altering their original mass. Additionally, the strengthened elements develop a much higher ultimate deformation and residual strength [10,11,12,13]. Consequently, after reinforcement, masonry elements are better prepared for supporting extreme events without brittle failure occurrence. This is particularly important when working with older buildings, mostly composed by sound ceramic brick or natural stone masonry elements but also when dealing with more recent infill ceramic brick masonry.
The improvement in the properties of mortars by means of the addition of natural fibres is well known and has been employed empirically for centuries [14]. Recently, various fibre-reinforced mortars (FRMs) have been developed by adding natural [15,16,17,18] or man-made fibres, showing very attractive mechanical properties [19,20,21]. These FRMs can be used to upgrade the in-plane and the out-of-plane loading and deformation capacity of the original elements. Additionally, when used as external overlays they constitute a protection system to the reinforced walls from weathering agents. However, the FRMs developed in the recent past were frequently composed of Portland cement binder, which has been shown to lead to compatibility problems with old masonry elements, namely by the crystallization of salts that damage natural stone. Additionally, the low flexibility of the Portland cement-based mortars may cause structural problems in older ceramic brick or natural stone masonry when the building is subject to movements [22], and delamination of the strengthening layers in the case of infill masonry [11]. The use of natural hydraulic lime (NHL) binders are believed to show better compatibility with masonry in terms of strength and hygroscopic behaviour [23,24,25,26]. Furthermore, the choice for NHL mortars was found to be more sustainable when compared to the use of Portland cement (CEM) [27].
The flexural strength (ft,fl) vs. compressive strength (fc) correspondence of FRMs developed recently, composed of different types of binders and fibres, is shown in Figure 1. The mechanical performance of the mortars can be clearly divided into two groups. The first group, labelled as “Geopolymer and CEM-FRM”, is composed mainly of Portland cement or Geopolymer (Geo)-based mortars that show compressive and flexural strengths higher than 20 and 5 MPa, respectively [28,29,30,31,32,33]. The second group, “Lime and NHL-FRM”, integrates mainly fibre-reinforced lime mortars (NHL-FRM), showing lower mechanical properties [34,35,36,37,38,39,40,41]. Desirably, the mechanical properties of the FRM should not be much different from the substrates, especially the elastic modulus and the compressive strength [4]. The area marked and identified as “target values” in Figure 1 represents the desirable range of mechanical properties of FRM when applied as strengthening overlay of infill or structural masonry elements. The compressive strength values were determined based in previous research developed by Almeida et al. [11,42] and research from other authors that characterised the mechanical behaviour of a broad range of masonry [43,44].
Considering the literature review and the current state of knowledge, this research is particularly devoted to investigating the mechanical properties of lime-based mortars with suitable properties for masonry strengthening as overlays. Additionally, this research also deals with the characterization of these materials with a view on their application as strengthening overlays in masonry, in particular the fracture properties that may support their selection and design, considering specific application requirements.

Research Significance

This study was aimed at developing NHL based composite systems for masonry strengthening overlays. To maximise the post-cracking properties and maintaining a competitive cost/performance and cost/durability indicators, a type of synthetic polyacrylonitrile (PAN) fibre commonly used to avoid cracking in floor screed and shotcrete, was adopted for the reinforcement of the mortars, and its behaviour was tested. Several authors have studied NHL-FRM’s [36,37,38,39,40,41]; however, these studies were mostly focussed on low-compressive-strength mortars (fc < 10 MPa), used for the rehabilitation of heritage buildings. In contrast, this work targets the development of an FRM envisioned as part of a masonry strengthening overlay system that can be applied to both older masonry buildings and infill masonry, with slightly higher compressive strength (10 < fc < 15 MPa). To achieve the required strength at early age, a small percentage of cement CEM 52.5 was included, 10% of the NHL in weight.
Considering the importance of the post-cracking behaviour on the overall strengthening efficiency, particular attention was dedicated to quantitatively assess toughness and fracture energy enhancement for different fibre fractions. The fresh behaviour and the hardened mechanical properties of the developed NHL mortars were assessed in terms of ductility, toughness, and fracture energy for different levels of fibre reinforcement, with a view on strengthening applications.

2. Materials and Methods
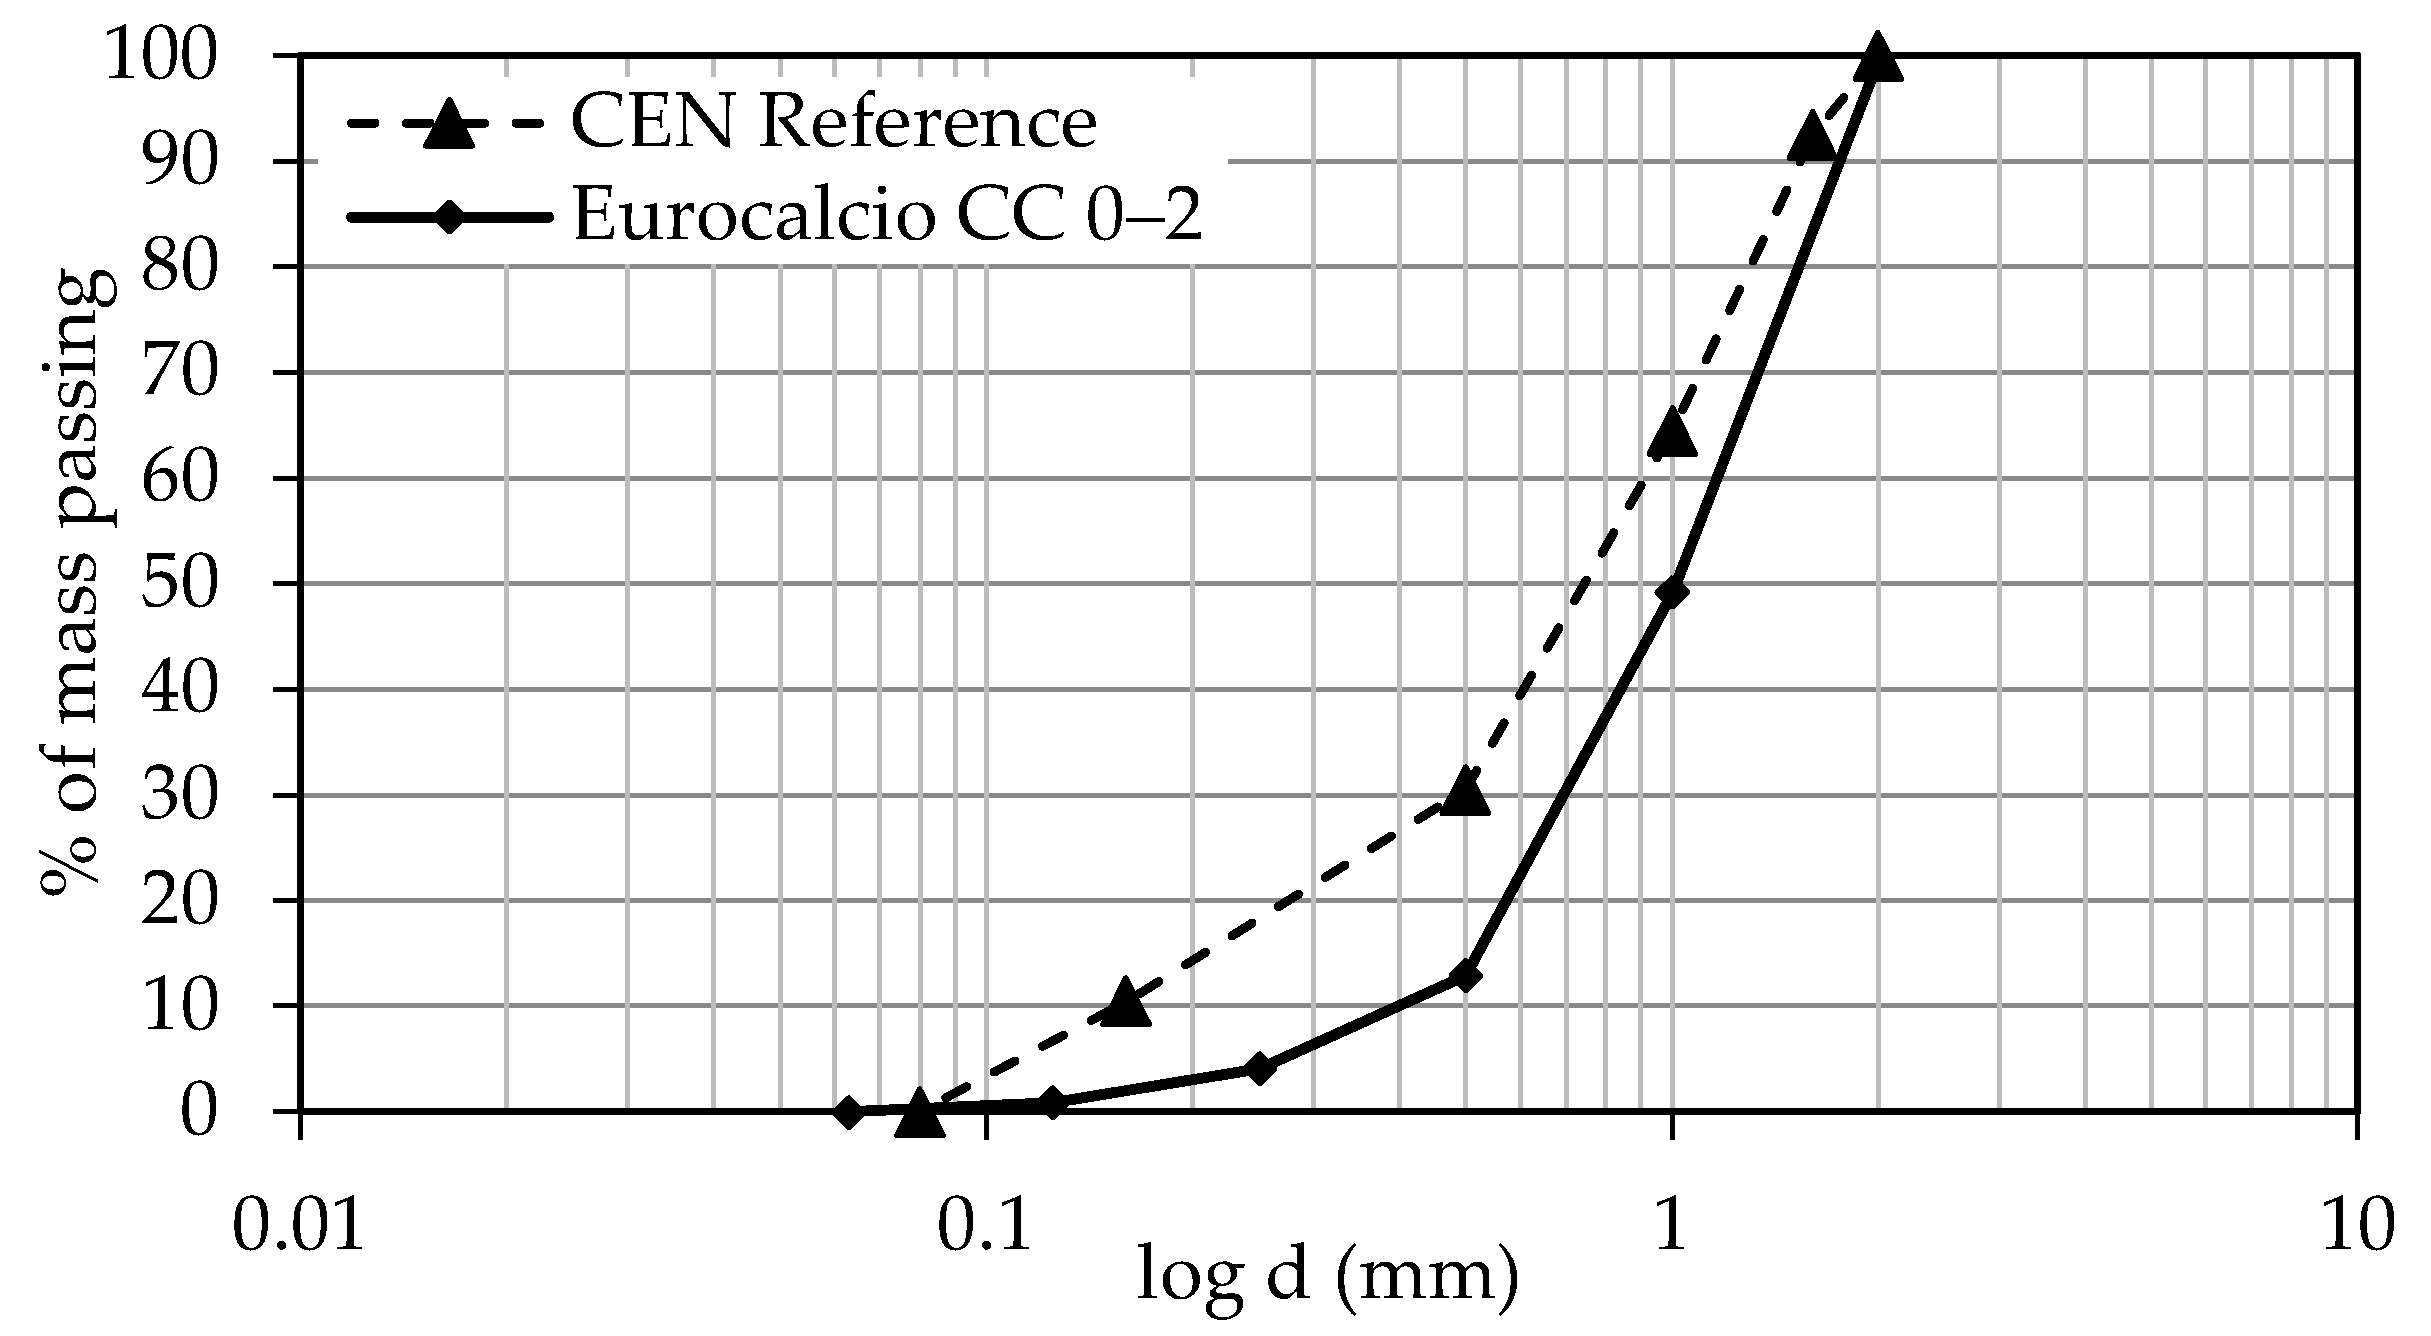
The stiffening effect of PAN fibres on an NHL matrix was studied by adding different amounts of fibres to a matrix composed of NHL, white Portland cement in small dosages, and limestone aggregates. Fresh and hardened properties of the resulting FRMs were characterized for different fibre fractions; the details of this experimental program are given in the next section. In brief, while in the fresh state, workability was characterized using flow table tests, following the procedures indicated in EN 1015-3 [45], the air content was obtained using the pressure method and the density was obtained by means of the fresh density method following EN 1015-7 [46]. In the hardened state, the dry bulk density, the compressive strength and elastic modulus, and the flexural strength were char 28 days after mixing. Additionally, the evolution of the density and of the flexural strength were obtained at 7 and 90 days after mixing.

2.1. Materials

The materials used in this study are commercially available and were supplied directly by the producers. The natural hydraulic lime classified as NHL 5.0 according to the EN 459-1 [47] was supplied by SECIL (Macieira—Portugal); see Table 1. The white Portland cement classified as CEM II/A-L 52.5 N (br.) according to EN 197-1 [48] was supplied by SECIL (Pataias, Portugal), composed of 80% to 94% of Portland clinker, 6 to 20% of limestone and 0 to 5% of other ingredients. The limestone crushed sand aggregate was supplied by Eurocálcio (Leiria, Portugal), and the corresponding grading curve is represented in Figure 2. according to EN 13139 [49] the sand is classified as 0/2 mm. For comparison, the CEN Reference sand curve according to EN 196-1:2016 [50] is also shown.
The PAN fibres were supplied by SGL Carbon (Barreiro, Portugal) and their properties are summarized in Table 2. In the field of Civil Engineering, this type of PAN fibre is mainly used in dry mixed mortars, shotcrete and concrete, presenting a good chemical resistance, and according to the manufacturer it allows the exposure to temperatures not exceeding 220 °C during short periods.

2.2. Mixing Process and Fresh State

In a previous stage, the optimal water/binder and aggregate/binder ratios were obtained by changing the amount of water until a good workability was obtained for the application as a strengthening overlay. Subsequently, mixtures were formulated with consistent water to binder and aggregate to binder ratios, 0.45 and 1.5, respectively, as outlined in Table 3, illustrating the composition for 1 m3 of mortar. Variation in the fibre content was the primary focus for designing these mixtures. While preserving the established ratios, this approach ensured continuity in the fundamental proportions critical for this study.
The mixing process followed the procedure presented in Figure 3. First, the dry components were added, namely the binders, NHL 5.0 and CEM Br., and the aggregates. After mixing for 30 s, water was added and the mortar was mixed again for 120 s. After mixing the mortar, the PAN fibres were added to obtain the FRM by mixing for 180 s more, until a homogeneous mixture was obtained. Thirty seconds later, the fresh state characterization tests were carried out.
The flow table test was carried out according to EN 1015-3 [45] and the resulting value was obtained by averaging the diameter measured in two perpendicular directions of the spread sample of fresh mortar, which had been placed on a table disc with the help of a cone with dimensions specified in EN 1015-3 [45]; see Figure 4a. Then, 15 vertical impacts were applied by raising the flow table and allowing it to fall freely through a height of 10 mm.
The air content of the fresh mixtures was obtained following EN 1015-7 [46]. Accordingly, a sample of each fresh mixture was placed inside the measuring container; see Figure 4b. After closing the apparatus, water was introduced on the top of the mortar surface, and immediately after, air pressure was applied by forcing the water into the mortar and displacing all the air from within pores. The change in the water level was measured as an indication of the volume of air displaced into the fresh mixture.

2.3. Hardened State

The dry bulk density of the hardened mixtures was determined following EN 1015-10 [51] and expressed as the ratio between its mass in dried condition and the occupied volume.
The compressive behaviour of the hardened mixtures was evaluated by means of compressive and elastic modulus tests using cylinders with a diameter of 60 mm and a height of 120 mm, following EN 12390 [52]. A servo-hydraulic actuator was used with 100 kN of maximum force, with a feedback controller, and a load cell of 200 kN maximum capacity, as shown in Figure 5a,b. For failure tests, a monotonically increasing compressive displacement was imposed to the cylinder specimens at a rate of 0.01 mm/s. For the elastic modulus characterization, a cyclic load was imposed to the cylinders at a rate of 1.75 kN/s. Displacements were acquired by 3 LVDT with 10 mm measuring stroke.
The flexural behaviour of the mortars was studied following EN 1015-11 [53]. Three-point flexural tests were carried out on prismatic specimens of 40 × 40 × 160 mm3 dimensions using a Lloyds Universal testing machine with a 50 kN actuator under displacement control. The tests were performed by applying a monotonically increasing mid-span displacement at a rate of 0.01 mm/s; see Figure 5c.

3. Results

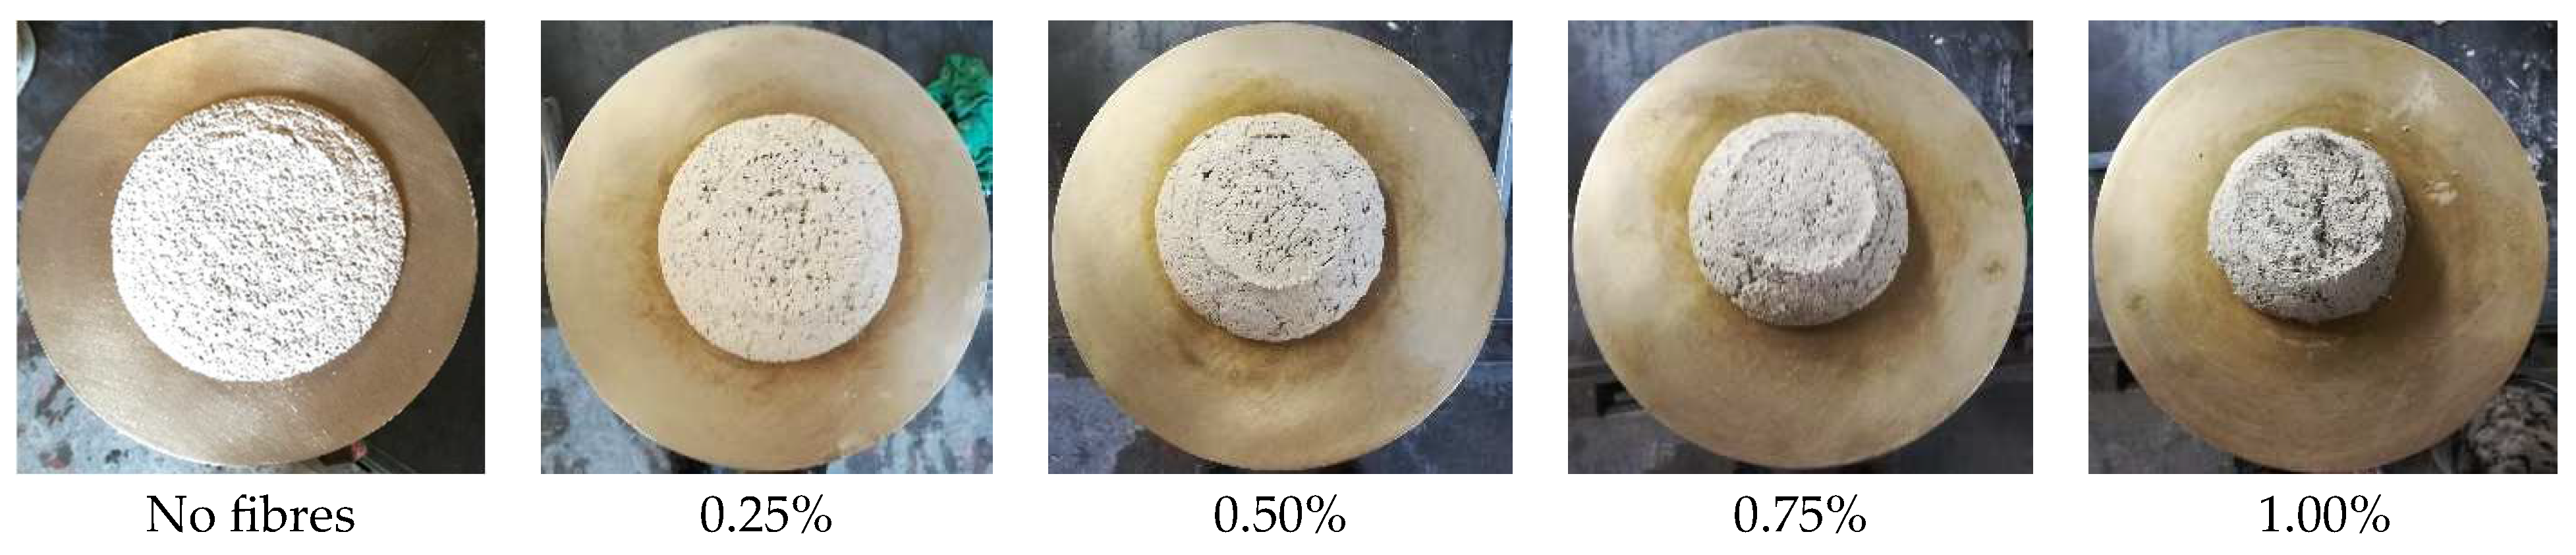
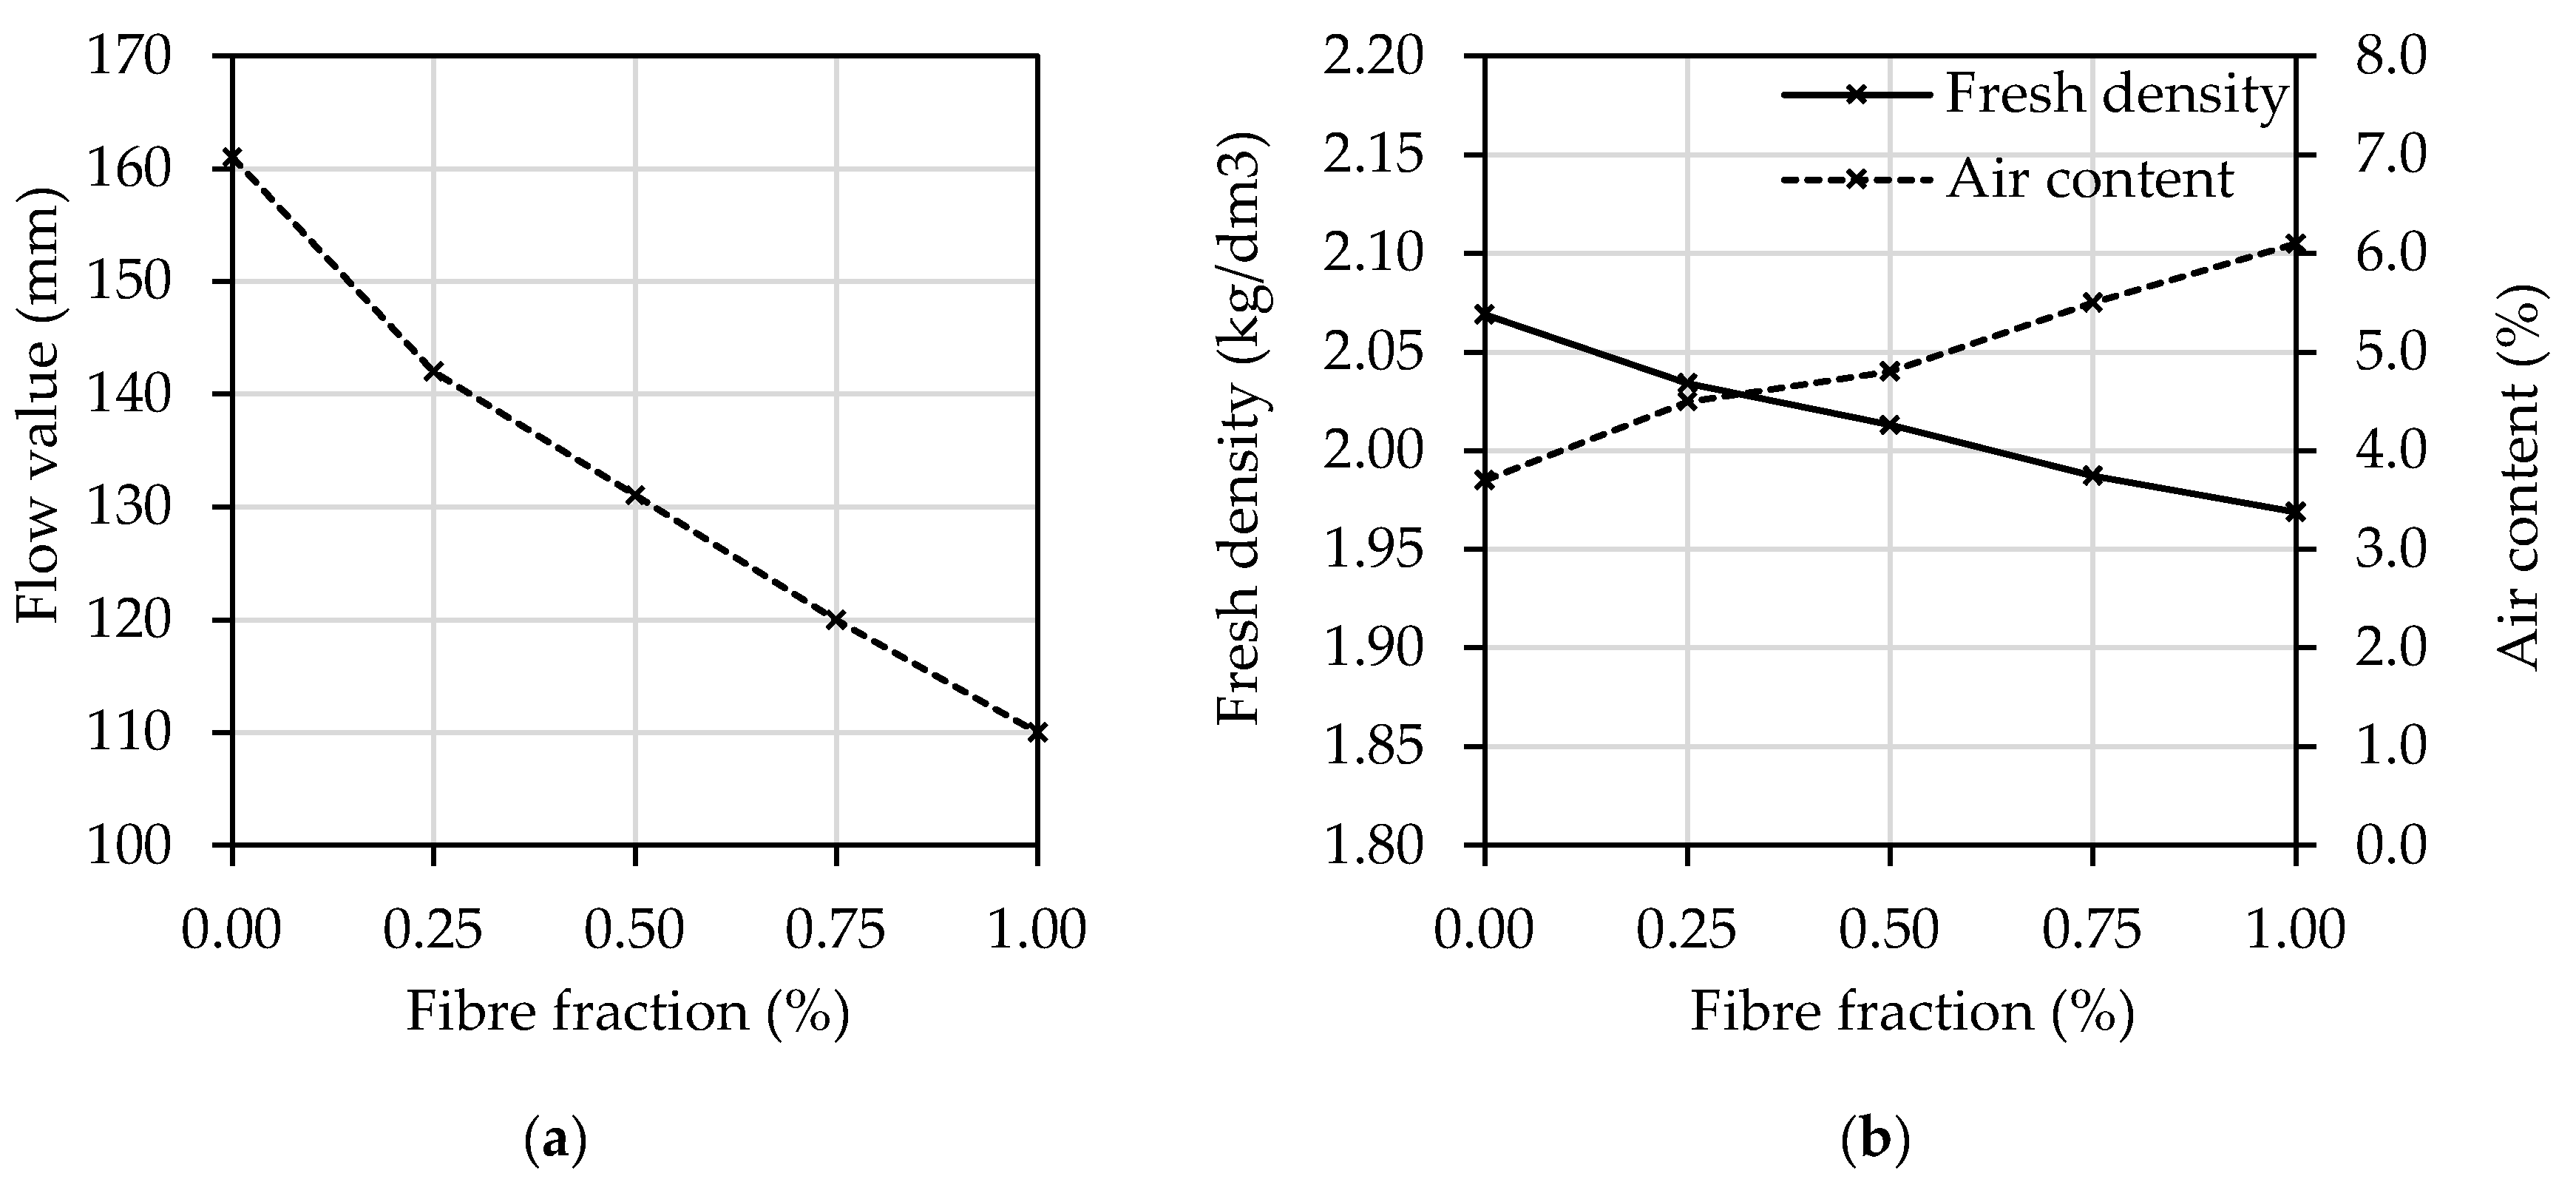
3.1. Fresh Behaviour

The influence of the increasing fibre fraction on the workability of the mixtures can be seen in Figure 6 and Figure 7a, which shows the final spread of the samples after imposing the 15 strokes. Additionally, Figure 7b shows the density obtained in the fresh state and the air content measured for each mixture versus the fibre fraction. The main application envisaged for the mixtures developed, as strengthening overlay, makes workability a parameter of major concern. The mixture that showed the best fresh behaviour was the mortar containing 0.25% of fibres in volume, yielding a flowability measurement of 142 mm, measured with the flow table method. By increasing the fibre content up to 0.75% and 1.00%, the flowability decreased to 120 mm and 110 mm, respectively. Moreover, the air content increased with the fibre content, which is attributable to deficient particle arrangement within the mortar matrix.

3.2. Hardened Behaviour

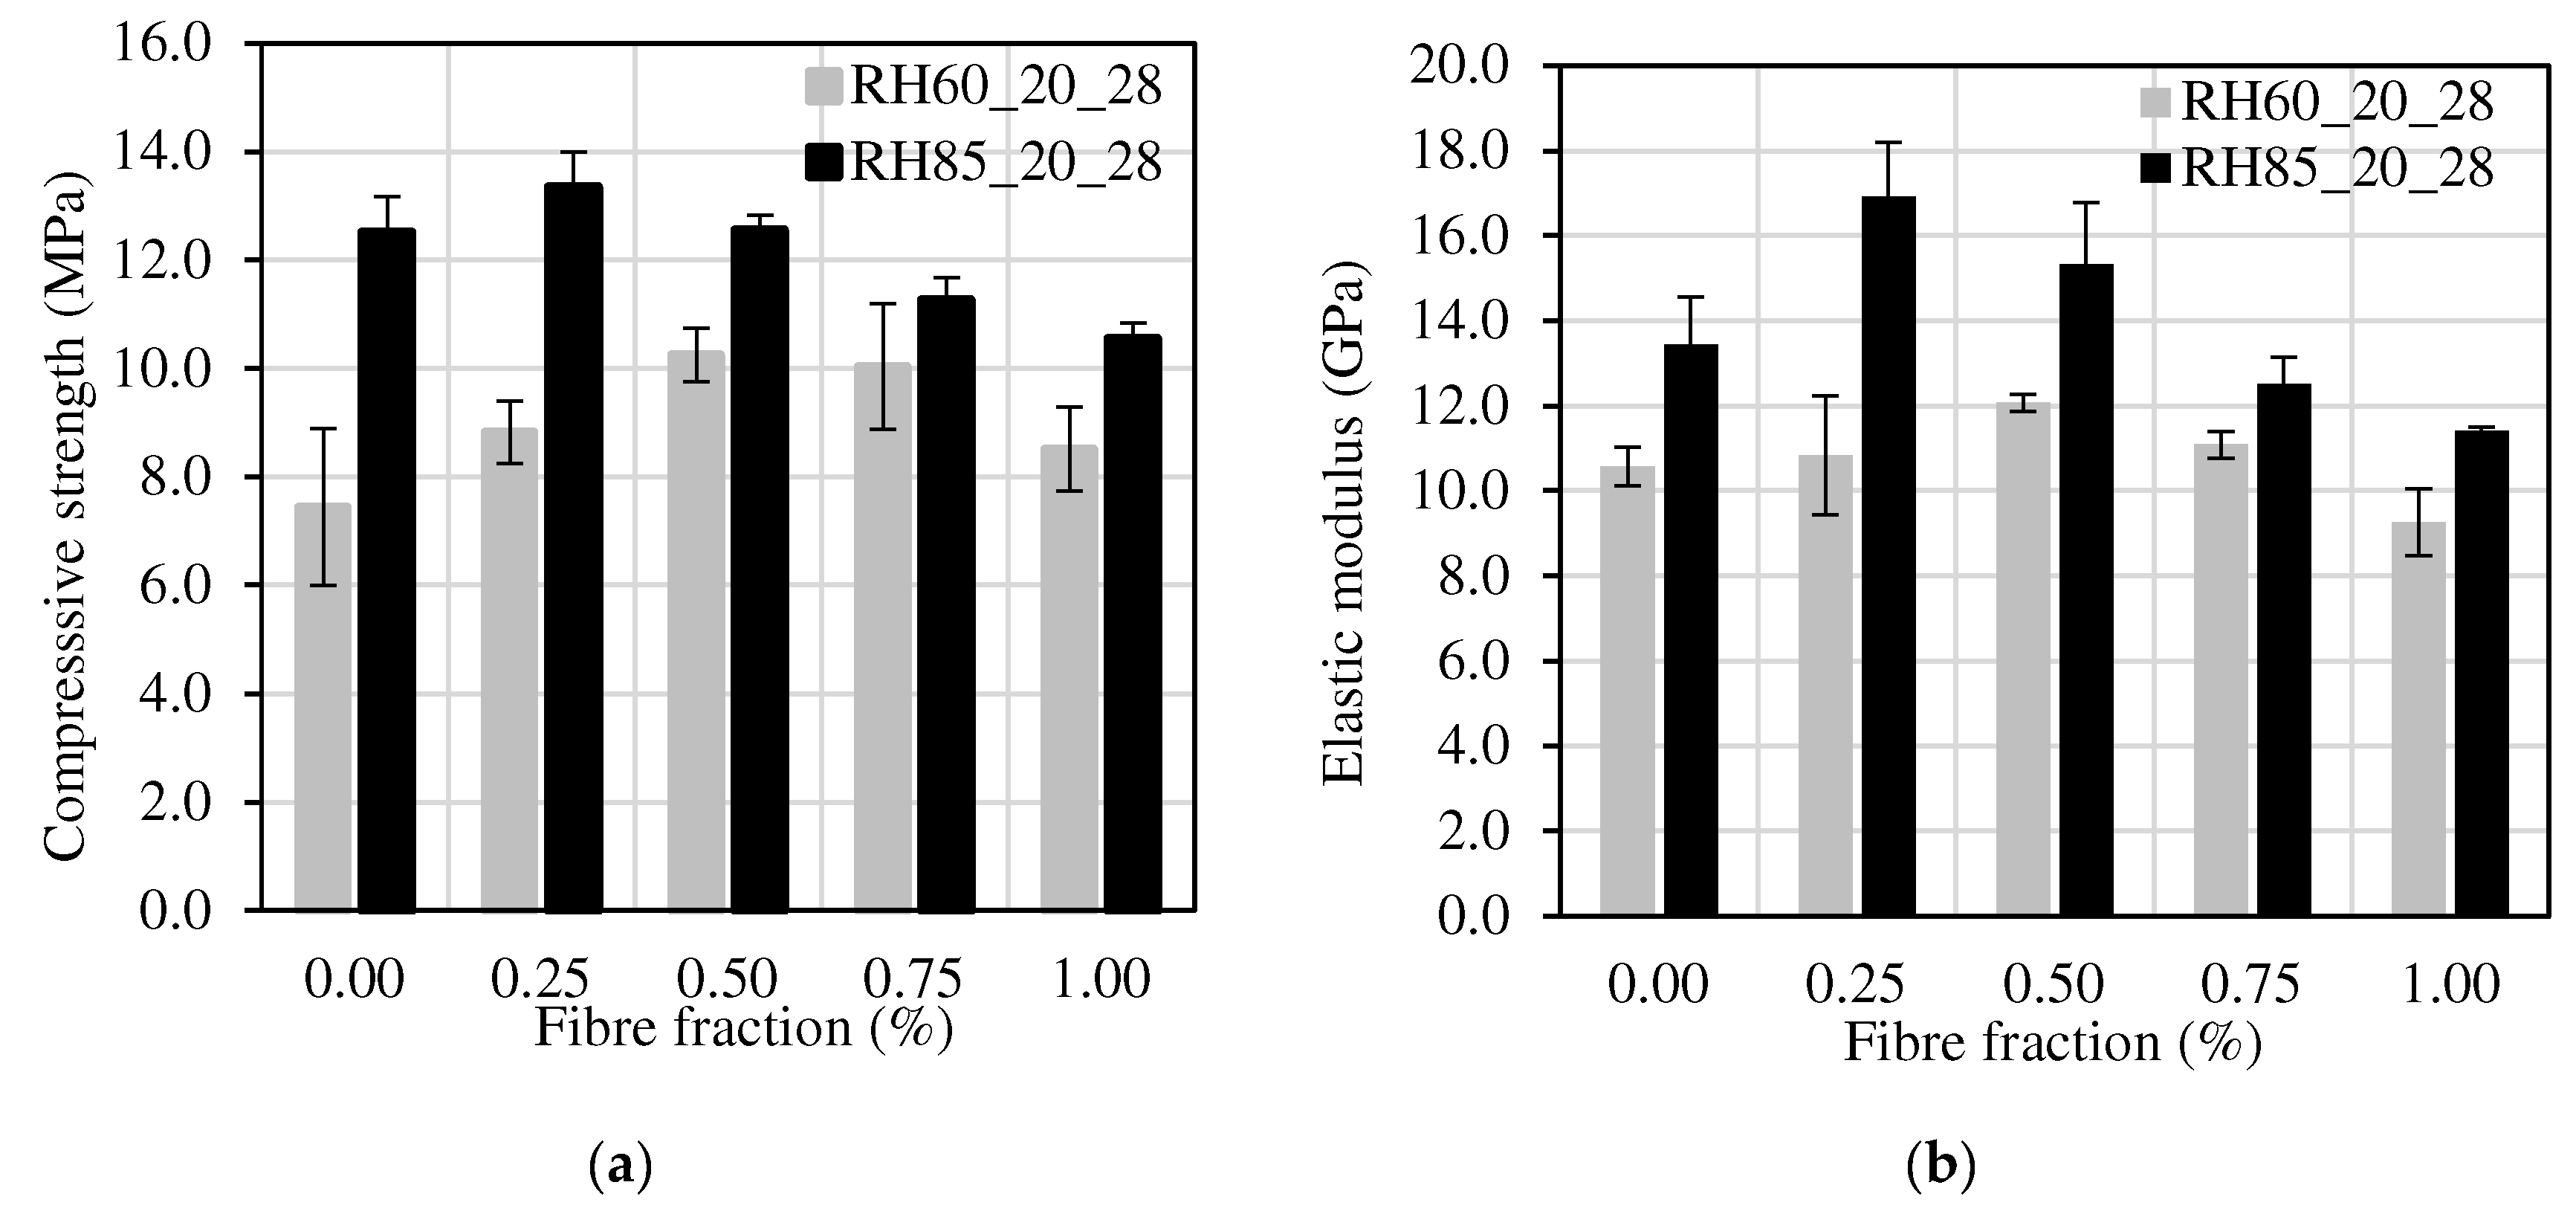
3.2.1. Compression Tests Results

One group of specimens was cured for 28 days in a climatic chamber at 20 °C and 60% of relative humidity (RH). The compression test results obtained for these specimens are presented in Table 4, where σ m a x , σ ¯ m a x and ( C o V ) represent the maximum stress, the respective mean value and the coefficient of variation;   a n d     ε σ m a x and ε ¯ σ m a x represent the strain for the maximum load and the respective mean value. Another group of specimens was cured at 20 °C and 85% RH also at 28 days, and the results obtained are also presented in Table 4. As shown, the scatter of results obtained in each group of samples was, in general, low, apart from the values obtained for the reference mortar cured at a 60% RH.

3.2.2. Flexural Test Results

One group of specimens was cured in a climatic room at 20 °C and 85% RH for 7, 28 and 90 days. The flexural test results obtained are shown in Table 5, namely the flexural strength, f , derived from Equation (1) [53], the displacement obtained for the maximum load, d f , m a x , the respective mean values, A v .   , and the coefficient of variation, ( C o V ) . Another group of specimens was cured at 20 °C and 60% RH, and the results obtained at 28 and 90 days are presented in Table 5. The equivalent tensile strengths under flexure show, in general, a low coefficient of variation. However, in the case of the displacement obtained for the maximum load, a higher scatter of results was observed, in some cases exceeding 15%. This result may reflect the fact that fibres contribute to distribute damage and originate multiple cracks, increasing deformability as well as the scatter of the post-cracking response parameters, due to the brittle nature of the cracking process as well as the possible heterogeneous distribution and orientation of the fibres.
f = 1.5 × F L b d 2
where F is the maximum load applied to the specimen; L is the distance between the supports; b and d are the width and depth of the specimen’s cross-section.

4. Discussion of Results

4.1. Compressive Behaviour

The compressive behaviour of representative specimens cured for 28 days in a climatic chamber at 20 °C and 60% RH and 85% RH is shown in Figure 8a,b, respectively, were the average axial compressive strain is the average displacement of the three LVDTs divided by the length of the specimen. The initial slope of the compressive stress—strain responses, as expected, was marginally influenced by the addition of fibres, showing essentially similar slopes for different fibre fractions. However, the peak stress and the post-peak behaviour of the mixtures were clearly influenced by the fibre content. The peak stress presented the tendency to increase for lower fibre fractions and to decrease when higher fibre fractions were used, while the post peak behaviour improved for higher fibre fractions. These changes suggest that the increase in the fibre fraction led to the expected increase in ductility and the ability to dissipate energy after cracking, due to the contribution of the PAN fibres to restrain crack propagation. However, above a certain limit, higher fibre fractions may have contributed to the reduction in the solid skeleton compactness and strength, along with the reduction in workability.
Figure 9 shows the main results obtained for the compressive strength at 28 days of curing after casting, for both curing environments. The specimens cured at 85% RH show, in all cases, higher compressive strength than the ones obtained for specimens cured at 60% RH; see Figure 9a. The compressive strength shows a small variation, with the increase in the fibre content for both curing conditions. In the case of 85% RH, the maximum compressive strength was achieved for a fibre fraction of 0.25%, and at 60% RH the maximum compressive strength was achieved for a fibre fraction of 0.50%. This variation would not occur in the case of Portland cement FRM, as concluded by González et al. [54] by studying the pore morphology of mortars in different curing conditions. However, in the case of NHL-FRM, the binder’s hardening is influenced by hydration reactions and additional carbonation reactions [55]. For NHL 5.0 from Secil, Table 1 shows that there is a minimum of 15% free lime available for carbonation reaction. The availability of free lime simultaneously with higher porosity and favourable curing conditions, 60% RH in a ventilated climatic chamber, may justify the slight increase in the strength due to carbonation.
The same trend can be observed for the elastic modulus, as shown in Figure 9b. The values of the elastic modulus and compressive strength are in accordance with the ones expected for an NHL mortar.

4.2. Flexural Behaviour

The flexural responses obtained were adjusted to exclude the initial deformation for small loads due to the accommodation of the loading device and the supports. The approach used is schematically represented in Figure 10 and allowed us to acquire more realistic values by disregarding the initial parasitic deflections [37,56]. After the occurrence of the first crack, the onset of matrix cracking, the load–deflection curve deviates from linearity; for plain mortar, the load–deflection curve drops suddenly, leading to failure. In the case of an FRM, the addition of fibres significantly influences the composite’s behaviour after cracking, leading to deflection–softening (load decay with the increase in deflection), or alternatively to deflection–hardening (load increases with the deflection) [19,57].
After adjusting all flexural stress vs. deflection responses, representative curves for each fibre fraction were selected and are plotted in Figure 11a,b. The effect of adding fibres to the matrix is clear, even for 0.25% of fibres. By increasing the fibre fraction, the toughness of the material gradually increases and the flexural response gradually shifts from a typically brittle fracture to a deflection–softening response for lower fibre fractions, and a deflection–hardening response for higher fibre volume fractions.
The values of the modulus of rupture (MOR), and of the limit of proportionality (LOP) were computed according to the RILEM Technical Committee 49 TFR [58] recommendations:
M O R = 3 F m a x L 2 b d 2
L O P = 3 F c r a c k L 2 b d 2  
These are plotted against the fibre volume fraction in Figure 12a,b, respectively. The MOR was obtained from the maximum load, F m a x , and the LOP by finding the load at which the first non-linearity is observed in the force–deflection relationship, F c r a c k , see Figure 10.
The values of the MOR and LOP obtained for both curing environments show a clear increasing trend with the fibre volume fraction. The specimens cured at 85% RH showed, for all fibre fractions, a higher MOR. Regarding the LOP, no clear trend was observed, and for the higher amounts of fibres, 0.75 and 1.00%, the LOP values obtained for 85% RH were lower or similar to the ones obtained for 60% RH. The increase in LOP with the fibre fraction indicates that fibre reinforcement started contributing for the flexural capacity of the mortar at a very early stage of the micro-cracking propagation. As expected, the influence of fibre fraction was more pronounced on the increase in MOR, since at this load level, meso-cracks are already formed, being the fibres crossing these cracks which are more active in arresting their propagation.

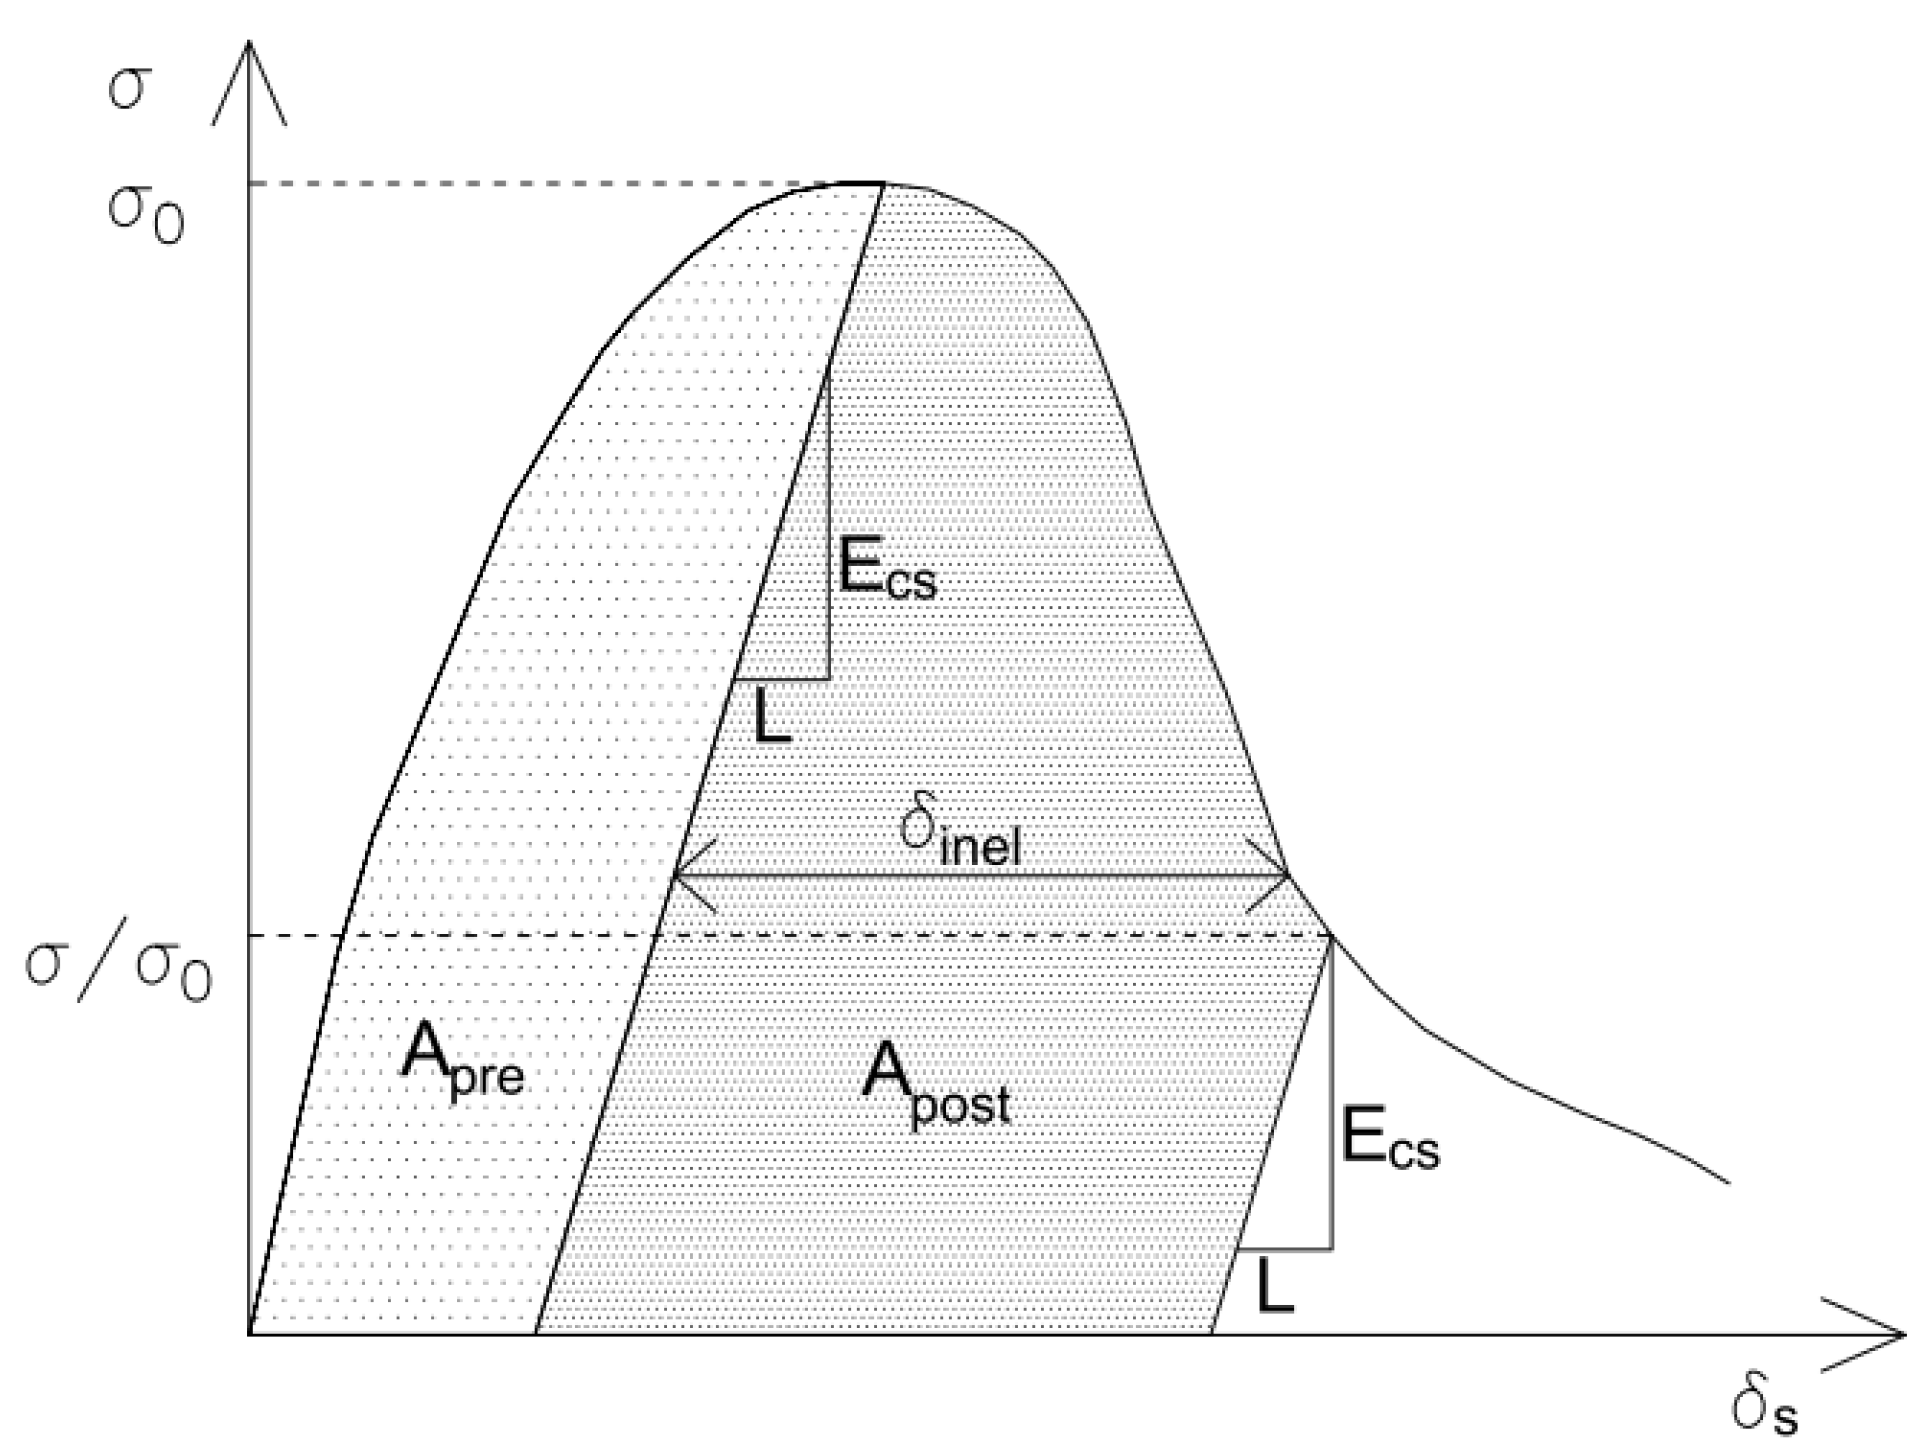
4.3. Toughness in Compression

The energy dissipated during the fracture process in compression, also designated as the work of fracture in compression [59,60], can be obtained by dividing the area under the stress vs. displacement response into two parts; see Figure 13. The area indicated as Apre represents the energy dissipated in compression before the peak and Apost the energy dissipated after the peak. Since the post-cracking portion of the experimental response tends to extend over large deformations, it is important to define a reference residual stress, σ0, common to all specimens, up to which the energy dissipated during the fracture process in compression is computed. Therefore, the Apost value was measured up to a deflection in the post-peak phase corresponding to σ/σ0 = 0.33.
The results obtained for both curing conditions are shown in Figure 14, where it is visible that the energy dissipated during the fracture process in compression increased with the fibre fraction. However, in the case of the specimens cured at 85% of RH, the value of the pre-peak energy dissipated remained approximately constant for mortars with different fibre contents. Probably, the curing environment with a higher RH favoured the curing of the NHL-based matrix, therefore leading to increased energy required to induce the same level of damage.
The toughness ratio in compression (TRc) can be used to identify the capacity of the materials to absorb energy and plastically deform before failure. Considering that one of the main aims of this study is to develop FRMs that maximise the capacity of masonry elements to dissipate energy when used as strengthening overlays, this ratio was computed following the procedure adopted by other authors [56,61,62]. As described by Equations (4) and (5) and represented in Figure 15, TRc represents the ratio between the area limited by the stress vs. strain response up to a predefined level of strain, ε, and the area given by fc × ε, with fc being the compressive strength, as shown in Figure 15. The predefined strain values, ε, were assumed as 0.0105 and 0.0175, which represent three and five times the concrete ultimate strain (TRc,3 and TRc,5), assuming that this strain was 0.0035 according to EN 1992-1-1:2010 (EC2) [63], and following the methodology adopted in [56].
T R c , 3 = A r e a   O A B C f c × 0.0105 × 100 %
T R c , 5 = A r e a   O A B C f c × 0.0175 × 100 %
The TRc values obtained when considering lower predefined strains ε, TRc,3, show an increase of around 25% when compared to the reference mixture without fibres, with the mixtures containing 0.75% and 1.00% of PAN fibres; see Figure 16a. However, when higher values of the predefined strain ε are considered, TRc,5, this increase tendency is considerably higher, reaching around 100% for the specimens cured in 85% RH; see Figure 16b. This variation of the TRc values reveals the significant contribution of the fibre reinforcement to the improvement in the post-peak behaviour of the mixtures while subjected to compression loading.
The relation between compressive strength and toughness ratios for lower and higher deformation levels, TRc,3 and TRc,5, is shown in Figure 17, considering both curing conditions, RH60 and RH85. For RH60, when lower levels of deformation were used as a reference, TRc,3, lower variations in this ratio were obtained, changing from 60% to 85%, while more expressive increments, from 40% to 85%, were obtained when higher deformations were considered, TRc,5. In both cases, TRc,3 and TRc,5, the trend was similar: the specimens showing higher compressive strength tended to show lower toughness ratios because energy released during the matrix cracking tends to increase, which is more demanding to the fibre reinforcement. The specimens cured in RH85 presented an opposite evolution of the toughness ratios, TRc,3 and TRc,5: the higher the compressive strength, the lower the toughness ratio in compression.

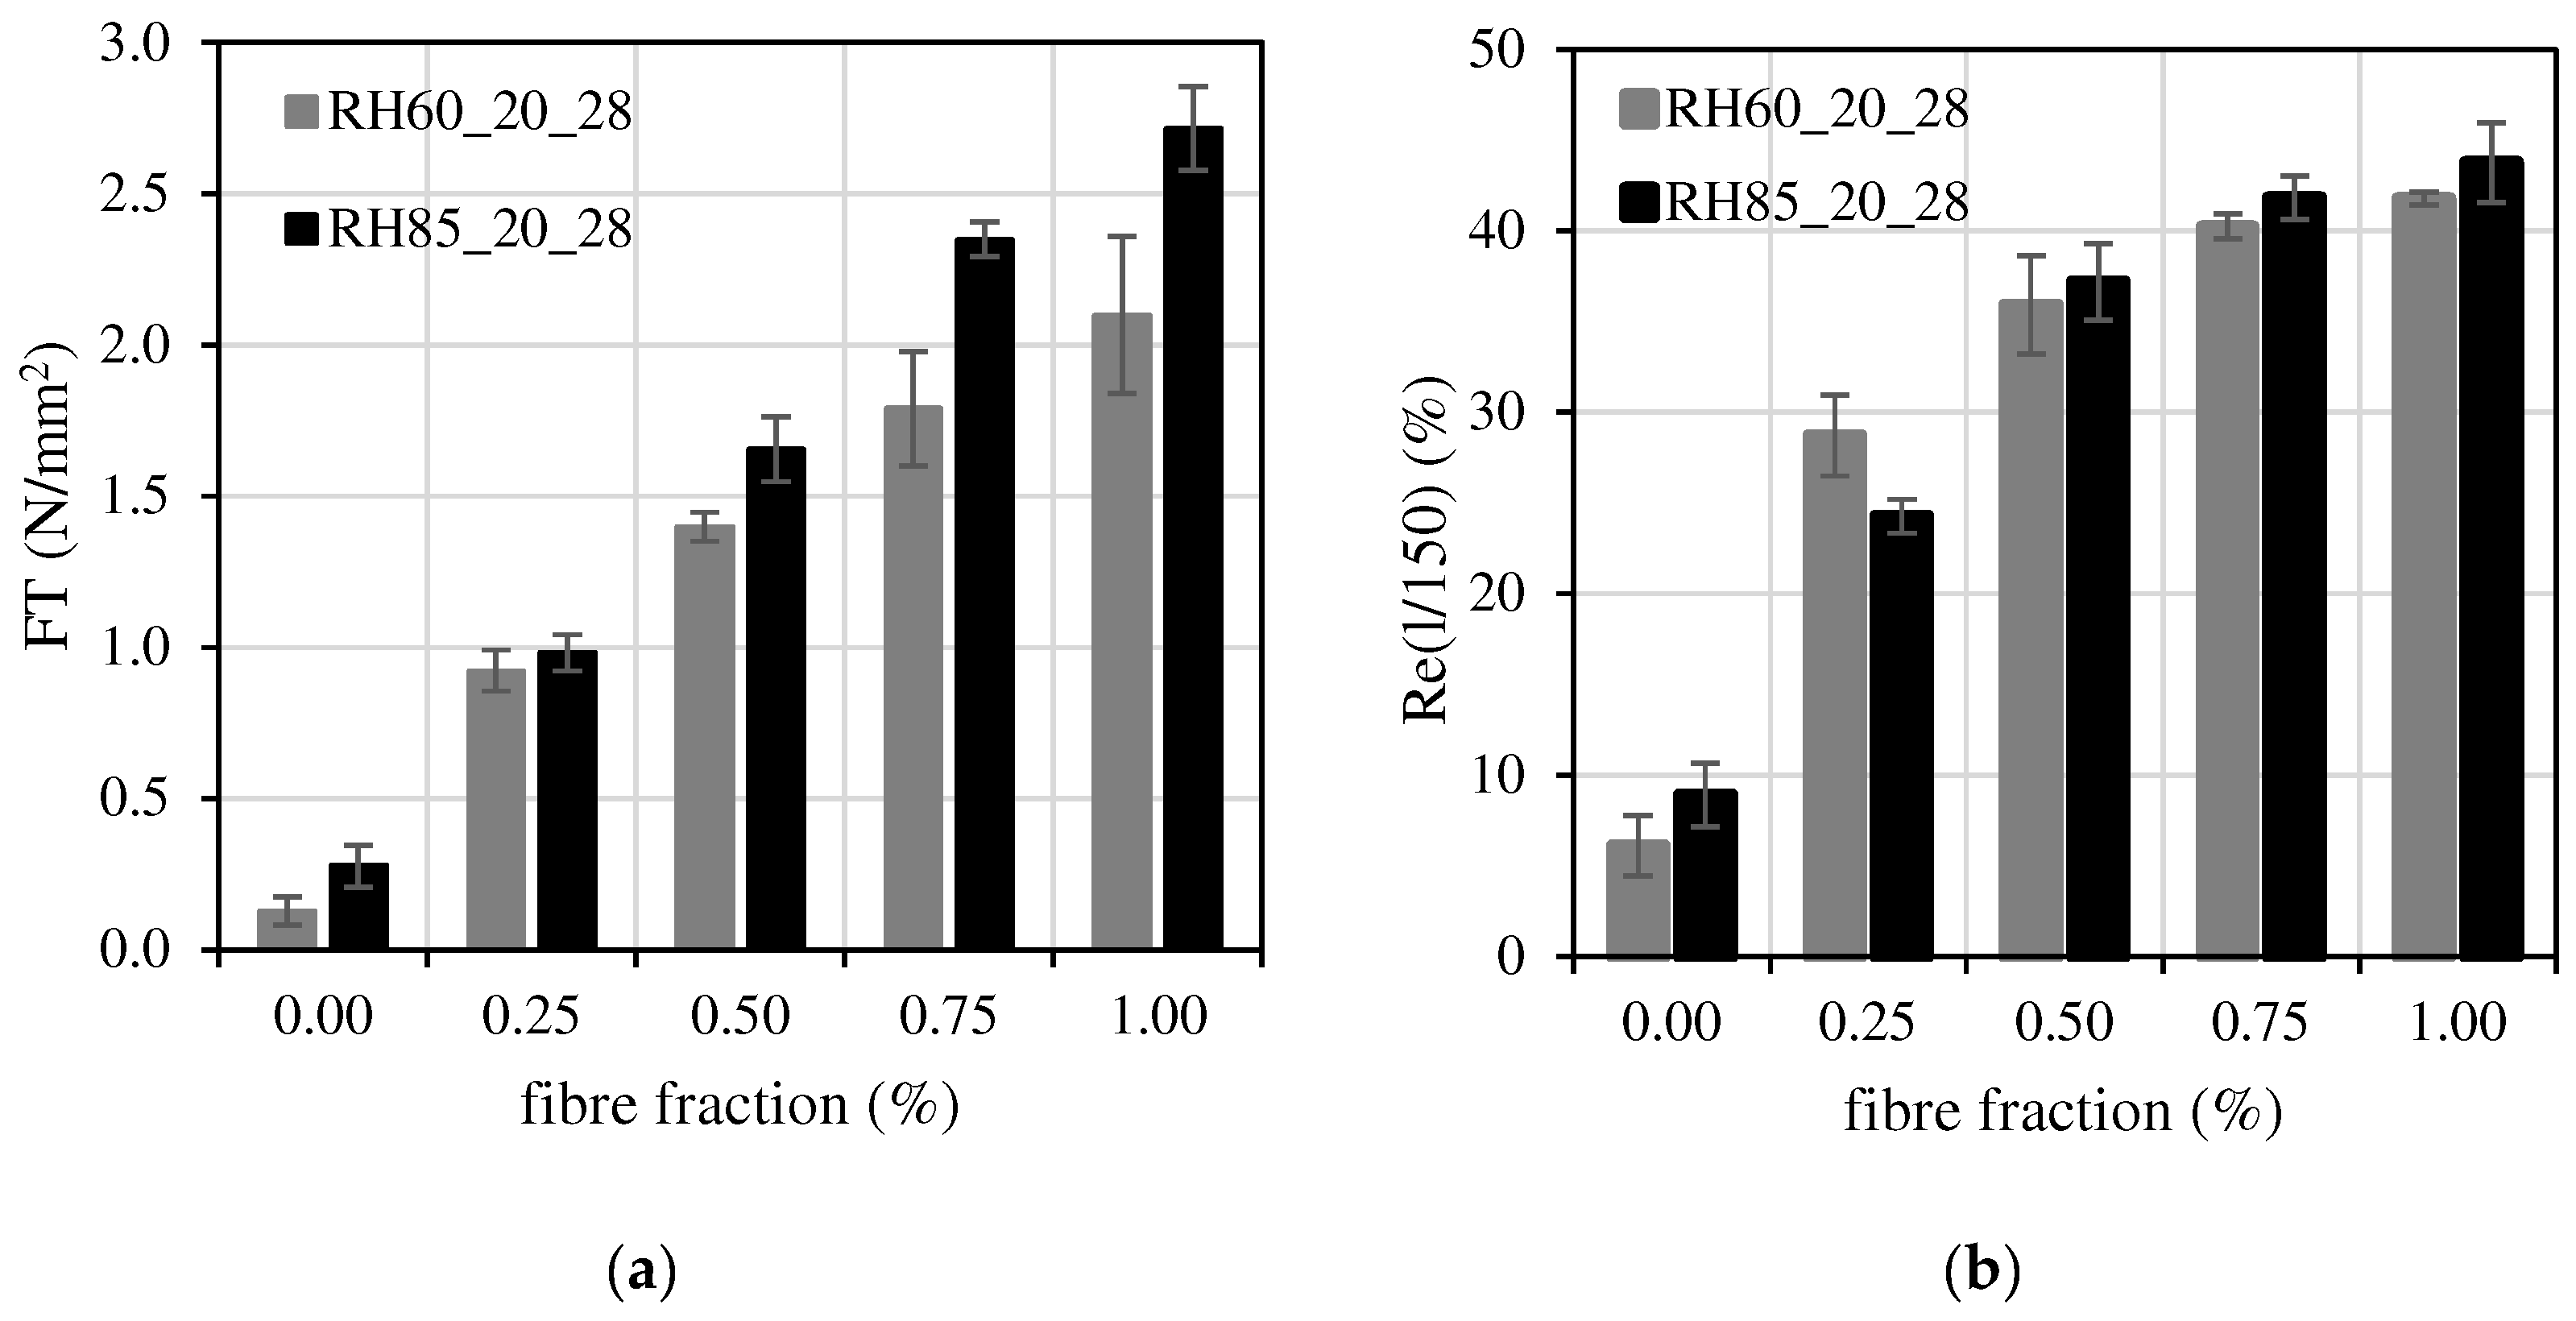
4.4. Toughness in Flexure

The flexural toughness (Tb) was derived from the flexural load-vs.-displacement responses previously shown and obtained from three-point bending tests, EN 1015-11 [53], adapted according to Jang et al. [41]; see Figure 10. The energy absorbed by the specimens during the fracture process in flexure is represented by the area under the load vs. deflection curve. According to Iucolano et al. [37], the load-vs.-deflection response depends on (i) the specimen size; (ii) the loading configuration (midpoint versus third-point loading); (iii) type of feedback control variable used during testing (load, load-point deflection, cross-head displacement, etc.); (iv) and loading rate. In order to minimize the effects of load configuration and specimen size, the normalization of the energy absorption capacity is required. This can be achieved by using the normalised flexural toughness factor ratio, Re(l/150), presented in Equation (7), where for each specimen the flexural toughness factor (FT) (see Equation (6) and Figure 18) is normalized with respect to the MOR value presented in Equation (2) [64,65]. The deflection δTb, adopted to calculate Tb and FT, was limited to 1/150 of the distance between supports; see Figure 18.
F T = T b × L δ t b × b × d 2
R e ( l / 150 ) = F T M O R × 100 %
The obtained results, presented in Figure 19, show that FT has increased with the fibre fraction. For the reference mixture, the FT value varied between 0.1 and 0.3 N/mm2, for RH 60% and 85%, respectively. These values increased about 10 and 16 times when 1.00% of fibres was added to both mixtures. The ratio Re(l/150), obtained for the fibre volume fraction of 1.00%, showed a variation between 4.9 and 6.8 times relative to the reference mixture.
Figure 20 shows the relation between the flexural strength and the toughness ratio in flexure obtained for L/150 deflection. The results showed an increase in the toughness ratio in flexure with the increase in the flexural strength. This strong correlation is indicative of the higher ductility of NHL-FRMs with higher strength in flexure, in this case because the fibre reinforcement contributed both to increase flexural strength and to the improvement in the post-peak behaviour in flexure.

4.5. Fibre Reinforcement Efficiency in Flexure

4.5.1. Contribution for Flexural Strength

The fibre reinforcement efficiency of mortars developed in this work is analysed in Figure 21, where data referring to mortars from different authors are also included. The flexural strength ratio is presented as the ratio between the flexural strength value from plain mortars and the values from fibre-reinforced mortars. Mortars composed of different types of binders are presented, namely, CEM and geopolimeric binders in Figure 21a and NHL in Figure 21b. The type of fibres used by other authors vary from natural fibres, such as palm, to man-made fibres, such as basalt, glass, PET, PVA and PAN. The influence of the fraction of fibres on the flexural strength ratio of CEM-FRM is positive in most cases. In the NHL-FRMs, that influence showed a high variation and in some cases was even negative, depending on the authors.
The use of PAN fibres up to 1.00% in volume showed an efficiency level of NHL-FRM higher than the studies using basalt, glass or hemp fibres. The level of efficiency was justified by the good compatibility between the NHL matrix and the surface of the PAN fibre, as well as the tensile strength of the PAN fibres [66].

4.5.2. Contribution for Flexural Toughness

The effect of the fibres on the ductility of mortars was evaluated by quantifying the flexural toughness ratios; see Figure 22. Different procedures were suggested by the standards for the evaluation of the toughness in flexure [65,67,68,69]. In this study, a ratio between the flexural toughness from fibre-reinforced mortar and plain mortar was used, allowing comparison between the values obtained from different sources.
Figure 22 shows that two groups of FRMs can be identified: CEM-FRMs are presented in Figure 22a and NHL-FRMs in Figure 22b. The FRMs of the first group, for the same fibre fraction, always showed a lower toughness ratio than the FRCs belonging to the NHL-FRM group, independently of the type of fibre. This indicates in general a lower ductility of the CEM-FRMs when compared to NHL-FRMs. The NHL-FRM developed in this study reached a flexural toughness nine times higher when 1.00% of fibres were added. Nonetheless, for CEM-FRMs the same fibre fractions led to increased factors of around three. In contrast, NHL-FRMs in general show very high flexural toughness ratios [36,38], showing higher efficiency for the same fibre fractions, as shown in Figure 22a,b. Figure 23 represents the flexural strength vs. flexural toughness ratio of FRMs, where it is possible to identify that the mortar reinforced with glass fibres developed by Chan et al. [36] presented low flexural strength. The mortar developed by Liguori et al. [38] presented a high flexural strength and flexural toughness ratio. However, when considering the mechanical properties set as target for the overlay application, 10 < fc < 15 MPa and 5 < ft,fl < 7 MPa, these NHL-FRMs clearly underperformed considering the compressive strength; see Figure 1.

5. Conclusions

The need to strengthen a vast number of existing masonry structures that are frequently under the effect of dynamic actions determine the importance of studying metrics that allow us to assess the performance of FRMs used as strengthening overlays. These metrics cannot be limited to maximum resistance or deformability; instead, they must be oriented to distinguish materials with a higher energy dissipation capacity.
In this work, a new NHL-FRM material was developed to be used as an economically and environmentally sustainable strengthening overlay. The use of metrics geared towards the assessment of toughness and ductility led to the identification of a material that is compatible with the application and meets its requirements.
The main conclusions from this study are as follows:
  • The inclusion of PAN fibres in an NHL matrix changed the fresh and hardened behaviour of the mortar, even with minimal fibre addition of 0.25%.
  • A fibre content of 1.00% resulted in deficient workability for overlay application. Utilizing admixtures like superplasticizers may enhance workability without compromising mechanical properties.
  • The target values of compressive strength at 28 days, 10 < fc < 15 MPa, were achieved for F0.50_RH60 and F0.75_RH60 and for all mortars cured at RH85.
  • The flexural strength target values, 5 < fft,fl < 7.5 MPa, were achieved for F0.75_RH85, F1.00_RH60 and F1.00_RH85.
  • The compressive and flexural toughness of the FRM substantially increase with the adding of fibres. There was an important variation in the capacity to dissipate energy, even for lower amounts as 0.25%; this capacity was maximized at 1.00% of fibres.
  • The correlation between the mechanical properties in compression and flexure and the respective toughness ratios showed opposite trends. While the toughness ratio in compression increased for lower compressive strength values, the toughness ratio in flexure increased for higher flexural strength values.
Both the developed NHL-FRM with PAN fibres and the mechanical assessment approach used can be advantageous for overlay strengthening design and application in masonry elements, with the possibility of achieving interesting mechanical performances as well as good compatibility and sustainable formulations.

Author Contributions

Conceptualization, J.A.P.P.A., E.N.B.P. and J.A.O.B.; methodology, J.A.P.P.A., E.N.B.P. and J.A.O.B.; formal analysis, J.A.P.P.A. and E.N.B.P.; investigation, J.A.P.P.A.; resources, E.N.B.P. and J.A.O.B.; Writing—Original draft, J.A.P.P.A.; writing—review and editing, J.A.P.P.A., E.N.B.P. and J.A.O.B.; supervision, E.N.B.P. and J.A.O.B.; project administration, E.N.B.P.; funding acquisition, E.N.B.P. All authors have read and agreed to the published version of the manuscript.

Funding

The first author would like to thank FCT (Fundação para a Ciência e a Tecnologia) for the funding through the PhD grant SFRH/BD/115090/2016. The authors would like to thank the project RENEw, POCI-01-0247-FEDER-033834, funded by Fundo Europeu de Desenvolvimento Regional (FEDER) and Programa Operacional da Competitividade e Internacionalização do Portugal 2020 (COMPETE 2020).

Institutional Review Board Statement

Not applicable.

Informed Consent Statement

Not applicable.

Data Availability Statement

The data presented in this study are available from the corresponding author, J.A.P.P.A., upon reasonable request.

Acknowledgments

The authors are very grateful to the companies SECIL and EUROCALCIO for the material provided.

Conflicts of Interest

The authors declare no conflicts of interest.

References

  1. Gautam, D.; Chaulagain, H. Structural performance and associated lessons to be learned from world earthquakes in Nepal after 25 April 2015 (MW 7.8) Gorkha earthquake. Eng. Fail. Anal. 2016, 68, 222–243. [Google Scholar] [CrossRef]
  2. Parisi, F.; Augenti, N. Earthquake damages to cultural heritage constructions and simplified assessment of artworks. Eng. Fail. Anal. 2013, 34, 735–760. [Google Scholar] [CrossRef]
  3. Romão, X.; Costa, A.; Paupério, E.; Rodrigues, H.; Vicente, R.; Varum, H. Field observations and interpretation of the structural performance of constructions after the 11 May 2011 Lorca earthquake. Eng. Fail. Anal. 2013, 34, 670–692. [Google Scholar] [CrossRef]
  4. De Felice, G.; De Santis, S.; Garmendia, L.; Ghiassi, B.; Larrinaga, P.; Lourenco, P.; Oliveira, D.; Paolacci, F.; Papanicolaou, C.G. Mortar-based systems for externally bonded strengthening of masonry. Mater. Struct. 2014, 47, 2021–2037. [Google Scholar] [CrossRef]
  5. García, D.; Díez, J. Stone masonry walls: Strengthening with TRM (I). In Structural Analysis of Historic Construction; Ayala, D.F.D., Fodde, E., Eds.; Taylor & Francis Group: London, UK, 2008; pp. 851–859. [Google Scholar]
  6. Garmendia, L.; Larrinaga, P.; García, D.; Marcos, I. Textile-reinforced mortar as strengthening material for masonry arches. Int. J. Arch. Heritage 2014, 8, 627–648. [Google Scholar] [CrossRef]
  7. Kouris, L.A.S.; Triantafillou, T.C. State-of-the-art on strengthening of masonry structures with textile reinforced mortar (TRM). Constr. Build. Mater. 2018, 188, 1221–1233. [Google Scholar] [CrossRef]
  8. De Felice, G.; Aiello, M.A.; Caggegi, C.; Ceroni, F.; De Santis, S.; Garbin, E.; Gattesco, N.; Hojdys, Ł.; Krajewski, P.; Kwiecień, A.; et al. Recommendation of RILEM Technical Committee 250-CSM: Test method for Textile Reinforced Mortar to substrate bond characterization. Mater. Struct. 2018, 51, 95. [Google Scholar] [CrossRef]
  9. Bakis, C.E.; Bank, L.C.; Brown, V.L.; Cosenza, E.; Davalos, J.F.; Lesko, J.J.; Machida, A.; Rizkalla, S.H.; Triantafillou, T.C. Fiber-Reinforced Polymer Composites for Construction—State-of-the-Art Review. J. Compos. Constr. 2002, 6, 73–87. [Google Scholar] [CrossRef]
  10. Papanicolaou, C.; Triantafillou, T.; Lekka, M. Externally bonded grids as strengthening and seismic retrofitting materials of masonry panels. Constr. Build. Mater. 2011, 25, 504–514. [Google Scholar] [CrossRef]
  11. Almeida, J.A.; Pereira, E.B.; Barros, J.A. Assessment of overlay masonry strengthening system under in-plane monotonic and cyclic loading using the diagonal tensile test. Constr. Build. Mater. 2015, 94, 851–865. [Google Scholar] [CrossRef]
  12. Kyriakides, M.A.; Billington, S.L. Seismic Retrofit of Masonry-Infilled Non-Ductile Reinforced Concrete Frames Using Sprayable Ductile Fiber-Reinforced Cementitious Composites. In Proceedings of the 14 World Conference on Earthquake Engineering, Beijing, China, 12–17 October 2008. [Google Scholar]
  13. Dehghani, A.; Fischer, G.; Alahi, F.N. Strengthening masonry infill panels using engineered cementitious composites. Mater. Struct. 2013, 48, 185–204. [Google Scholar] [CrossRef]
  14. Stefanidou, M.; Papayianni, I.; Pachta, V. Evaluation of inclusions in mortars of different historical periods from greek monuments. Archaeometry 2012, 54, 737–751. [Google Scholar] [CrossRef]
  15. Mansur, M.; Aziz, M. A study of jute fibre reinforced cement composites. Int. J. Cem. Compos. Light. Concr. 1982, 4, 75–82. [Google Scholar] [CrossRef]
  16. Filho, R.D.T.; Scrivener, K.; England, G.L.; Ghavami, K. Durability of alkali-sensitive sisal and coconut fibres in cement mortar composites. Cem. Concr. Compos. 2000, 22, 127–143. [Google Scholar] [CrossRef]
  17. Claramunt, J.; Ardanuy, M.; García-Hortal, J.A.; Filho, R.D.T. The hornification of vegetable fibers to improve the durability of cement mortar composites. Cem. Concr. Compos. 2011, 33, 586–595. [Google Scholar] [CrossRef]
  18. Fidelis, M.E.A.; Filho, R.D.T.; Silva, F.d.A.; Mechtcherine, V.; Butler, M.; Hempel, S. The effect of accelerated aging on the interface of jute textile reinforced concrete. Cem. Concr. Compos. 2016, 74, 7–15. [Google Scholar] [CrossRef]
  19. Kim, D.J.; Naaman, A.E.; El-Tawil, S. Comparative flexural behavior of four fiber reinforced cementitious composites. Cem. Concr. Compos. 2008, 30, 917–928. [Google Scholar] [CrossRef]
  20. Ralegaonkar, R.; Gavali, H.; Aswath, P.; Abolmaali, S. Application of chopped basalt fibers in reinforced mortar: A review. Constr. Build. Mater. 2018, 164, 589–602. [Google Scholar] [CrossRef]
  21. Skourup, B.N.; Erdogmus, E. Characteristics of PVA fiber-reinforced mortars. In Proceedings of the 2009 Structures Congress—Don’t Mess with Structural Engineers: Expanding Our Role, Austin, TX, USA, 30 April–2 May 2009; Leslie, E., Ed.; Robertson Associates: New York, NY, USA, 2009; pp. 1622–1631. [Google Scholar]
  22. Silva, B.; Pinto, A.F.; Gomes, A. Natural hydraulic lime versus cement for blended lime mortars for restoration works. Constr. Build. Mater. 2015, 94, 346–360. [Google Scholar] [CrossRef]
  23. Pavía, S.; Hanley, R. Flexural bond strength of natural hydraulic lime mortar and clay brick. Mater. Struct. 2010, 43, 913–922. [Google Scholar] [CrossRef]
  24. Pozo-Antonio, J. Evolution of mechanical properties and drying shrinkage in lime-based and lime cement-based mortars with pure limestone aggregate. Constr. Build. Mater. 2015, 77, 472–478. [Google Scholar] [CrossRef]
  25. Kalagri, A.; Karatasios, I.; Kilikoglou, V. The effect of aggregate size and type of binder on microstructure and mechanical properties of NHL mortars. Constr. Build. Mater. 2014, 53, 467–474. [Google Scholar] [CrossRef]
  26. Gulotta, D.; Goidanich, S.; Tedeschi, C.; Toniolo, L. Commercial NHL-containing mortars for the preservation of historical architecture. Part 2: Durability to salt decay. Constr. Build. Mater. 2015, 96, 198–208. [Google Scholar] [CrossRef]
  27. Aly, M.; Pavia, S. Mechanical and hygric properties of natural hydraulic lime (NHL) mortars with pozzolans. In Proceedings of the SMAR 2015—Third Conference on Smart Monitoring, Assessment and Rehabilitation of Civil Structures, Antalaya, Turkey, 7–9 September 2015; ITÜ, Istanbul Technical University: Antalaya, Turkey, 2015. [Google Scholar]
  28. Sadrmomtazi, A.; Tahmouresi, B.; Saradar, A. Effects of silica fume on mechanical strength and microstructure of basalt fiber reinforced cementitious composites (BFRCC). Constr. Build. Mater. 2018, 162, 321–333. [Google Scholar] [CrossRef]
  29. Dawood, E.T.; Mohammad, Y.Z.; Abbas, W.A.; Mannan, M.A. Toughness, elasticity and physical properties for the evaluation of foamed concrete reinforced with hybrid fibers. Heliyon 2018, 4, e01103. [Google Scholar] [CrossRef]
  30. Dawood, E.T.; Ramli, M. Properties of High-Strength Flowable Mortar Reinforced with Palm Fibers. ISRN Civ. Eng. 2012. [Google Scholar] [CrossRef]
  31. Deng, Z.C.; Deng, H.L.; Li, J.H.; Liu, G.D. Flexural fatigue behavior and performance characteristics of polyacrylonitrile fiber reinforced concrete. Key Eng. Mater. 2006, 302–303, 572–583. [Google Scholar] [CrossRef]
  32. Xu, F.; Zhou, M.K.; Shen, W.G.; Li, B.X. Study on the toughness performance of polypropylene fiber and sbr polymer latex modified cement mortar. Adv. Mater. Res. 2009, 79–82, 1751–1754. [Google Scholar] [CrossRef]
  33. Al-Mashhadani, M.M.; Canpolat, O.; Aygörmez, Y.; Uysal, M.; Erdem, S. Mechanical and microstructural characterization of fiber reinforced fly ash based geopolymer composites. Constr. Build. Mater. 2018, 167, 505–513. [Google Scholar] [CrossRef]
  34. Kheradmand, M.; Mastali, M.; Abdollahnejad, Z.; Pacheco-Torgal, F. Experimental and numerical investigations on the flexural performance of geopolymers reinforced with short hybrid polymeric fibres. Compos. Part B Eng. 2017, 126, 108–118. [Google Scholar] [CrossRef]
  35. De Oliveira, L.A.P.; Castro-Gomes, J.P. Physical and mechanical behaviour of recycled PET fibre reinforced mortar. Constr. Build. Mater. 2011, 25, 1712–1717. [Google Scholar] [CrossRef]
  36. Chan, R.; Bindiganavile, V. Toughness of fibre reinforced hydraulic lime mortar. Part-1: Quasi-static response. Mater. Struct. 2010, 43, 1435–1444. [Google Scholar] [CrossRef]
  37. Iucolano, F.; Liguori, B.; Colella, C. Fibre-reinforced lime-based mortars: A possible resource for ancient masonry restoration. Constr. Build. Mater. 2013, 38, 785–789. [Google Scholar] [CrossRef]
  38. Liguori, B.; Caputo, D.; Iucolano, F. Fiber-reinforced lime-based mortars: Effect of zeolite addition. Constr. Build. Mater. 2015, 77, 455–460. [Google Scholar] [CrossRef]
  39. Seker, B.S.; Cakir, F.; Acar, V.; Seydibeyoglu, M.O.; Akbulut, H. Combined effects of chopped carbon and glass fibres on mechanical properties of lime-based mortar. Adv. Compos. Lett. 2017, 26, 41–48. [Google Scholar] [CrossRef]
  40. Asprone, D.; Cadoni, E.; Iucolano, F.; Prota, A. Analysis of the strain-rate behavior of a basalt fiber reinforced natural hydraulic mortar. Cem. Concr. Compos. 2014, 53, 52–58. [Google Scholar] [CrossRef]
  41. Santarelli, M.L.; Sbardella, F.; Zuena, M.; Tirillò, J.; Sarasini, F. Basalt fiber reinforced natural hydraulic lime mortars: A potential bio-based material for restoration. Mater. Des. 2014, 63, 398–406. [Google Scholar] [CrossRef]
  42. Almeida, J.A.; Bordigoni, D.; Pereira, E.B.; Barros, J.A.; Aprile, A. Assessment of the properties to characterise the interface between clay brick substrate and strengthening mortar. Constr. Build. Mater. 2016, 103, 47–66. [Google Scholar] [CrossRef]
  43. Asteris, P.G.; Argyropoulos, I.; Cavaleri, L.; Rodrigues, H.; Varum, H.; Thomas, J.; Lourenço, P.B. Masonry compressive strength prediction using artificial neural networks. In Transdisciplinary Multispectral Modeling and Cooperation for the Preservation of Cultural Heritage; Communications in Computer and Information Science; Springer: Cham, Switzerland, 2019. [Google Scholar] [CrossRef]
  44. Zahra, T.; Dhanasekar, M. Prediction of masonry compressive behaviour using a damage mechanics inspired modelling method. Constr. Build. Mater. 2016, 109, 128–138. [Google Scholar] [CrossRef]
  45. EN 1015-3:1999; Methods of Test for Mortar for Masonry—Part 3: Determination of Consistence of Fresh Mortar (by Flow Table). Comité Européen de Normalisation: Brussels, Belgium, 2004.
  46. EN 1015-7:1999; Methods of Test for Mortar for Masonry—Part 7: Determination of Air Content of Fresh Mortar. Comité Européen de Normalisation: Brussels, Belgium, 2004.
  47. EN 459-1:2010; Building Lime—Part 1: Definitions, Specifications and Conformity Criteria. Comité Européen de Normalisation: Brussels, Belgium, 2010.
  48. EN 197-1:2011; Cement. Composition, Specifications and Conformity Criteria for Common Cements. Comité Européen de Normalisation: Brussels, Belgium, 2011; pp. 1–50.
  49. EN 13139:2013; Aggregates for Mortar. Comité Européen de Normalisation: Brussels, Belgium, 2013.
  50. EN 196-1:2005; Methods of Testing Cement—Part 1: Determination of Strength. Comité Européen de Normalisation: Brussels, Belgium, 2005.
  51. EN 1015-10:1999; Methods of Test for Mortar for Masonry—Part 10: Determination of Dry Bulk Density of Hardened Mortar. Comité Européen de Normalisation: Brussels, Belgium, 2006.
  52. EN 12390-13:2013; Testing Hardened Concrete. Part 13: Determination of Secant Modulus of Elasticity in Compression. Comité Européen de Normalisation: Brussels, Belgium, 2013.
  53. EN 1015-11:1999; Methods of Test Mortar for Masonry—Part 11: Determination of Flexural and Compressive Strength of Hardened Mortar. Comité Européen de Normalisation: Brussels, Belgium, 1999.
  54. González, D.C.; Rahman, M.; Mínguez, J.; Vicente, M.A.; Hindi, R. Influence of fibers and curing conditions on the pore morphology in plain and fiber-reinforced high-performance concrete through the use of computed tomography scan technology. Appl. Sci. 2020, 10, 4286. [Google Scholar] [CrossRef]
  55. Lanas, J.; Bernal, J.P.; Bello, M.; Galindo, J.A. Mechanical properties of natural hydraulic lime-based mortars. Cem. Concr. Res. 2004, 34, 2191–2201. [Google Scholar] [CrossRef]
  56. Jang, S.-J.; Yun, H.-D. Combined effects of steel fiber and coarse aggregate size on the compressive and flexural toughness of high-strength concrete. Compos. Struct. 2018, 185, 203–211. [Google Scholar] [CrossRef]
  57. Naaman, A.E.; Reinhardt, H.W. High Performance Fiber Reinforced Cement Composites HPFRCC-4: International RILEM Workshop. Mater. Struct. 2003, 36, 710–712. [Google Scholar] [CrossRef]
  58. Rilem TC 49-TFR. Test for the determination of modulus of rupture and limit of proportionality of thin fibre reinforced cement section. Mater Struct. 1984, 17, 161–163. [Google Scholar]
  59. Jansen, D.C.; Shah, S.P.; Jansen, M.D.C.; Member, A. Effect of Length on Compressive Strain Softening of Concrete. J. Eng. Mech. 1997, 123, 25–35. [Google Scholar] [CrossRef]
  60. Vasconcelos, G. Experimental Investigations on the Mechanics of Stone Masonry: Characterization of Granites and Behavior of Ancient Masonry Shear Walls. Ph.D. Dissertation, University of Minho, Braga, Portugal, 2005. [Google Scholar]
  61. Nataraja, M.; Dhang, N.; Gupta, A. Stress–strain curves for steel-fiber reinforced concrete under compression. Cem. Concr. Compos. 1999, 21, 383–390. [Google Scholar] [CrossRef]
  62. Bhargava, P.; Sharma, U.K.; Kaushik, S.K. Compressive Stress-Strain Behavior of Small Scale Steel Fibre Reinforced High Strength Concrete Cylinders. J. Adv. Concr. Technol. 2006, 4, 109–121. [Google Scholar] [CrossRef]
  63. EN 1992-1-1:2004; Eurocode 2: Design of Concrete Structures—Part 1-1: General Rules and Rules for Buildings. CEN: Brussels, Belgium, 2004.
  64. Banthia, N.; Mindess, S. Toughness Characterization of Fiber-Reinforced Concrete: Which Standard to Use? J. Test. Evaluation 2004, 32, 11901. [Google Scholar] [CrossRef]
  65. JSCE. JSCE-SF4 Method of Tests for Flexural Strength and Flexural Toughness of Steel Fiber Reinforced Concrete; JSCE: Tokyo, Japan, 1984. [Google Scholar]
  66. Pakravan, H.R.; Jamshidi, M.; Latifi, M. Performance of fibers embedded in a cementitious matrix. J. Appl. Polym. Sci. 2010, 116, 1247–1253. [Google Scholar] [CrossRef]
  67. ASTM C1018-97; Standard Test Method for Flexural Toughness and First-Crack Strength of Fiber-Reinforced Concrete (Using Beam with Third-Point Loading). American Society for Testing and Materials: West Conshohocken, PA, USA, 1997. [CrossRef]
  68. ASTM C1609; Standard Test Method for Flexural Performance of Fiber-Reinforced Concrete (Using Beam with Third-Point Loading). American Society for Testing and Materials: West Conshohocken, PA, USA, 2012; pp. 1–9.
  69. C1399/C1399M; Standard Test Method for Obtaining Average Residual-Strength of Fiber-Reinforced. American Society for Testing and Materials: West Conshohocken, PA, USA, 2010; pp. 1–6. [CrossRef]
Figure 1. Flexural and compressive strength of FRM’s developed by different authors [28,29,30,31,32,33,34,35,36,37,38,39,40,41].
Applsci 14 01947 g001
Figure 2. Grading curve for the limestone sand and CEN Reference sand.
Applsci 14 01947 g002
Figure 3. Mixing procedure of the FRM.
Applsci 14 01947 g003
Figure 4. Equipment used to characterize the fresh behaviour of the mixtures: (a) flow table; (b) container to determine the air content of FRM.
Applsci 14 01947 g004
Figure 5. Images showing the setup used for evaluating the (a) elasticity modulus in compression; (b) compressive strength; and (c) flexural strength.
Applsci 14 01947 g005
Figure 6. Flow table test results obtained for the different mixtures after 15 strokes.
Applsci 14 01947 g006
Figure 7. Fresh behaviour characterization: (a) flow values obtained for different amounts of fibres; (b) fresh density and air content values obtained for different fibre fractions.
Applsci 14 01947 g007
Figure 8. Typical compressive stress vs. average axial compressive strain responses obtained for mortars with different fibre fractions: (a) specimens cured in 60% RH; (b) specimens cured at 85% RH.
Applsci 14 01947 g008
Figure 9. Compressive behaviour of mixtures in two different curing environments: (a) compressive strength; (b) elastic modulus.
Applsci 14 01947 g009
Figure 10. Schematic representation of the flexural response and approach adopted to correct the experimental setup adjustments during loading [37].
Applsci 14 01947 g010
Figure 11. Typical flexural stress vs. displacement responses obtained from flexure tests: (a) specimens cured in 60% RH; (b) specimens cured at 85% RH.
Applsci 14 01947 g011aApplsci 14 01947 g011b
Figure 12. RH 60 and 85% curing conditions: (a) modulus of rupture; (b) limit of proportionality.
Applsci 14 01947 g012
Figure 13. Method to calculate the work of fracture in compression [59,60].
Applsci 14 01947 g013
Figure 14. Compression fracture energy for different curing conditions: (a) RH 60; (b) RH 85.
Applsci 14 01947 g014
Figure 15. Definition of compressive toughness ratio [61,62].
Applsci 14 01947 g015
Figure 16. Toughness ratio for RH 60 and 85 curing conditions: (a) TRc,3; (b) TRc,5.
Applsci 14 01947 g016
Figure 17. Relation between compressive strength and toughness ratio, TRc,3 and TRc,5 for RH60 and RH85.
Applsci 14 01947 g017
Figure 18. Definition of flexural toughness ratio [65].
Applsci 14 01947 g018
Figure 19. Toughness values for RH 60% and 85% curing conditions: (a) flexural toughness (FT); (b) flexural toughness factor Re(l/150).
Applsci 14 01947 g019
Figure 20. Relation between flexural strength and toughness ratio.
Applsci 14 01947 g020
Figure 21. Efficiency of fibre reinforcement showed by the normalized flexural strength: (a) FRM with Portland cement and Geopolymeric binders [28,30,33]; (b) FRM with NHL binders [35,36,37].
Applsci 14 01947 g021
Figure 22. Efficiency of fibre reinforcement on the flexural toughness ratio: (a) FRM with Portland cement and Geopolymeric binders (10SF means 10% replacement of CEM by silica fume) [28,30,32,34]; (b) FRM with NHL binders (20Zeo means 20% replacement of NHL by zeolite and 20Tuff stands for 20%replacement of NHL by tuff) [36,37,38,40].
Applsci 14 01947 g022
Figure 23. Flexural strength vs. flexural toughness ratio from FRM [28,30,32,34,35,36,37,38,40,41].
Applsci 14 01947 g023
Table 1. Properties from the commercially available NHL 5.0, according to the manufacturer.
Physical Properties
Fineness (>90 µm)(%)≤15.0
Fineness (>200 µm)(%)≤2.0
Setting time, start (hour)>1
Setting time, final(hour)≤15
Chemical Properties
(Sulphate) SO3 (%)≤2
(Free Lime) Ca(OH)2(%)≥15
(Anhydrite) CaSO4(%)<1
Mechanical Properties
Compressive strength at 7 days(MPa)≥2
Compressive strength at 28 days(MPa)≥5.0 and ≤15.0
Table 2. Properties of PAN fibres, according to the manufacturer.
Density(g/cm3)1.17
Length(mm)6
Fineness(dtex)2.5
Tensile strength(MPa)580
Elongation(%)14–18
Elastic Modulus(GPa)10.4
Table 3. Composition of the mortars.
vol. (%)Weight of Components (kg/m3)
MixtureFibresNHL 5.0CEM Br.SandWaterPAN Fibres
R0.00%663.966.4995.9328.60.0
F_0.250.25%662.266.2993.3327.82.9
F_0.500.50%660.466.0990.6326.95.9
F_0.750.75%658.765.9988.0326.08.8
F_1.001.00%656.965.7985.4325.211.7
Table 4. Results for uniaxial compression tests of specimens cured in 60% RH and 85% RH.
RH60_20_28RH85_20_28
σ m a x σ ¯ m a x ( C o V ) ε σ m a x ε ¯ σ m a x ( C o V ) σ m a x ρ ¯ m a x ( C o V ) ε σ m a x ε ¯ σ m a x ( C o V )
Specimen(MPa)MPa (%)(mm/mm)mm/mm (%)(MPa)MPa (%)(mm/mm)mm/mm (%)
R_015.8 0.002 12.8 0.005
R_028.9 0.003 13.2 0.006
R_038.3 0.002 11.7 0.004
R_046.77.4 (17)0.0020.002 (16)12.412.5 (5)0.0040.005 (15)
F0.25_019.3 0.002 13.5 0.004
F0.25_029.2 0.002 13.3 0.004
F0.25_038.6 0.003 14.1 0.004
F0.25_048.18.8 (6)0.0020.002 (9)12.513.3 (4)0.0040.004 (7)
F0.50_019.6 0.003 12.3 0.003
F0.50_0210.7 0.003 12.6 0.004
F0.50_0310.2 0.003 12.4 0.004
F0.50_0410.510.2 (4)0.0030.003 (3)12.912.6 (2)0.0030.004 (7)
F0.75_018.5 0.004 11.3 0.004
F0.75_0210.9 0.004 11.8 0.004
F0.75_039.9 0.004 11.2 0.004
F0.75_0410.910 (10)0.0040.004 (4)10.811.3 (3)0.0050.004 (12)
F1.00_019.2 0.004 10.6 0.008
F1.00_027.4 0.003 10.3 0.006
F1.00_038.9 0.005 10.3 0.004
F1.00_048.58.5 (8)0.0050.004 (22)10.910.5 (2)0.0050.006 (20)
Table 5. Flexural test results of specimens cured at 85% RH for 7, 28 and 90 days and 60% RH for 28 and 90 days.
RH85_20RH60_20_28
7 Days28 Days90 Days28 Days90 Days
f d f , m a x f d f , m a x f d f , m a x f d f , m a x f d f , m a x
SpecimenMPa (%)mm (%)MPa (%)mm (%)MPa (%)mm (%)MPa (%)mm (%)MPa (%)mm (%)
R_012.020.162.780.123.910.122.020.162.490.17
R_022.020.153.180.194.190.132.020.152.210.12
R_032.570.183.250.183.50.112.570.182.50.11
A v . ( C o V ) 2.2 (12)0.16 (8)3.07 (7)0.16 (19)3.87 (7)0.12 (7)2.2 (12)0.16 (8)2.40 (6)0.13 (17)
F0.25_011.920.114.140.214.40.151.920.112.970.12
F0.25_021.880.153.880.144.750.161.880.153.160.14
F0.25_032.050.174.10.153.950.142.050.173.710.16
A v . ( C o V ) 1.95 (4)0.14 (16)4.04 (3)0.17 (17)4.37 (7)0.15 (6)1.95 (4)0.14 (16)3.28 (9)0.14 (10)
F0.50_013.260.424.670.255.120.183.260.424.10.15
F0.50_022.920.444.230.194.810.182.920.444.80.16
F0.50_032.630.374.460.284.430.162.630.374.620.15
A v . ( C o V ) 2.94 (9)0.41 (7)4.45 (4)0.24 (17)4.79 (6)0.17 (8)2.94 (9)0.41 (7)4.50 (7)0.15 (4)
F0.75_013.560.386.060.325.870.293.560.3850.16
F0.75_023.350.355.410.365.370.283.350.355.450.28
F0.75_033.370.435.410.346.050.33.370.434.930.17
A v . ( C o V ) 3.42 (3)0.39 (9)5.63 (5)0.34 (5)5.77 (5)0.29 (4)3.42 (3)0.39 (9)5.13 (4)0.20 (27)
F1.00_013.750.516.450.36.630.283.750.514.610.25
F1.00_023.470.535.950.36.690.363.470.536.410.28
F1.00_033.360.466.220.396.770.333.360.465.760.27
A v . ( C o V ) 3.53 (5)0.5 (6)6.21 (3)0.33 (12)6.70 (1)0.33 (10)3.53 (5)0.5 (6)5.59 (13)0.27 (6)
Disclaimer/Publisher’s Note: The statements, opinions and data contained in all publications are solely those of the individual author(s) and contributor(s) and not of MDPI and/or the editor(s). MDPI and/or the editor(s) disclaim responsibility for any injury to people or property resulting from any ideas, methods, instructions or products referred to in the content.

