Article

Assessment of Engineering Behavior and Water Resistance of Stabilized Waste Soils Used as Subgrade Filling Materials

1
School of Civil Engineering, Hunan University of Science and Technology, Xiangtan 411201, China
2
School of Geosciences and Info-Physics, Central South University, Changsha 410083, China
*
Author to whom correspondence should be addressed.
Appl. Sci. 2024, 14(5), 1901; https://doi.org/10.3390/app14051901
Submission received: 20 January 2024 / Revised: 15 February 2024 / Accepted: 18 February 2024 / Published: 26 February 2024
(This article belongs to the Section Civil Engineering)

Abstract

:
Urban construction has generated substantial amounts of waste soils, impeding urban ecological development. With the aim of promoting waste recycling, waste soils possess a high potential for sustainable utilization in subgrade construction. However, these waste materials exhibit inadequate engineering properties and necessitate stabilization for an investigation into their long-term performance as subgrade filling materials. Initially, a thorough assessment and comparison were conducted to examine the key mechanical properties of lime- and cement-stabilized soils with mixed ratios (total stabilizer contents ranging from 2% to 8%). The results indicated that these soils met the requirements of subgrade materials except for the 2% lime-treated soil. Subsequently, to reveal the improvement in water resistance of stabilized waste soil (e.g., under conditions of rainfall or elevated groundwater table), the effects of soil densities and stabilizer contents on the disintegration characteristics were investigated using a range of disintegration tests. An evolutionary model for the disintegration ratio of stabilized soils was then developed to predict the process of disintegration breakage. This model facilitates the quantification of the lower disintegration rates and elevated disintegration time attributed to higher levels of compactness and stabilizer contents during a three-stage disintegration process. This enhances the understanding and evaluation of sustainable applications in stabilized waste soils used as subgrade filling materials.

1. Introduction

Engineering waste soil usually refers to the soil generated in the construction and demolition of all kinds of buildings, structures, roads, pipelines and so on. With the acceleration of urbanization in China, an astonishing amount of waste soil is excavated and disposed of in spoil grounds or landfills each year [1]. For example, the output of waste soil from Shaoxing in the Zhejiang province reached 20 million tons in 2020, accounting for about 80% of construction waste, and it is growing at an annual rate of over 10% [2]. Massive waste soil has brought a series of problems, such as high disposal costs, occupation of urban land, damage to the ecological environment and potential safety hazards [3]. On the other hand, the crushed rock used as subgrade materials is costly and in shortage due to the prohibition of large-scale mining [4]. Therefore, there is an urgent need to explore sustainable methods of resource utilization for engineering waste soils.
To address these challenges, an effective and economical strategy entails utilizing substantial quantities of waste soil as subgrade filling materials after soil stabilization [5], providing huge social, economic and environmental benefits. Various types of waste soils are generated in urban construction, each with distinct properties. In the coastal areas of the Zhejiang North Plain, for instance, the waste soil is characterized by fine particles, high moisture content, significant porosity and low strength, rendering it unsuitable for direct use in roadbed filling. Therefore, the key to achieving the goal is to improve the mechanical properties and to bear the capacity of the waste soils so that they meet the requirements of the subgrade filling. An efficient approach involves the use of additives as stabilizers, which are proven to enhance the subgrade performance and water resistance of waste soils [6]. Lime, often combined with cement, is frequently employed for soil stabilization due to its cost-effectiveness, accessibility and environmental friendliness [7]. After undergoing lime treatment, soils that contain a large amount of clay minerals exhibit significant improvements in their physical and mechanical properties, including compaction and consolidation properties, compressive and shear strength, swelling and shrinking deformation, durability and micro-pore structure, etc. [8,9,10,11,12,13,14], and the bearing capacity is one of the key mechanical properties for subgrade filler [15,16,17].
The hydration reaction of lime consumes large amounts of water in the soil and creates a high pH environment, and then the flocculation reaction and the pozzolanic reaction enhance the soil mechanical indexes, which form three main gels (calcium silicate hydrates, calcium aluminate hydrates and calcium sulfoaluminate hydrates) bonding the particles within the clay aggregates [18]. The strength of lime-treated soil undergoes a gradual enhancement over several weeks due to the time-dependent pozzolanic reaction [19]. In terms of the improvement effect of mechanical indexes, the optimal amount of lime varies with soil type, mineralogy, composition and particle size distribution. According to Bell [20], the optimum addition of lime for the compressive strength of montmorillonite was approximately 4% by weight, whereas for kaolinite and quartz, it ranged between 4% and 6%. The work of Al-Rawas [10] indicated a significant reduction in both the swell percentage and swell pressure of expansive soils when the lime addition exceeded 6%. Ouhadi [21] reported that a minimum of 6% lime is required as an additive to improve the plasticity properties of soft clay. Soil properties typically vary significantly from one region to another, and the mixing ratio plays a crucial role in influencing the enhanced soil mechanics, improvement cost and duration of improvement. Therefore, a comprehensive assessment of the effectiveness and enhancement of the engineering properties of treated soils is indispensable for the design and construction of subgrades.
Compared with soils treated using lime, cement-stabilized soils present a relatively higher strength [22]. This is mainly associated with the formation of additional calcium aluminate hydrates (CAH) that could create a strongly bonded fabric within the soil [23]. The cement paste formed by cement hydration usually sets and hardens into a hard solid within a few hours [23]. However, the use of only cement as the stabilizer may not be suitable for the treatment of large-scale waste soils, as the cement-stabilized soils, after hardening, cannot achieve high compactness during the subgrade filling. Combined stabilizers (i.e., lime and cement) are also very popular for improving waste soils [10,11,18,24] because the lime- and cement-stabilized soils obtain the improvement advantages of both cement and lime. There are few studies on the effect of soils with combined and single stabilizers at different contents on-road performance. Moreover, a tailored improvement plan was required through experimentation rather than by replicating experiences from other areas.
So far, the long-term stability performance of modified soil subgrades is also a key issue. Due to rainfall or elevated water tables, the disintegration breakage of improved residual soils often leads to severe settlement and a decrease in the stability of the subgrade [25,26]. The water resistance of the treated subgrade filler is essential to the long-term service performance of the subgrade. A disintegration test is used to test the water resistance of the soil and to evaluate the disintegration characteristics [27,28,29]. Many researchers have conducted water stability experiments on untreated soil and its impact factors, including initial water content [30], temperature [31], sample shape [32], particle size [33], salinity [34], mineral composition [33,35] and micro-structure [36,37], etc., but compactness is rarely considered an important quality control index for subgrade. With respect to the stabilized soils, investigations into water stability have primarily emphasized two aspects: analyzing the concentration changes of cations (e.g., calcium ions, sodium ions, etc.) in the solution of stabilized soils after leaching [8,24,38] and assessing the weakening of strength properties resulting from water immersion [9,26,39]. Little literature has been found on disintegration characteristics for stabilized soils; moreover, there is a lack of relevant disintegration models to describe the evolution of disintegration characteristics of stabilized soils, which can be useful for the design of subgrade engineering.
To address the mentioned concerns, this work delves into laboratory test results and examines the evolution of disintegration breakage in stabilized waste soils. The physical and mechanical parameters of untreated soils, which were the typical waste soils from urban construction in Shaoxing, China, were first determined. Two types of stabilizers, namely lime or lime + cement, were selected considering their suitability for large-scale applications in subgrade construction. Subsequently, the engineering properties of the two stabilized soils with different stabilizer contents were evaluated to identify an appropriate range of stabilizers. The effect of different compactness and stabilizer contents on the disintegration characteristics for untreated and treated waste soils was also revealed. Finally, the evolution model of the disintegration ratio for stabilized soils was derived using the Weibull distribution, and the new formulas to calculate the disintegration rate were derived.

2. Materials and Methods

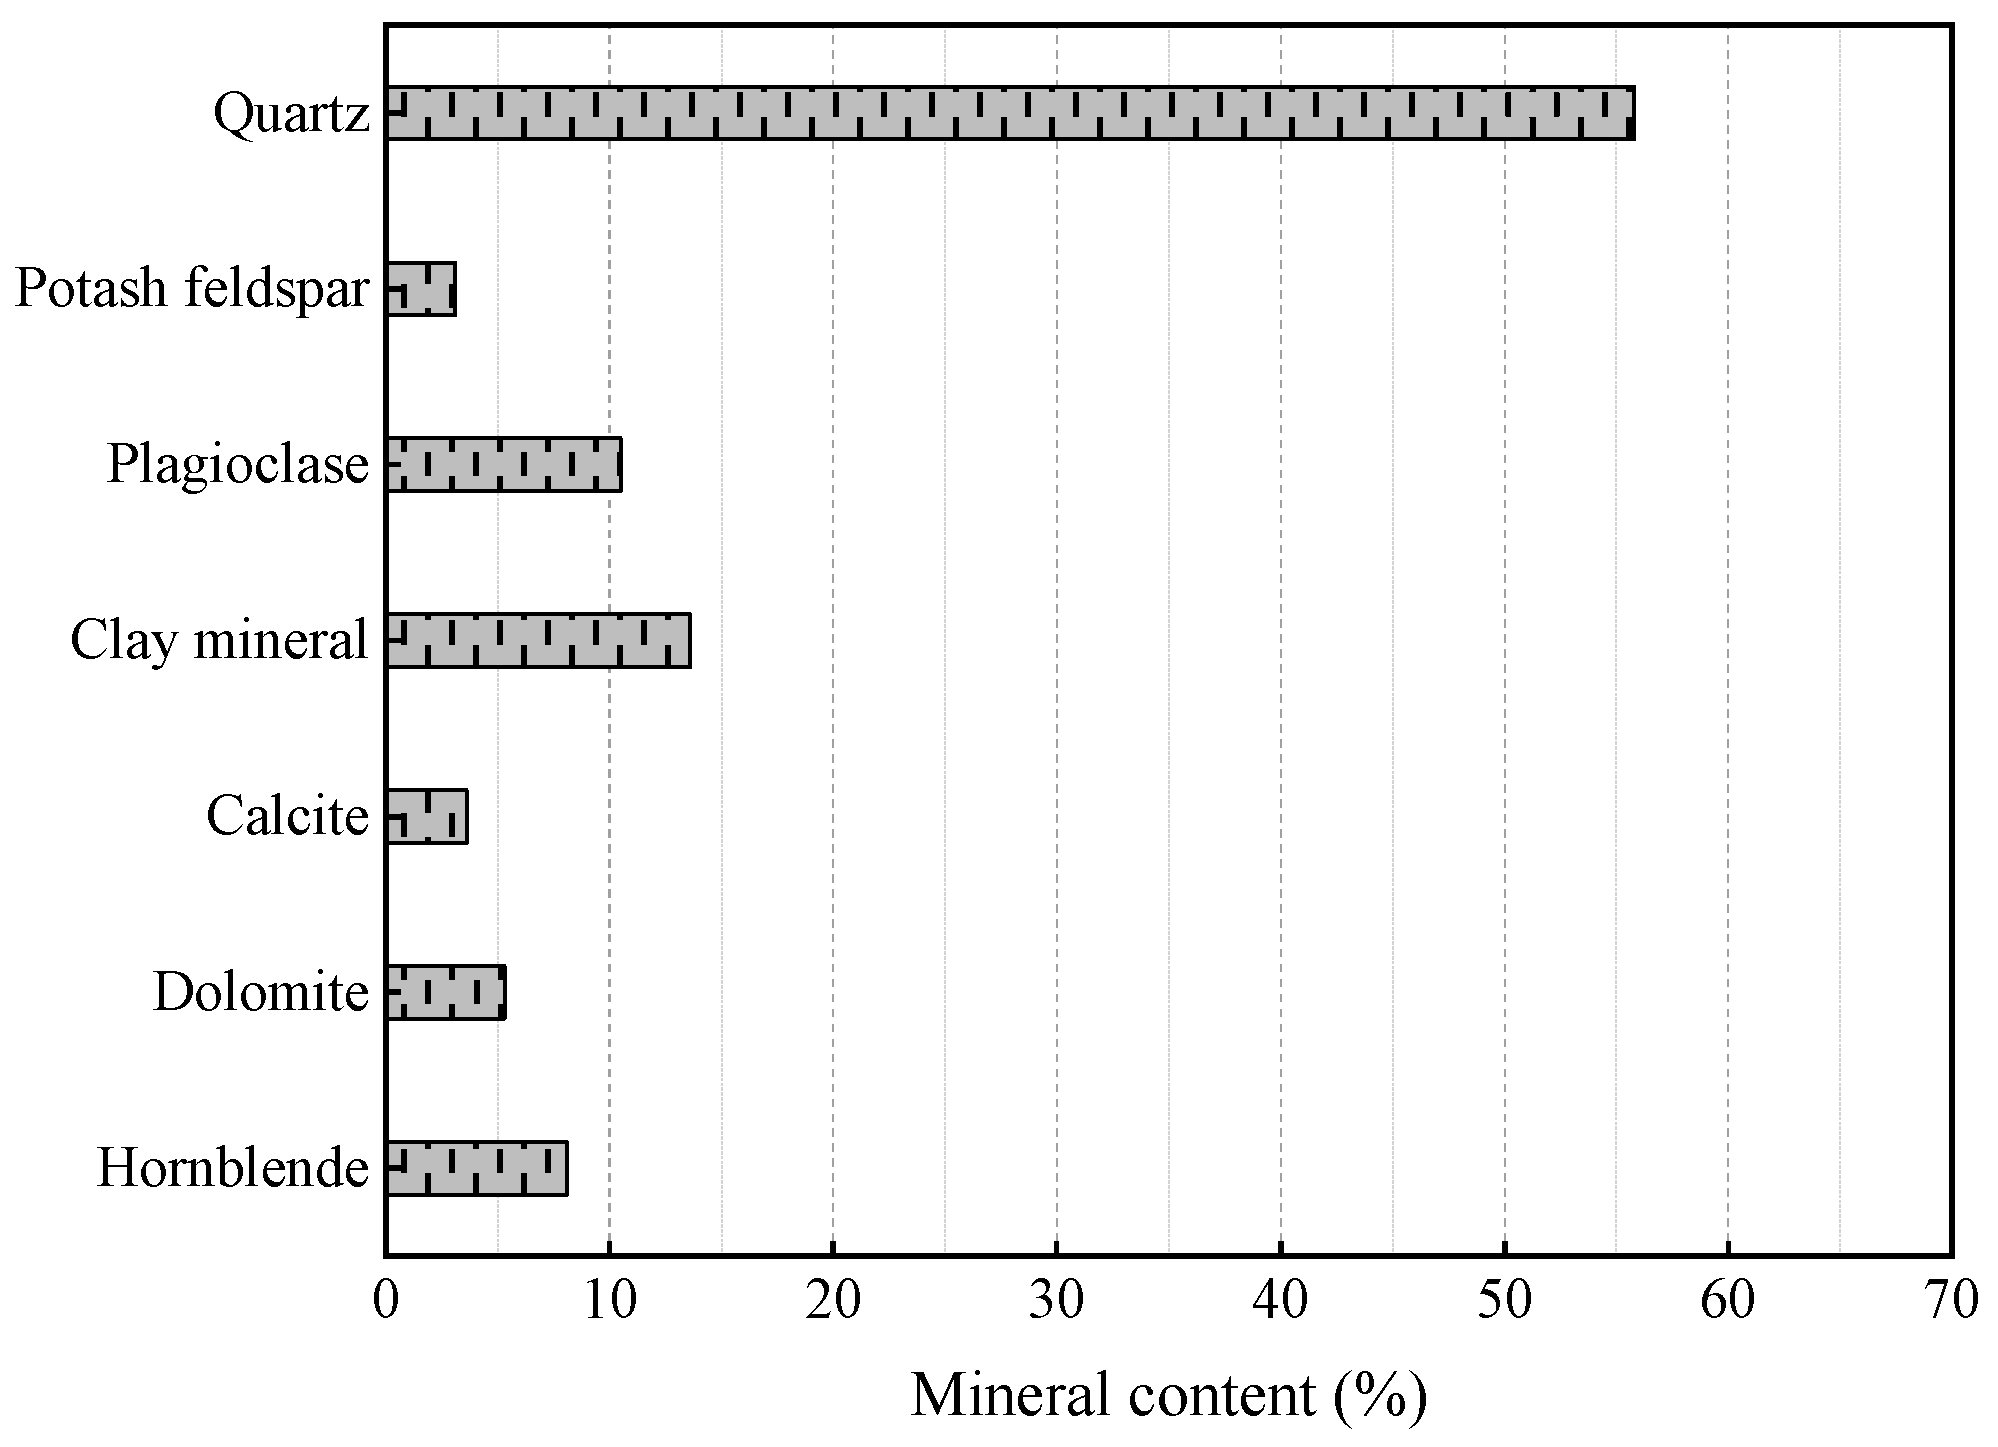
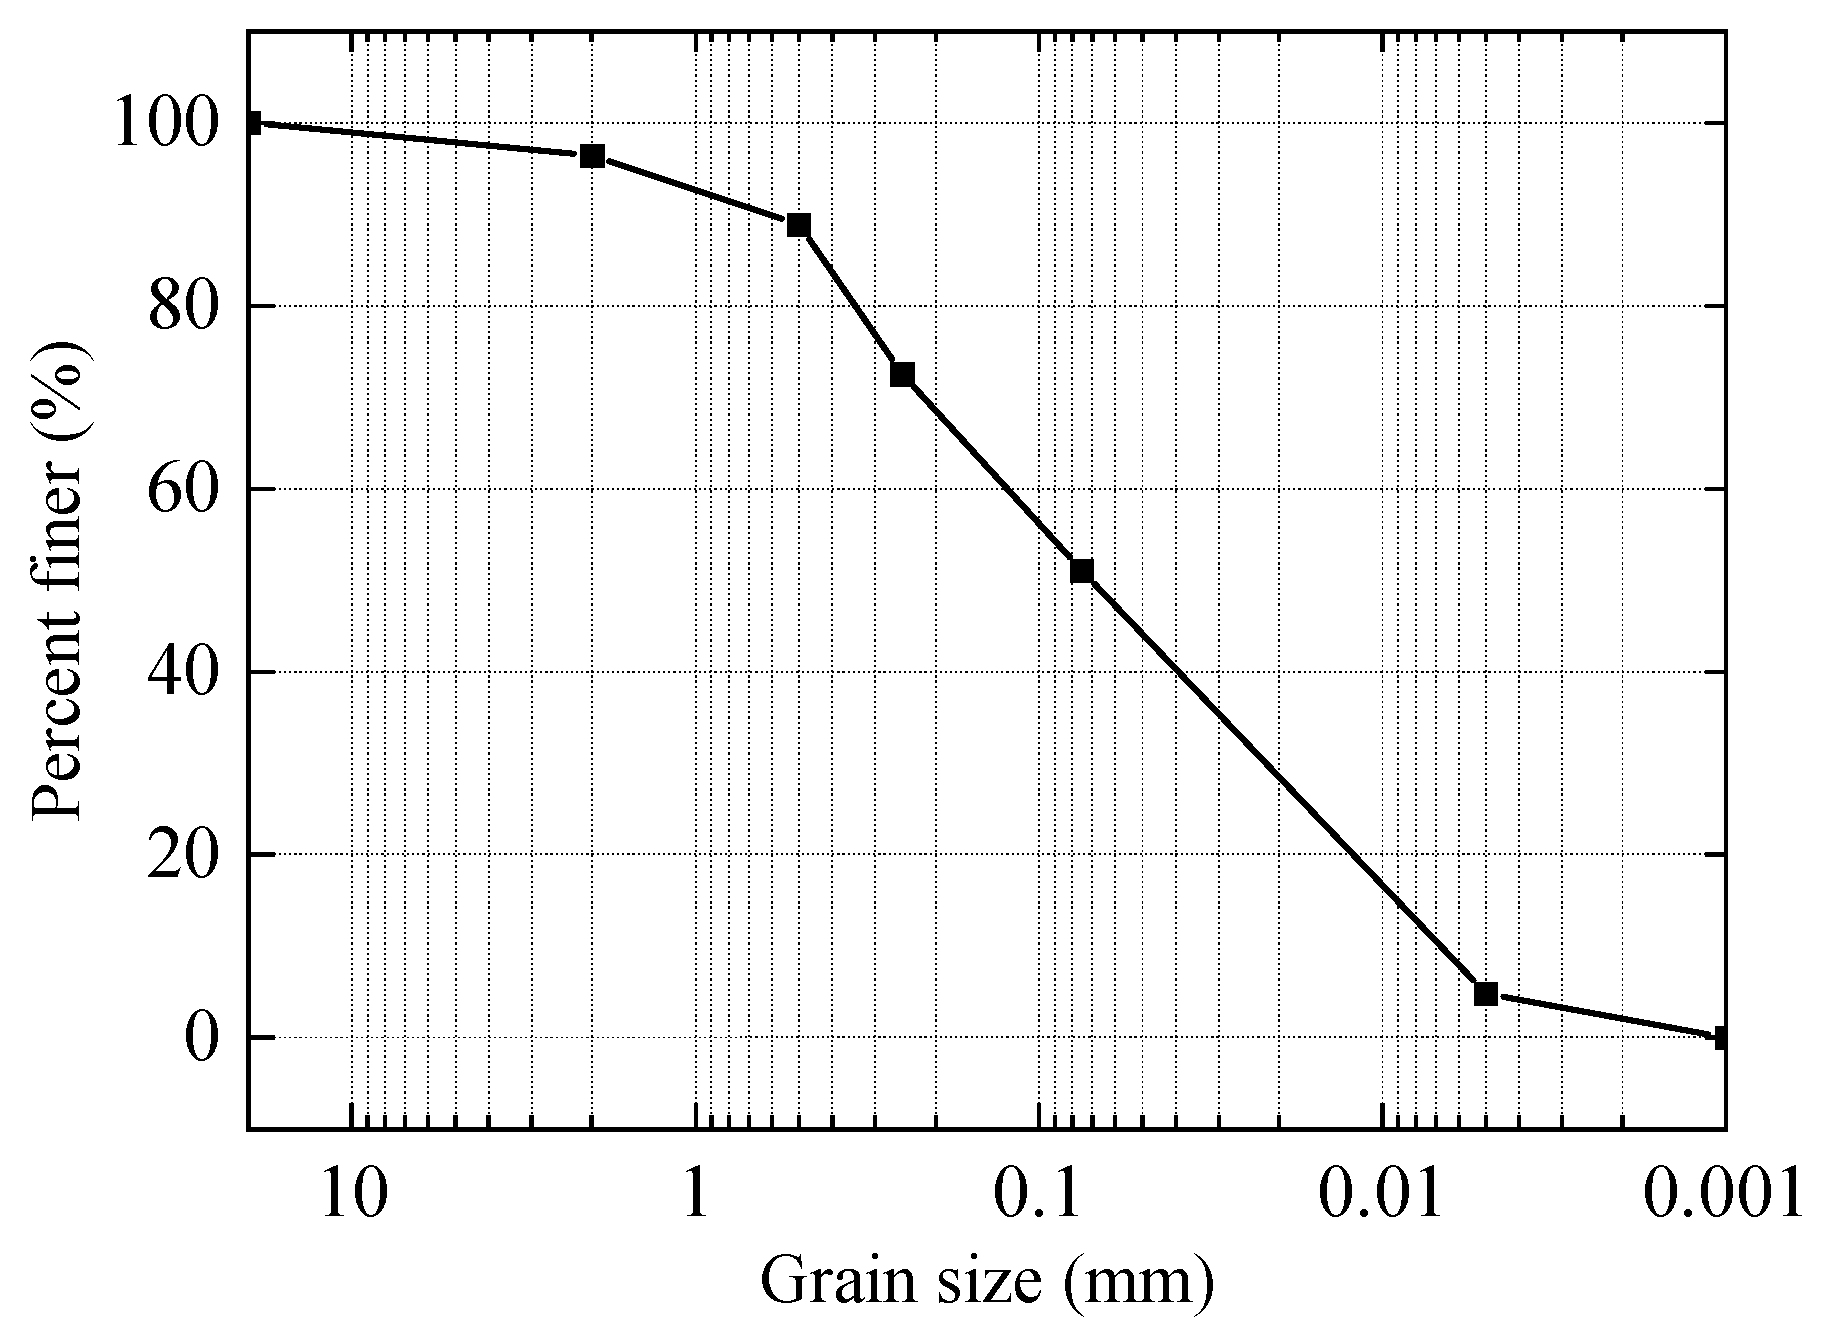
2.1. Physical and Mechanical Properties of Waste Soil

The waste soil samples were collected from the coastal industrial area in Keqiao District, Shaoxing, as shown in Figure 1. This location is situated in the middle latitude with a relatively flat terrain, positioned on the south coast of Hangzhou Bay, China. According to the engineering geological survey, this area is influenced by a subtropical monsoon climate and has plentiful rainfall and well-developed river systems. The buried depth of the groundwater level in this area is generally from 0.1 m to 1.4 m. The underground space in this area contains various types of geotechnical soil layers with an uneven distribution. In this work, all the waste soils were obtained from excavations related to pile foundation construction, often reaching depths of up to 50 m below ground level.
The wasted soils tested in the field have a high natural moisture content, more than 40% on average. After removing plastic garbage, plant roots and other junk within the soil, the waste soil was put into a large package by operating a large construction machinery and was then transported to the laboratory. To examine the physical and mechanical parameters of the waste soils, geotechnical tests were performed, adhering to the guidelines specified in the “Test Methods of Soils for Highway Engineering” (JTG 3430-2020) [40].
Waste soil, in appearance, is grayish yellow or greenish gray with plastic, medium toughness and strength. The mineral composition of the waste soil was assessed through X-ray quantitative phase analysis and consisted of approximately 13.6% clay minerals and 86.4% non-clay minerals, including quartz (55.8%), plagioclase (10.5%), hornblende (8.2%) and other minerals, as depicted in Figure 2. The gradation curve obtained from sieve tests is shown in Figure 3, with a d10, d30 and d60 of 0.007, 0.02 and 0.12 mm, respectively. The coefficient of uniformity Cu and coefficient of curvature Cc were determined to be 17.1 and 0.476, respectively, which are calculated using the following formula:
C u = d 60 d 10
C c = d 30 2 d 10 · d 60
The fineness modulus MX of the waste soil was calculated to be 0.7 using the following formula:
MX = [ ( A 0.15 + A 0.3 + A 0.6 + A 1.18 + A 2.36 ) 5 A 4.75 ] / ( 100 A 4.75 ) ,
where A0.15 is accumulated sieve residue percentage of a particle of the size of 0.15 mm, and others are in sequence. The specific gravity was obtained to be 2.603. Based on the results of wL = 35.3 (liquid limit), wP = 21.1 (plastic limit) and the corresponding Ip = 14.2 (plasticity index), the soil was classified as silty clay. This classification adheres to the criteria outlined in “Specification for Design of Highway Subgrade” (JTG D30-2015), which states that the liquid limit should be less than 50% and the plasticity index should be less than 26 [41] for embankment filling materials. The direct shear test showed that cohesion c and internal friction angle φ were 10.47 kPa and 35.88°, respectively. The key parameters and properties of the untreated soil are listed in Table 1.
To ensure sufficient stability and durability for the subgrade, the waste soil cannot be directly used as subgrade filling materials due to the following pending problems. Firstly, the high natural moisture content of the waste soil makes it difficult to meet the required high compactness. Secondly, according to “Specification for Design of Highway Subgrade” (JTG D30-2015) [41], the California bearing ratio (CBR2.5) of the subgrade filler needs to be greater than 8 for high-speed and first-class highways. Moreover, this waste soil sample belongs to fine-grained soil with poor gradation, which has low disintegration resistance and serious particle loss after water immersion. It is of importance to understand the disintegration characteristics of the waste and stabilized soils.

2.2. Modification Scheme and Test Arrangements

To improve the physical and mechanical properties of untreated soil, lime and lime combined with cement were selected as stabilizers with various dosages. The lime used was grade III calcium quicklime powder with content of CaO and MgO of more than 90%. Ordinary portland cement of grade 42.5, whose main chemical components consist of tricalcium silicate, dicalcium silicate, tricalcium aluminate and tetracalcium ferroaluminate, was adopted. The cement fineness was characterized by a specific surface area, which was 350 m2/kg. The literature shows that the optimum rational content for lime or cement is generally less than 9% [10,20,21], and a high stabilizer content would lead to a substantial increase in cost. Therefore, the percentages of lime were 2%, 4%, 6% and 8% as calculated by dry soil weight, while the mixes of soil with 50% lime and 50% cement (1:1) were also prepared at the total additive content of 2%, 4%, 6% and 8%, as indicated in Table 2. The preparation of these improved soil specimens was carried out at the optimum moisture content, except for compaction tests.
Following the process of air-drying, the soil samples were sieved using a 2 mm sieve (10 sieve number), and the resulting moisture content was measured at 28%. For complete drying, the soil samples, together with cement and lime, were placed in an oven set at 105 °C for 24 h. The dried soil samples, along with the measured quantities of lime and cement, were precisely weighed and then combined in a large bucket for manual mixing. Soil samples were prepared by adding different amounts of water and stirred with a mixer for more than 15 min to ensure full contact between the stabilizer and the soil. The mixture was then sealed in plastic bags for laboratory testing after curing the reaction for 7 days in consideration of the rapid construction of the stabilized soil subgrade.

2.2.1. Compaction Test

A group of heavy compaction tests (T 0131-2019 (JTG 3430-2020)) was prepared with 5 specimens. About 25 kg of soil was required before the tests, which allowed for 5 specimens with different moisture contents. The test cylinder used had an inner diameter of 15.2 cm and a height of 17 cm. The specimens were compacted in three layers by a 4.5 kg hammer, and each layer was given 98 hits with a drop distance of 45 cm, resulting in a total compaction work of about 2678 kJ.

2.2.2. CBR Test

Conforming to the specifications outlined in T 0134-2019 (JTG 3430-2020), the test specimens were prepared at the maximum dry density, determined through the heavy compaction test, and at the optimal moisture content. Then, the specimen was immersed for 96 h to reach the most unfavorable condition, and loading plates were installed on its top for the subsequent penetration test. The CBR value was calculated using a unit pressure under penetration of 2.5 mm, with a loading rate of 1.25 mm/s. The expansion ratio of these specimens was measured using a dial indicator before the penetration test. At the end of soaking, the reading of the dial indicator was used, and the expansion ratio was calculated using the following formula:
δ = H 1 H 0 H 0 ,
where δ is the expansion ratio of the specimen after soaking in water, H1 is the height of the specimen at the end of soaking and H0 is the height of the specimen before soaking.

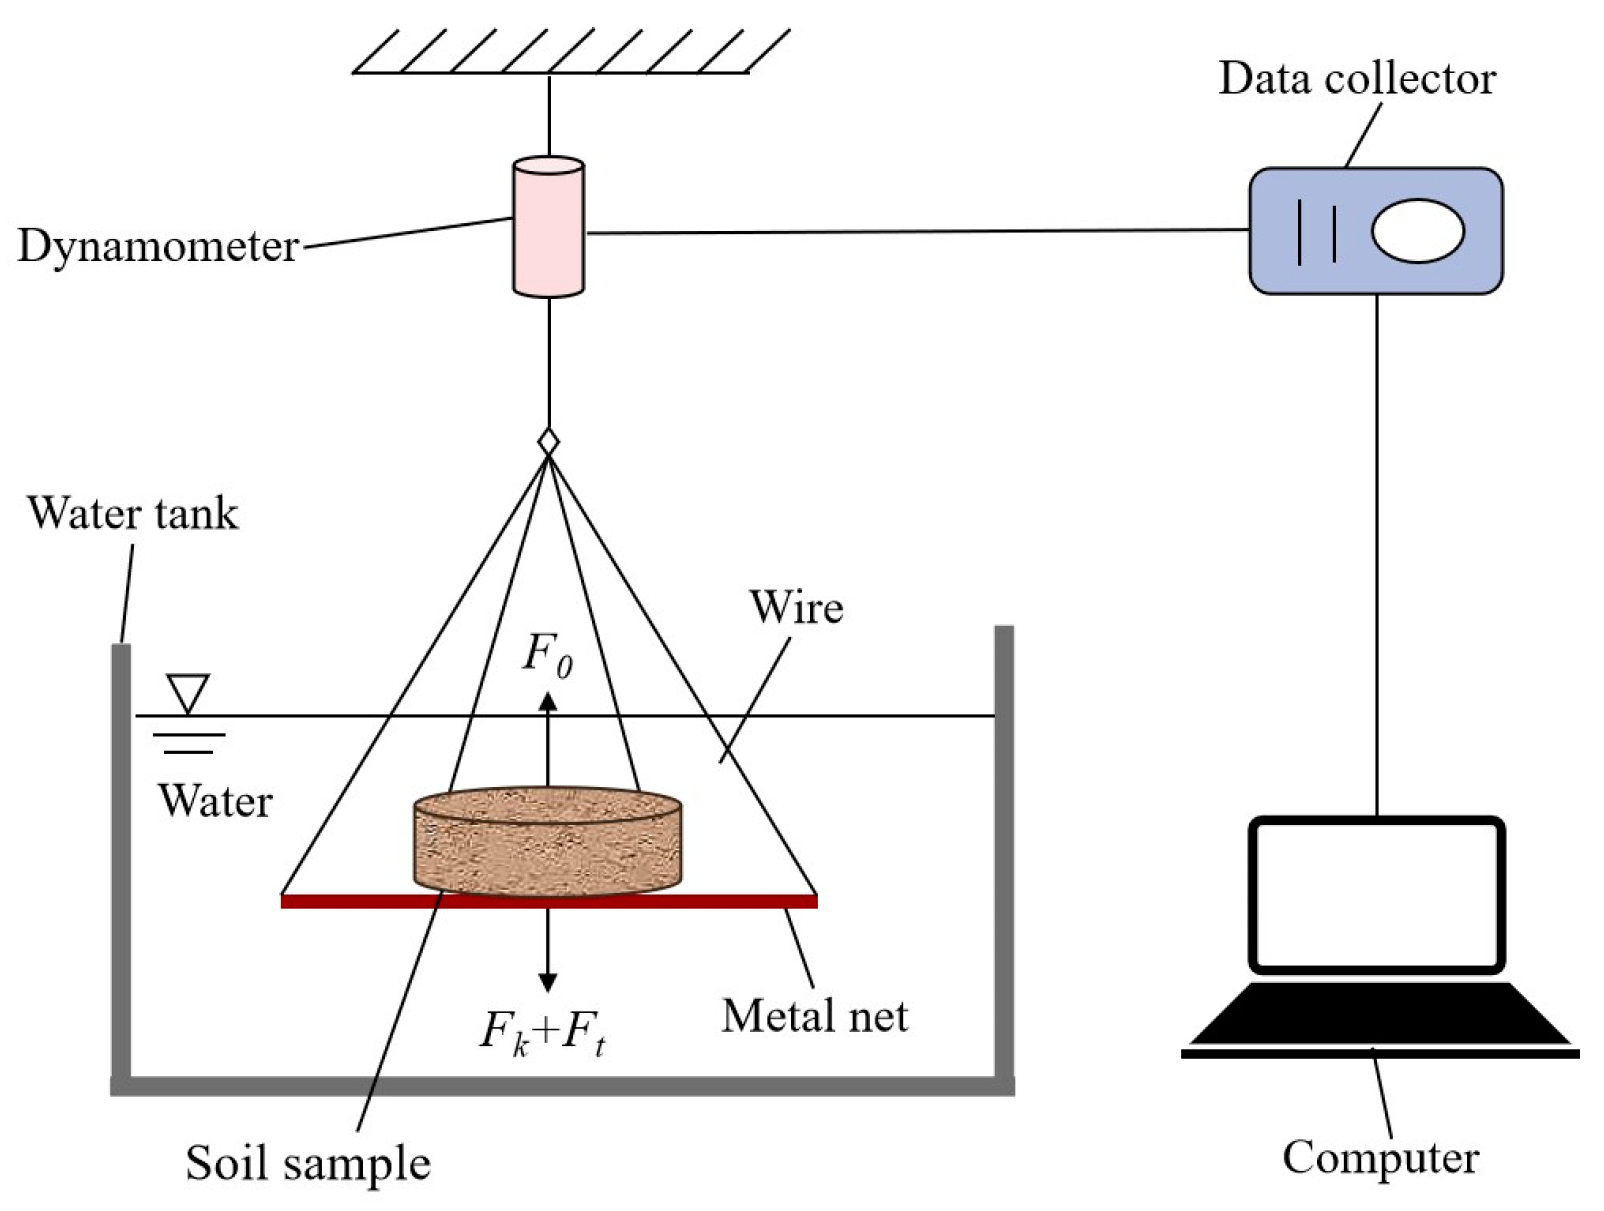
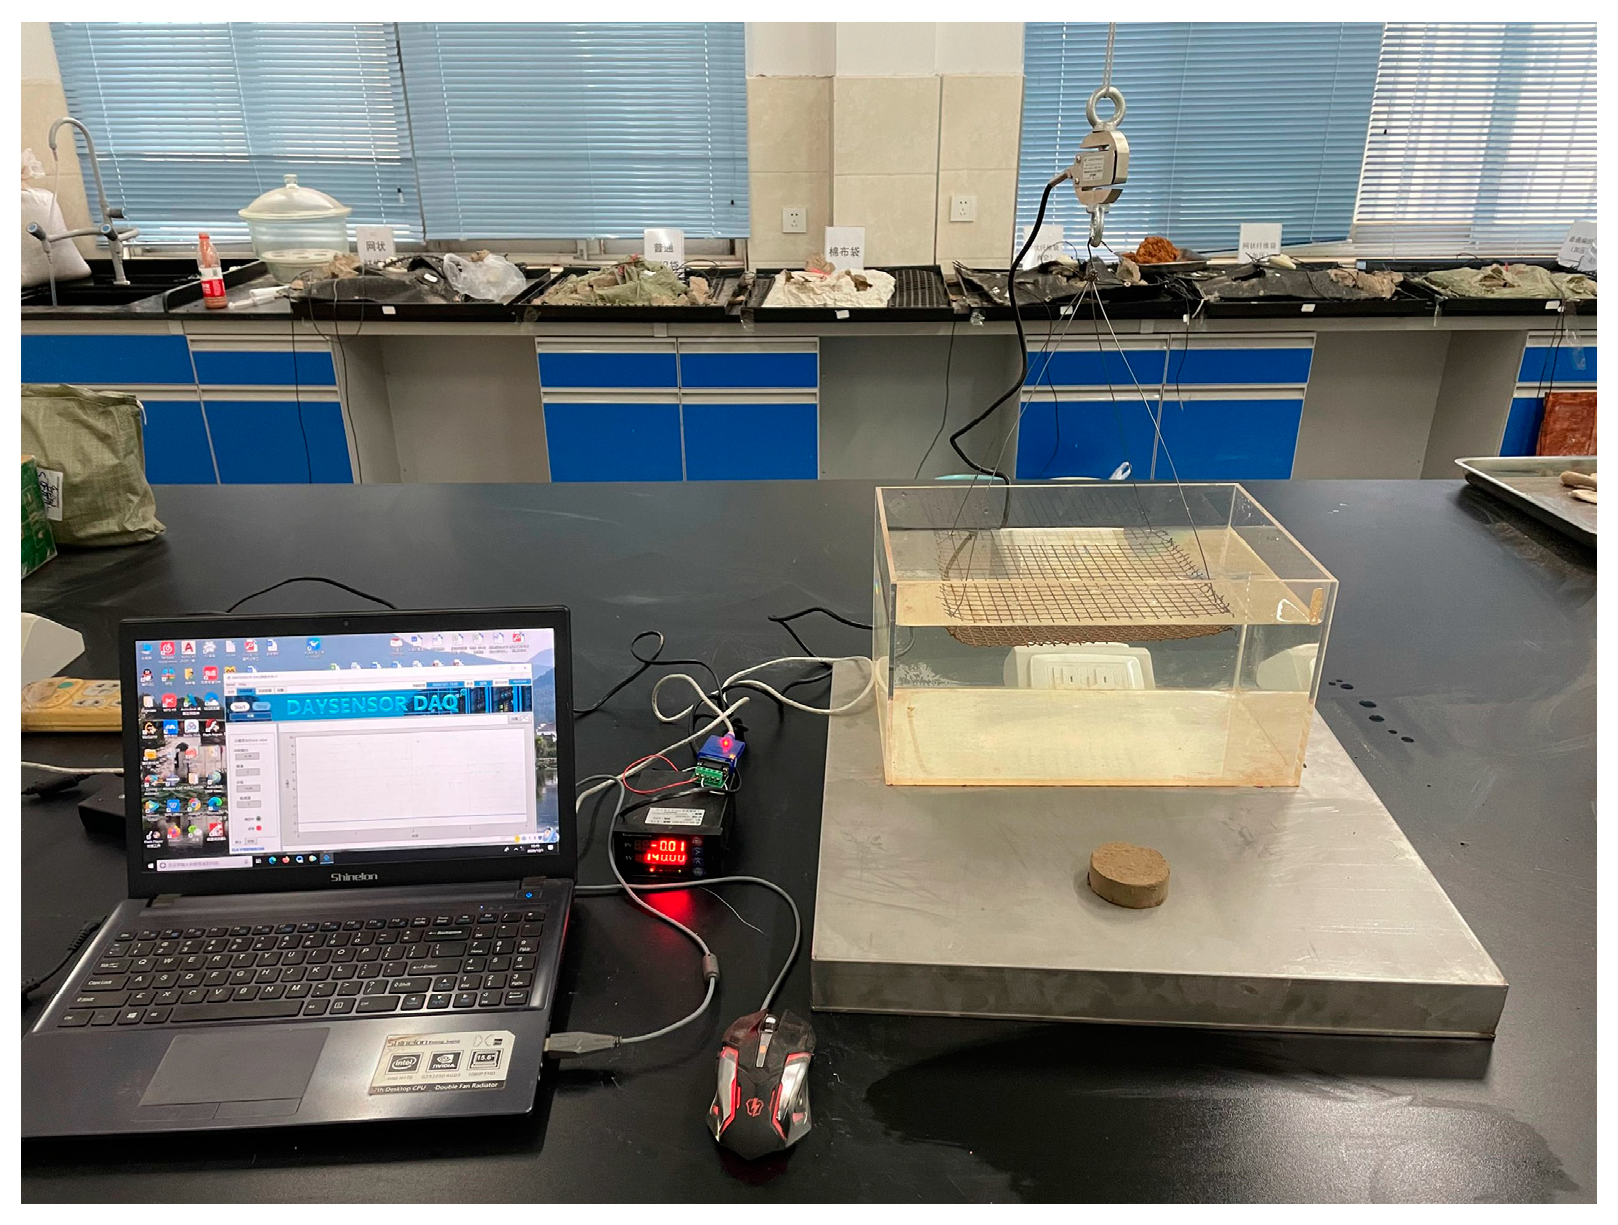
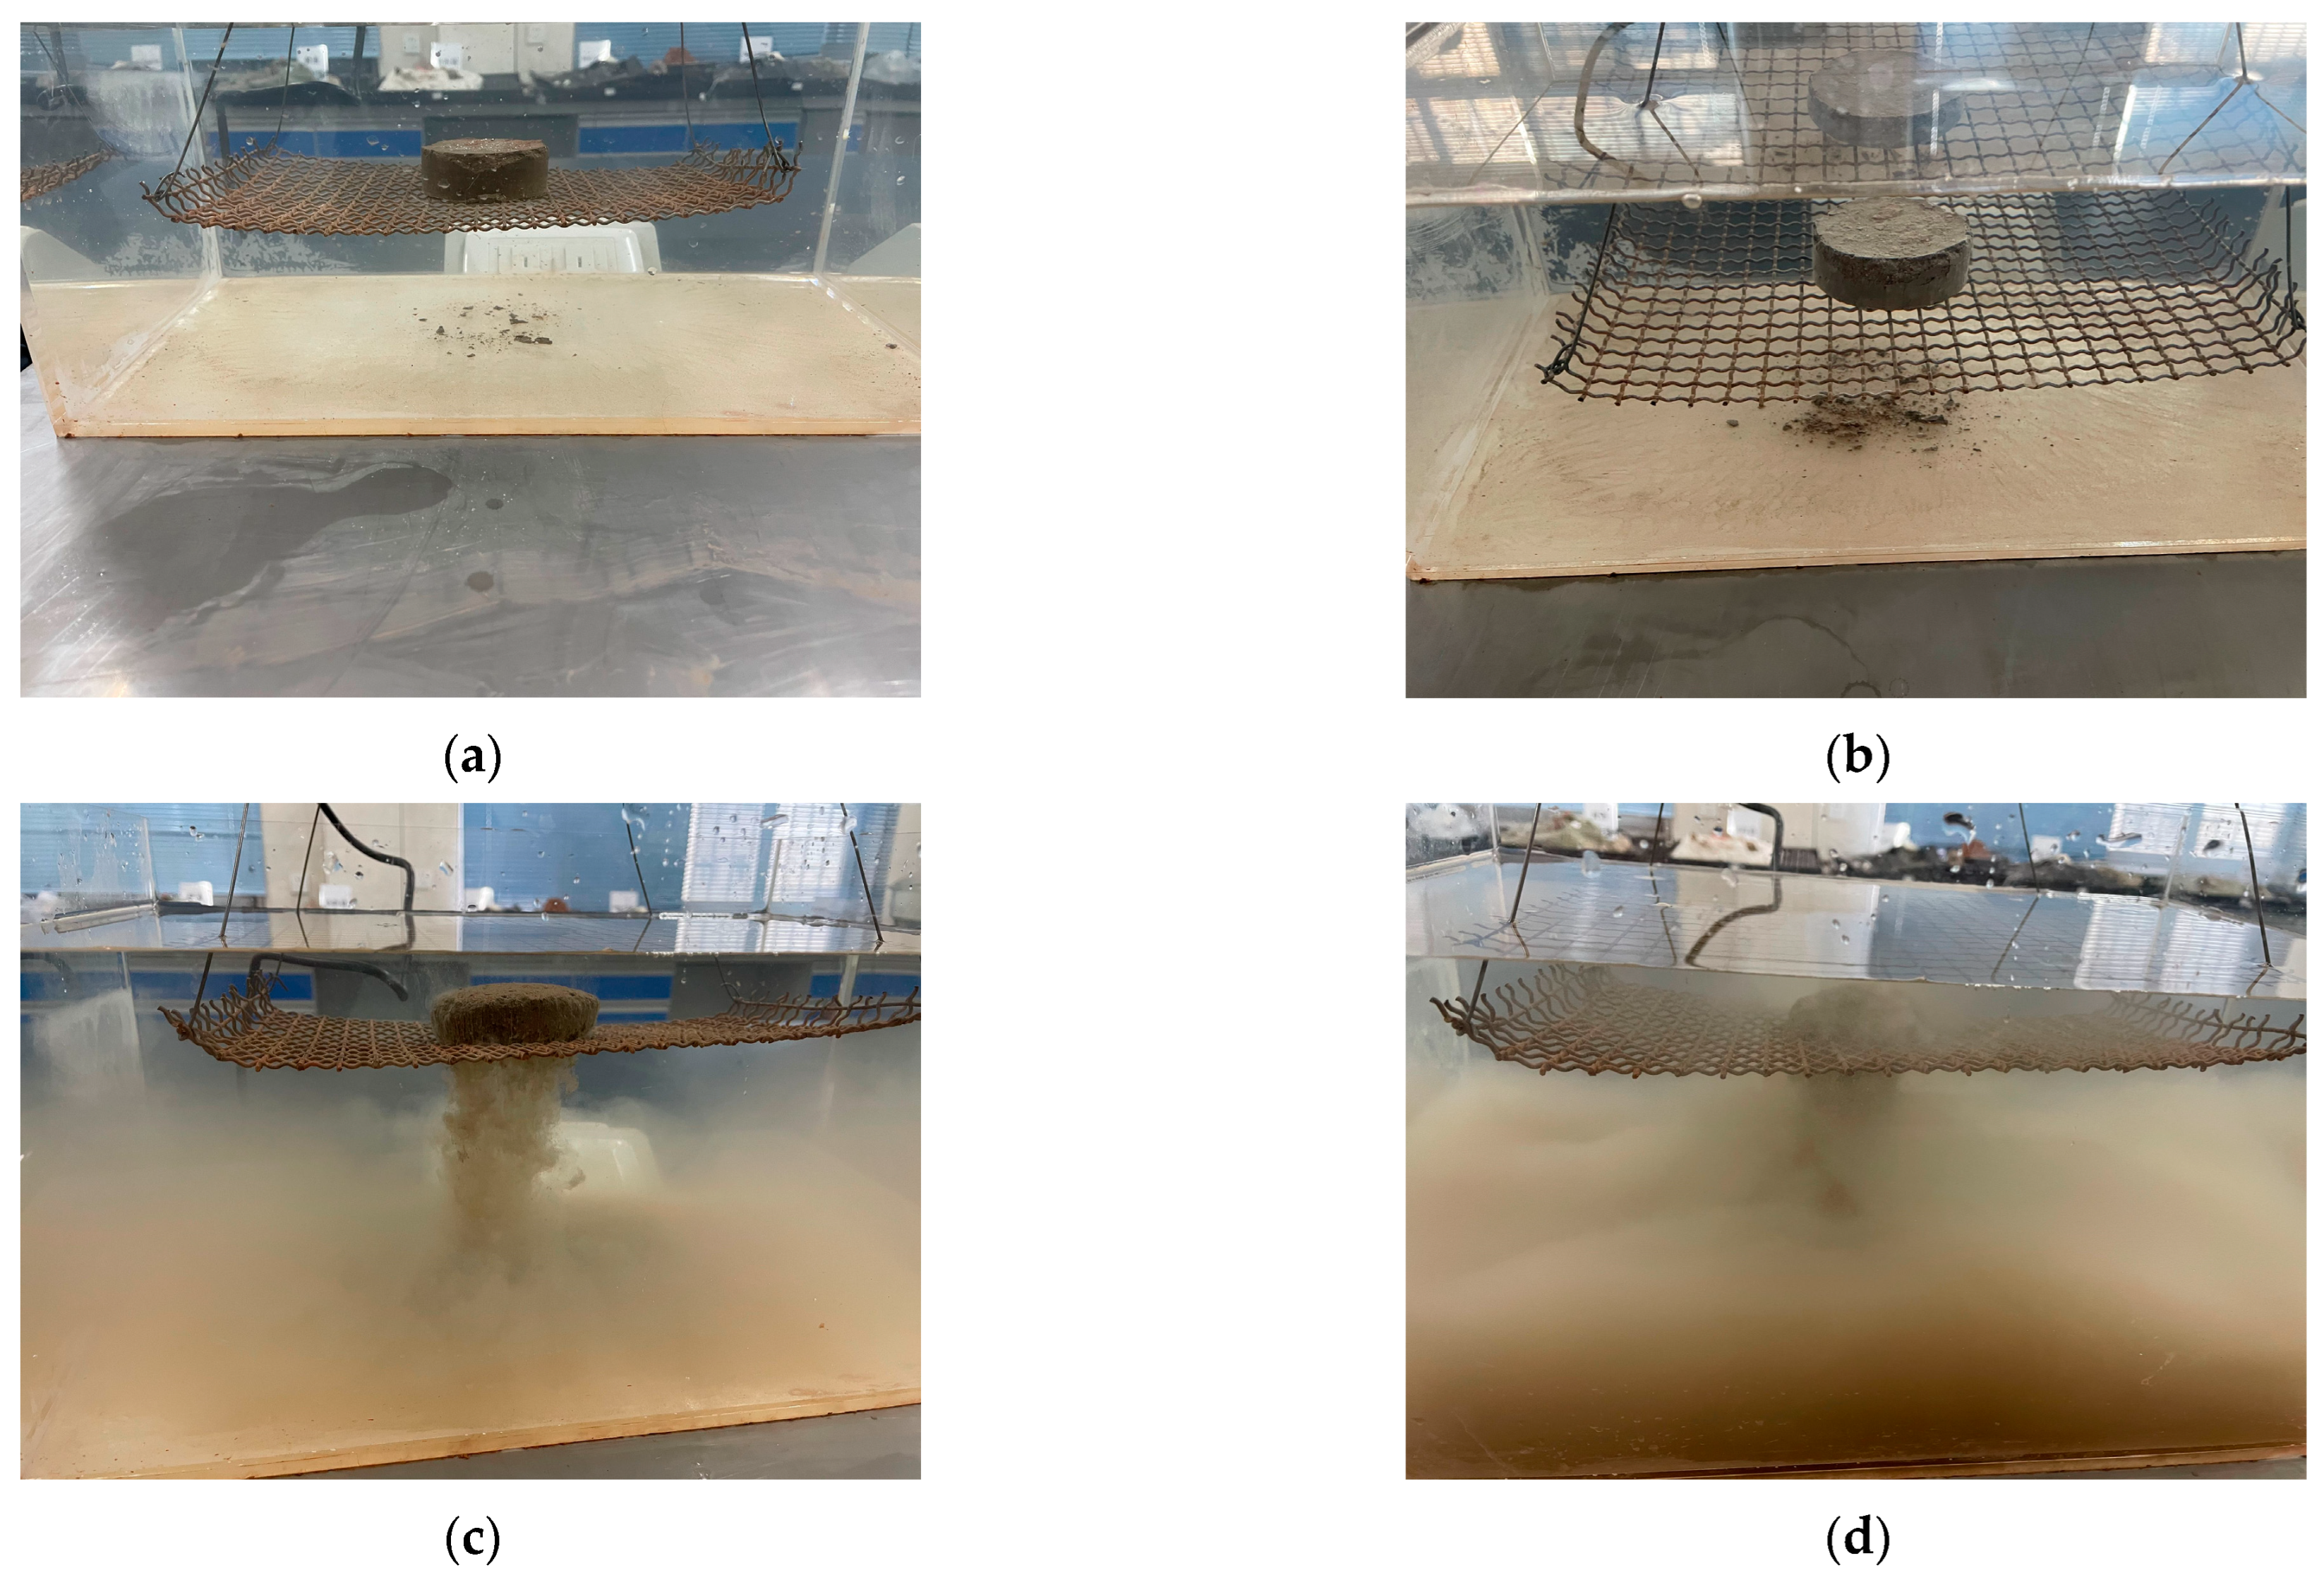
2.2.3. Disintegration Test

The disintegration test measures the disintegration ratio and reveals the soil behavior when immersed in tap water, which is the main method to study the disintegration resistance of subgrade fillers. The soil samples were prepared by static compression due to the controllable wet density and compactness of the soil samples. This avoids the deficiency of inconsistent density between soil layers, usually caused by the proctor compaction method. The ring knife was placed in the compactor, and the precisely configured treated soil with the optimum moisture content was also put into it. After compaction, a specimen that had a diameter of 61.8 mm, a height of 20 mm and a volume of 60 cm3 was obtained. Then, the specimens were sealed with plastic sheeting and placed in a constant 20° temperature box. Given the compactness of the subgrade filling in the actual project, the disintegration test of untreated and treated soils with the addition of 4%, 6% and 8% was carried out under 90% and 100% compactness.
A self-made disintegration system (see Figure 4 and Figure 5), which is mainly composed of an acrylic water tank (length 38 cm, width 26 cm, height 20 cm), metal net (length 25 cm, width 20 cm), wire, dynamometer, data collector and computer, was adopted. This disintegration device eliminates the inaccurate dynamic measurement of the measuring cylinder device recommended by “Test Methods of Soils for Highway Engineering” [40] and allows for different specimen sizes. The soil sample was placed in the center of the hanging basket net, about 20 cm from the bottom of the water tank. The force sensor is connected to the hanging metal net to measure the weight change of the soil sample. After debugging the sensor and data collector, the water tank was quickly filled with tap water, and the data started to be recorded at the frequency of 1 Hz when the soil sample was put into the water. The disintegration process could be observed and photographed until the soil sample is completely disintegrated. The disintegration ratio was calculated as follows:
A t = F 0 F t F 0 F k × 100 % ,
where At is the disintegration ratio of the sample at time t, F0 is the instantaneous reading of the dynamometer when the soil sample is completely immersed in the water, Ft is the dynamometer reading at time t and Fk is the dynamometer reading for metal net and wire when no sample is in the water.

3. Results

3.1. Effect of Stabilizer Contents on Compaction Characteristics

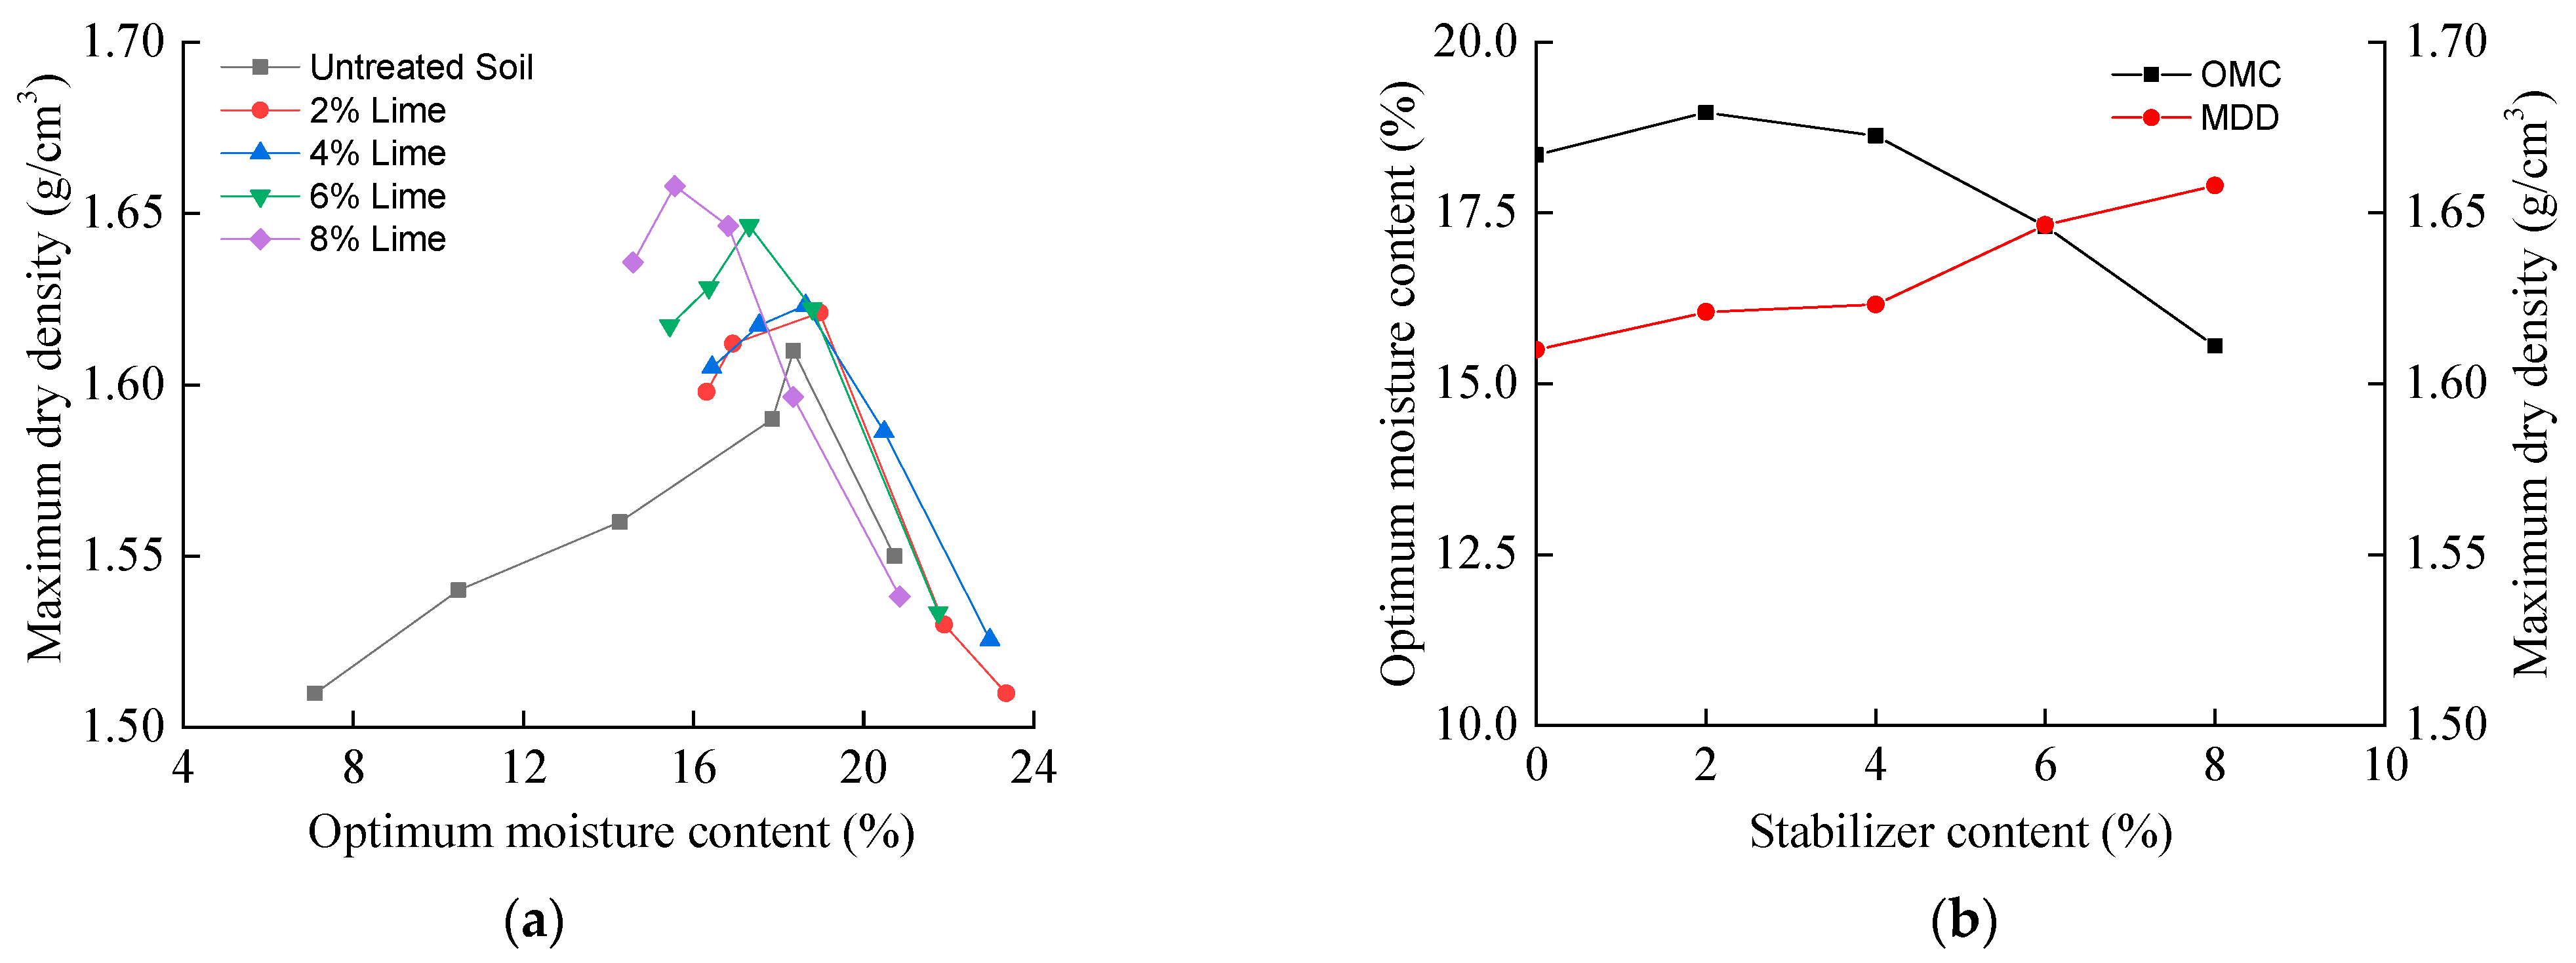
3.1.1. Influence of Lime Content

Figure 6 presents the effect of different lime contents on the compaction property of silty clay. The maximum dry density (MDD) shows an upward trend from 1.61 g/cm3 of the original soil to 1.66 g/cm3 of the mixture soil with 8% lime content. The reason is mainly associated with the hydration reaction that generates calcium hydrates, filling the voids among the soil particles [20]. The agglomeration effect turns the fine particles into larger particles through cohesion and cementation, which contributes to forming dense soil masses [19].
The optimum moisture content (OMC) showed a downtrend with the increasing lime content. This is not surprising because the hydration reaction of lime consumes much water and evaporates part of the water from the mixture while releasing a large amount of heat [7]. Therefore, the amount of water consumed increases with the lime content. Please note that the higher the lime content is, the more water needs to be added in order to obtain the lime-stabilized soil with optimal water content.

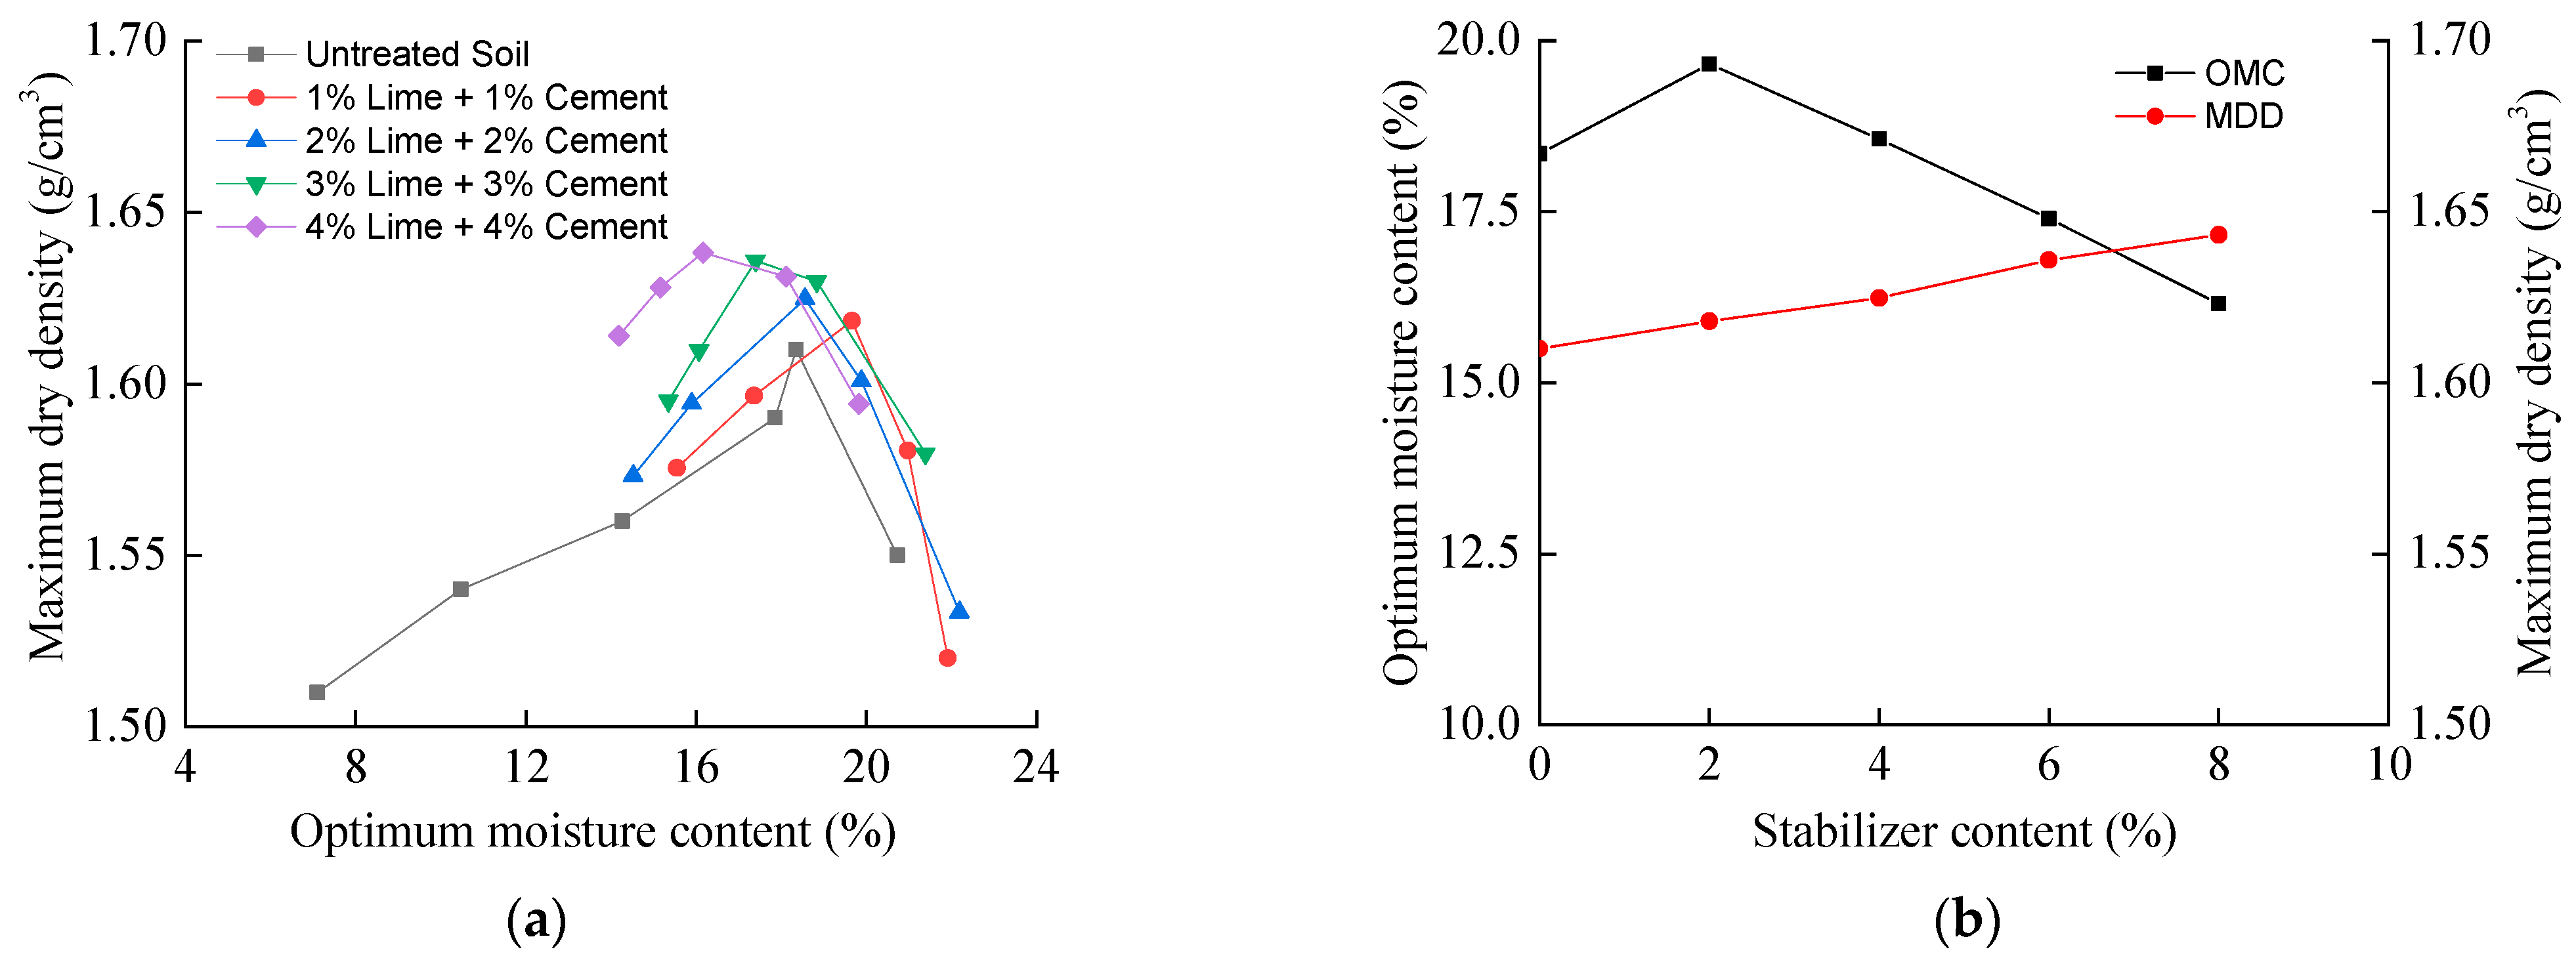
3.1.2. Influence of Lime and Cement Content

The optimum moisture content and maximum dry density of the mixed soil with lime and cement were demonstrated in Figure 7. As the stabilizer content increased, the maximum dry density also increased, with a maximum of 1.65 g/cm3 at the addition of 8%, but the increment of dry density decreased at this content. The optimum moisture content of 2% lime–cement–stabilized soil is the largest at 19.66%, and then it decreases with the larger stabilizer content, which is consistent with lime-stabilized soil.
Under the same dosage of stabilizer, the maximum dry density of lime–cement–stabilized soil is basically the same as that of lime-stabilized soil when the additional content is less than 6%. However, it is significantly lower than that of stabilized soil with a stabilizer content greater than or equal to 6%, indicating that lime-stabilized soil could obtain greater dry density. Similar results are reported in the literature for cement-treated clayey sediments dredged [18] and expansive over-consolidated clay collected from an urban site in Algeria [42].

3.2. Effect of Stabilizer Contents on Bearing Capacity
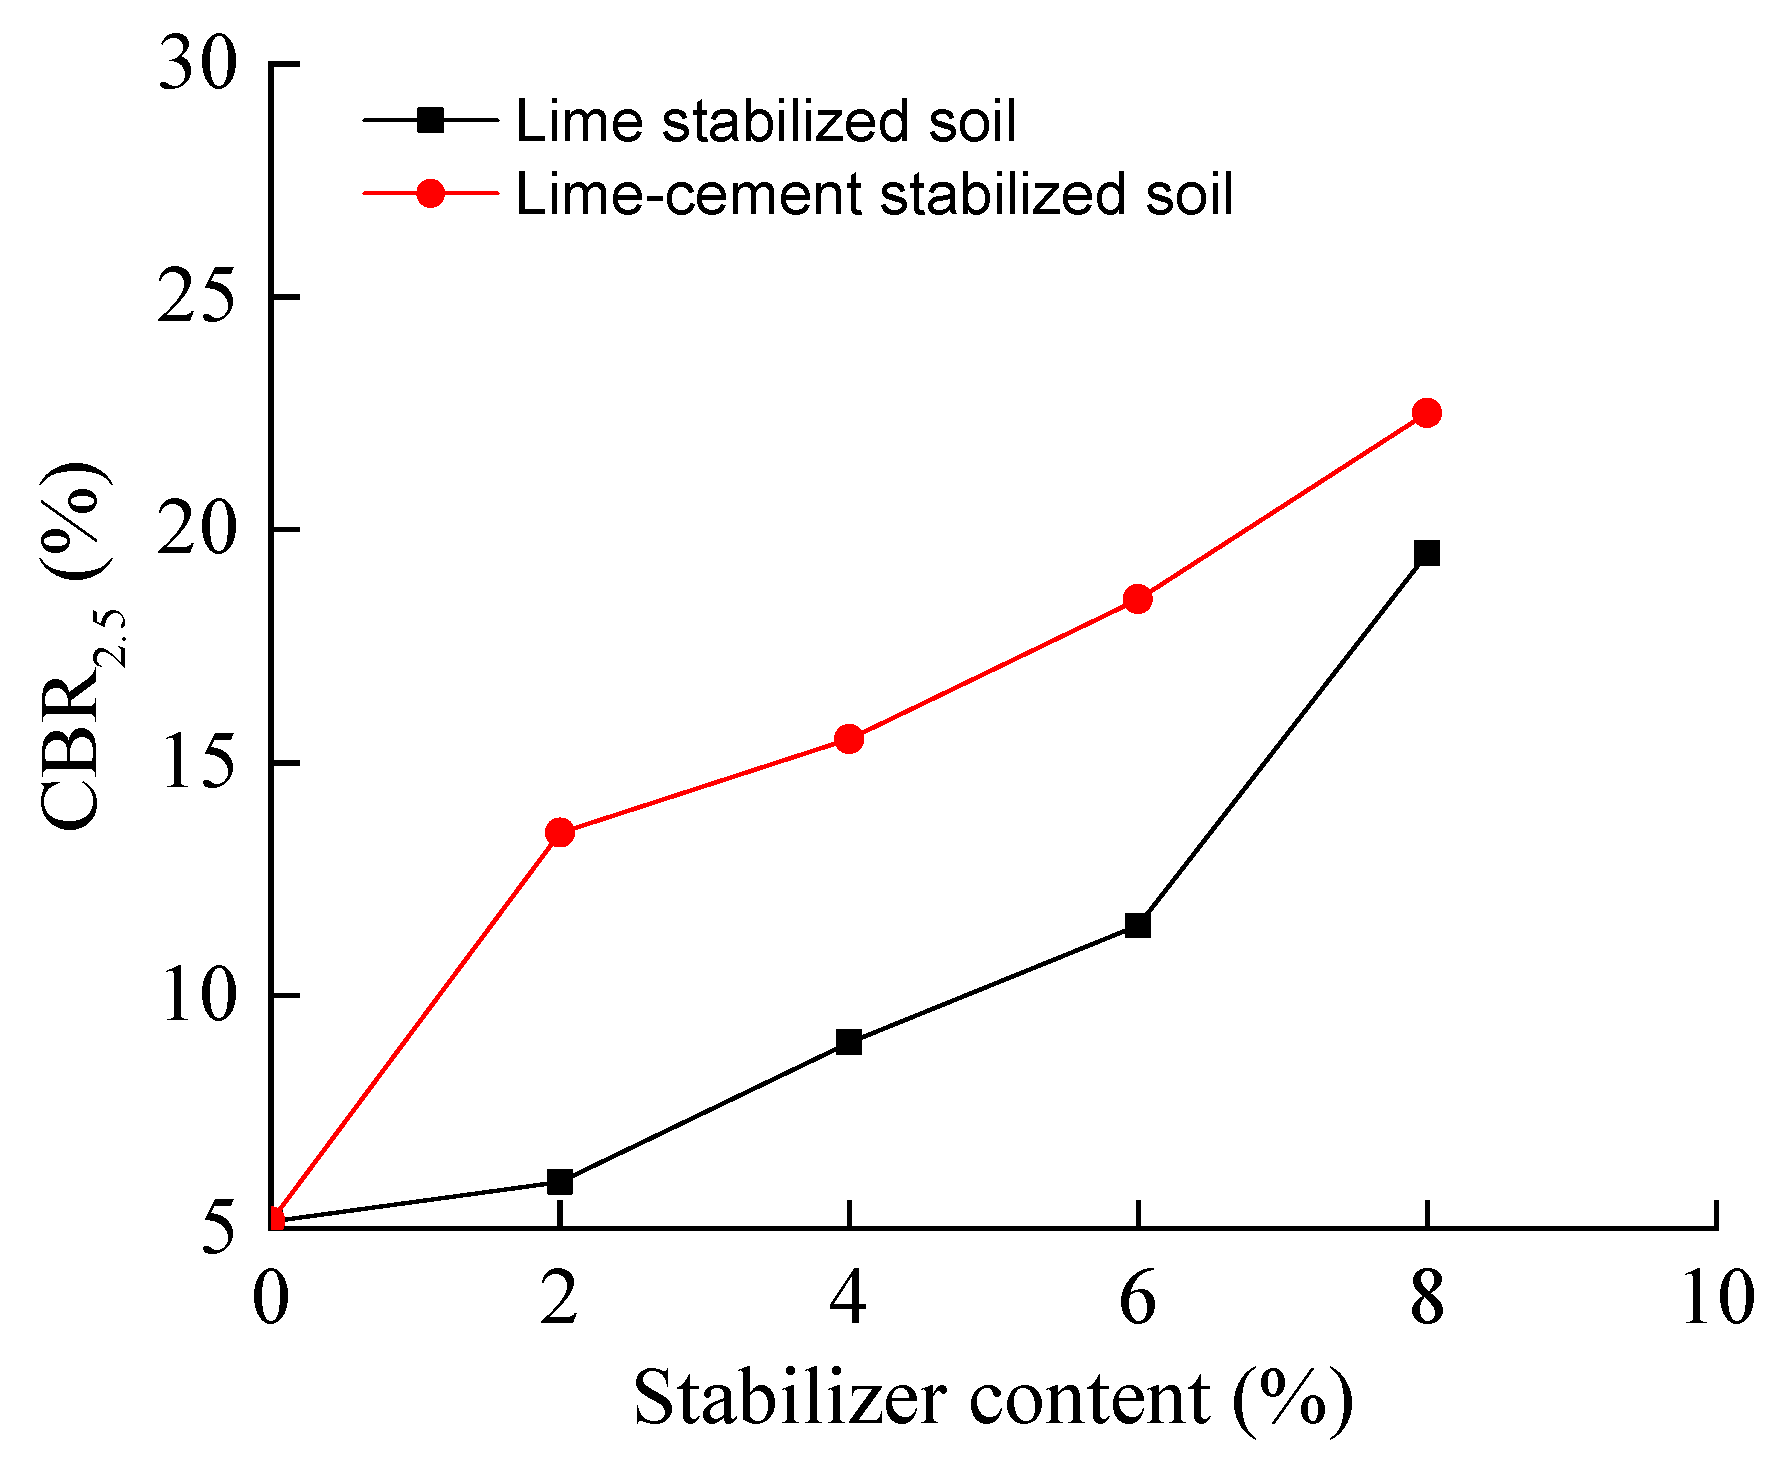
3.2.1. CBR2.5

Figure 8 provides an overview of the CBR2.5 (California bearing ratio at 2.5 mm penetration) of the stabilized soil at different stabilizer contents. The CBR of the lime-stabilized soil demonstrates a non-linear growth pattern as the lime content ranges from 2% to 8%. With an 8% lime addition, the CBR2.5 of the soil rises from 5.1% to 18%, exhibiting an increase of up to 3.5 times greater than that of the untreated soil. This enhancement can be attributed to the occurrence of ion exchange and gelation reactions between the soil and lime, where individual soil particles are aggregated into small agglomerates, thus forming a more stable structure [8,12]. Over time, the formation of denser crystals further enhances the strength of the lime-stabilized soil.
In comparison to using a single stabilizer, the addition of cement leads to a more notable increase in the CBR value at the equivalent stabilizer content. The bearing ratio of the lime–cement soil exceeded the minimum CBR2.5 requirement for high-speed and first-class highway subgrade filling by a factor of 2.81. This is due to the fact that the hydration reaction of cement is faster than that of lime, generating calcium silicate hydrate and calcium alumina hydrate through the rigidly coagulate reaction to strengthen the soil skeleton, which rapidly increases the strength of the soil. In addition, the CBR value of lime–cement–stabilized soil is closer to the CBR value of lime soils by increasing its content.
In conclusion, the untreated soil fails to meet the requirement that the CBR is more than 8% for high-speed and first-class highways (Specification for Design of Highway Subgrade JTG D30-2015). To achieve this target, 4% lime or 1% lime + 1% cement is required for the effective utilization of the stabilized waste soil as subgrade fillers.

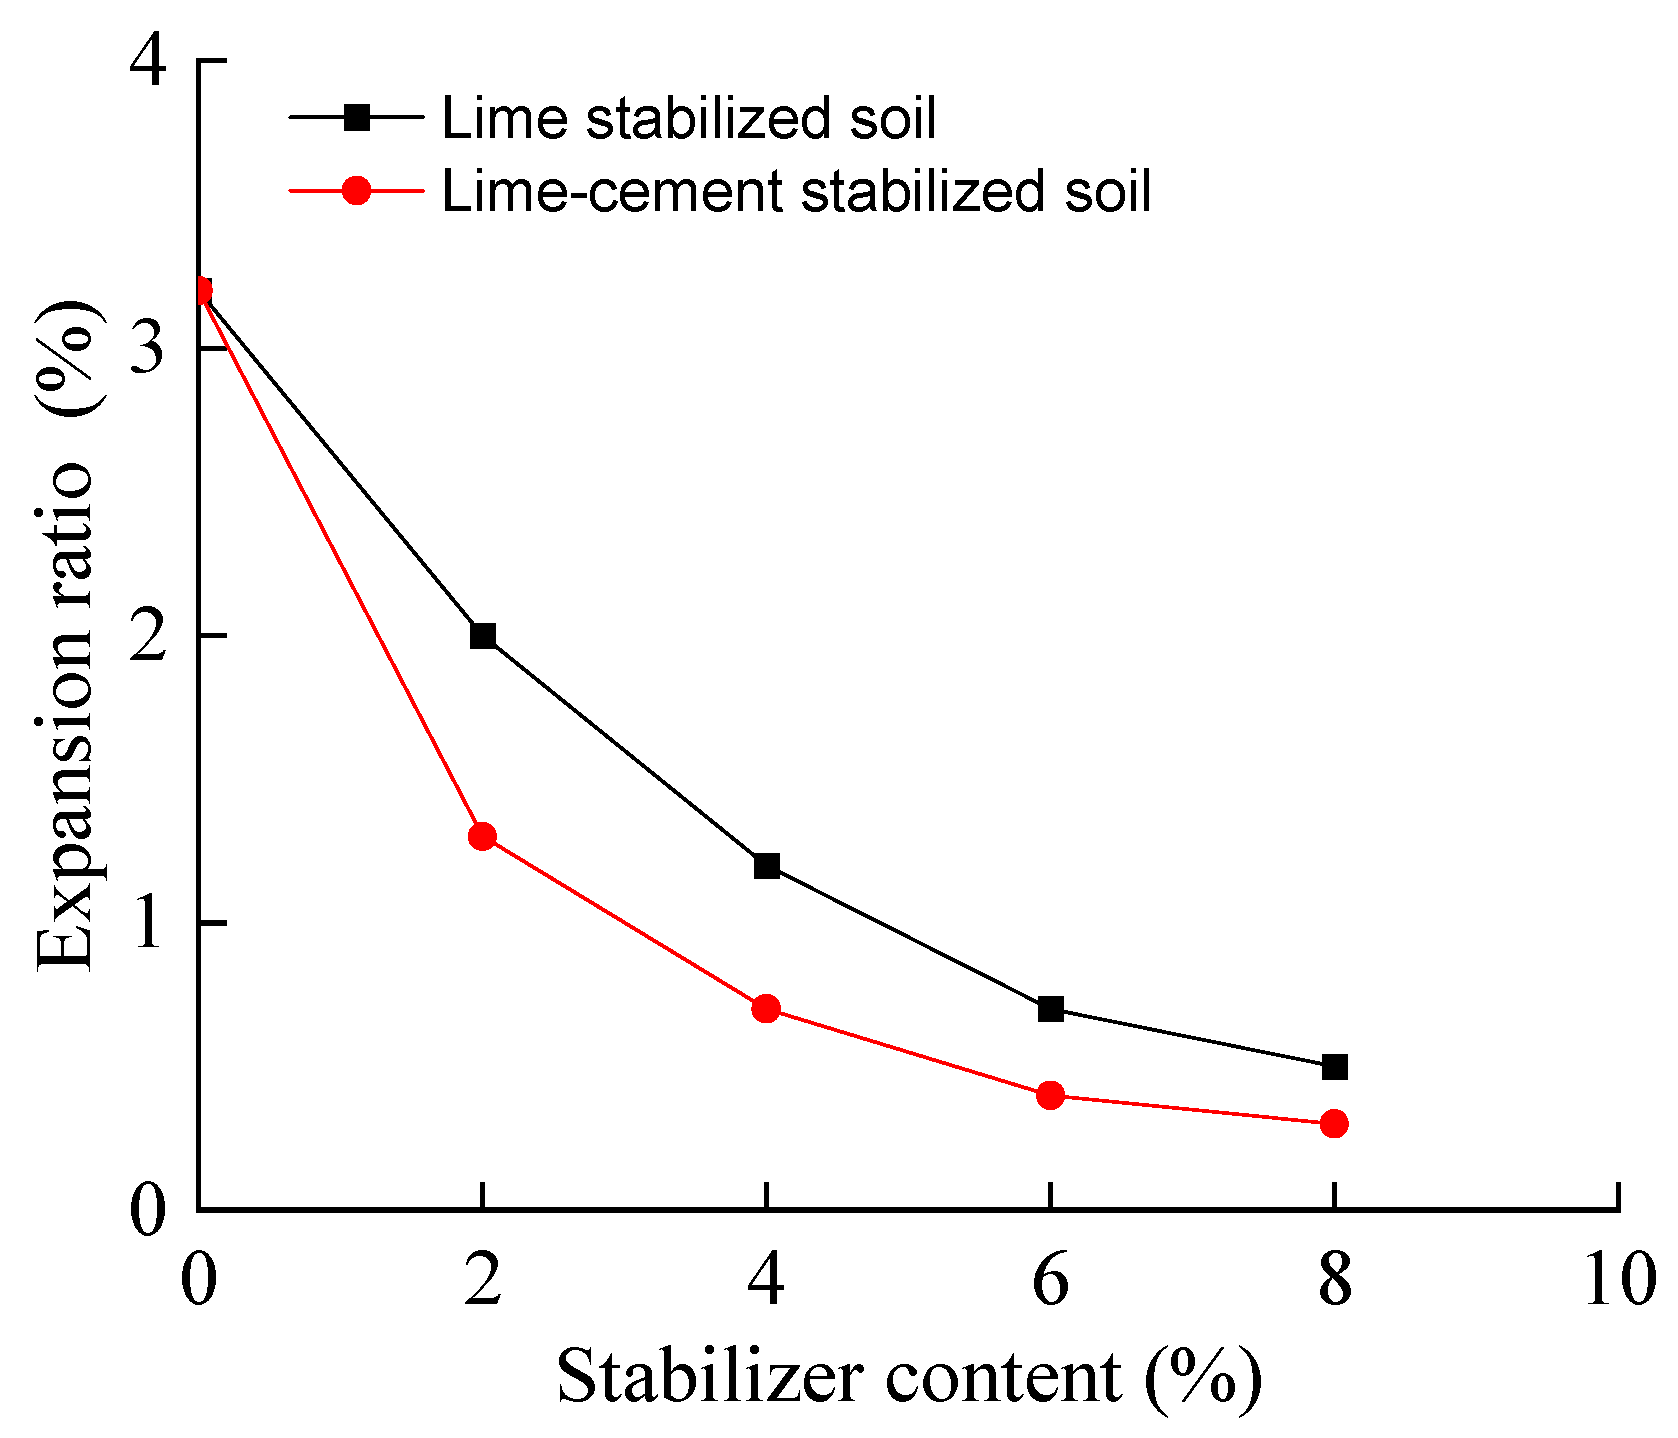
3.2.2. Expansion Ratio

The waste soil presented a decrease in expansion ratio after the addition of stabilizers, as illustrated in Figure 9. Notably, the two types of stabilized soils demonstrated the most substantial reduction in expansion ratio at a stabilizer content of 2%, while minimal changes were observed when the content surpassed 6%. Specifically, for lime-stabilized soils, the expansion ratio decreased from 3.2% to 2% and 0.5% with the addition of 2% and 8%, respectively. In contrast, the composite stabilized soil exhibited a smaller expansion ratio, with the minimum value being merely 0.3% when utilizing a stabilizer content of 4% cement + 4% lime.

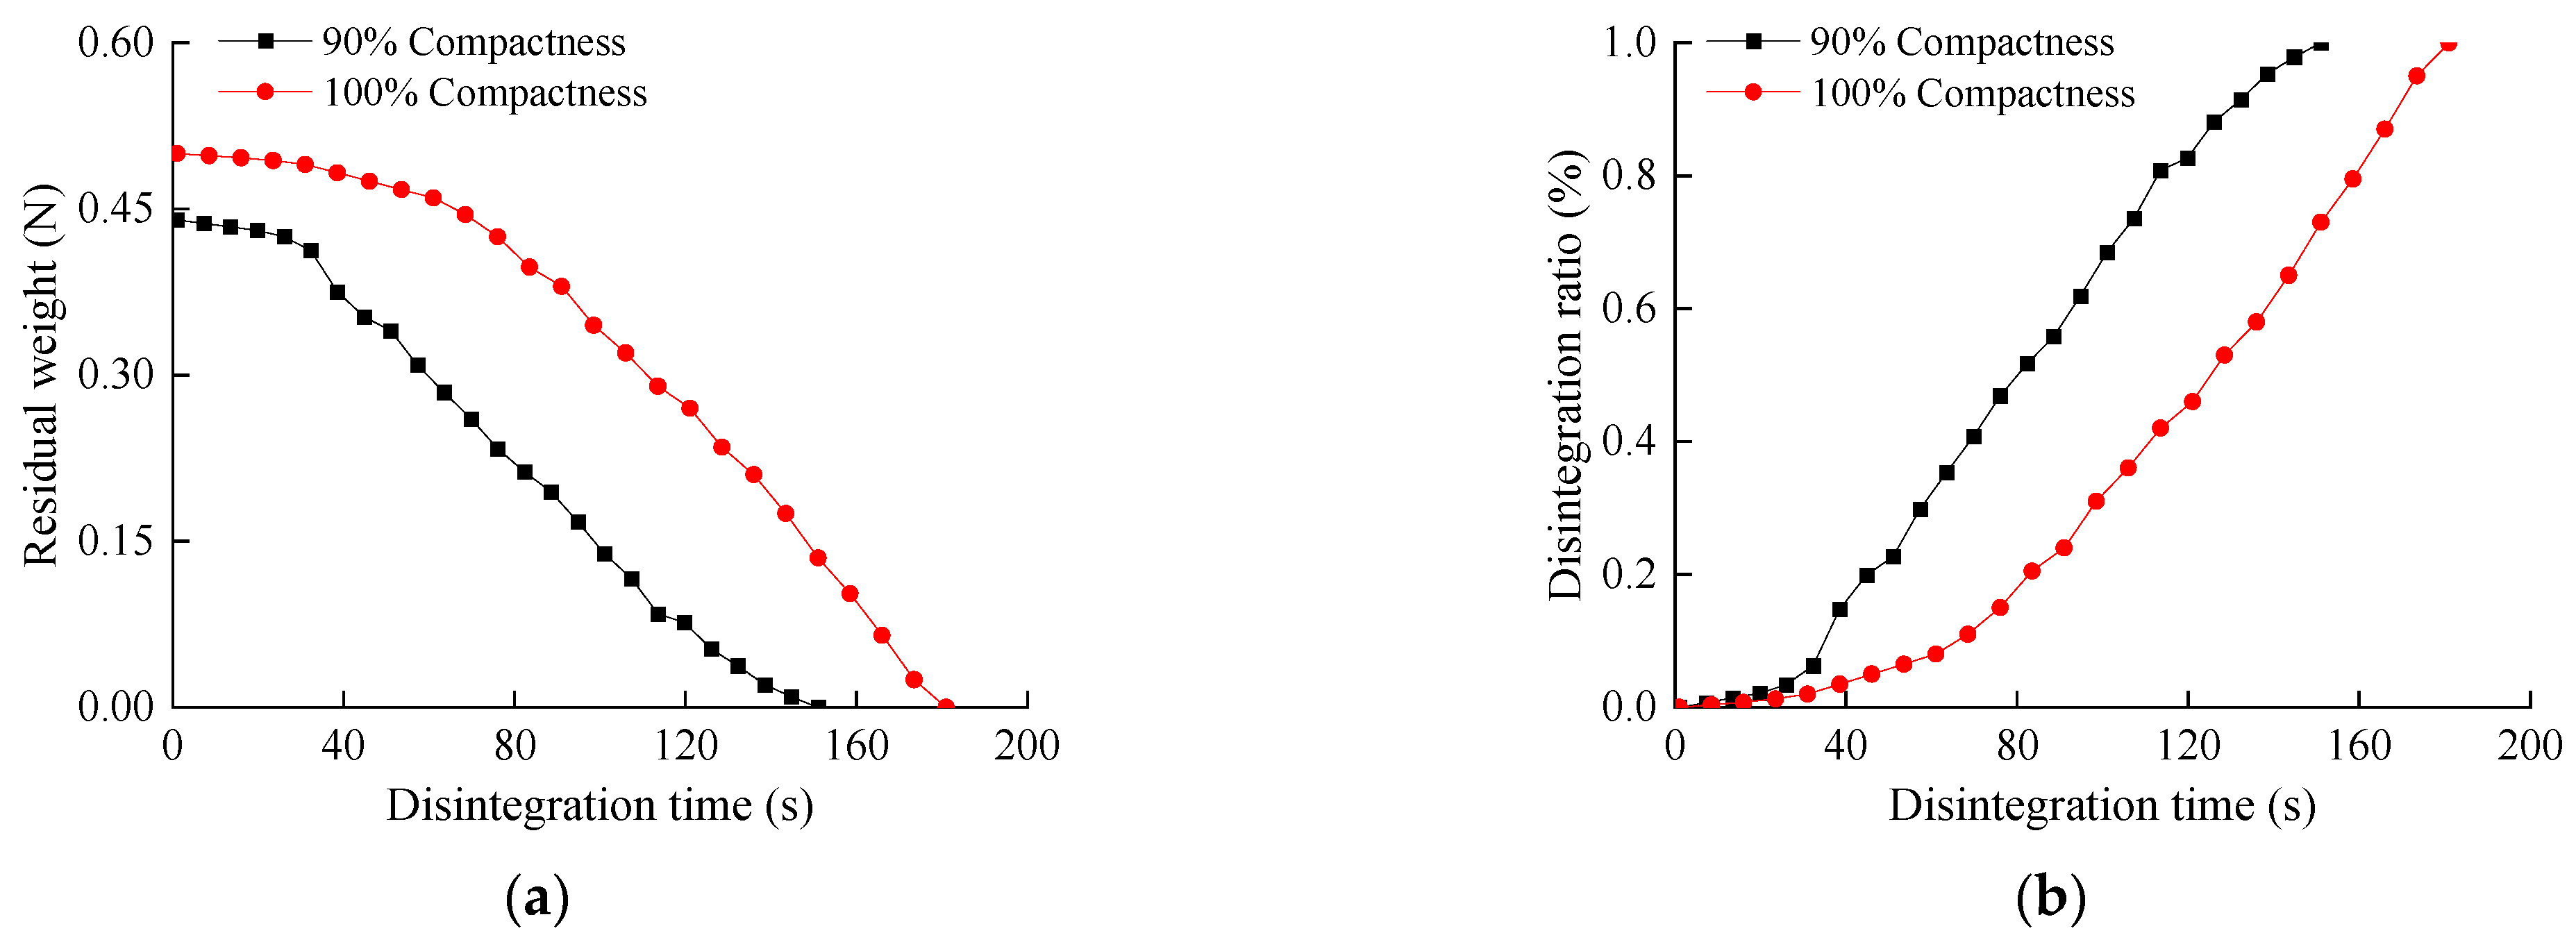
3.3. Effect of Compactness on Disintegration Characteristics

3.3.1. Initial Observations

The disintegration breakage of the typical stabilized silty clay during the disintegration tests was demonstrated in Figure 10. After immersing the specimen into the water, soil particles on the surface are softened and gradually peeled off into the bottom of the water (see Figure 10a), resulting in the surroundings of the specimen being cloudy immediately. The specimen continuously absorbed water, and the bubbles appeared to escape from the water surface, especially for the specimen with lower compactness. As the water absorption time of the soil sample prolonged, cracks began to appear on the surface, which opened up many infiltration channels for water infiltration. The specimen disintegrated mainly in blocks [33], as shown in Figure 10b. The air hidden inside the specimen was squeezed out by the water, and larger air bubbles started to emerge and rise to the water’s surface, indicating that the disintegration rate was gradually accelerated. A large number of soil particles fell out of the wire mesh [36], beneath which the water became severely turbid with very low visibility (Figure 10c). The remaining small amount of specimen was close to saturation without bubbles emerging [30], and the disintegration rate decreased until the specimen was completely disintegrated (Figure 10d).
Waste soils are usually buried underground and contain a lot of cement-soluble salts and soil organic matter. The water stability of these substances is relatively poor after a long period of the repeated action of groundwater. When the external water invades the pores along the surface cracks of the specimen, the pores inside the soil are continuously occupied by water, and the pore gas inside the specimen is continuously discharged, which destroys the cement structure of the soil particles. These cements are diluted or dissolved in the water, resulting in the loss of cementation between particles. Hence, the soil particles lose their connection and constantly fall off by gravity.

3.3.2. Untreated Waste Soil

Figure 11 presents the variation in the residual weight and disintegration ratio of silty clay with the disintegration time under two different compactnesses. The disintegration could be completed in a relatively short period of time, which is mainly divided into two phases, namely, slow disintegration and accelerated disintegration [30]. The first phase was the water absorption of the soil sample with a disintegration ratio of less than 5%. There were basically no cracks appeared on the specimen surface, and only a small amount of soil fell off, resulting in a small inclination of the disintegration curve. The soil samples with 100% compactness took 30 s longer than those with 90% compactness, indicating that higher compactness enhances the water stability of the soil mass during the initial disintegration stage [39]. Then, cracks developed internally and penetrated through the specimen, and a rapid increase was observed in the disintegration ratio, which was demonstrated by the sudden surge in the disintegration ratio of the soil sample with 90% compactness around 30 s. Afterward, there was an almost linear change with time. This is different from the disintegration characteristics of other soils that have been reported, where the disintegration rate increases sharply with disintegration time [34,36] or increases first and then decreases [32,34].
Compared with the untreated soil with 90% compactness, the disintegration time of the soil with 100% compactness took about 180 s to contribute to a total increase of 20%. As the soil with lower compactness has larger pores, water easily penetrates into the pores and increases the internal air pressure of the soil sample. Higher compactness makes the pores among the soil samples smaller, and the rate of water intrusion into the soil and the increase in air pressure slows down, resulting in a longer disintegration time. Therefore, the compactness of the silty clay as subgrade filler in projects should be increased as much as possible, and interception and drainage measures are also required.

3.3.3. Lime-Stabilized Waste Soil

Figure 12 shows the relationship between the residual weight and disintegration time of the silty clay with lime contents of 4%, 6% and 8%. Three disintegration stages were observed for the disintegration of lime-stabilized soil compared with the untreated soil. The first two stages were consistent with the untreated soil in spite of the last phase of saturated dissolution, where the disintegration ratio of the soil decreases until complete disintegration [32,34]. In addition, higher compactness increased the disintegration time of the treated soil under the same lime content, with a maximum increase of 15% for the soil with 8% lime content.
The lime-stabilized soil with 90% and 100% compactness showed that the disintegration ratio accelerates significantly when the disintegration ratios were 8% and 12% on average, respectively, and this extended the water absorption phase, which was similar to the untreated soils. The disintegration ratio was basically identical to that of the untreated soils before the disintegration ratio exceeds 80%. Subsequently, the disintegration ratio slowed down in the phase of saturated dissolution, and it decreased with the larger lime content. This increased the disintegration time of the lime-stabilized soils, which is significantly different from the disintegration characteristics of untreated soil.
The addition of lime contributes to cementing the fine soil particles into a mass, and the proportion of sticky particles gradually increases [26,27]. The disintegration time of all the mixed soils with lime increased by 8%, corresponding to the addition of 1% in lime content. It should be noted that lime content should not be too large due to the marginal effects and engineering costs.
From Figure 13, the stabilized silty clay showed an almost linear increase in the maximum disintegration time, considering varying contents of lime and different soil compactness. Hence, the relationship could be fitted as expressed:
tmax = −12.7nx + 23.78x + 289.7n − 112.59,
where tmax is the maximum disintegration time (s), x is stabilizer content from 0 to 8% and n is the soil compactness between 90% and 100%.

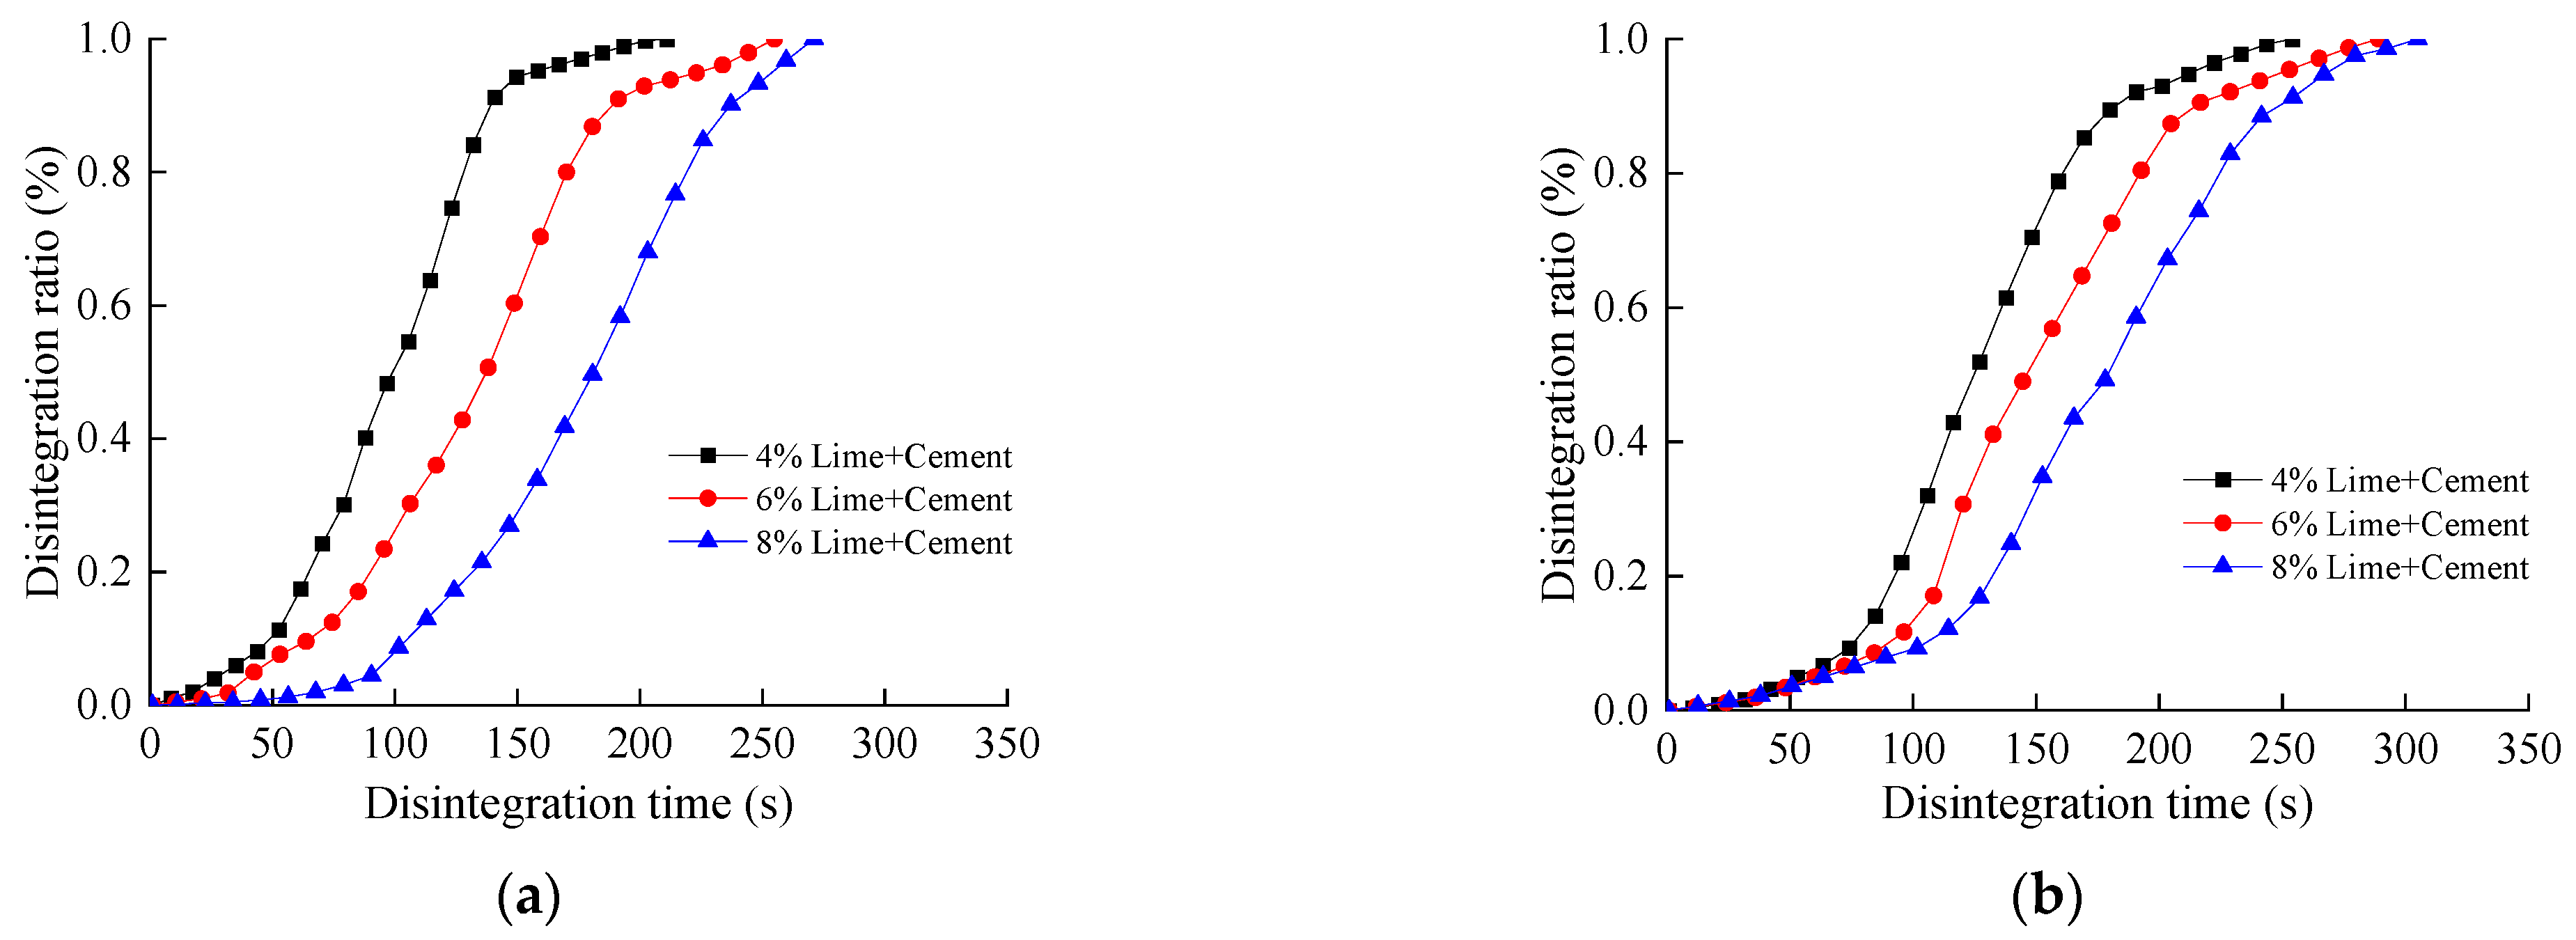
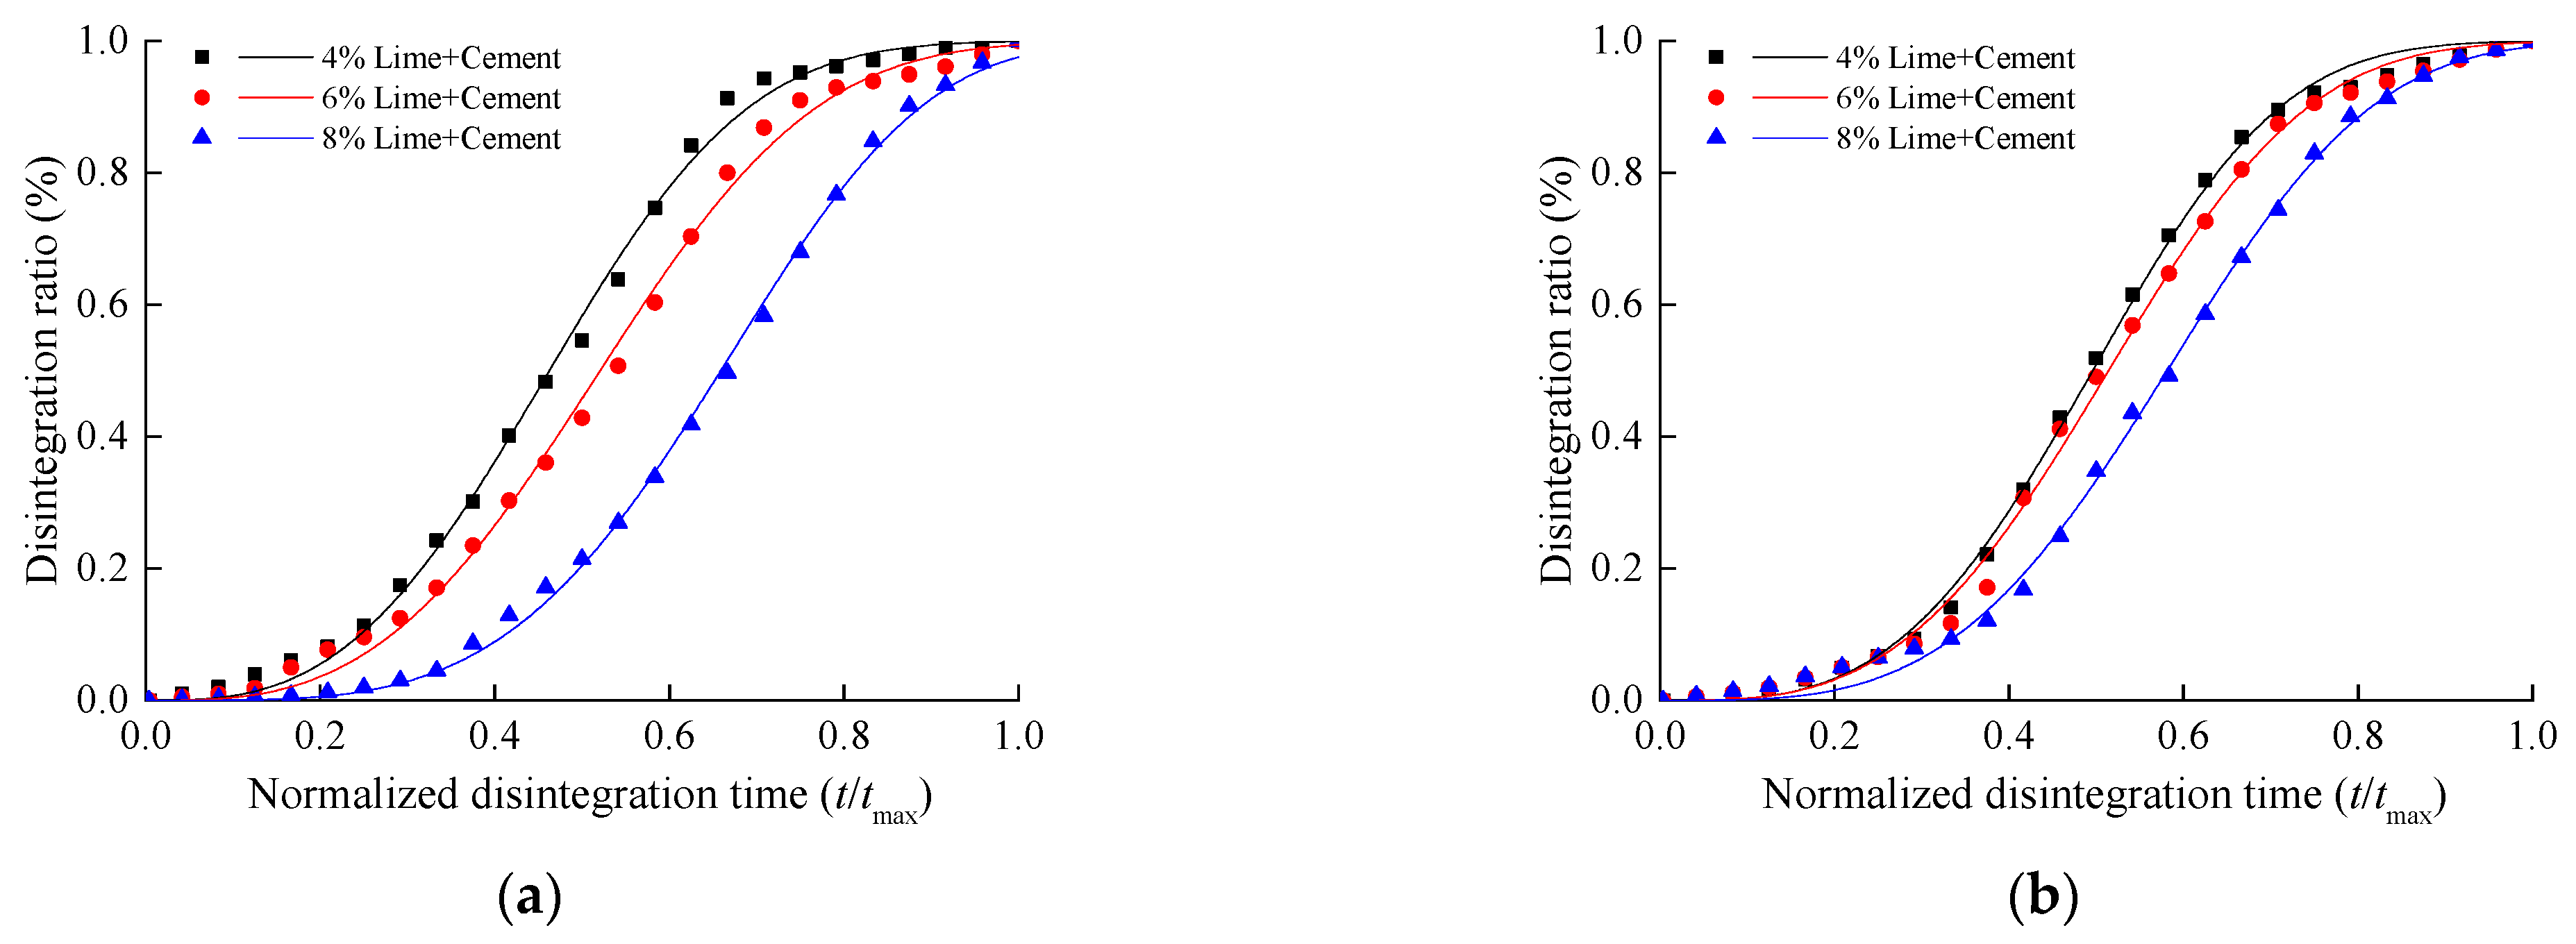
3.3.4. Lime–Cement–Stabilized Waste Soil

The disintegration relationships of the silty clay using the stabilizer of lime and cement are shown in Figure 14. The disintegration process of mixed soil combined with lime and cement still presented three phases in accordance with the lime-stabilized soil, and the disintegration time was positively correlated with the total amount of stabilizer added. The specimens with 90% compactness at the additions of 2% lime and 2% cement content had a disintegration time of 270 s, which was the most significant increase of 80% compared to the untreated soil. Higher compactness also had an extension on the disintegration time of the mixed soil, with an average rise of 20% at the combined additions of 4%, while the disintegration time of the soil samples with larger stabilizer content was less affected by the compactness, which improved the disintegration time by 10% at the combined additions of 8%.
It could also be noted that the disintegration time of the mixed soil with lime and cement is longer than that of the lime-stabilized soil for the same amount of stabilizer added. An increase of approximately 110% and 115% in the disintegration time was observed when the dry density of the specimens was 90% and 100% relative to the maximum dry density, respectively. The observed increase could be attributed to the dissolution of unreacted lime that remains in the samples, as well as the formation of calcium hydrates resulting from the pozzolanic reaction. These factors contribute to the improved cohesion and resistance of the treated soil [38,43]. The stability of calcium hydrates formed by lime cannot be ensured since chromatography analysis demonstrated higher concentrations of Ca2+ in lime-stabilized soil after disintegrating [24]. In contrast, the hydrates formed as a result of cement treatment demonstrate stability within the solid phase of the treated soil, as confirmed by X-ray diffraction. This stability significantly enhances the resistance to disintegration, ensuring a satisfactory performance. Therefore, the stabilizer of lime combined with cement for waste soil should be given priority in areas under high groundwater, and the improvement method of cement is usually not recommended due to the fast setting and hardening, which is not suitable for large-scale treatment of waste in factories.
There is a good fit for the maximum disintegration time of lime or lime- and cement-stabilized soil, as shown in Figure 15. The disintegration resistance of soils stabilized by lime and cement was better than that of lime-stabilized soils at the stabilizer content, with an average increase of 26.4% for each 1% increase in stabilizer content at 90% compactness and 44.2% at 100 compactness. The fitting relationship can be expressed as follows:
tmax = 3.3nx + 12.68x + 335.1n − 149.78

4. Discussion

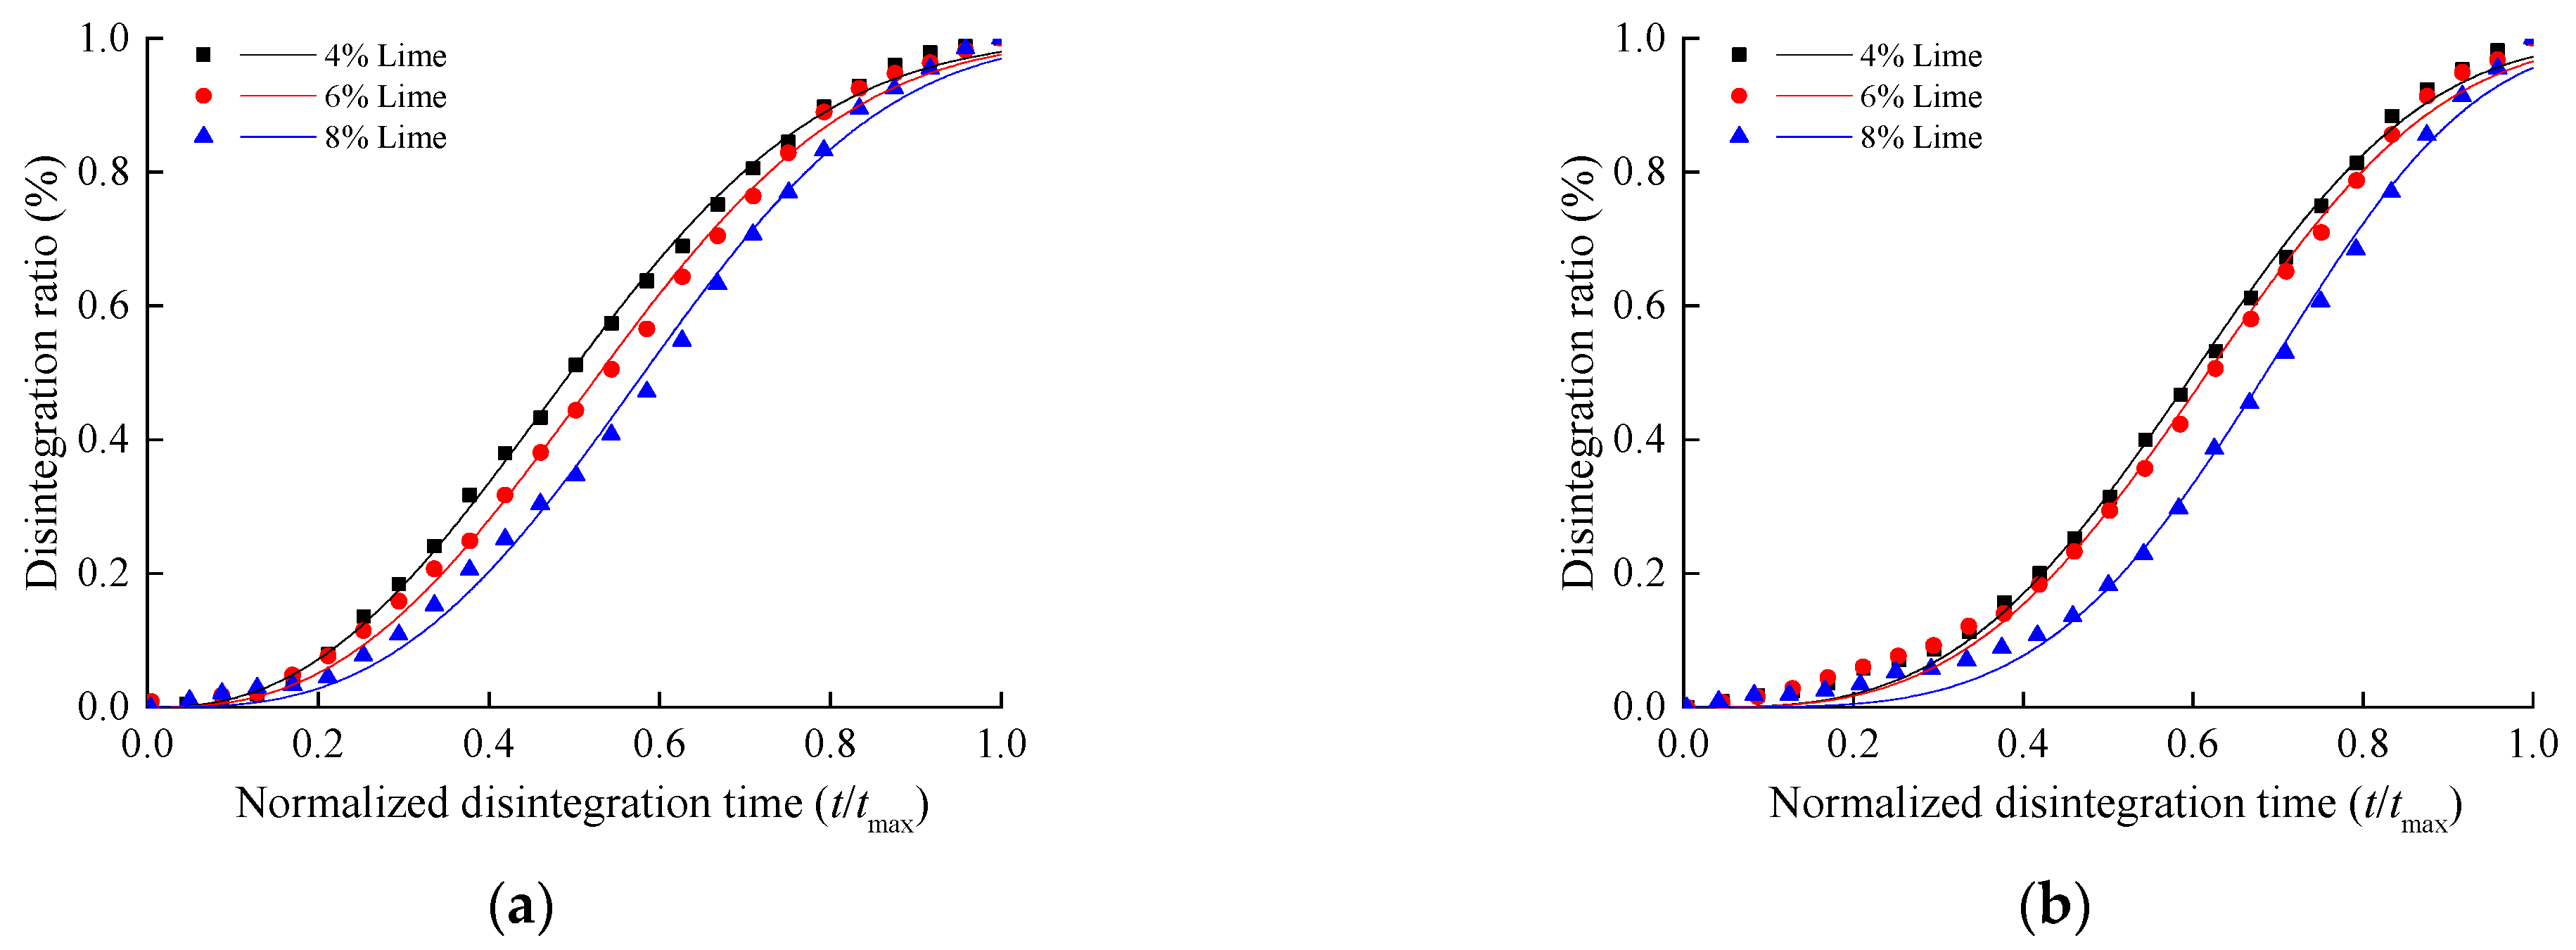
4.1. Development of Disintegration Model

Quantitatively characterizing the disintegration rate of stabilized soils involves understanding the physical processes and the soil characteristics that contribute to soil disintegration. This section necessitates an in-depth discussion of methodologies for proffering a disintegration model tailored to stabilized soils.
A disintegration model has been formulated using the Weibull distribution [44], encompassing considerations of soil compactness and stabilizer content, with the aim of quantifying the disintegration rate across three distinct stages. It could easily infer the distribution parameters with small samples [45,46,47] and can be applied to disintegration and fragmentation studies of soil particles [48]. To explore the evolution of disintegration breakage, this work employs a two-parameter Weibull distribution model for stabilized silty clay under static disintegration conditions.
The current disintegration ratio Pi (0 < Pi ≤ 1) of soil particles could be expressed by the Weibull cumulative distribution function, given as follows:
P i = 1 e ( t i / d ) k ,
ti = t/tmax,
where ti is the normalized disintegration time and d and k are the parameters of the Weibull distribution function, respectively.
Although the maximum disintegration time was not consistent for different soil samples, a variation of the disintegration ratio with normalized disintegration time was obtained under different additions and compactness, as shown in Figure 16 and Figure 17. This is consistent with the changing trend shown in Figure 12 and Figure 14, where the disintegration ratio is positively correlated with the content of lime or lime and cement and negatively correlated with compactness. Hence, a unified model has been developed to elucidate the process of disintegration breakage for all stabilized soil samples. The parameters of the evolution model described in Equation (8) were determined by employing the least squares technique [49].
i = 1 n P i 1 e ( t i / d ) k 2 = min j = 1 m i = 1 n P i 1 e ( t i / d ) k 2
The disintegration parameters for stabilized soil samples were derived using the experimental outcomes and a least squares approach outlined in Equation (6), as summarized in Table 3. To comprehensively assess Equation (4) in capturing the disintegration breakage of stabilized soil, the data from Figure 12 and Figure 14 were recalibrated and presented in Figure 16 and Figure 17. The relationship between the disintegration ratio (Pi) and the normalized time (ti) is effectively described by the disintegration model using the Weibull distribution, as validated by the correlation coefficient R2 approaching 1. This compelling similarity serves as a strong confirmation of the efficacy of the Weibull distribution in characterizing the process of disintegration breakage. When the compaction level remains constant, an increase in stabilizer content causes both parameters d and k to rise progressively, resulting in a downward shift of the disintegration curve. Consequently, at the same normalization time, the disintegration ratio decreases, indicating an enhanced resistance to complete disintegration of the stabilized silty clay.
To delve deeper into the importance of the Weibull parameters (d and k), Equation (8) can be applied to facilitate a detailed examination:
ln ln ( 1 / ( 1 P i ) ) = k ln t i k ln d
A clear positive correlation is evident between Pi and ln[ln(1/(1 − Pi))], with a linear association observed between ln[ln(1/(1 − Pi))] and lnti. As indicated by Equation (11), when k is held constant, incremental variations in d scarcely impact the shape of the disintegration curve, but they lead to a gradual reduction in the intercept of the curve. Conversely, with d held constant, higher values of k result in varying gradients within the major segments of the disintegration curve and can even induce alterations in its overall shape.
Changes in the model parameters of d and k correspond to modifications in the disintegration curve, characterizing the disintegration properties of the stabilized silty clay. Notably, the parameter d signifies the intercept of the disintegration curve, while parameter k governs the slope of the curve. As a result, using the Weibull model to analyze the progression of disintegration breakage is considered appropriate due to the remarkable agreement observed between the test results, which encompass the Piti correlation and the Weibull model. Furthermore, the parameters d and k possess precise and well-defined mathematical interpretations.

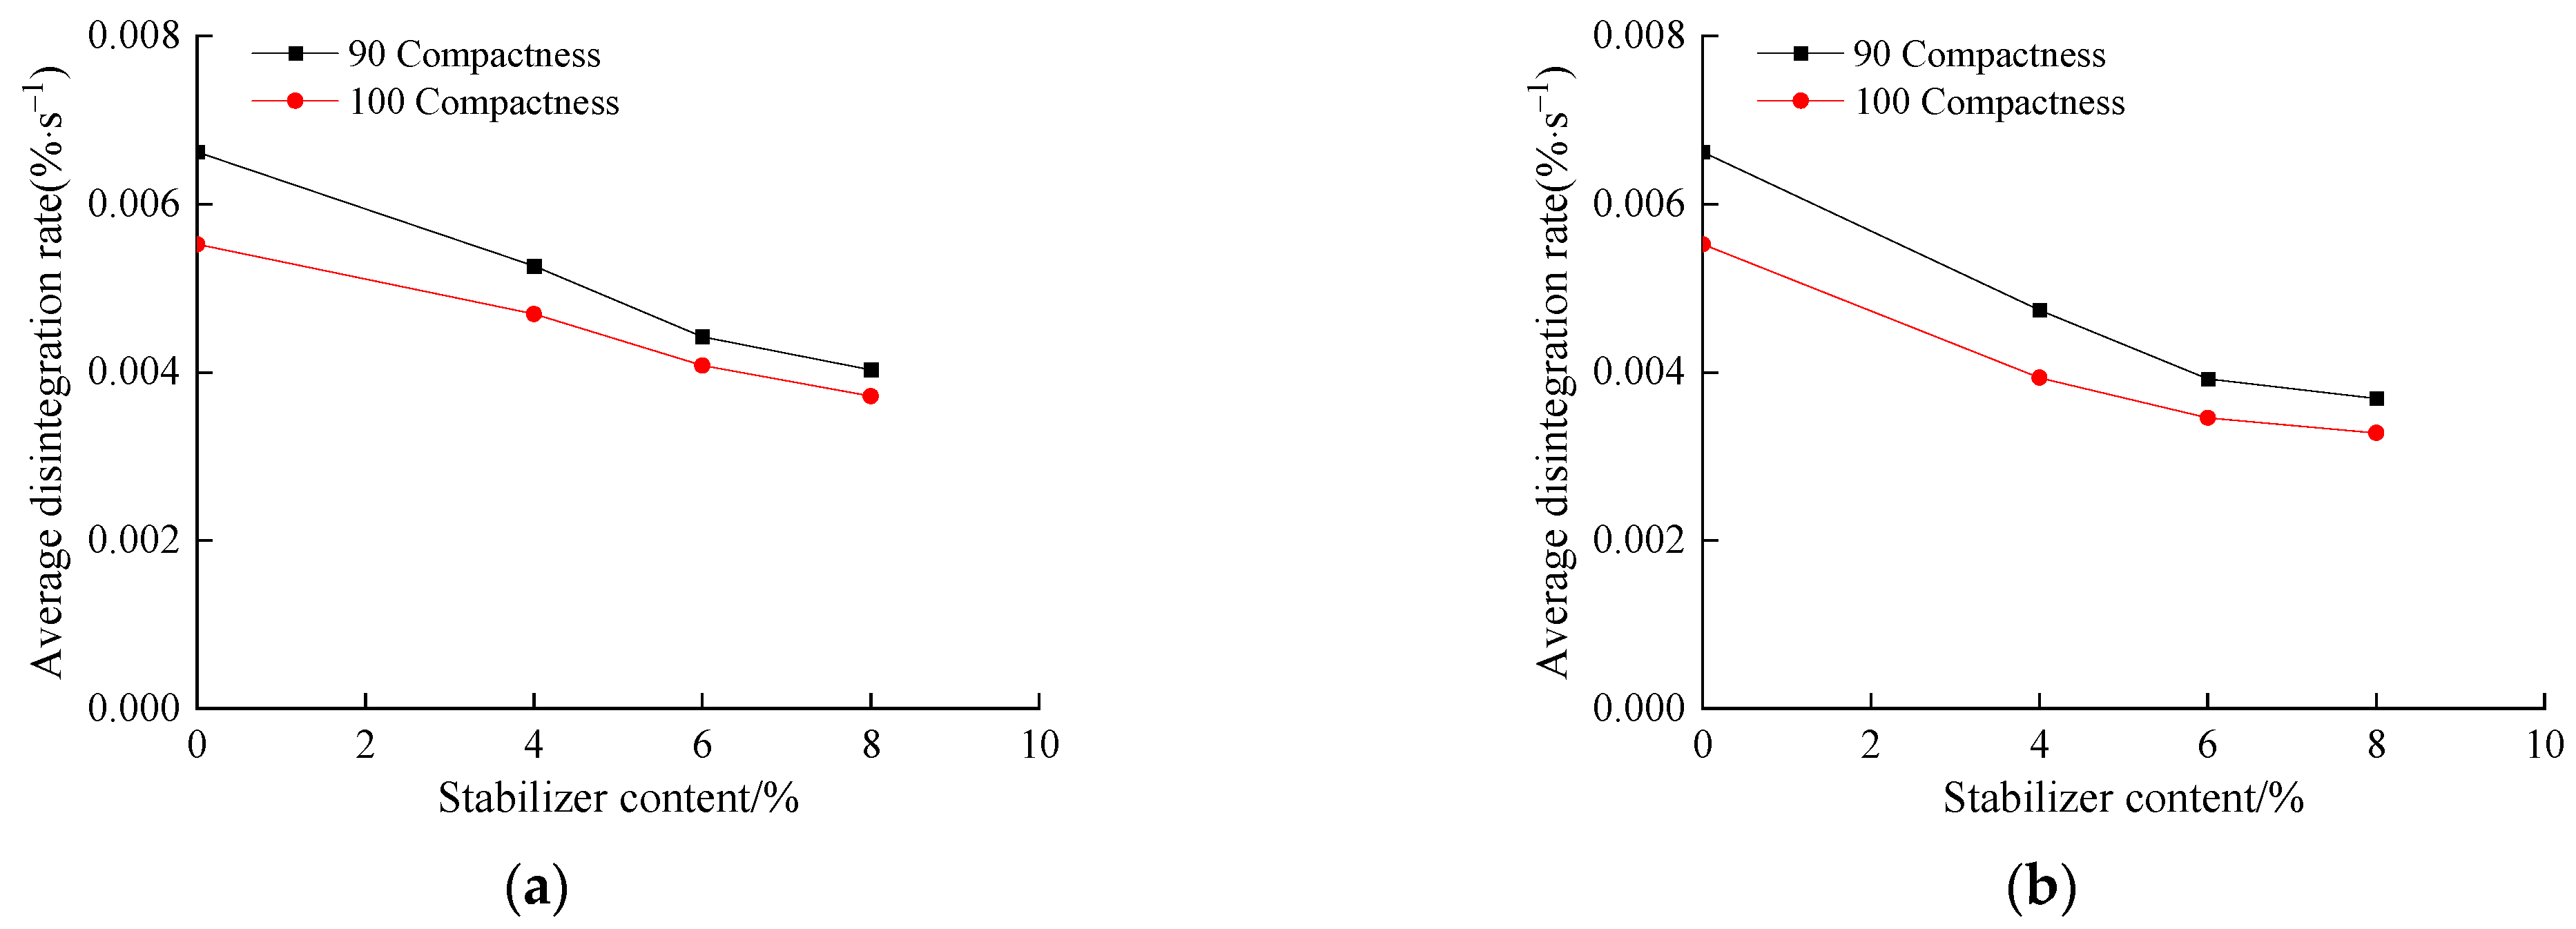
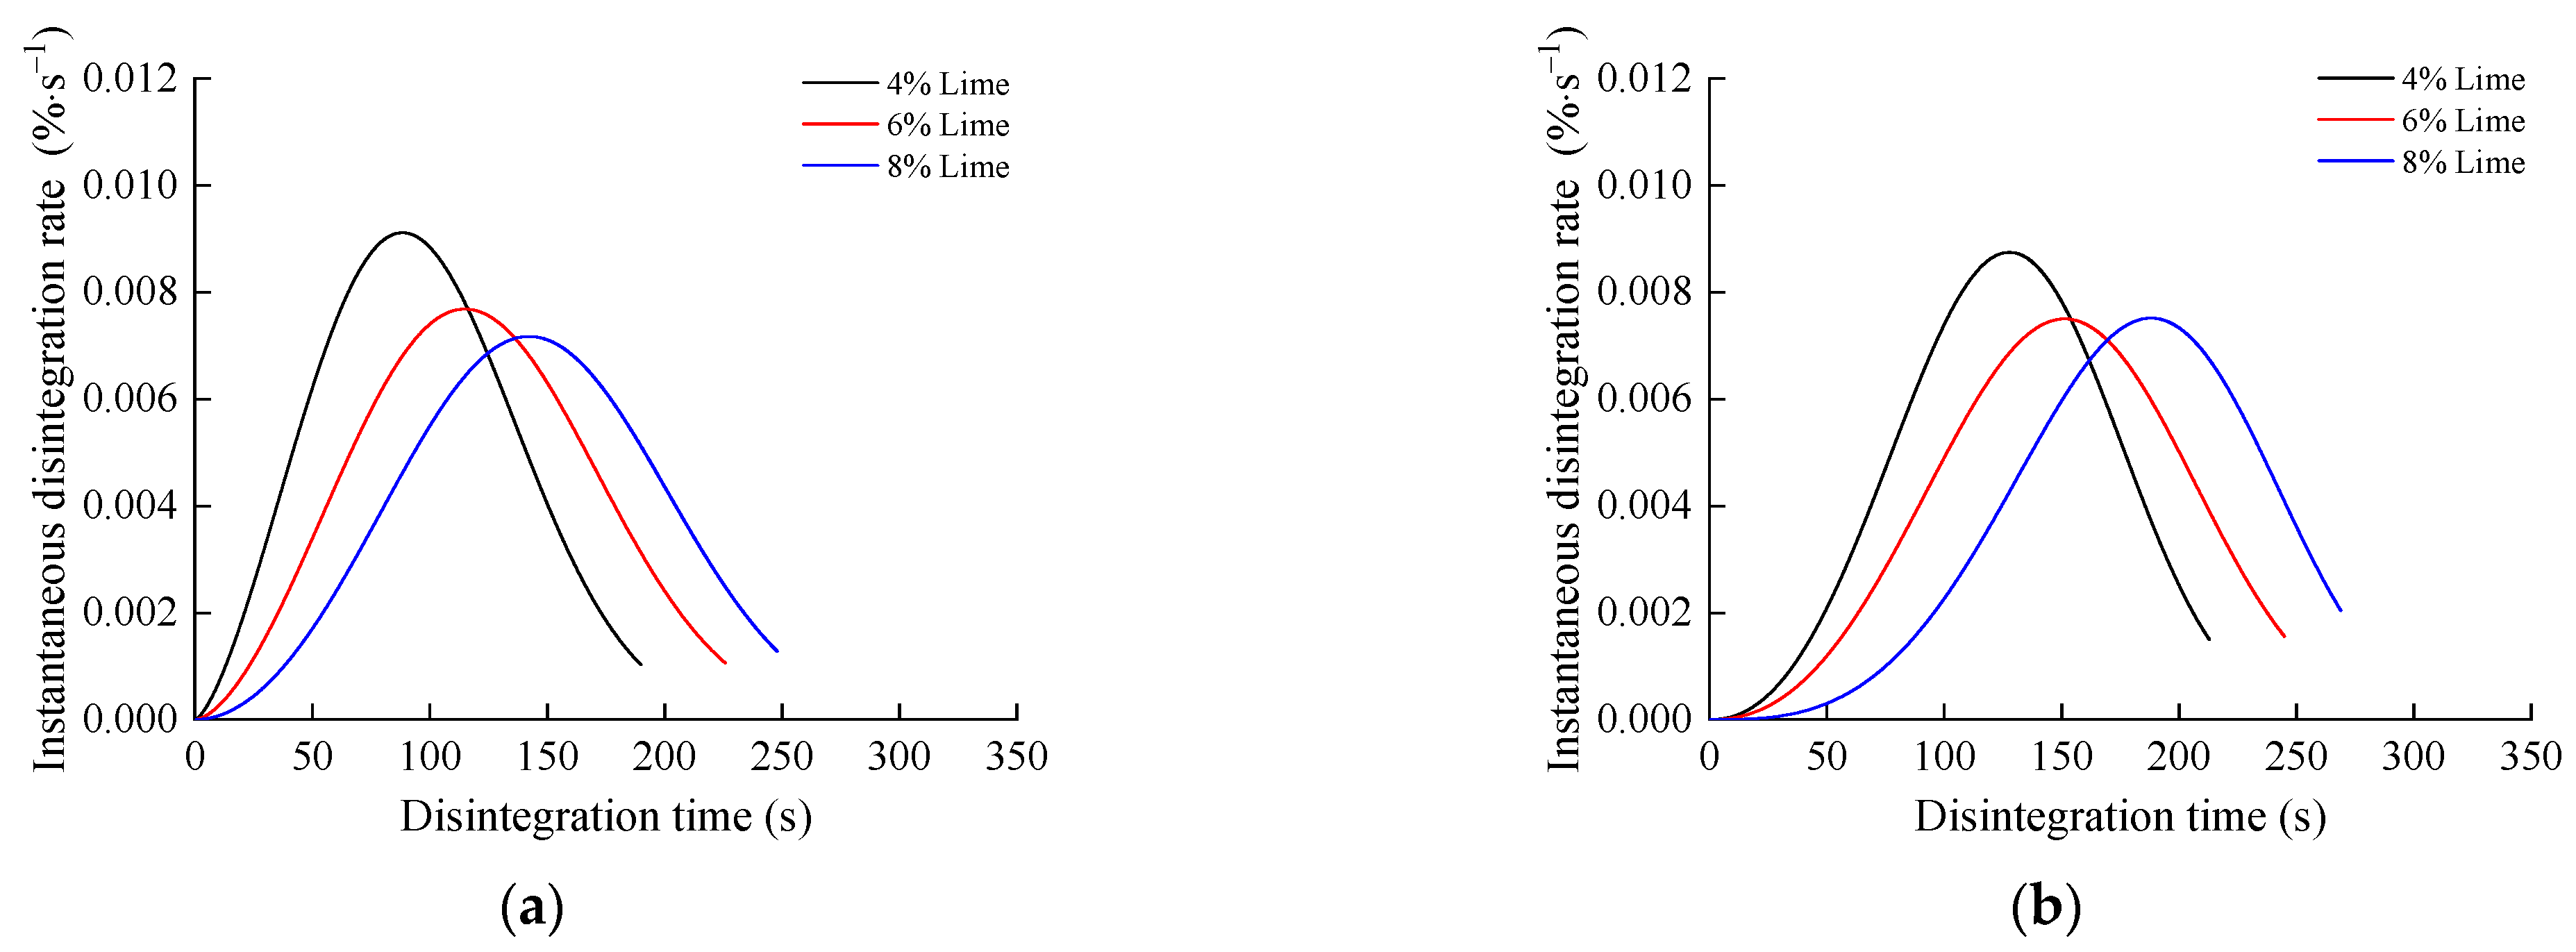
4.2. Evaluation of Disintegration Rate

To further elucidate the disintegration evolution of the stabilized soil, the average disintegration rate can be calculated by using the disintegration ratio. This rate does not directly represent the actual disintegration rate but serves as a measure of the speed at which the soil disintegrates within a defined time period, as expressed by the following equation [33]:
v t ¯ = A t i + 1 A t i t i + 1 t i
where Ai+1t and Ait are the disintegration rate of the specimen at ti+1 and t, respectively.
The average disintegration rate reflects the speed of the disintegration ratio from the initiation to the completion of the disintegration process. By substituting the maximum disintegration time tmax of the disintegrated specimen into Equation (12), the variation in average disintegration rate with the total amount of stabilizer added during the disintegration process could be obtained for the stabilized soil.
The increase in lime content significantly reduced the average disintegration rate of the stabilized soil (Figure 18a). The average disintegration rate of untreated soil was 6.6 × 10⁻³%/s under 90% compactness, while the average disintegration rate of lime-stabilized soil at the lime additions of 8% decreased to 3.9 × 10⁻³%/s. This reduction exhibited a basic linear trend for soil under both 90% and 100 compactnesses, with an increase in 1% lime content leading to a decrease in the disintegration rate by about 3 × 10⁻⁴%/s. This suggested that the lime stabilizer is effective in improving the disintegration performance of silty clay.
Compared with lime-stabilizer soil, the lower average disintegration rate of lime- + cement-stabilized soil implies better disintegration resistance under the same compactness and stabilizer content, as shown in Figure 18b. However, the soil sample using the larger combined additions presents a higher marginal effect, such that the effect of reducing the average disintegration rate is weakened. This once again demonstrated that the appropriate content of stabilizer needs to be investigated for application in engineering, and the addition of 6% may be a better scheme for soils stabilized by lime and cement.
The average disintegration rate fails to capture the variation in the instantaneous disintegration rate in the disintegration process. Given that the disintegration evolution of the stabilized silty clay could be characterized by the Weibull distribution model, the instantaneous disintegration rate was calculated using the first derivatives of Equation (8) in combination with Equation (9):
v i = d P i d t = k e t t max · d k t k 1 t max · d k
With the corresponding Weibull parameters substituted into Equation (13), the instantaneous disintegration rate of the stabilized silty clay was obtained, as shown in Figure 19 and Figure 20.
Compared with the average disintegration rate, the instantaneous disintegration clearly describes the evolution process of the disintegration rate of the stabilized silty clay. Specifically, the disintegration rate demonstrates a parabolic growth with the disintegration time, reaching a peak at about half of the disintegration process and then decreasing continuously. In addition, the peak disintegration rate is basically twice the average disintegration rate.
The peak disintegration rate was observed to be the highest and occurred earlier for the 4% stabilized silty clay using lime or lime + cement. The stabilized soil at the additions of 8% has a slightly lower peak disintegration rate than 6% stabilized soil, with a minimum value of 6.7 × 10⁻³%/s. Stabilized soils with lime and cement could achieve a lower disintegration rate at the end of disintegration due to a larger disintegration time. Higher compactness also reduces the peak disintegration rate and delays the occurrence of peak disintegration time. The analysis presented above reiterates the effectiveness of the Weibull distribution model in capturing the progression of disintegration breakage in the stabilized silty clay, encompassing both the disintegration ratio and disintegration rates.

5. Conclusions

This work endeavors to utilize waste soil generated from urban construction as a subgrade filler following stabilization with lime and cement. This practice is feasible and environmentally friendly, aligning with the current world trend towards environmental protection. Comprehensive assessments of the key engineering properties and the progressive nature of disintegration characteristics in the stabilized soil were conducted. Furthermore, a disintegration model based on the two-parameter Weibull distribution was developed. The primary conclusions drawn from this investigation are summarized as follows:
(1)
With lime content increasing, the lime-stabilized soils presented an increase in the maximum dry density while the optimum moisture content decreased. The lime—cement–stabilized soils exhibited similar behavior but less maximum dry density.
(2)
Compared with the single stabilizer of lime, the CBR value of soils increased more significantly, and the expansion ratio was smaller using the addition of cement at the same stabilizer content. The stabilized waste soil with 4% lime or 1% lime + 1% cement could satisfy the requirements of subgrade materials, according to JTG D30-2015.
(3)
The disintegration time of all the mixed soil with lime increased by 8%, corresponding to the addition of 1% in lime content. The lime and cement soil showed better resistance to disintegration, with an increase in disintegration time of approximately 110% and 115% at the compactness of 90% and 100%, respectively. The stabilizer of lime combined with cement for waste soil should be given priority in areas under high groundwater.
(4)
An evolution model describing the disintegration ratio in the stabilized soil using the Weibull distribution has been developed. The model parameters, namely d and k, were found to be associated with alterations in the disintegration curve, where d represents the intercept, and k signifies the gradient. Both parameters demonstrate gradual increments with increased stabilizer content.
(5)
Disintegration rate equations were formulated by using the developed evolution model. The disintegration rate curve demonstrates a parabolic pattern, with the peak disintegration rate being exactly twice the average disintegration rate. Higher levels of compactness and stabilizer contents reduce the peak disintegration rate and delay the occurrence of peak disintegration time.

Author Contributions

Conceptualization, F.H. and Z.L.; methodology, Z.L.; formal analysis, F.H.; investigation, W.Y.; data curation, W.Y.; writing—original draft preparation, F.H.; writing—review and editing, Z.L.; visualization, F.H.; supervision, Z.L.; project administration, Z.L.; funding acquisition, Z.L. All authors have read and agreed to the published version of the manuscript.

Funding

This research was funded by the Construction Research Project of Zhejiang Province (grant number 2020K153), the Natural Science Foundation of Hunan Province (grant number 2022JJ30257) and the Zhengzhou Research and Development (R&D) Project (grant number 31310122).

Institutional Review Board Statement

Not applicable.

Informed Consent Statement

Not applicable.

Data Availability Statement

Some or all data, models or codes that support the findings of this study are available from the corresponding author upon reasonable request.

Acknowledgments

We extend our deepest appreciation to Ze Liu for his invaluable guidance, unwavering support, and mentorship throughout this research.

Conflicts of Interest

The authors declare no conflicts of interest.

References

  1. Jin, R.; Li, B.; Zhou, T.; Wanatowski, D.; Piroozfar, P. An Empirical Study of Perceptions towards Construction and Demolition Waste Recycling and Reuse in China. Resour. Conserv. Recycl. 2017, 126, 86–98. [Google Scholar] [CrossRef]
  2. Wang, H.; Xia, S.; Zhang, Q.; Zhang, P. Has China’s Construction Waste Change Been Decoupled from Economic Growth? Buildings 2022, 12, 147. [Google Scholar] [CrossRef]
  3. Yang, H.; Xia, J.; Thompson, J.R.; Flower, R.J. Urban Construction and Demolition Waste and Landfill Failure in Shenzhen, China. Waste Manag. 2017, 63, 393–396. [Google Scholar] [CrossRef]
  4. Yang, X.; Chen, Q. Mining Violations, Rent-Seeking, and Resource Governance in China: Evidence from Central Environmental Protection Inspection. Extr. Ind. Soc. 2023, 13, 101218. [Google Scholar] [CrossRef]
  5. Wu, H.; Duan, H.; Zheng, L.; Wang, J.; Niu, Y.; Zhang, G. Demolition Waste Generation and Recycling Potentials in a Rapidly Developing Flagship Megacity of South China: Prospective Scenarios and Implications. Constr. Build. Mater. 2016, 113, 1007–1016. [Google Scholar] [CrossRef]
  6. Huang, J.; Kogbara, R.B.; Hariharan, N.; Masad, E.A.; Little, D.N. A State-of-the-Art Review of Polymers Used in Soil Stabilization. Constr. Build. Mater. 2021, 305, 124685. [Google Scholar] [CrossRef]
  7. Firoozi, A.A.; Guney Olgun, C.; Firoozi, A.A.; Baghini, M.S. Fundamentals of Soil Stabilization. Int. J. Geo-Eng. 2017, 8, 26. [Google Scholar] [CrossRef]
  8. Deneele, D.; Le Runigo, B.; Cui, Y.J.; Cuisinier, O.; Ferber, V. Experimental Assessment Regarding Leaching of Lime-Treated Silt. Constr. Build. Mater. 2016, 112, 1032–1040. [Google Scholar] [CrossRef]
  9. Guney, Y.; Sari, D.; Cetin, M.; Tuncan, M. Impact of Cyclic Wetting-Drying on Swelling Behavior of Lime-Stabilized Soil. Handb. Environ. 2007, 42, 681–688. [Google Scholar] [CrossRef]
  10. Al-Rawas, A.A.; Hago, A.W.; Al-Sarmi, H. Effect of Lime, Cement and Sarooj (Artificial Pozzolan) on the Swelling Potential of an Expansive Soil from Oman. Build. Environ. 2005, 40, 681–687. [Google Scholar] [CrossRef]
  11. Shen, Y.S.; Tang, Y.; Yin, J.; Li, M.P.; Wen, T. An Experimental Investigation on Strength Characteristics of Fiber-Reinforced Clayey Soil Treated with Lime or Cement. Constr. Build. Mater. 2021, 294, 123537. [Google Scholar] [CrossRef]
  12. Barbero-Barrera, M.M.; Jové-Sandoval, F.; González Iglesias, S. Assessment of the Effect of Natural Hydraulic Lime on the Stabilisation of Compressed Earth Blocks. Constr. Build. Mater. 2020, 260, 119877. [Google Scholar] [CrossRef]
  13. Khodaparast, M.; Rajabi, A.M.; Mohammadi, M. Mechanical Properties of Silty Clay Soil Treated with a Mixture of Lime and Zinc Oxide Nanoparticles. Constr. Build. Mater. 2021, 281, 122548. [Google Scholar] [CrossRef]
  14. Cheng, Y.; Wang, S.; Li, J.; Huang, X.; Li, C.; Wu, J. Engineering and Mineralogical Properties of Stabilized Expansive Soil Compositing Lime and Natural Pozzolans. Constr. Build. Mater. 2018, 187, 1031–1038. [Google Scholar] [CrossRef]
  15. Wang, D.X.; Abriak, N.E.; Zentar, R.; Xu, W. Solidification/Stabilization of Dredged Marine Sediments for Road Construction. Environ. Technol. 2012, 33, 95–101. [Google Scholar] [CrossRef] [PubMed]
  16. Wang, Q.; Kong, L.; Tseng, M.L.; Song, Y.; Wang, H. Solid Waste Material Reuse Analysis: Filling the Road Subgrade with Riverway Silt and Sediment. Environ. Sci. Pollut. Res. 2022, 29, 35096–35109. [Google Scholar] [CrossRef]
  17. Hossain, K.M.A.; Lachemi, M.; Easa, S. Characteristics of Volcanic Ash and Natural Lime Based Stabilized Clayey Soils. Can. J. Civ. Eng. 2006, 33, 1455–1458. [Google Scholar] [CrossRef]
  18. Federico, A.; Vitone, C.; Murianni, A. On the Mechanical Behaviour of Dredged Submarine Clayey Sediments Stabilized with Lime or Cement. Can. Geotech. J. 2015, 52, 2030–2040. [Google Scholar] [CrossRef]
  19. Locat, J.; Trembaly, H.; Leroueil, S. Mechanical and Hydraulic Behaviour of a Soft Inorganic Clay Treated with Lime. Can. Geotech. J. 1996, 33, 654–669. [Google Scholar] [CrossRef]
  20. Bell, F.G. Lime Stabilization of Clay Minerals and Soils. Eng. Geol. 1996, 42, 223–237. [Google Scholar] [CrossRef]
  21. Ouhadi, V.R.; Yong, R.N.; Amiri, M.; Ouhadi, M.H. Pozzolanic Consolidation of Stabilized Soft Clays. Appl. Clay Sci. 2014, 95, 111–118. [Google Scholar] [CrossRef]
  22. Zhao, X.; Rao, J.; Yang, Q.; Rong, Y.; Fu, Z.; Wang, Z.; Chen, Z. Experimental Study on Improvement Effects of Completely Weathered Phyllite Using Red Clay and Cement for High-Speed Railway Embankments. J. Renew. Mater. 2022, 10, 1287–1305. [Google Scholar] [CrossRef]
  23. Aziz, M.; Sheikh, F.N.; Qureshi, M.U.; Rasool, A.M.; Irfan, M. Experimental Study on Endurance Performance of Lime and Cement-Treated Cohesive Soil. KSCE J. Civ. Eng. 2021, 25, 3306–3318. [Google Scholar] [CrossRef]
  24. Bouras, F.; Al-Mukhtar, M.; Tapsoba, N.; Belayachi, N.; Sabio, S.; Beck, K.; Martin, M. Geotechnical Behavior and Physico-Chemical Changes of Lime-Treated and Cement-Treated Silty Soil. Geotech. Geol. Eng. 2022, 40, 2033–2049. [Google Scholar] [CrossRef]
  25. Graybeal, B.; Tanesi, J. A Cementitious Long-Life Wearing Course to Reduce Frequency of Maintenance Works on High-Traffic Roads. Transp. Res. Arena Eur. 2008, 1561, 454–461. [Google Scholar] [CrossRef]
  26. Elandaloussi, R.; Bennabi, A.; Dupla, J.C.; Canou, J.; Benamar, A.; Gotteland, P. Effectiveness of Lime Treatment of Coarse Soils against Internal Erosion. Geotech. Geol. Eng. 2019, 37, 139–154. [Google Scholar] [CrossRef]
  27. Zhang, X.W.; Kong, L.W.; Li, J.J. Influence of Dry and Wet Seasons on Disintegration Characteristics of Basalt Residual Soil from the Leizhou Peninsula, China. Q. J. Eng. Geol. Hydrogeol. 2018, 51, 450–460. [Google Scholar] [CrossRef]
  28. Czerewko, M.A.; Cripps, J.C. Assessing the Durability of Mudrocks Using the Modified Jar Slake Index Test. Q. J. Eng. Geol. Hydrogeol. 2001, 34, 153–163. [Google Scholar] [CrossRef]
  29. Admassu, Y.; Hamdan, H.; Gautam, T. Multivariate Statistical Approach to Re-Evaluate the Slake Durability Index Test (ASTM 4644-08). Eng. Geol. 2016, 209, 12–20. [Google Scholar] [CrossRef]
  30. Ze, Z.; Vadim, P.; Svetlana, N.; Zhongqiong, Z.; Junjie, W. Disintegration Characteristics of a Cryolithogenic Clay Loam with Different Water Content: Moscow Covering Loam (PrQIII), Case Study. Eng. Geol. 2019, 258, 105159. [Google Scholar] [CrossRef]
  31. Yan, L.; Liu, P.; Peng, H.; Kašanin-Grubin, M.; Lin, K. Laboratory Study of the Effect of Temperature Difference on the Disintegration of Redbed Softrock. Phys. Geogr. 2019, 40, 149–163. [Google Scholar] [CrossRef]
  32. Li, X.A.; Wang, L.; Yan, Y.L.; Hong, B.; Li, L.C. Experimental Study on the Disintegration of Loess in the Loess Plateau of China. Bull. Eng. Geol. Environ. 2019, 78, 4907–4918. [Google Scholar] [CrossRef]
  33. Zhang, X.; Liu, X.; Chen, C.; Kong, L.; Wang, G. Engineering Geology of Residual Soil Derived from Mudstone in Zimbabwe. Eng. Geol. 2020, 277, 105785. [Google Scholar] [CrossRef]
  34. Wang, J.; Gu, T.; Zhang, M.; Xu, Y.; Kong, J. Experimental Study of Loess Disintegration Characteristics. Earth Surf. Process. Landf. 2019, 44, 1317–1329. [Google Scholar] [CrossRef]
  35. Zhang, Z.; Liu, W.; Cui, Q.; Han, L.; Yao, H. Disintegration Characteristics of Moderately Weathered Mudstone in Drawdown Area of Three Gorges Reservoir, China. Arab. J. Geosci. 2018, 11, 405. [Google Scholar] [CrossRef]
  36. Zhang, X.; Liu, X.; Chen, C.; Xu, Y.; Liu, H. Evolution of Disintegration Properties of Granite Residual Soil with Microstructure Alteration Due to Wetting and Drying Cycles. Bull. Eng. Geol. Environ. 2022, 81, 93. [Google Scholar] [CrossRef]
  37. Sahoo, S.; Prasad Singh, S. Strength and Durability Properties of Expansive Soil Treated with Geopolymer and Conventional Stabilizers. Constr. Build. Mater. 2022, 328, 127078. [Google Scholar] [CrossRef]
  38. Mahedi, M.; Cetin, B.; Dayioglu, A.Y. Effect of Cement Incorporation on the Leaching Characteristics of Elements from Fly Ash and Slag Treated Soils. J. Environ. Manag. 2020, 253, 109720. [Google Scholar] [CrossRef] [PubMed]
  39. Hou, T.S.; Yuan, X.H.; Zeng, X.; Wang, X.; Ceng, Y.D.; Zhang, Z.Z.; Hou, M.L. Water Resistance Properties of Lime Soil Ground under Long-Term Soaking Environment. Indian Geotech. J. 2021, 51, 1299–1309. [Google Scholar] [CrossRef]
  40. Chinese Standard JTG E40-2007; Test Methods of Soils for Highway Engineering. China Communications Press: Beijing, China, 2007.
  41. Chinese Standard JTG D30-2015; Specifications for Design of Highway Subgrades. China Communications Press: Beijing, China, 2015.
  42. Khemissa, M.; Mahamedi, A. Cement and Lime Mixture Stabilization of an Expansive Overconsolidated Clay. Appl. Clay Sci. 2014, 95, 104–110. [Google Scholar] [CrossRef]
  43. Carde, C.; François, R. Effect of ITZ leaching on durability of cement-based materials. Cem. Concr. Res. 1997, 27, 971–978. [Google Scholar] [CrossRef]
  44. Nakagawa, T.; Osaki, S. The Discrete Weibull Distribution. IEEE Trans. Reliab. 1975, R-24, 300–301. [Google Scholar] [CrossRef]
  45. Lu, C.; Danzer, R.; Fischer, F.D. Fracture Statistics of Brittle Materials: Weibull or Normal Distribution. Phys. Rev. E 2002, 65, 67102. [Google Scholar] [CrossRef]
  46. Wong, T.; Wong, R.H.C.; Chau, K.T.; Tang, C.A. Microcrack Statistics, Weibull Distribution and Micromechanical Modeling of Compressive Failure in Rock. Mech. Mater. 2006, 38, 664–681. [Google Scholar] [CrossRef]
  47. Carrasco, J.M.F.; Ortega, E.M.M.; Cordeiro, G.M. A Generalized Modified Weibull Distribution for Lifetime Modeling. Comput. Stat. Data Anal. 2008, 53, 450–462. [Google Scholar] [CrossRef]
  48. Lobo-Guerrero, S.; Vallejo, L.E. Application of Weibull Statistics to the Tensile Strength of Rock Aggregates. J. Geotech. Geoenvironment. Eng. 2006, 132, 786–790. [Google Scholar] [CrossRef]
  49. Erami, F.E.; Firoozjaee, A.R. Numerical Solution of Bed Load Transport Equations Using Discrete Least Squares Meshless (DLSM) Method. Appl. Math. Model. 2020, 77, 1095–1109. [Google Scholar] [CrossRef]
Figure 1. Field Sampling.
Applsci 14 01901 g001
Figure 2. Mineral content of engineering waste soil.
Applsci 14 01901 g002
Figure 3. Particle size distribution.
Applsci 14 01901 g003
Figure 4. The scheme of disintegration test.
Applsci 14 01901 g004
Figure 5. Self-made disintegration test system.
Applsci 14 01901 g005
Figure 6. Results of compaction tests of stabilized silty clay with lime: (a) Compaction curves; (b) Influence of stabilizer content.
Applsci 14 01901 g006
Figure 7. Results of compaction tests of stabilized silty clay with lime and cement: (a) Compaction curves; (b) Influence of stabilizer content.
Applsci 14 01901 g007
Figure 8. CBR2.5 of stabilized silty clay.
Applsci 14 01901 g008
Figure 9. Expansion ratio of stabilized silty clay.
Applsci 14 01901 g009
Figure 10. Disintegration process of soil samples: (a) Surface spalling; (b) Gradual disintegration; (c) Accelerated disintegration; (d) Disintegration breakage.
Applsci 14 01901 g010
Figure 11. Disintegration curve of untreated silty clay: (a) Residual weight; (b) Disintegration ratio.
Applsci 14 01901 g011
Figure 12. Disintegration ratio of silty clay stabilized by lime: (a) 90% compactness; (b) 100% compactness.
Applsci 14 01901 g012
Figure 13. Maximum disintegration time of stabilized silty clay using the additions of lime.
Applsci 14 01901 g013
Figure 14. Disintegration ratio of silty clay stabilized by lime and cement: (a) 90% compactness; (b) 100% compactness.
Applsci 14 01901 g014
Figure 15. Maximum disintegration time of stabilized silty clay using the additions of lime and cement.
Applsci 14 01901 g015
Figure 16. Comparison between test results and model for stabilized soil with lime: (a) 90% compactness; (b) 100% compactness.
Applsci 14 01901 g016
Figure 17. Comparison between test results and model for stabilized soil with lime and cement: (a) 90% compactness; (b) 100% compactness.
Applsci 14 01901 g017
Figure 18. Average disintegration rate of stabilized silty clay using the additions of (a) lime and (b) lime and cement.
Applsci 14 01901 g018
Figure 19. Instantaneous disintegration rate of silty clay stabilized by lime: (a) 90% compactness; (b) 100% compactness.
Applsci 14 01901 g019
Figure 20. Instantaneous disintegration rate of silty clay stabilized by lime and cement: (a) 90% compactness; (b) 100% compactness.
Applsci 14 01901 g020
Table 1. Physical and mechanical properties of waste soil.
PropertiesTest Values
Specific gravity, Gs2.60
Coefficient of uniformity, Cu25.7
Coefficient of curvature, Cc0.317
d10 (mm)0.007
d30 (mm)0.02
d60 (mm)0.12
Liquid limit, wL (%)35.3
Plastic limit, wP (%)21.1
Plasticity index, IP (%)14.2
Friction angle, φ (°)26
Cohesion, c (kPa)13
Table 2. Design of the mixing ratio for the stabilized soil.
Type of Stabilized SoilCombinations
Lime-stabilized soil2% lime
4% lime
6% lime
8% lime
Lime- and cement-stabilized soil1% lime + 1% cement
2% lime + 2% cement
3% lime + 3% cement
4% lime + 4% cement
Table 3. Weibull model parameters.
Stabilizer Content90% Compactness100% Compactness
dkR2dkR2
4% lime0.57522.45820.99890.67263.22930.9975
6% lime0.60862.64640.99780.69023.27290.9959
8% lime0.65752.98380.99630.75163.99170.9956
2% lime + 2% cement0.52292.98250.99770.55353.32920.9985
3% lime + 3% cement0.58663.07070.99710.57533.25680.9976
4% lime + 4% cement0.72174.01940.99870.64453.54540.9983
Disclaimer/Publisher’s Note: The statements, opinions and data contained in all publications are solely those of the individual author(s) and contributor(s) and not of MDPI and/or the editor(s). MDPI and/or the editor(s) disclaim responsibility for any injury to people or property resulting from any ideas, methods, instructions or products referred to in the content.

