Article

Technological Composition and Innovation Factors in Inventive Yangtze River Delta: Evidence from Patent Inventions

1
Department of Urban Planning, College of Architecture and Urban Planning, Tongji University, Shanghai 200092, China
2
Department of Urban Planning and Design, Faculty of Architecture, The University of Hong Kong, Hong Kong SAR, China
*
Authors to whom correspondence should be addressed.
Appl. Sci. 2024, 14(5), 1842; https://doi.org/10.3390/app14051842
Submission received: 26 January 2024 / Revised: 16 February 2024 / Accepted: 20 February 2024 / Published: 23 February 2024

Abstract

:
Patents as proxy for technological trends is well noted. The rapid increase of patents in China, however, has aroused debates on its technological progress: ‘few original innovations’ are produced in advanced areas, and true ‘breakthroughs’ are disproportionate to the quantity of the applications. As different technological fields contributions vary to technological progress, a nuanced understanding towards technological composition is in need to help reveal China’s strength in technological innovation. This research takes the Yangtze River Delta (YRD), one of China’s most inventive city-regions, as an epitome to examine the issue via three steps: (1) valid patent inventions applied from 2010 to 2018 are sorted to capture the concentration and colocation features of 35 technological fields defined by the World Intellectual Property Organization (WIPO); (2) four types (intensive, extensive, distinctive, and supportive) of technologies exemplifying technology intensity and interactivity are identified by the cross-classification method and further analyzed by spatial autocorrelation; (3) how urban factors relate to innovation of these four types of technologies are explored. This research unveils a mixed but polarized structure of technological composition in the YRD where the spatial concentration of technologies is as analogous to the nation’s but colocation is not; though quite a few technologies fall into the intensive (usually high-tech) category which assumes to be more likely to breed ‘breakthroughs’, their numbers are limited and far less than extensive (usually labor intensive) or supportive. Knowledge exchange is frequent in core inventive cities where economic performance measured by GDP is most eminently linked to patent inventions of categorized technologies, the exception is intensive technology for which the significance of university students overrides other factors.

1. Introduction

Facing economic slowdown, post-pandemic society has reiterated the significance of technological innovation, with the result of increased academic interests in various fields [1,2,3,4,5]. The contribution of technological innovation to the economy, however, varies in different fields and depends on how innovative activities coordinate with each other [6]. Identifying the locational concentration of different technological fields and how knowledge flows among them thus deepens recognition on technological change and helps better incentive making. However, to decode technological composition and technologies’ spatial association has long proven tough. Patent data, introduced at the earliest in the late 1980s, were viable resources to measure technological innovation [7]. The data sources resolve two main difficulties for recognizing technological innovation: first, linking technological and different fields is possible under the patent classification system; second, identifying the spatial location of the invention is workable through the information of application address [8,9,10,11].
Extant research contends that knowledge spillovers are geographically bounded and that technology breakthrough as well as economic benefits are gained within this boundary. A populated city-region is considered as a spatial scale fitting such boundary for innovative activities [12,13]. Scale effects produced by city-regions help minimize externalities by sharing earns and risks that are brought about by technological or industrial specialization, reduce transaction costs through efficient resource, labor, and goods search, and foster active learning and exchange of tacit knowledge [14,15,16]. It is also a scale reaching the limit of knowledge spillover and tacit knowledge exchange, thus most likely to breed primary invention [17,18,19]. Yet, as city-regions differ in location, resources, and governance systems, how knowledge creation activities distribute in different fields and spatially interact within a city-region are considered case-by-case and far less understood.
Using patent data, some studies have conducted country-level analyses to reveal the composition and spatial location of technologies, mostly in U.S. and Europe [17,20,21], but there have not been many efforts deploying patent data to deconstruct technological composition within the city-region. Patent filing in China has grown rapidly over the past years since the pursuit of innovation strategy. Taking advantage of the large set of patent data, studies on China’s innovation landscape have emerged around 2010 [22,23,24,25,26]. The findings suggest that innovative activities are spatially concentrated in coastal areas, particularly the three most populated city regions (Beijing–Tianjin–Hebei, Yangtze River Delta, and Pearl River Delta) with very small portion engendered outside, and that the degree of spatial concentration of innovative activities in China far outweighs that in the U.S. and EU [27]. Therefore, the key to understand technological innovation in China would be to decipher the innovation landscape in the coastal, populated city-regions. Nevertheless, a country-level analysis is often province-based, losing the possibilities to uncover a nuanced picture. Under the hyper growth of applications, the quality of patents also aroused substantial international concern, given that over half of the applications can only be classified as the lower quality “utility model” or “design” instead of the high innovative “invention” [6,28]. This means the majority of the applications were incremental, minor changes instead of the original invention, but clear distinguishment of the original invention from other types is inadequate, let alone the knowledge about innovative activities in specific fields.
This research therefore seeks to decode China’s innovation via one of its most innovative city-regions, the Yangtze River Delta (YRD), and identify its technological composition and innovation factors with valid patent inventions applied from 2010 to 2018 from this region to the Chinese National Intellectual Property Administration (CNIPA). It also aims to disentangle how innovative activities distribute in different technological fields and interact with each other, and compare this observation in China with that in the U.S., to reflect the quality dilemma. This research was one of the first attempts to decode technological composition and its association with cities in a city-region of China. It improves the cross-classification method and extends its application to a non-Western context, thus contributes to an in-depth, contextualized recognition on technological innovation that links to different fields at the city-region level. Following this introduction, Section 2 is divided into three parts to instruct the empirical study: the first part reviews the patent system which helps link technological innovation to industrial fields and consults related extant studies using this classification system; the second part further reviews the ways to identify intensity and interactivity of technologies and their spatial dependence; the third part reviews urban factors that may influence technological innovation. Section 3 then describes in detail the study area and research methods introduced in the review. Section 4 presents the result by applying the method to examine the YRD. Section 5 concludes by discussing implications of the results for technological innovation development.

2. Literature Review

2.1. Technological Fields and Spatial Features

Patents as standardized data sources about technology have so far primarily applied across macro territories, often at the national level [17,29,30,31,32,33,34]. In addition, despite the wide use of patents as a proxy to measure technological innovation [35,36], researchers recently argued that to simply equate the number of patents to innovative capability should be very cautious [37]. China is probably at the forefront of this controversy, as many of its patent applications are discarded during or after disposal or classified as a lower quality “utility model” or “design” instead of “invention” [6,28]. Under the regulation of CNIPA, only those passed through substantive examination, during publication or obtaining grants, are valid patents (Figure 1). A utility model offers protection of “minor inventions” through a system similar to a patent but is overall cheaper to obtain or maintain, thus is often viewed as second-class patents [38,39]. Earlier, in April 1985 when the Patent Law of the People’s Republic of China was in force, utility model, design, and invention were all defined as patents, but this was not the case in the United States or United Kingdom. Even considering patent inventions alone, researchers have identified a skewed distribution in terms of their value and quality: a great portion are useless, a few have certain value, an extreme few are breakthroughs [40], and less than half have entered the market [41].
It has been noted that the patent type, e.g., the technological field in which the patent belongs, may play a role for innovation quality [40]. Normally, the more advanced the technology is, the more concentrated the patents produced [16], and the more likely the breakthroughs will happen. Knowledge spillover effects may well suggest that these concentrated, advanced technologies are highly inclined to form an innovation chain with other technologies, whereby the synergetic effects induce increasing colocation knowledge production [42]. To identify the concentration (usually measured by Gini coefficients) and colocation (can be measured by principal component analysis), the degree of patent production in line with their technological fields thus helps to unfold the innovative potential of a city-region. The patent classification system aids in this regard. The commonly used one by United States Patent and Trademark Office is the United States Patent Classification (USPC) system, which was first developed in 1900. Instead, CNIPA adopts the International Patent Classification (IPC) scheme established by the 1971 Strasbourg Agreement, which has been used by patent offices across over 100 countries. In 2010, an agreement between the USPTO and European Patent Office brought about the Cooperative Patent Classification system as harmonization. The system has a similar structure to IPC classification, thus resolved the inconsistency between major classification systems [11]. In this research, the four-digit IPC code proposed in the WIPO IPC-Technology Concordance Table will be applied to sort different technological fields.
Extant research using the IPC code to examine technological heterogeneity and their location features is primarily conducted at the national level. Huallachain [16] and Choi, Sohn [17] find that in U.S., the most spatially concentrated technology fields are those advanced high-tech sectors, normally related to computer, biotechnology, and semiconductors, etc. Concentration implies internal flows of knowledge within the technology and different technology often concentrated in different cities. For instance, New York’s is foremost in drugs, communication, organic compounds, and medical, etc., Los Angles ranks top in amusement devices, Detroit is in an advantageous position in motors, engines, parts, and metalworking, Rochester is center for optics, while Houston and Texas are bases for earth working and wells. Interdependency between technologies, viz. frequent knowledge flow between technology, also varies among technological groups. In the U.S., for instance, knowledge flows between computer, information storage, and semiconductors are intense, showing a significant colocation pattern, but those between the electronic sector and medical sector are much less frequent, indicating a weaker knowledge exchange. Do technological innovation activities in city-regions analogous those in nations? Given the knowledge above, the research aims to identify the question below:
RQ1. To what extent do the spatial concentration and colocation patterns of technologies defined by WIPO in a city-region, as evidenced in YRD, resemble, and differ from those in a nation?

2.2. Cross-Classification and Spatial Dependence

To better understand the intensity and interactivity of technologies, scholars proposed the cross-classification method to combine the results of concentration and colocation [16,17]. Four quadrants are proposed to indicate the relative position of different technologies according to their concentration and colocation degrees: the assumption is that the higher the concentration degree, the more likely knowledge flows within the technology, and vice versa; the higher the colocation degree, the more likely knowledge flows across other technologies, and vice versa. The method responds to the argument of spatial proximity for local buzz and knowledge exchange [43,44] across space: spatially dispersed technologies characterized by low colocation with other fields are extensive in nature, suggesting open and loose knowledge ties within and across technologies; spatially dispersed technologies characterized by high colocation with other fields are supportive in nature, implying weak internal knowledge flows but strong interaction with related fields; spatially concentered technologies characterized by low colocation with other fields are distinctive in nature, suggesting strong internal knowledge flows but dispersed knowledge ties with other fields; spatially concentrated technologies characterized by high colocation with other fields are intensive in nature, implying strong internal flows of knowledge and robust ties with associated technologies.
Applying the method, researchers unveil that in U.S., the majority of technologies can be classified to extensive and distinctive types, with limited ones belonging to the supportive. In addition, as time went by, technologies once intensive are likely to become extensive as newly emerged technologies are often more intensive. This can be illustrated by computer technology which evolved relatively extensively after nanotechnology came into being [16,17]. Though the method enables rapid classification of extensive, distinctive, supportive, and intensive technologies, it is too simplistic to identify the nuanced variations of knowledge exchange within and across technological fields. Understanding such variations is not insignificant because the ways knowledge has been shared are crucial for potential breakthroughs and radical innovation often occurs in knowledge-intensive industries [45,46]. In this regard, this study improves the cross-classification method by visualizing the relative position of technologies and accurately maps them in the four-quadrant diagram. The quantities of each technology are further associated to reveal the actual innovative outputs in each field. The purpose is not for the identification of specialization, but to understand how technologies spatially agglomerate and coordinate with one and the other in reality.
Spatial autocorrelation empowers the identification of where classified technologies locate and to what extent they are interdependent, thus reveals the inventive cities where knowledge flows are spatially dependent and reinforce innovative outputs [10,47]. As noted in numerous studies, the exchange of tacit knowledge which inspires original innovations requires face-to-face communications, thus is distance-sensitive [43,48]. Global and local Moran’s I [49,50] are valid coefficients in this regard and will be used in this research to reveal the overall spatial dependence of categorized technologies (Global Moran’s I) as well as the association between technologies at a particular location and those at the neighboring areas (Local Moran’s I). Disentangling patents’ locational features and their spatial dependance helps the adjustment of a spatial plan, and necessitates inquiries of the question below:
RQ2. Given its concentration and colocation features, how does technology vary from one to the other under the four-quadrant cross-classification system, and how do the cross-classified technologies spatially depend?

2.3. Innovation Factors for Technological Development

Though the features of innovative entities such as firm size, ownerships, and R&D investment are viewed as significant for technological breakthrough [51], this is not the sole factor in a complex city. Factors such as economic strength and dynamism, talents and their mobility, urban construction level, etc., are also tested as influential [10,52]. Dating back to early 20th century, the correlation between economic performance and technological advancement was evident [53]. Technological progress, in whatever fields, would bring about visible economic growth, and a better economy would assuredly reinforce technological advancement [54]. Recently, however, with the increasing complexity of economic innovative activities, the bundle relation between economy and innovation is not as certain as usual in some areas. For instance, in a study about China’s green growth, technological innovation was found as having a positive impact, but GDP was not [55]; in the Chinese video game industry, applying technologies to military training, biomimicry, and product presentation is considered far more significant than its mere economic contributions [56]. Is the economy still overridingly associated with innovation in a city-region? This research employs GDP, GDP per capita, and public expense to represent the economy from three aspects: in particular, GDP represents economic aggregates, GDP per capita represents economic efficiency per person, and public expense presents economic inputs for social development. The resident population serves as the talent pool and the primary source of human capital for innovative activities [57]. Yet, quality innovative outputs shall depend on quality talents who normally engage in intellectual intensive work. University students in this research provide as a quality talent pool for venture activities [58]. Cities are the font of economic innovation [13,59] and its built environment matters for innovation productivity [10,60]. To identify how innovative outputs are associated with the built environment, this research employs building construction, green area per capita, and road mileage for analysis: the building construction represents architectural environment, green area per capita represents public space environment, and road mileage represents the transportation environment. For developing countries, gaining innovation capacity may also depend on foreign sources of knowledge and technology which possibly flow through a variety of channels such as FDI [61]. For instance, by importing the licensing of technology and forming alliances with firms of developed countries, Japan fast caught up with advanced foreign technology in the postwar phase [62]. However, the importance of FDI as a channel for knowledge transfer varies from place to place, e.g., South Korea and Taiwan and its role in technological innovation, thus is at best being discussed case-by-case. Given the review above, the following research questions are proposed:
RQ3. How do the cross-classified technologies associate with urban innovation factors? Is economic performance overriding other factors such as human capital, urban built environment, and foreign resources for technological innovation, as evidenced in the YRD?

3. Study Area and Research Method
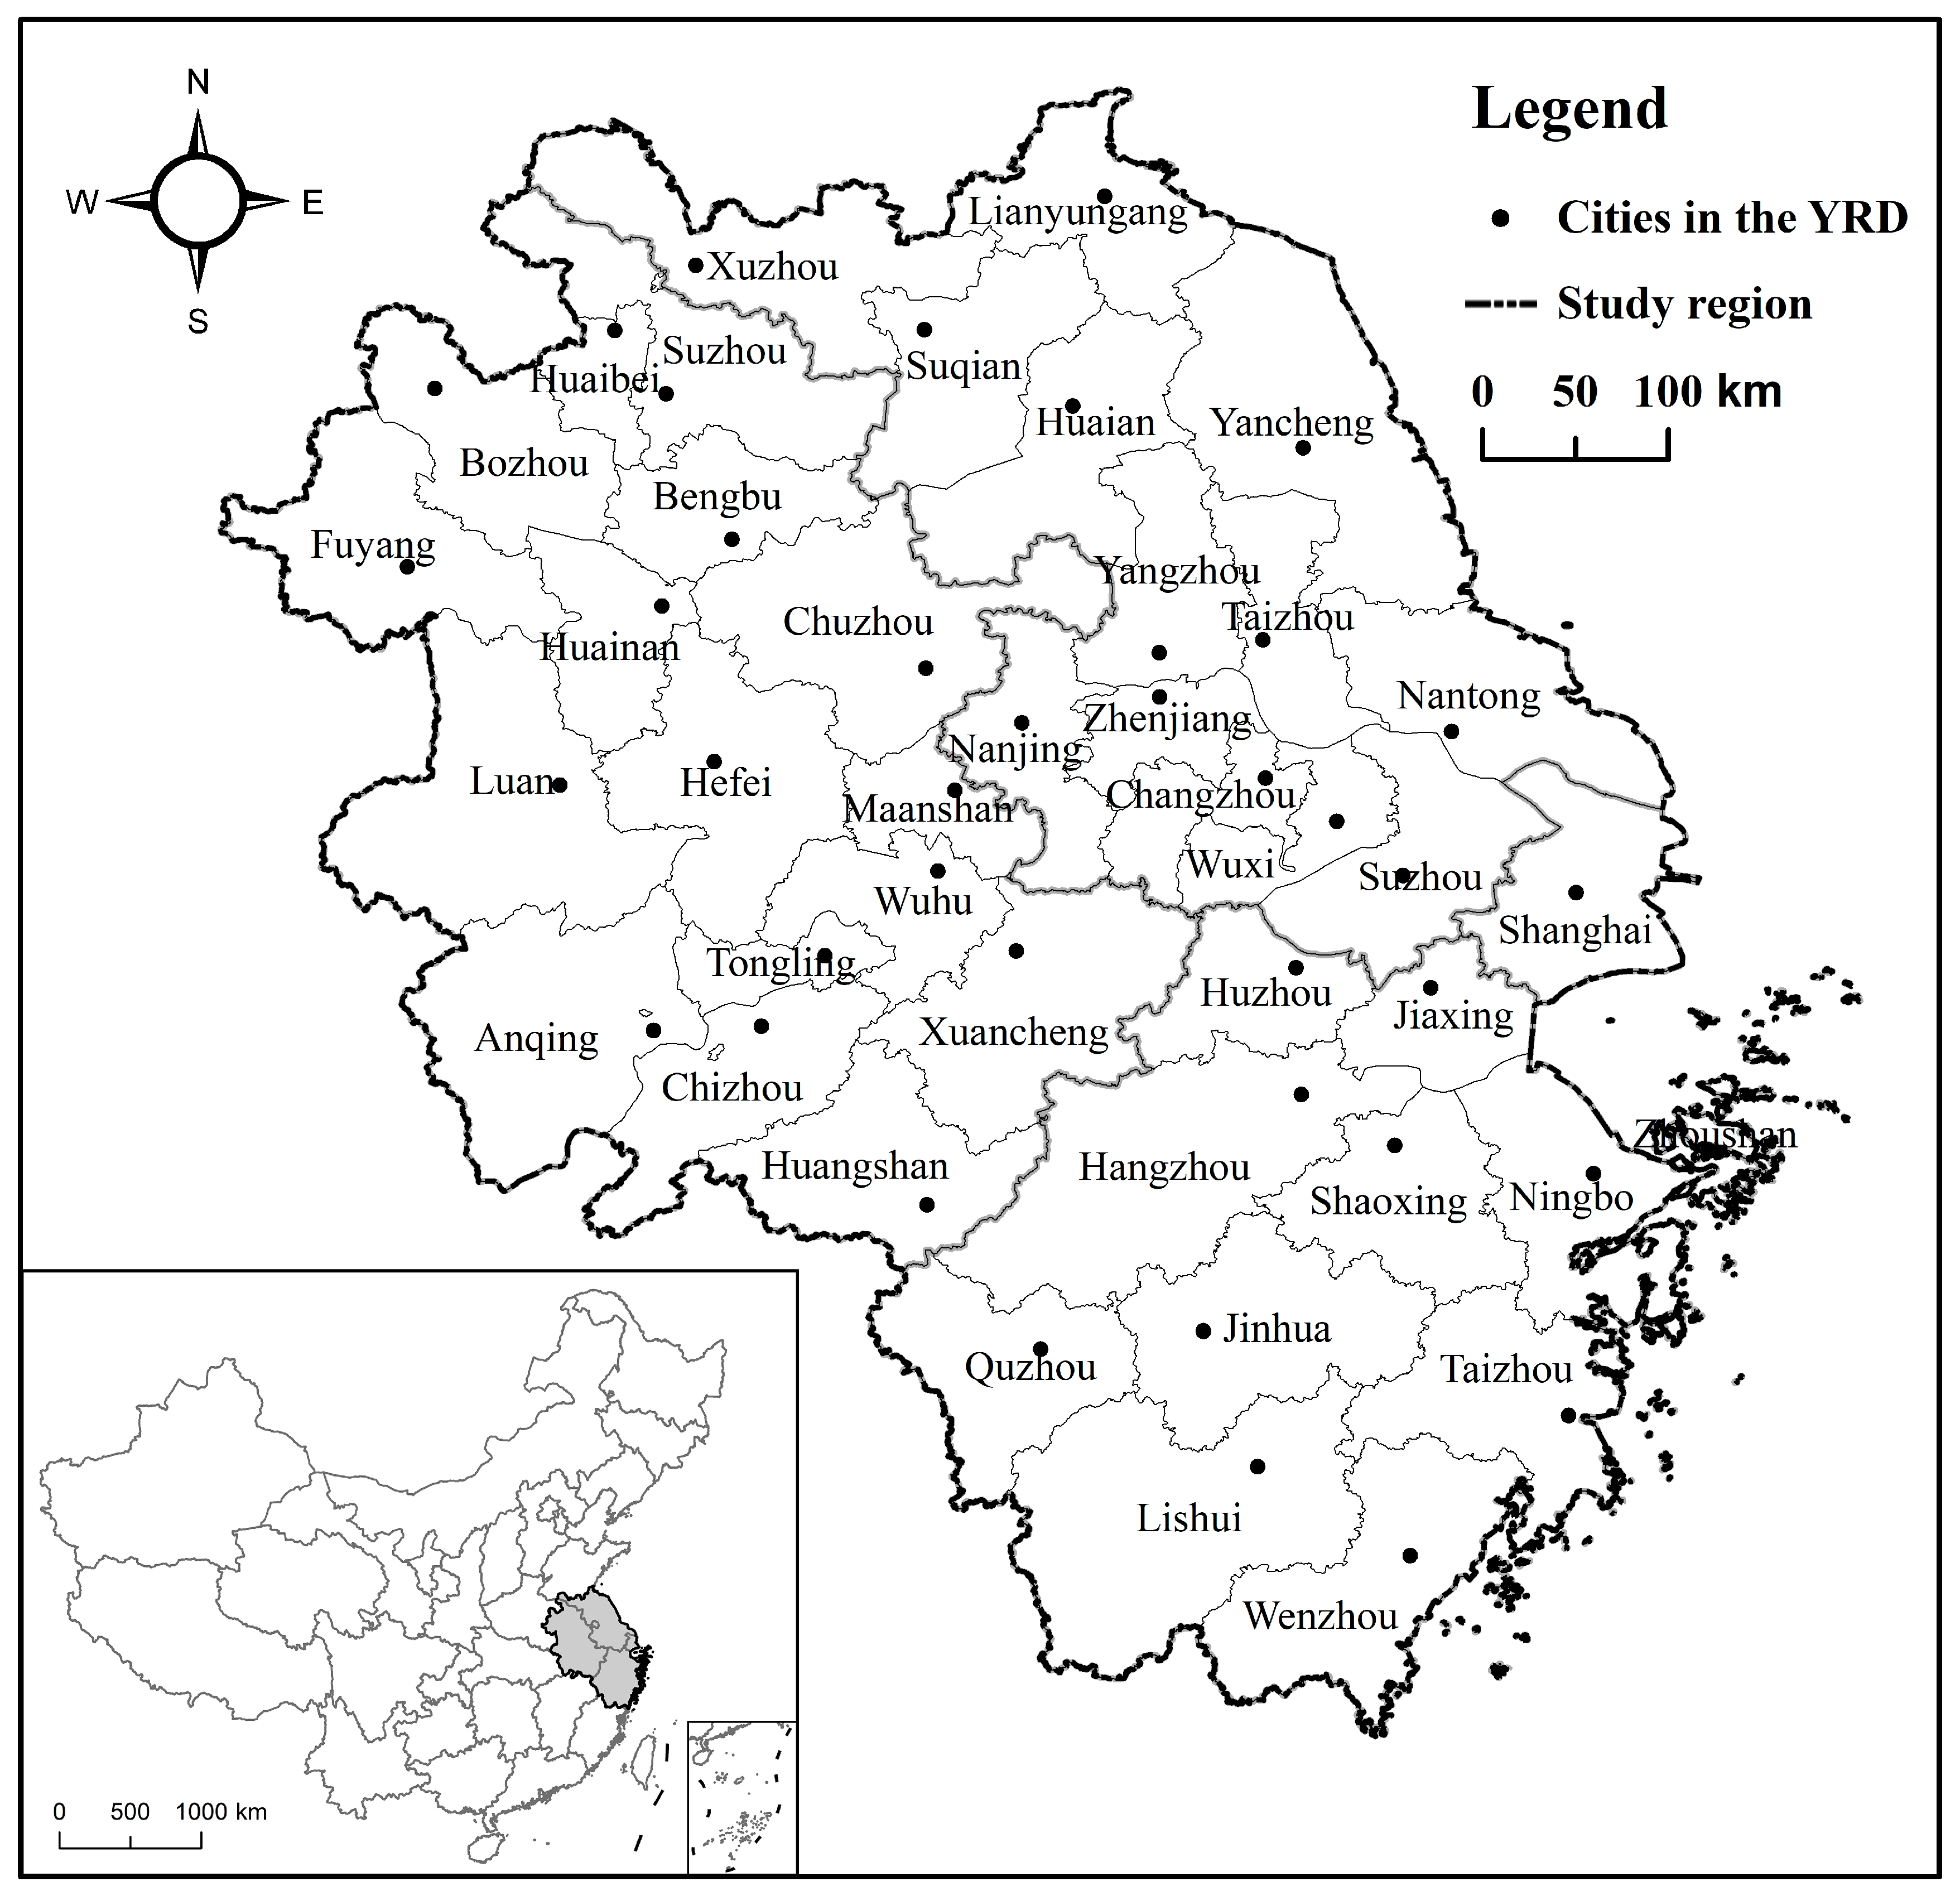
3.1. Study Area

The YRD is located in the lower reaches of the Yangtze River and on the edge of the Yellow Sea and the East China Sea. Occupying a pivotal strategic position in the country’s modernization, the YRD is one of the most dynamic regions with the highest degree of openness and the strongest innovation capability in China. It is selected as the study area for representing innovation patterns in China in microcosms. According to the “Outline of the Yangtze River Delta Regional Integrated Development Plan” issued by the Chinese Communist Party Central Committee and the State Council in 2019, the YRD includes Shanghai, Jiangsu Province, Zhejiang Province, and Anhui Province with an area of 358,000 km2 and a total of 41 cities, serving as the geographical base for this research (Figure 2).

3.2. Research Method

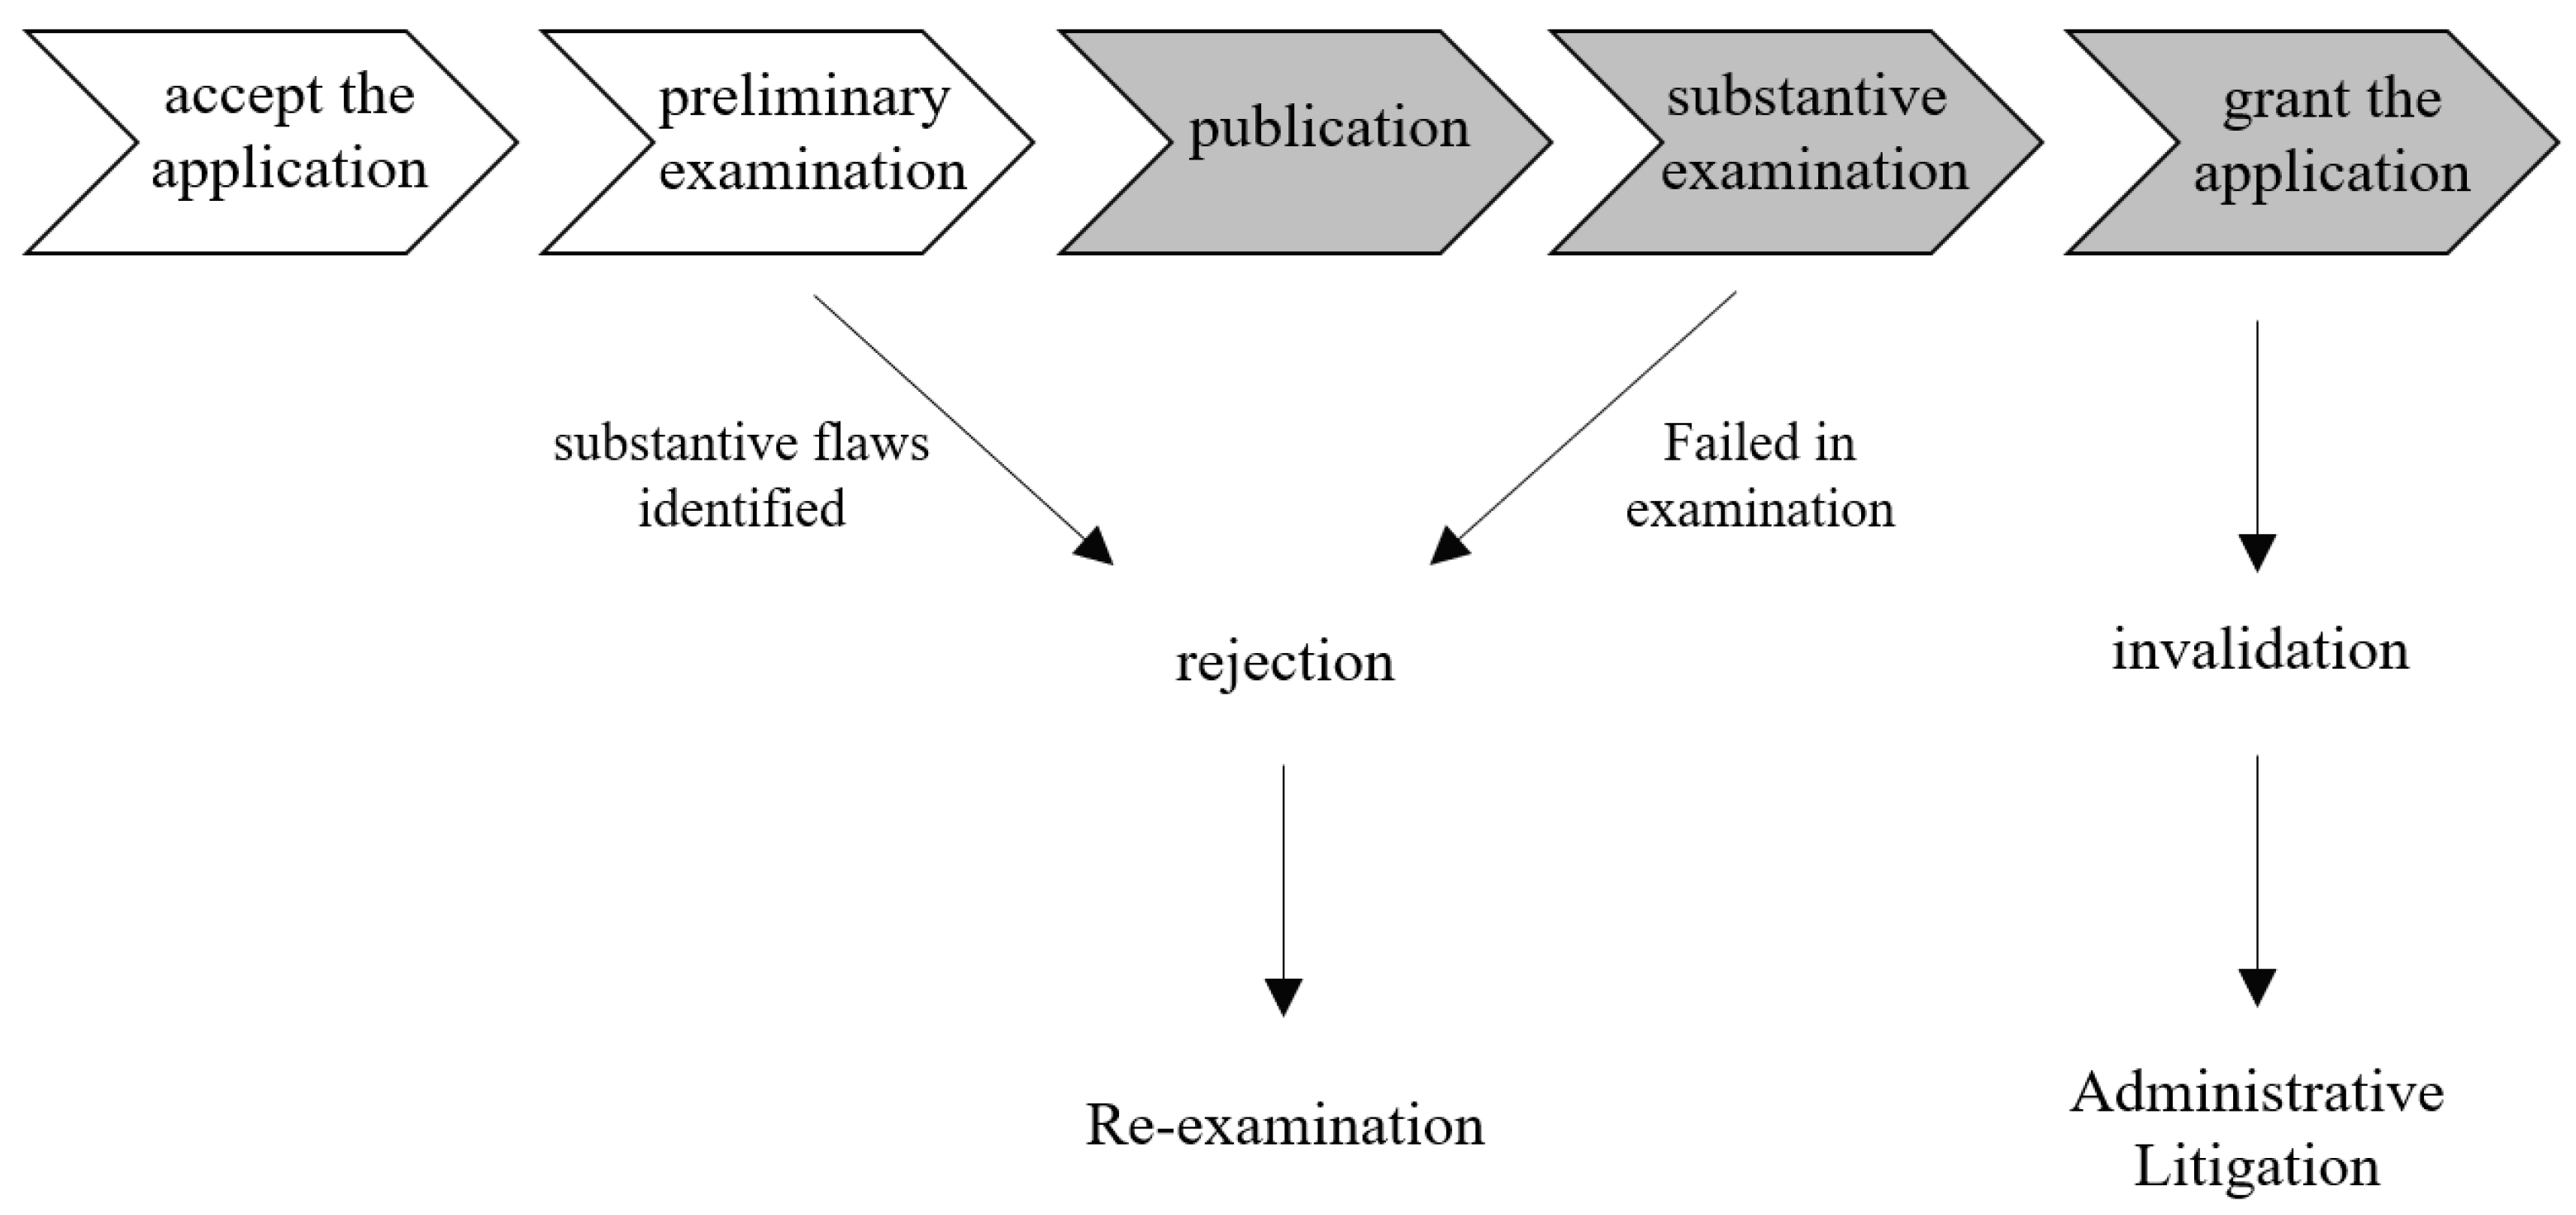
3.2.1. Data Processing

Patent data from the CNIPA with application addresses in the YRD are extracted and collated. Over 8.6 million patent records applied from 2000 to 2018 are identified and the YRD and its 41 cities are selected as the spatial units for analysis. The applicants’ addresses were geocoded for accurate statistics of patents quantity in each city. This research also applies kinds of classification strategies based on the information from the patent dataset. The examination by time section has unfolded an upsurge in the number of patent applications, from less than 27 thousand in 2000 to more than 118 thousand in 2018, with the ratio of valid patents simultaneously increasing by years. The ratios of three types of patents, however, show contrasting trends during the 19 years: the ratio of patents classified as an invention has slightly increased but the ratio of valid patents classified as an invention has greatly decreased, ratios of valid patents classified as a design and utility model have been increasing (Figure 3), and their proportion to inventions became stable around 2010. As invention patents require a higher standard of innovation, the research has distinguished this type of valid patent since 2010. It computes and sorts 35 fields defined by World Intellectual Property Organization [63] to prepare the data for the following analysis.

3.2.2. Data Analysis

(1)
Spatial concentration and colocation analysis
Determining the degree of spatial concentration and dispersion of patents, this research employs the Lorenz curve and calculates the Gini coefficient of the 35 fields. The Gini index is traditionally used to measure wealth inequality. Krugman [64] as well as Audretsch and Feldman [65] were the earliest to propose the application of a Ginicoefficient to the comparison of the spatial variation of industries. Later on, the coefficient is widely used in innovation space studies [10,33]. It is denoted by
G i n i = i j | x i x j | 2 n i x i  
where n represents the number of cities. Gini ranges from 0 to 1, with 0 indicating a complete dispersion of patent activities and 1 denoting complete concentration. The higher the value, the more concentrated the innovative activities, and vice versa.
To identify how technological fields are potentially correlated with one another, principal component analysis (PCA) is conducted to group subcategories of patents with analogous geographical distribution and convenient exchange of knowledge across technologies. The PCA approach is powerful for the dimensionality reduction of data and sorting subclassified patents into a composite “technology group”. The loading values suggest the extent of how technologies associate with one another: the greater the value, the more prominent the colocation effects of the classified patents.
(2)
Cross-classification and spatial autocorrelation
Spatial concentration analysis and component analysis are combined to identify the relative characteristics of technologies. Each field is located into a four-quadrant diagram (Figure 4), based on its relative values of Gini coefficient and principal component loading to the average values of those in all fields. The horizontal axis represents the principal component loading value, the lower value (L) the left, the higher value (H) the right; the vertical axis represents the values of Gini coefficient, the lower value (L) the bottom, the higher value (H) the top. Those falling into the lower-left grid with lower values in both Gini and PCA are extensive technologies characterized by vast knowledge flows across multiple technology fields; the rest are as claimed in the figure. For more, please refer to Section 2.2.
Spatial autocorrelation allows the measurement of to what extent these technologies spatially depend and empowers the visualization of such dependence. Global Moran’s I assesses the overall spatial dependency, with I = 0 indicating an equally spatial pattern, I > 0 indicating a clustered pattern of similar values, and I < 0 indicating proximity of dissimilar values. Local Moran’s I differentiates five types of technological spatial clusters: high-high indicates levels of similar tech outputs of place and its neighbours are all high; low-low indicates levels of similar tech outputs of place and its neighbours are all low; high-low indicates a place where tech outputs are high neighbouring places where similar tech outputs are low; low-high indicates a place where tech outputs are low neighbouring places where similar tech outputs are high; a not significant area indicates a place that does not significantly differ nor resemble its neighbours.
(3)
Relation with cities
Regression is applied to analyse the relational factors of technological innovation outputs. Subcategories of patents from 2010 to 2018 are aggregated, as dependent variables. The nine indicators include residential population, GDP, GDP per capita, public budget expenditure, building construction area, green park area per capital, road mileage, actual utilized FDI, and number of students in universities, and are collated as independent variables (Table 1).
As shown in the equation below, FEM is adopted to examine the effects of various factors on technological innovation outputs.
yi,t = b0 + bixi,t + ai + ei,t
The dependent variable, yi,t, represents the level of technological innovation output of city i at year t. xi,t represents all the independent variables explained in the last subsection. ai is a city-dependent variable that is used to capture unobserved heterogeneity, and ei,t is the error term.

4. Result

4.1. Concentration and Colocation Patterns of the 35 Fields

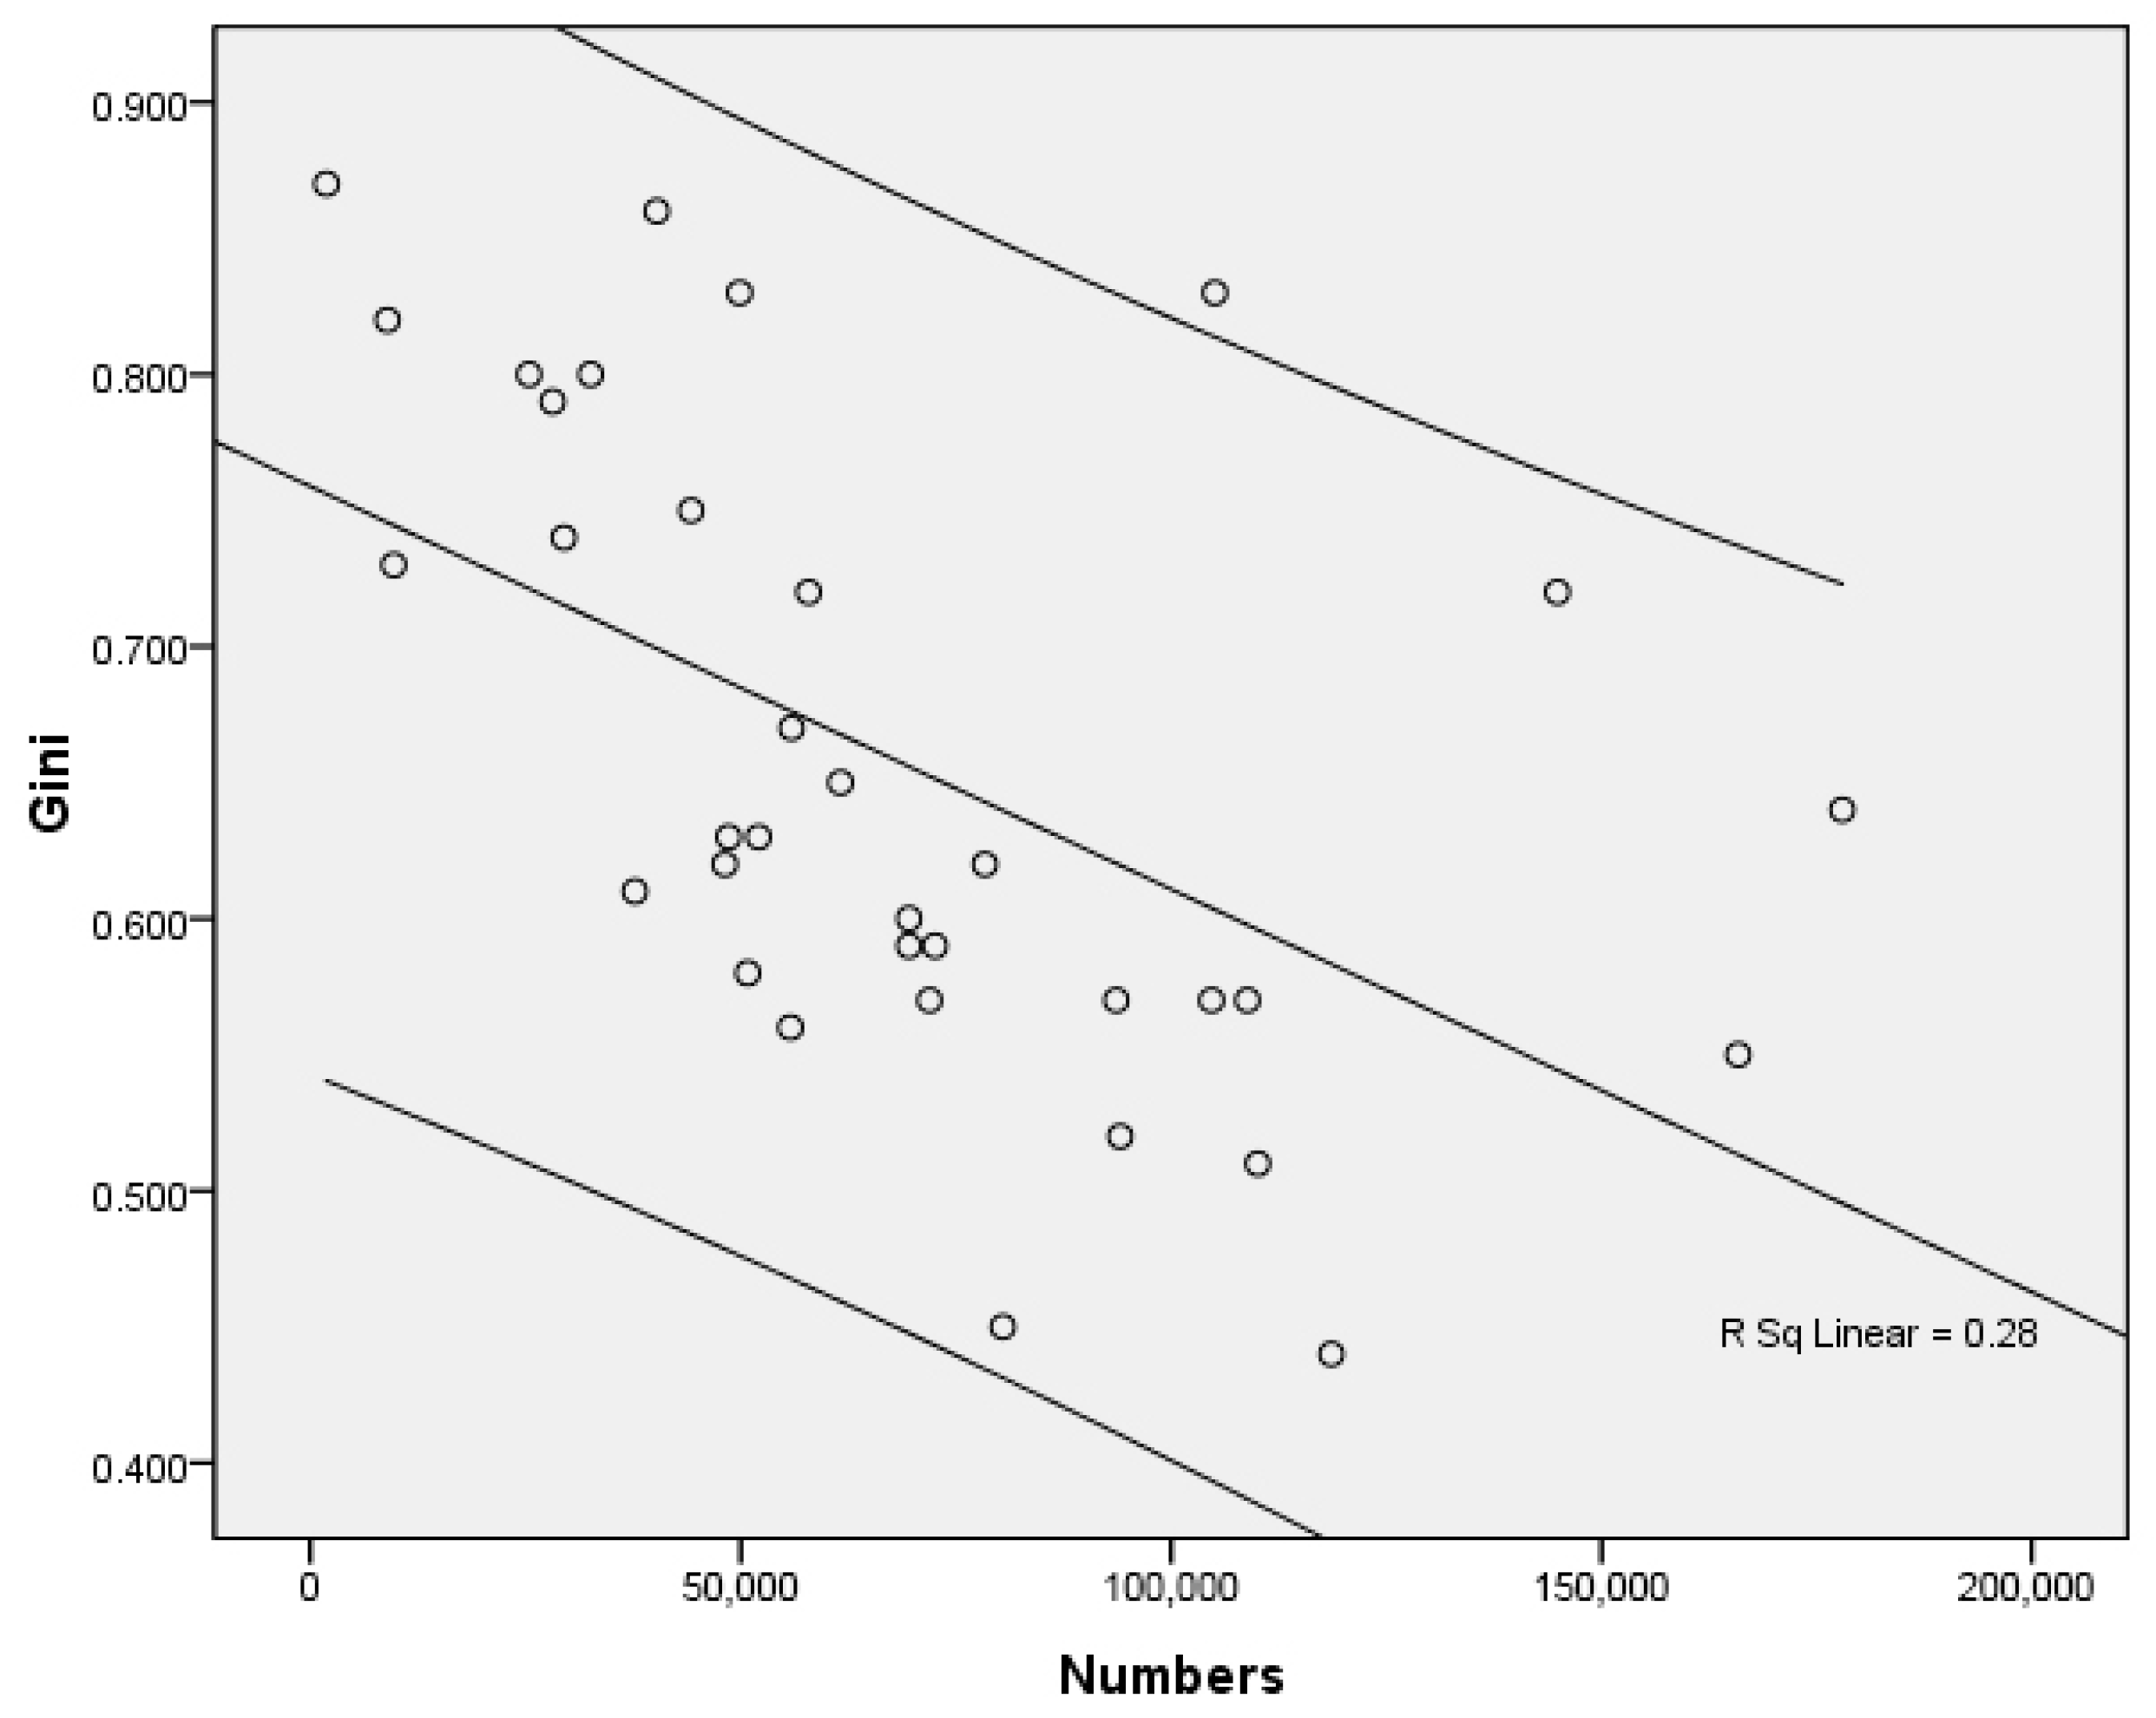
4.1.1. Technologies Are Spatially Concentrated in Few Innovative Giants but Concentration Degree Varied among Different Fields

The calculation of Gini coefficients unveils the degree of spatial concentration of innovative outputs (Table 2). The range of the Gini fell between 0.44 and 0.87, indicating that the concentration of different technologies greatly varies. Pearson’s correlation of Gini coefficients and the number of valid inventions is −0.529, indicating a negative, moderate relation between the degree of inventions spatial concentration and the number of inventions (Figure 5). That is, the more inventions made in particular field, the less concentration it might have, and some very intensive high technology such as micro-structure and nano-technology are still quite immature. Thus, they only have a very small quantity. Shanghai, Suzhou, Nanjing, Hangzhou, and Wuxi are innovative giants, accommodating a large share of valid invention patents and all are significant players in measurements and electrical machinery. Shanghai and Suzhou are the most productive inventive cities but remain different in some divisions of innovation. For instance, Shanghai leads in technological innovation in the field of computer technology, semiconductors, and civil engineering, while Suzhou pioneers in machine tools, handling, other special machines, textile, and paper machines. Nanjing has strength in the invention of pharmaceuticals and organic fine chemistry, Hangzhou is more specialized in control, while Wuxi is strong in customer goods invention. It is noteworthy that only two fields have Gini coefficients lower than 0.5, foods chemistry and other special machines, indicating a relatively dispersed spatial pattern. Cities from Anhui province perform relatively weakly but its two major cities, Hefei and Wuhu, dominated technological innovation in food chemistry. Hefei owns most valid invention patents in Anhui, but still subordinates to Wuxi. Wuhu subordinates to Hefei, and is the only city (apart from Hefei) in Anhui that is comparable to cities in Jiangsu and Zhejiang in terms of innovative outputs.

4.1.2. Highly Mixed Technological Composition except for Food Sectors

Three components are extracted with eigenvalues surpassing 1 from the correlation matrix for 35 technological fields based on valid invention patents, explaining 92.62% of the variance in the data (Table 3). The value of the Kaiser–Meyer–Olkin Measure of sampling adequacy is 0.775, surpassing the recommended value of 0.6. Factors 1, 2, and 3 explain 48.37%, 38.07%, and 6.18% of the variance among the fields, respectively. Component 1 spans a highly mixed category of computer, communication, and biochemistry technologies, encompassing four technological fields with a loading value surpassing 0.9, including computer technology, telecommunications, IT methods for management, and digital communication, followed by eight fields of biotechnology, organic fine chemistry, basic communication processes, micro-structure/nanotechnology, analysis of biological materials, measurement, semiconductors, and control with a loading value surpassing 0.8, and five fields of pharmaceuticals, civil engineering, medical, engines, and optics with a loading value surpassing 0.7. This combination of technologies suggests that knowledge creation in major fields related to electronic information, computer science, biochemistry, and medical hygiene in the Yangtze River Delta are highly colocated, making complex knowledge exchange and flows possible across different fields. Component 2 entitled gadgets and mechanics, encompassed two technological fields with a loading value that surpassed 0.9, the machine tools and handling, immediately followed by five fields of working of textile and paper machines, furniture, and games, surface technology and coating, mechanical elements, and other special machines with a loading value surpassing 0.8, and five fields of chemical engineering, thermal processes and apparatus, other consumer goods, and audio-visual technology with a loading value that surpassed 0.7. This combination of technologies indicates that gadgets and mechanical working not only entail the colocation of technological innovation in machine tools and handling, but also may involve knowledge flow and close cooperation from (chemical) engineering, electronics, and even transport. Component 3 is predominated by food chemistry with a loading value of 0.882, followed by pharmaceuticals, basic materials chemistry, and other special machines with a loading value below 0.5, revealing a relative independent knowledge production in the field of foodstuff production and processing.

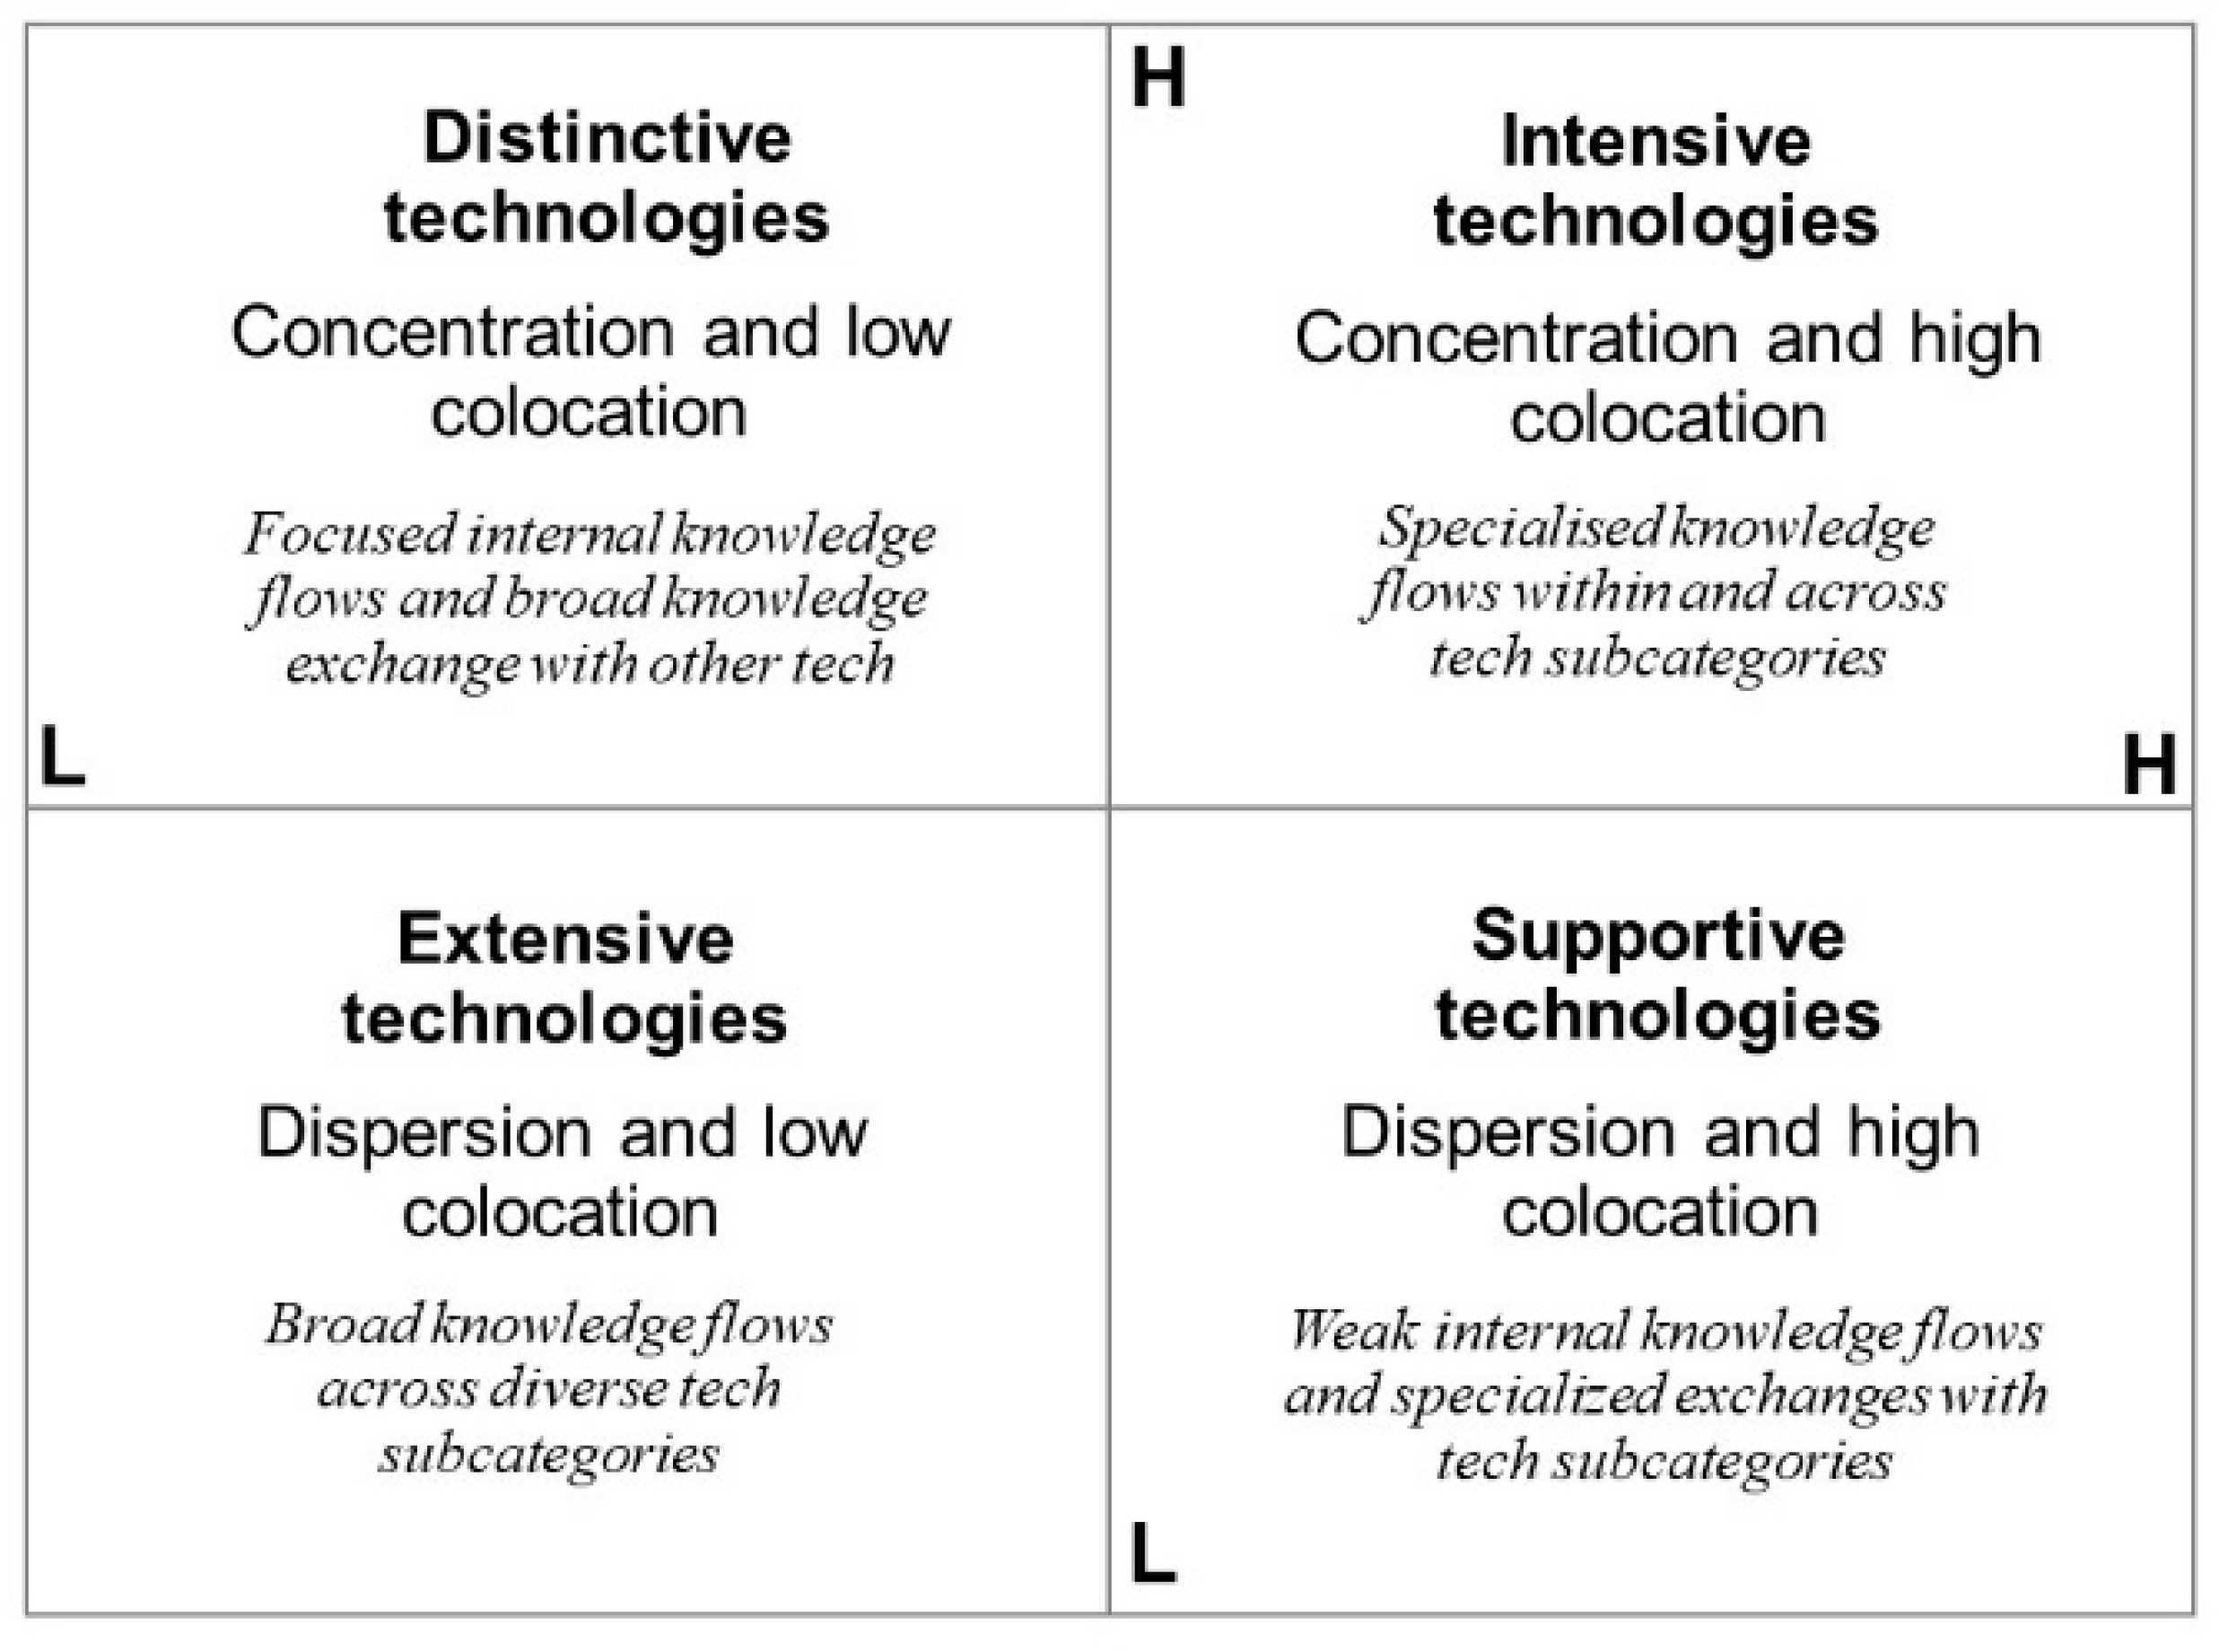
4.2. The Extensive, Distinctive, Supportive, and Intensive Technologies under the Four-Quadrant Classification Diagram and Their Spatial Dependence

Spatial concentration and PCA reveal the variance of concentration and colocation degree. According to the extensive, distinctive, supportive, and intensive technologies proposed in research method, the 35 technological fields are reclassified into the four-quadrant diagram (Figure 6). Concentration level, measured by Gini coefficients, below the average 0.635 is characterized by spatial dispersion while factor loading more than the average 0.805 indicates apparent colocation. In this regard, there are 12 fields that belong to the intensive technologies with high concentration and high colocation, including control, measurement, analysis of biological materials, biotechnology, IT methods for management, telecommunications, basic communication processes, computer technology, semiconductors, digital communication, micro-structure and nano-technology, and organic fine chemistry; most are high-tech industries requiring frontier knowledge. The extensive technologies with a low concentration and low colocation include 11 fields; they are basic materials chemistry, materials, metallurgy, environmental technology, macromolecular chemistry/polymers, thermal processes and apparatus, engines/pumps/turbines, chemical engineering, civil engineering, pharmaceuticals, transport, and other consumer goods. The supportive technologies with low concentration but high colocation encompass eight fields, including furniture/games, food chemistry, textile and paper machines, handling, machine tools, mechanical elements, other special machines, and surface technology/coating. Both extensive and supportive technologies are mainly generated in the field of traditional manufacturing and the daily necessities industry which are relatively labor intensive. The distinctive technologies with high concentration but low colocation comprise only four fields, including medical technology, audio-visual technology, electrical machinery, apparatus, energy and optics; all are highly specialized fields with demands for professional knowledge.
Moran’s I is calculated for the four classified technology groups. Results of Global Moran’s I are all positive, suggesting an overall clustered spatial pattern of similar values in all four technologies. However, a value of I is minimal for intensive technology, indicating that component technologies in this group are relatively independent compared with the other three groups. Figure 7 is a Lisa cluster map of the four classified technology groups, high-high clusters mainly distribute in the east, surrounded by low-high outliers in distinctive, intensive, and extensive technologies. Low-low clusters mainly distribute in the west (Anqing, Chizhou, and Huangshan) and northwest (from Chuzhou to Hefei) of the YRD in all four technology groups. There is no low-high or high-low outlier in supportive technologies, which also has the largest high-high cluster.

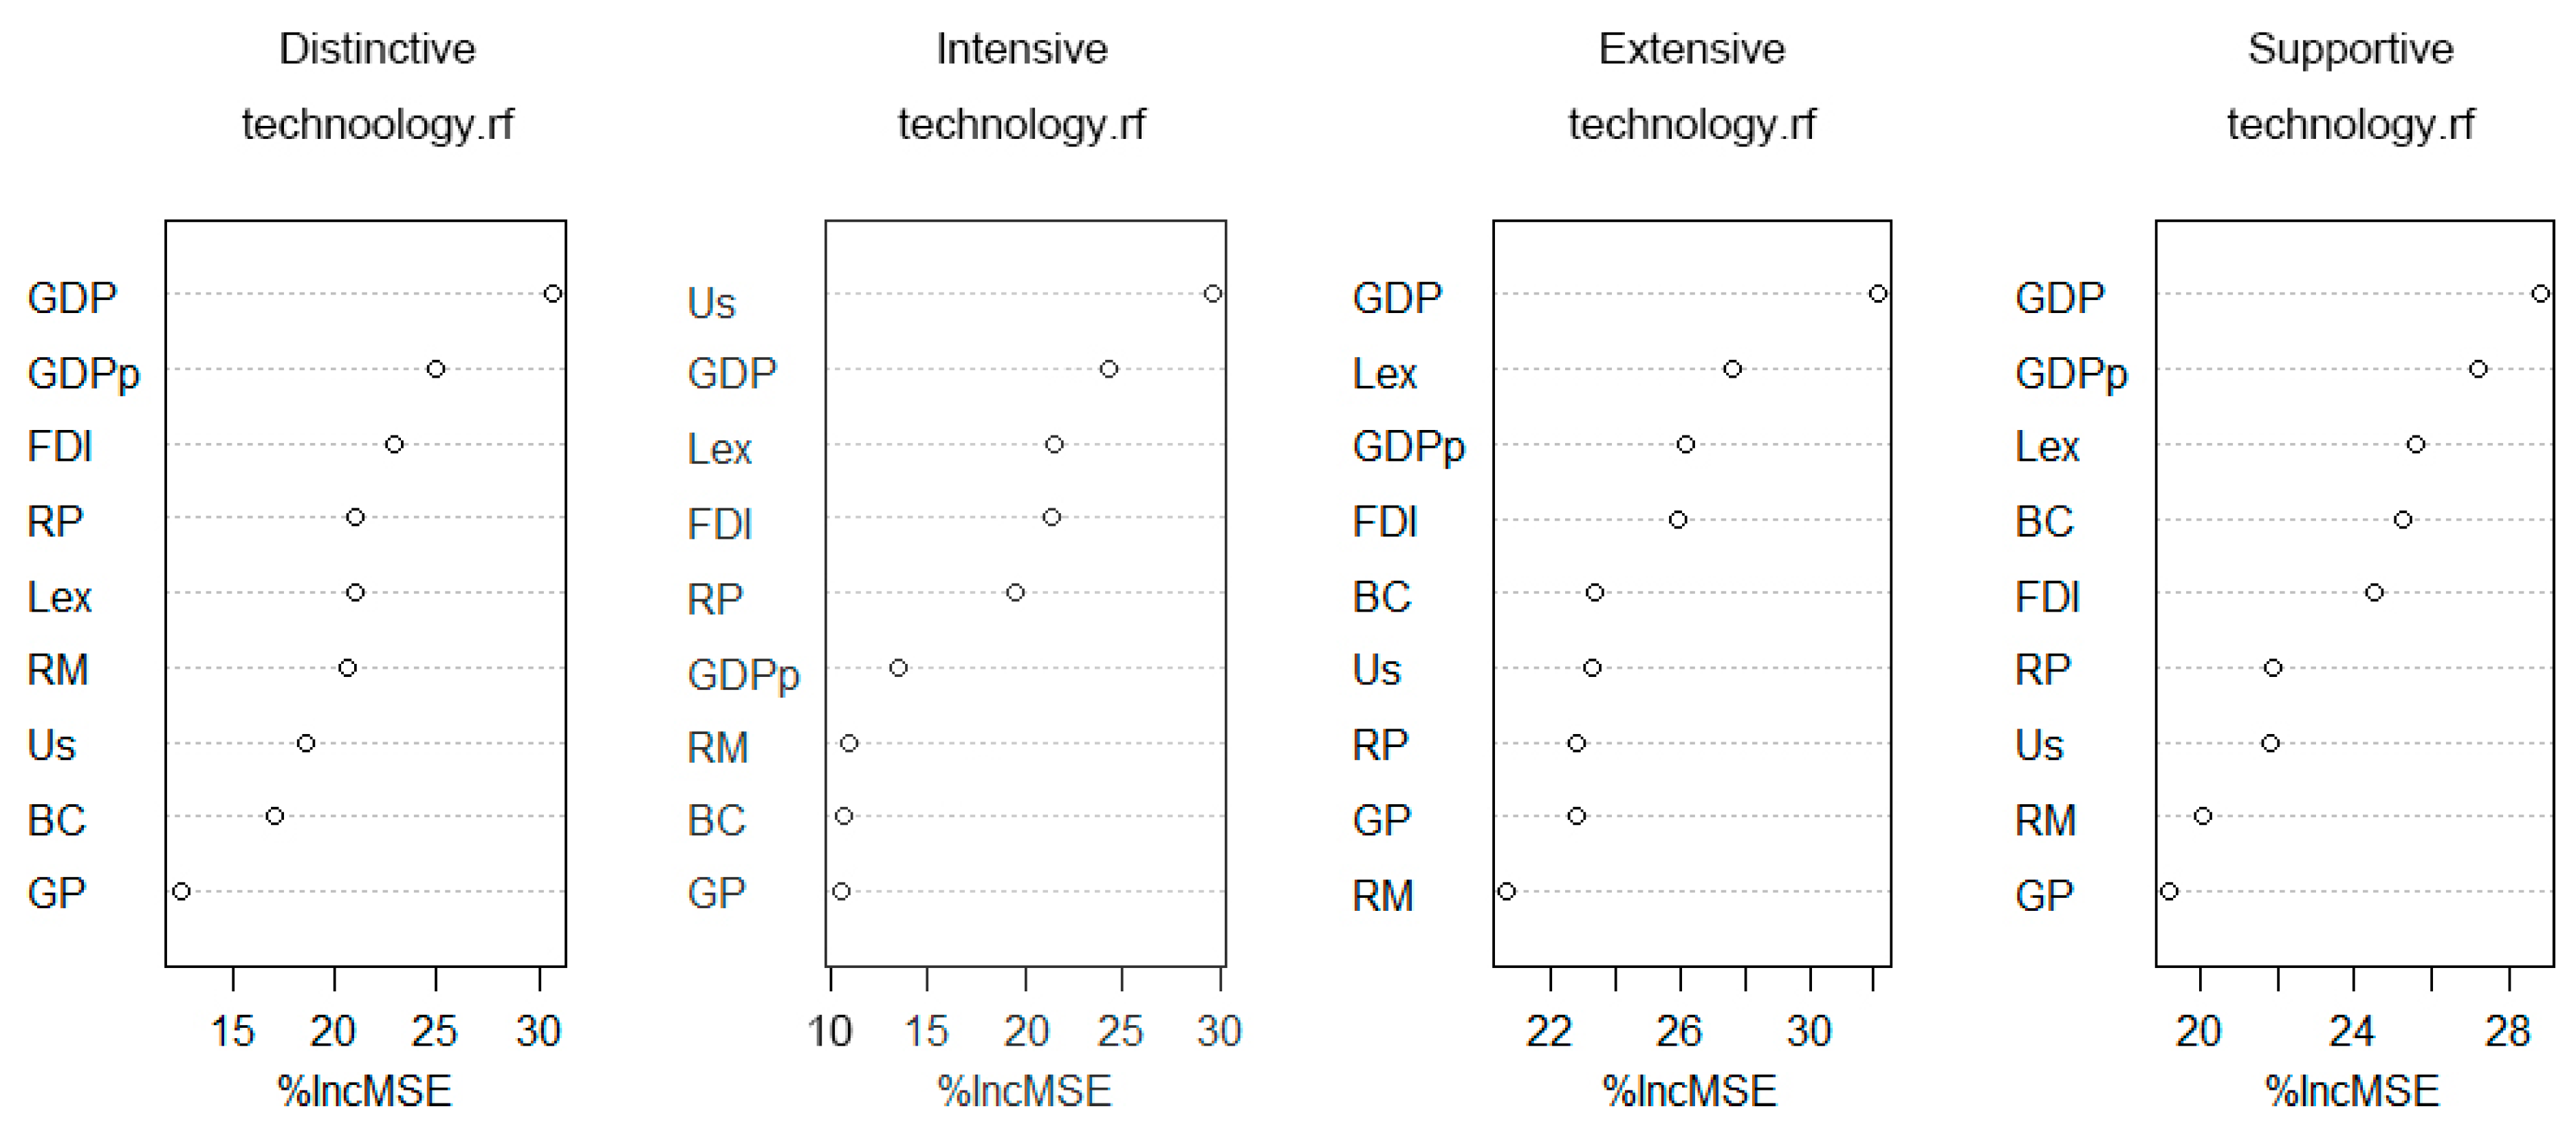
4.3. Economic Status and Human Capital Are Fundamental to Innovation but the Degree of Relevance Varied across Different Technologies

Regression is conducted to fulfil the knowledge inadequacy about relations of technological innovation and urban development. The results of FEM and random forest (RF) are listed in Table 4 and Figure 8, showing a well goodness-of-fit, given that the values of R square and the percentage of variance explained are overall satisfactory. The two regression models support and complement each other, revealing that the outputs of all four types of technological innovations are significantly interrelated with GDP, public budget expenditure, actually utilized FDI, and university students, as p-values of these variables are less than 0.05 and values of their %IncMSE are more than those of other variables. The results of FEM indicate that the development of economy and high-quality talents is key to all types of technological innovation. Public expense is negatively related to technological innovation outputs, implying that the more the expenditure on public service from a local government, the less innovative the city. This differs from earlier research at a microscopic urban level that public expense is positively related to outputs in different districts [10]. It can be possibly deduced that within the same urban economic system characterized by highly marketized public service provision like Shanghai, public expense from its sub-district government is critical for better innovative milieu. Nevertheless, among different urban economic systems, expenditure on public service from the government is not essential for innovation; instead, the higher marketization degree of public service provision, with implications of less government expense on public serve, is very likely more conducive to urban innovation vitality.
The results of RF reaffirm the overwhelming significance of economies of scale in high-quality innovation but for intensive technology in need of frontier scientific knowledge, significance of university students surpasses GDP. Even though university students matter in high-tech and scientific research, the role of the general population is much less important. However, for distinctive, extensive, and supportive technologies which rely less on cutting-edge knowledge, university students had much lower importance than other variables, ranking third or fourth from the last, and the importance of residential population exceeds (for distinctive technology) or is almost equivalent to (for extensive and supportive technology) university students. Variables related to urban constructions such as road mileage, green area, and building construction area are generally least important, especially for distinctive and intensive technology. Only building construction is relatively important for supportive technology, possibly implying that cities where supportive technological innovation is active are more likely to grow rapidly than others.

5. Discussion and Conclusions

Drawn from data sources of patents applications from 2010 to 2018 from the CNIPA, this research pioneered filtering valid patent inventions and using the IPC code to explore one of China’s most technological robust regions, the YRD, which enriches the discussion on technological composition and innovation factors at the city-region scale in the Chinese context. By visualizing the classification in a four-quadrants diagram based on the quantified concentration and colocation indicators, the study deepens our recognition on intra-city regional innovation patterns across technology fields and reflect on the quality dilemma. It is thus able to identify the technological component and relational urban factors of innovation in the YRD region across prefectural-level cities in line with the extensive, supportive, distinctive, and intensive technology groups, to generate new insights into technological innovation development.
The YRD is usually viewed as a technopole for the national innovation system. This study has unfolded the heterogeneity of the tech space within this city region from two aspects: the spatial heterogeneity of different technological fields and the technological heterogeneity of different cities, to echo RQ1. Spatial heterogeneity of different technologies not only refers to an uneven distribution of a particular technology across different cities but also implies the divergent spatial concentration degree (measured by Gini coefficients) among the 35 technologies (see Table 2). In other words, the level of such unevenness varied across technologies and the variations, if compared by Gini coefficients, are substantial, ranging from 0.44 to 0.87. Inventions requiring the most cutting-edge technology such as micro-structure and nano-technology, digital communication, semiconductors, computer technology, etc., have the greatest values of Gini. Inventions in traditional manufacturing with much less demand for frontier knowledge have much lower values of Gini. This generally accords with the patterns found in metropolitan areas of the U.S. [16,17], though the concentration degree is slightly lower than the latter. There were minor exceptions; for instance, food chemistry is extremely concentrated in the U.S. but very disperse in this study. From a broader perspective, however, unlike the U.S. where technological innovation is spread across the country and concentrated in dispersed urban clusters, China’s innovation is spatially concentrated in the east coast, particularly the most populated city-regions [27]. Thus, concentration and colocation are highly overlapping and the vast majority of technological innovation borders one another, forming high mixed and heterogenous tech clusters. Further research on a country level comparison may help a more in-depth explanation. Technological heterogeneity of different cities points to the patterns of how different technologies colocate with one another. The top three principal components explain 92.62% of the variance in the data, which indicates a contrasting colocation pattern. The largest component is related to computer and communication with a hybrid combination of biochemistry, measurement, and semiconductor, etc. The second largest component is related to mechanical engineering, combined with gadget and chemistry. While these two components unravel a high degree of colocation of its combined technologies, the third significant component, with a much lower rate of variance explained, is almost solely related to food chemistry. The result suggests a different as well as similar colocation pattern of technology group compared with that found in metropolitan areas of the U.S. [16,17]: technological components with a substantial mix of technologies from different fields identified in this research is more diverse than that in the U.S. but technology bundles in small areas is relatively unanimous.
To probe RQ2, this research charts the relative position of the 35 technologies. It unfolds that most technologies are distributed in the southwest (extensive) and northeast (intensive) quadrants; that is, technologies with high/low concentration degree are often simultaneously characterized by high/low colocation, and supportive technologies are also substantial. The polarized distribution, somehow, differs from that in the U.S. where 60–70% technologies are extensive or distinctive with limited supportive technologies, implying the distribution is skewed to the left. Technologies in the northeast quadrant are usually intelligence intensive; e.g., digital communication, micro-structure, and nano-technology, telecommunication, and computer technology etc. Those in the southwest quadrant classified as extensive technology are usually labor intensive such as basic materials chemistry, materials, metallurgy, and chemical engineering. Distinctive technologies in the northwest quadrants are very few, only optics, audio-visual technology, medical technology, and electrical machinery barely enter, in which enclosed knowledge flows are the main form. These three groups of technology have a high-high cluster in Suzhou, sometimes enlarge to Changzhou and Shanghai, neighboring low-high outliers in Jiaxing and Nantong. Supportive technologies falling into the southeast quadrant are often daily necessities such as food chemistry, furniture, machine tools, and handling, etc. This type has the largest high-high cluster without a high-low or low-high outlier. All four groups of technology have low-low clusters in the west, primarily in the less developed Anhui province. Highly concentrated technologies often mutually depend and have frequent flows of knowledge, whereby ‘breakthroughs’ are more likely to happen [45,46]. However, intensive technologies such as micro-structure and nano-tech, basic communication process, analysis of biological materials, and IT methods for management are quite minimal in terms of quantity (Figure 6). The majority of applications belong to extensive and supportive technologies, which is relatively difficult to induce ‘breakthroughs’. China’s way towards innovative economy still requires efforts.
Addressing RQ3, a regression analysis of these four types of technologies with cities is conducted. Findings verify the close association between economy and innovative outputs, as shown in the results that GDP (per capita), public expense, and actually utilized FDI are significantly related to the outputs of valid inventive patents, especially in extensive, distinctive, and supportive categories. However such an association does not always dominate urban-innovation relations; as in intensive category, the number of students in universities is most significantly associated with the outputs of valid inventive patents. The observation echoes the trend that the mutual reinforcement of economy and innovation is not as certain as usual and that the economy’s overriding importance in innovation is declining [55,56]. Moreover, in the relation between economy and innovation, economies of scale seem to matter more than economic efficiency per person, as GDP is more significantly related to innovative outputs than GDP per capita in the result. This is especially true for a distinctive technology on which influence of GDP per capita is negligible and for an intensive technology whose relation with GDP per capita is even negative and mainly relies on intensive talents. FDI ranks high in all four types of technologies, but distinctive technology seems to rely more on it as FDI represents the third significant factor associated with innovation. This implies that technology spillover from foreign areas still plays a role in China’s innovation progress, especially for distinctive technology [61,62]. The significance of public expense varied in different situations, depending on the marketization degree of a macro environment for public service provision and the intervention of local government. Population was once viewed as significant for technological innovation, but not the case in this research. This can be seen from, for example, Xuzhou which is the third populous city after Shanghai and Suzhou, but quite weak in intensive technological innovation, as are Fuyang and Yancheng. It is the university students that significantly relate to intensive technology outputs and turn out to be the sources of human capital for innovation.
Though the number of patents in China has grown exponentially since the pursuit of innovation strategy as observed in this research, benefits from the exponential growth of patent filings are uncertain: few ‘original innovations’ are produced in advanced areas, and true ‘breakthroughs’ are disproportionate to the quantity of the applications. The valid rate of patent applications, defined as applications passed through substantive examination, during publication, or obtaining grants by CNIPA to all the applications, has been increasing during the study period, but the rates greatly varied among technological fields, and high-quality patent inventions did not increase in proportion. From 2004 to 2009, the number of invention types even decreased, naturally raising the question on China’s technological innovation quality. Intensive leading-edge technologies such as micro-structure, nanotechnology, basic communications, biological materials etc. are very few and great many patents fell into extensive and supportive categories, which are less advanced in innovation. Indeed, as countries are competing to increase the number of their innovative outputs, Iran, Singapore, South Korea, Portugal, and India are also emerging technological powers with fast growth of patent filings [66,67]. It is worth noting that the quality problems are not unique to China; in India for instance, innovations have been concentrated in few specific industries and the density of researchers are quite low [68], jeopardizing the general improvement of innovative quality. Apart from the quality issue, existing patent filing procedures may also lead to redundant inputs in innovation as the time lag from a decision of whether a patent is issued at all to a claim being made is likely to prevent later applicants gaining patents without any earlier notice, and the time lag typically takes 3 years [69]. Excessive competition under this system is thus also a waste of time and energy.
In a nutshell, this research attempts to offer insightful evidence for policy makers to better plan and develop innovative technological clusters and knowledge spinoffs at the city-region level and enrich the understanding towards innovative patterns and critical factors in China and the world. With the findings and discussion, this research argues for incentives encouraging the quality improvement of patents instead of merely focusing on the quantity, and moderately enhancing transparency to avoid redundancy.

Author Contributions

Conceptualization, L.L. and L.W. (Lan Wang); Methodology, L.L. and X.Z.; Software, X.Z.; Formal analysis, L.W. (Lie Wang); Resources, L.L. and X.Z.; Data curation, L.W. (Lie Wang) and X.Z.; Writing—original draft, L.L.; Writing—review & editing, L.L.; Visualization, L.W. (Lie Wang); Project administration, L.L.; Funding acquisition, L.L. and L.W. (Lan Wang). All authors have read and agreed to the published version of the manuscript.

Funding

This research is sponsored by the Program of Shanghai Technology Research Leader (23XD1433900).

Informed Consent Statement

Not applicable.

Data Availability Statement

Some of the data presented in this study are obtained from China National Intellectual Property Administration.

Conflicts of Interest

The authors declare no conflict of interest.

Abbreviations

YRDYangtze River Delta
PCAPrincipal component analysis
WIPOWorld Intellectual Property Organization
CNIPAChinese National Intellectual Property Administration
USPCUnited States Patent Classification
FEMFixed effects model
RFRandom forest
GDPGross domestic products
GDPpGDP per capita
LexPublic expense
BCBuilding construction
RPResidential population
GPGreen area per capita
RMRoad mileage
FDIForeign direct investment
UsUniversity student

References

  1. Amankwah-Amoah, J. COVID-19 pandemic and innovation activities in the global airline industry: A review. Environ. Int. 2021, 156, 106719. [Google Scholar] [CrossRef] [PubMed]
  2. Ho, C.-M. Research on interaction of innovation spillovers in the AI, Fin-Tech, and IoT industries: Considering structural changes accelerated by COVID-19. Financ. Innov. 2023, 9, 1–29. [Google Scholar] [CrossRef]
  3. Junaidi; Liza, L.O. Technology and metaverse in the post-COVID-19 era: The impact on education, economy and culture in Indonesia. J. Public Health 2023, 45, e596–e597. [Google Scholar] [CrossRef]
  4. Elkhwesky, Z.; El Manzani, Y.; Elbayoumi Salem, I. Driving hospitality and tourism to foster sustainable innovation: A systematic review of COVID-19-related studies and practical implications in the digital era. Tour. Hosp. Res. 2024, 24, 115–133. [Google Scholar] [CrossRef]
  5. Brem, A.; Viardot, E.; Nylund, P.A. Implications of the coronavirus (COVID-19) outbreak for innovation: Which technologies will improve our lives? Technol. Forecast. Soc. Chang. 2021, 163, 120451. [Google Scholar] [CrossRef]
  6. Jin, P.; Mangla, S.K.; Song, M. The power of innovation diffusion: How patent transfer affects urban innovation quality. J. Bus. Res. 2022, 145, 414–425. [Google Scholar] [CrossRef]
  7. Acs, Z.J.; Audretsch, D.B. Patents as a Measure of Innovative Activity. Kyklos 1989, 42, 171–180. [Google Scholar] [CrossRef]
  8. Antonelli, C. The Economics of Innovation, New Technologies and Structural Change; Routledge: London, UK, 2014. [Google Scholar]
  9. Dosi, G.; Nelson, R. Technical Change and Industrial Dynamics as Evolutionary Processes. In Handbook of the Economics of Innovation; Elsevier: Amsterdam, The Netherlands, 2010; pp. 51–127. [Google Scholar]
  10. Li, L.; Zhang, X. Spatial evolution and critical factors of urban innovation: Evidence from Shanghai, China. Sustainability 2020, 12, 938. [Google Scholar] [CrossRef]
  11. Goldschlag, N.; Lybbert, T.J.; Zolas, N.J. Tracking the technological composition of industries with algorithmic patent concordances. Econ. Innov. New Technol. 2020, 29, 582–602. [Google Scholar] [CrossRef]
  12. Krugman, P. The new economic geography: Now middle-aged. Reg. Stud. 2011, 45, 1–7. [Google Scholar] [CrossRef]
  13. Florida, R.; Adler, P.; Mellander, C. The city as innovation machine. Reg. Stud. 2017, 51, 86–96. [Google Scholar] [CrossRef]
  14. Breschi, S.; Lenzi, C. Co-invention networks and inventive productivity in US cities. J. Urban Econ. 2016, 92, 66–75. [Google Scholar] [CrossRef]
  15. Huallachain, B.O.; Kane, K. Regional aspects of collaborative invention across national innovation systems. Eur. Plan. Stud. 2014, 23, 2227–2252. [Google Scholar] [CrossRef]
  16. Huallachain, B.O. Inventive Megaregions of the United States: Technological Composition and Location. Econ. Geogr. 2012, 88, 165–195. [Google Scholar] [CrossRef]
  17. Choi, H.S.; Sohn, S.Y.; Yeom, H.J. Technological composition of US metropolitan statistical areas with high-impact patents. Technol. Forecast. Soc. Chang. 2018, 134, 72–83. [Google Scholar] [CrossRef]
  18. Breschi, S.; Lissoni, F. Knowledge Spillovers and Local Innovation Systems: A Critical Survey. Ind. Corp. Change 2001, 10, 975–1005. [Google Scholar] [CrossRef]
  19. Wang, J.; Zhang, X.; Yeh, A.G. Spatial proximity and location dynamics of knowledge-intensive business service in the Pearl River Delta, China. Habitat Int. 2016, 53, 390–402. [Google Scholar] [CrossRef]
  20. Fornahl, D.; Brenner, T. Geographic concentration of innovative activities in Germany. Struct. Change Econ. Dyn. 2009, 20, 163–182. [Google Scholar] [CrossRef]
  21. Maliszewski, P.J.; Huallachain, B.O. Hierarchy and concentration in the American urban system of technological advance. Pap. Reg. Sci. 2012, 91, 743–758. [Google Scholar] [CrossRef]
  22. Huang, K.G. China’s Innovation Landscape. Science 2010, 329, 632–633. [Google Scholar] [CrossRef]
  23. Zhang, Y.; Li, K. Research on the spatial dependence of Chinese province-level innovative output. Stud. Sci. Sci. 2008, 26, 659–665. (In Chinese) [Google Scholar]
  24. Li, G.; Wang, C. Spatial characteristics and dynamic changes of provincial innovation output in China:An investigation using the ESDA. Geogr. Res. 2012, 31, 95–106. (In Chinese) [Google Scholar]
  25. OECD. OECD Reviews of Innovation Policy: China 2008; OECD Publishing: Paris, France, 2008. [Google Scholar]
  26. Chen, K.; Guan, J. Mapping the functionality of China’s regional innovation systems: A structural approach. China Econ. Rev. 2011, 22, 11–27. [Google Scholar] [CrossRef]
  27. Duvivier, C.; Polese, M.; Apparicio, P. The location of information technology-led new economy jobs in cities: Office parks or cool neighbourhoods? Reg. Stud. 2018, 52, 1–13. [Google Scholar] [CrossRef]
  28. China-Power-Team. Are Patents Indicative of Chinese Innovation? China Power: Unpacking the Complexity of China’s Rise 2016. Available online: https://chinapower.csis.org/patents/ (accessed on 17 June 2022).
  29. Acs, Z.J.; Anselin, L.; Varga, A. Patents and innovation counts as measures of regional production of new knowledge. Res. Policy 2002, 31, 1069–1085. [Google Scholar] [CrossRef]
  30. Dang, J.; Motohashi, K. Patent statistics: A good indicator for innovation in China? Patent subsidy program impacts on patent quality. China Econ. Rev. 2015, 35, 137–155. [Google Scholar] [CrossRef]
  31. Martin, C.; Mulas-Granados, C.; Sanz, I. Spatial distribution of R&D expenditure and patent applications across EU regions and its impact on economic cohesion. J. Reg. Res. 2005, 6, 41–61. [Google Scholar]
  32. Verspagen, B.; Schoenmakers, W. The spatial dimension of patenting by multinational firms in europe. J. Econ. Geogr. 2004, 4, 23–42. [Google Scholar] [CrossRef]
  33. Lim, U. The spatial distribution of innovative activity in U.S. metropolitan areas: Evidence from patent data. J. Reg. Anal. Policy 2003, 33, 132259. [Google Scholar]
  34. Goncalves, E.; De Almeida, E.S. Innovation and Spatial Knowledge Spillovers: Evidence from Brazilian Patent Data. Reg. Stud. 2009, 43, 513–528. [Google Scholar] [CrossRef]
  35. Griliches, Z. Patent Statistics as Economic Indicators: A Survey. J. Econ. Lit. 1990, 28, 1661–1707. [Google Scholar]
  36. Anselin, L.; Varga, A.; Acs, Z. Local geographic spillovers between university research and high technology innovations. J. Urban Econ. 1997, 42, 422–448. [Google Scholar] [CrossRef]
  37. Putnam, J.; Luu, H.; Ngo, N. Does China Really Dominate Global Innovation? The Impact of China’s Subsidized Patent Application System; Hudson Institute: Washington, DC, USA, 2021. [Google Scholar]
  38. WIPO. Utility Models. Available online: https://www.wipo.int/patents/en/topics/utility_models.html (accessed on 17 December 2022).
  39. Heikkilä, J.; Lorenz, A. Need for speed? Exploring the relative importance of patents and utility models among German firms. Econ. Innov. New Technol. 2018, 27, 80–105. [Google Scholar] [CrossRef]
  40. Fleming, L. Breakthroughs and the ‘long tail’ of innovation. MIT Sloan Manag. Rev. 2007, 49, 69–74. [Google Scholar]
  41. Webster, E.; Jensen, P.H. Do Patents Matter for Commercialization. J. Law Econ. 2011, 54, 431–453. [Google Scholar] [CrossRef]
  42. Sun, H.; Edziah, B.K.; Kporsu, A.K.; Sarkodie, S.A.; Taghizadeh-Hesary, F. Energy efficiency: The role of technological innovation and knowledge spillover. Technol. Forecast. Soc. Chang. 2021, 167, 120659. [Google Scholar] [CrossRef]
  43. Eder, J.; Musil, R. Towards a location sensitive R&D policy. Local buzz, spatial concentration and specialisation as a challenge for urban planning Empirical findings from the life sciences and ICT clusters in Vienna. Cities 2016, 59, 20–29. [Google Scholar]
  44. Nooteboom, B.; Van Haverbeke, W.; Duysters, G.; Gilsing, V.; Van den Oord, A. Optimal cognitive distance and absorptive capacity. Res. Policy 2007, 36, 1016–1034. [Google Scholar] [CrossRef]
  45. Bouncken, R.B.; Kraus, S. Innovation in knowledge-intensive industries: The double-edged sword of coopetition. J. Bus. Res. 2013, 66, 2060–2070. [Google Scholar] [CrossRef]
  46. Byun, S.K.; Oh, J.-M.; Xia, H. Incremental vs. breakthrough innovation: The role of technology spillovers. Manag. Sci. 2021, 67, 1779–1802. [Google Scholar] [CrossRef]
  47. Buzard, K.; Carlino, G.A.; Hunt, R.M.; Carr, J.K.; Smith, T.E. Localized knowledge spillovers: Evidence from the spatial clustering of R&D labs and patent citations. Reg. Sci. Urban Econ. 2020, 81, 103490. [Google Scholar]
  48. Kucharska, W.; Erickson, G.S. Tacit knowledge acquisition & sharing, and its influence on innovations: A Polish/US cross-country study. Int. J. Inf. Manag. 2023, 71, 102647. [Google Scholar]
  49. Anselin, L. Local indicators of spatial association—LISA. Geogr. Anal. 1995, 27, 93–115. [Google Scholar] [CrossRef]
  50. Anselin, L. Spatial econometrics. In Handbook of Spatial Analysis in the Social Sciences; Edward Elgar Publishing: Cheltenham, UK, 2022; pp. 101–122. [Google Scholar]
  51. Huang, K.G.L.; Huang, C.; Shen, H.; Mao, H. Assessing the value of China’s patented inventions. Technol. Forecast. Soc. Change 2021, 170, 120868. [Google Scholar] [CrossRef]
  52. He, S.; Du, D.; Jiao, M.; Lin, Y. Spatial-Temporal Characteristics of Urban Innovation Capability and Impact Factors Analysis in China. Sci. Geogr. Sin. 2017, 37, 1014–1022. [Google Scholar]
  53. Schumpeter, J.A. The Theory of Economic Development: An Inquiry into Profits, Capital, Credit, Interest, and the Business Cycle; Harvard University Press: Cambridge, MA, USA, 1934. [Google Scholar]
  54. Rosenberg, N. Was Schumpeter a Marxist? Ind. Corp. Change 2011, 20, 1215–1222. [Google Scholar] [CrossRef]
  55. Wang, K.-H.; Umar, M.; Akram, R.; Caglar, E. Is technological innovation making world “Greener”? An evidence from changing growth story of China. Technol. Forecast. Soc. Change 2021, 165, 120516. [Google Scholar] [CrossRef]
  56. Xi, X.; Xi, B.; Miao, C.; Yu, R.; Xie, J.; Xiang, R.; Hu, F. Factors influencing technological innovation efficiency in the Chinese video game industry: Applying the meta-frontier approach. Technol. Forecast. Soc. Change 2022, 178, 121574. [Google Scholar] [CrossRef]
  57. Sternberg, R. Regional Dimensions of Entrepreneurship. Soc. Sci. Electron. Publ. 2009, 5, 211–340. [Google Scholar] [CrossRef]
  58. Wonglimpiyarat, J. The innovation incubator, university business incubator and technology transfer strategy: The case of Thailand. Technol. Soc. 2016, 46, 18–27. [Google Scholar] [CrossRef]
  59. Shearmur, R. Are cities the font of innovation? A critical review of the literature on cities and innovation. Cities 2012, 29, S9–S18. [Google Scholar] [CrossRef]
  60. Wu, K.; Wang, Y.; Zhang, H.O.; Liu, Y.; Ye, Y. Impact of the Built Environment on the Spatial Hetero-geneity of Regional Innovation Productivity: Evidence from the Pearl River Delta, China. Chin. Geogr. Sci. 2021, 31, 413–428. [Google Scholar] [CrossRef]
  61. Keller, W. International technology diffusion. J. Econ. Lit. 2004, 42, 752–782. [Google Scholar] [CrossRef]
  62. Fagerberg, J.; Srholec, M.; Verspagen, B. Innovation and economic development. In Handbook of the Economics of Innovation; Elsevier: Amsterdam, The Netherlands, 2010; pp. 833–872. [Google Scholar]
  63. WIPO. New Concept of Technology Classification IPC-Technology Concordance Table. Available online: https://www.wipo.int/patents/ (accessed on 17 December 2022).
  64. Krugman, P. Geography and Trade; MIT Press: Cambridge, MA, USA, 1991. [Google Scholar]
  65. Audretsch, D.B.; Feldman, M.P. R&D Spillovers and the Geography of Innovation and Production. Am. Econ. Rev. 1996, 86, 630–640. [Google Scholar]
  66. Crescenzi, R.; Rodríguez-Pose, A. The Geography of Innovation in China and India. Int. J. Urban Reg. Res. 2017, 41, 1010–1027. [Google Scholar] [CrossRef]
  67. Gazni, A. The growing number of patent citations to scientific papers: Changes in the world, nations, and fields. Technol. Soc. 2020, 62, 101276. [Google Scholar] [CrossRef]
  68. Ghosh, T.; Parab, P.M. Assessing India’s productivity trends and endogenous growth: New evidence from technology, human capital and foreign direct investment. Econ. Model. 2021, 97, 182–195. [Google Scholar] [CrossRef]
  69. Thompson, N.C.; Kuhn, J.M. Does Winning a Patent Race lead to more follow-on Innovation? J. Leg. Anal. 2020, 12, 183–220. [Google Scholar] [CrossRef]
Figure 1. Procedures of patent applications under Chinese National Intellectual Property Administration. Source: author.
Applsci 14 01842 g001
Figure 2. Study area of Yangtze River Delta, China. Source: author.
Applsci 14 01842 g002
Figure 3. Number and ratio of three types of (valid) patents.
Applsci 14 01842 g003
Figure 4. Cross-classification of technological innovation by extant of concentration and colocation.
Applsci 14 01842 g004
Figure 5. Scatter of Gini coefficients and number of valid invention IPC of 35 technologies in Yangtze River Delta (2010–2018); Source: authors.
Applsci 14 01842 g005
Figure 6. Cross-classification of 35 technological fields by extant of concentration and colocation; Source: authors.
Applsci 14 01842 g006
Figure 7. Lisa clusters of four classifications of technologies; Source: authors.
Applsci 14 01842 g007
Figure 8. Random Forest result for urban factors and four classified technologies in YRD. (increased importance from bottom to top).
Applsci 14 01842 g008
Table 1. Dependent and independent variables.
DescriptionMinMaxMedianMeanSE
Dependent variables—four classifications of technologies
Distinctive technologiesNo. of patents1824421979072.44
Intensive technologiesNo. of patents224,8053021579189.43
Extensive technologiesNo. of patents1515,8979892211157.60
Supportive technologiesNo. of patents415,3869601939133.50
Independent variables
Variable 1Residential population10,000 persons72.42425.68469.07524.5019.62
Variable 2GDP100 million Yuan300.8432,679.872300.23765.51236.60
Variable 3GDP per capitaYuan/person9528174,27058276.364,077.791850.51
Variable 4Public expense10,000 Yuan0.09078351.54278.71497.4947.06
Variable 5Building construction 10,000 sq.m171.5687,557.214099.310,942.58773.97
Variable 6Green area per capitaSq.m5.7919.713.3913.290.14
Variable 7Road mileagekm1555243061073110950234.77
Variable 8FDI100 million USD0.3751185.147.227915.731.40
Variable 9University students10,000 persons0.499485.67965.6110.730.83
Table 2. Degree of concentration with valid invention patents; Source: authors.
No.Technological Field NameGini Coeff.Top Three Cities in Terms of Valid Invention IPC Numbers
1Electrical machinery, apparatus, energy0.64Shanghai, Suzhou/Jiangsu, Nanjing/Jiangsu
2Audio-visual technology0.74Shanghai, Suzhou/Jiangsu, Hangzhou/Zhejiang
3Telecommunications0.80Shanghai, Nanjing/Jiangsu, Hangzhou/Zhejiang
4Digital communication0.86Shanghai, Hangzhou/Zhejiang, Nanjing/Jiangsu
5Basic communication processes0.82Shanghai, Nanjing/Jiangsu, Suzhou/Jiangsu
6Computer technology0.83Shanghai, Nanjing/Jiangsu, Hangzhou/Zhejiang
7IT methods for management0.80Shanghai, Nanjing/Jiangsu, Hangzhou/Zhejiang
8Semiconductors0.83Shanghai, Suzhou/Jiangsu, Wuhu/Anhui
9Optics0.79Shanghai, Suzhou/Jiangsu, Nanjing/Jiangsu
10Measurement0.72Shanghai, Nanjing/Jiangsu, Hangzhou/Zhejiang
11Analysis of biological materials0.73Shanghai, Nanjing/Jiangsu, Hangzhou/Zhejiang
12Control0.72Shanghai, Nanjing/Jiangsu, Hangzhou/Zhejiang
13Medical technology0.67Shanghai, Suzhou/Jiangsu, Hangzhou/Zhejiang
14Organic fine chemistry0.65Shanghai, Nanjing/Jiangsu, Hangzhou/Zhejiang
15Biotechnology0.75Shanghai, Nanjing/Jiangsu, Hangzhou/Zhejiang
16Pharmaceuticals0.58Nanjing/Jiangsu, Shanghai, Hangzhou/Zhejiang
17Macromolecular chemistry, polymers0.59Shanghai, Suzhou/Jiangsu, Hefei/Anhui
18Food chemistry0.45Hefei/Anhui, Wuhu/Anhui, Nanjing/Jiangsu
19Basic materials chemistry0.52Shanghai, Suzhou/Jiangsu, Nanjing/Jiangsu
20Materials, metallurgy0.57Shanghai, Suzhou/Jiangsu, Nanjing/Jiangsu
21Surface technology, coating0.63Wuxi/Jiangsu, Suzhou/Jiangsu, Shanghai
22Micro-structure and nano-technology0.87Shanghai, Suzhou/Jiangsu, Wuxi/Jiangsu
23Chemical engineering0.51Suzhou/Jiangsu, Shanghai, Nanjing/Jiangsu
24Environmental technology0.59Shanghai, Nanjing/Jiangsu, Suzhou/Jiangsu
25Handling0.57Suzhou/Jiangsu, Shanghai, Wuxi/Jiangsu
26Machine tools0.55Suzhou/Jiangsu, Shanghai, Wuxi/Jiangsu
27Engines, pumps, turbines0.61Shanghai, Hangzhou/Zhejiang, Suzhou/Jiangsu
28Textile and paper machines0.60Suzhou/Jiangsu, Shanghai, Wuxi/Jiangsu
29Other special machines0.44Suzhou/Jiangsu, Shanghai, Nanjing/Jiangsu
30Thermal processes and apparatus0.62Shanghai, Suzhou/Jiangsu, Ningbo/Zhejiang
31Mechanical elements0.57Suzhou/Jiangsu, Shanghai, Wuxi/Jiangsu
32Transport0.62Shanghai, Suzhou/Jiangsu, Wuhu/Anhui
33Furniture, games0.56Suzhou/Jiangsu, Ningbo/Zhejiang, Shanghai
34Other consumer goods0.63Wuxi/Jiangsu, Hefei/Anhui Suzhou/Jiangsu
35Civil engineering0.57Shanghai, Suzhou/Jiangsu, Nanjing/Jiangsu
Table 3. Rotated component matrix for 35 technological fields based on valid invention patents; source: authors.
FieldsComputer, Communication, BiochemistryMechanic, Gadget, Chemical EngineeringFoods
Computer technology0.932
IT methods for management0.912
Telecommunications0.912
Digital communication0.908
Biotechnology0.894
Organic fine chemistry0.880
Basic communication processes0.875
Micro-structure and nano-technology0.875
Analysis of biological materials0.868
Measurement0.846
Semiconductors0.844
Control0.843
Pharmaceuticals0.795 0.416
Civil engineering0.790.549
Medical technology0.7890.592
Engines, pumps, turbines0.7690.55
Optics0.7460.612
Environmental technology 0.635
Materials, metallurgy 0.636
Transport 0.623
Audio-visual technology 0.708
Electrical machinery, apparatus, energy 0.727
Macromolecular chemistry, polymers 0.698
Basic materials chemistry 0.6410.382
Chemical engineering 0.786
Thermal processes and apparatus 0.747
Mechanical elements 0.842
Other special machines 0.8060.355
Surface technology, coating 0.854
Handling 0.9
Textile and paper machines 0.899
Machine tools 0.937
Food chemistry 0.882
Furniture, games 0.881
Other consumer goods 0.71
Variance explained48.37%38.07%6.18%
Table 4. Results by FEM and random forest regression.
Fixed Effects Model (Coefficient)Random Forest Relative Importance (%IncMSE)
Model 1Model 2Model 3Model 4Model 5Model 6Model 7Model 8
Distinctive TechnologyIntensive TechnologyExtensive TechnologySupportive TechnologyDistinctive TechnologyIntensive TechnologyExtensive TechnologySupportive Technology
Residential population (RP)0.126−0.1540.3840.51621.03419.83723.61921.917
GDP (GDP)1.779 ***1.931 ***1.705 ***1.387 ***30.63124.26031.81428.772
GDP per capita (GDPp)0.025−0.168 ***0.217 **0.271 **24.90013.44227.68327.177
Public expense (Lex)−0.520 ***−0.589 ***−0.680**−0.649 **20.97621.41326.96225.556
Building construction (BC)−0.027−0.033−0.018−0.03417.01210.68924.04825.252
Green area per capita (GP)−0.043 *−0.044 **0.0040.05312.51310.39219.48119.218
Road mileage (RM)0.0240.0120.0920.09320.66210.85821.74220.108
Actual utilized FDI (FDI) 0.331 ***0.290 ***0.595 ***0.514 ***22.86421.31525.09924.503
University student (Us)0.670 ***0.311 **0.816 ***0.751 **18.61829.52822.12721.821
R square0.9620.9710.9360.885
% Var explained 0.9370.9580.9130.860
Note: For FEM, * p < 0.05, ** p < 0.01, *** p < 0.001, R square assesses the goodness-of-fit for FEM; % Var explained is similar to R square in random forest.
Disclaimer/Publisher’s Note: The statements, opinions and data contained in all publications are solely those of the individual author(s) and contributor(s) and not of MDPI and/or the editor(s). MDPI and/or the editor(s) disclaim responsibility for any injury to people or property resulting from any ideas, methods, instructions or products referred to in the content.

