Article

Attapulgite-Supported Nanoscale Zero-Valent Iron Composite Materials for the Enhanced Removal of Ni2+ from Aqueous Solutions: Characterization, Kinetics, and Mechanism

1
School of Environmental and Municipal Engineering, Lanzhou Jiaotong University, Lanzhou 730070, China
2
College of Resources, Environment and Life Sciences, Ningxia Normal University, Guyuan 756000, China
3
Gansu Hanxing Environmental Protection Co., Ltd., Lanzhou 730070, China
4
College of Chemistry and Chemical Engineering, Ningxia Normal University, Guyuan 756000, China
*
Author to whom correspondence should be addressed.
Appl. Sci. 2024, 14(5), 1823; https://doi.org/10.3390/app14051823
Submission received: 21 December 2023 / Revised: 15 February 2024 / Accepted: 19 February 2024 / Published: 23 February 2024

Abstract

:

Featured Application

Attapulgite-supported nanoscale zero-valent iron composite materials for the enhanced removal of Ni2+ from aqueous solutions: characterization, kinetics, and mechanism.

Abstract

This study focuses on addressing the pollution caused by Ni in water. To enhance the removal efficiency of Ni2+, attapulgite (ATP) from Linze County, Gansu Province, China, was used as a carrier to prepare attapulgite loaded with nanoscale zero-valent iron (nZVI@ATP) via a liquid-phase reduction. This approach aims to mitigate the aggregation and oxidation tendencies of nZVI, thereby improving its performance in Ni2+ removal. The results revealed that nZVI@ATP exhibited a mesoporous structure with a specific surface area and an average pore size of 51.79 m2/g and 9.22 nm. Notably, nZVI@ATP showed a remarkably reduced agglomeration phenomenon. In addition, nZVI@ATP demonstrated a considerably more excellent adsorption performance for Ni2+ than raw ATP and pure nZVI, as its highest adsorption capacity was 143.20 mg/g when the iron–ATP ratio was 2:1 (initial concentration: 200 mg/L, initial pH: 5, temperature: 298 K, and dosing amount: 1 g/L). The adsorption of Ni2+ by nZVI@ATP followed the quasi-secondary kinetic model, and the removal rate of Ni2+ was inversely proportional to the initial concentration and directly proportional to the dosage. The adsorption capacity tended to increase and then decrease as the pH increased. The removal mechanism of Ni2+ by nZVI@ATP involved adsorption, reduction, and precipitation, with the significant mechanism being the induced Ni(OH)2 precipitation on the nZVI@ATP surface.

1. Introduction

Despite the rapid advancement of industrial development and its associated positive aspects, including technological advancements, economic growth, and job opportunities, it has concurrently led to increasingly severe environmental problems, which arise from the discharge of numerous amounts of heavy metal elements into water bodies through electroplating, mining, metallurgy, and other activities [1]. In addition, the impact of human activities, such as agricultural production and domestic waste discharge, further contributes to the abovementioned issues, particularly concerning natural water bodies [2]. Over the past 50 years, the average concentrations of heavy metals (Cd, Pb, Cr, Ni, Al, and Mn) detected in surface freshwater around the world, specifically in Africa, Asia, Europe, and South America, have consistently exceeded the safety limits set by the WHO and US EPA [3,4,5]. In the industrial zone of Meghna Ghat in Bangladesh, samples have shown excessive levels of Cr, Cd, Ni, and Pb [6]. Similarly, in Nigeria, Cd, Cr, Mn, Ni, and Pb concentrations in surface freshwater have exceeded the maximum recommended levels for drinking water set by WHO [7]. Therefore, addressing the problem of heavy metal pollution, particularly removing heavy metal ions from water bodies, is a major global concern [8]. Ni and its compounds have many industrial and commercial uses. Given their widespread use in aircraft, electroplating, steel, and metallurgical industries, excessive Ni content is released into the environment. The Ni2+ concentrations in terrestrial and aquatic resources can reach 26 g/kg and 0.2 mg/L, respectively, which is about 25 times that of uncontaminated resources [9]. Ni has become one of the major pollutants in the ecological environment. Ni2+ has detrimental effects on the environment, human body, and microorganisms, and animal experimentations have confirmed the carcinogenicity of Ni compounds as they can induce tumor production and disrupt the human immune system, causing allergic reactions [10,11].
Currently, compared to the inefficiency of chemical precipitation techniques and the interference susceptibility of ion exchange technologies in the treatment of heavy metal-polluted wastewater, as well as the high cost associated with electrochemical techniques, adsorption presents significant advantages in practicality, cost-effectiveness, and efficiency, making it an effective method for treating Ni. Adsorption is considered to be an efficient, convenient, and economical method for wastewater treatment. The flexibility in design and operation, the high removal efficiency, and the possibility of regeneration and reuse of most adsorbents through appropriate desorption processes contribute to the increasing popularity of adsorption processes. It relies on the interaction between porous solid adsorbents and heavy metal ions, with the main mechanisms including electrostatic adsorption, composite adsorption, ion exchange, etc. [12,13,14]. This process promotes the enrichment of heavy metal ions on the adsorbent, ultimately achieving the purpose of purifying the water body [15]. Recently, clay minerals have been widely used as adsorbents for removing heavy metal ions from water [16]. Attapulgite (ATP), whose theoretical chemical formula is Mg5·Si8·O20(OH)2(OH2)4·4H2O, is a 2:1 layered chain hydrated magnesium-rich silicate clay mineral with a specific rod-like crystal structure, considerable surface area, and unique surface charge distribution characteristics [17]. Owing to its rich mineral resources, easy access, low cost, nontoxic nature, and multiple applications, natural ATP has excellent potential for solving heavy metal pollution in water [18,19]. The ATP clay resources in Linze, Gansu are relatively abundant, with ATP from the Linze mine exhibiting a stratified distribution and a brick-red surface [20]. However, the low-grade ATP from the original mine contains many impurities and has a rough surface and a low specific surface area, resulting in substantially weakened physicochemical properties, hampering its large-scale exploitation.
Owing to its large specific surface area and strong reactivity, nanoscale zero-valent iron (nZVI) is widely used for remediating water and soil pollution [21]. The nZVI reduction technology offers several advantages, including a rapid reaction, a simple process, suitability for small-scale and decentralized treatments, and an absence of the drawbacks associated with traditional methods. In addition, nZVI is an active, inexpensive, widely available, and environmentally friendly substance, making it a popular choice for remediating heavy metal pollution [22]. However, owing to its propensity for easy agglomeration and oxidation, which reduces its overall performance, nZVI cannot be used alone for pollutant removal [23]. Furthermore, ATP can be used as an excellent solid phase negative carrier owing to its good dispersion ability and mechanical properties [20]. Accordingly, nZVI loading onto ATP to prepare nZVI@ATP—a new pollutant remover—can substantially improve nZVI dispersion and increase the contact area of nZVI with pollutants [24], affording a new and efficient composite material for removing Ni-induced pollution in water.
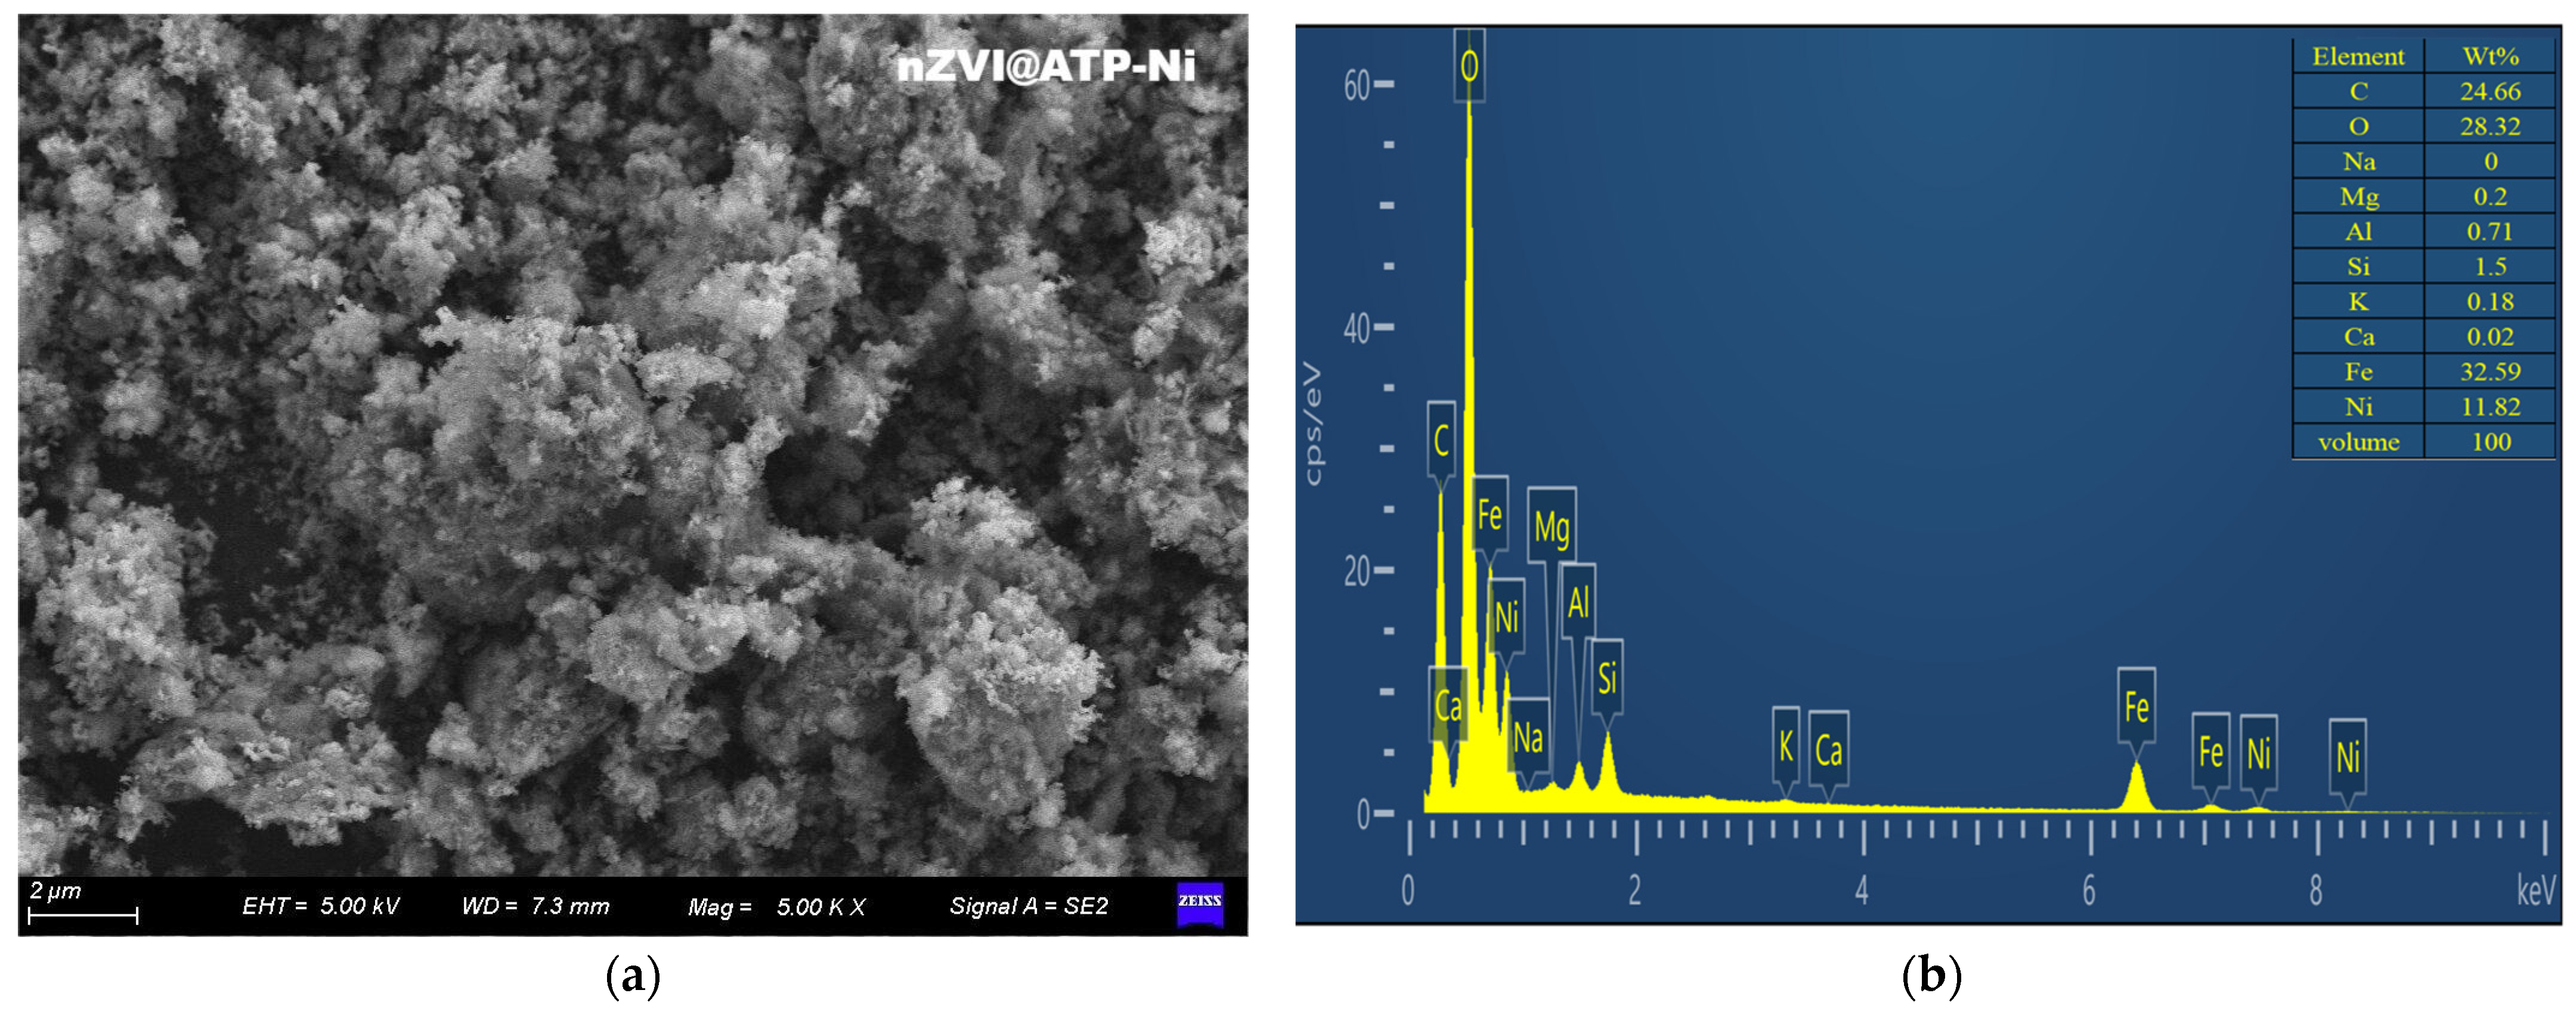
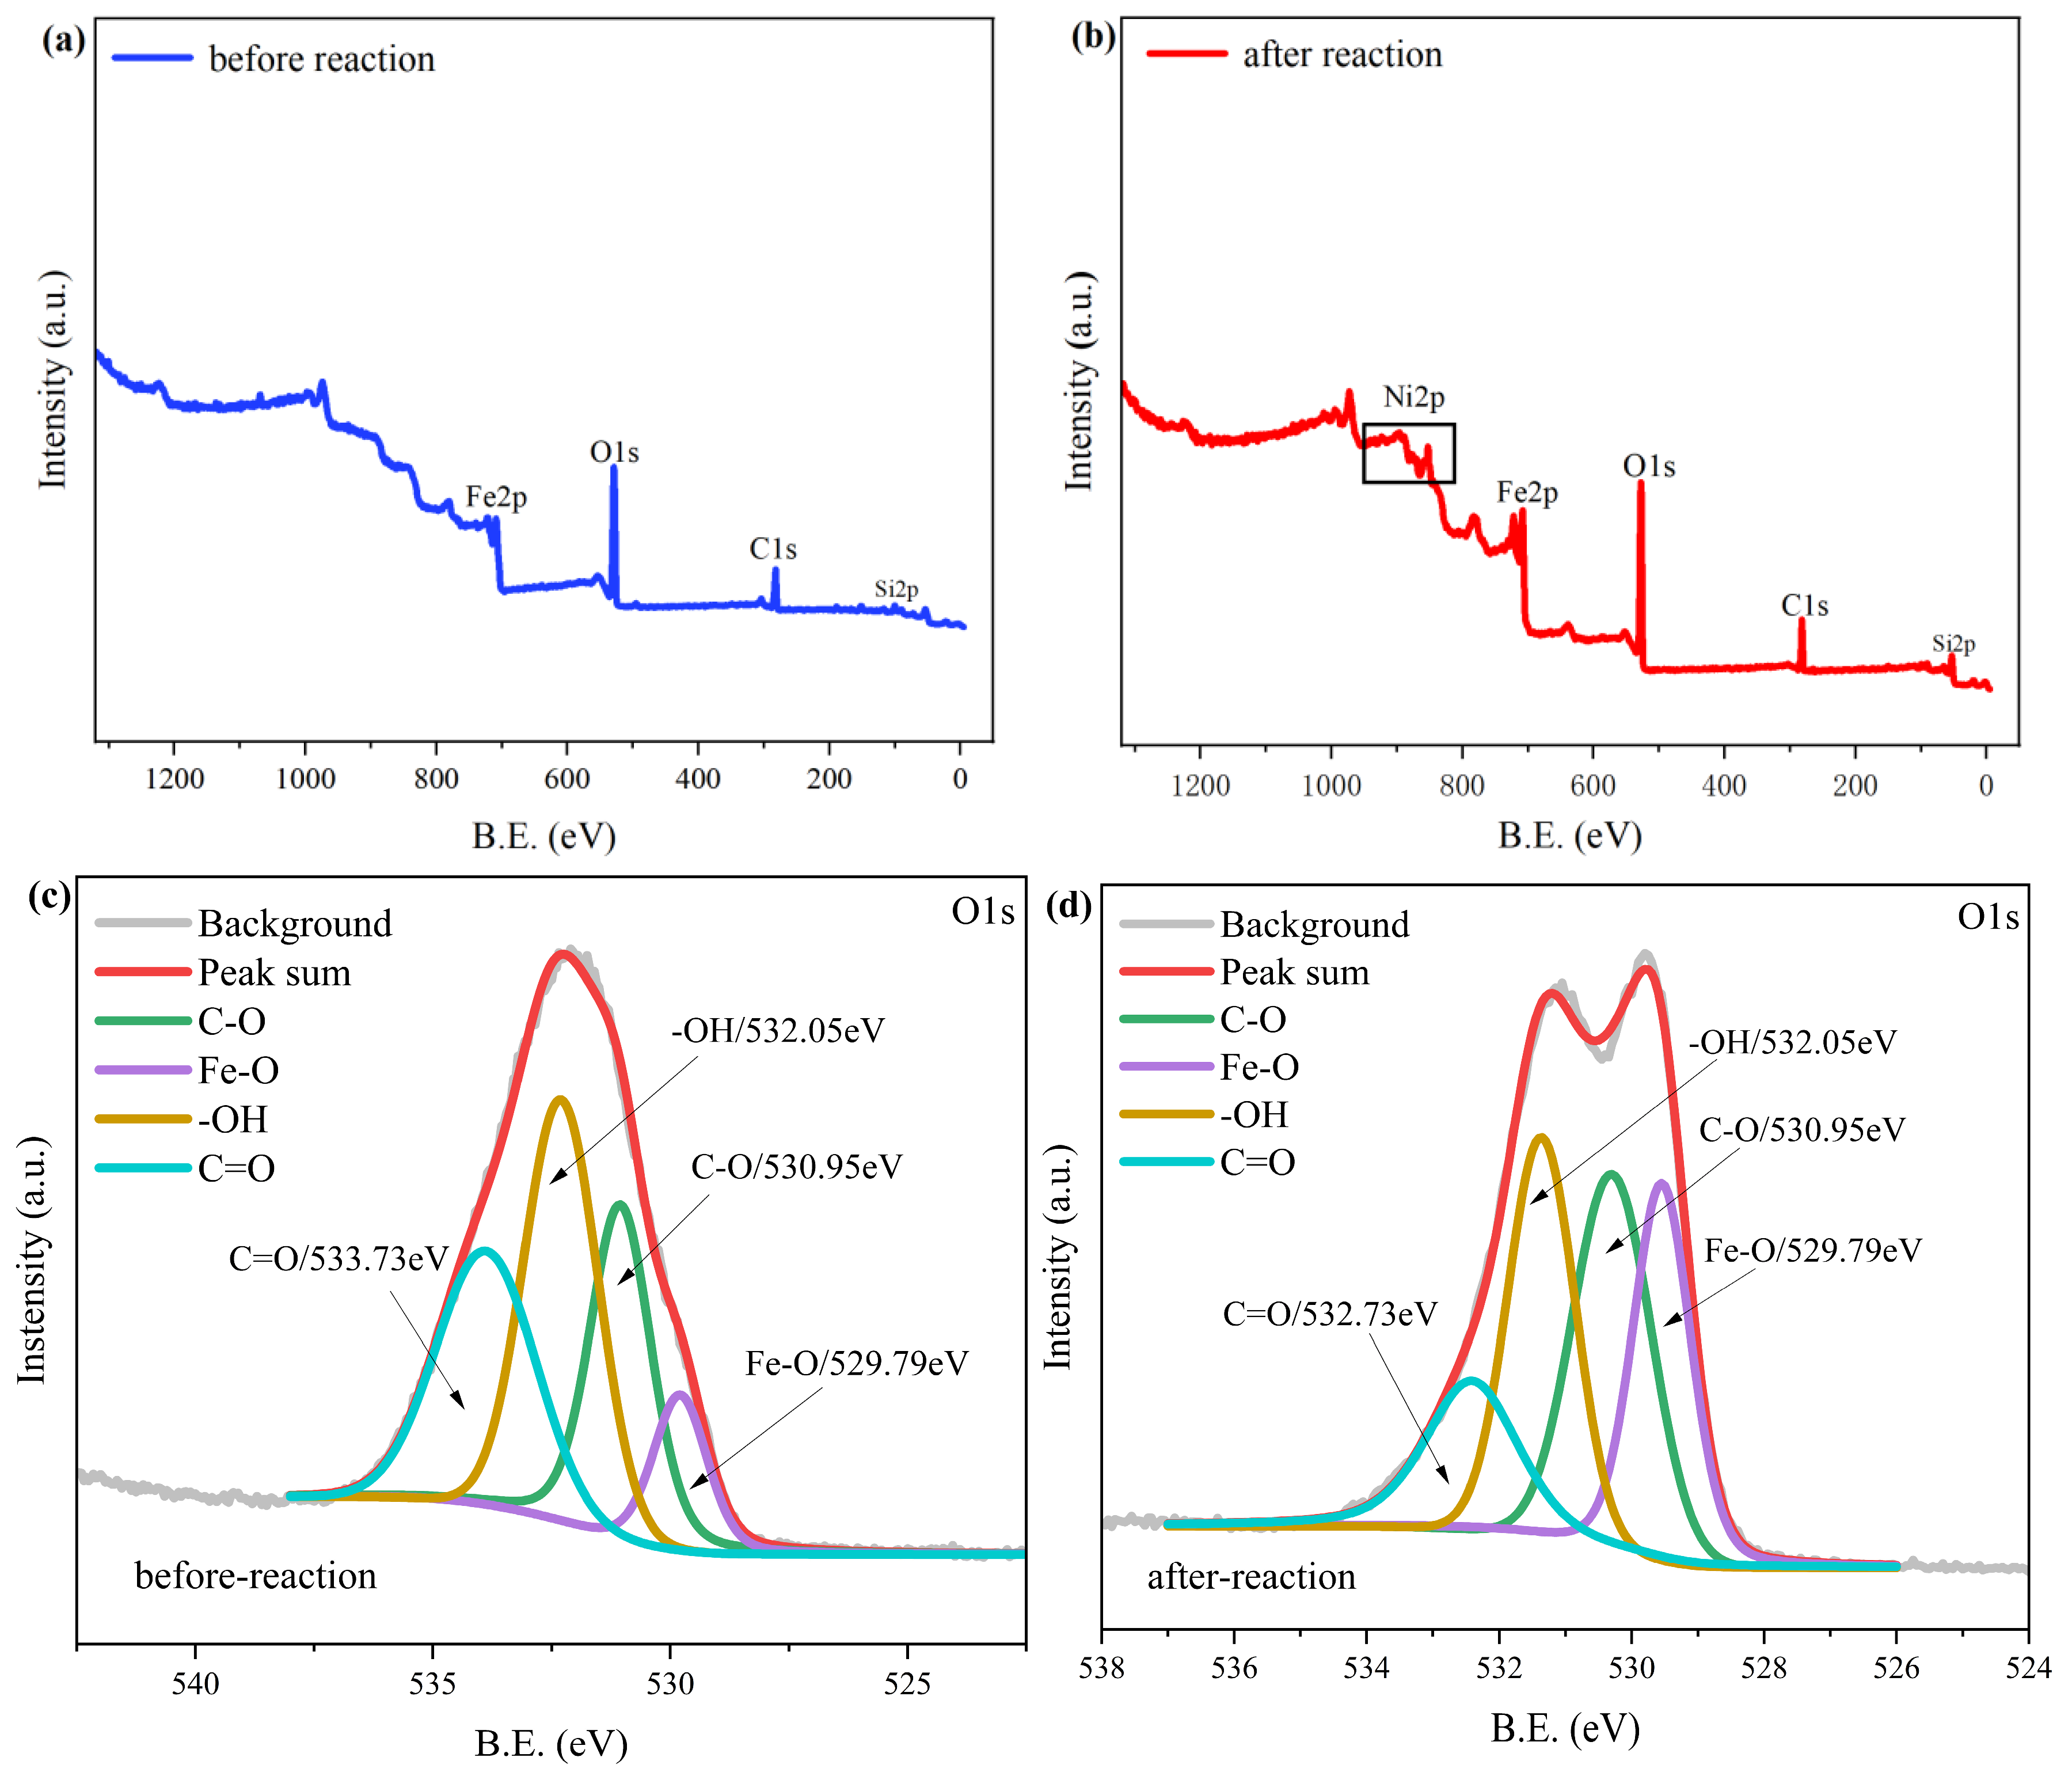
This study explores the Ni2+ removal performance and mechanism of nZVI@ATP in water. A liquid-phase reduction method was used to synthesize nZVI@ATP composites with different iron-to-soil ratios, after which static adsorption of Ni2+ was conducted to investigate the effects of the initial concentration, dosing amount, initial pH, and coexisting ions on the adsorption capacity of nZVI@ATP composites. The kinetic and intraparticle diffusion models were used to investigate the nZVI@ATP adsorption properties of Ni2+ in water. Furthermore, scanning electron microscopy–energy dispersive spectroscopy (SEM–EDS), Fourier transform infrared (FTIR) spectroscopy, X-ray diffraction (XRD), X-ray photoelectron spectroscopy (XPS), and other characterization methods were used in combination to uncover the mechanism of Ni2+ adsorption by nZVI@ATP.

2. Materials and Methods

2.1. Materials

Ferrous sulfate heptahydrate (FeSO4·7H2O, ≥99.0%), anhydrous ethanol (C2H5OH, ≥99.7%), sodium borohydride (NaBH4, ≥98.0%), sodium hydroxide (NaOH, ≥96.0%), nitric acid (HNO3), hydrochloric acid (HCl), and nickel chloride hexahydrate (NiCl2·6H2O, ≥99%) were purchased from the National Chemical Reagent Company. Furthermore, sodium nitrate (NaNO3, ≥99.0%) was purchased from Tianjin Damao Chemical Reagent Factory. All chemical reagents were of an analytical grade. ATP was purchased from Gansu Hanxing Environmental Protection Technology Co., Ltd. (Lanzhou, China). The mineral composition of the ATP was as follows: 19.3% ATP, 15.1% quartz, 5.3% seafoam, 19.8% feldspar, 10.9% muscovite, and 6.9% mica, while the remaining 22.7% comprised a combination of chlorite, kaolinite, gypsum, montmorillonite, and calcite. The pH value of the ATP was 8.47.

2.2. Preparation of nZVI@ATP and nZVI

ATP (200-mesh sieved) and FeSO4·7H2O were dissolved in a three-necked flask with 100 mL of deionized water at different mass ratios of iron to ATP (3:1, 2:1, 1:1, 1:2, and 1:3) and stirred for 2 h, followed by the addition of 100 mL of anhydrous ethanol and a 30 min stirring. Subsequently, 400 mL of a 0.5-mol/L NaBH4 solution was immediately added at a rate of 1–2 drops/s, and nZVI@ATP was obtained after centrifugation. Further, the nZVI@ATP was washed thrice with ethanol and deionized water and dried under vacuum at 40 °C for 6 h. This procedure was conducted in a N2 atmosphere, and the nZVI@ATP was stored under a vacuum seal in a refrigerator freezer layer for backup. The preparation process of the nZVI was the same as the process mentioned above, with the only difference being the absence of ATP. The reaction equation is shown in Equation (1).
Fe2+ + 2BH4 + 6H2O →Fe0 + 2B(OH)3 + 7H2

2.3. Adsorption of Ni2+ by nZVI@ATP

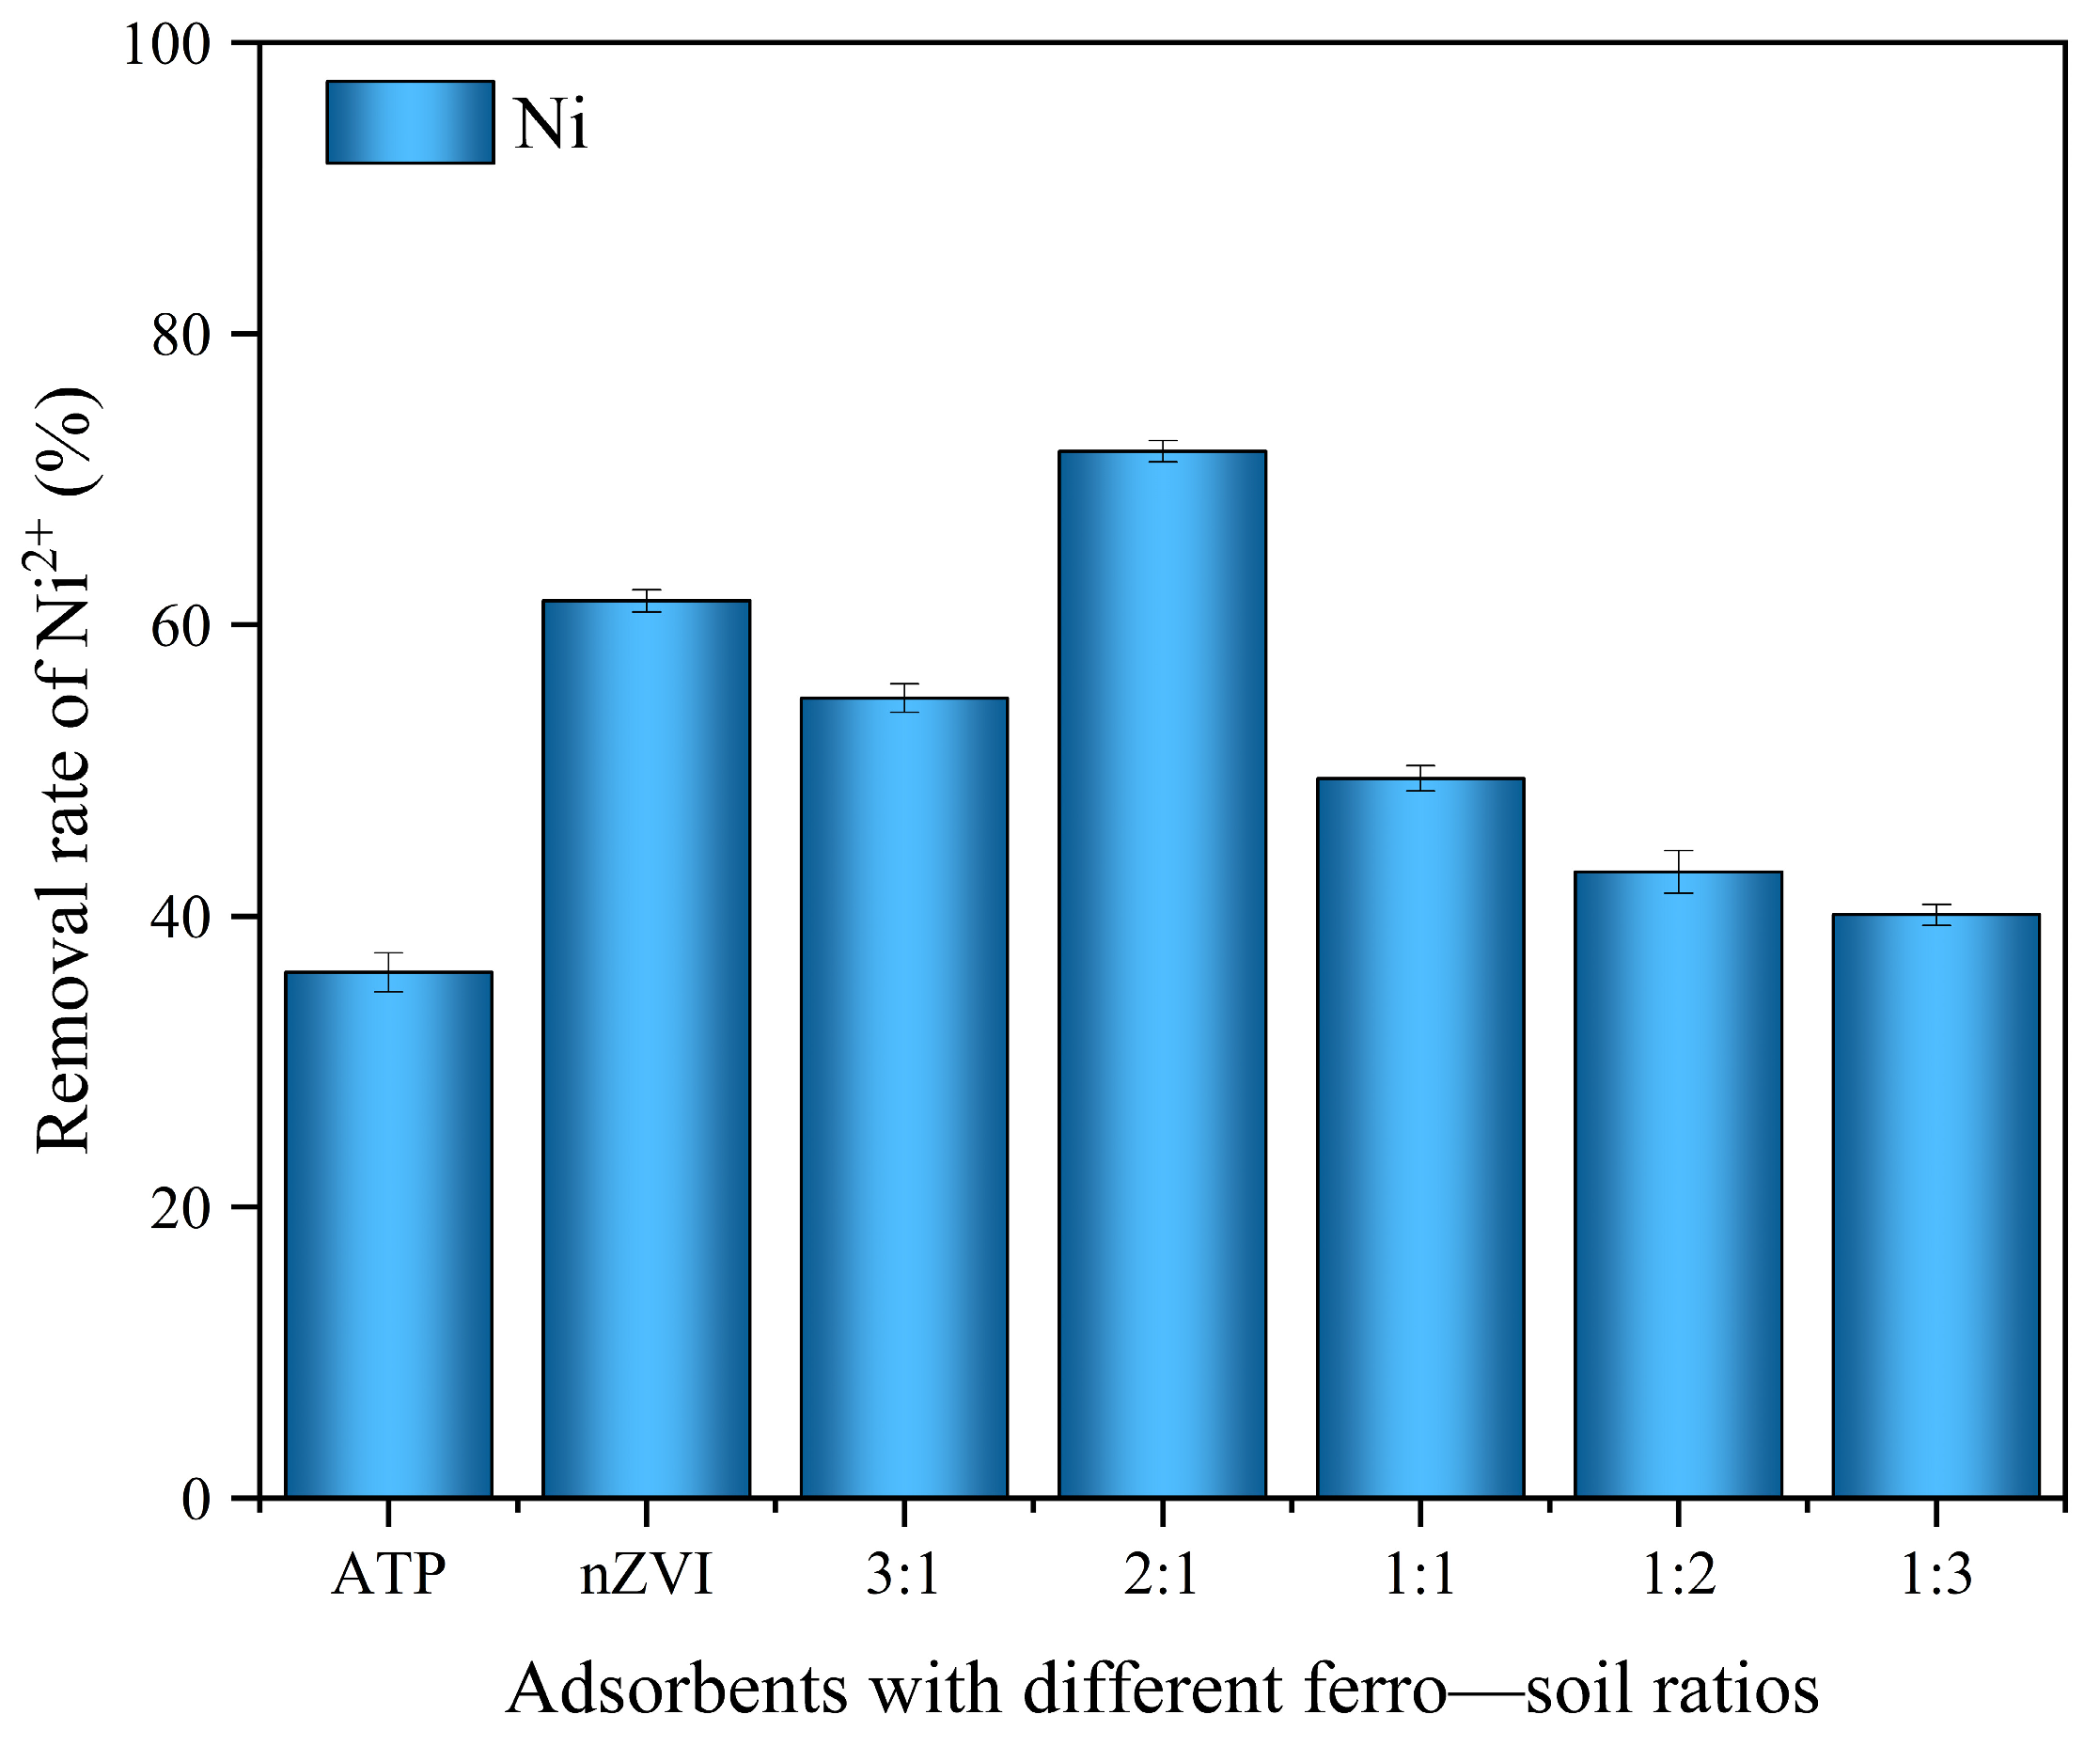
2.3.1. Screening of nZVI@ATP Adsorbents with Different Ratios of Fe and ATP

ATP, nZVI, and nZVI@ATP samples with different iron-to-ATP ratios were added to centrifuge tubes loaded with 30 mL of 200 mg/L Ni2+ solution at 1 g/L. The solution pH was adjusted to 5.0 using 0.1-mol/L HCl and 0.1-mol/L NaOH before adding the Ni2+ solution. The resulting solution was placed in a constant temperature water bath, shaken at 298 K and 220 r/min for 12 h, and passed through a 0.45 μm filter membrane. The Ni2+ residual concentration after the aforementioned reaction was detected using a flame atomic absorption spectrophotometer (FAAS) to determine the composite with the best adsorption performance for Ni2+. Subsequent experiments were conducted based on the determination of the optimal iron-to-ATP ratio in combination with the actual situation.

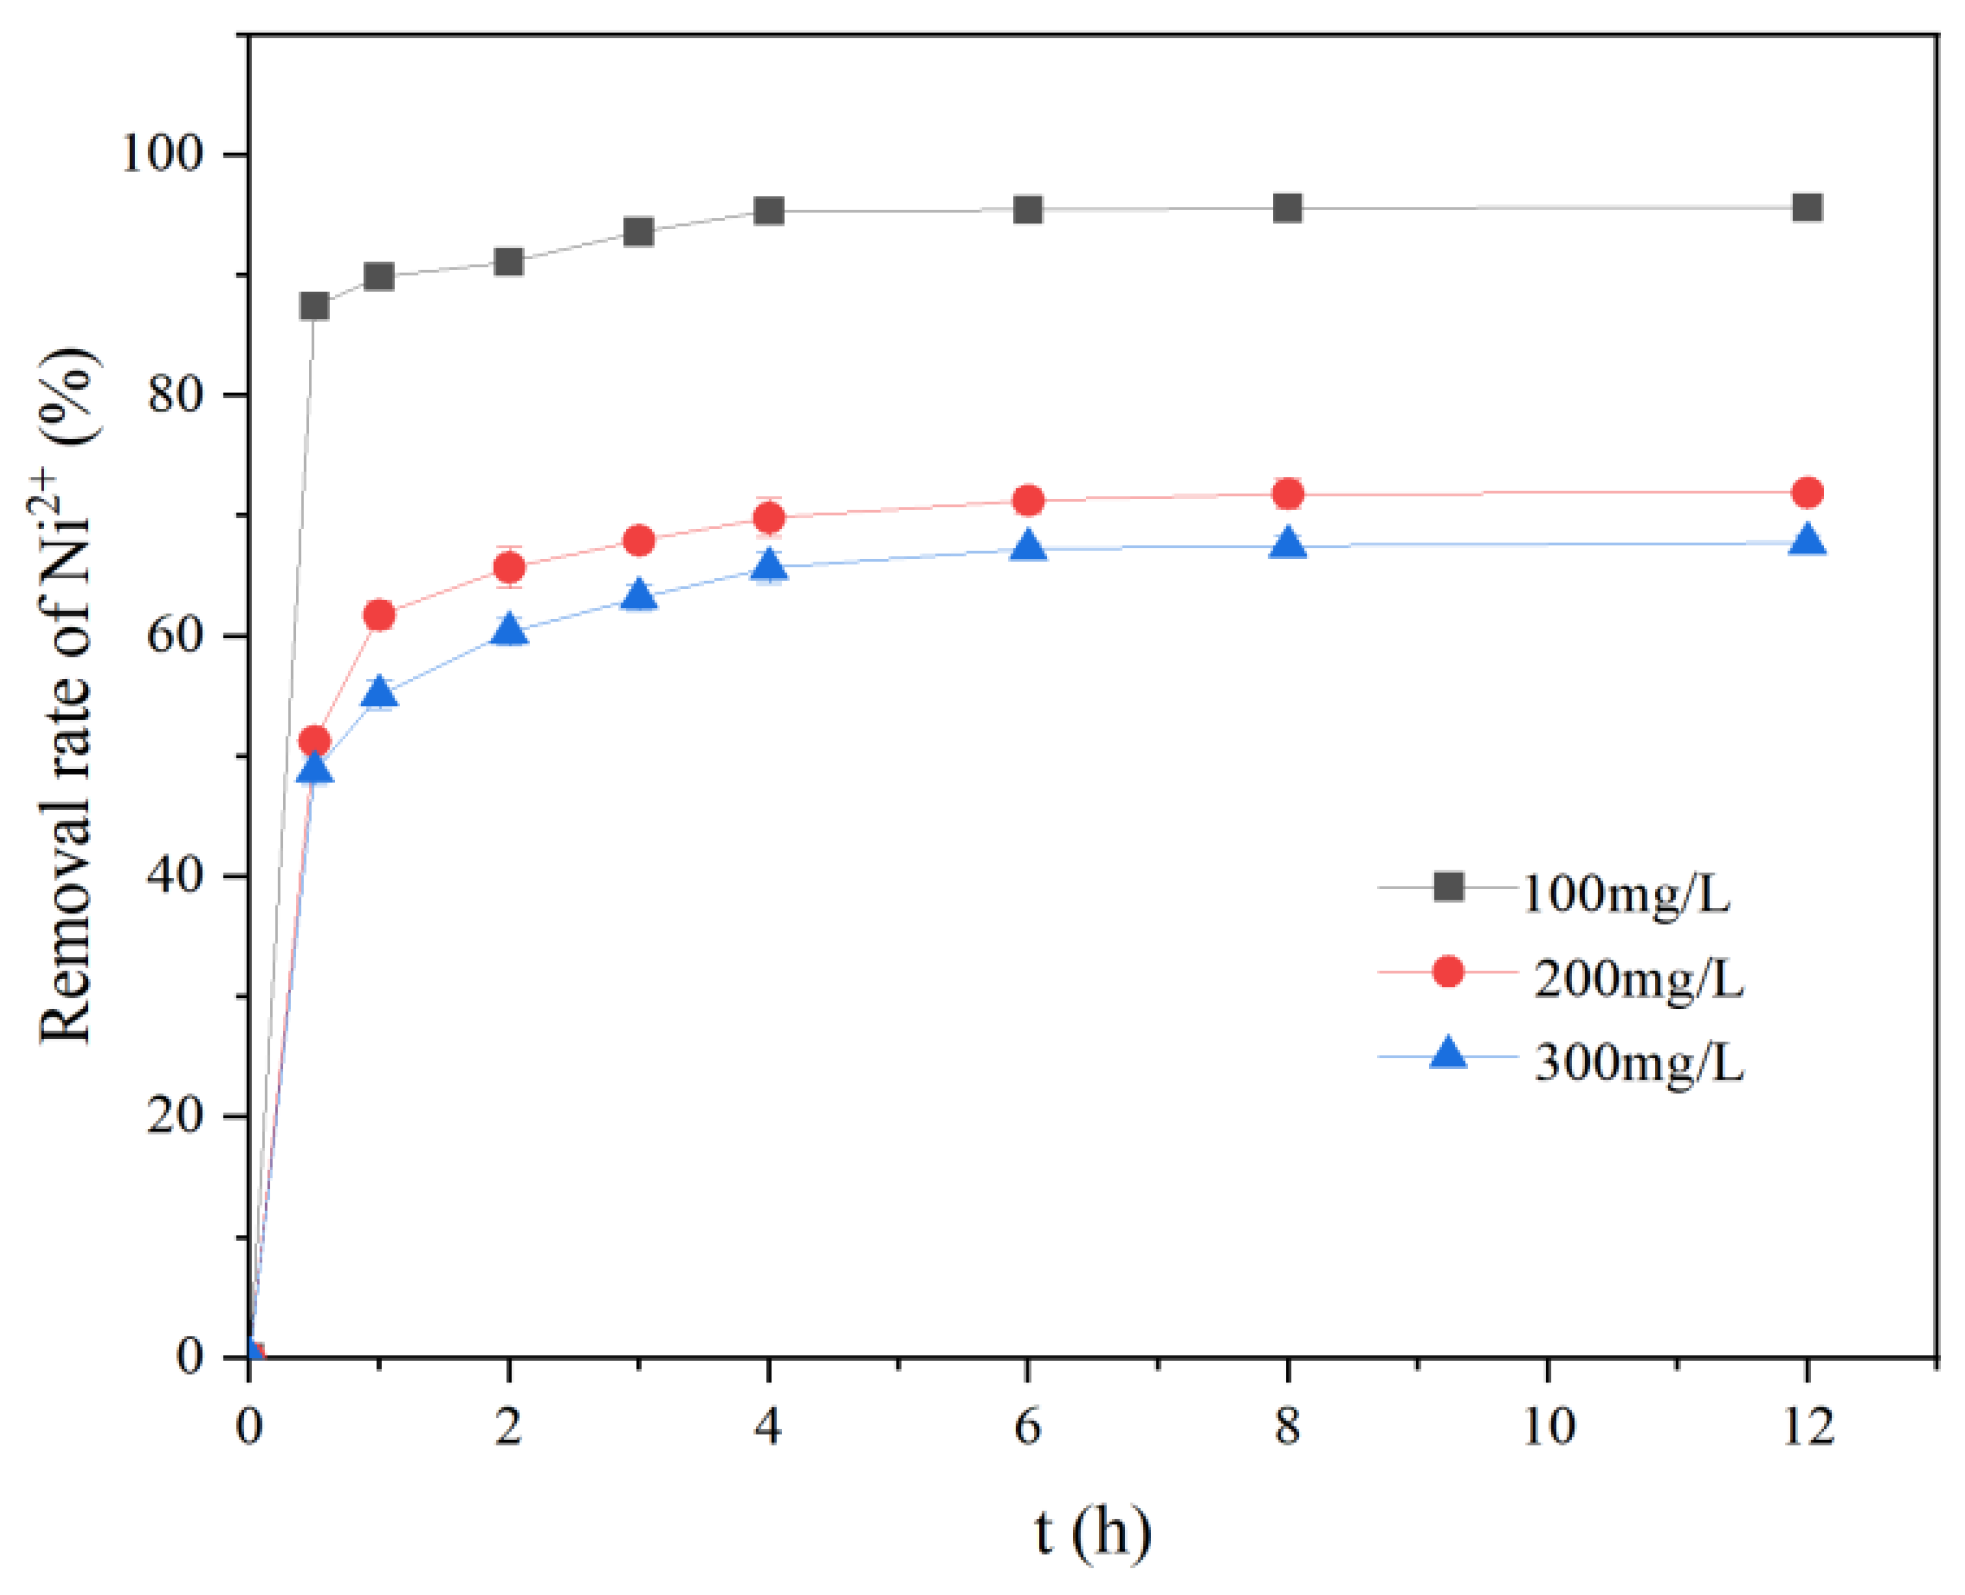
2.3.2. Effect of Initial Concentration on Ni2+ Adsorption by nZVI@ATP

After adding nZVI@ATP at an injection rate of 1 g/L, 30 mL of Ni2+ solutions with initial concentrations of 100, 200, and 300 mg/L were added to the centrifuge tubes, and the pH was adjusted to 5. The solutions were then shaken for 0.5, 1, 2, 3, 4, 6, 8, and 12 h at 25 °C in a constant temperature water bath and removed and filtered through a 0.45 µm microporous filter membrane. Subsequently, the remaining Ni2+ concentration in the solution was measured.

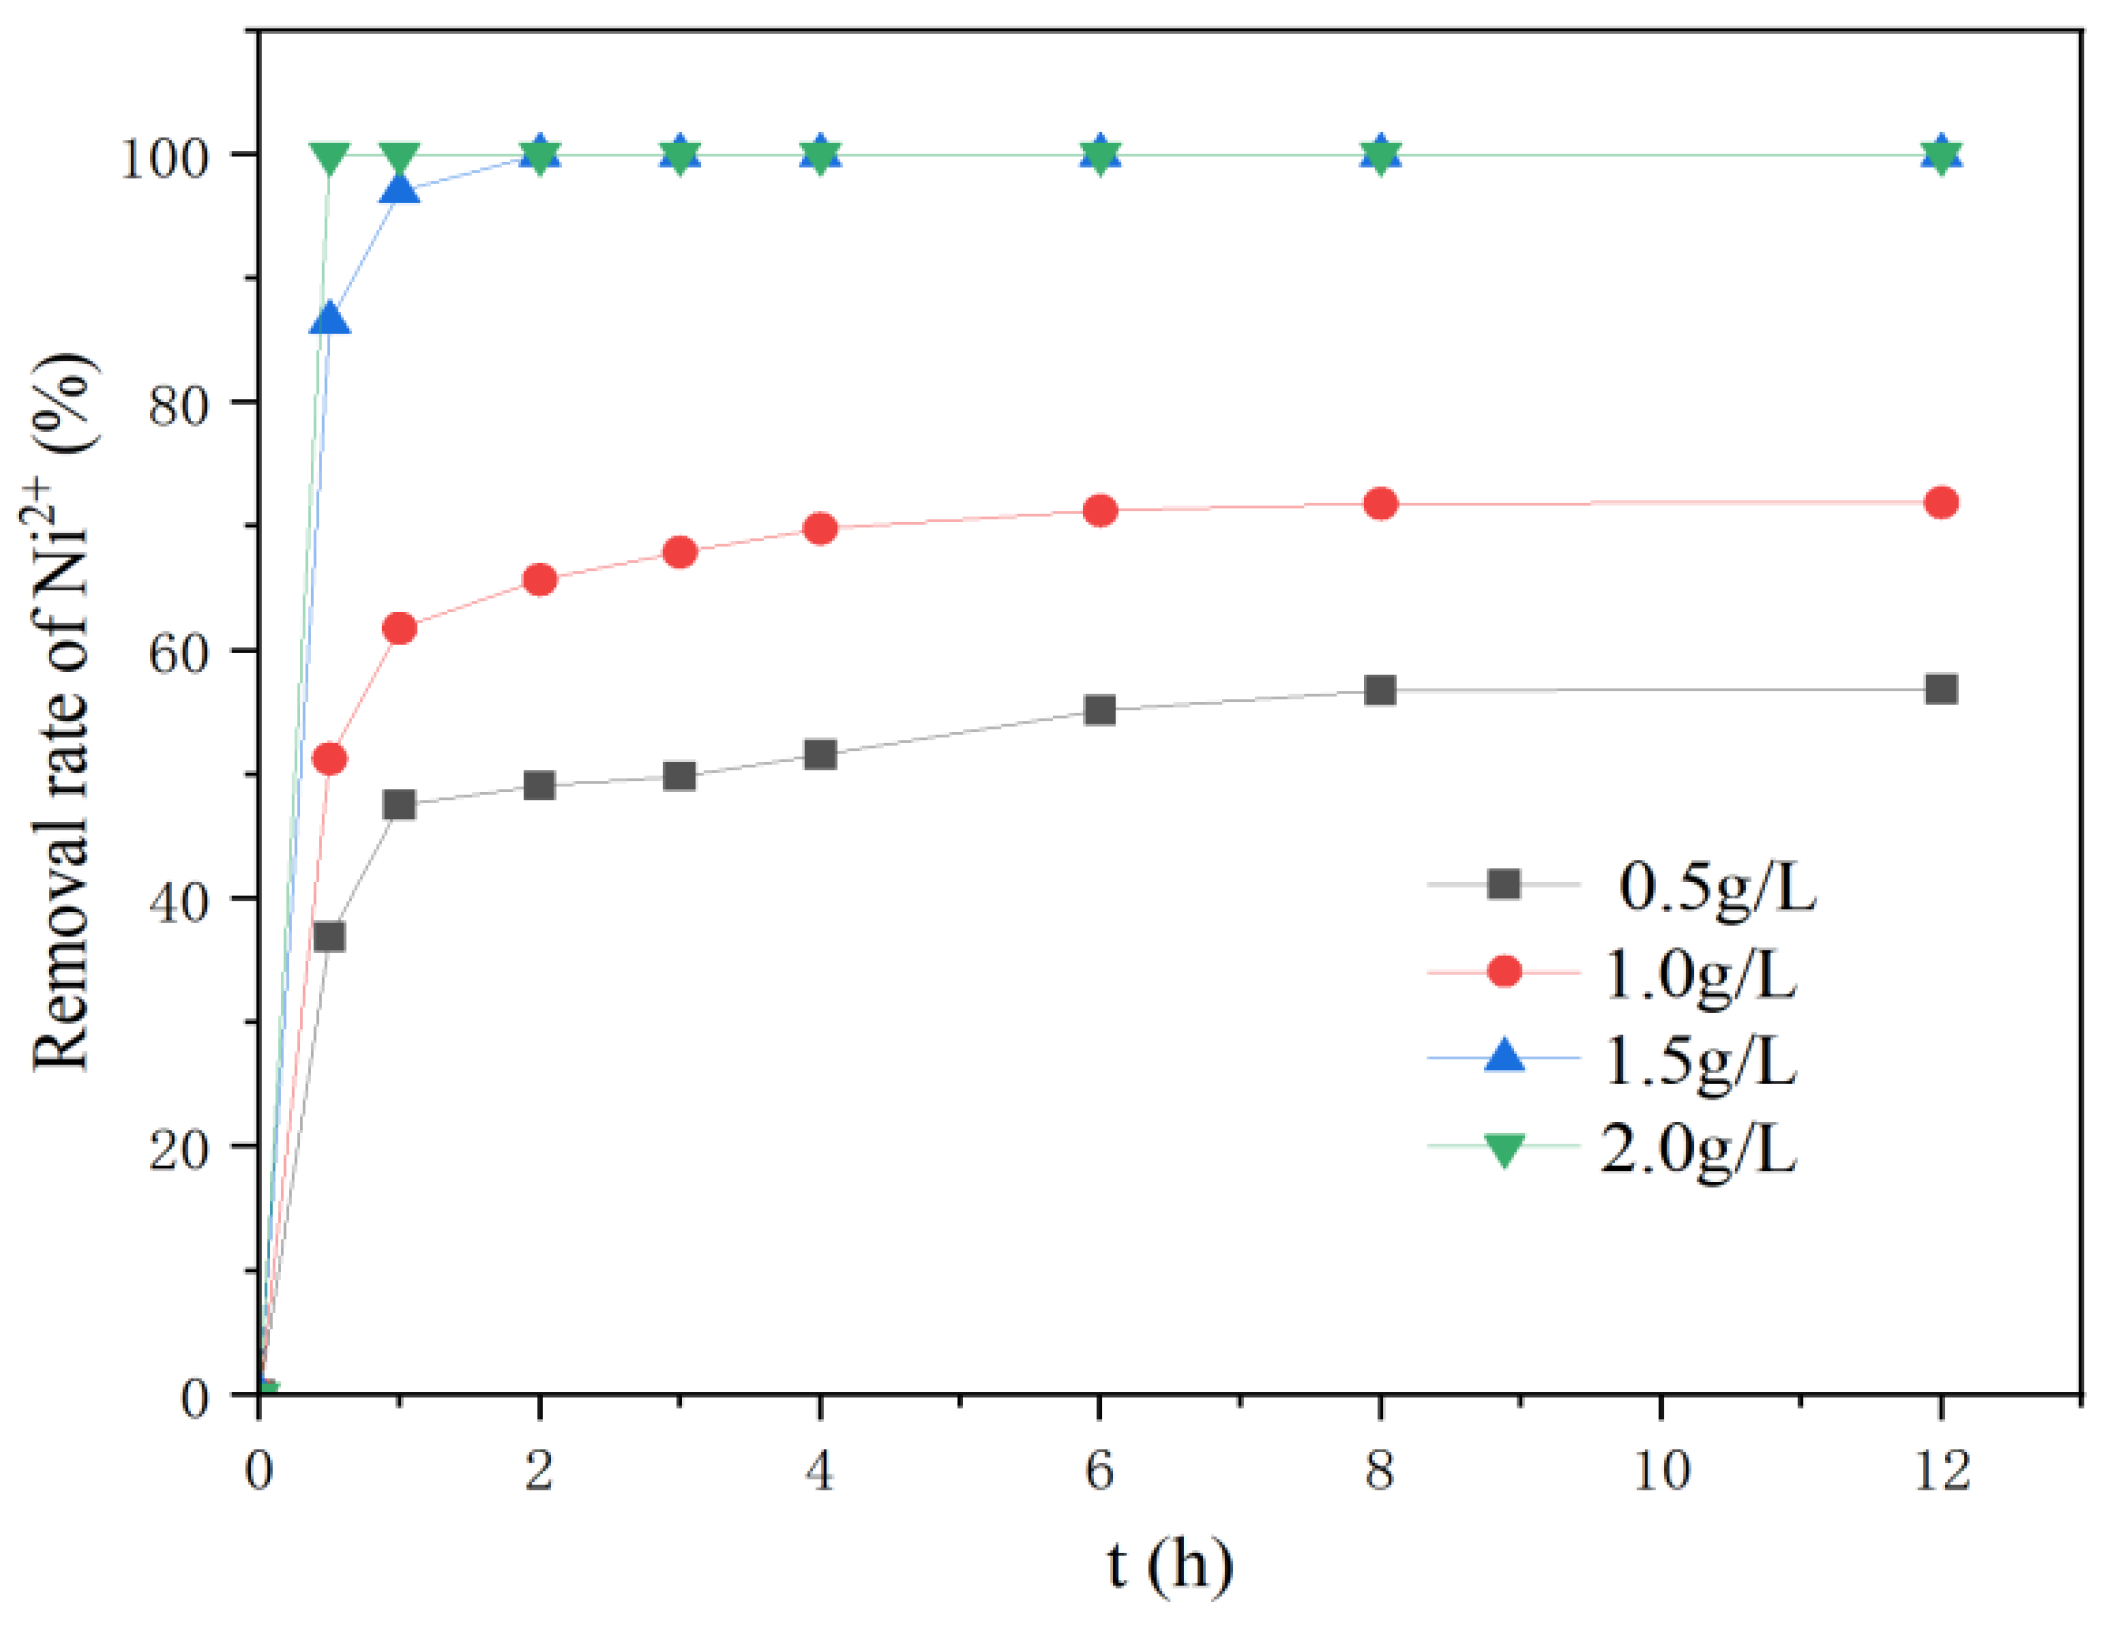
2.3.3. Effect of Dosing Amount of Solution on Ni2+ Adsorption by nZVI@ATP

After adding nZVI@ATP at concentrations of 0.5, 1.0, 1.5, and 2.0 g/L, 30 mL of the 200 mg/L Ni2+ solution with a pH of 5 was added, shaken in a constant temperature water bath at 25 °C, removed, and filtered through a 0.45 µm microporous membrane. Thereafter, the concentration of the remaining Ni2+ in the solution was measured.

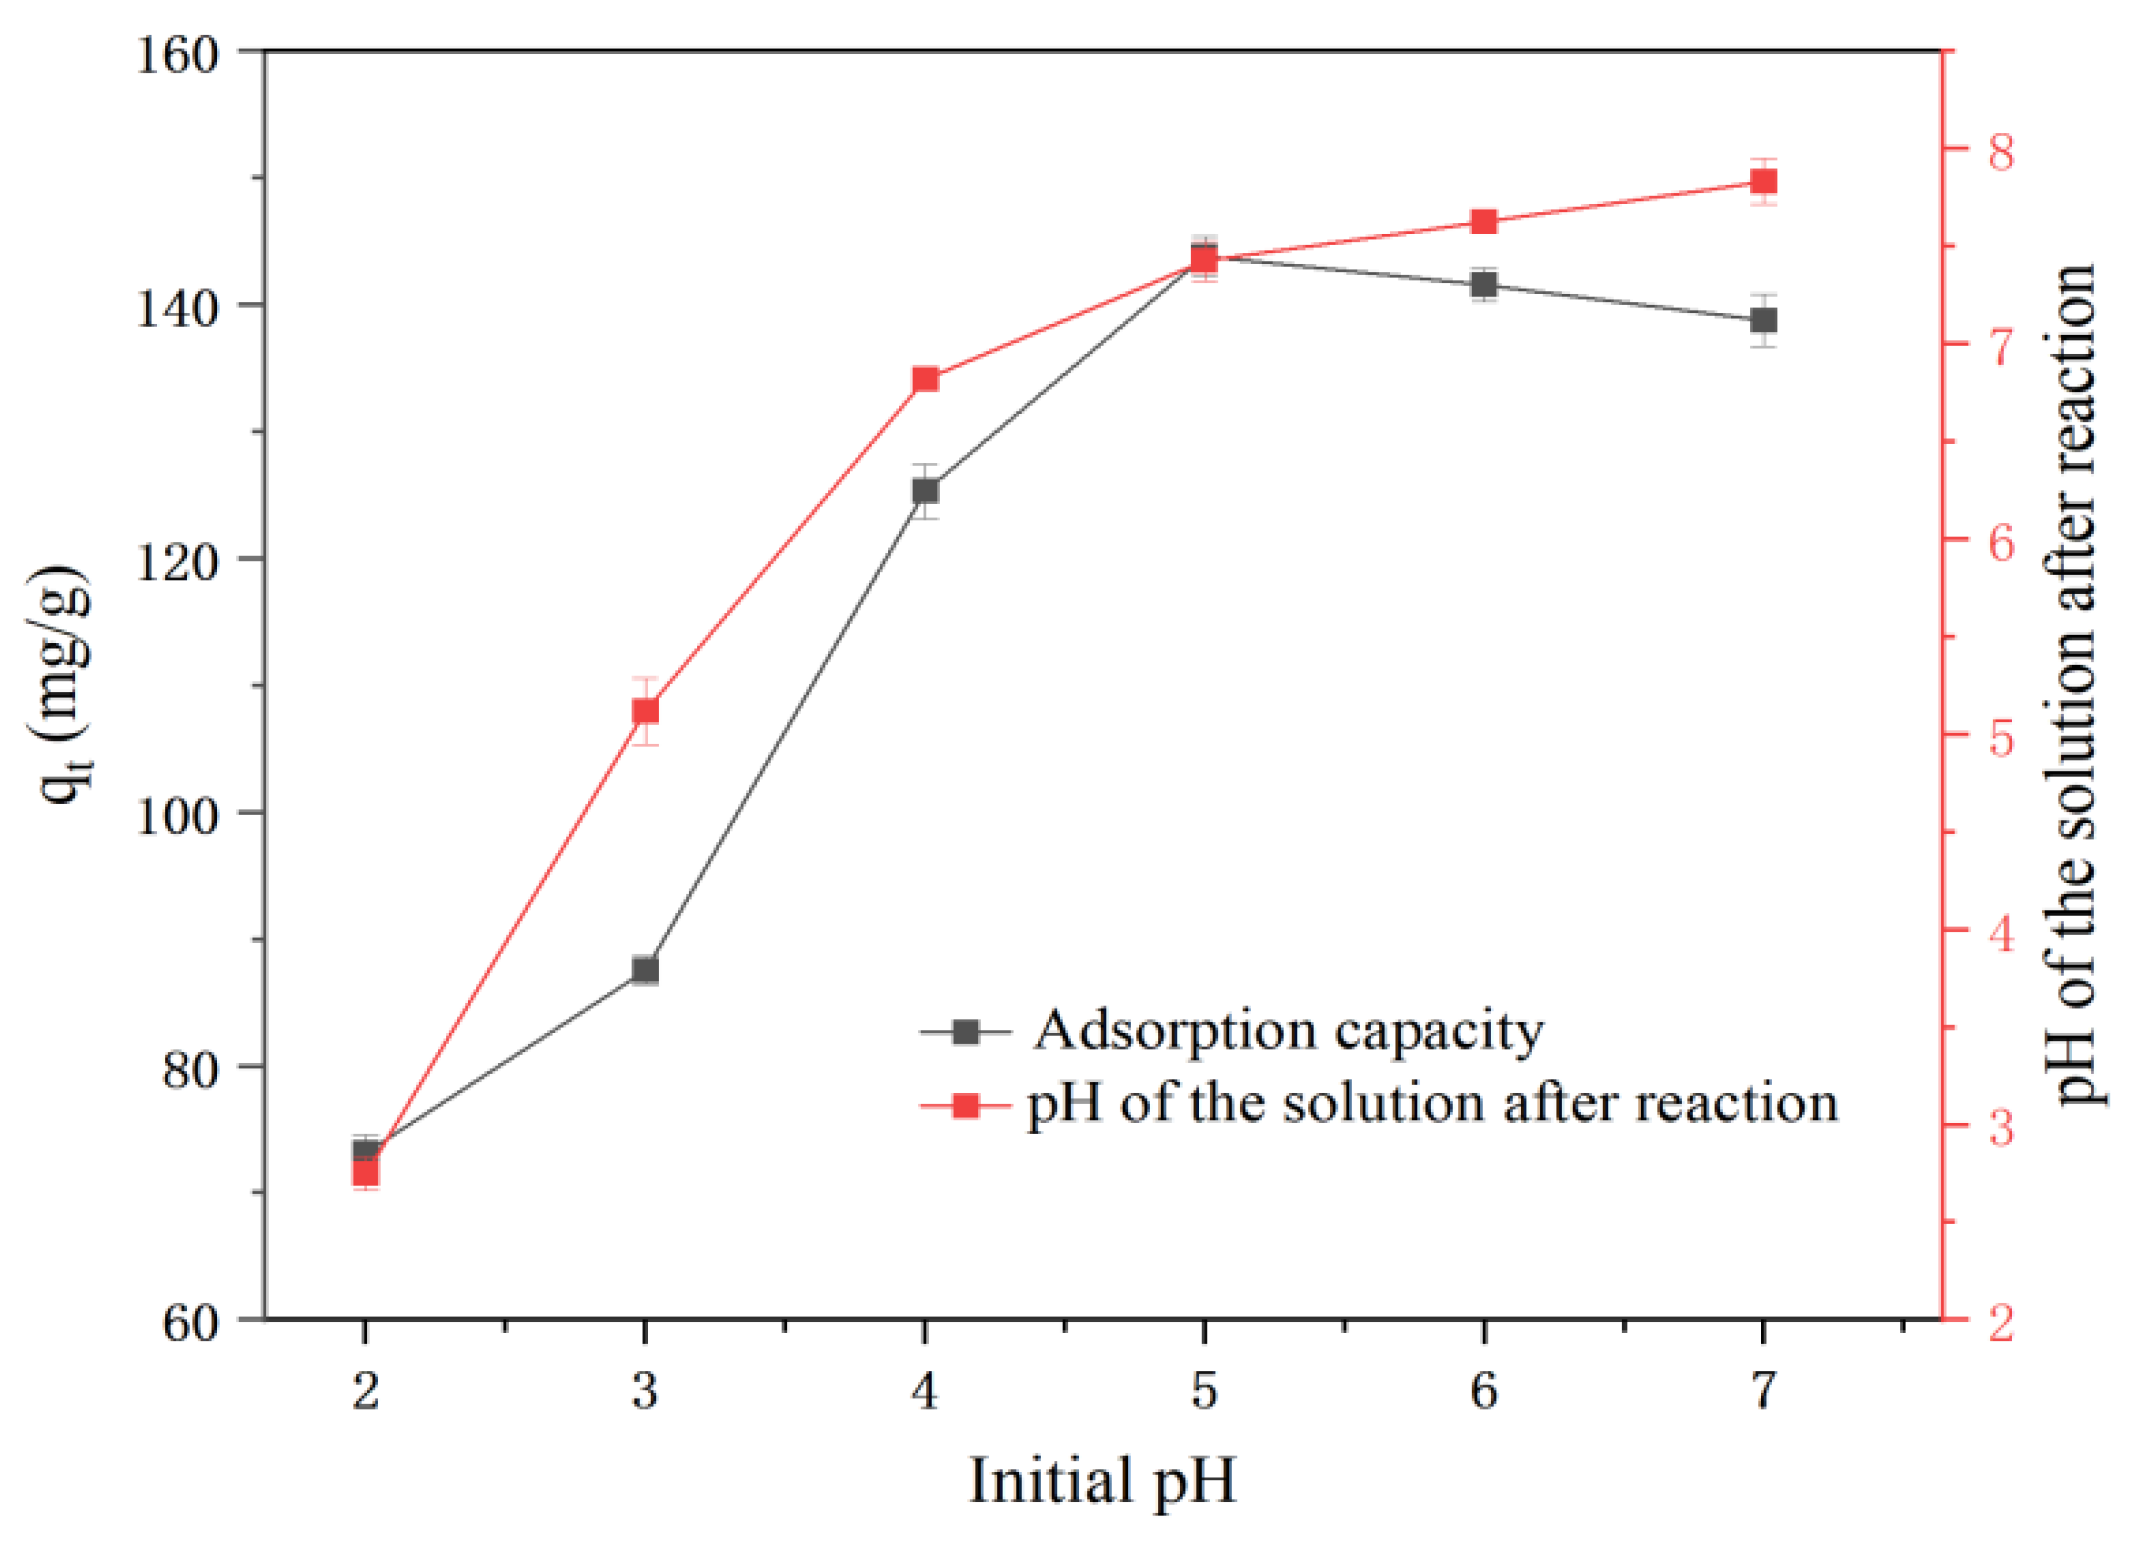
2.3.4. Effect of pH on Ni2+ Adsorption by nZVI@ATP

The initial pH of the Ni2+ solution (200 mg/L) was pre-adjusted to 2, 3, 4, 5, 6, and 7. The nZVI@ATP adsorbent was added to different pH solutions at 1 g/L dosing to examine the effect of the pH. The solution was shaken in a shaker at 25 °C for 12 h at 200 r/min and then passed through a 0.45 µm filter membrane to measure the concentration of the remaining Ni2+ in the solution.

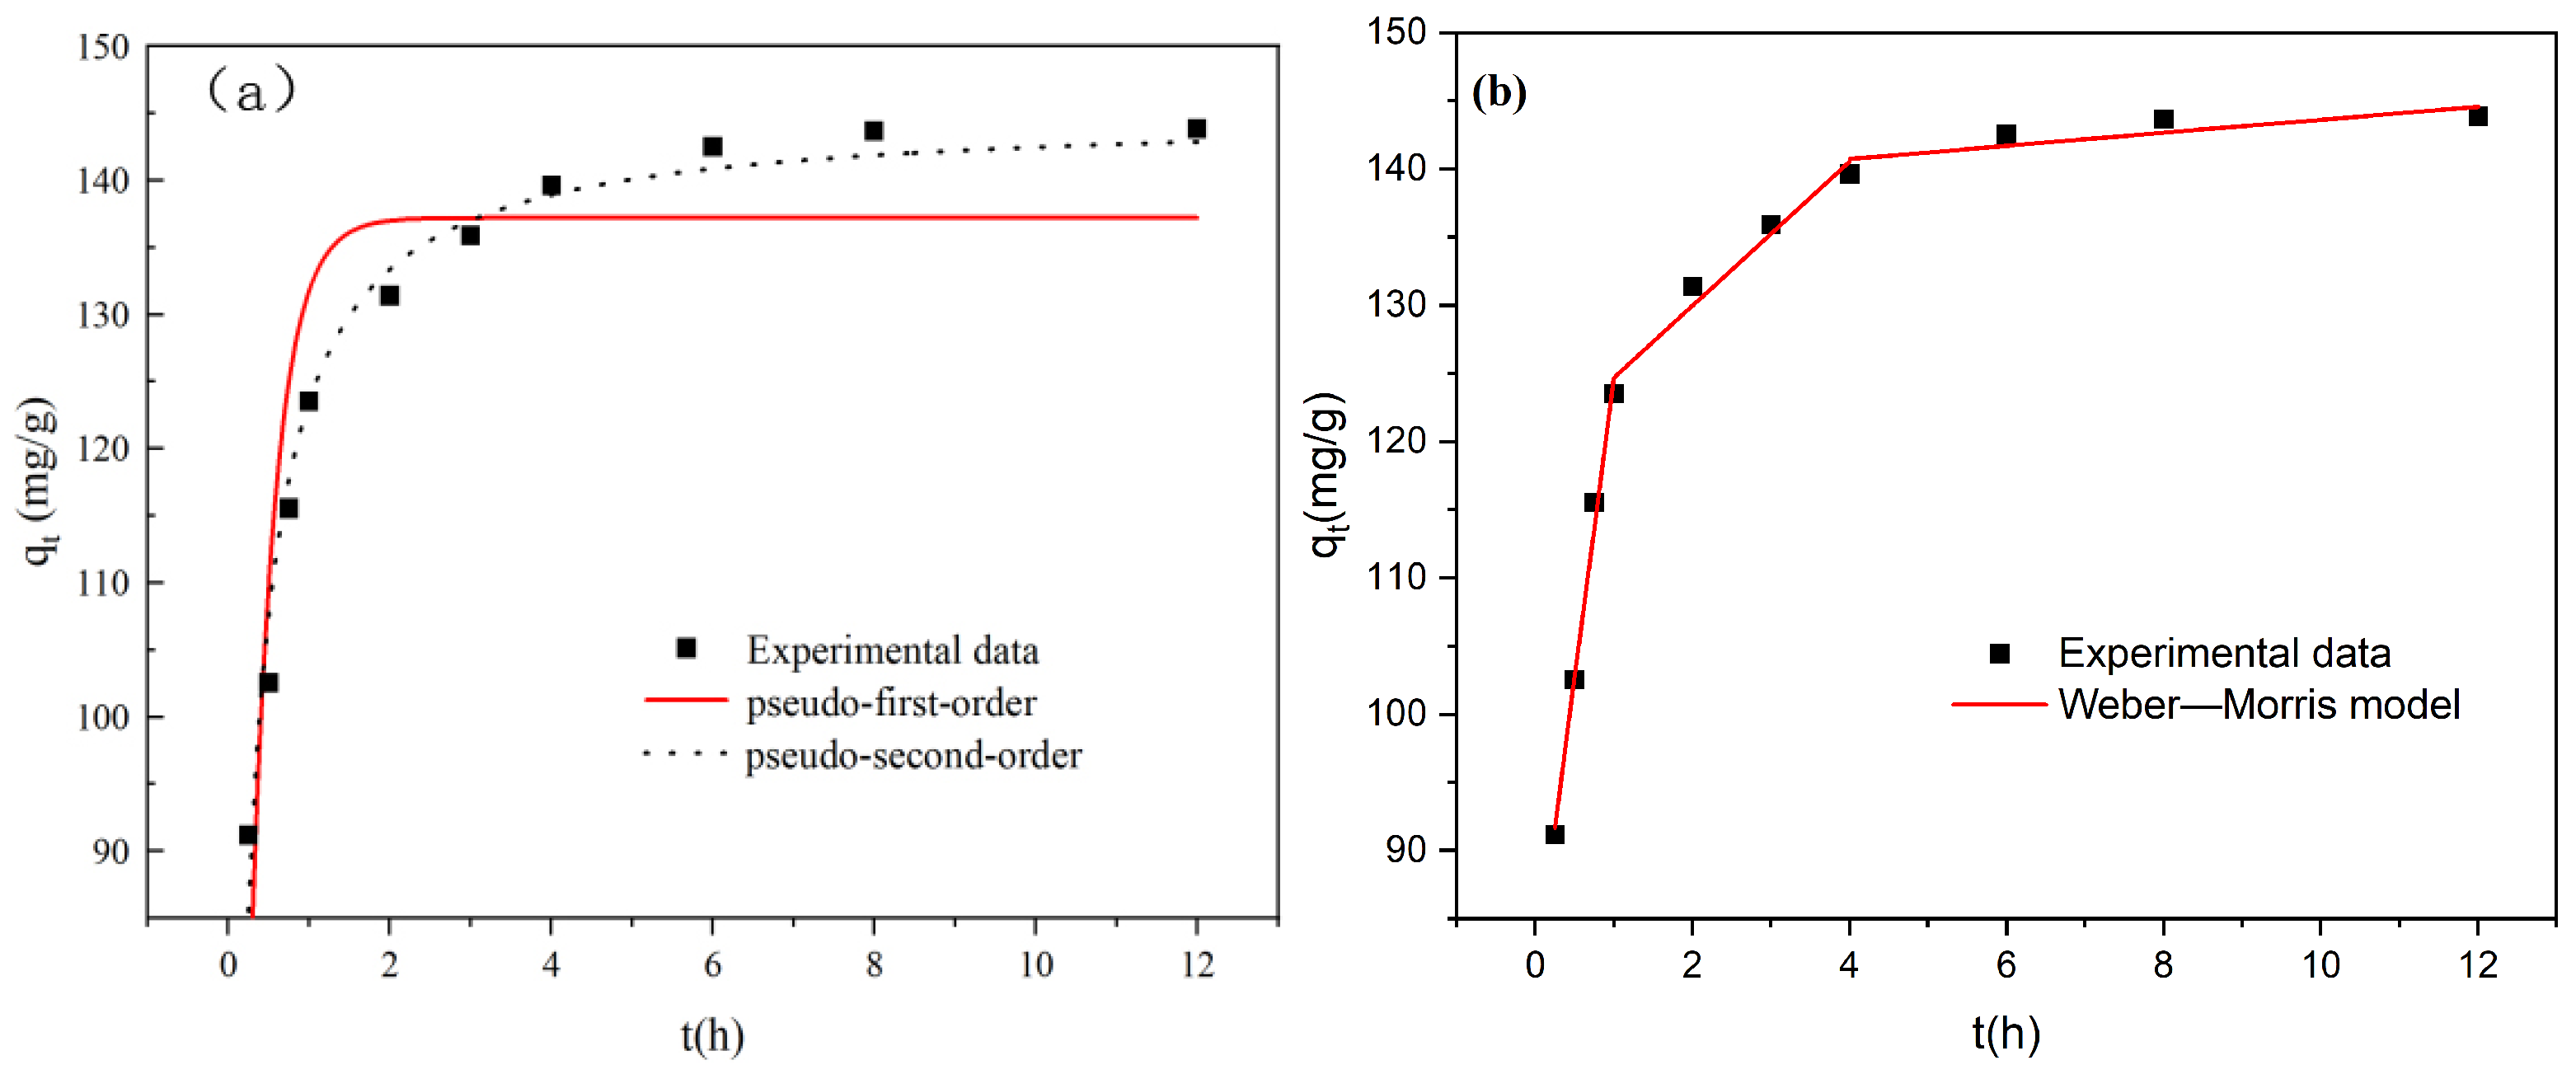
2.3.5. Adsorption Kinetics Experiment

The kinetics of the Ni2+ removal by nZVI@ATP were investigated. In total, 30 mL of Ni2+ solution was added at an initial concentration of 200 mg/L to the centrifuge tube, and the pH was adjusted to 5. The nZVI@ATP was added to the centrifuge tube at a dosage of 1 g/L, and the solutions were then shaken for 0.25, 0.5, 0.75, 1, 2, 3, 4, 6, 8, and 12 h at 25 °C in a constant temperature water bath, removed, and filtered through a 0.45 µm microporous filter membrane. Subsequently, the remaining Ni2+ concentration in the solution was measured.

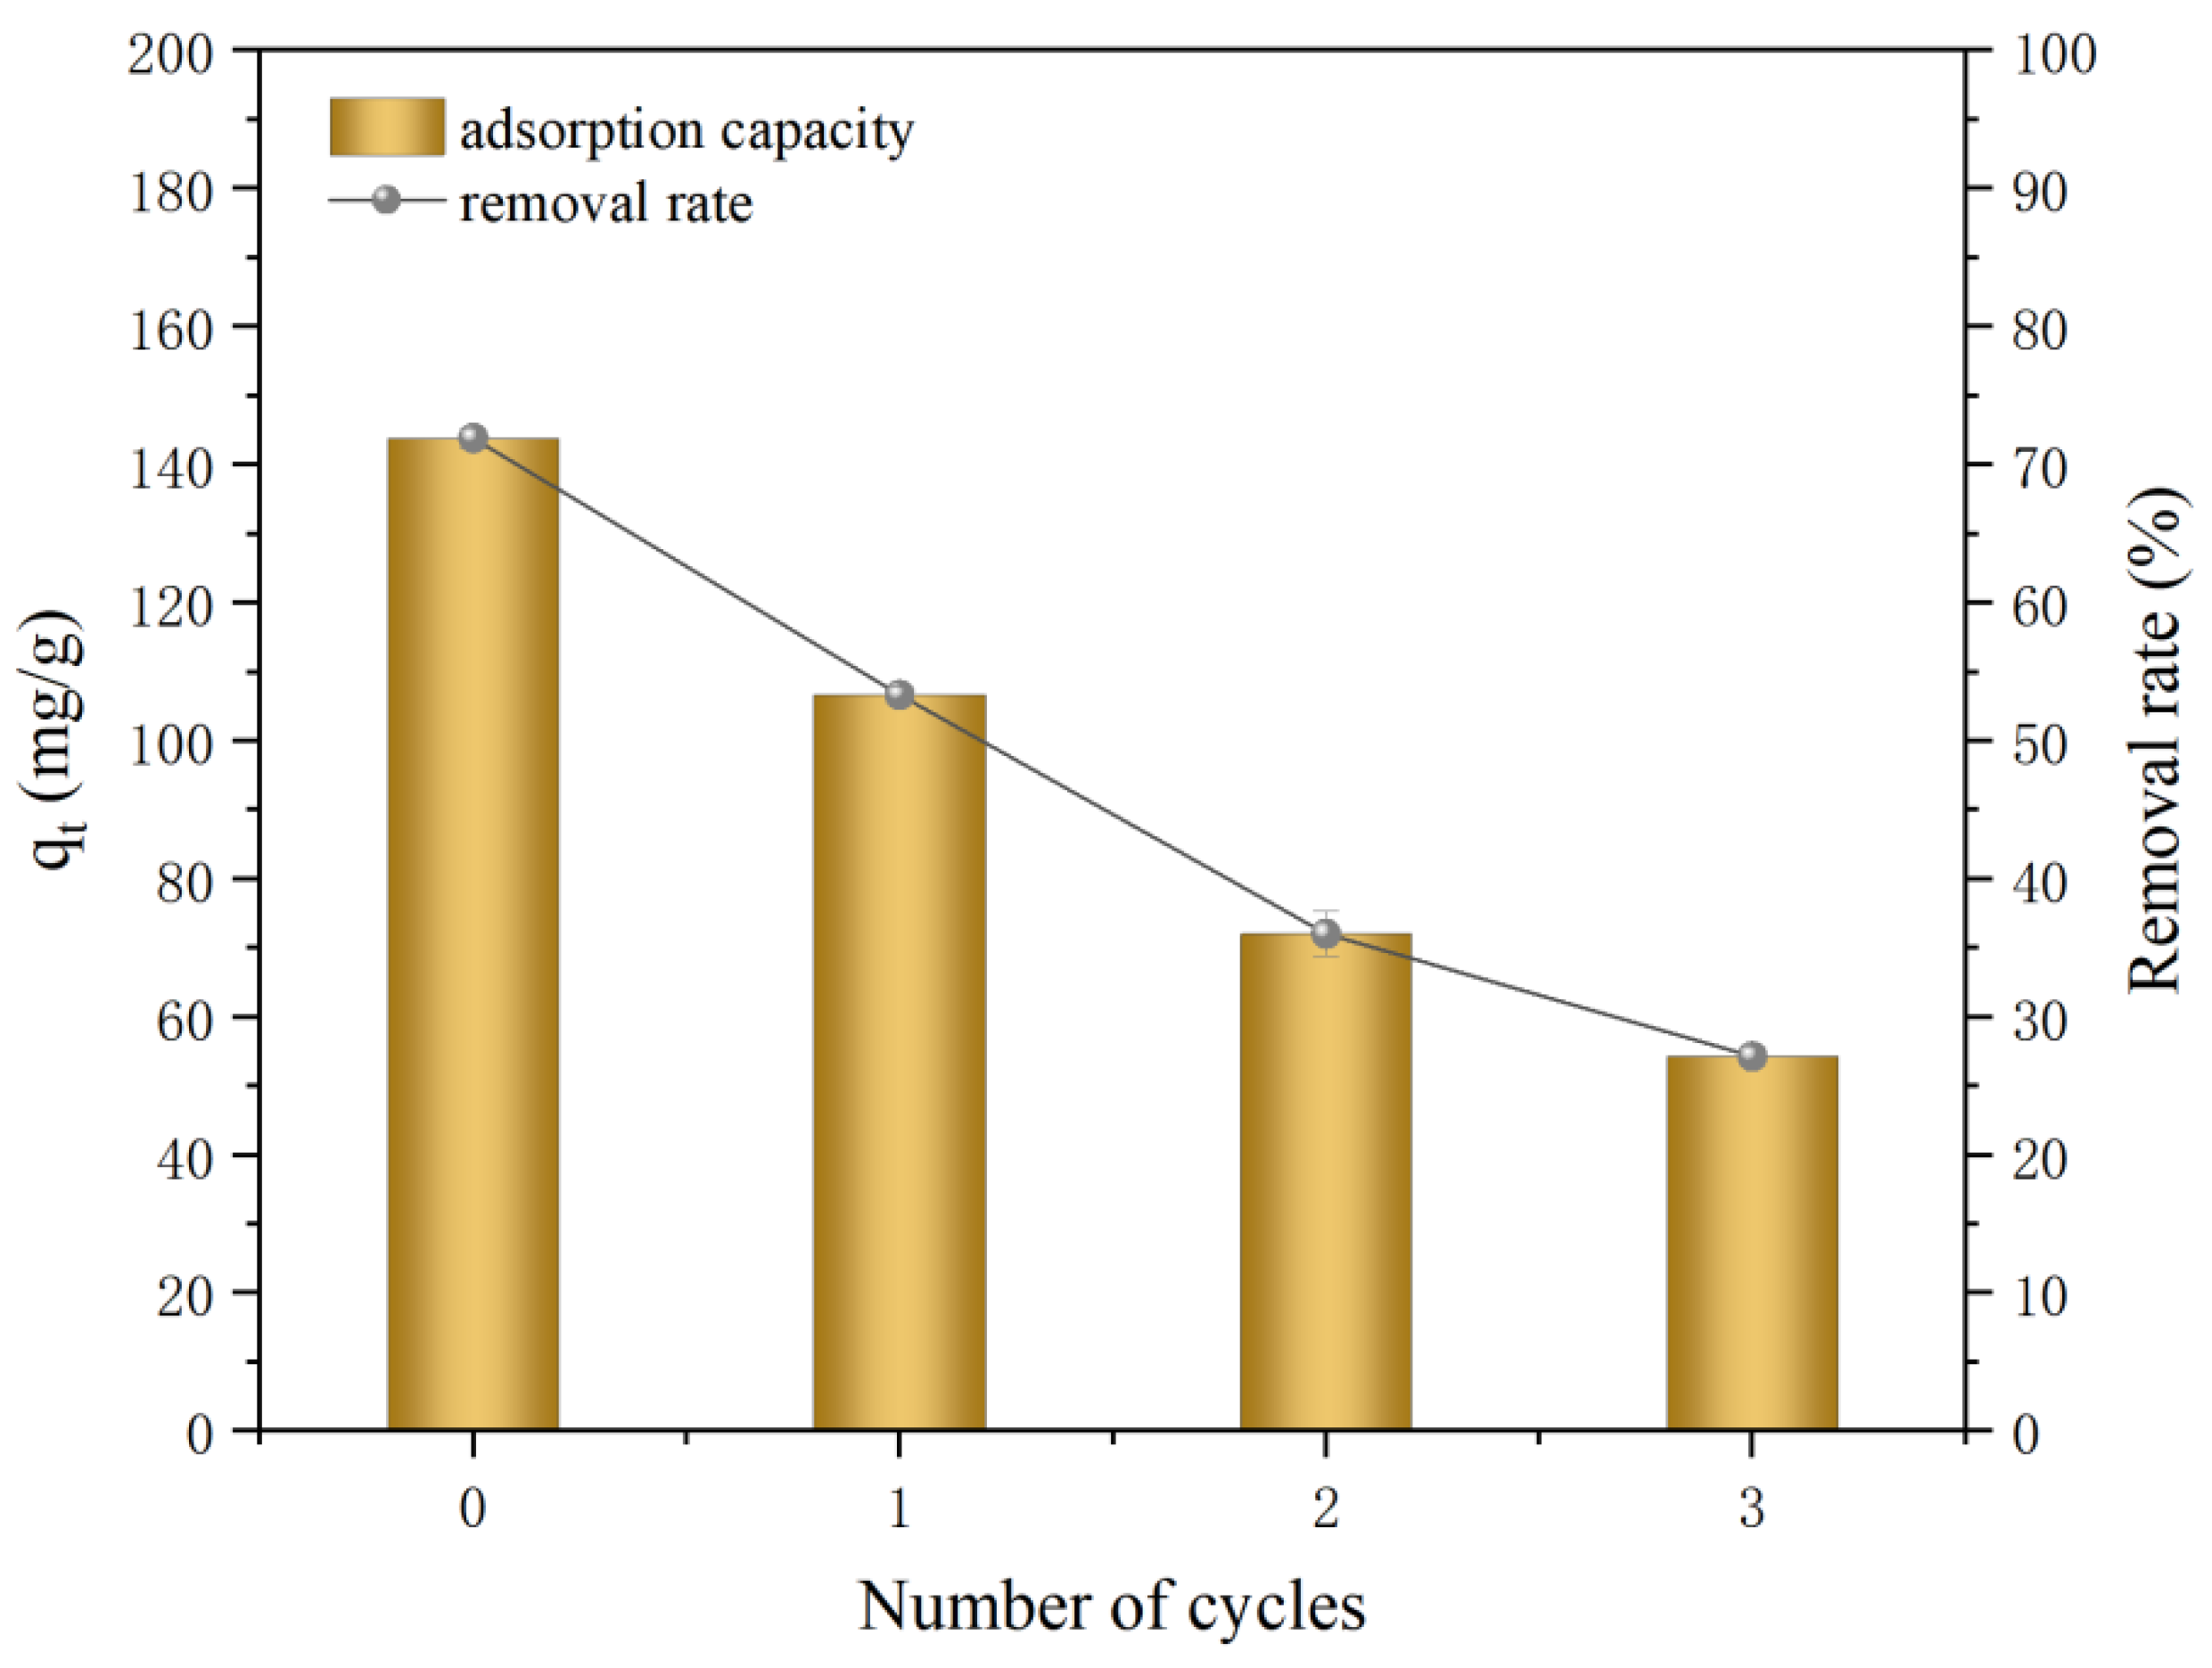
2.3.6. Material Recycling Experiments

The reacted nZVI@ATP material was rinsed repeatedly with 0.5 mol/L of dilute nitric acid, centrifuged, and filtered. The treated material was placed in a vacuum drying oven, stored in a heated vacuum for 12 h, and then removed, ground, and sieved. Subsequently, it was added to a 30 mL Ni2+ solution with a concentration of 200 mg/L at a dose of 1 g/L of nZVI@ATP. The resulting solution was placed in a constant temperature water bath shaker and shaken at 25 °C. The solution was then placed in a thermostatic water bath shaker and shaken at 25 °C and 220 rpm for 12 h; after which, it was removed. The remaining Ni2+ concentration was measured for three consecutive cycles using the aforementioned method.

2.4. Characterization

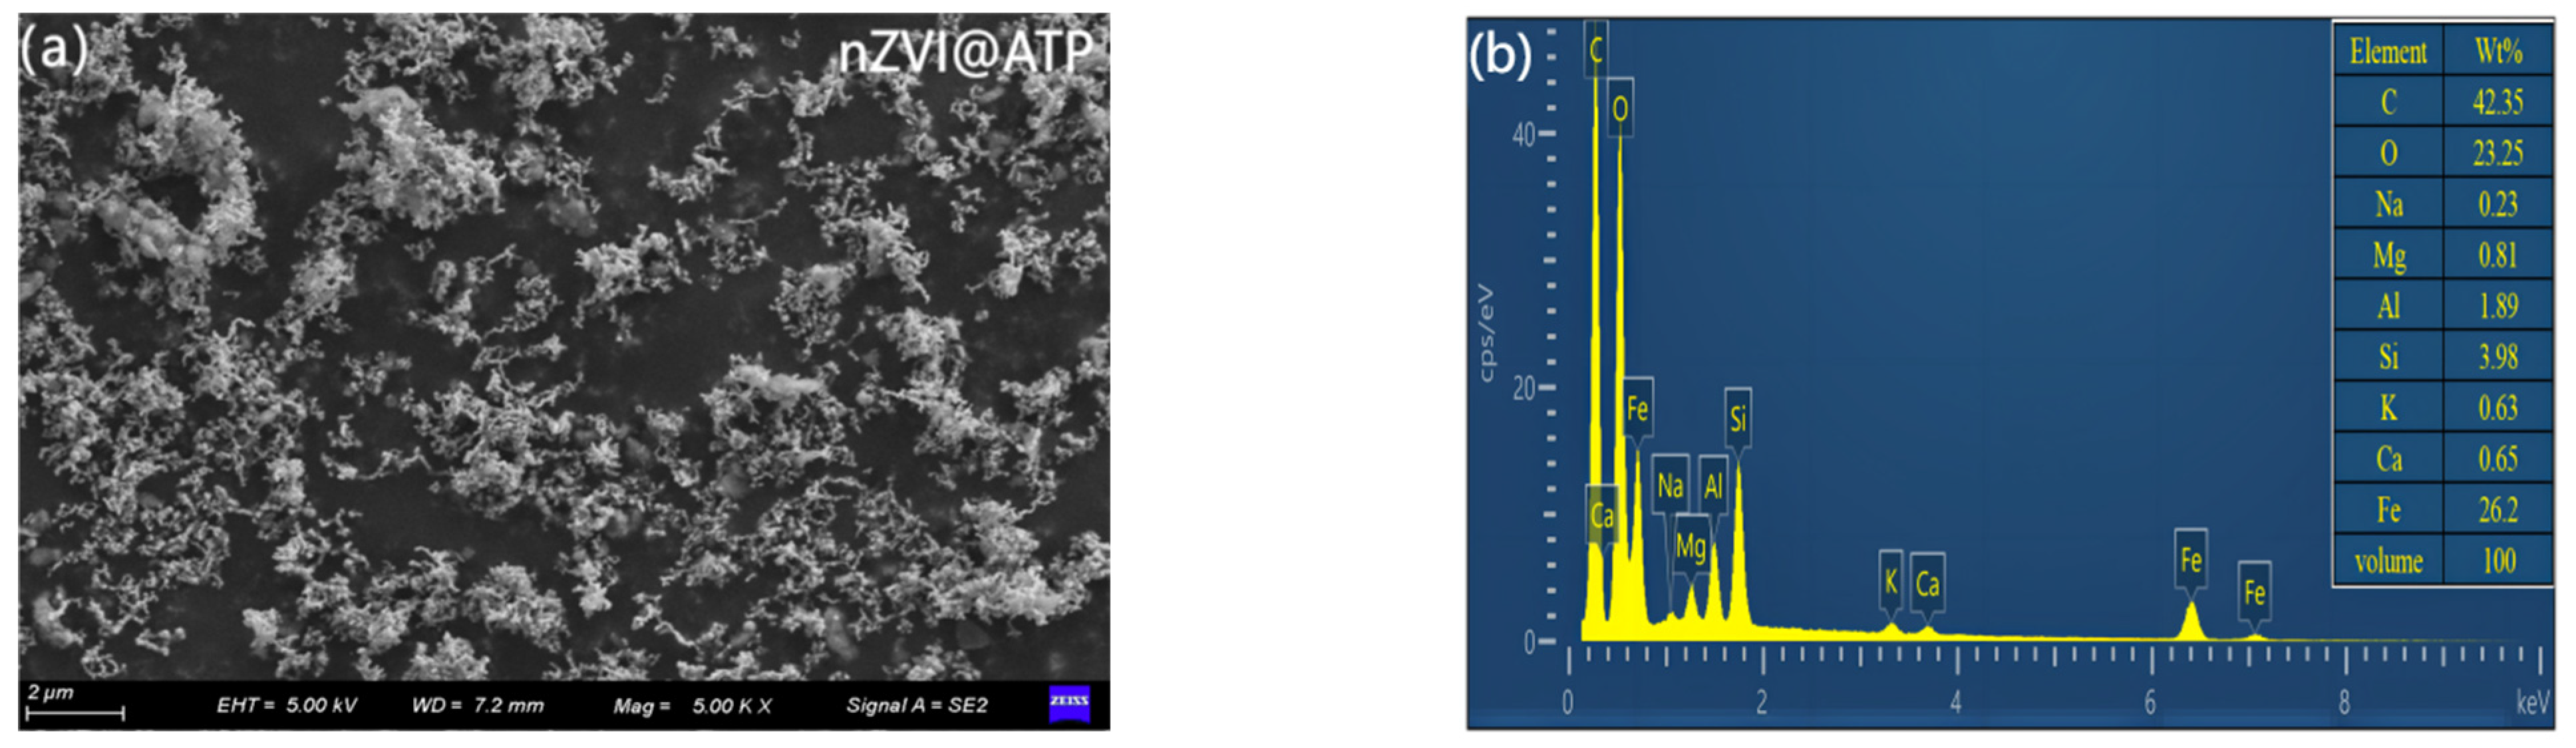
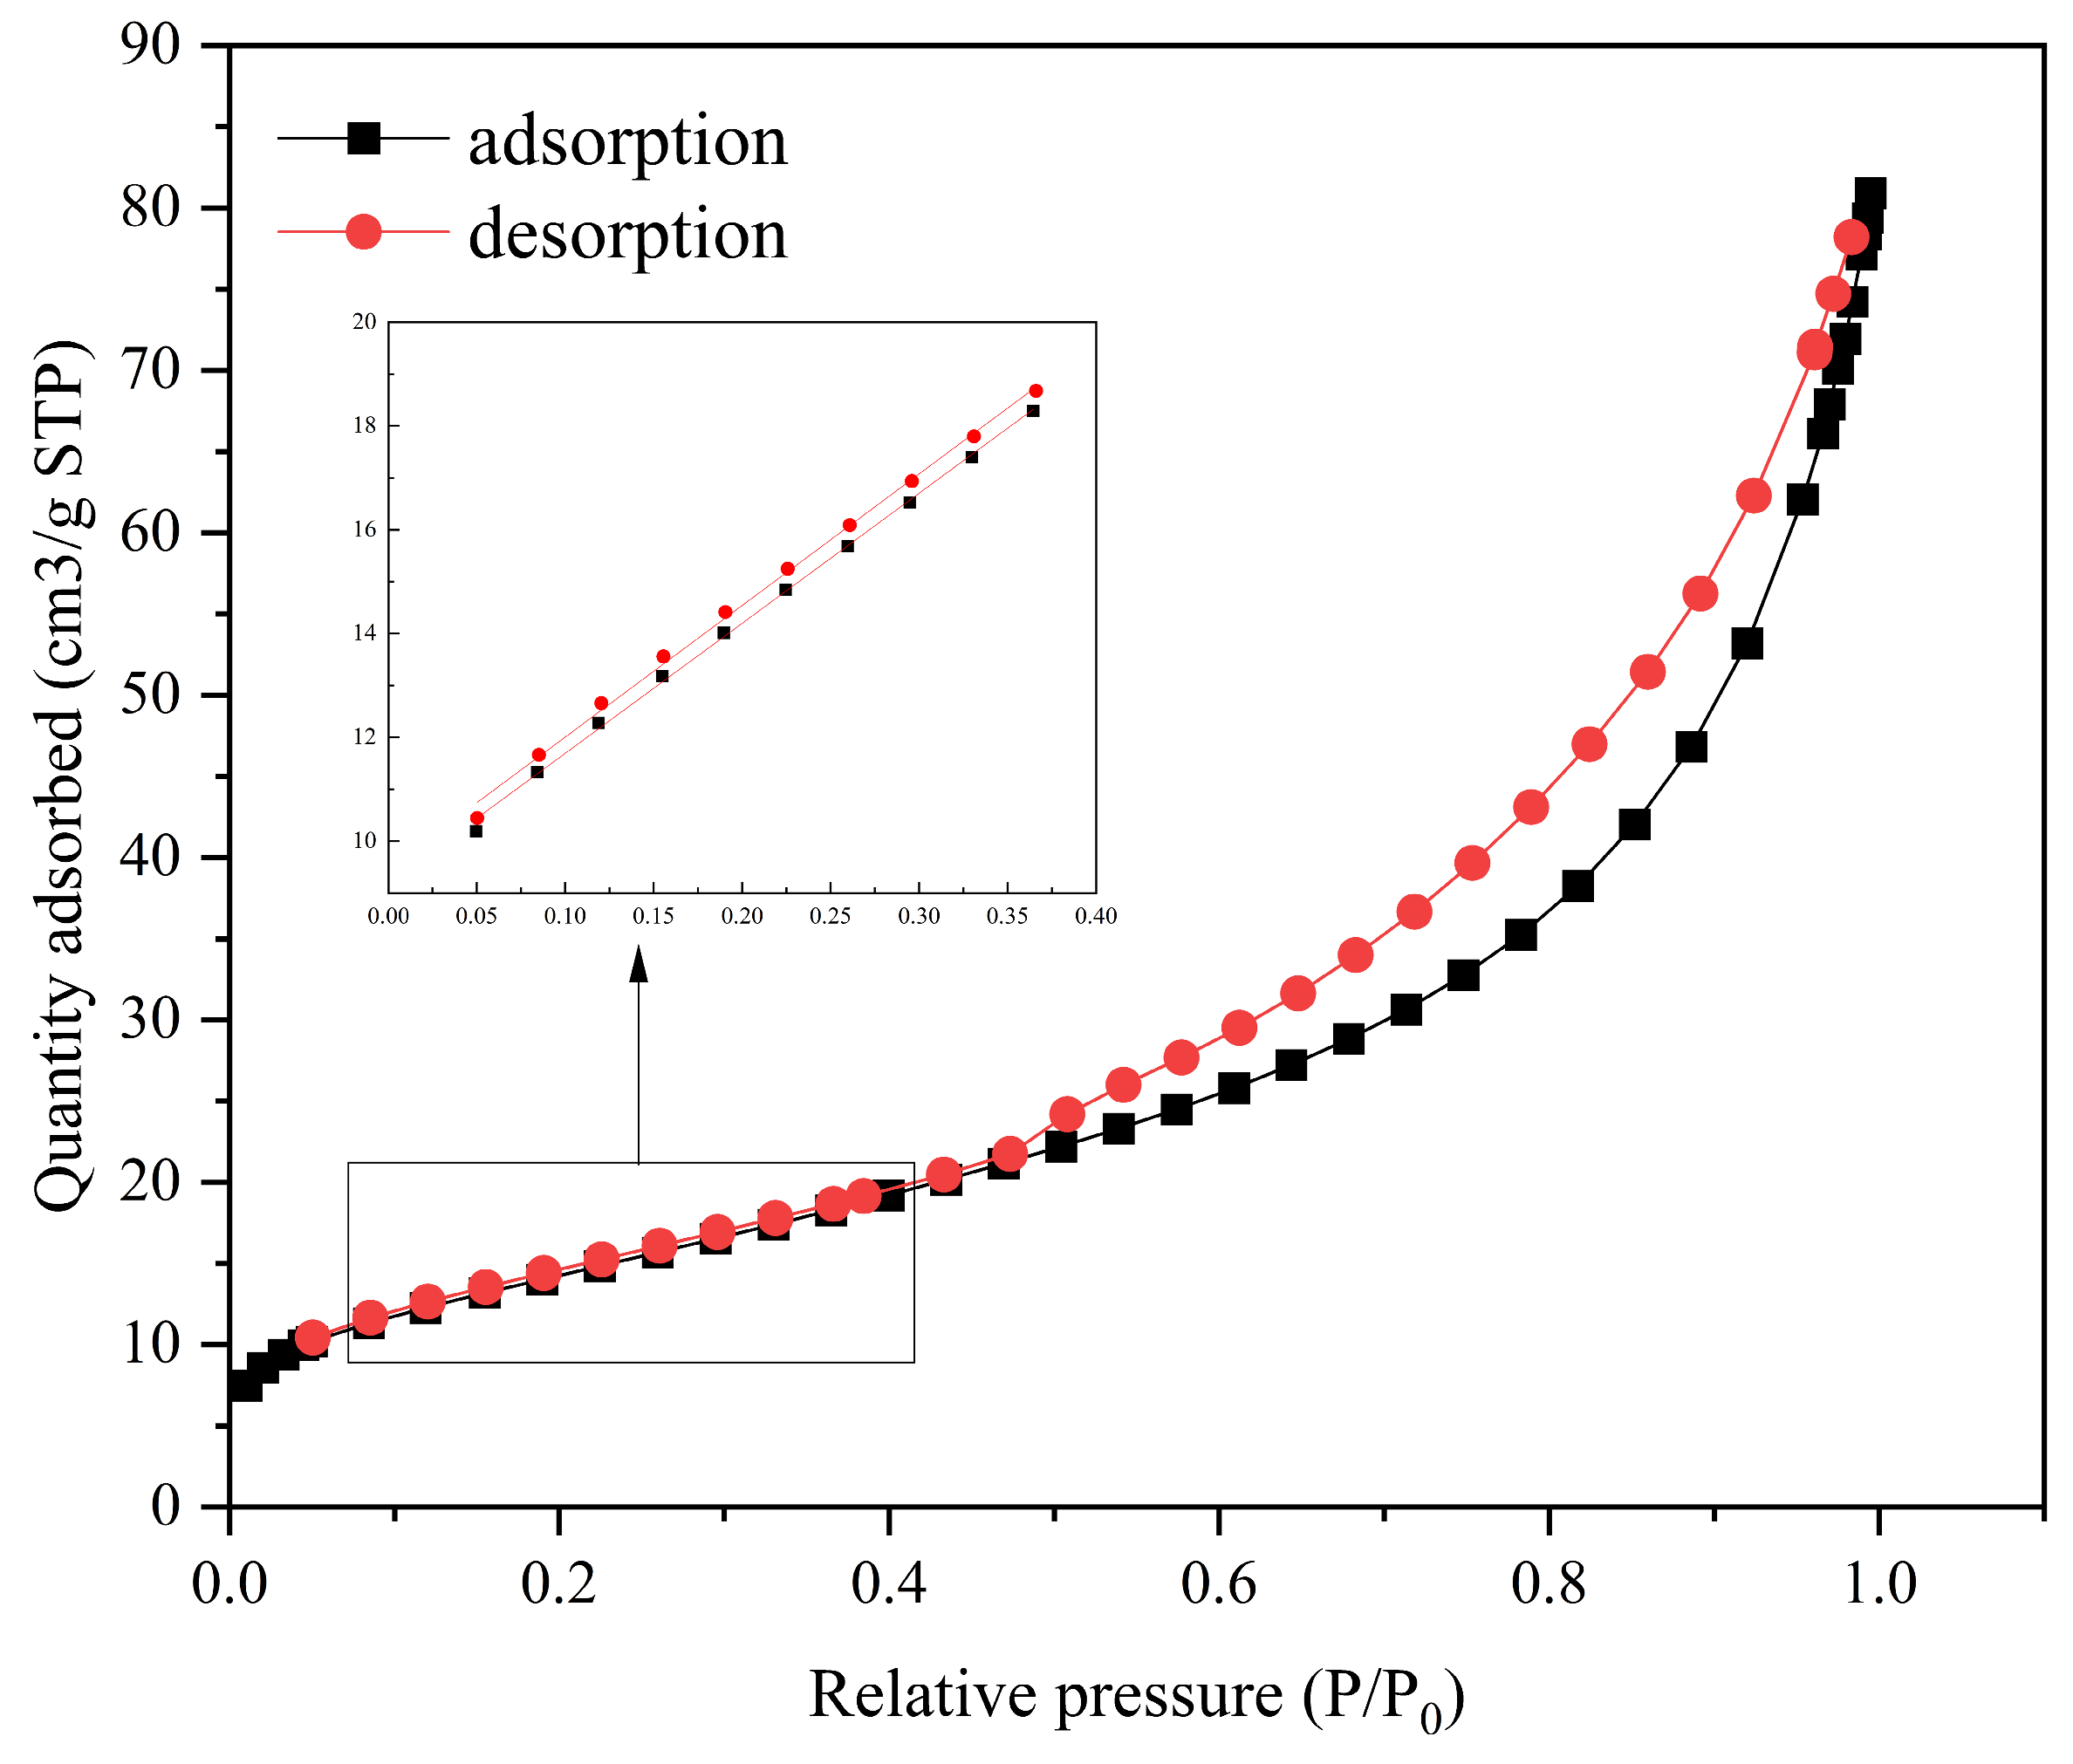
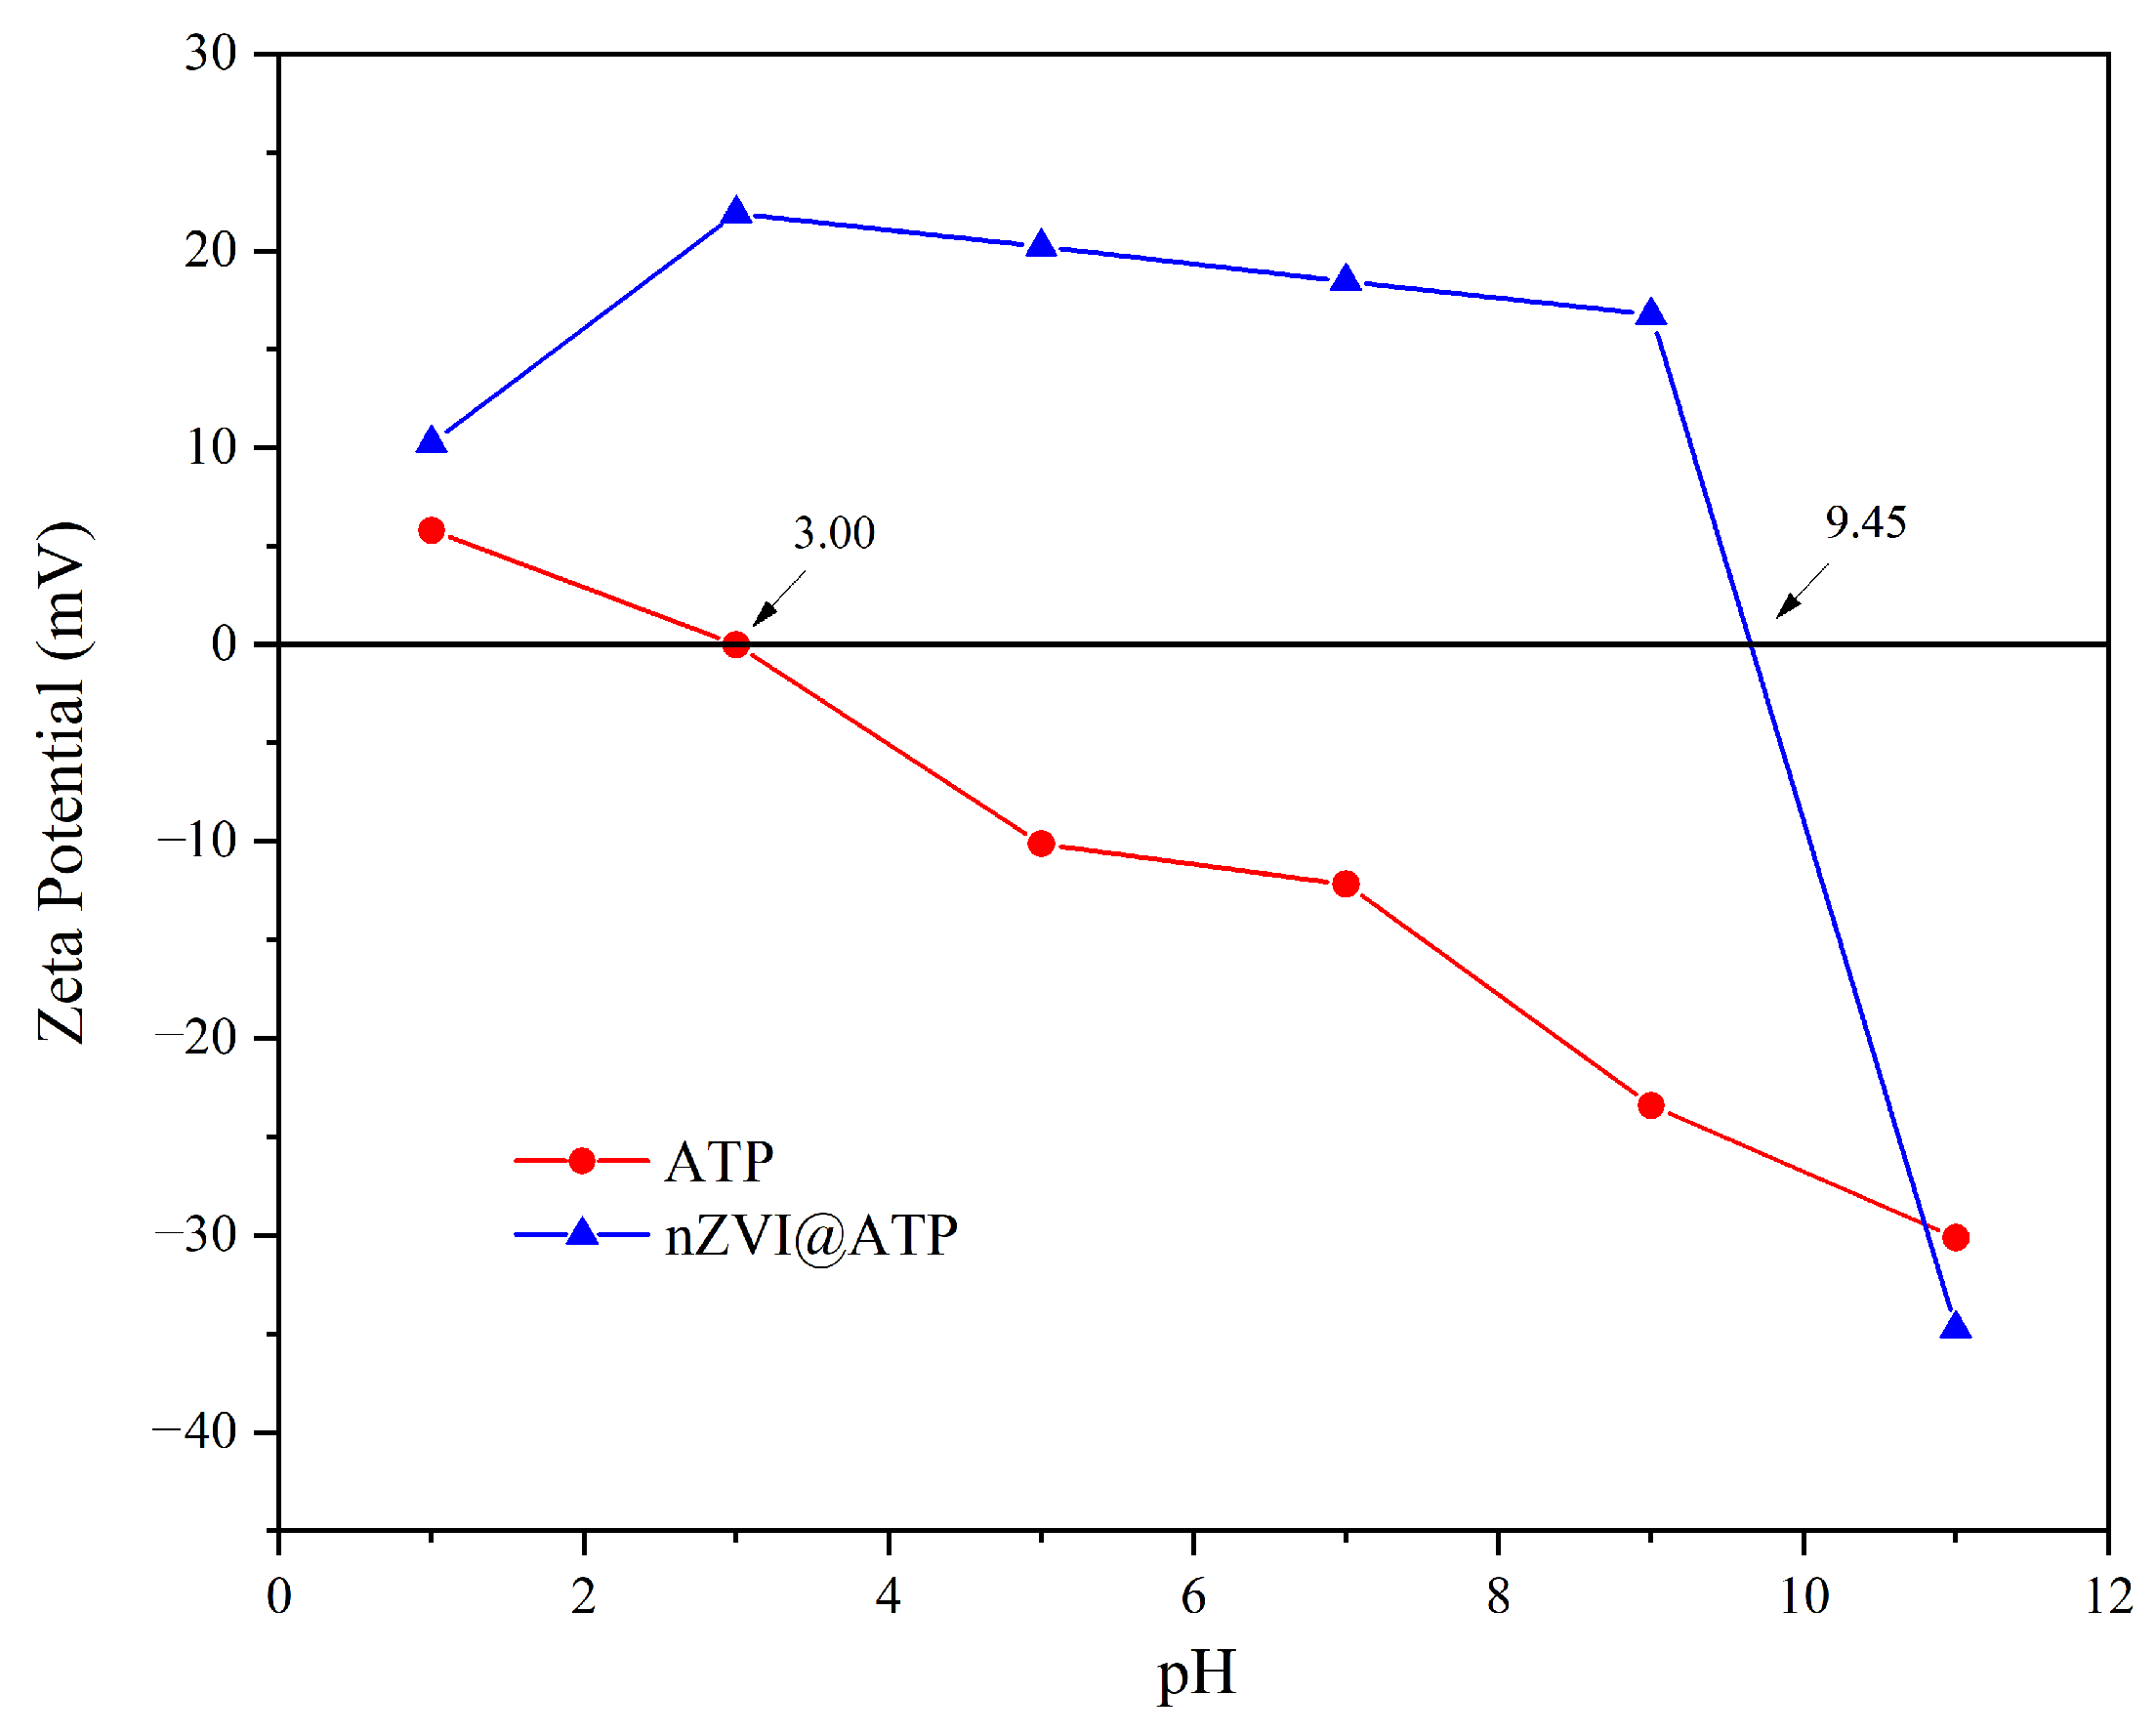
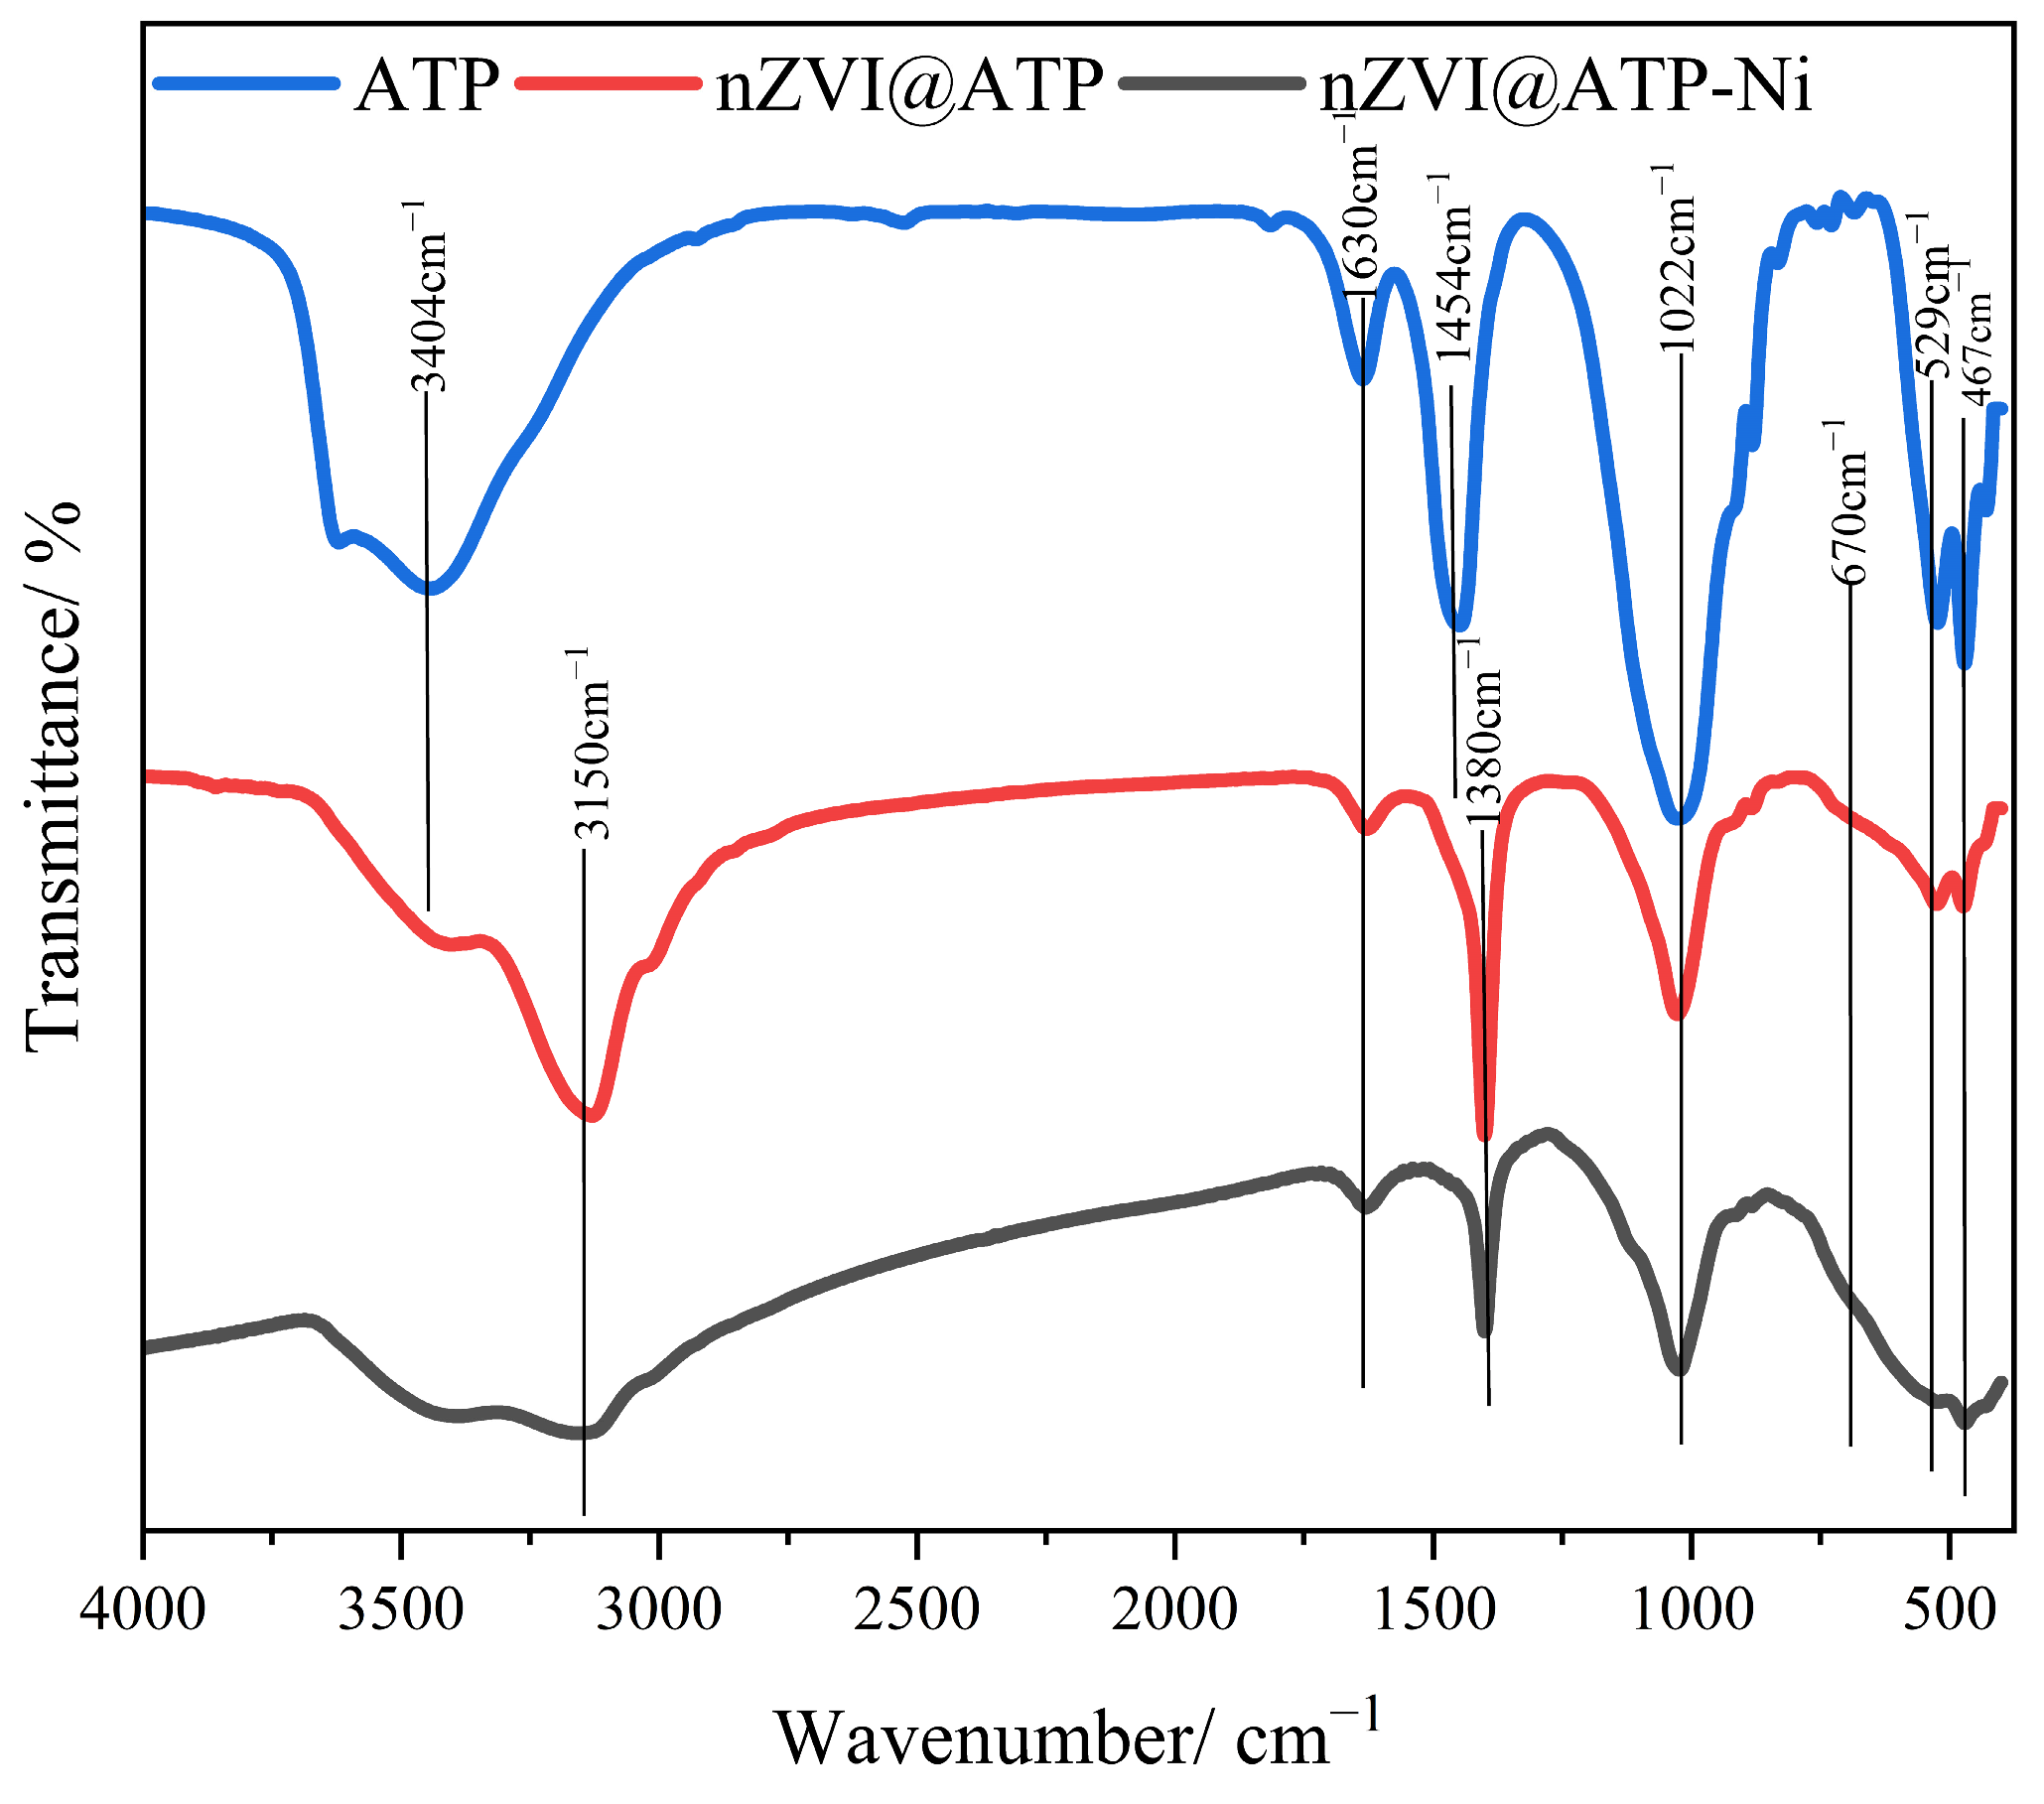
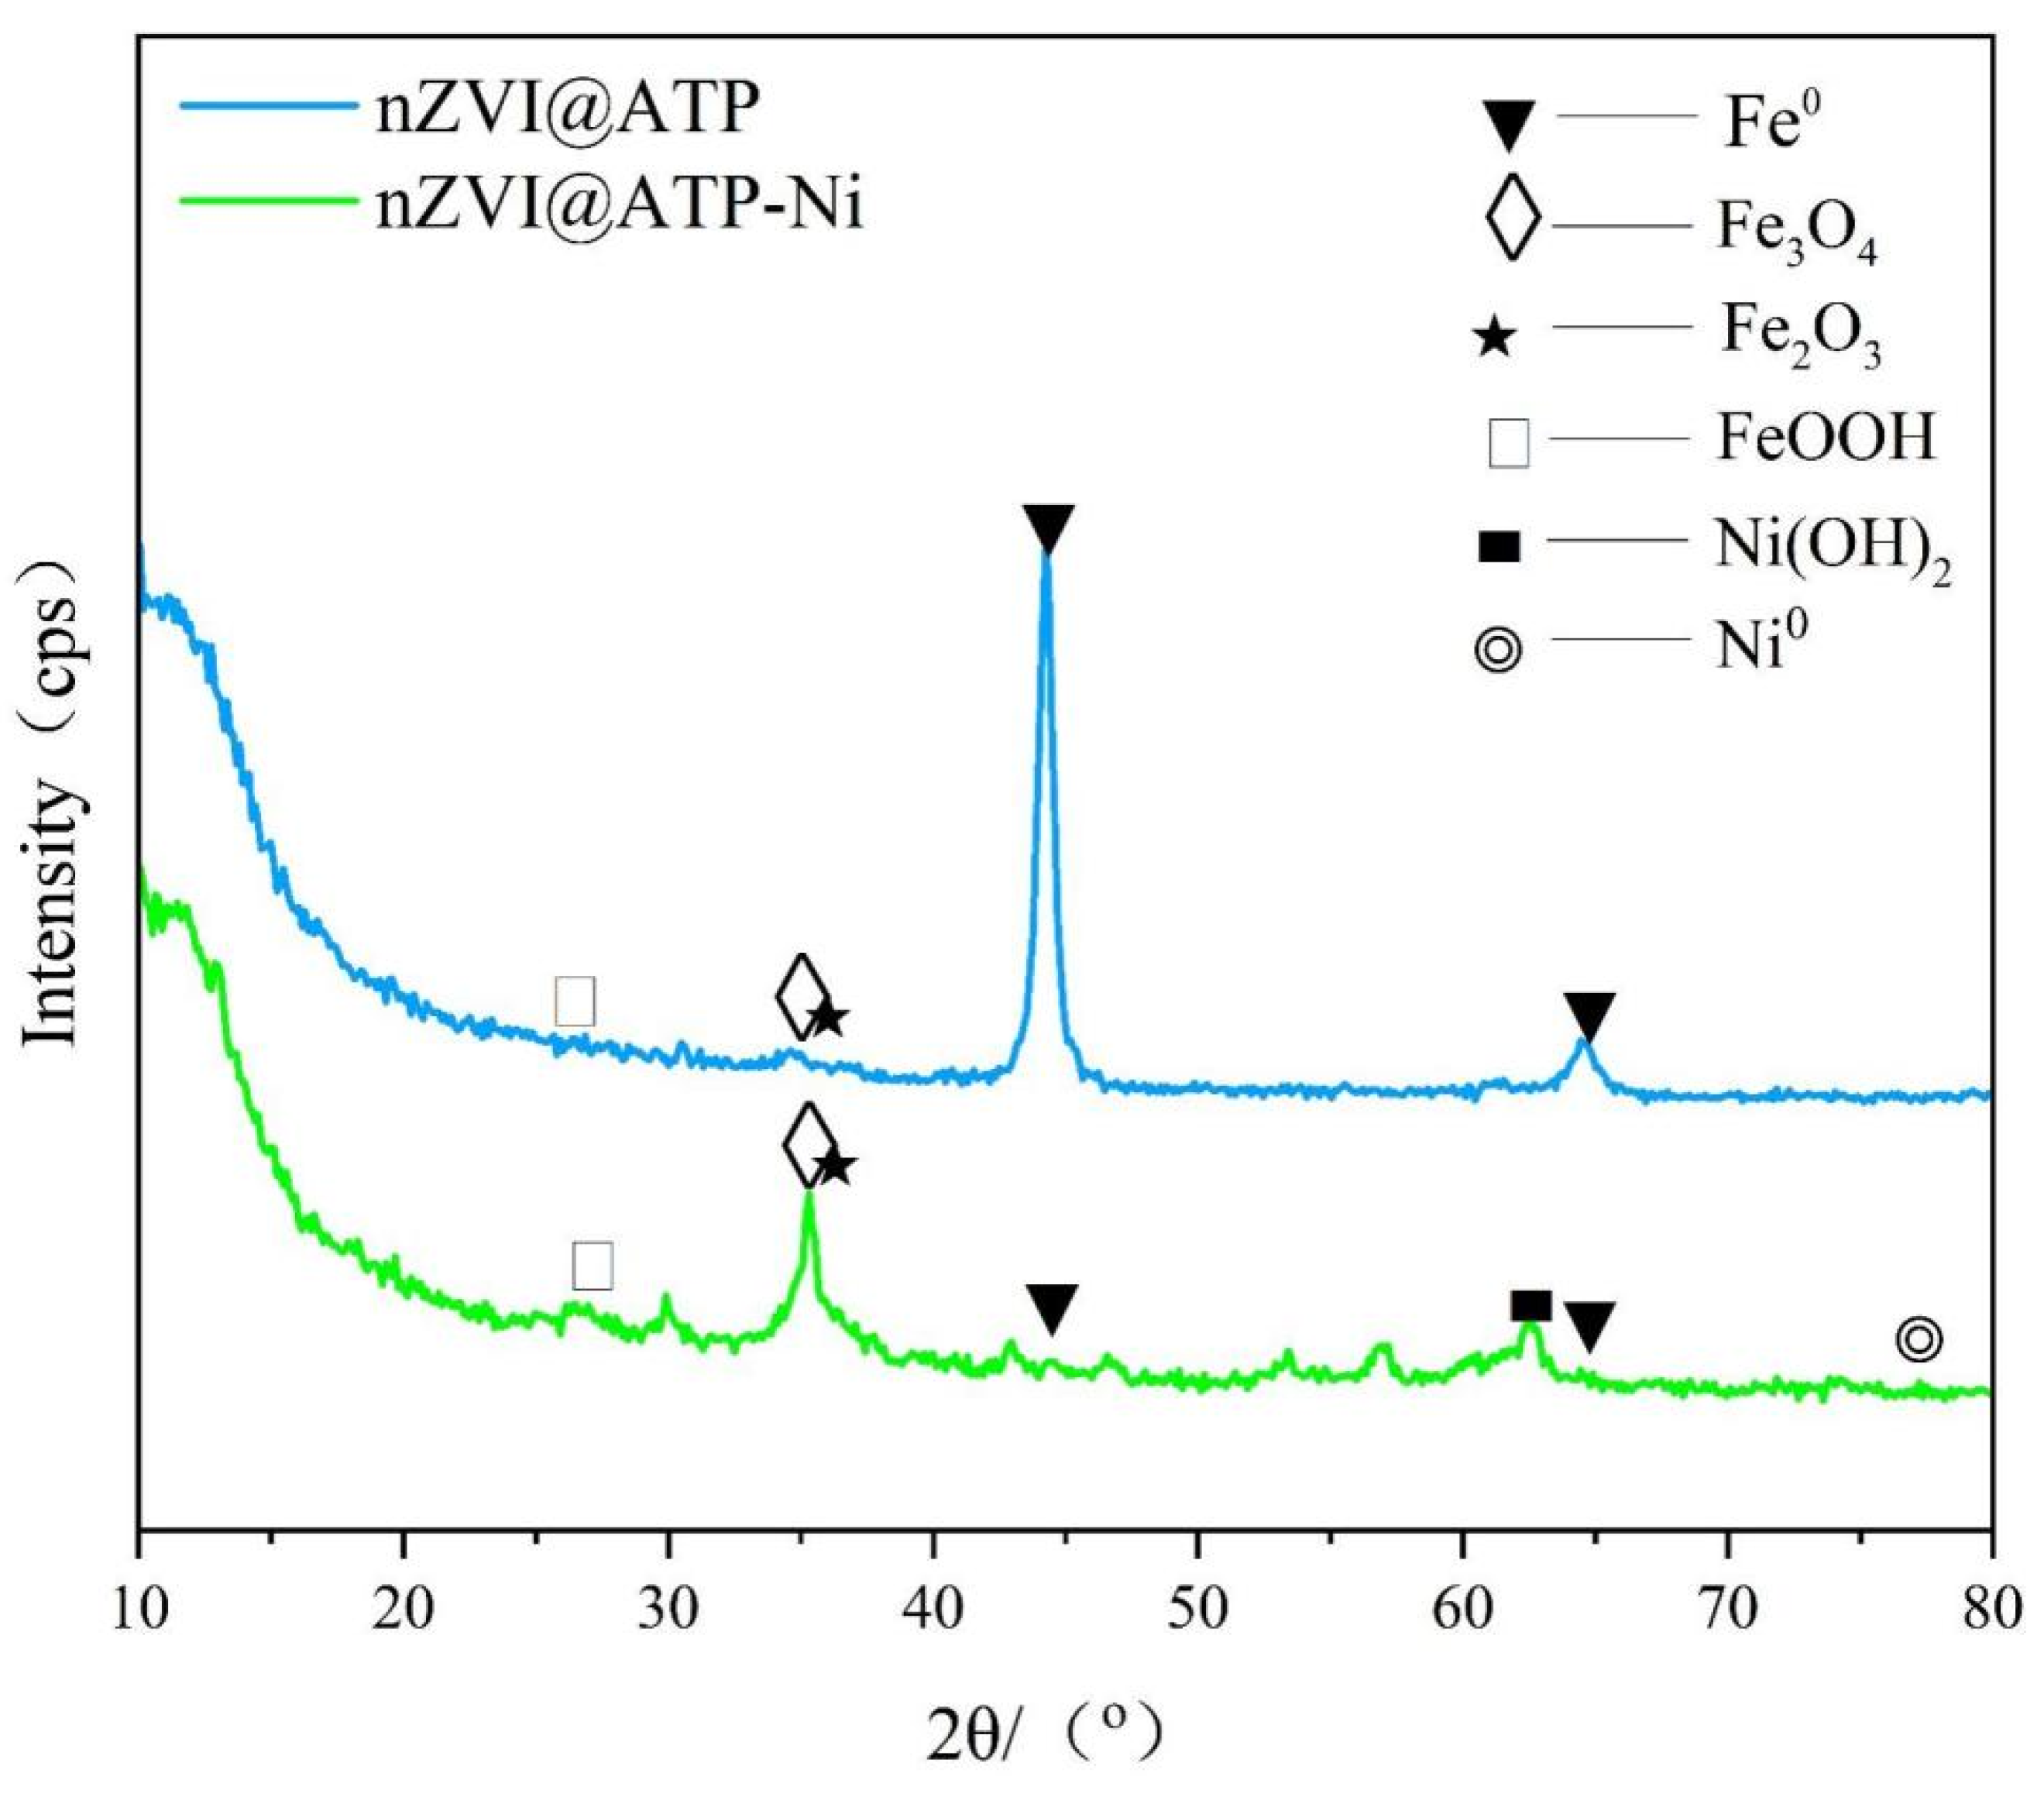
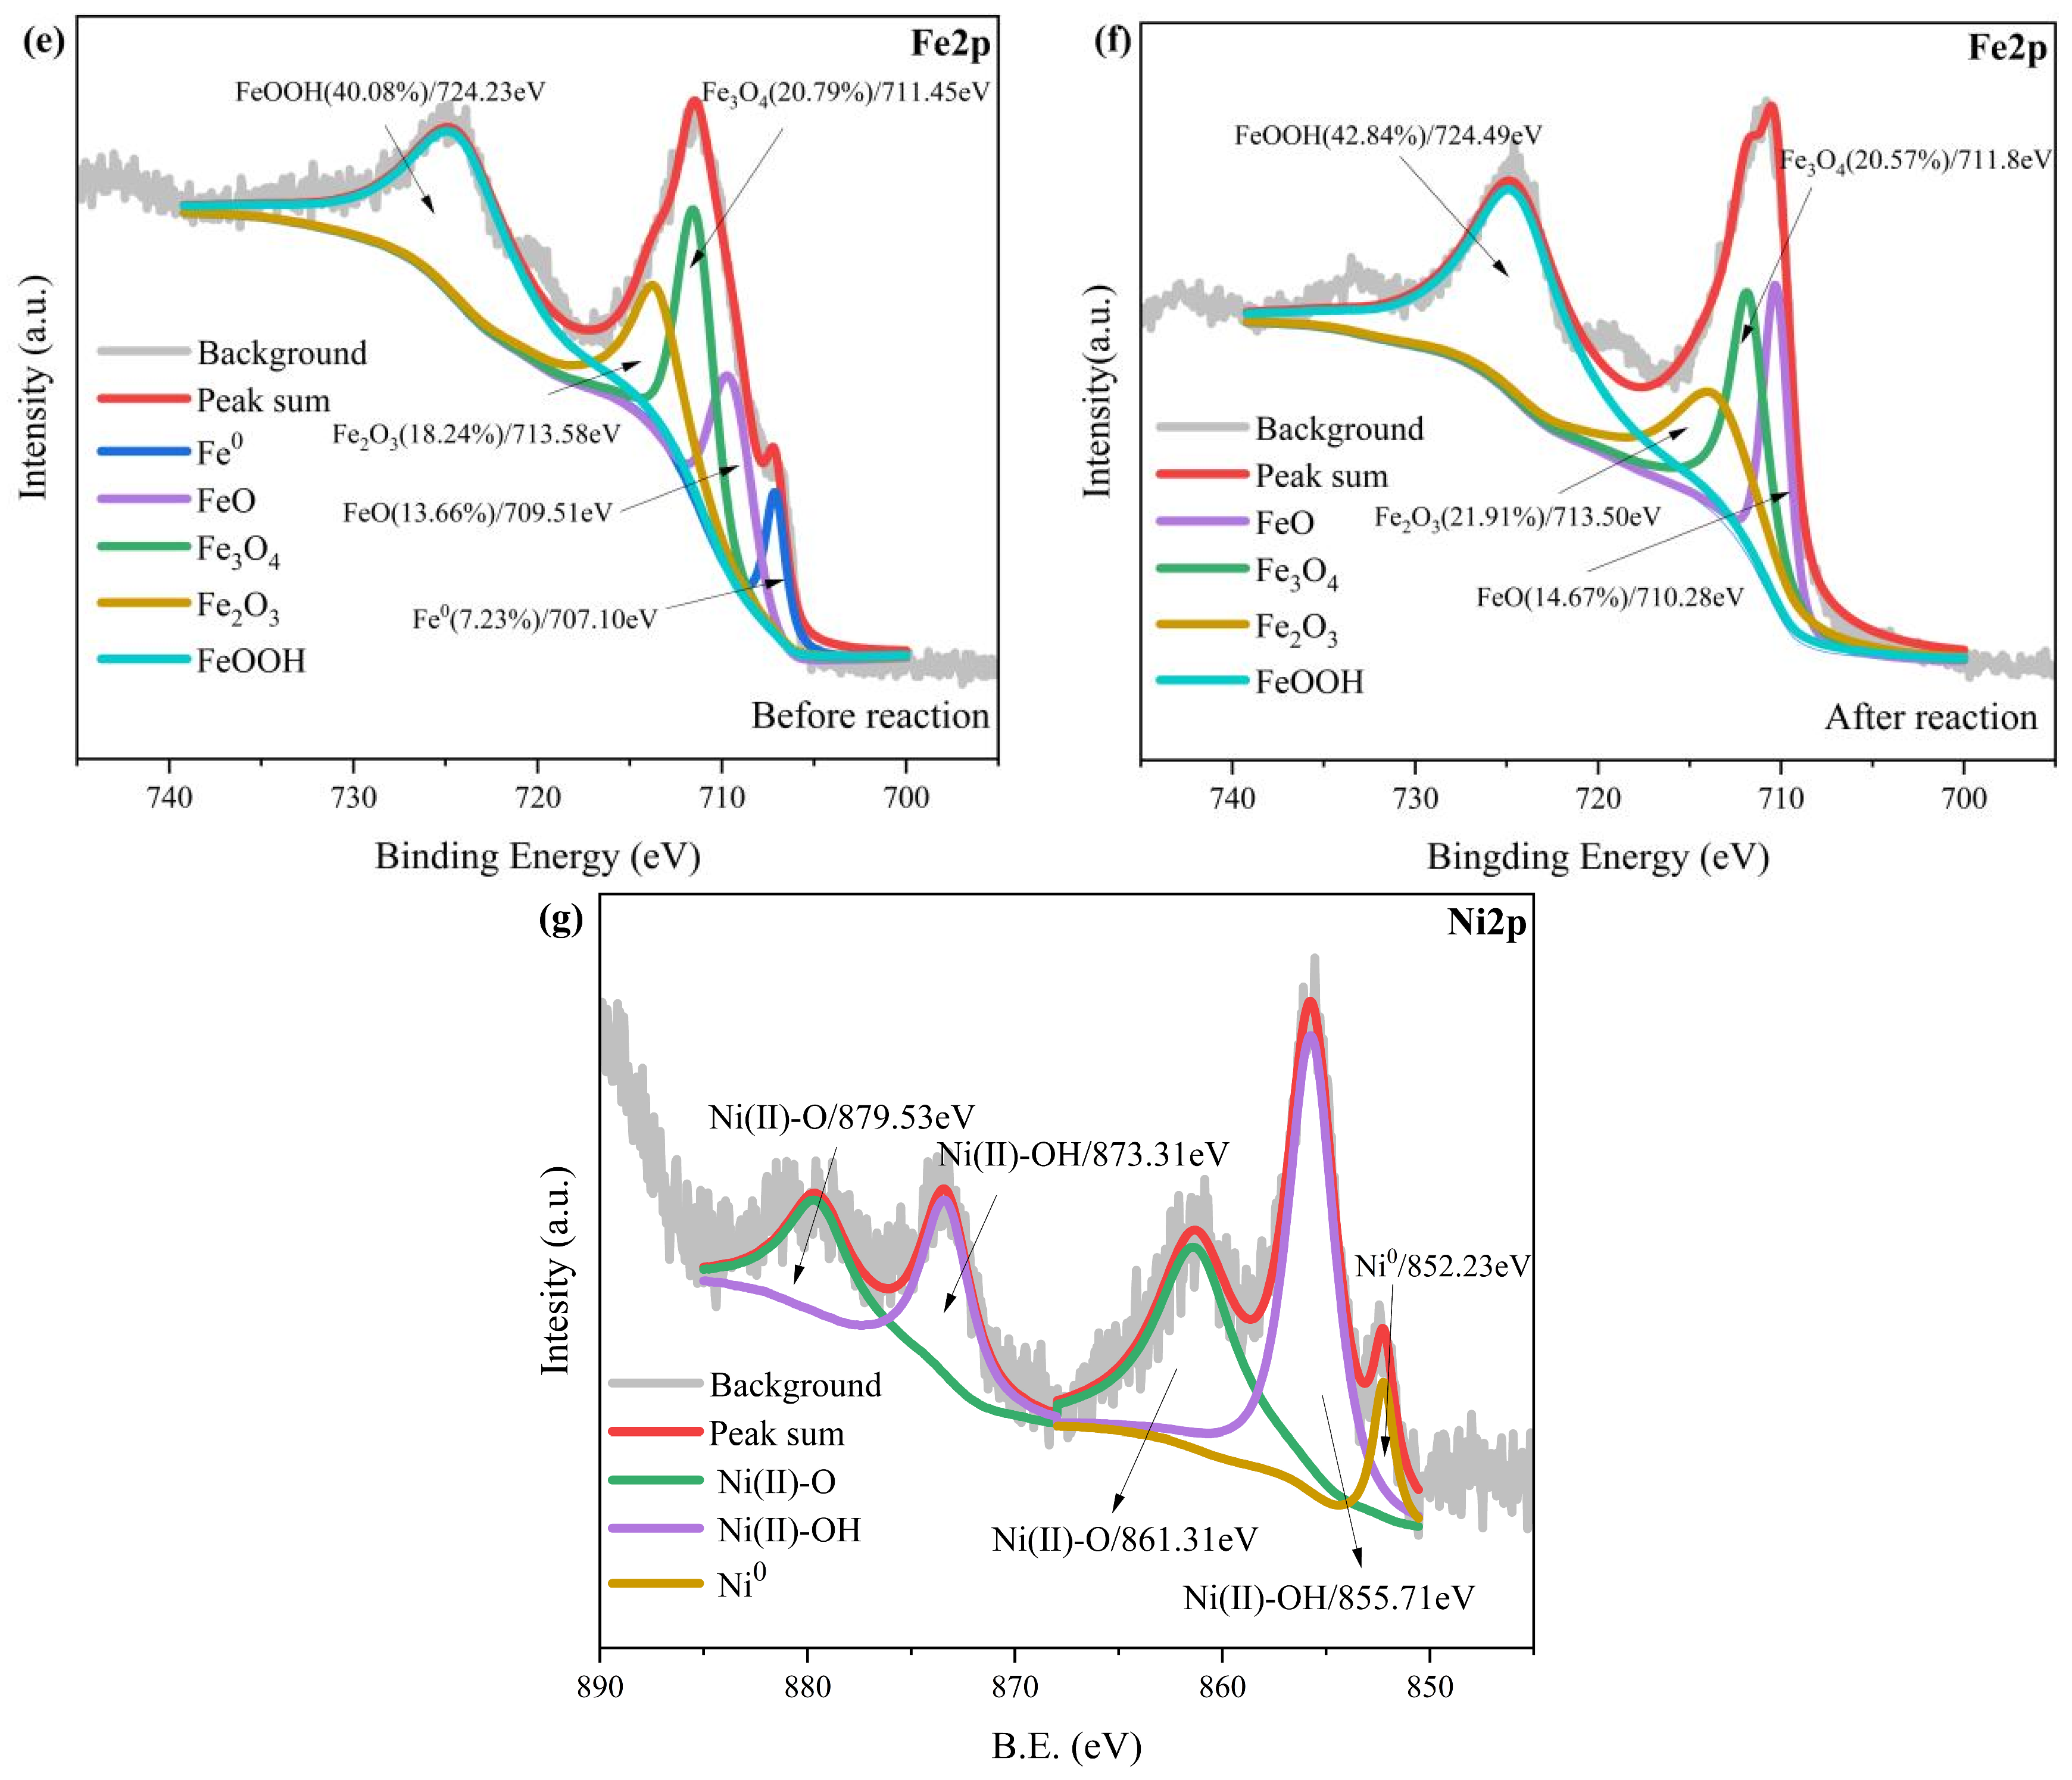
The morphology and elemental composition of the adsorbents were analyzed via SEM (GeminiSEM500, Carl Zeiss AG, Jena, Germany) and EDS (X-max ExtremeX, Oxford Instruments, Abingdon, UK). The specific surface area and pore size of the adsorbents were determined based on the Barrett Joyner Halenda (BJH) adsorption model and the t-plot micropore model using a specific surface area and porosity analyzer (BET, ASAP2020, Micromeritics Instruments, Norcross, GA, USA). XRD (Rigaku, Rigaku Corporation, Tokyo, Japan) was used to analyze the crystal structure and material composition of the adsorbents in the 2θ range of 2–80° using CuKα radiation. The functional groups of nZVI@ATP were analyzed at 4000–400 cm−1 via FTIR spectroscopy (Vertex70; Bruker, Ettlingen, Germany; 1 mg sample and 110 mg of KBr). The zeta potential of the samples was determined using a zeta potential tester (Nano-ZS90, Malvern Panalytical, Malvern, UK). XPS (Kratos AXIS Ultra DLD, Kratos, Manchester, UK) was performed to analyze the valence states of the major elements in the adsorbents after calibration based on the C1s peaks. The Ni2+ concentration in aqueous solutions was determined via FAAS (220FS, Varian, Palo Alto, CA, USA).

2.5. Data Processing Methods

Three parallel samples were used for the abovementioned experiments; the results were averaged, and the standard deviations were calculated using Excel. The experimental data were processed and plotted using Origin 2019b. The adsorption amount (qe, mg/g) and removal rate (R, %) were calculated as follows:
q e = ( C 0 C e ) V m
R = ( C 0 C e ) C 0 × 100 %
where qe is the sorption amount, mg/g; C0 denotes the initial concentration of the pollutant, mg/L; Ce denotes the remaining concentration of the pollutant, mg/L; V is the volume of the pollutant solution, L; and m is the material dosing amount, g.
The equations for the pseudo-first-order, pseudo-second-order, and Weber–Morris models are as follows [24,25,26,27,28]:
d q t d t = k 1 ( q e q t )
d q t d t = k 2 ( q e q t ) 2
q t = k d t 1 2 + E i
where qt denotes the amount of pollutants adsorbed by nZVI@ATP at moment t, mg/g; k1 is the quasi-primary kinetic equation rate constant, g/(mg·h); k2 is the quasi-secondary kinetic equation rate constant, g/(mg·h); kd is the rate constant of the intraparticle diffusion equation, mg/(g·h1/2); and Ei denotes the intercept, mmol/g.

3. Results and Discussion

3.1. Effect of the Mass Ratio of Fe(0) to ATP

Figure 1 shows the Ni2+ removal efficiencies of different materials. The Ni2+ removal efficiencies of the nZVI@ATP composites exceeded those of the pure ATP at different Fe-to-ATP ratios. The removal efficiency of nZVI@ATP for Ni2+ first increased and then decreased with an increasing iron–ATP ratio and was the highest at the iron–ATP ratio of 2:1 (reaching 71.93%). This finding demonstrates that the material at this particular ratio possessed the highest number of active sites. This characteristic ensures an adequate number of active sites and effectively prevents a decline in adsorption efficiency caused by issues such as nZVI agglomeration. A further increase in the Fe-to-ATP ratio resulted in a gradual decrease in adsorption performance, probably caused by the insufficient number of effective active sites due to the decreasing Fe0 content. Easy agglomeration and oxidation are factors impeding the full exploitation of the adsorption performance of pure nZVI. Notably, when the ATP was used for loading, the nZVI agglomeration phenomenon considerably improved and more active sites were involved in the reaction to improve the adsorption performance of nZVI@ATP on Ni2+. Because the best adsorption performance of the composites on the Ni2+ was achieved at an iron–ATP of 2:1, the adsorption performance and mechanism were studied based on this ratio in subsequent experiments.

3.2. Characterization

3.2.1. SEM–EDS Analysis

From the SEM image in Figure 2a, it can be observed that numerous spherical particles with a particle size of about 80–120 nm were gathered on the ATP. The spherical particles were supposed to be nZVI, and the nZVI was in the form of chains. By analyzing the spectra obtained by EDS in Figure 2b, the chemical element composition of the sample can be obtained as Mg, Al, Si, Ca, K, and Fe. ATP mainly contains Mg, Al, Si, Ca, and K, and the main element of nZVI is Fe. It can be seen that the EDS results show that the nZVI@ATP contains all of these elements, which can indicate that the nZVI is successfully loaded on the bumpy rods, and the relative content of Fe is 26%. nZVI@ATP has a nanoscale structure, and the larger surface area contributes to a higher reactivity and provides more active sites. nZVI@ATP loading helps to enhance the stability of nZVI and prevents particle agglomeration and oxidation to a certain extent, which prolongs the nanoparticles’ lifetime and enhances their reactivity.

3.2.2. BET Analysis

The specific surface area of the nZVI@ATP was analyzed to obtain the specific surface parameters of the material, as well as the N2 adsorption and desorption curves (Figure 3 and Table 1). The N2 adsorption and desorption curves were isotherms of type IV(a). The isotherm and adsorption model analysis revealed that the nZVI@ATP had a mesoporous structure (2–50 nm), with a specific surface area and an average pore size of 51.79 m2/g and 9.22 nm, respectively; the specific surface area of the nZVI@ATP exceeded that of the nZVI (15–34 m2/g) [29]. This finding indicates that ATP exerts a good dispersion effect on nZVI and can effectively alleviate its easy agglomeration.

3.2.3. Zeta Potential Analysis

Figure 4 depicts the variation in the zeta potential of ATP and nZVI@ATP with pH. The zeta potential of ATP tended to decrease with an increasing pH, with an isoelectric point of 3.0. The ATP surface was positively charged for the solution with a pH < 3 and negatively charged for the solution with a pH > 3. However, the zeta potential of the nZVI@ATP tended to first increase and then decrease with an increasing pH, and its isoelectric point was about 9.40. When the pH was 2–10, its zeta potential was greater than that of the ATP; this shift can be attributed to the negative charge of the ATP itself and the iron oxides produced upon oxidation on the nZVI surface [24].
The variation of the surface potential of the nZVI@ATP under different pH conditions plays a crucial role in its effectiveness for Ni2+ removal. Under acidic conditions, ATP surfaces carry positive charges, facilitating the adsorption of Ni2+, while under alkaline conditions, the surface charge of nZVI@ATP becomes negative, promoting the removal of Ni2+. Overall, the collaborative effect of surface potential changes and pH plays a critical role in the interaction and adsorption efficiency of substances during the reaction process.

3.3. Influencing Factors

3.3.1. Effect of Initial Ni2+ Concentration

Figure 5 shows the effect of the initial solution concentration on Ni2+ adsorption over time by nZVI@ATP. When the reaction was conducted for 12 h, the removal rate of the Ni2+ by the nZVI@ATP at an initial solution concentration of 100 mg/L reached 95.65%; however, the removal rate reached only 67.75% at an initial concentration of 300 mg/L. As the reaction proceeded, the removal rates of each group gradually tended to equilibrate after 2 h. The corresponding adsorption capacities were 95.65, 143.86, and 203.27 mg/g at initial solution concentrations of 100, 200, and 300 mg/L, respectively.

3.3.2. Effect of Dosage of nZVI@ATP

Figure 6 shows that the removal rate of Ni2+ by nZVI@ATP was only 56.87% at a dose of 0.5 g/L after 12 h of reaction. Conversely, the removal rates of Ni2+ for the groups with dosing amounts of 1.5 and 2 g/L reached 100% after only two hours. This was because increasing the dosing amount increased the number of active sites on the material surface, thereby enabling an effective pollutant–material reaction [30]. As the reaction proceeded, the removal efficiency of each group gradually decreased after 1 h, which was due to the progress of sorption leading to saturation of the sorbent, resulting in decreased reactivity [17].

3.3.3. Effect of pH

Figure 7 shows that the solution pH substantially affected the removal of Ni2+ by nZVI@ATP. For an initial pH of 2.0–5.0, the Ni2+ removal rate sharply increased from 73.2 to 143.87 mg/g, and the solution pH increased from 2.75 to 7.42 after the reaction. For an initial pH of 5.0–7.0, the Ni2+ removal rate by the nZVI@ATP decreased slightly, and the solution pH increased from 7.42 to 7.88 after the reaction. Notably, for the initial pH of 2.0–5.0, the excess H+ in the solution competing with Ni2+ for the active sites of the material necessitated a lower removal rate. As the initial pH of the solution kept increasing, increasing hydroxide ions in the water promoted the generation of Ni(OH)2 precipitation, resulting in an improved removal performance [31]. We obtained the isoelectric point of nZVI@ATP as 9.40 (Figure 3). At pH < 9.40, the nZVI@ATP surface was positively charged, and electrostatic repulsion existed between the nZVI@ATP and Ni2+, which hindered the removal of Ni2+ by the nZVI@ATP. In addition, with the increasing pH, the deprotonation was enhanced, and the surface electronegativity of the nZVI@ATP gradually increased; this competitive relationship gradually weakened, the Ni2+ removal rate by the nZVI@ATP increased, and the highest Ni2+ removal rate by the nZVI@ATP was reached at a pH of 5. The increasing pH of the solution after the reaction can be attributed to the reaction between the nZVI and water to produce excess OH, which increases the pH of the solution [24]. In addition, ATP, as an alkaline substance, plays a role in increasing the pH after the reaction [14].

3.4. Kinetics

Figure 8 shows the kinetic and intraparticle diffusion fitting curves of Ni2+ adsorption by nZVI@ATP. The adsorption capacity of the nZVI@ATP on Ni2+ in the solution gradually tended to equilibrium after 6 h (Figure 8a). The adsorption process was divided into three stages: 0–1 h was the fastest stage; 1–6 h was a slow stage; and 6–12 h was a stage wherein adsorption gradually tended to equilibrium. At the beginning of the adsorption, numerous active sites on the surface of the nZVI@ATP and the high concentration of Ni2+ in the solution resulted in the fastest reaction rate. Further, as the reaction proceeded, the number of free active sites on the surface of the composite material gradually decreased; the pores on the material surface were blocked; and the adsorption rate gradually declined, which gradually attained equilibrium after 6 h.
The time dependence curves of the adsorption capacity of nZVI@ATP on Ni2+ were fitted using pseudo-first-order, PSO, and Weber–Morris models. The fitted equations are shown in Equations (4)–(6), and the fitted parameters are listed in Table 2 and Table 3. The correlation coefficient R2 of the pseudo-first-order kinetics was 0.7830, and the adsorption capacity gradually deviated from the actual capacity after 1 h as the reaction proceeded, indicating that the pseudo-first-order kinetics favored only the early stage of the reaction. The correlation coefficient of then PSO kinetics was 0.9729, significantly exceeding that of the quasi-primary kinetics. In comparison, the equilibrium adsorption capacity obtained by fitting the quasi-secondary kinetic model was 144.9593 mg/g, which is comparable with the actual adsorption capacity of 143.8667 mg/g, indicating that quasi-secondary kinetics can better describe the adsorption of Ni2+ by composites and that the adsorption rate is mainly chemisorption [30,31,32,33]. To gain a clearer understanding of the adsorption performance of nZVI@ATP, we compared its adsorption efficiency with that of other materials for Ni2+. Table 4 presents a comparison of the adsorption performance of different materials on Ni2+. The advantage of nZVI@ATP over other adsorbents in removing the Ni2+ from solution suggests that nZVI@ATP has a greater potential for the removal of heavy metals.
The data were fitted using the Weber–Morris model, and the fitting results and parameters are shown in Figure 8b and Table 4. It can be learned that the removal process of Ni2+ by nZVI@ATP is divided into three stages. The surface diffusion process is from 0 to 1 h, which is the diffusion of Ni2+ to the surface of the material through the thin film layer on the surface of the material. The intra-particle diffusion process is between 1 and 4 h, which is the diffusion of Ni2+ to the interior of the material, at which point the rate of adsorption slows down and the majority of the active sites are on the outer surface of the nZVI@ATP. When the adsorption rate slows down and most of the active sites on the outer surface of the nZVI@ATP are occupied, the Ni2+ gradually diffuses to the inner surface of the particles, occupying the active sites inside the particles. When it gradually occupies the adsorption active center in the pores of the nZVI@ATP, the adsorption rate in the pores tends to zero and reaches the state of adsorption equilibrium, i.e., the third stage. The surface diffusion rate constant R12 was 0.9918, which was significantly higher than that of R22 and R32. The results indicated that the surface diffusion process could remove Ni2+ faster in the early stage of the reaction. As the reaction proceeded, the reaction rate was limited to a certain extent due to the high resistance of the boundary layer, which led to the slowing down of the reaction rate and eventually to the equilibrium [34]. The fitted plots showed that none of the fitted straight lines passed through the origin, indicating that the adsorption rate of Ni2+ by nZVI@ATP was limited by other factors such as surface diffusion and surface adsorption in addition to the main intra-particle diffusion.
Figure 5 represents the variation of Ni2+ removal by nZVI@ATP with the time at different initial concentrations (100 mg/L, 200 mg/L, and 300 mg/L). Figure 8 represents the kinetic analysis of Ni2+ adsorption by nZVI@ATP at an initial concentration of 200 mg/L. By comparing Figure 5 and Figure 8, it was found that both the adsorption amount and the removal rate increased with time, and the trend of both was almost the same, in which the results of the kinetic simulation experiments were similar to the removal rate results to the extent of 97.18%.

3.5. Recycling of Materials

Reusability is an important aspect of determining adsorbent applicability. Considering the readiness of Ni2+ to dissolve in dilute HNO3, 0.5 M of dilute HNO3 was used in the experiment to rinse the reacted material, followed by recycling. Figure 9 shows that the adsorbed amount of Ni2+ successively decreased from 143.86 mg/g to 106.67, 72.06, and 54.26 mg/g after the first, second, and third rinses, respectively. These decrements in the adsorbed amounts were mainly due to the continuous reaction depletion of the Fe0 material loaded on the ATP and the successive rinses, resulting in a significantly depleted nZVI amount.

3.6. Ni Removal Mechanism

3.6.1. SEM–EDS

SEM–EDS is an effective method to observe the surface morphology of a material while quantitatively analyzing its elemental composition. The SEM–EDS images of nZVI@ATP after adsorption are shown in Figure 10. Compared with the surface before the reaction (Figure 1), the surface of the adsorbed material was rough and had irregular flocs after the reaction (Figure 10a), probably due to Fe0 oxidation on the material surface and the generated iron oxides during the reaction. In addition, the adsorbent might have some insoluble complexes generated via the coordination reaction with Ni2+ in water [29]. As can be seen in Figure 1, no Ni was observed on the material surface before the reaction, while the Ni2+ content in the EDS pattern after the reaction (Figure 10b) was 11.82%, indicating the successful adsorption of Ni2+ by nZVI@ATP on the material surface.

3.6.2. FTIR

Figure 11 shows the FTIR spectra of ATP, nZVI@ATP, and nZVI@ATP after the reaction with Ni. The wavelength broadband of ATP at 3404 cm−1 was related to the vibrational peak of –OH [33]. After loading the nZVI, the stretching vibrational peak of –OH shifted to 3150 cm−1, indicating that the nZVI@ATP generated iron oxide during the preparation process [24]. After the reaction of the nZVI@ATP with Ni, the stretching vibration peak of –OH weakened considerably in intensity, indicating that the material was complexed with Ni2+ [35]. The vibrational peak at 1630 cm−1 is C=O in the material; the telescopic vibrational peak at 1380 cm−1 is the Fe-OH vibrational peak; and the characteristic peak at 1022 cm−1 is the telescopic vibrational peak of the Si-O-Si bond in the material [36]. The stretching vibration peak at 670 cm−1 was attributed to Fe–O, indicating that the material reacted with Ni to form iron oxides [21].

3.6.3. XRD

Figure 12 shows the XRD plots of nZVI@ATP before and after Ni2+ adsorption. The characteristic peaks of Fe0 were found at 44.9° and 65.2° [37,38], those of Fe2O3 and Fe3O4 at 35.59°and 35.4° [23], and that of FeOOH at 26.58°, as seen in the plot of nZVI@ATP, indicating that the material was oxidized during the preparation or preservation process and that the nZVI @ATP surface generated iron oxides. After the reaction, the characteristic diffraction peaks at 2θ of 44.9° and 65.2° disappeared, indicating that the Fe0 on the nZVI surface underwent a sufficient reaction and was completely consumed. The substantially enhanced characteristic peaks observed at 35.59° and 35.4° indicated that the nZVI was further oxidized to Fe2O3 and Fe3O4 during the reaction. The characteristic peak at 62.40° corresponded to Ni(OH)2 [39], while the characteristic peak of Ni0 was detected at 78.2° [40], indicating that part of the Ni2+ was reduced to Ni0 and part of the Ni2+ combined with hydroxide to produce a Ni(OH)2 precipitate [41].

3.6.4. XPS

To analyze the elemental valence and relative content of the material before and after the reaction, the material was characterized via XPS; the results are shown in Figure 13. Before the reaction, the main elements of the material were Fe, O, C, and Si (Figure 13a), and, after the reaction (Figure 13b), the fractional spectrum of Ni2+ appeared in the material, indicating that nZVI@ATP exerted an adsorption effect on Ni2+. Figure 13c shows the characteristic peaks of O1s before the reaction; the O1s characteristic orbitals can be divided into four peaks: Fe–O (529.79 eV), C–O (530.95 eV), –OH (532.05 eV), and C=O (533.73 eV) [42,43]. After the reaction, the Fe–O characteristic peaks and its relative content considerably increased (Figure 13d and Table 5). In addition, the relative contents of –OH and C=O decreased after the reaction (Table 6), indicating the coordination reaction between the oxygen-containing functional groups in the nZVI@ATP and Ni2+ [44].
Figure 13e,f shows the characteristic peaks of Fe2p before and after the nZVI@ATP reaction. Fe and O were the main elements present on the material surface, mainly in the form of FeO (709.51 eV), Fe2O3 (713.58 eV), Fe3O4 (711.45 eV), and FeOOH (724.23 eV) [45,46]. The appearance of the characteristic peak of Fe0 before the reaction indicated the successful preparation of the nZVI@ATP, and the disappearance of this peak after the reaction confirmed that the Fe0 present on the nZVI@ATP surface was involved in the reaction and largely consumed.
Notably, the iron oxide content on the material surfaces increased to different degrees after the reaction (see Table 7 and the semiquantitative analysis of the XPS spectra), indicating that the Fe0 on the nZVI@ATP surface underwent continuous oxidation to produce more iron oxides during the reaction. Figure 13g shows the Ni2p fractional spectrum and the five characteristic peaks obtained after fitting. In this spectrum, the binding energies of 879.53 and 861.31 eV corresponded to Ni(II)–O, those of 873.31 and 855.71 eV corresponded to Ni(II)–OH, and that of 852.23 eV corresponded to Ni0, indicating that the reaction products were mainly in the form of nickel oxides, nickel hydroxides, and nickel monomeric forms [31]. The standard electrode potential of Ni2+ is −0.257 V, which slightly exceeds the standard potential of Fe2+/Fe0 (−0.44 V) [47], indicating that Ni2+ removal is partly due to the redox effect of nZVI. In summary, the mechanism of Ni2+ removal by nZVI@ATP involved the complexation of Ni2+ by oxygen-containing functional groups on the nZVI@ATP surface, the reduction of Ni2+ to Ni0 by Fe2+/Fe0, precipitation via the reaction of Ni2+ with OH due to water corrosion of Fe0 on the nZVI@ATP surface [31], and the partial dehydration of the hydroxide to produce Ni oxide. The data presented in Table 7 indicate that the main removal mechanism involves the generation of a large amount of OH through the reaction between nZVI@ATP and water, inducing Ni2+ to generate hydroxide precipitates.

4. Conclusions

The prepared nZVI@ATP considerably enhanced Ni2+ removal as the loading of nZVI onto ATP effectively reduced nZVI agglomeration. The static adsorption analysis of nZVI@ATP for varying iron–ATP ratios revealed that the highest Ni2+ removal efficiency (71.93%) was achieved when the iron–ATP ratio was 2:1 and its adsorption capacity was 143.86 mg/g. The quasi-secondary kinetics could better describe the adsorption of Ni2+ by nZVI@ATP composites, and the fitted equilibrium adsorption amount was obtained. The adsorption of Ni2+ by nZVI@ATP is mainly divided into three stages: surface diffusion, intra-particle diffusion, and adsorption equilibrium. The rate of adsorption of Ni2+ by nZVI@ATP is limited by other factors such as surface diffusion and surface adsorption in addition to the main intra-particle diffusion. The removal efficiency of nZVI@ATP for Ni2+ showed an increasing trend as the initial concentration and dosage increased. For a pH of 2–7, the removal efficiency of nZVI for Ni2+ first increased and then decreased with the pH, and the highest removal efficiency of nZVI@ATP for Ni2+ was achieved at a pH of 5. It was shown that nZVI@ATP successfully realized the adsorption of Ni2+. The removal efficiency of Ni2+ was 71.93% after 13 h at C0 = 200 mg/L, an adsorbent dosage of 1.0 g/L, and a pH = 5. The recycling of nZVI@ATP revealed that the material still had a high adsorption capacity for Ni after the first cycle, which gradually decreased with an increasing number of cycles. SEM–EDS, FTIR, XRD, and XPS analyses revealed that the mechanism of Ni2+ removal by nZVI@ATP involved adsorption, reduction, and precipitation, with the main mechanism being the induced Ni(OH)2 precipitation on the nZVI@ATP surface.

Author Contributions

All authors contributed to the study conception and design. Material preparation, data collection, and analysis were performed by G.M. and L.D. The first draft of the manuscript was written by K.M., G.M., J.R., L.T., T.Z. and J.D. All authors have read and agreed to the published version of the manuscript.

Funding

This research was financially supported by the Natural Science Foundation of Ningxia province (2023AAC03346); the Gansu Key Research and Development Program—Industrial (22YF7GA139); the Innovation Fund Project of Higher Education in Gansu Province (2023A-036); the Industrial Support Program of Education, Department of Gansu Province (2021CYZC-31); the project of Gansu Province Science and Technology Plan (22CX3GA076); the Lanzhou Talent Innovation and Entrepreneurship Project (2021-RC-41); and the Research and Practice Project on Education and Teaching Reform in Ningxia Hui Autonomous Region (bjg2023083).

Institutional Review Board Statement

Not applicable.

Informed Consent Statement

Not applicable.

Data Availability Statement

The raw data supporting the conclusions of this article will be made available by the authors on request.

Conflicts of Interest

Author J.R. was employed by the company Gansu Hanxing Environmental Protection Co., Ltd. The remaining authors declare that the research was conducted in the absence of any commercial or financial relationships that could be construed as a potential conflict of interest.

References

  1. Vareda, J.P.; Valente, A.J.; Durães, L. Assessment of heavy metal pollution from anthropogenic activities and remediation strategies: A review. J. Environ. Manag. 2019, 246, 101–118. [Google Scholar] [CrossRef] [PubMed]
  2. Fiyadh, S.S.; AlSaadi, M.A.; Jaafar, W.Z.; AlOmar, M.K.; Fayaed, S.S.; Mohd, N.S.; Hin, L.S.; El-Shafie, A. Review on heavy metal adsorption processes by carbon nanotubes. J. Clean. Prod. 2019, 230, 783–793. [Google Scholar] [CrossRef]
  3. USEPA. National Primary Drinking Water Regulations, UnitedStates Environmental Protection Agency; National Service Center for Environmental Publications: Cincinnati, OH, USA, 2009. [Google Scholar]
  4. WHO. Guidelines for Drinking-Water Quality Third Edition Incorpo-Rating the First and Second Addenda Incorporating 1st and 2nd Ad-denda; WHO Press: Geneva, Switzerland, 2008; Volume 1. [Google Scholar]
  5. Zhou, Q.; Yang, N.; Li, Y.; Ren, B.; Ding, X.; Bian, H.; Yao, X. Total concentrations and sources of heavy metal pollution in global river and lake water bodies from 1972 to 2017. Glob. Ecol. Conserv. 2020, 22, e00925. [Google Scholar] [CrossRef]
  6. Rahman, M.A.T.M.T.; Paul, M.; Bhoumik, N.; Hassan, M.; Alam, M.K.; Aktar, Z. Heavy metal pollution assessment in the groundwater of the Meghna Ghat industrial area, Bangladesh, by using water pollution indices approach. Appl. Water Sci. 2020, 10, 186. [Google Scholar] [CrossRef]
  7. Baswa-Allah, K.A. Assessment of heavy metal pollution in Nigerian surface freshwaters and sediment: A meta-analysis using ecological and human health risk indices. J. Contam. Hydrol. 2023, 256, 104199. [Google Scholar] [CrossRef]
  8. Velarde, L.; Nabavi, M.S.; Escalera, E.; Antti, M.L.; Akhtar, F. Adsorption of heavy metals on natural zeolites: A review. Chemosphere 2023, 1, 38508. [Google Scholar] [CrossRef]
  9. Cempel, M.; Nikel, G. Nickel: A Review of Its Sources and Environmental Toxicology. Pol. J. Environ. Stud. 2006, 15, 375–382. [Google Scholar]
  10. Lee, Y.-J.; Lim, S.-S.; Baek, B.J.; An, J.-M.; Nam, H.-S.; Woo, K.-M.; Cho, M.-K.; Kim, S.-H.; Lee, S.-H. Nickel(II)-induced nasal epithelial toxicity and oxidative mitochondrial damage. Environ. Toxicol. Pharmacol. 2016, 42, 76–84. [Google Scholar] [CrossRef]
  11. Zambelli, B.; Uversky, V.N.; Ciurli, S. Nickel impact on human health: An intrinsic disorder perspective. Biochim. Et Biophys. Acta (BBA) Proteins Proteom. 2016, 1864, 1714–1731. [Google Scholar] [CrossRef] [PubMed]
  12. Li, R.; Wang, J.J.; Zhang, Z.; Awasthi, M.K.; Du, D.; Dang, P.; Wang, L. Recovery of phosphate and dissolved organic matter from aqueous solution using a novel CaO-MgO hybrid carbon composite and its feasibility in phosphorus recycling. Sci. Total Environ. 2018, 642, 526–536. [Google Scholar] [CrossRef] [PubMed]
  13. Kwak, J.-H.; Islam, M.S.; Wang, S.; Messele, S.A.; Naeth, M.A.; El-Din, M.G.; Chang, S.X. Biochar properties and lead(II) adsorption capacity depend on feedstock type, pyrolysis temperature, and steam activation. Chemosphere 2019, 231, 393–404. [Google Scholar] [CrossRef]
  14. Peng, Y.; Luo, Y.; Li, Y.; Azeem, M.; Li, R.; Feng, C.; Shaheen, S.M. Effect of corn pre-puffing on the efficiency of MgO-engineered biochar for phosphorus recovery from livestock wastewater: Mechanistic investigations and cost benefit analyses. Biochar 2023, 5, 26. [Google Scholar] [CrossRef]
  15. Wu, X.; Huang, M.; Zhou, T.; Mao, J. Recognizing removal of norfloxacin by novel magnetic molecular imprinted chitosan/γ-Fe2O3 composites: Selective adsorption mechanisms, practical application and regeneration. Sep. Purif. Technol. 2016, 165, 92–100. [Google Scholar] [CrossRef]
  16. Li, H.; Zhang, J.; Zhang, Y.; Huang, H.; Ou, H.; Zhang, Y. In-situ adsorption-conversion recovery of heavy metal cadmium by natural clay mineral for multi-functional photocatalysis. Sep. Purif. Technol. 2023, 319, 124058. [Google Scholar] [CrossRef]
  17. Dai, L.; Meng, K.; Zhao, W.; Han, T.; Lei, Z.; Ma, G.; Tian, X.; Ren, J. Mechanism-Enhanced Active Attapulgite-Supported Nanoscale Zero-Valent Iron for Efficient Removal of Pb(2+) from Aqueous Solution. Nanomaterials 2022, 12, 1591. [Google Scholar] [CrossRef] [PubMed]
  18. Li, Y.; Wang, Z.; Xie, X.; Zhu, J.; Li, R.; Qin, T. Removal of Norfloxacin from aqueous solution by clay-biochar composite prepared from potato stem and natural attapulgite. Colloids Surf. A Physicochem. Eng. Asp. 2017, 514, 126–136. [Google Scholar] [CrossRef]
  19. Yin, H.; Kong, M.; Gu, X.; Chen, H. Removal of arsenic from water by porous charred granulated attapulgite-supported hydrated iron oxide in bath and column modes. J. Clean. Prod. 2017, 166, 88–97. [Google Scholar] [CrossRef]
  20. Yu, H.; Zhu, Y.; Duan, F.; Wang, A. Porous materials prepared from eco-friendly attapulgite and gallnut stabilized aqueous foam templates for high-efficient removal of organic pollutants. Mater. Today Sustain. 2023, 21, 100315. [Google Scholar] [CrossRef]
  21. Wang, J.; Liu, G.; Zhou, C.; Li, T.; Liu, J. Synthesis, characterization and aging study of kaolinite-supported zero-valent iron nanoparticles and its application for Ni(II) adsorption. Mater. Res. Bull. 2014, 60, 421–432. [Google Scholar] [CrossRef]
  22. Genchi, G.; Carocci, A.; Lauria, G.; Sinicropi, M.S.; Catalano, A. Nickel: Human Health and En-vironmental Toxicology. Int. J. Environ. Res. Public Health 2020, 17, 679. [Google Scholar] [CrossRef] [PubMed]
  23. Wei, A.; Ma, J.; Chen, J.; Zhang, Y.; Song, J.; Yu, X. Enhanced nitrate removal and high selectivity towards dinitrogen for groundwater remediation using biochar-supported nano zero-valent iron. Chem. Eng. J. 2018, 353, 595–605. [Google Scholar] [CrossRef]
  24. Ren, J.; Ma, G.; Zhao, W.; Tao, L.; Zhou, Y.; Liao, C.; Dai, L. Insights into enhanced removal of Cd2+ from aqueous solutions by attapulgite supported sulfide-modified nanoscale zero-valent iron. Water Sci. Technol. 2022, 86, 3163–3180. [Google Scholar] [CrossRef]
  25. Arshadi, M.; Soleymanzadeh, M.; Salvacion, J.W.L.; SalimiVahid, F. Nanoscale zero-valent iron (NZVI) supported on sineguelas waste for Pb (II) removal from aqueous solution: Kinetics, thermodynamic and mechanism. J. Colloid Interface Sci. 2014, 426, 241–251. [Google Scholar] [CrossRef] [PubMed]
  26. Lakkaboyana, S.K.; Khantong, S.; Asmel, N.K.; Obaidullah, S.; Kumar, V.; Kannan, K.; Yaacob, W.Z.W. Indonesian Kaolin supported nZVI (IK-nZVI) used for the an efficient removal of Pb (II) from aqueous solutions: Kinetics, thermodynamics and mechanism. J. Environ. Chem. Eng. 2021, 9, 106483. [Google Scholar] [CrossRef]
  27. Arshadi, M.; Abdolmaleki, M.K.; Mousavinia, F.; Foroughifard, S.; Karimzadeh, A. Nano modification of NZVI with an aquatic plant Azolla filiculoides to remove Pb (II) and Hg (II) from water: Aging time and mechanism study. J. Colloid Interface Sci. 2017, 486, 296–308. [Google Scholar] [CrossRef]
  28. Xu, H.; Li, X.; Gao, M.; Hu, X.; Zhang, X.; Li, Y.; Hu, X. Chitosan and biochar synergize the efficient elimination of lead from wastewater by sulfidised nano-zero-valent iron. J. Environ. Chem. Eng. 2022, 10, 107101. [Google Scholar] [CrossRef]
  29. Xue, W.; Huang, D.; Zeng, G.; Wan, J.; Cheng, M.; Zhang, C.; Hu, C.; Li, J. Performance and toxicity assessment of nanoscale zero valent iron particles in the remediation of contaminated soil: A review. Chemosphere 2018, 210, 1145–1156. [Google Scholar] [CrossRef]
  30. Zarime, N.A.; Yaacob, W.Z.W.; Jamil, H. Removal of heavy metals using bentonite supported nano-zero valent iron particles. In AIP Conference Proceedings; AIP Publishing: New York, NY, USA, 2018; p. 1940. [Google Scholar]
  31. Efecan, N.; Shahwan, T.; Eroğlu, A.E.; Lieberwirth, I. Characterization of the uptake of aqueous Ni2+ ions on nanoparticles of zero-valent iron (nZVI). Desalination 2009, 249, 1048–1054. [Google Scholar] [CrossRef]
  32. Cai, X.; Wu, Y.; Chuang, Y.; He, C.; Shi, T. Study on the Competitive Adsorption of Pb (II) and Ni (II) in Aqueous Solution Onto B-nZVI and Its Stability After Adsorption. Water Air Soil Pollut. 2023, 234, 181. [Google Scholar] [CrossRef]
  33. Tang, J.; Mu, B.; Zong, L.; Wang, A. One-step synthesis of magnetic attapulgite/carbon supported NiFe-LDHs by hydrothermal process of spent bleaching earth for pollutants removal. J. Clean. Prod. 2018, 172, 673–685. [Google Scholar] [CrossRef]
  34. Zarime, N.A.; Solemon, B.; Wan Yaacob, W.Z.; Jamil, H.; Che Omar, R.; Oyekanmi, A.A. Effectiveness of Artificially Synthesized Granitic Residual Soil-Supported Nano Zero-Valent Iron (Gr-nZVI) as Effective Heavy Metal Contaminant Adsorbent. Inorganics 2023, 11, 131. [Google Scholar] [CrossRef]
  35. Song, M.; Hu, X.; Gu, T.; Zhang, W.X.; Deng, Z. Nanocelluloses affixed nanoscale Zero-valent iron (nZVI) for nickel removal: Synthesis, characterization and mechanisms. J. Environ. Chem. Eng. 2022, 10, 107466. [Google Scholar] [CrossRef]
  36. Mochizuki, Y.; Bud, J.; Liu, J.; Takahashi, M.; Tsubouchi, N. Adsorption of phosphate from aqueous using iron hydroxides prepared by various methods. J. Environ. Chem. Eng. 2021, 9, 104645. [Google Scholar] [CrossRef]
  37. Kadu, B.S.; Sathe, Y.D.; Ingle, A.B.; Chikate, R.C.; Patil, K.R.; Rode, C.V. Efficiency and recycling capability of montmorillonite supported Fe–Ni bimetallic nanocomposites towards hexavalent chromium remediation. Appl. Catal. B Environ. 2011, 104, 407–414. [Google Scholar] [CrossRef]
  38. Lim, T.-T.; Zhu, B.-W. Effects of anions on the kinetics and reactivity of nanoscale Pd/Fe in trichlorobenzene dechlorination. Chemosphere 2008, 73, 1471–1477. [Google Scholar] [CrossRef] [PubMed]
  39. Li, X.; Ding, R.; Shi, W.; Xu, Q.; Ying, D.; Huang, Y.; Liu, E. Hierarchical porous Co(OH)F/Ni(OH)2: A new hybrid for supercapacitors. Electrochim. Acta 2018, 265, 455–473. [Google Scholar] [CrossRef]
  40. Zhu, F.; Liu, T.; Zhang, Z.; Liang, W. Remediation of hexavalent chromium in column by green synthesized nanoscale zero-valent iron/nickel: Factors, migration model and numerical simulation. Ecotoxicol. Environ. Saf. 2021, 207, 111572. [Google Scholar] [CrossRef]
  41. Tsai, T.H.; Chou, H.W.; Wu, Y.F. Removal of nickel from chemical plating waste solution through precipitation and production of microsized nickel hydroxide particles. Sep. Purif. Technol. 2020, 251, 117315. [Google Scholar] [CrossRef]
  42. Toupin, M.; Bélanger, D. Spontaneous Functionalization of Carbon Black by Reaction with 4-Nitr-ophenyldiazonium Cations. Langmuir 2008, 24, 1910–1917. [Google Scholar] [CrossRef]
  43. Yi, Y.; Wang, X.; Ma, J.; Ning, P. An efficient Egeria najas-derived biochar supported nZVI composite for Cr(VI) removal: Characterization and mechanism investigation based on visual MINTEQ model. Environ. Res. 2020, 189, 109912. [Google Scholar] [CrossRef]
  44. Sang, L.; Wang, G.; Liu, L.; Bian, H.; Jiang, L.; Wang, H.; Zhang, Y.; Zhang, W.; Peng, C.; Wang, X. Immobilization of Ni (Ⅱ) at three levels of contaminated soil by rhamnolipids modified nano zero valent iron (RL@nZVI): Effects and mechanisms. Chemosphere 2021, 276, 130139. [Google Scholar] [CrossRef] [PubMed]
  45. Xu, B.-D.; Qian, T.-T.; Chen, S.; Yang, J.; Jiang, H. Preparation of highly stable and easily regenerated sulfuretted nZVI via one-pot fast pyrolysis method for the removal of diclofenac. J. Environ. Chem. Eng. 2021, 9, 105425. [Google Scholar] [CrossRef]
  46. Xu, J.; Cao, Z.; Wang, Y.; Zhang, Y.; Gao, X.; Ahmed, M.B.; Zhang, J.; Yang, Y.; Zhou, J.L.; Lowry, G.V. Distributing sulfidized nanoscale zerovalent iron onto phosphorus-functionalized biochar for enhanced removal of antibiotic florfenicol. Chem. Eng. J. 2019, 359, 713–722. [Google Scholar] [CrossRef]
  47. Üzüm, Ç.; Shahwan, T.; Eroğlu, A.E.; Hallam, K.R.; Scott, T.B.; Lieberwirth, I. Synthesis and characterization of kaolinite-supported zero-valent iron nanoparticles and their application for the removal of aqueous Cu2+ and Co2+ ions. Appl. Clay Sci. 2009, 43, 172–181. [Google Scholar] [CrossRef]
Figure 1. Removal efficiency of Ni2+ by different adsorbents (initial concentration of 200 mg/L; initial pH of 5; temperature of 298 K; dosage of 1 g/L; and stirring time of 12 h).
Applsci 14 01823 g001
Figure 2. (a) SEM image of nZVI@ATP; and (b) EDS image of nZVI@ATP.
Applsci 14 01823 g002
Figure 3. nZVI@ATP adsorption and desorption curve.
Applsci 14 01823 g003
Figure 4. Variation of zeta potential of ATP and nZVI@ATP with pH.
Applsci 14 01823 g004
Figure 5. Adsorption results of different initial concentrations on Ni2+ over time by nZVI@ATP (initial pH of 5; temperature of 298 K; dosing amount of1 g/L; and stirring time of 12 h).
Applsci 14 01823 g005
Figure 6. Adsorption results of different dosing amounts on Ni2+ over time by nZVI@ATP (initial concentration of 200 mg/L; initial pH of 5; temperature of 298 K; and stirring time of 12 h).
Applsci 14 01823 g006
Figure 7. Effect of pH on Ni2+ adsorption by nZVI@ATP (initial concentration of 200 mg/L; temperature of 298 K; dosage of 1 g/L; and stirring time of 12 h).
Applsci 14 01823 g007
Figure 8. Fitting curves of Ni2+ adsorption kinetics by nZVI@ATP (a); and intraparticle diffusion (b).
Applsci 14 01823 g008
Figure 9. Material recycling diagram (initial concentration of 200 mg/L; initial pH of 5; temperature of 298 K; dosing amount of 1 g/L; and stirring time of 12 h).
Applsci 14 01823 g009
Figure 10. SEM–EDS map of nZVI@ATP after adsorption of Ni2+.
Applsci 14 01823 g010
Figure 11. FT-IR before and after the reaction of nZVI@ATP with Ni.
Applsci 14 01823 g011
Figure 12. XRD diagram before and after the nZVI@ATP reaction.
Applsci 14 01823 g012
Figure 13. XPS spectra of nZVI@ATP before and after Ni2+ adsorption: (a) full spectrum of nZVI@ATP; (b) full spectrum of nZVI@ATP after reaction; (c) subspectrum before O1s reaction; (d) subspectrum after O1s reaction; (e) subspectrum before Fe2p reaction; (f) subspectrum after Fe2p reaction; and (g) subspectrum after Ni2p reaction.
Applsci 14 01823 g013aApplsci 14 01823 g013b
Table 1. nZVI@ATP specific surface area parameters.
ItemnZVI@ATP
BET specific surface area (m2/g)51.79
Single point total pore volume (cm3/g)11.93 × 10−2
BJH adsorption accumulation pore volume (cm3/g)11.76 × 10−2
BET average pore size (4 V/A by BET) (nm)9.22
Table 2. Kinetic fitting parameters for Ni2+ adsorption by nZVI@ATP.
C0Quasi-Level KineticsQuasi-Secondary Kinetics
qm1k1R12qm2k2R22
200 mg/L137.21533.22440.7830144.95930.03970.9729
Note: C0 is the initial concentration of the solution (mg/L); qm is the adsorption capacity of the material (mg/g); k1 is the quasi-primary adsorption kinetic constant (g/(mg·h)); k2 is the quasi-secondary adsorption kinetic constant (g/(mg·h)).
Table 3. Fitting parameters for Weber–Morris of Ni2+ adsorbed by nZVI@ATP.
C0kd1E1R12kd2E2R22kd3E3R32
200 mg/L44.041280.66570.99185.2889117.41670.96800.4776138.84290.6988
Note: C0 is the initial concentration of the solution (mg/L); kd is the rate constant of the intraparticle diffusion equation (mg/(g·h1/2)); and Ei is the intercept (mmol/g).
Table 4. Comparison of the adsorption performance of different materials on Ni2+.
SampleCarrierInitial ConcentrationTemperaturepHDosing AmountAdsorption AmountReference
Gr-nZVIgranitic residual50 mg/L298 K6.010 g/L7.0 mg/g[34]
kaolinite–nZVIkaolinite50 mg/L298 K5.05 g/L9.24 mg/g[21]
ZVI-50 mg/L298 K5.05 g/L4.58 mg/g[21]
Bentonite composite nZVIBentonite400 mg/L298 K-1 g/L16.5 mg/g[30]
ATP-200 mg/L298 K5.01 g/L72.33 mg/gThis article
nZVI-200 mg/L298 K5.01 g/L123.3 mg/gThis article
nZVI@ATPATP200 mg/L298 K5.01 g/L143.87 mg/gThis article
Table 5. Changes in the relative content ratio of O elements before and after adsorption.
StatusFe-O–OHC-OC=O
Before Reaction10.63%35.15%25.89%28.32
After Reaction25.01%27.63%30.39%16.97%
Table 6. Changes in the relative content ratio of Fe elements before and after adsorption.
StatusFe0FeOFe2O3Fe3O4FeOOH
Before Reaction7.23%13.66%18.24%20.79%40.08%
After Reaction-14.67%21.91%20.57%42.84%
Table 7. Changes in the relative content ratio of Ni elements after adsorption.
StatusNi(Ⅱ)-ONi(Ⅱ)-OHNi0
After Reaction44.16%50.09%5.75%
Disclaimer/Publisher’s Note: The statements, opinions and data contained in all publications are solely those of the individual author(s) and contributor(s) and not of MDPI and/or the editor(s). MDPI and/or the editor(s) disclaim responsibility for any injury to people or property resulting from any ideas, methods, instructions or products referred to in the content.

