

A Framework for Communicating and Building a Digital Twin Model of the Electric Car


Abstract
1. Introduction
- Testing the vehicle before launch with various parameters.
- Real flight reflection, comparisons, and updates.
- Diagnostic tool for finding the causes of faults or damage.
- Investigation of new modifications not planned at the design stage.
- Model-in-the-loop (MiL)—a computer-simulated model in an environment, such as Simulink; used for capturing the most important features of the plant (hardware), identifying errors in mathematical equations, and understanding the behavior of a model under specific conditions and finding areas for improvement.
- Software-in-the-loop (SiL)—a computer-simulated model and controller model; software simulator instead of real hardware; an essential tool for identifying defects and problems; the software provides input data that is fed into the model. The model then process the input and produces output that is captured and analyzed. Outputs are compared to the expected results to determine whether the model is working correctly.
- Processor-in-the-loop (PiL) or FPGA-in-the-loop (FiL)—controller code runs on the built-in processor, testing the processor in the developed control logic and finding faults.
- Hardware-in-the-loop (HiL)—uses actual physical connections to the embedded processor, such as inputs and outputs and actuators or a communication interface; used for verifying if the controller works stably and how it responds in real time to changing signals.
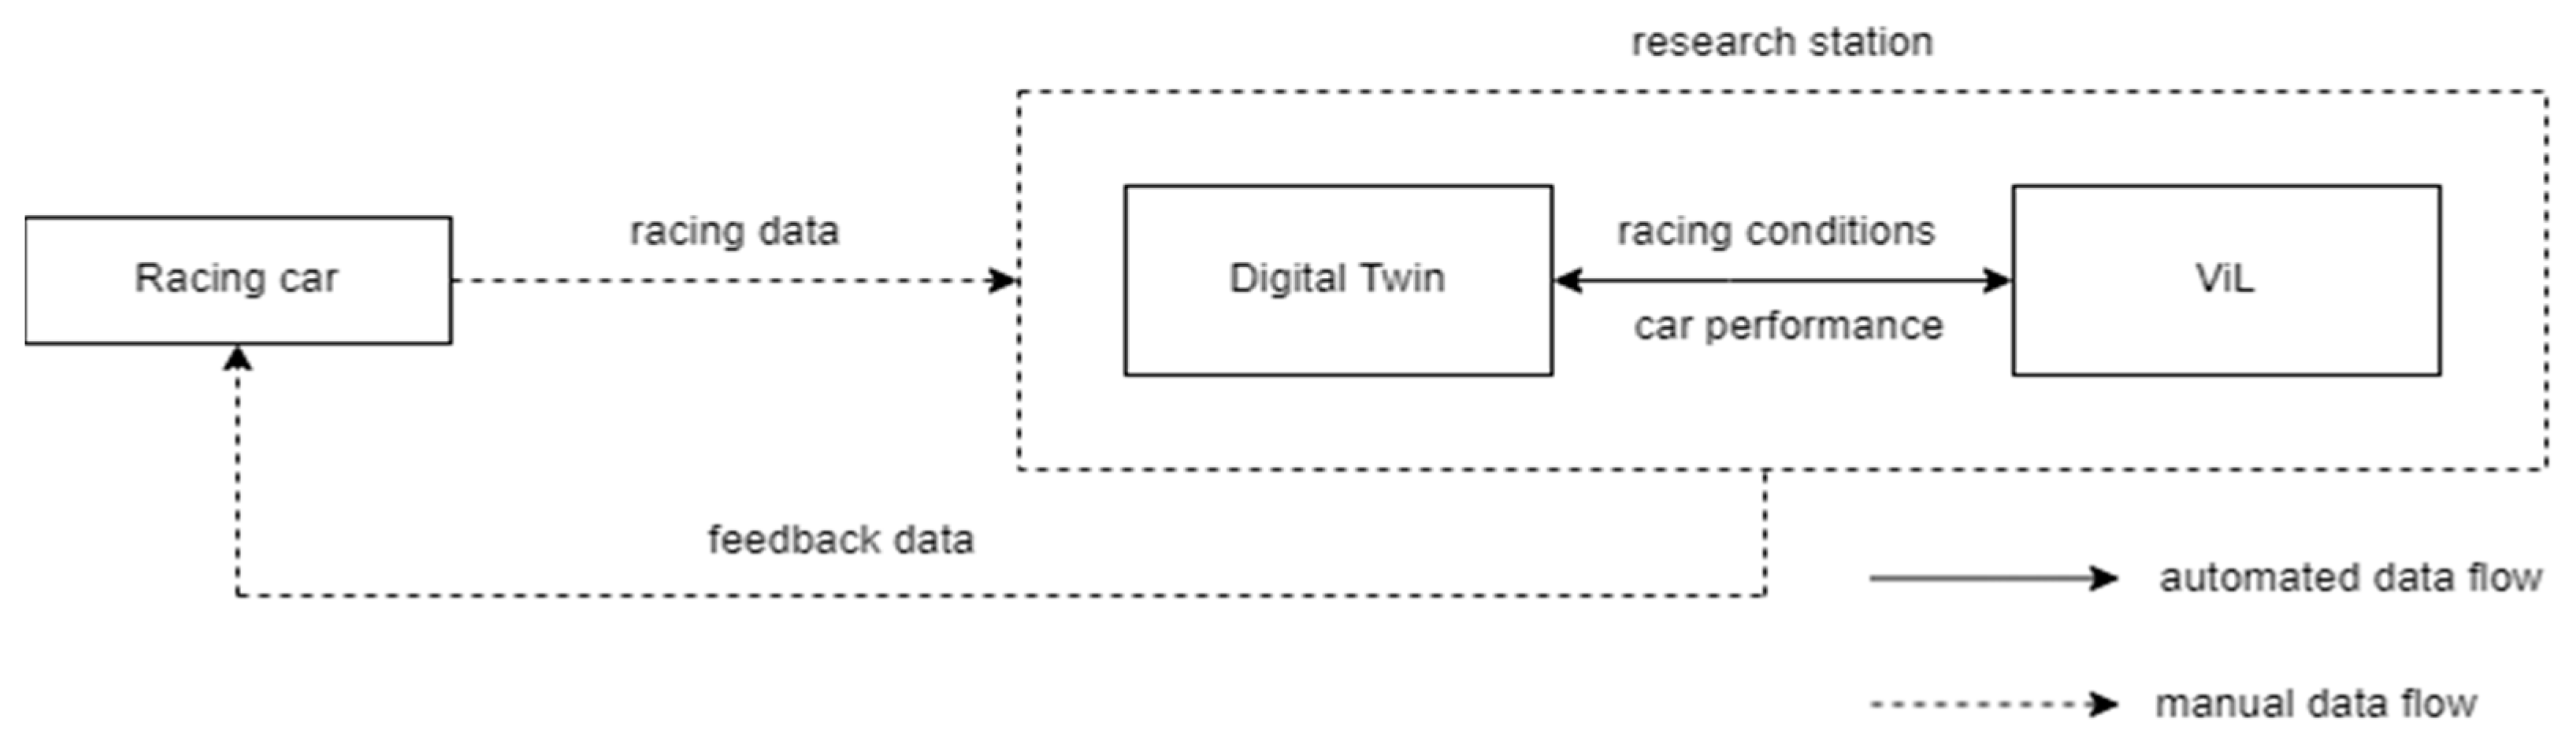
- Vehicle-in-the-loop (ViL)—last step before full road testing; complete vehicle system; used for testing real-world scenarios with a virtual environment.
- Regenerative braking—a simulation test proved that the regenerative braking logic saved approximately 30% of energy consumption compared to a vehicle without recuperation [41].
- Battery efficiency—different speed profiles were tested on a chassis dynamometer with VW e-Up. The question concerned the impact of speed on energy consumption and battery performance [42].
- Energy management system—data from vehicles were sent to the cloud via 4G LTE network. Real-time vehicle performance was consistent with the cloud computing status. Based on these calculations, an ID-VIL simulation was performed to evaluate possible decisions to minimize costs and battery life loss [43].
- Hybrid energy storage system—modelling and simulation of the battery–supercapacitors system for the e-Golf. Studies have shown that the system can reduce energy consumption by 2.95% per 100 km [44].
Goals and Approaches
2. Digital Twin Components and Communication
- PC and router;
- SEW Eurodrive MDX61B drive inverter with a DFE11B extension card;
- Three-phase SEW DRE80M4 AC motor with ES7S incremental encoder;
- DC motor;
- Shaft with the mass wheel and the built-in torque sensor;
- Car wheel;
- Drive system (belts).
- Establish communication.
- Build a simulation program.
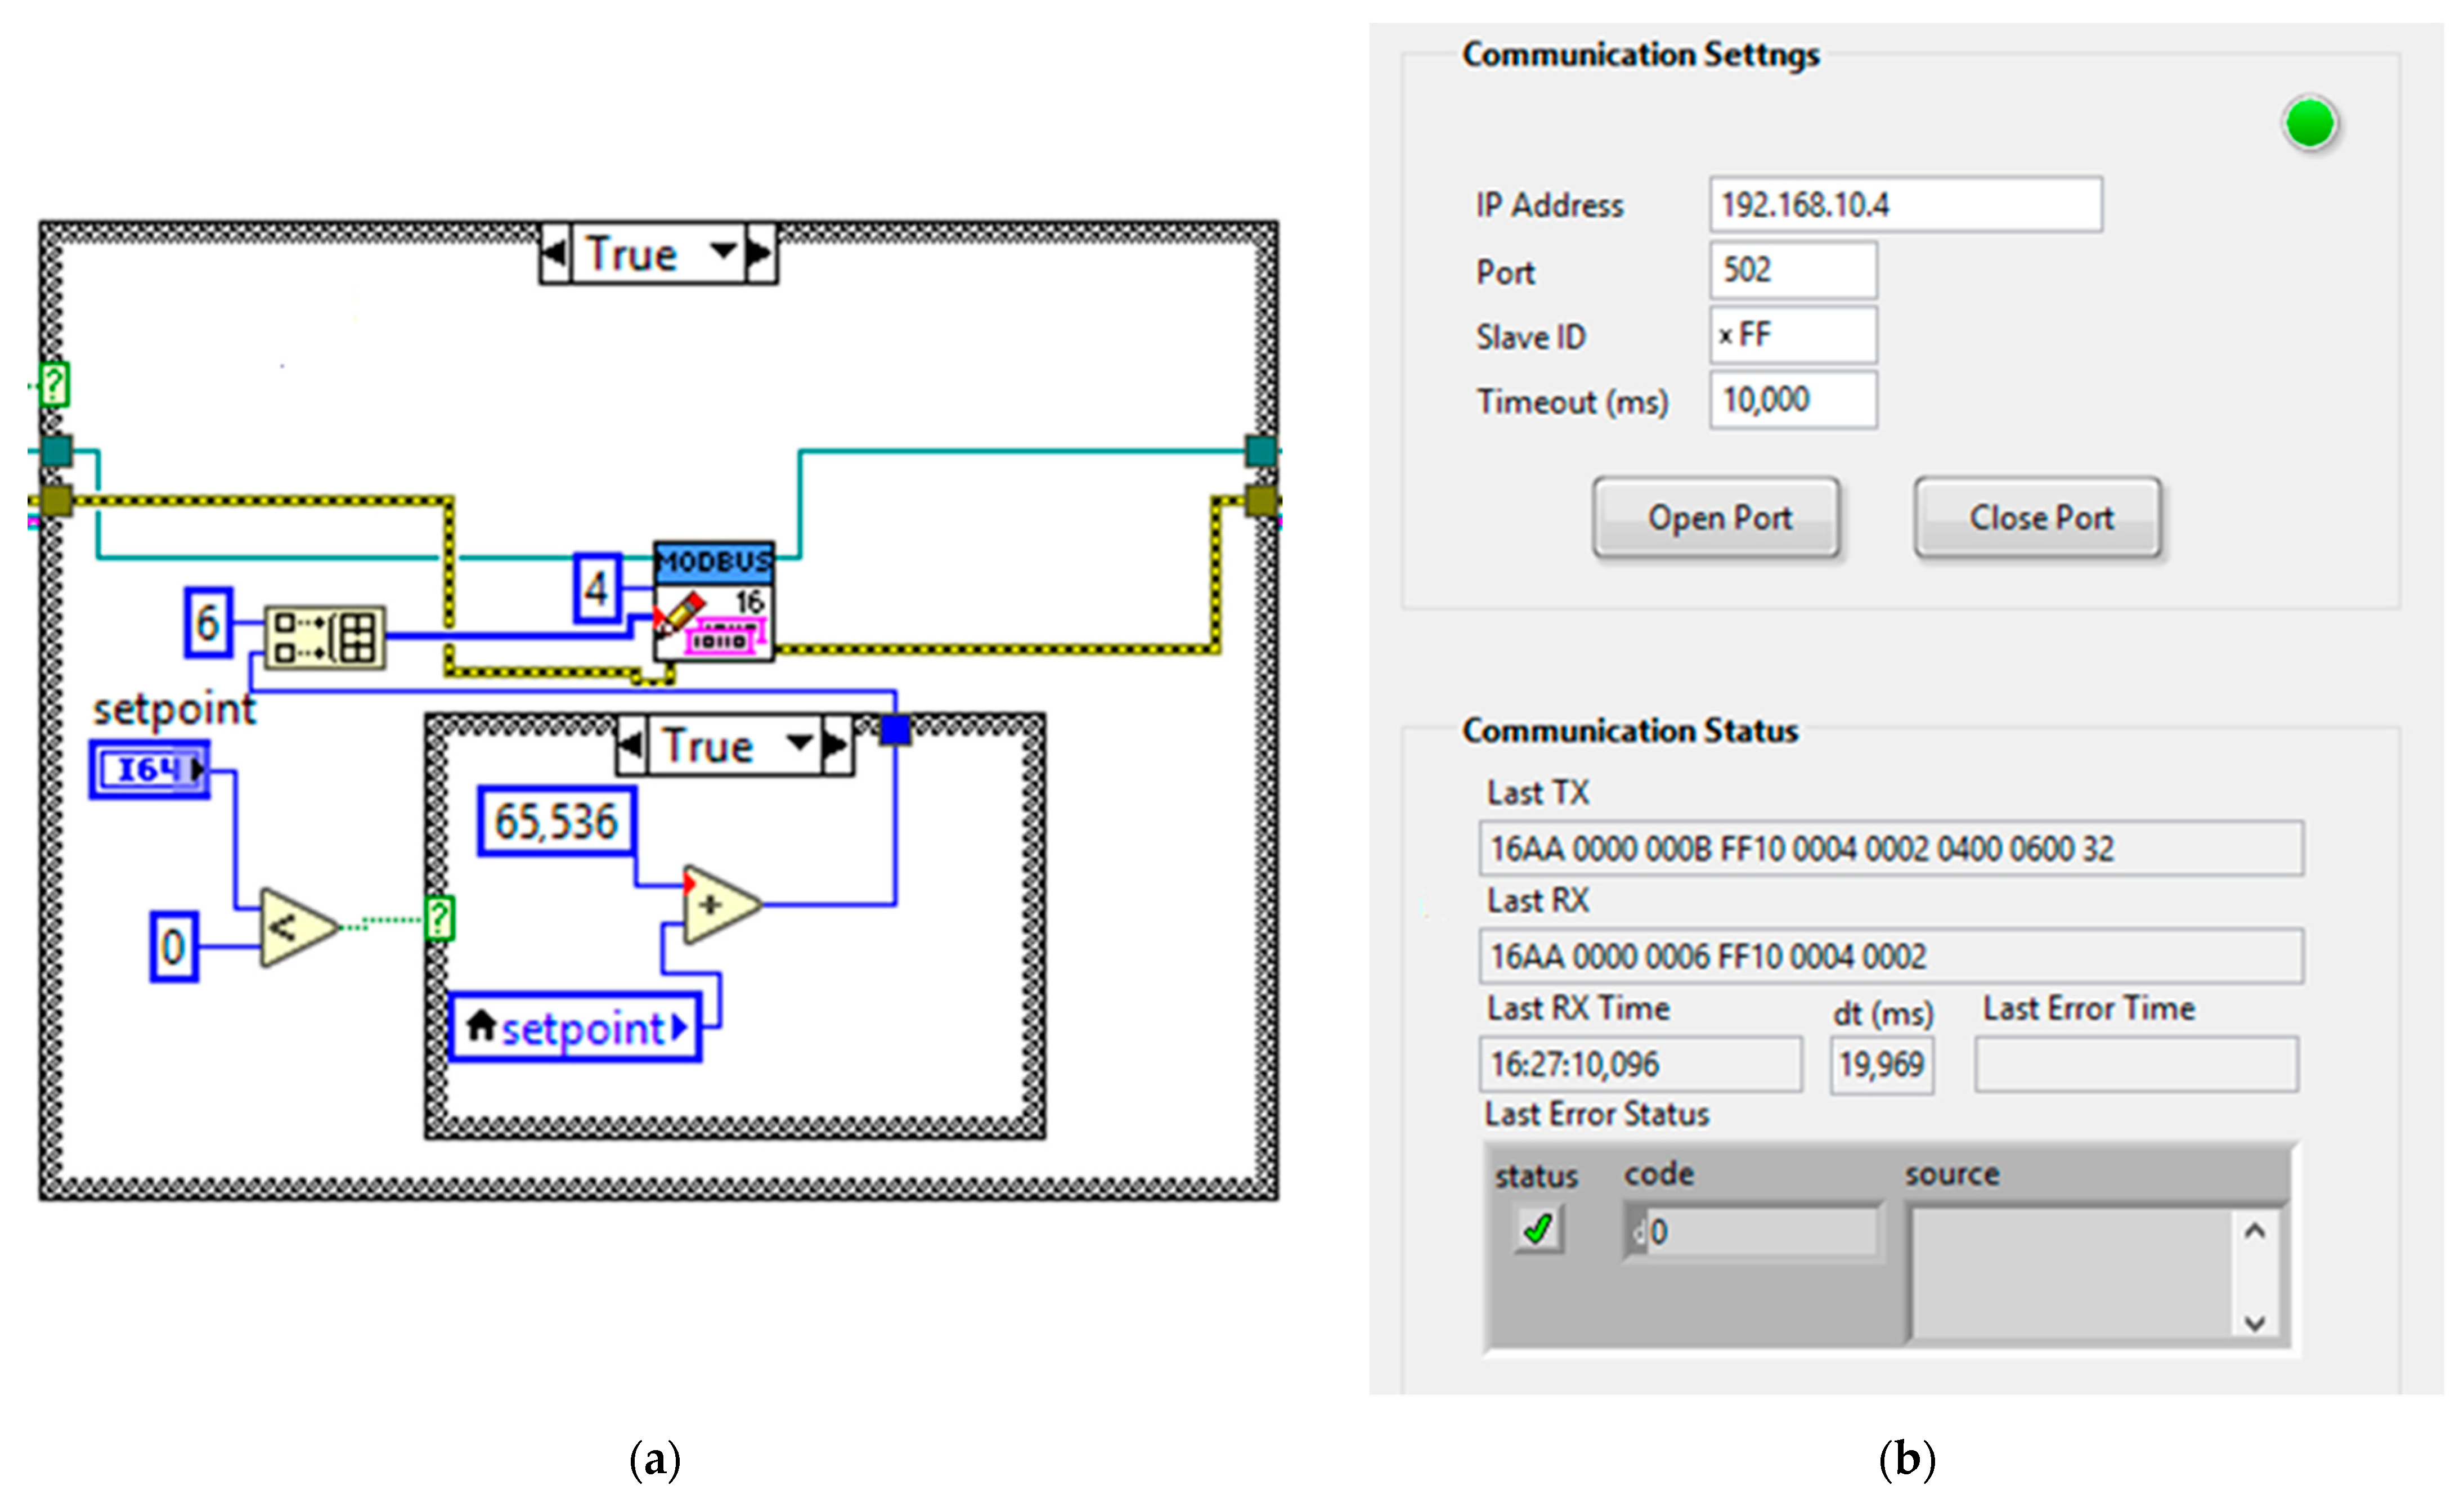
2.1. Establishing Communication
- FC3—read holding registers.
- FC16—write multiple registers.
- FC23—read/write multiple registers.
- 16AAhex—transaction identifier, value assigned by the client;
- 0000—protocol identifier must be zero;
- 000Bhex = 11dec—number of consecutive double words;
- FFhex—the server identifier means that the DFE11B is the end station;
- 10hex = 16dec—function code, FC16 is the operation record;
- 0004—address of the first register;
- 0002—number of required registers;
- 04—number of double words remaining;
- 0006hex = 0110bin—setting the value of control word 1, bit 1, and bit 2 to 1 causes the inverter to enter the read-ready state;
- 0032hex = 50dec—current controlled value, set value.
2.2. Building a Simulation Algorithm
3. Results
- First lap simulation—no additional torque from the AC motor.
- Further lap simulation with specified setpoints.
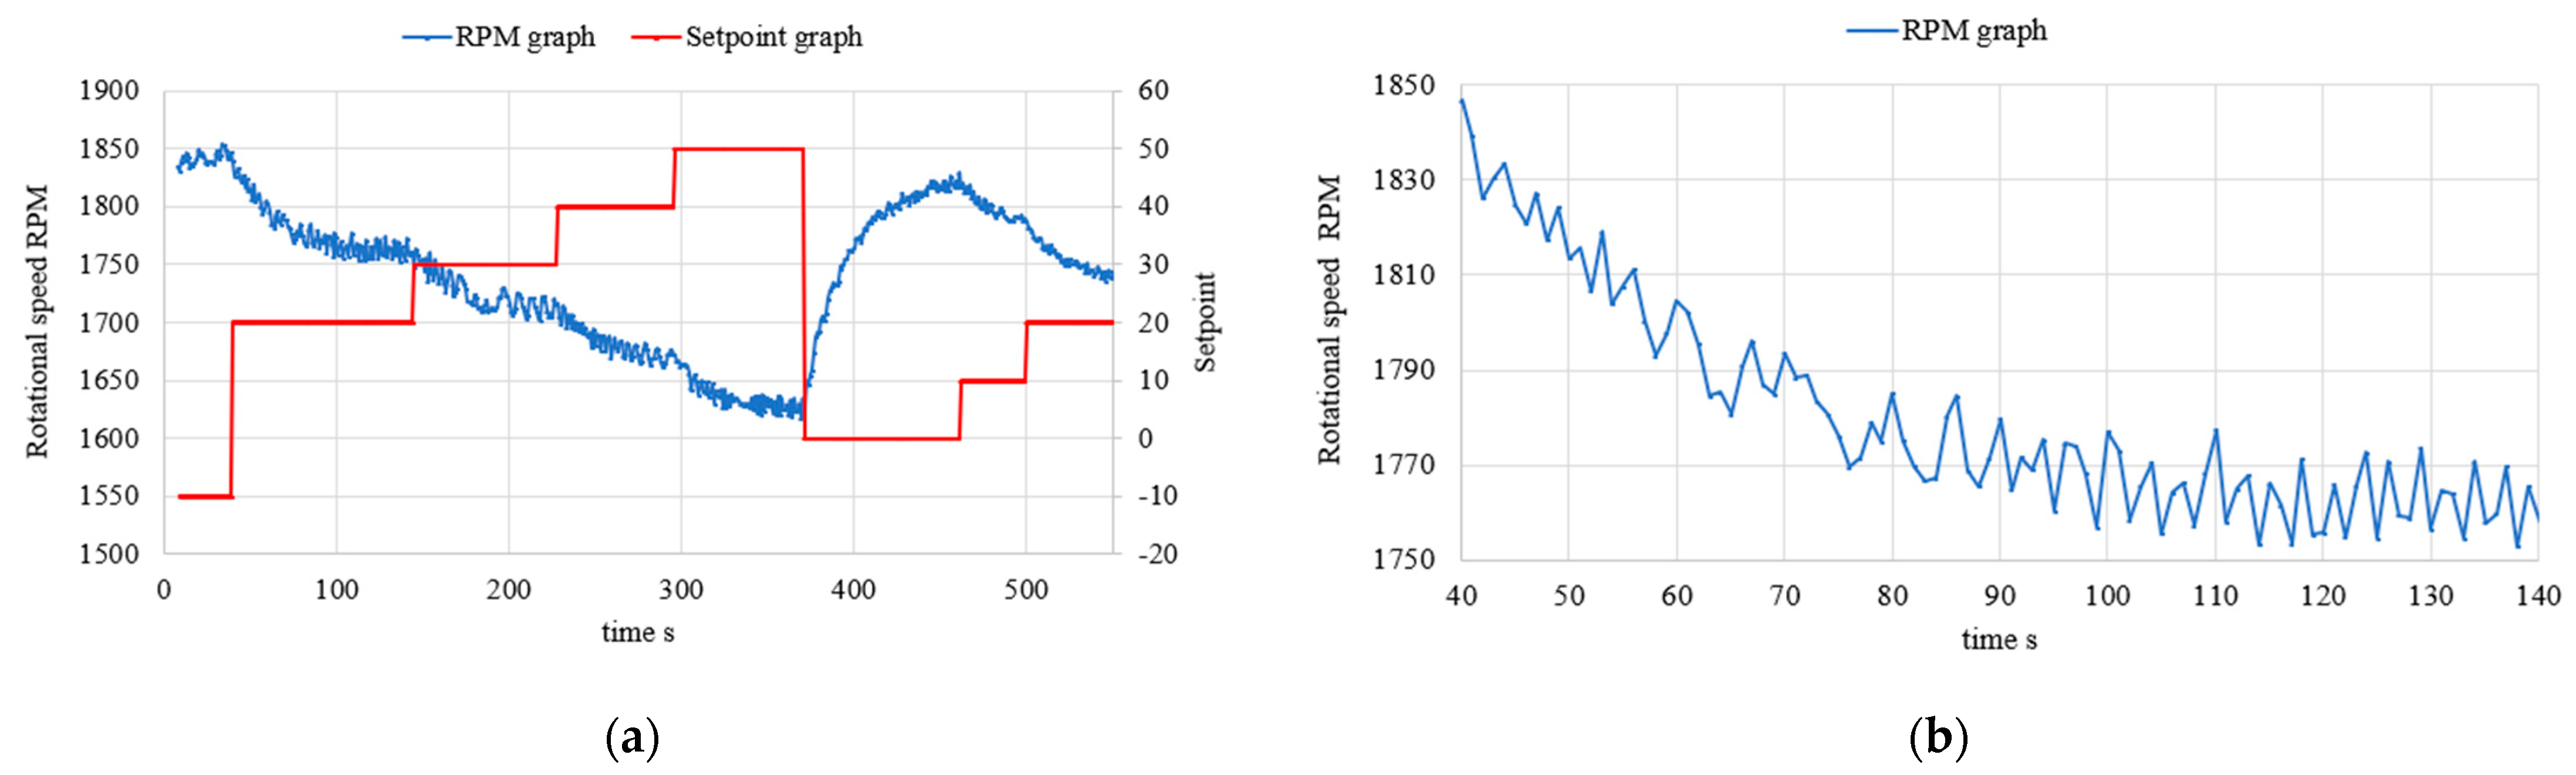
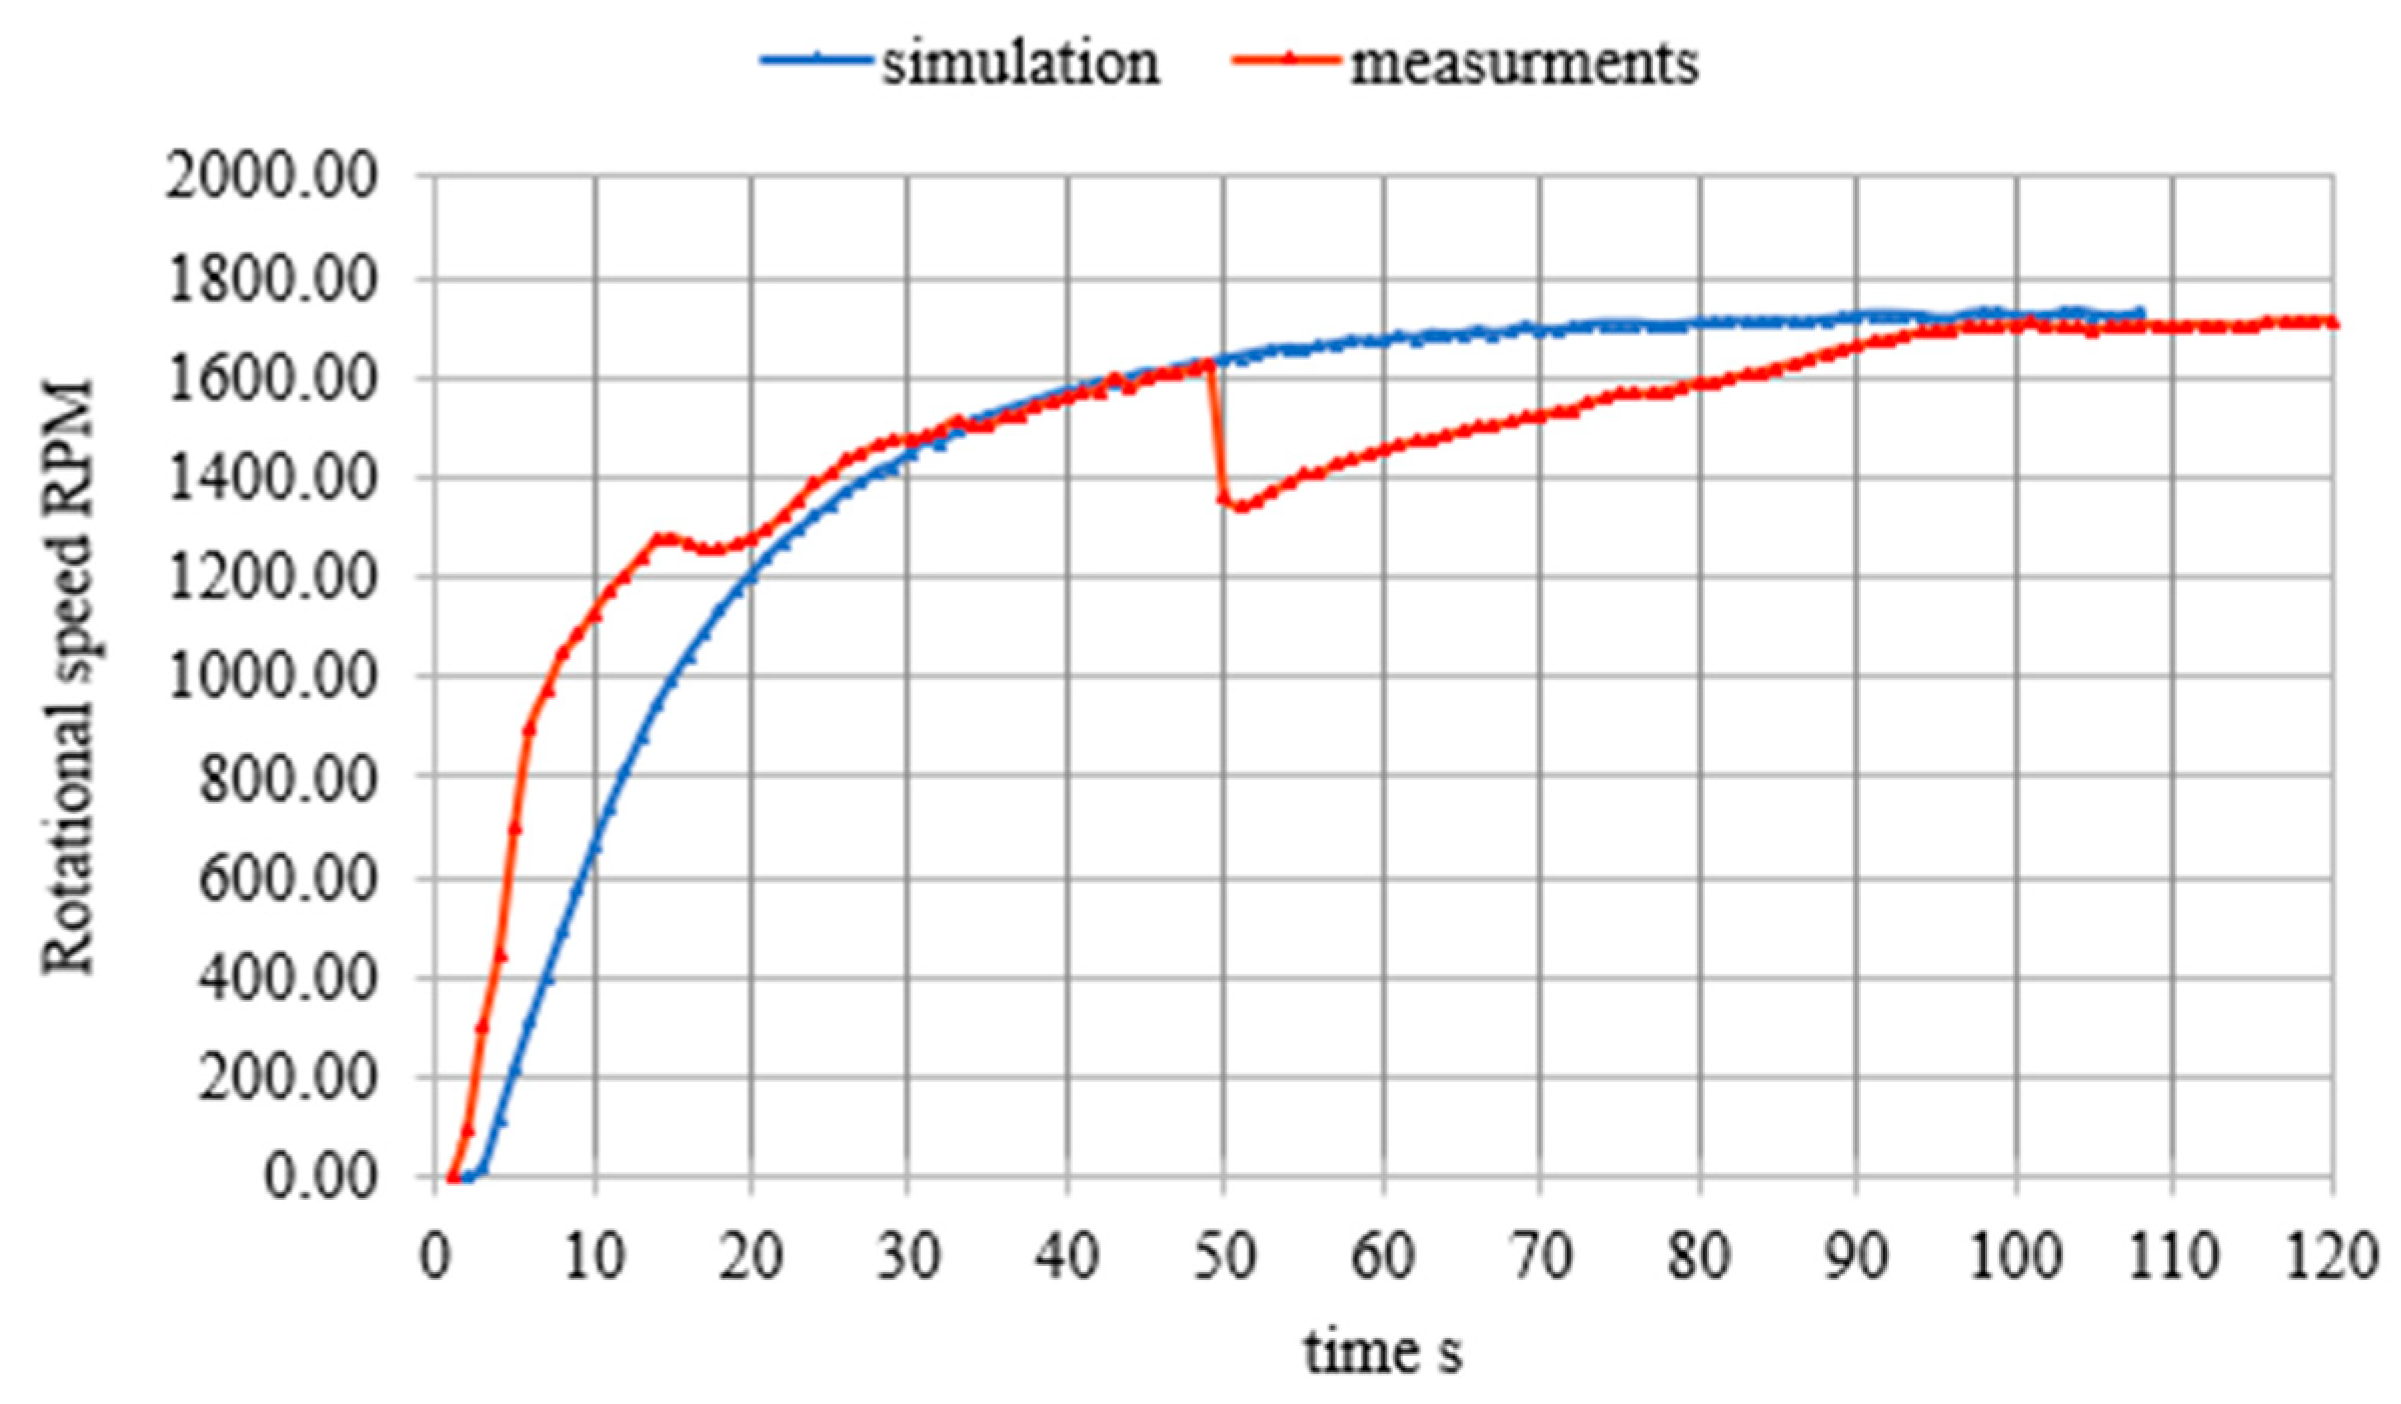
3.1. Simulation of Lap 1
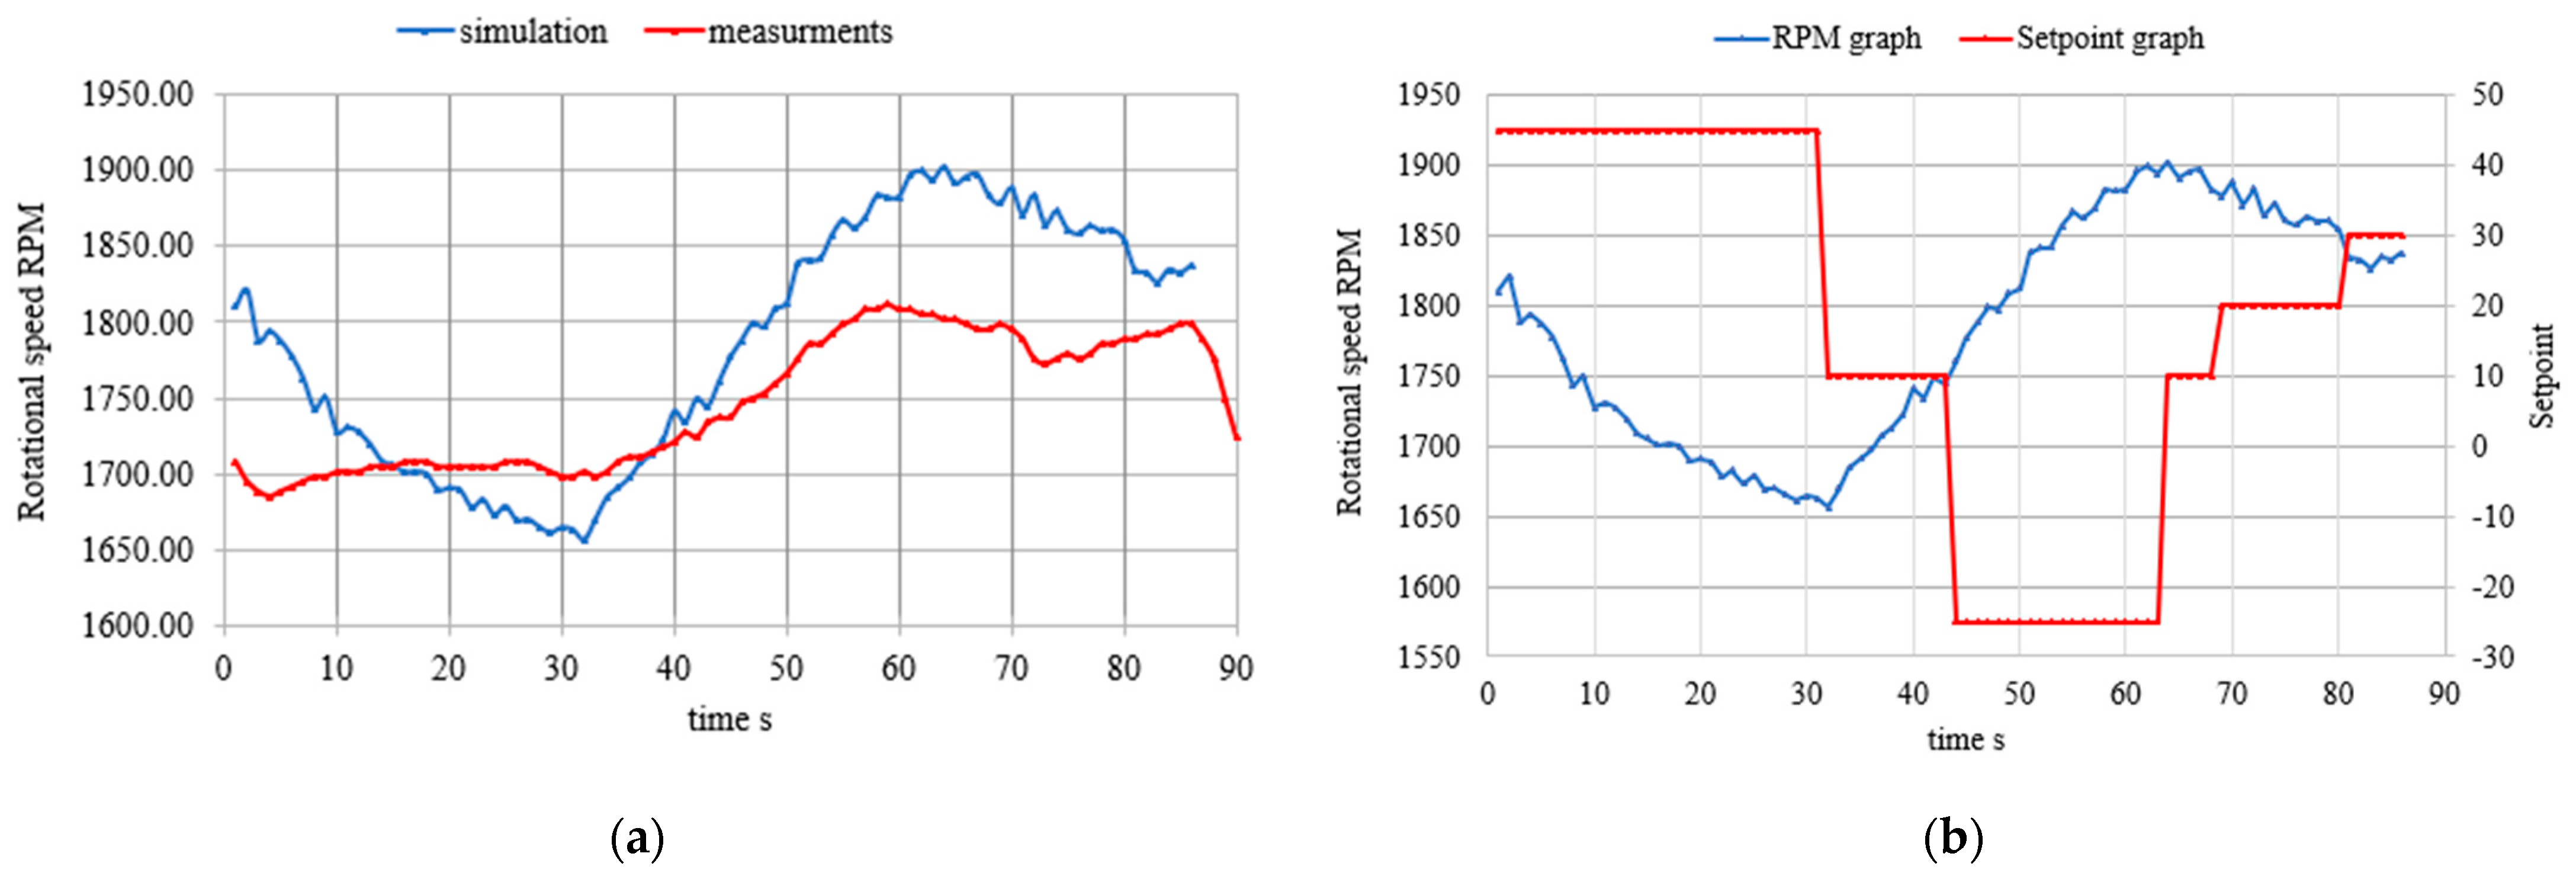
3.2. Simulation of Lap 5
4. Discussion
- Random events and incidents occurring during real races are not taken into account.
- Varying the load on the AC motor does not provide a constant output value.
- The overall condition of the battery and DC motor may affect the final results.
- No additional load is added on the first lap.
- Because the setpoints cause subsequent laps to take too long, the motor speed increases and there is no time to reduce it. To obtain more appropriate time laps, the track should be divided into more segments, even if the speed does not change much during the time lap.
- Analysis of telemetry data in order to select tested journeys.
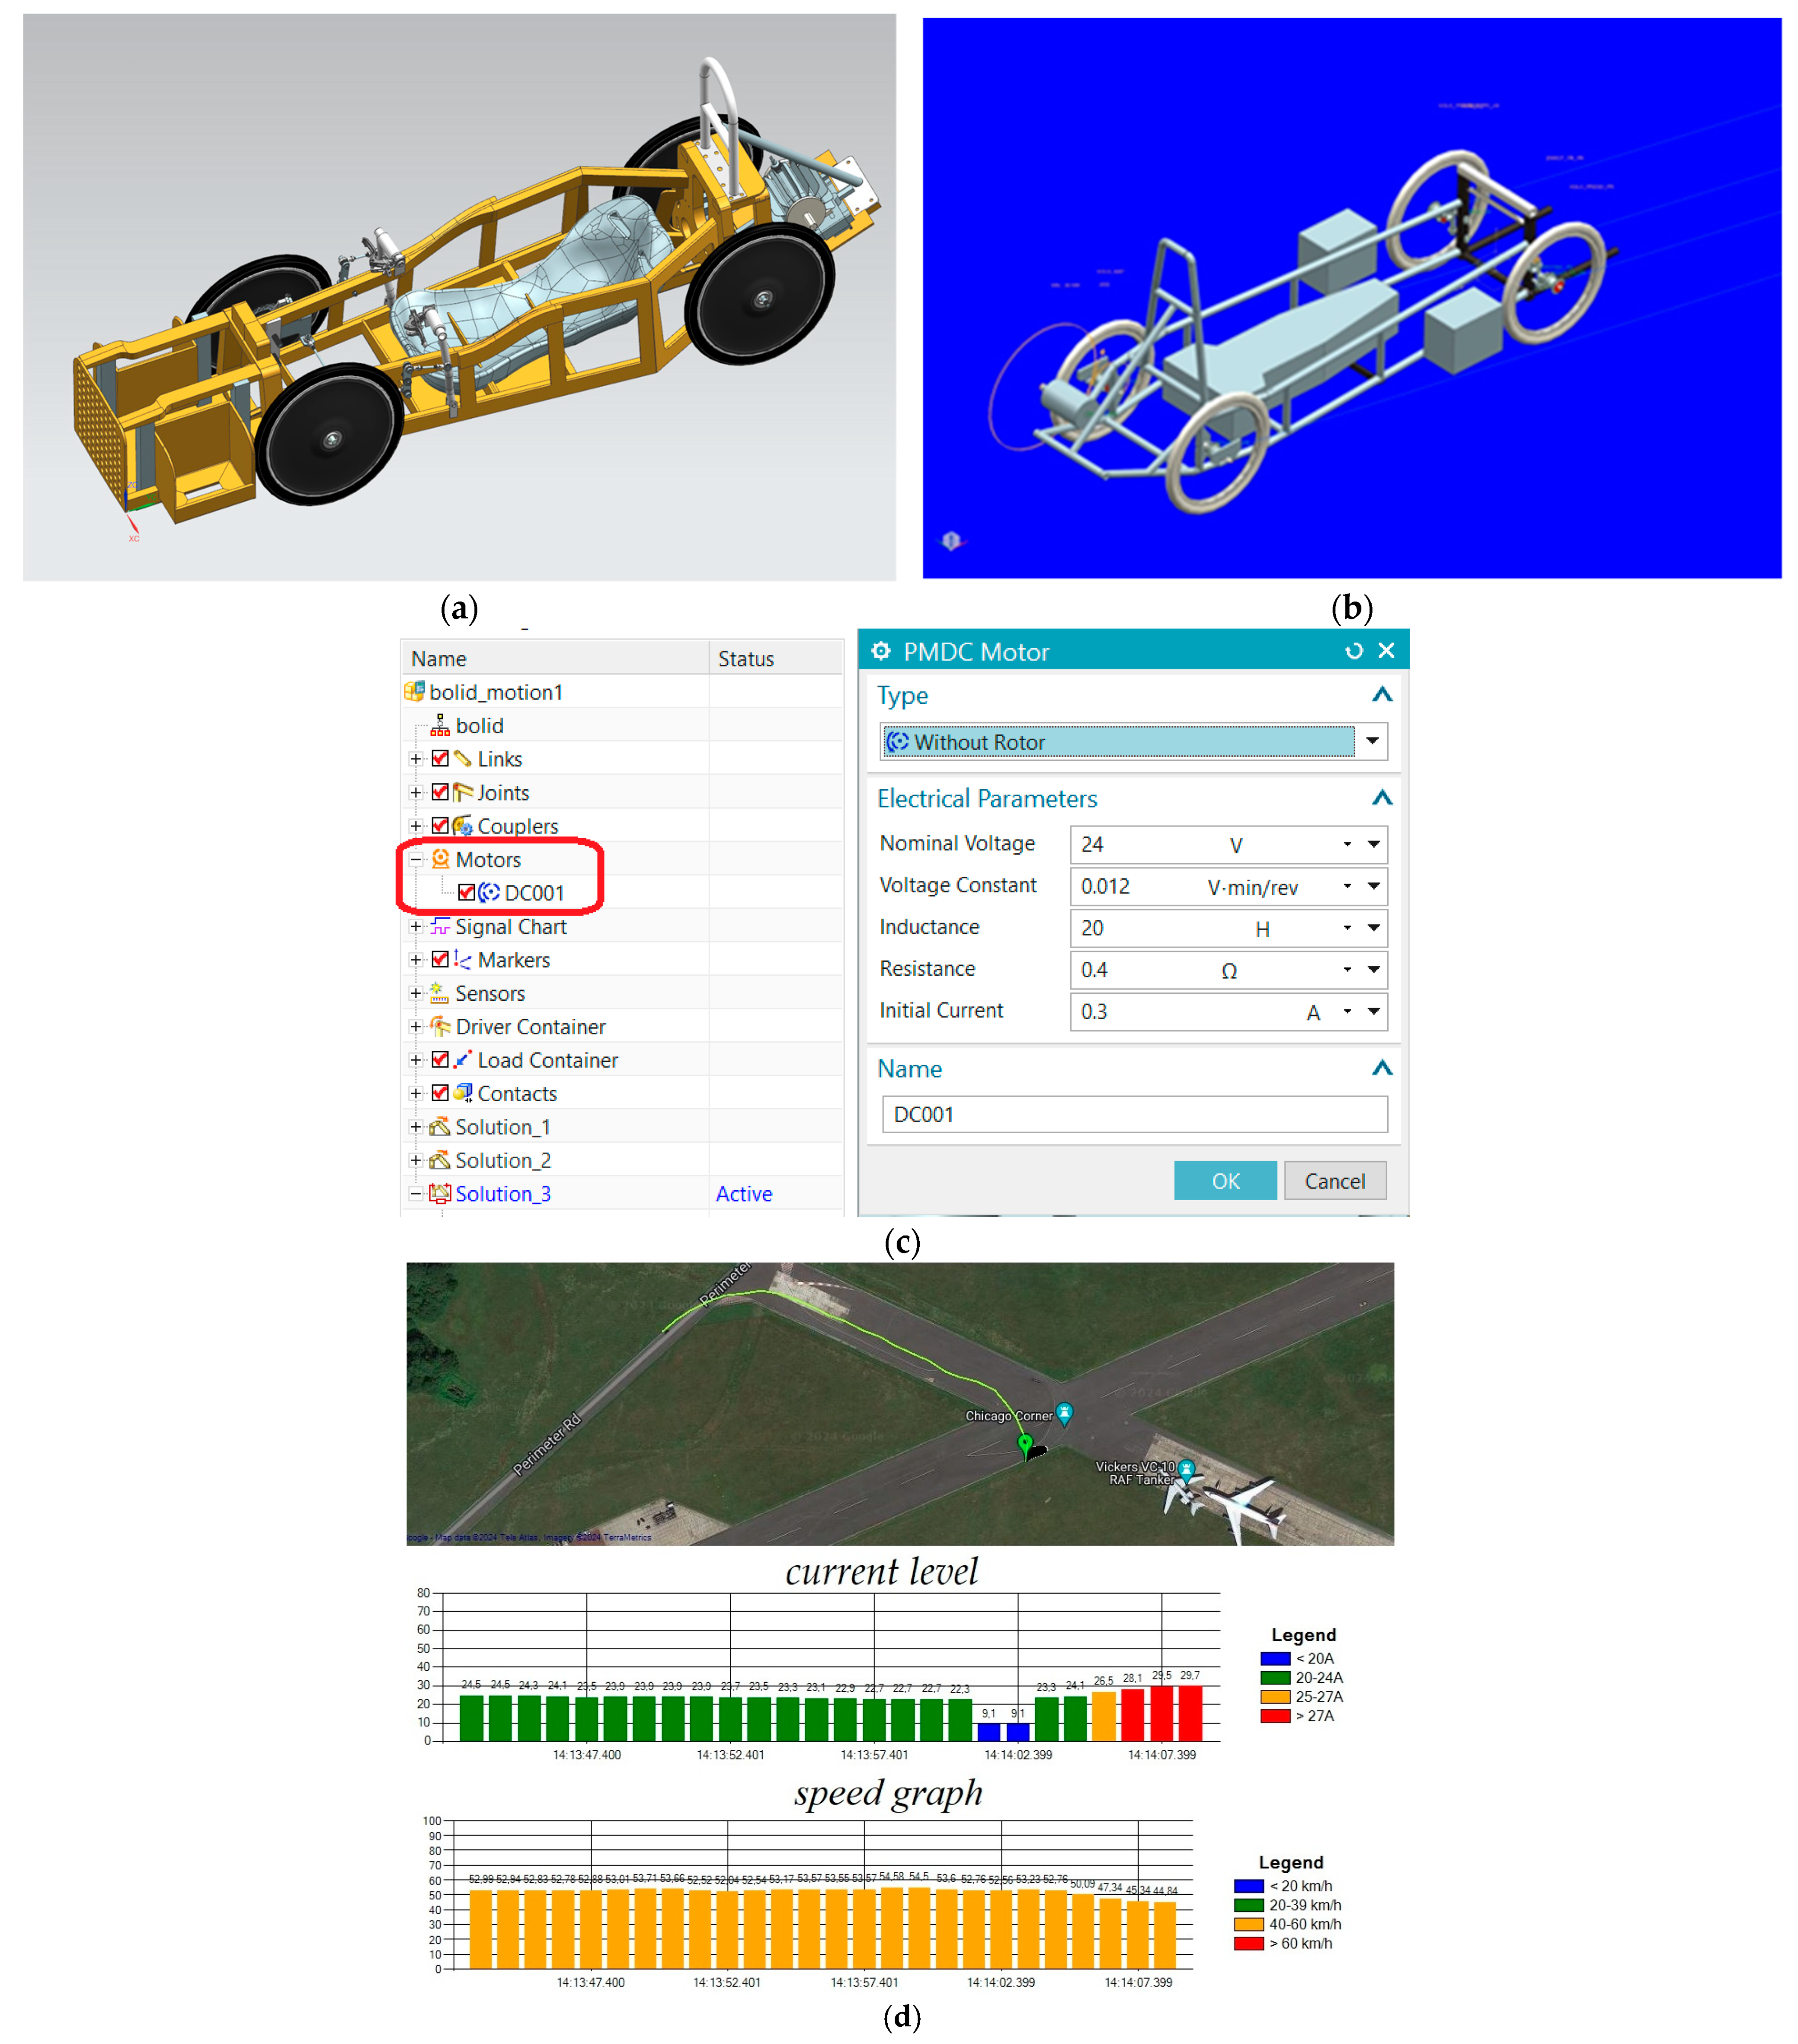
- Creating a CAD model of the car (Figure 7a). Based on the physical parameters, the car is mapped in terms of structure, arrangement of elements in the vehicle, determination of the masses of individual components, determination of technical parameters of the drive, adjustment of chassis parameters, and determination of aerodynamic resistance based on analyses of air flow through the car body (Figure 7b) [64,65]. The body model is omitted and replaced by the impact of aerodynamic drag forces [66]. The model is tuned by modifying the parameters of the car engine (Figure 7c) and adjusting them in such a way that the engine current and the car speed match the data of the telemetry application (Figure 7d).
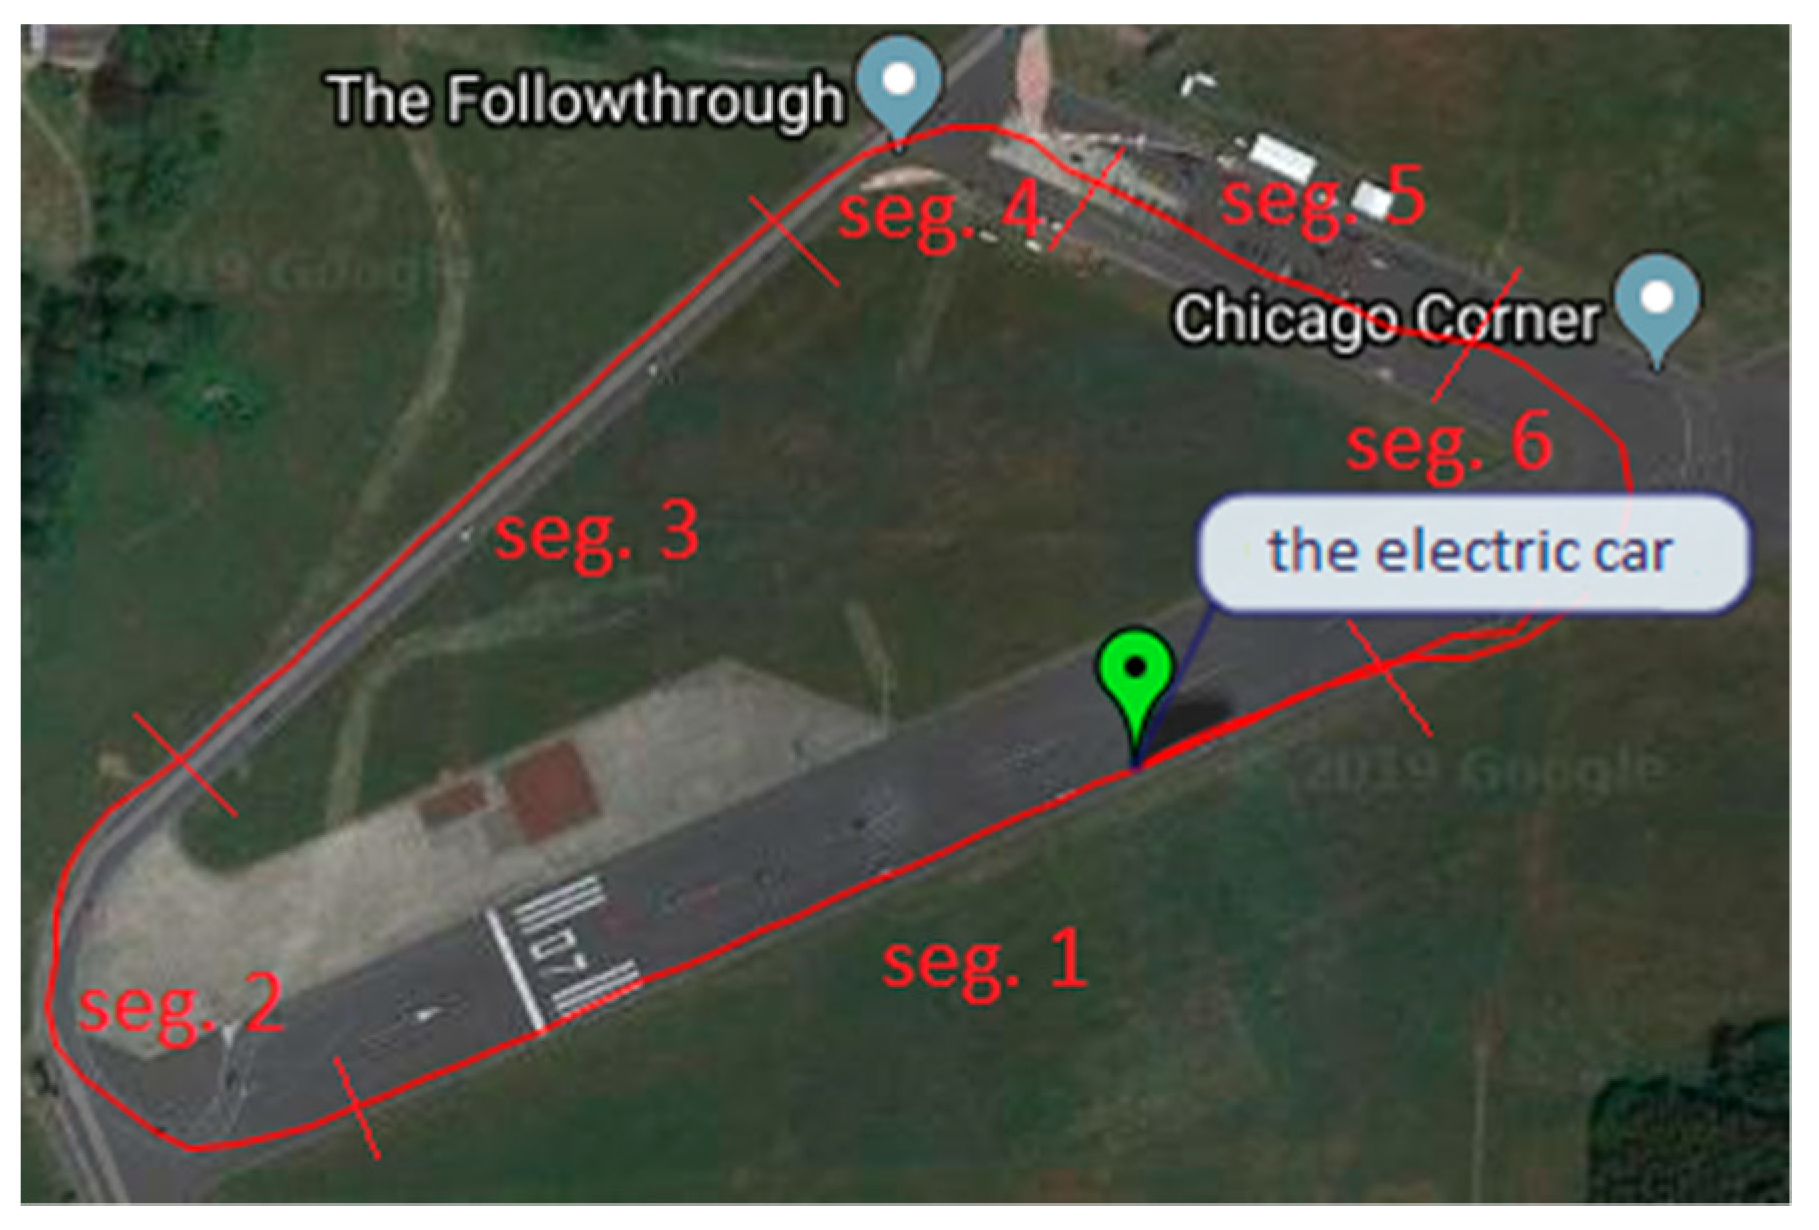
- Building a CAD model of the track on which the car run. The track is modeled based on satellite data, taking into account changes in terrain height. The first step is to make a sketch of the track contour based on satellite photos from a top view, as in Figure 4. Points are added at altitudes corresponding to the altitude [m.a.s.l.] of the corresponding track points based on Google Earth satellite data. In order for the car to move along the desired track, the points of contact between the vehicle and the ground must be determined. For this purpose, the 3D Contact function is used. Four contacts are assigned (each corresponding to each of the vehicle’s wheels) with the same physical values.
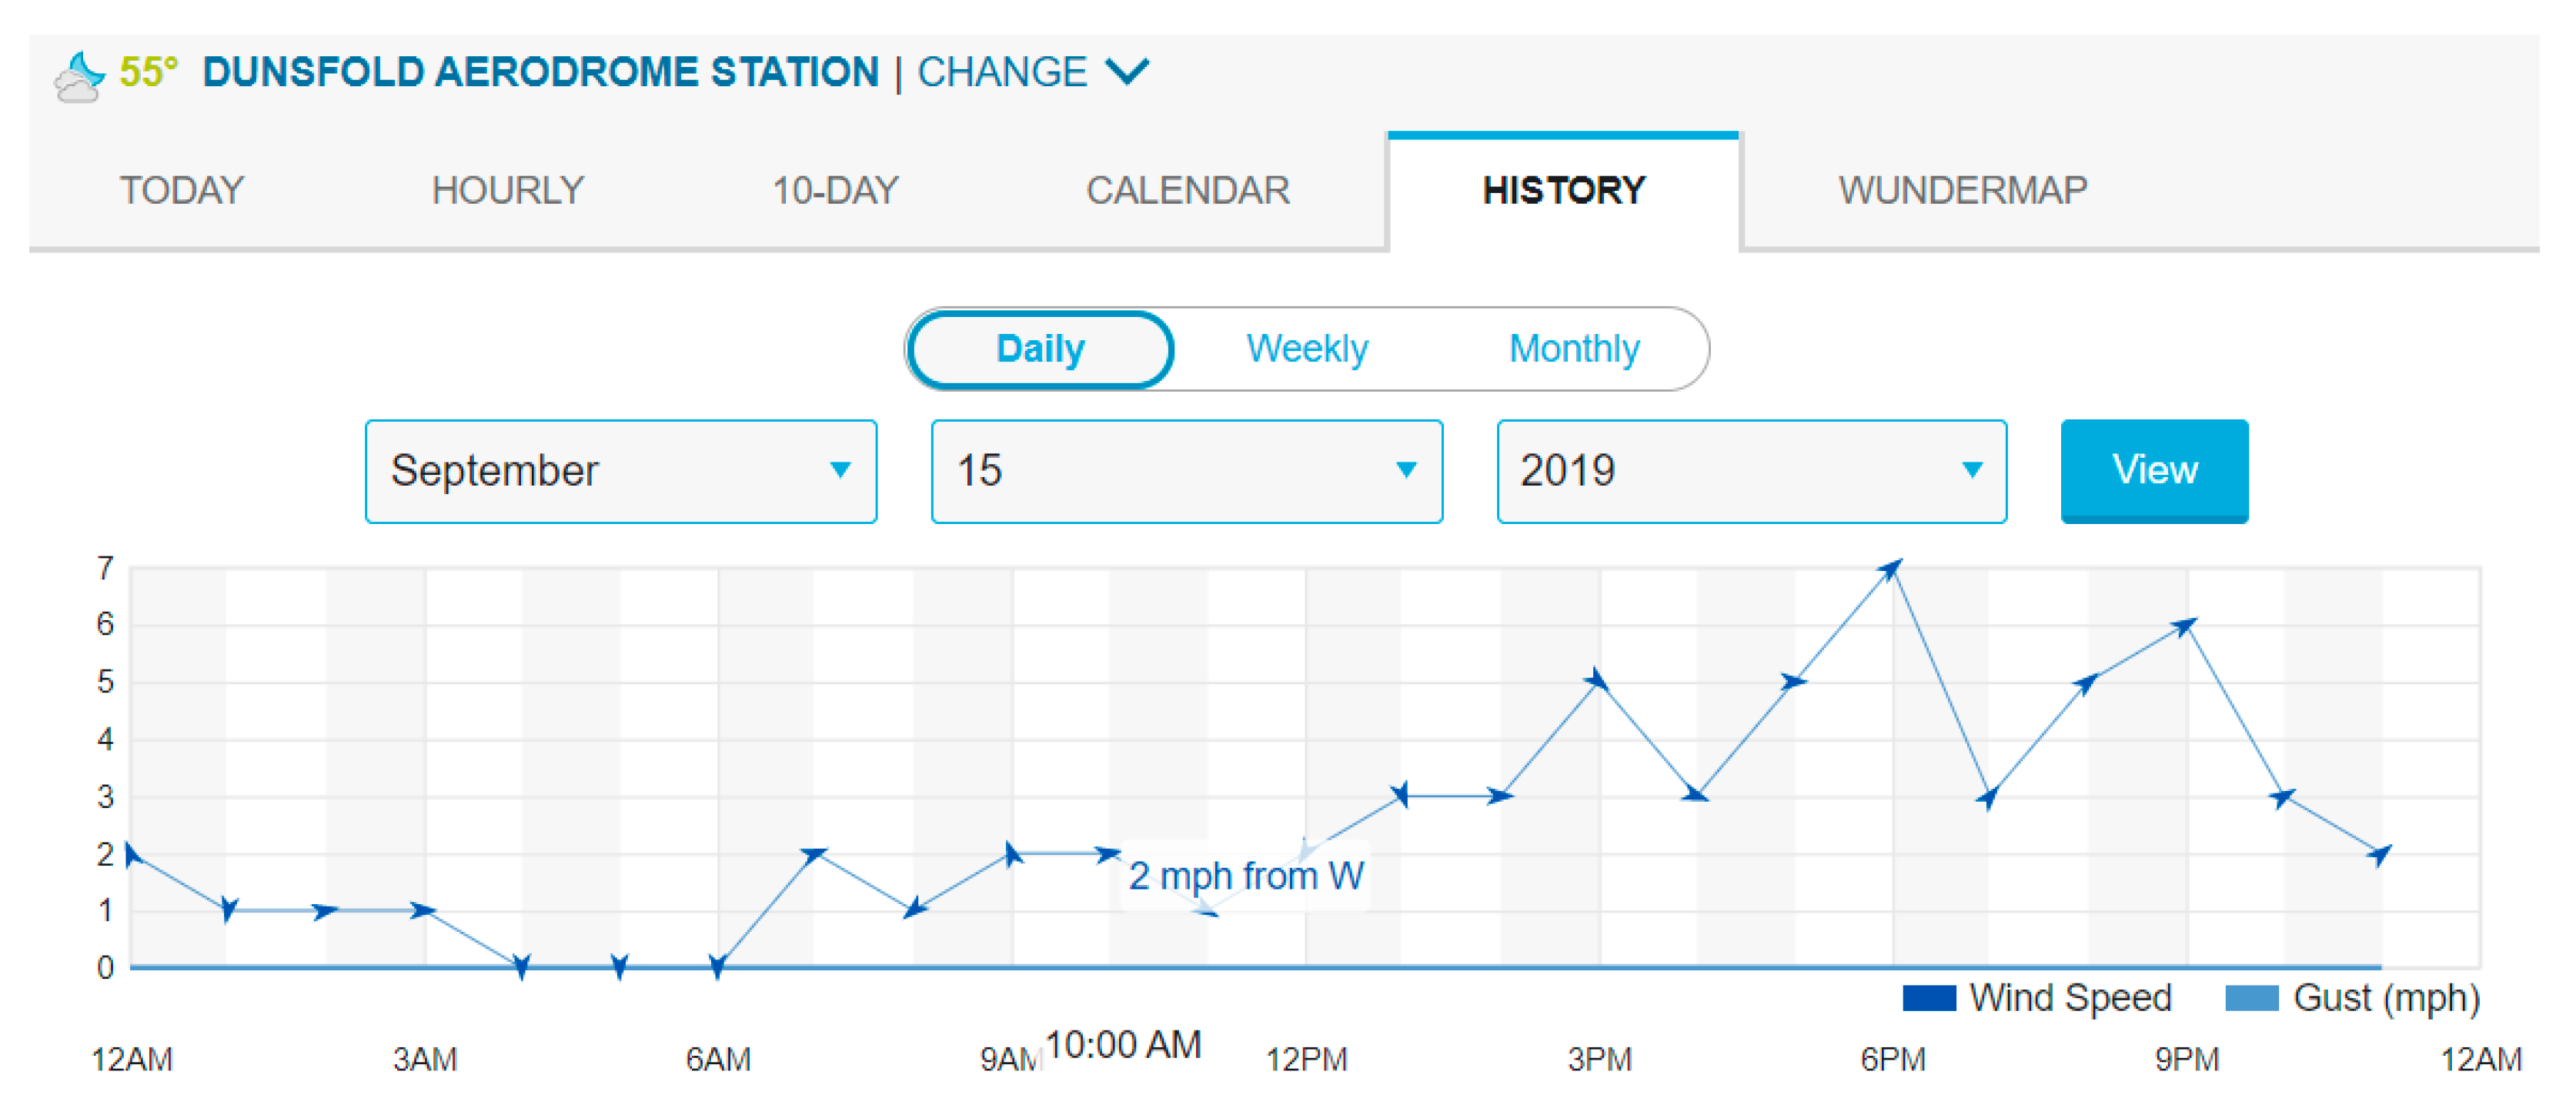
- Creating a simulation in the Siemens NX Motion Simulation module, taking into account the forces acting on the car in the real environment. Atmospheric conditions were modeled. According to the diagram from the Weather Underground website, the wind blows from west to east at a speed of 2 [mph], which after conversion gives a value of 0.89408 [m/s] (Figure 8).
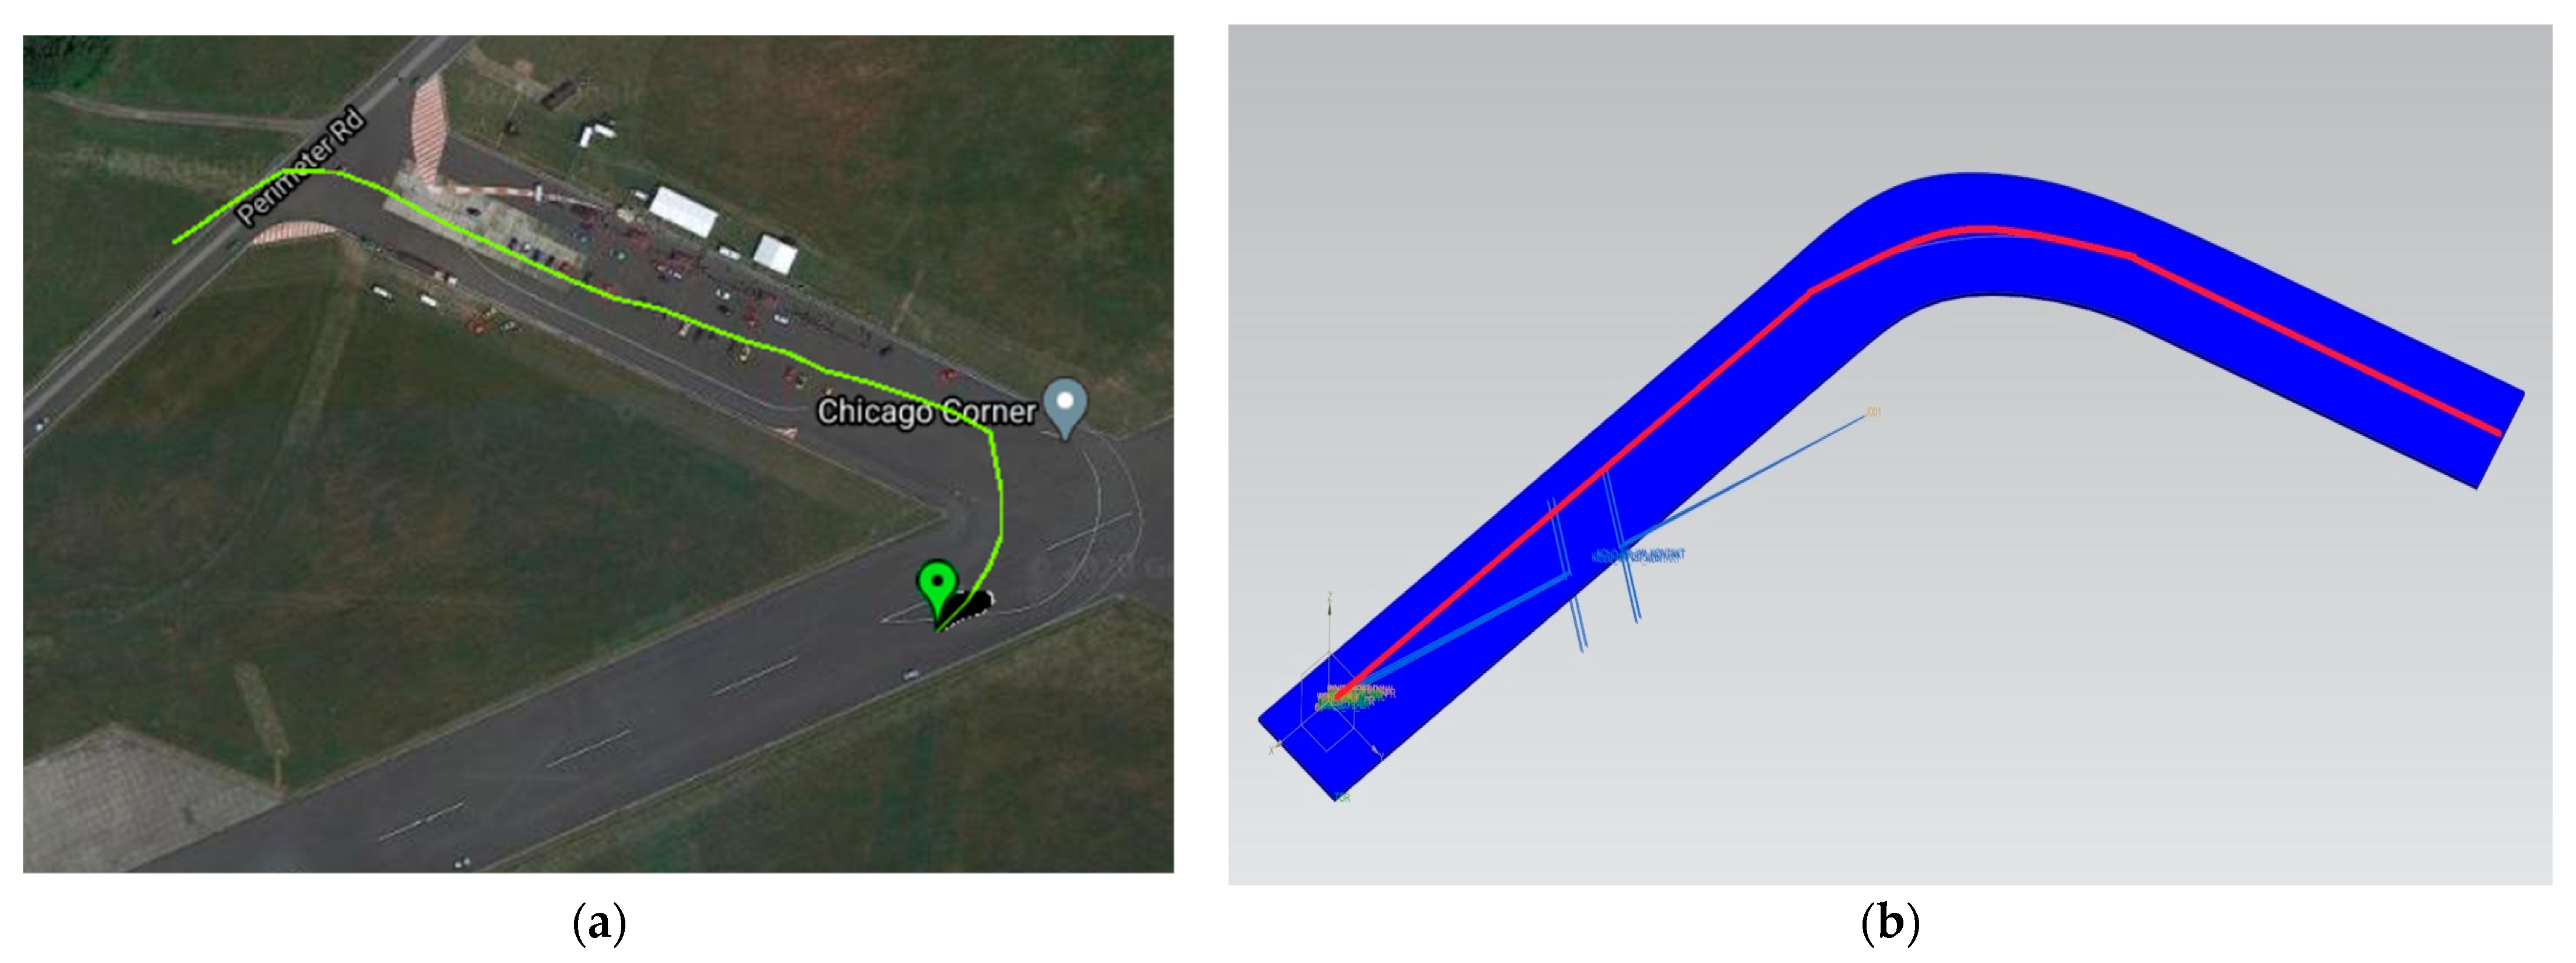
- Reflection of the car’s passage in a virtual environment based on data from the telemetry application. Data obtained from the telemetry system allow for plotting the actual trajectory of the car (Figure 9a). After running a simulation that mirrored part of the Dunsfold track, the car goes around the corner on the same trajectory as the real car in the race. Once this result is achieved, the model is considered tuned and ready for testing (Figure 9b)
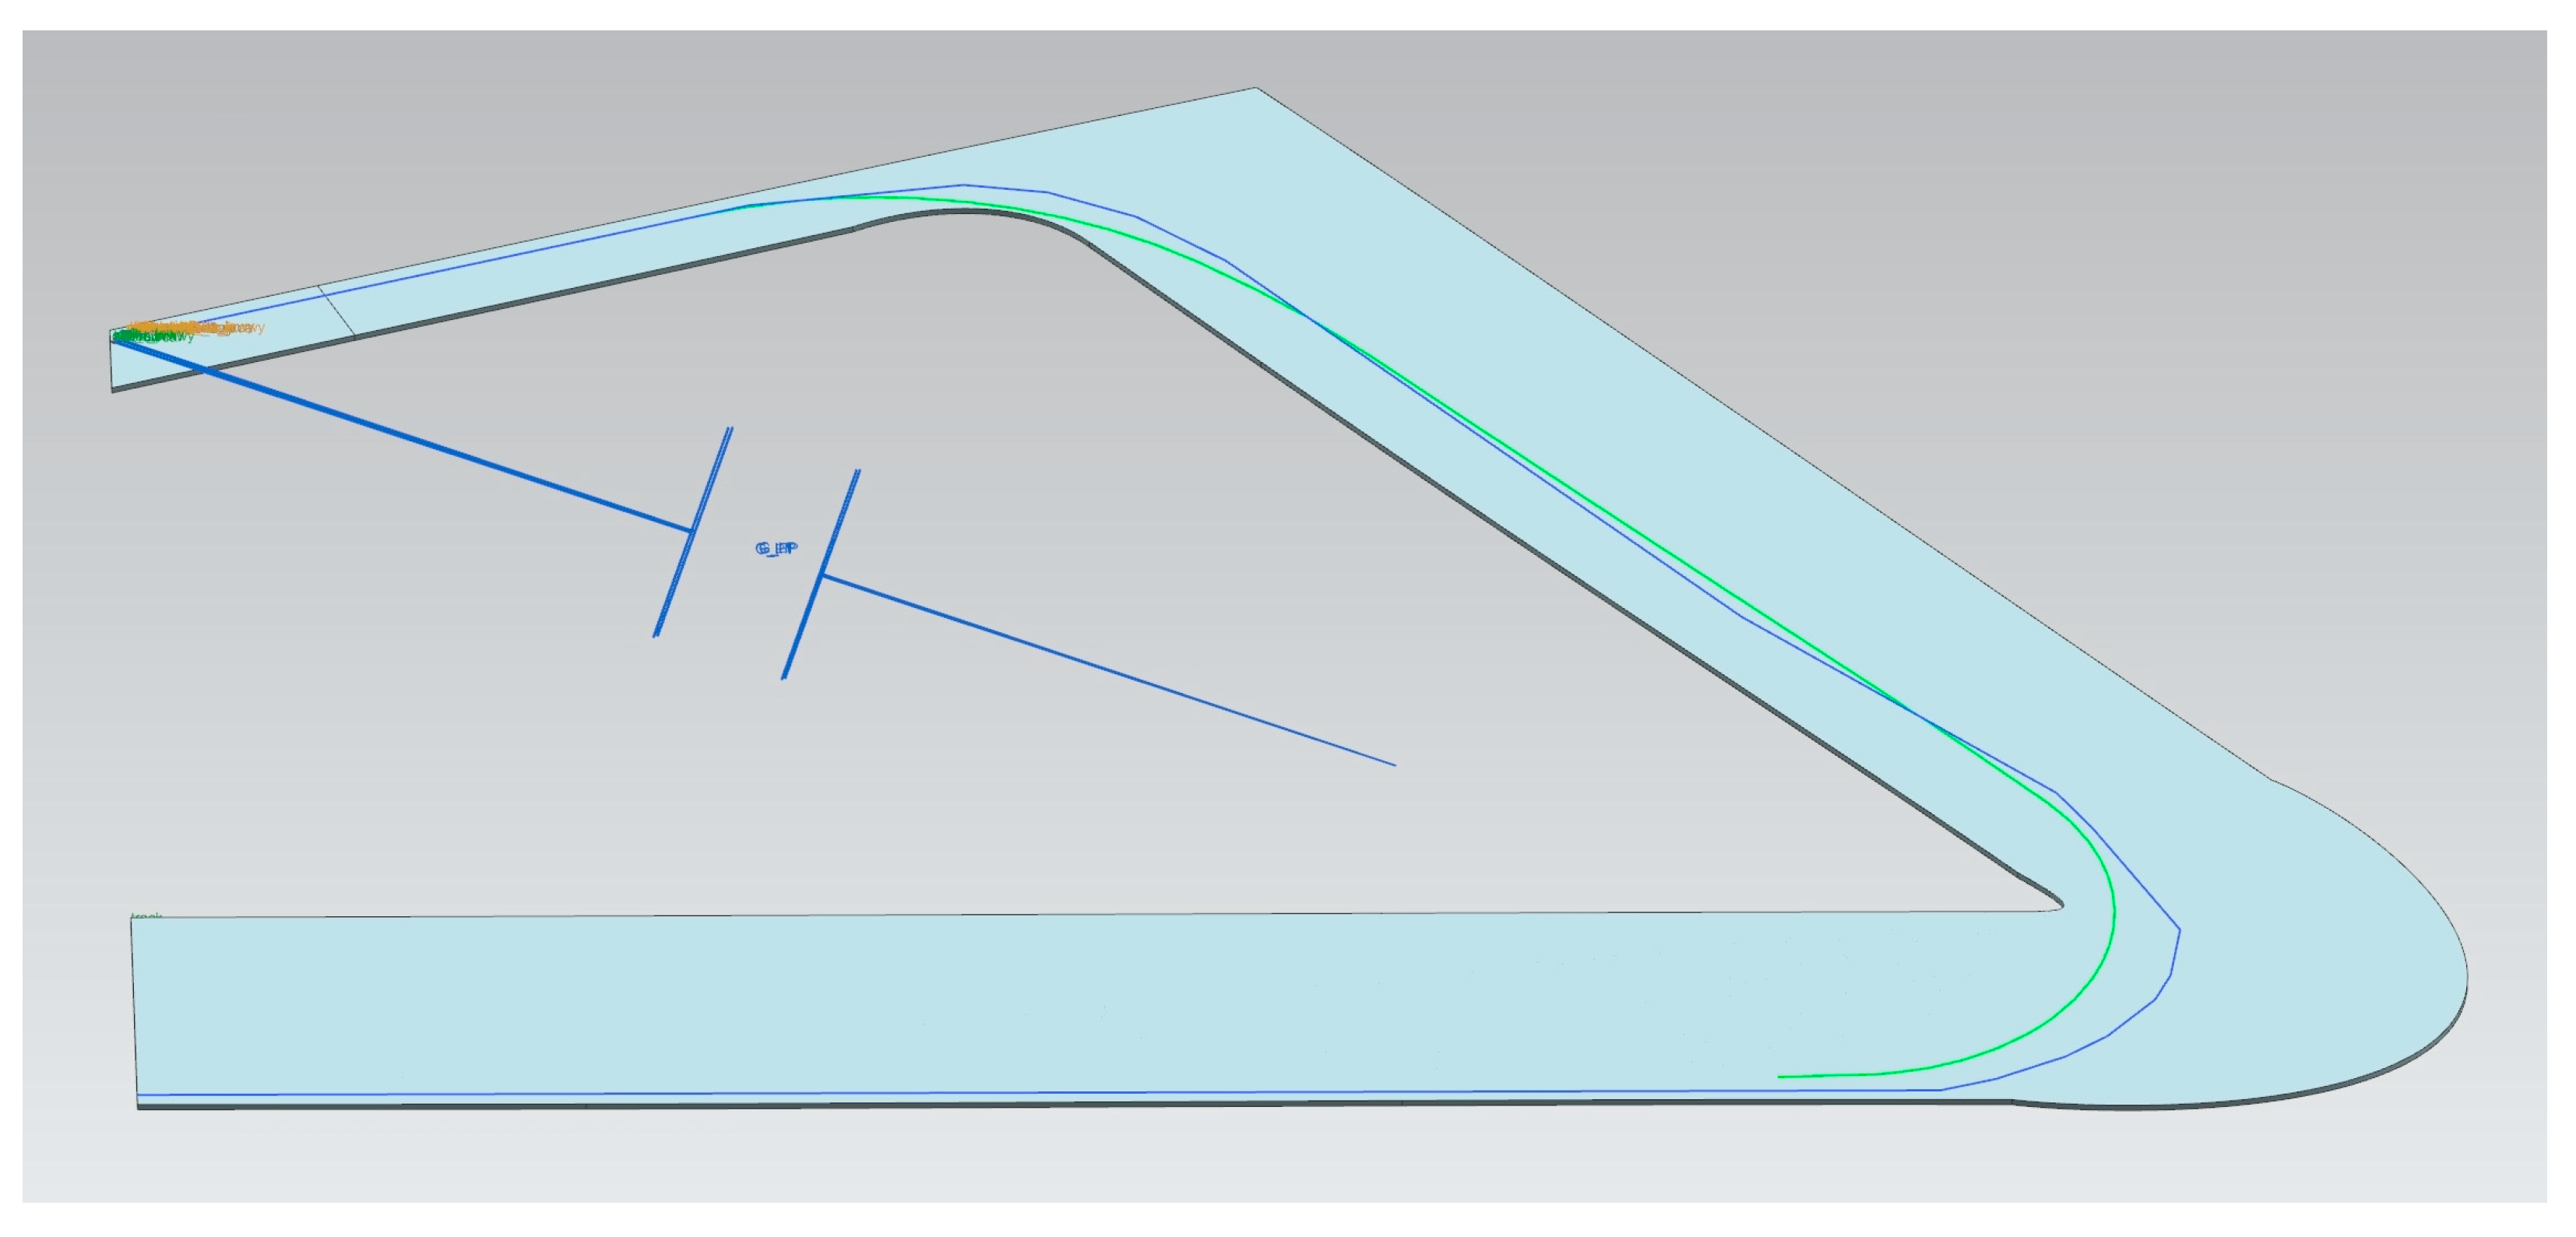
- Optimization of the car’s driving path in the selected corner. The next stage is to route the digital twin along a new route. The goal is to obtain higher travel speeds at a simi-lar current level, i.e., approximately 20A. The test run and the comparison of the movement trajectories are presented in Figure 10. The green line shows the theoretical trajectory, while the blue line reflects the trajectory obtained from the GPS position of the telemetry module.
5. Conclusions and Future Work
Author Contributions
Funding
Institutional Review Board Statement
Informed Consent Statement
Data Availability Statement
Conflicts of Interest
References
- Achouch, M.; Dimitrova, M.; Ziane, K.; Sattarpanah Karganroudi, S.; Dhouib, R.; Ibrahim, H.; Adda, M. On Predictive Maintenance in Industry 4.0: Overview, Models, and Challenges. Appl. Sci. 2022, 12, 8081. [Google Scholar] [CrossRef]
- Teplická, K.; Khouri, S.; Mudarri, T.; Freňáková, M. Improving the Quality of Automotive Components through the Effective Management of Complaints in Industry 4.0. Appl. Sci. 2023, 13, 8402. [Google Scholar] [CrossRef]
- Sanguesa, J.A.; Torres-Sanz, V.; Garrido, P.; Martinez, F.J.; Marquez-Barja, J.M. A Review on Electric Vehicles: Technologies and Challenges. Smart Cities 2021, 4, 372–404. [Google Scholar] [CrossRef]
- Khanum, A.; Lee, C.-Y.; Yang, C.-S. Deep-Learning-Based Network for Lane Following in Autonomous Vehicles. Electronics 2022, 11, 3084. [Google Scholar] [CrossRef]
- Barton, M.; Budjac, R.; Tanuska, P.; Gaspar, G.; Schreiber, P. Identification Overview of Industry 4.0 Essential Attributes and Resource-Limited Embedded Artificial-Intelligence-of-Things Devices for Small and Medium-Sized Enterprises. Appl. Sci. 2022, 12, 5672. [Google Scholar] [CrossRef]
- Digital Twin Industry Worth $110.1 Billion by 2028. Available online: https://www.marketsandmarkets.com/PressReleases/digital-twin.asp (accessed on 11 August 2023).
- Ali, W.A.; Fanti, M.P.; Roccotelli, M.; Ranieri, L. A Review of Digital Twin Technology for Electric and Autonomous Vehicles. Appl. Sci. 2023, 13, 5871. [Google Scholar] [CrossRef]
- Kampczyk, A.; Dybeł, K. The Fundamental Approach of the Digital Twin Application in Railway Turnouts with Innovative Monitoring of Weather Conditions. Sensors 2021, 21, 5757. [Google Scholar] [CrossRef]
- Souanef, T.; Al-Rubaye, S.; Tsourdos, A.; Ayo, S.; Panagiotakopoulos, D. Digital Twin Development for the Airspace of the Future. Drones 2023, 7, 484. [Google Scholar] [CrossRef]
- Tomayko, J.E. Making New Reality: Computers in Simulations and Image Processing. In Computers in Spaceflight: The NASA Experience; Wichita State University: Wichita, KS, USA, 1988; pp. 278–281, Computers in the Apollo Mission Simulators. Available online: https://ntrs.nasa.gov/citations/19880069935 (accessed on 4 November 2023).
- Apollo 13: The First Digital Twin by Stephen Ferguson. Available online: https://blogs.sw.siemens.com/simcenter/apollo-13-the-first-digital-twin/ (accessed on 4 November 2023).
- Shafto, M.; Conroy, M.; Doyle, R.; Glaessgen, E.; Kemp, C.; LeMoigne, J.; Wang, L. Draft modeling, simulation, information technology & processing roadmap. Technol. Area 2010, 11, 1–32. Available online: https://m.moam.info/nasa-modeling-simulation-information-technology-processing-_597ba4671723ddb18e74c884.html (accessed on 4 November 2023).
- Singh, M.; Fuenmayor, E.; Hinchy, E.P.; Qiao, Y.; Murray, N.; Devine, D. Digital Twin: Origin to Future. Appl. Syst. Innov. 2021, 4, 36. [Google Scholar] [CrossRef]
- Kukushkin, K.; Ryabov, Y.; Borovkov, A. Digital Twins: A Systematic Literature Review Based on Data Analysis and Topic Modeling. Data 2022, 7, 173. [Google Scholar] [CrossRef]
- Rjabtšikov, V.; Rassõlkin, A.; Kudelina, K.; Kallaste, A.; Vaimann, T. Review of Electric Vehicle Testing Procedures for Digital Twin Development: A Comprehensive Analysis. Energies 2023, 16, 6952. [Google Scholar] [CrossRef]
- Uhlenkamp, J.-F.; Hauge, J.B.; Broda, E.; Lütjen, M.; Freitag, M.; Thoben, K.-D. Digital Twins: A Maturity Model for Their Classification and Evaluation. IEEE Access 2022, 10, 69605–69635. [Google Scholar] [CrossRef]
- Attaran, M.; Celik, B.G. Digital Twin: Benefits, use cases, challenges, and opportunities. Decis. Anal. J. 2023, 6, 100165. [Google Scholar] [CrossRef]
- Botín-Sanabria, D.M.; Mihaita, A.-S.; Peimbert-García, R.E.; Ramírez-Moreno, M.A.; Ramírez-Mendoza, R.A.; Lozoya-Santos, J.d.J. Digital Twin Technology Challenges and Applications: A Comprehensive Review. Remote Sens. 2022, 14, 1335. [Google Scholar] [CrossRef]
- Hofmann, W.; Branding, F. Implementation of an IoT- and Cloud-based Digital Twin for Real-Time Decision Support in Port Operations. IFAC-PapersOnLine 2019, 52, 2104–2109. [Google Scholar] [CrossRef]
- Lehner, D.; Pfeiffer, J.; Tinsel, E.F.; Strljic, M.M.; Sint, S.; Vierhauser, M.; Wortmann, A.; Wimmer, M. Digital Twin Platforms: Requirements, Capabilities, and Future Prospects. IEEE Softw. 2022, 39, 53–61. [Google Scholar] [CrossRef]
- Boyes, H.; Watson, T. Digital twins: An analysis framework and open issues. Comput. Ind. 2022, 143, 103763. [Google Scholar] [CrossRef]
- Ganguli, R.; Adhikari, S. The digital twin of discrete dynamic systems: Initial approaches and future challenges. Appl. Math. Model. 2020, 77 Pt. 2, 1110–1128. [Google Scholar] [CrossRef]
- Wu, H.; Ji, P.; Ma, H.; Xing, L. A Comprehensive Review of Digital Twin from the Perspective of Total Process: Data, Models, Networks and Applications. Sensors 2023, 23, 8306. [Google Scholar] [CrossRef]
- Yi, H. Improving cloud storage and privacy security for digital twin based medical records. J. Cloud Comp. 2023, 12, 151. [Google Scholar] [CrossRef]
- Feldt, J.; Kourouklis, T.; Kontny, H.; Wagenitz, A. Digital twin: Revealing potentials of real-time autonomous decisions at a manufacturing company. CIRP 2020, 88, 185–190. [Google Scholar] [CrossRef]
- Eirinakis, P.; Lounis, S.; Plitsos, S.; Arampatzis, G.; Kalaboukas, K.; Kenda, K.; Lu, J.; Rožanec, J.M.; Stojanovic, N. Cognitive Digital Twins for Resilience in Production: A Conceptual Framework. Information 2022, 13, 33. [Google Scholar] [CrossRef]
- Mo, D.-H.; Tien, C.-L.; Yeh, Y.-L.; Guo, Y.-R.; Lin, C.-S.; Chen, C.-C.; Chang, C.-M. Design of Digital-Twin Human-Machine Interface Sensor with Intelligent Finger Gesture Recognition. Sensors 2023, 23, 3509. [Google Scholar] [CrossRef]
- Ma, X.; Tao, F.; Zhang, M.; Wang, T.; Zuo, Y. Digital twin enhanced human-machine interaction in product lifecycle. CIRP 2019, 83, 789–793. [Google Scholar] [CrossRef]
- Kritzinger, W.; Karner, M.; Traar, G.; Henjes, J.; Sihn, W. Digital Twin in manufacturing: A categorical literature review and classification. IFAC-PapersOnLine 2018, 51, 1016–1022. [Google Scholar] [CrossRef]
- Sahal, R.; Alsamhi, S.H.; Brown, K.N.; O’Shea, D.; McCarthy, C.; Guizani, M. Blockchain-Empowered Digital Twins Collaboration: Smart Transportation Use Case. Machines 2021, 9, 193. [Google Scholar] [CrossRef]
- Ibrahim, M.; Rjabtšikov, V.; Gilbert, R. Overview of Digital Twin Platforms for EV Applications. Sensors 2023, 23, 1414. [Google Scholar] [CrossRef] [PubMed]
- Park, C.; Chung, S.; Lee, H. Vehicle-in-the-Loop in Global Coordinates for Advanced Driver Assistance System. Appl. Sci. 2020, 10, 2645. [Google Scholar] [CrossRef]
- Vignati, M.; Debattisti, N.; Bacci, M.L.; Tarsitano, D. A Software-in-the-Loop Simulation of Vehicle Control Unit Algorithms for a Driverless Railway Vehicle. Appl. Sci. 2021, 11, 6730. [Google Scholar] [CrossRef]
- Mihalič, F.; Truntič, M.; Hren, A. Hardware-in-the-Loop Simulations: A Historical Overview of Engineering Challenges. Electronics 2022, 11, 2462. [Google Scholar] [CrossRef]
- Issa, R.; Badr, M.M.; Shalash, O.; Othman, A.A.; Hamdan, E.; Hamad, M.S.; Abdel-Khalik, A.S.; Ahmed, S.; Imam, S.M. A Data-Driven Digital Twin of Electric Vehicle Li-Ion Battery State-of-Charge Estimation Enabled by Driving Behavior Application Programming Interfaces. Batteries 2023, 9, 521. [Google Scholar] [CrossRef]
- Venkatesan, S.; Manickavasagam, K.; Tengenkai, N.; Vijayalakshmi, N. Health Monitoring and Prognosis of Electric Vehicle Motor using intelligent-Digital Twin. IET Electr. Power Appl. 2019, 13, 1328–1335. [Google Scholar] [CrossRef]
- Merkle, L.; Pöthig, M.; Schmid, F. Estimate e-Golf Battery State Using Diagnostic Data and a Digital Twin. Batteries 2021, 7, 15. [Google Scholar] [CrossRef]
- Popa, L.; Berdich, A.; Groza, B. CarTwin—Development of a Digital Twin for a Real-World In-Vehicle CAN Network. Appl. Sci. 2023, 13, 445. [Google Scholar] [CrossRef]
- Albatayneh, A.; Assaf, M.N.; Alterman, D.; Jaradat, M. Comparison of the Overall Energy Efficiency for Internal Combustion Engine Vehicles and Electric Vehicles. Environ. Clim. Technol. 2020, 24, 669–680. [Google Scholar] [CrossRef]
- Martyushev, N.V.; Malozyomov, B.V.; Khalikov, I.H.; Kukartsev, V.A.; Kukartsev, V.V.; Tynchenko, V.S.; Tynchenko, Y.A.; Qi, M. Review of Methods for Improving the Energy Efficiency of Electrified Ground Transport by Optimizing Battery Consumption. Energies 2023, 16, 729. [Google Scholar] [CrossRef]
- Sandrini, G.; Chindamo, D.; Gadola, M. Regenerative Braking Logic That Maximizes Energy Recovery Ensuring the Vehicle Stability. Energies 2022, 15, 5846. [Google Scholar] [CrossRef]
- Konzept, A.; Reick, B.; Kaufmann, A.; Hermanutz, R.; Stetter, R. Battery Electric Vehicle Efficiency Test for Various Velocities. Vehicles 2022, 4, 60–73. [Google Scholar] [CrossRef]
- Zhang, Y.; Liu, H.; Zhang, Z.; Luo, Y.; Guo, Q.; Liao, S. Cloud computing-based real-time global optimization of battery aging and energy consumption for plug-in hybrid electric vehicles. J. Power Sources 2020, 479, 229069. [Google Scholar] [CrossRef]
- Almutairi, A.; Albagami, N.; Almesned, S.; Alrumayh, O.; Malik, H. Electric Vehicle Load Estimation at Home and Workplace in Saudi Arabia for Grid Planners and Policy Makers. Sustainability 2023, 15, 15878. [Google Scholar] [CrossRef]
- Restrepo, J.; Rosero, J.; Tellez, S. Performance Testing of Electric Vehicles on operating conditions in Bogotá DC, Colombia. In Proceedings of the 2014 IEEE PES Transmission & Distribution Conference and Exposition-Latin America (PES T&D-LA), Medellin, Colombia, 10–13 September 2014; IEEE: Medellin, Colombia, 2014; pp. 1–8. [Google Scholar]
- Zhao, Z.; Li, L.; Ou, Y.; Wang, Y.; Wang, S.; Yu, J.; Feng, R. A Comparative Study on the Energy Flow of Electric Vehicle Batteries among Different Environmental Temperatures. Energies 2023, 16, 5253. [Google Scholar] [CrossRef]
- Jones, D.; Snider, C.; Nassehi, A.; Yon, J.; Hicks, B. Characterising the Digital Twin: A systematic literature review. CIRP J. Manuf. Sci. Technol. 2020, 29 Pt A, 36–52. [Google Scholar] [CrossRef]
- Nowak, M.; Baier, M. Implementation of object-oriented programming in study of electrical race car. IOP Conf. Ser. Mater. Sci. Eng. 2016, 145, 042028. [Google Scholar] [CrossRef]
- Nowak, M.; Baier, A. Object-oriented application for electric car’s drive. In Selected Engineering Problems; Institute of Engineering Processes Automation and Integrated Manufacturing Systems: Gliwice, Poland, 2015; pp. 57–62. Available online: https://yadda.icm.edu.pl/yadda/element/bwmeta1.element.baztech-3da429a2-dc05-44b5-8817-233d21ece891/c/nowak_object_6_2016.pdf (accessed on 11 August 2023).
- Instruction Manual and Data Sheet Torque Sensor Series 2000. Available online: https://ncte.com/wp-content/uploads/2020/09/Instruction_manual_data_sheet_series2000_EN.pdf (accessed on 11 August 2023).
- GreenPower Motor Datasheet. Available online: http://www.greenpower.beamweb.co.uk/files/TechnicalInfo/GreenpowerF24PerformanceGraph.pdf (accessed on 11 August 2023).
- SEW Eurodrive. Parameter and Operating State Indicators. Available online: https://download.sew-eurodrive.com/download/pdf/16872819.pdf (accessed on 23 July 2023).
- SEW Eurodrive. Fieldbus Interface DFE11B Ethernet. Available online: https://download.sew-eurodrive.com/download/pdf/11284110.pdf (accessed on 23 July 2023).
- SEW Eurodrive. Communication and Fieldbus Unit Profile. Available online: https://assets.euautomation.com/uploads/parts/pdf/usb11a.pdf (accessed on 23 July 2023).
- SEW Eurodrive. MOVIDRIVE® MDX60B/61B. Available online: https://download.sew-eurodrive.com/download/pdf/23538457.pdf (accessed on 23 July 2023).
- Figueroa-Lorenzo, S.; Añorga, J.; Arrizabalaga, S. A Role-Based Access Control Model in Modbus SCADA Systems. A Centralized Model Approach. Sensors 2019, 19, 4455. [Google Scholar] [CrossRef]
- Mejías, A.; Herrera, R.S.; Márquez, M.A.; Calderón, A.J.; González, I.; Andújar, J.M. Easy Handling of Sensors and Actuators over TCP/IP Networks by Open Source Hardware/Software. Sensors 2017, 17, 94. [Google Scholar] [CrossRef]
- Modbus Organization. Modbus Application Protocol Specification. Available online: https://modbus.org/docs/Modbus_Application_Protocol_V1_1b.pdf (accessed on 11 August 2023).
- National Instruments. Modbus Master Plasmionique Inc. Available online: https://www.ni.com/en/support/downloads/toolsnetwork/download.modbus-master.html#374378 (accessed on 23 July 2023).
- Niknejad, P.; Agarwal, T.; Barzegaran, M.R. Utilizing Sequential Action Control Method in GaN-Based High-Speed Drive for BLDC Motor. Machines 2017, 5, 28. [Google Scholar] [CrossRef]
- Estrada, L.; Vázquez, N.; Vaquero, J.; de Castro, Á.; Arau, J. Real-Time Hardware in the Loop Simulation Methodology for Power Converters Using LabVIEW FPGA. Energies 2020, 13, 373. [Google Scholar] [CrossRef]
- Stević, Z.; Andjelković, Z.; Antić, D. A New PC and LabVIEW Package Based System for Electrochemical Investigations. Sensors 2008, 8, 1819–1831. [Google Scholar] [CrossRef] [PubMed]
- Stalica, A.; Błachuta, M.; Baier, A.; Zur, P.; Kołodziej, A.; Konopka, P.; Komander, M. Telemetric System for Silesian Greenpower’s Vehicle. IOP Conf. Ser. Mater. Sci. Eng. 2019, 564, 012119. Available online: https://iopscience.iop.org/article/10.1088/1757-899X/564/1/012119 (accessed on 23 July 2023). [CrossRef]
- Baier, A.; Komander, M.; Nowak, A.; Konopka, P.; Kołodziej, A.; Żur, P. Designing and verifying the concept of Silesian Greenpower electric bolide structure. In Proceedings of the Innovative Manufacturing Engineering and Energy (IManEE 2019), Pitesti, Romania, 22–24 May 2019; pp. 1–7. [Google Scholar] [CrossRef]
- Żur, P.; Baier, A.; Kołodziej, A. Influence of selected parameters of the motor controller on the current characteristics of the DC brush motor used in the Silesian Greenpower’s Vehicle. In Proceedings of the 4th International Conference on Mechanical, Manufacturing, Modeling and Mechatronics IC4M 2019, in Conjunction with 4th International Conference on Design Engineering and Science, ICDES 2019, Nice, France, 22–24 February 2019. [Google Scholar] [CrossRef]
- Grabowski, Ł.; Baier, A.; Buchacz, A.; Majzner, M.; Sobek, M. Application of CAD/CAE class systems to aerodynamic analysis of electric race cars. In Proceedings of the Modern Technologies in Industrial Engineering (ModTech2015), Mamaia, Romania, 17–20 June 2015. [Google Scholar] [CrossRef]


| Category | Dimensions | Comment |
|---|---|---|
| Context [17,18] | Reference object | What does a DT represent? A product, a manufacturing asset, a production line, a process, a factory, or a human. These objects are at different levels of abstraction. |
| Tangible product life cycle phases | The phase of the product life cycle at which a DT is applied: beginning, middle or end of life. | |
| Application domain | A sector for implementing a DT, e.g., manufacturing, aerospace, healthcare, automotive, maritime. | |
| Benefits | Improving existing services, adding new value, or establishing a new service. | |
| Computing capabilities [19,20] | Trigger types (simulation capabilities) | A simulation starts on a specific event and runs continuously or once at a specific time. |
| Model look-ahead perspective | Time horizon for using a DT: single specific operation or the entire period of product cooperation. | |
| Computing capabilities | Overall response time from a DT, processing speed. Time required from DT to be updated. | |
| Update frequency—input | How often a piece of new data appears: in real time or less frequently. | |
| Update frequency—output | Outputs from DT are immediate, real-time, or periodic due to the strategy implemented. | |
| Model [21,22] | Creation time | A DT was designed in parallel with the product’s design or later in the product life cycle. |
| Modelled characteristics | Which object behavior is modelled: geometric, kinematic, sensor, control, or system characteristics. | |
| Digital model types | Referring to the types of simulation models, the following are distinguished:
| |
| Model authenticity | How reliable is the digital twin representation compared to the actual product? | |
| Model maintenance | DT’s ability to ensure system validation and accuracy in new circumstances. Some cases require manual adaptation, while others are autonomous. | |
| Modularity | How the architecture of the DT system is designed and whether it integrates more modules.
| |
| Data [23,24] | Data storage | The location where data are stored depends on the size, type, and method of obtaining it: local disk, local server, cloud. |
| Data scope | The scale of data acquisition. Data from a single object, external data from many resources or big data. | |
| Data quality | Matching system requirements. The attributes of data quality are accuracy, completeness, consistency, and uniqueness. | |
| Data sources | DT uses data from physical sensors and measurements but also from simulation and analysis. | |
| Data interpretation | DT’s capabilities to use incoming data. If a DT operates on irregular and unsorted data. | |
| Control [25,26] | Level of cognition | DT is only for monitoring and diagnostic purposes or gives predictive forecasts based on a simulation. |
| Levels of autonomy | How DT processes decisions: with user support or fully independently, autonomous. | |
| Learning capabilities | Determines whether a machine learning algorithm exists; supervised, semi-supervised, unsupervised, and reinforced. | |
| Human–machine interaction (HMI) [27,28] | Types of interaction devices | Method of interacting with DT, starting with keyboard, mouse, display, and touchscreen. It may also include remote control via mobile phones or even cameras for the adaptive assistance system. |
| Human interaction capabilities | In case of new challenges, DT adapts itself or the output responses are predefined. | |
| Integration [29,30] | Digital twin interaction | Specifies whether there is only one DT or multiple DTs and describes how they collaborate. |
| Hierarchy | This dimension provides information about the rank of collaborating DTs. | |
| Connection mode | The connection between a DT and a physical object.
| |
| User focus | DT can be useful for an individual user, a department, a company, or several organizations. | |
| Collaboration | There are DTs established for different organizations, there is data exchange between them, and they can have similar purposes or work independently. |
| Method | MiL | SiL | PiL/FiL | HiL | ViL | Test Drive | |
|---|---|---|---|---|---|---|---|
| Aspect | |||||||
| Software simulated model | ✓ | ✓ | ✓ | ✓ | |||
| Control simulator | ✓ | ||||||
| Embedded processor | ✓ | ✓ | ✓ | ✓ | |||
| I/O, communication | ✓ | ✓ | ✓ | ||||
| Real conditions | ✓ | ||||||
| Topic | Description |
|---|---|
| Battery digital twin [35] | Based on available measurements from the LIB module, a DT framework was proposed in which various algorithms estimate the battery charge state. The digital twin of the battery is compared to the real-world module. |
| Health monitoring and prognosis of electric vehicle motor [36] | Data, such as speed, time, housing, and winding temperature, are collected to train an artificial neural network (ANN). The electric motor is modelled in Simulink and connected to the ANN. The engine health can be monitored with real engine data stored in the cloud. |
| eGolf battery digital twin [37] | Data from the car is sent to the cloud via the 4G mobile network. The DT of the battery estimates the state of charge and health condition. Battery status can be diagnosed by the end-user while driving. |
| Car twin [38] | Automotive systems, such as the anti-lock braking system, immobilization control module, power control module, power steering control module, and others, are modelled in Simulink. Input signals are collected from the car via the controller area network, comparing car simulation results with real-world data collect while driving a car. |
| Parameter | Name | Value |
|---|---|---|
| P100 | Setpoint source | Fieldbus |
| P101 | Control signal source | |
| P700 | Operating mode 1 | CFC and torque control |
| P870 | Setpoint description PO1 | Control word 1 |
| P871 | Setpoint description PO2 | Current |
| P872 | Setpoint description PO3 | No function |
| P873 | Actual value description PI1 | Status word 1 |
| P874 | Actual value description PI2 | Speed |
| P875 | Actual value description PI3 | Output current |
| P876 | PO data enable | ON |
| Bit | Functionality | Assignment |
|---|---|---|
| 0 | Fixed definition | Controller inhibit “1”/Enable “0” |
| 1 | Enable “1”/Rapid stop “0” | |
| 2 | Enable “1”/Stop “0” | |
| 3 | Hold control | |
| 4 | Integrator switchover | |
| 5 | Parameter set switch-over | |
| 6 | Reset | |
| 7 | Reserved | |
| 8 | Direction of rotation for motor potentiometer | 0 = CW direction of rotation 1 = CCW direction of rotation |
| 9 10 | Motor potentiometer acceleration Motor potentiometer deceleration | 10 9 0 0 = no change 0 1 = up 1 0 = down 1 1 = no change |
| 11 12 | Selection of the internal fixed setpoints n11–n13 or n21–n23 | 12 11 0 0 = Speed setpoint via process output data word 2 0 1 = Internal setpoint n11 n(21) 1 0 = Internal setpoint n12 n(22) 1 1 = Internal setpoint n13 n(23) |
| 13 | Fixed setpoint switchover | 0 = Fixed setpoint of the active parameter set selected by bit 11/12 1 = Fixed setpoint of another set of parameters selected by bit 11/12 |
| 14 15 | Reserved | Set reserved bits to 0 |
| Byte | Name | Notes |
|---|---|---|
| 0–1 | Transaction ID | MBAP—Modbus Application header |
| 2–3 | Protocol ID | |
| 4–5 | Length field | |
| 6 | Client ID | |
| 7 | Function code | PDU—protocol data unit |
| 8–n 1 | Data |
| Offset | Meaning for Read Operation | Meaning for Write Operation | Remarks |
|---|---|---|---|
| 0hex–3hex | Reserved | Reserved | No access |
| 4hex–Dhex | Process input data (actual values) | Process output data (setpoints) | Max. 10 words for MDX61B Access via FC3, FC16, FC23 |
| Segment No. | Length [m] | Setpoint Value |
|---|---|---|
| 1 | 445 | 45 |
| 2 | 165 | 10 |
| 3 | 308 | −25 |
| 4 | 83 | 10 |
| 5 | 181 | 20 |
| 6 | 191 | 30 |
| Description | |
|---|---|
| Strengths | Data-driven model uses real-world data Research station consists of the same parts as the racing car Various scenarios can be simulated |
| Weakness | Depends on data quality Lack of physical understanding of the data Manual method for implementing input data |
| Opportunities | The entire system can be expanded Indoor testing reduces time and costs |
| Threats | Complexity of data integration Requires appropriate validation |
Disclaimer/Publisher’s Note: The statements, opinions and data contained in all publications are solely those of the individual author(s) and contributor(s) and not of MDPI and/or the editor(s). MDPI and/or the editor(s) disclaim responsibility for any injury to people or property resulting from any ideas, methods, instructions or products referred to in the content. |
© 2024 by the authors. Licensee MDPI, Basel, Switzerland. This article is an open access article distributed under the terms and conditions of the Creative Commons Attribution (CC BY) license (https://creativecommons.org/licenses/by/4.0/).
Share and Cite
Bednarz, T.; Baier, A.; Paprocka, I. A Framework for Communicating and Building a Digital Twin Model of the Electric Car. Appl. Sci. 2024, 14, 1776. https://doi.org/10.3390/app14051776
Bednarz T, Baier A, Paprocka I. A Framework for Communicating and Building a Digital Twin Model of the Electric Car. Applied Sciences. 2024; 14(5):1776. https://doi.org/10.3390/app14051776
Chicago/Turabian StyleBednarz, Tomasz, Andrzej Baier, and Iwona Paprocka. 2024. "A Framework for Communicating and Building a Digital Twin Model of the Electric Car" Applied Sciences 14, no. 5: 1776. https://doi.org/10.3390/app14051776
APA StyleBednarz, T., Baier, A., & Paprocka, I. (2024). A Framework for Communicating and Building a Digital Twin Model of the Electric Car. Applied Sciences, 14(5), 1776. https://doi.org/10.3390/app14051776