Article

Photocatalytic Oxidization Based on TiO2/Au Nanocomposite Film for the Pretreatment of Total Phosphorus (TP)

School of Electronic and Electrical Engineering, Kyungpook National University, Daegu 41566, Republic of Korea
*
Author to whom correspondence should be addressed.
These authors contributed equally to this work.
Appl. Sci. 2024, 14(5), 1774; https://doi.org/10.3390/app14051774
Submission received: 31 December 2023 / Revised: 4 February 2024 / Accepted: 14 February 2024 / Published: 22 February 2024
(This article belongs to the Topic Advanced Nanomaterials for Sensing Applications)

Abstract

:
Phosphorus, an essential rare element in aquatic ecosystems, plays a key role in maintaining ecosystem balance. However, excess phosphorus leads to eutrophication and algal proliferation. To prevent eutrophication, the pretreatment and measuring of the concentration of total phosphorus (TP) is crucial. Compared to conventional TP pretreatment equipment (autoclave), a lab-on-a-chip detection device fabricated using micro-electromechanical system technology and titania (TiO2) as a photocatalyst is more convenient, efficient, and cost-effective. However, the wide bandgap of TiO2 (3.2 eV) limits photocatalytic activity. To address this problem, this paper describes the preparation of a TiO2/Au nanocomposite film using electron-beam evaporation and atomic-layer deposition, based on the introduction of gold film and TiO2 to a quartz substrate. The photocatalytic degradation properties of TiO2/Au nanocomposite films with thicknesses of 1, 2, 3, and 4 nm were assessed using rhodamine B as a pollutant. The experimental results demonstrate that the deposition of gold films with different thicknesses can enhance photocatalytic degradation efficiency through synergetic reactions in the charge separation process on the surface. The optimal photocatalytic efficiency is achieved when the deposition thickness is 2 nm, and it decreases with further increase in the thickness. When the photocatalytic reaction time is 15 min, the lab-on-a-chip (LOC) device with a 2-nm-thick gold layer and autoclave exhibits a similar TP pretreatment performance. Therefore, the proposed LOC device based on photocatalytic technology can address the limitations of conventional autoclave equipment, such as large volumes, long processing times, and high costs, thereby satisfying the growing demand for on-site evaluation.

1. Introduction

With progress in human industrialization and urbanization, although human living standards have continually improved, challenges such as environmental pollution, resource depletion, and ecosystem destruction have emerged. Phosphorus, a crucial trace element in plant photosynthesis, plays a vital role in maintaining ecological balance [1]. However, the accelerated pace of human industrialization has disrupted the balance of trace elements in the ecosystem. In particular, the discharge of phosphorus-containing substances into rivers and lakes has led to frequent occurrences of algal bloom and water eutrophication [2,3,4,5,6,7,8,9,10,11,12,13,14,15].
Given these concerns, it has become essential to monitor the concentration of total phosphorus (TP) in aquatic ecosystems to prevent eutrophication. As phosphorus typically exists in nature in compound forms, it is challenging to directly detect the TP concentration. This necessitates the conversion of organic and inorganic compounds containing phosphorus into easily detectable phosphates (PO43−) through pretreatments in advance, a process known as TP pretreatment.
Phosphorus-containing compounds are separated into phosphates via pretreatment and colored blue by a coloring agent. The concentration of TP is determined by measuring the absorbance of the blue compounds post-dyeing. As mentioned above, as a crucial stage in the TP analysis process, pretreatment significantly influences the accuracy and reliability of TP concentration testing. Currently, phosphorus-containing compounds are pretreated using a conventional piece of pretreatment equipment called an autoclave. Autoclave pretreatment necessitates operation under high temperature and pressure conditions. Given its substantial size and considerable cost, it is primarily employed in laboratories, research institutes, and similar facilities [16,17,18].
Compared with the conventional method of using an autoclave for pretreatment, photocatalysis technology has emerged as a promising solution to address the above-mentioned challenges. Through photocatalytic reactions using potassium persulfate (K2S2O8) as the oxidizing agent, organic and inorganic compounds containing phosphorus can be pretreated and transformed into easily detectable PO43−, and the phosphorus content in water can be monitored through changes in the PO43− concentration.
The process flows of the two types of TP pretreatment and measurement methods are shown in Figure 1. Both types of method include the pretreatment and measurement of TP samples that differ mainly in terms of TP pretreatment strategy. The first type of approach uses a conventional autoclave to pretreat the organic and inorganic compounds containing phosphorus and transform them into easily detectable PO43− under high temperature (121 °C) and high pressure (1.1 kg/cm2) conditions, adopting K2S2O8 as the oxidizing agent. This conventional TP pretreatment method requires that the sample is oxidized for least 30 mins under harsh experimental conditions (high temperature and high pressure).
The alternative TP pretreatment method involves a portable and inexpensive LOC device prepared using micro-electro-mechanical system technology [19,20,21]. Using the principle of photocatalysis, a K2S2O8 oxidizing agent is used to pretreat phosphorus-containing compounds and transform them into PO43− under UV (365 nm) light irradiation. Owing to its high photocatalytic activity, titania (TiO2) is widely used in the field of photocatalysis.
After pretreatment, a mixture (colorant) containing ammonium molybdate (NH4)6Mo7O24·4H2O) and ascorbic acid (C6H8O6) is added to stain the samples. As the PO43− concentration increases, the color of the dyed sample transitions from light blue to dark blue. The phosphorus compounds and oxidizing agent are introduced into the LOC testing device via a micropump. The photocatalytic reaction time is controlled by adjusting the flow rate of the micropump. Finally, the absorbance of samples subjected to different photocatalytic reaction durations are measured through UV–vis spectrophotometry.
TiO2—an important semiconductor material with applications in various fields, such as photocatalytic water splitting for hydrogen production, sensors, solar cells, self-cleaning coating, degradation of organic pollutants, and TP or total nitrogen photocatalyst—has attracted substantial research attention owing to its non-toxic, strong oxidation properties, earth abundance, and stable chemical structure [22,23,24]. However, the wide bandgap (3.2 eV) of TiO2 limits the separation and transport efficiency of its photogenerated carriers. Moreover, the rapid recombination of photogenerated carriers restricts the photocatalytic activity of TiO2.
Considering these aspects, it has become necessary to identify techniques that will improve the photocatalytic performance of TiO2. At present, doping with noble metals (e.g., Au, Ag, and Pt) is the most prevalent method of improving the photocatalytic performance of TiO2 [25]. Therefore, in this work, TiO2/Au nanocomposite film test devices with different gold film thicknesses were prepared through various methods, such as electron beam (e-beam) evaporation and atomic layer deposition (ALD). The photocatalytic activity of TiO2 was enhanced through the synergistic activity of TiO2 and gold nanoparticles [26,27]. The degradation properties of TiO2/Au nanocomposite film under different photocatalytic reaction durations were evaluated using rhodamine B (RhB) as a pollutant in microfluidic channels composed of polydimethylsiloxane (PDMS).
The principle of the photocatalytic reaction of TiO2 [28] can be explained as follows: When incident light with photon energy greater than the bandgap width of TiO2 irradiates the sample surface, it leads to the formation of electron–hole pairs which cause redox reactions to occur with the substances on the surface. Electrons combine with the oxygen molecules dissolved in water to produce superoxide ion-free radicals (•O2), while holes convert water molecules or hydroxide ions adsorbed on the TiO2 surface into hydroxyl radicals (•OH). Superoxide ions and hydroxyl radicals are highly oxidizing and can decompose the organic compounds in water into inorganic compounds such as carbon dioxide (CO2) and water (H2O) [29,30]. Chemical equations representing the roles of the electron–hole pairs are presented below.
TiO2 + hν => Electrons (e) + Holes (h+)
Electrons (e) + O2 => •O2
Holes (H+) + H2O => H+ + •OH
Holes (H+) + OH => •OH
The synergistic reaction of doped TiO2 and gold nanoparticles is shown in Figure 2. In the TiO2/Au nanocomposite film, electrons migrating to valence bands flow from TiO2 to gold nanoparticles due to the energy band difference between them, thereby increasing carrier concentration and impeding their recombination. In addition, gold nanoparticles and possible defect sites at the interface of TiO2 promote electron migration.
The LOC pretreatment equipment discussed in this article aims to employ photocatalytic technology as a substitute for conventional autoclaves. Advanced MEMS technology has been leveraged to create a portable TP analysis system, eliminating the constraints of time and location associated with traditional autoclave equipment. By employing a parallel arrangement of multiple types of LOC equipment, it is possible to achieve large-capacity detection and meet the total phosphorus pretreatment requirements across various scale levels. The most important aspect is that, owing to the integration and miniaturization technologies employed, it has significant advantages over traditional autoclave equipment in terms of both cost and size. This enables the use of more cost-effective and environmentally friendly testing procedures.

2. Materials and Methods

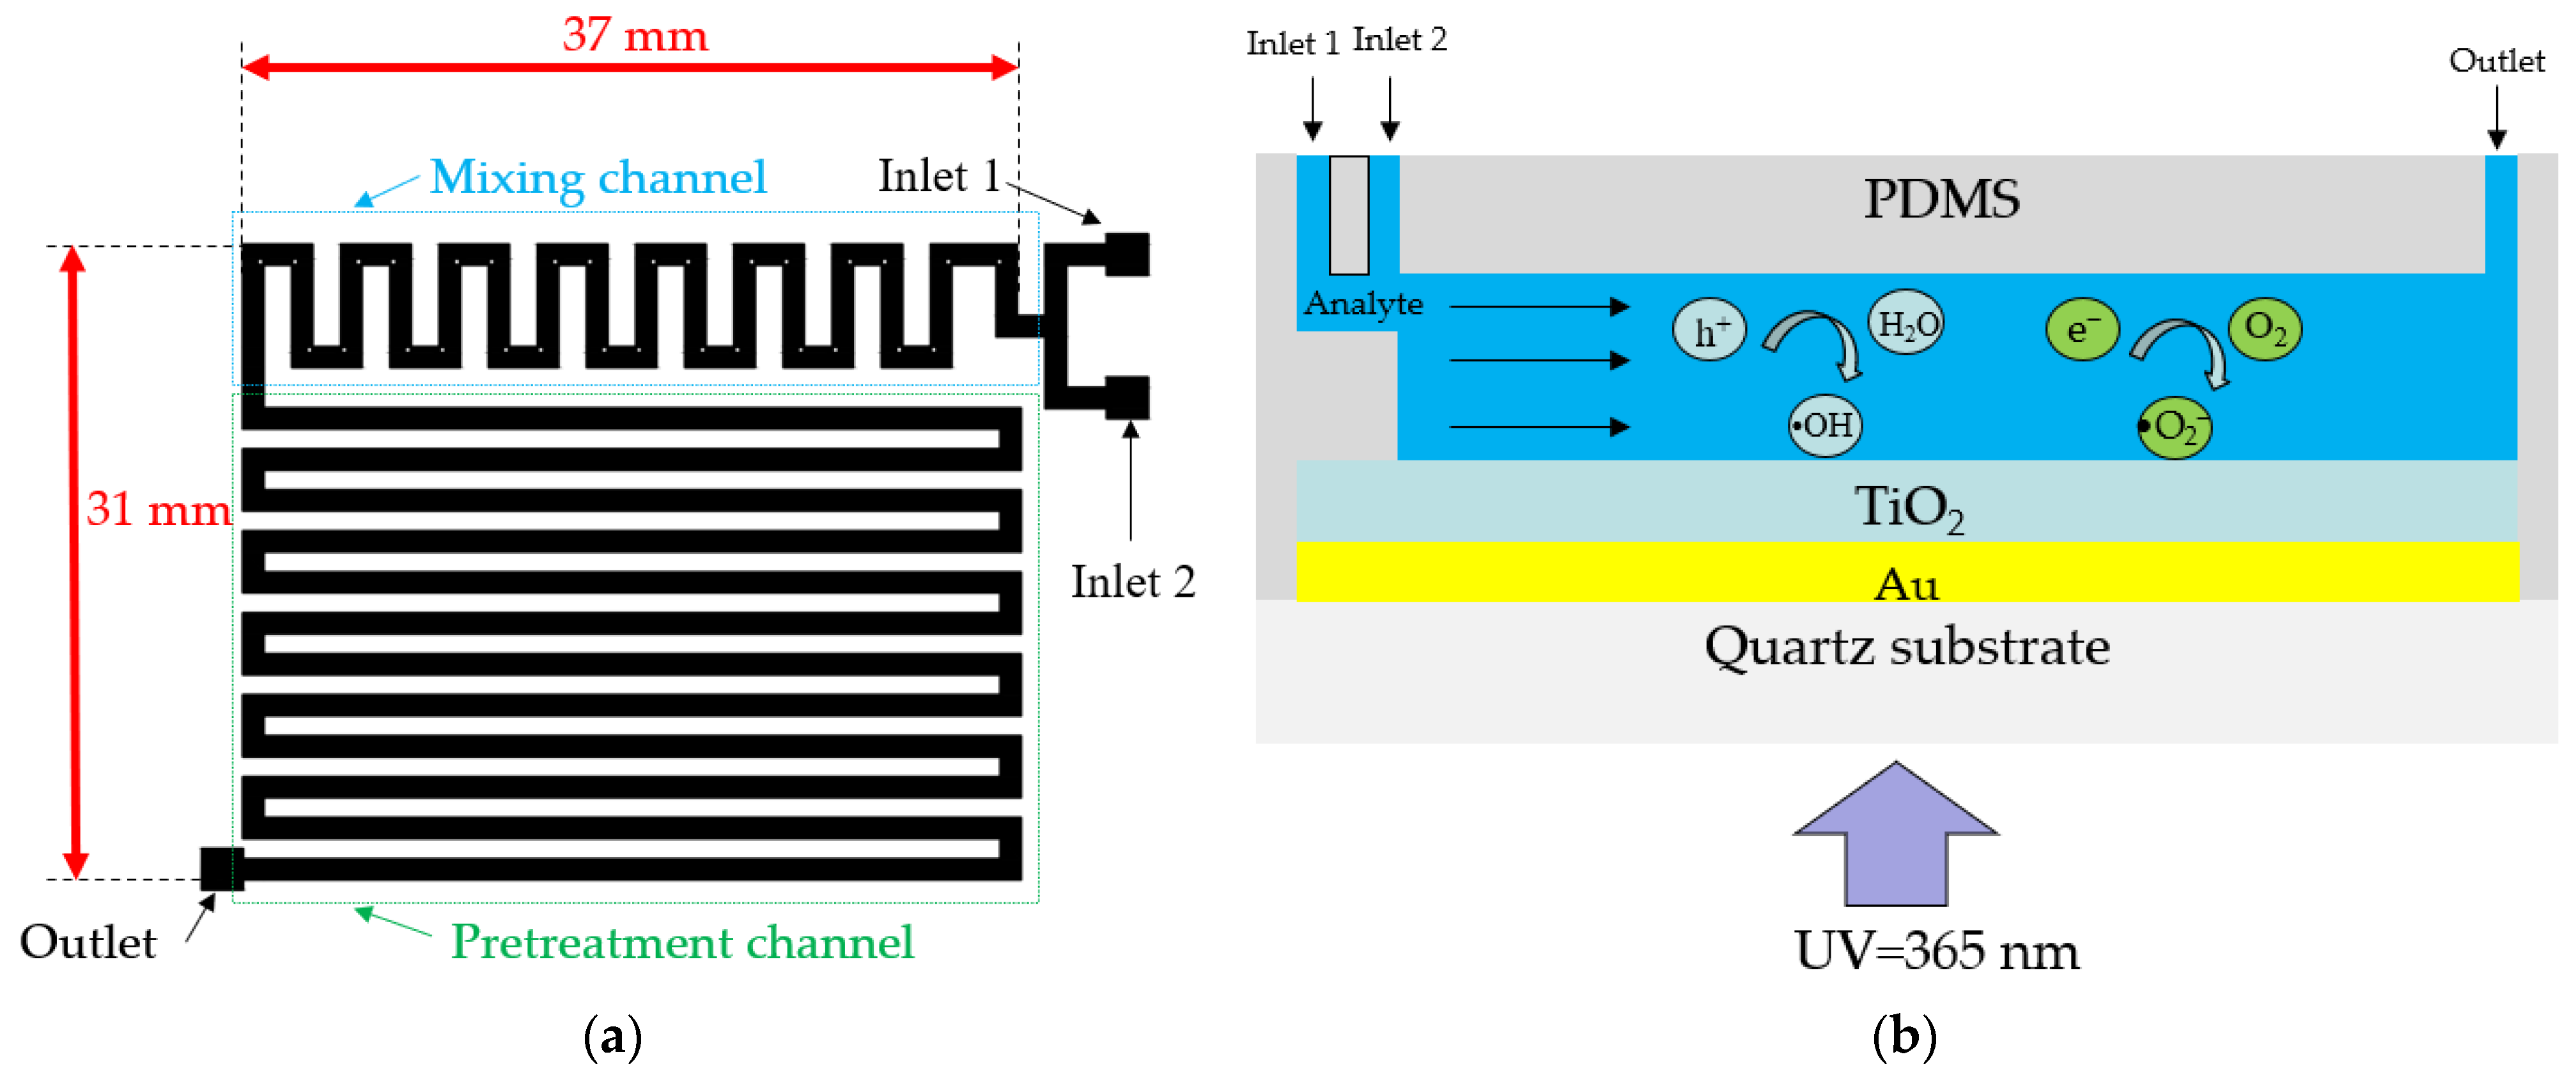
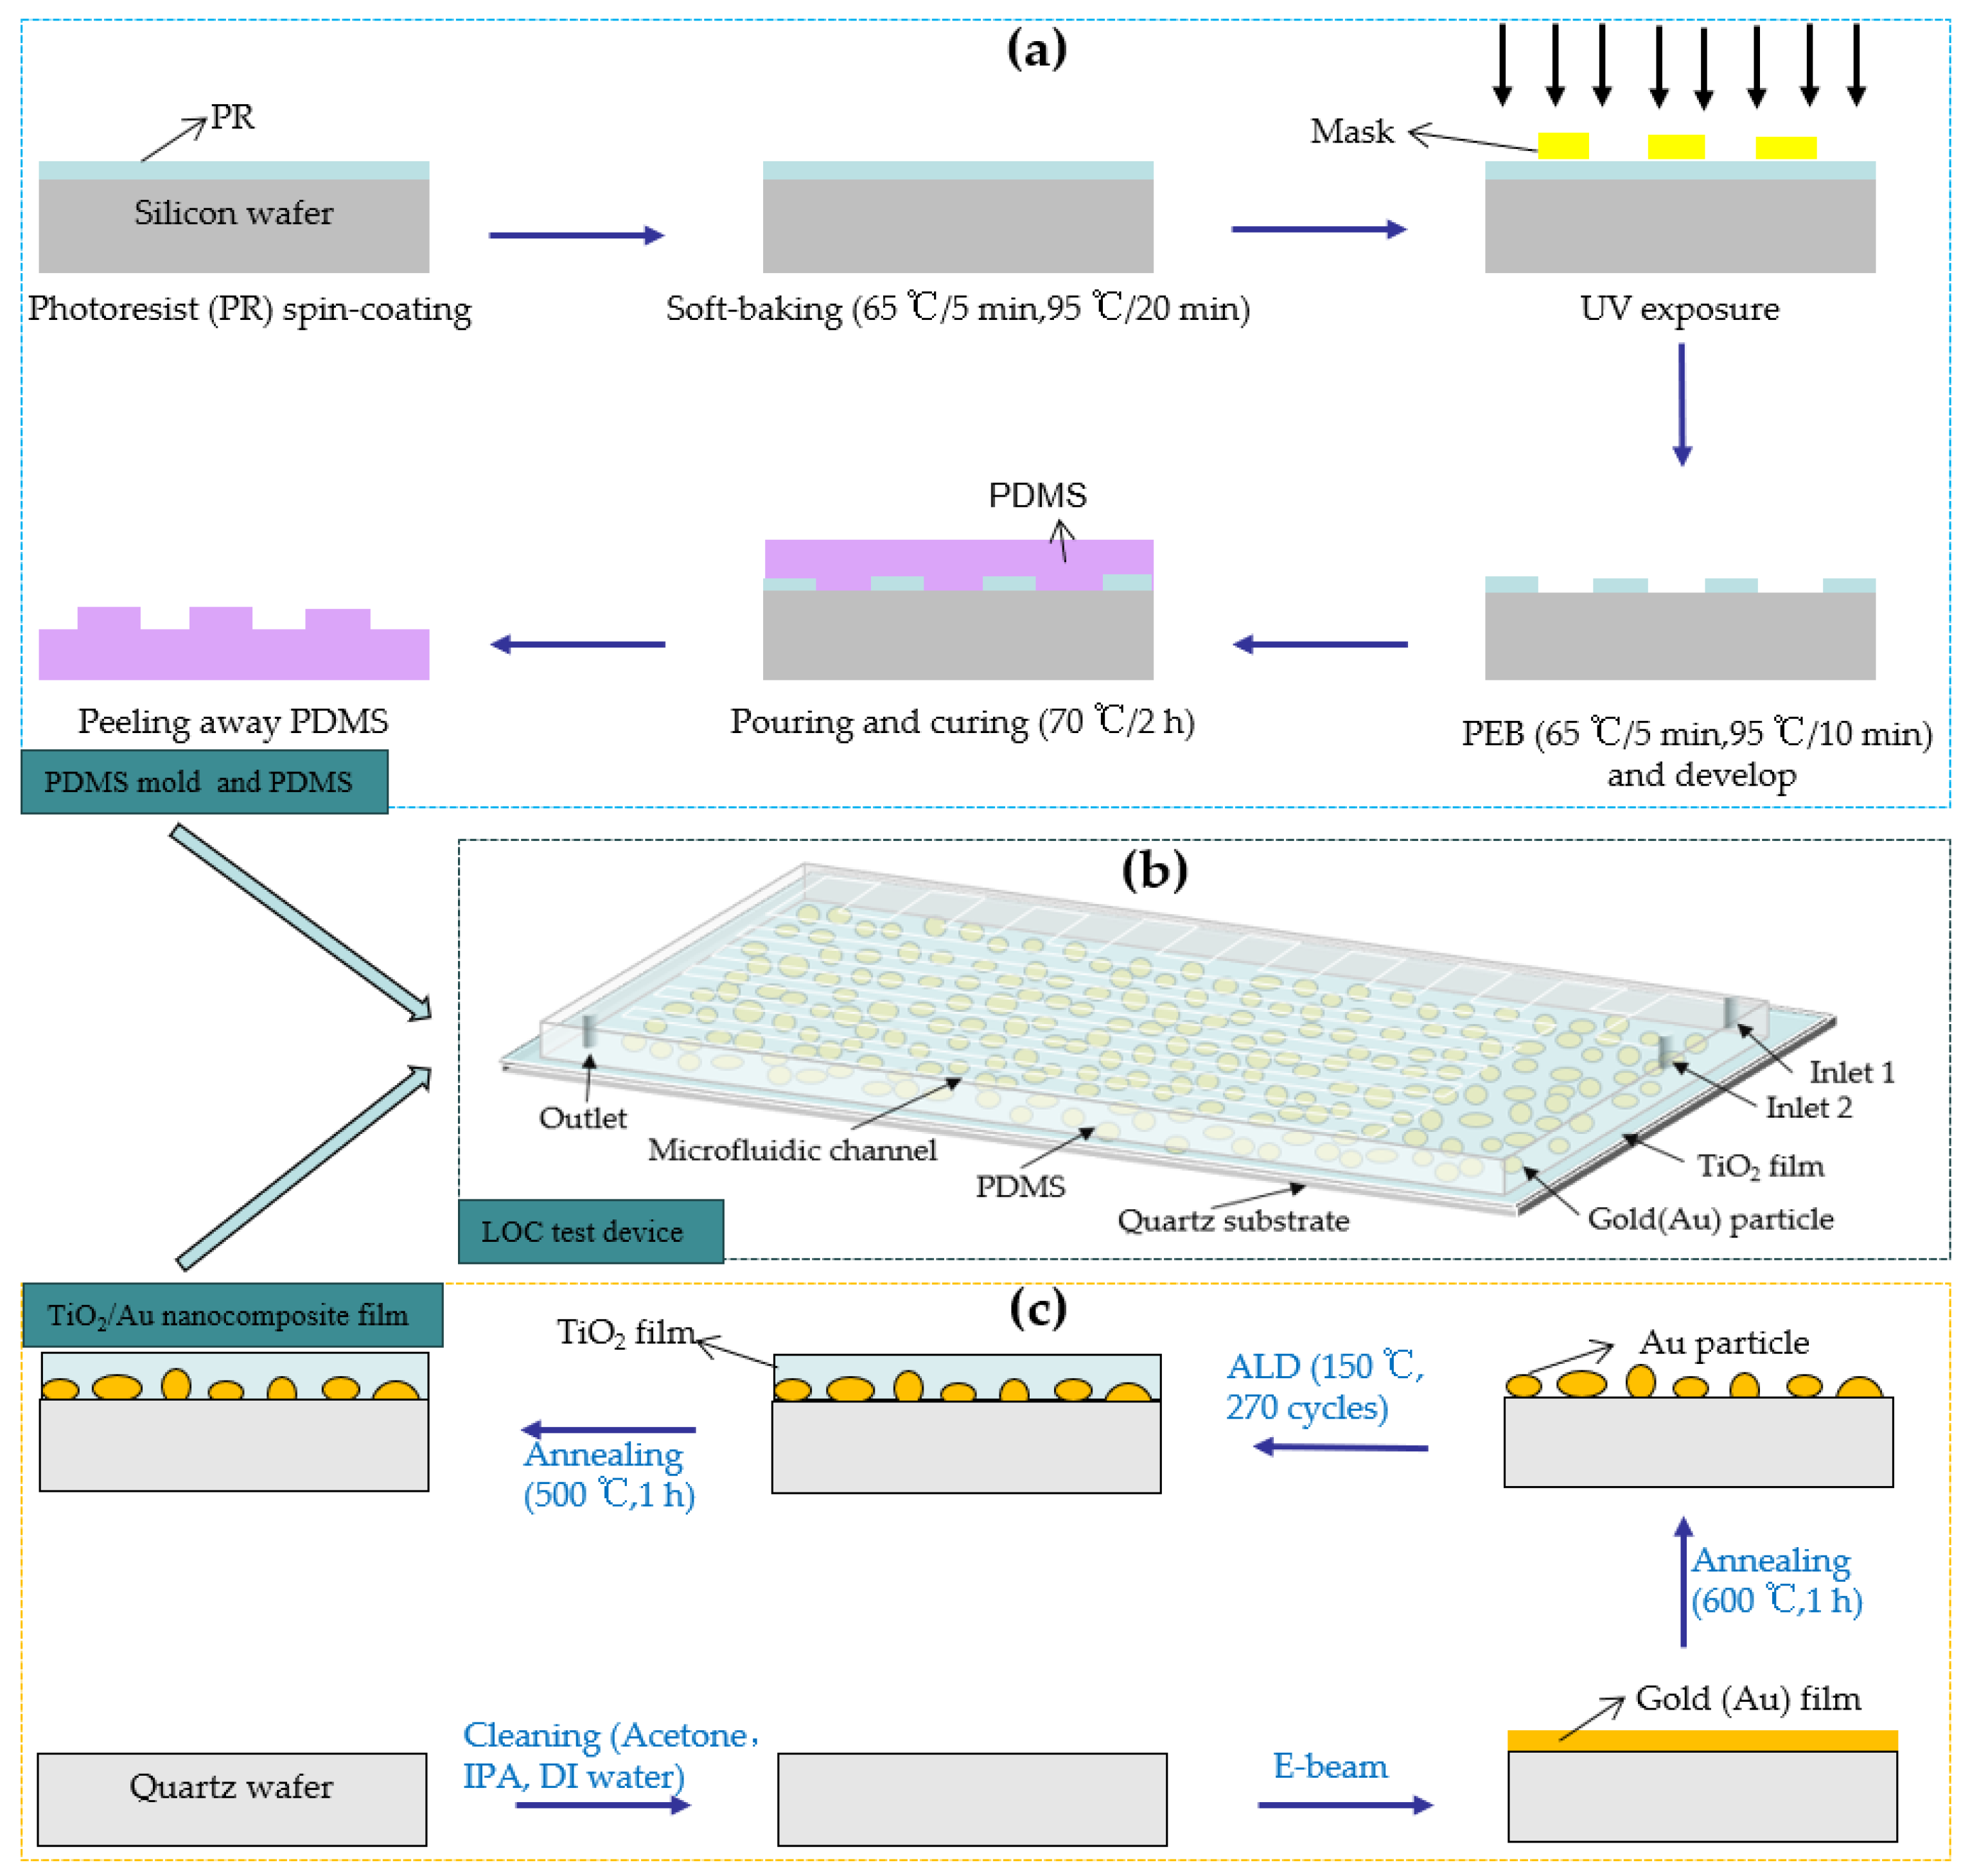
2.1. Design and Fabrication of the LOC Test Device

Figure 3a shows the top view of the pre-designed microchannel for TP pretreatment, including a mixing channel and pretreatment channel. The length and width of the microchannel, excluding the input–output ports for connecting hoses, are 37 mm and 31 mm, respectively. The width and height of the mixing and pretreatment channels are 1 mm and 0.1 mm, respectively. To ensure thorough mixing of the oxidant and analyte, square obstacles with a width of 0.3 mm were placed within the mixing channel [20]. Two input ports in the mixing channel section facilitate the entry of the analyte and oxidant (K2S2O8), and an output port at the end of the pretreatment channel enables the collection of liquid after the photocatalytic reaction.
Figure 3b presents a schematic of the photocatalytic reaction occurring within the microchannel. The analyte fed to the input port gradually flows towards the output under the influence of the micropump. When UV light with a wavelength of 365 nm irradiates the TiO2/Au nanocomposite film, the separated electrons react with oxygen molecules to produce superoxide ions (•O2), while the holes react with water molecules to form hydroxyl radicals (•OH). The superoxide ions and hydroxyl radicals, as critical intermediates of photocatalytic reactions, significantly affect photocatalytic efficiency [31,32].
Before preparing the microchannel, a PDMS mold was developed using a 6 in Si substrate using the photolithography method [19]. The fabrication processes of the PDMS mold and PDMS are illustrated in Figure 4a. First, a SU-8 2075-negative photoresist (PR) was used to prepare a PR coating on the Si substrate through the spin-coating method. Subsequently, the PR coating was soft-baked at different temperatures for different durations. Next, the baked PR was exposed to a pre-designed photomask plate and subjected to post-exposure baking at different temperatures for different durations. Finally, the SU-8 developer was used to develop the baked PR for 10 mins (or more) to remove the PR outside of the exposure area, forming a microfluidic channel mold.
After obtaining the PDMS mold, it was wrapped in tinfoil, and a mixture of 44 g of PDMS polymer base and curing agent (mixing ratio: 10 to 1) was poured into the mold. A 20 min vacuum treatment was implemented to remove the bubbles in the mixture. Next, the PDMS solution was baked at 70 °C for 2 h to transform the liquid into a transparent solid. The transparent solid PDMS layer was peeled off and cut to obtain a pattern inverse to that of the PDMS mold. The height and width of the microchannel are 0.1 mm and 1 mm, respectively. Inlet and outlet holes were punched in predetermined locations.
The process of fabricating the TiO2/Au nanocomposite film is illustrated in Figure 4c. The pre-deposited 6 in quartz substrate was cleaned using acetone, isopropyl alcohol, and deionized water. Subsequently, the dried, contamination-free quartz substrate was placed in an e-beam evaporation chamber (SORONA SRN-200, Gyeonggi-do, Republic of Korea), and gold films with thicknesses of 1, 2, 3, and 4 nm were deposited. The deposited gold films were placed in a heating furnace for high-temperature annealing (600 °C, 1 h). This process transformed the shape of the deposited gold particles from an island-like shape to a nearly spherical one, thereby increasing the average interparticle distance [24]. In the next step, TiO2 films with a thickness of 15 nm were deposited onto the surfaces of the gold nanoparticles using ALD equipment (CN1 Atomic Classic, Gyeonggi-do, Republic of Korea), employing alternating pulses of tetrakisdimethylamido titanium (TDMATi) and H2O as precursors in an Ar atmosphere [33,34]. When the deposition temperature was 150 °C, the thickness of TiO2 deposited per cycle was approximately 0.57 Å, and 270 deposition cycles generated TiO2 films with a thickness of 15 nm. For comparison, pure TiO2 films with a thickness of 15 nm were also deposited on a quartz substrate using the same method. Finally, the deposited TiO2 film was annealed at 500 °C for 1 h to transform its crystal structure into the anatase phase, characterized by high photocatalytic performance [35,36,37]. The pressure applied during the high-temperature annealing process for the aforementioned materials was standard atmospheric pressure.
After prefabricating the TiO2/Au nanocomposite film and PDMS, a thin mixed liquid coating of PDMS polymer base and curing agent was prepared through the spin-coating method. The PDMS was then placed on the coating and dipped in thin layer of the mixed liquid before bonding with the TiO2/Au nanocomposite film. Finally, the PDMS and TiO2/Au nanocomposite film were baked at 70 °C for 2 h to enhance the bonding between them, yielding the LOC test device. The three-dimensional (3D) diagram of the fabricated LOC device is shown in Figure 4b, and its layered structure is shown in Figure 5. The device consists of four parts: a quartz substrate at the bottom, PDMS with microfluidic channels at the top, and a metal-doped and photocatalyst layer in the middle.

2.2. Performance Evaluation of TiO2/Au Nanocomposite Film

RhB, an organic compound dye (typically red in color), is often used with methyl blue or methyl orange dyes for the photocatalytic degradation of pollutants [38,39,40]. In this study, RhB was selected as the test sample for the photocatalytic degradation experiments to verify the performance of TiO2/Au nanocomposite film. All the chemicals were purchased from Duksan Pure Chemicals Co., Ltd. (Ansan city, Republic of Korea)
During the experiment, RhB and K2S2O8 were connected by a hose on the micropump, facilitating a uniform flow from the input port into the microchannel for photocatalytic reaction. The micropump flow rates were 59.38, 27.19, 17.76, 13.87, 11.10, and 8.88 µL/min, corresponding to photocatalytic reaction durations of 1, 2, 3, 4, 5, and 6 min, respectively. The photocatalytic degradation efficiency of the TiO2/Au nanocomposite film with different thicknesses of gold film and pure TiO2 was measured by adjusting the micropump flowrate to vary the photocatalytic reaction duration. The inner diameter of the hose connecting the input to the test sample was 0.25 mm. The absorbance of the photocatalytic degradation solution, collected in a Petri dish at the outlet, was measured using a UV–vis spectrophotometer (AOE UV-1800PC, Shanghai, China), and compared with the original concentration. In all experiments, UV light with a wavelength of 365 nm and power of 5 W was irradiated from the back. All experiments were conducted at room temperature, 18 °C to 25 °C. The external lighting in the experimental area was normal indoor lighting. The conditions for other photocatalytic experiments remain unchanged if not specified.

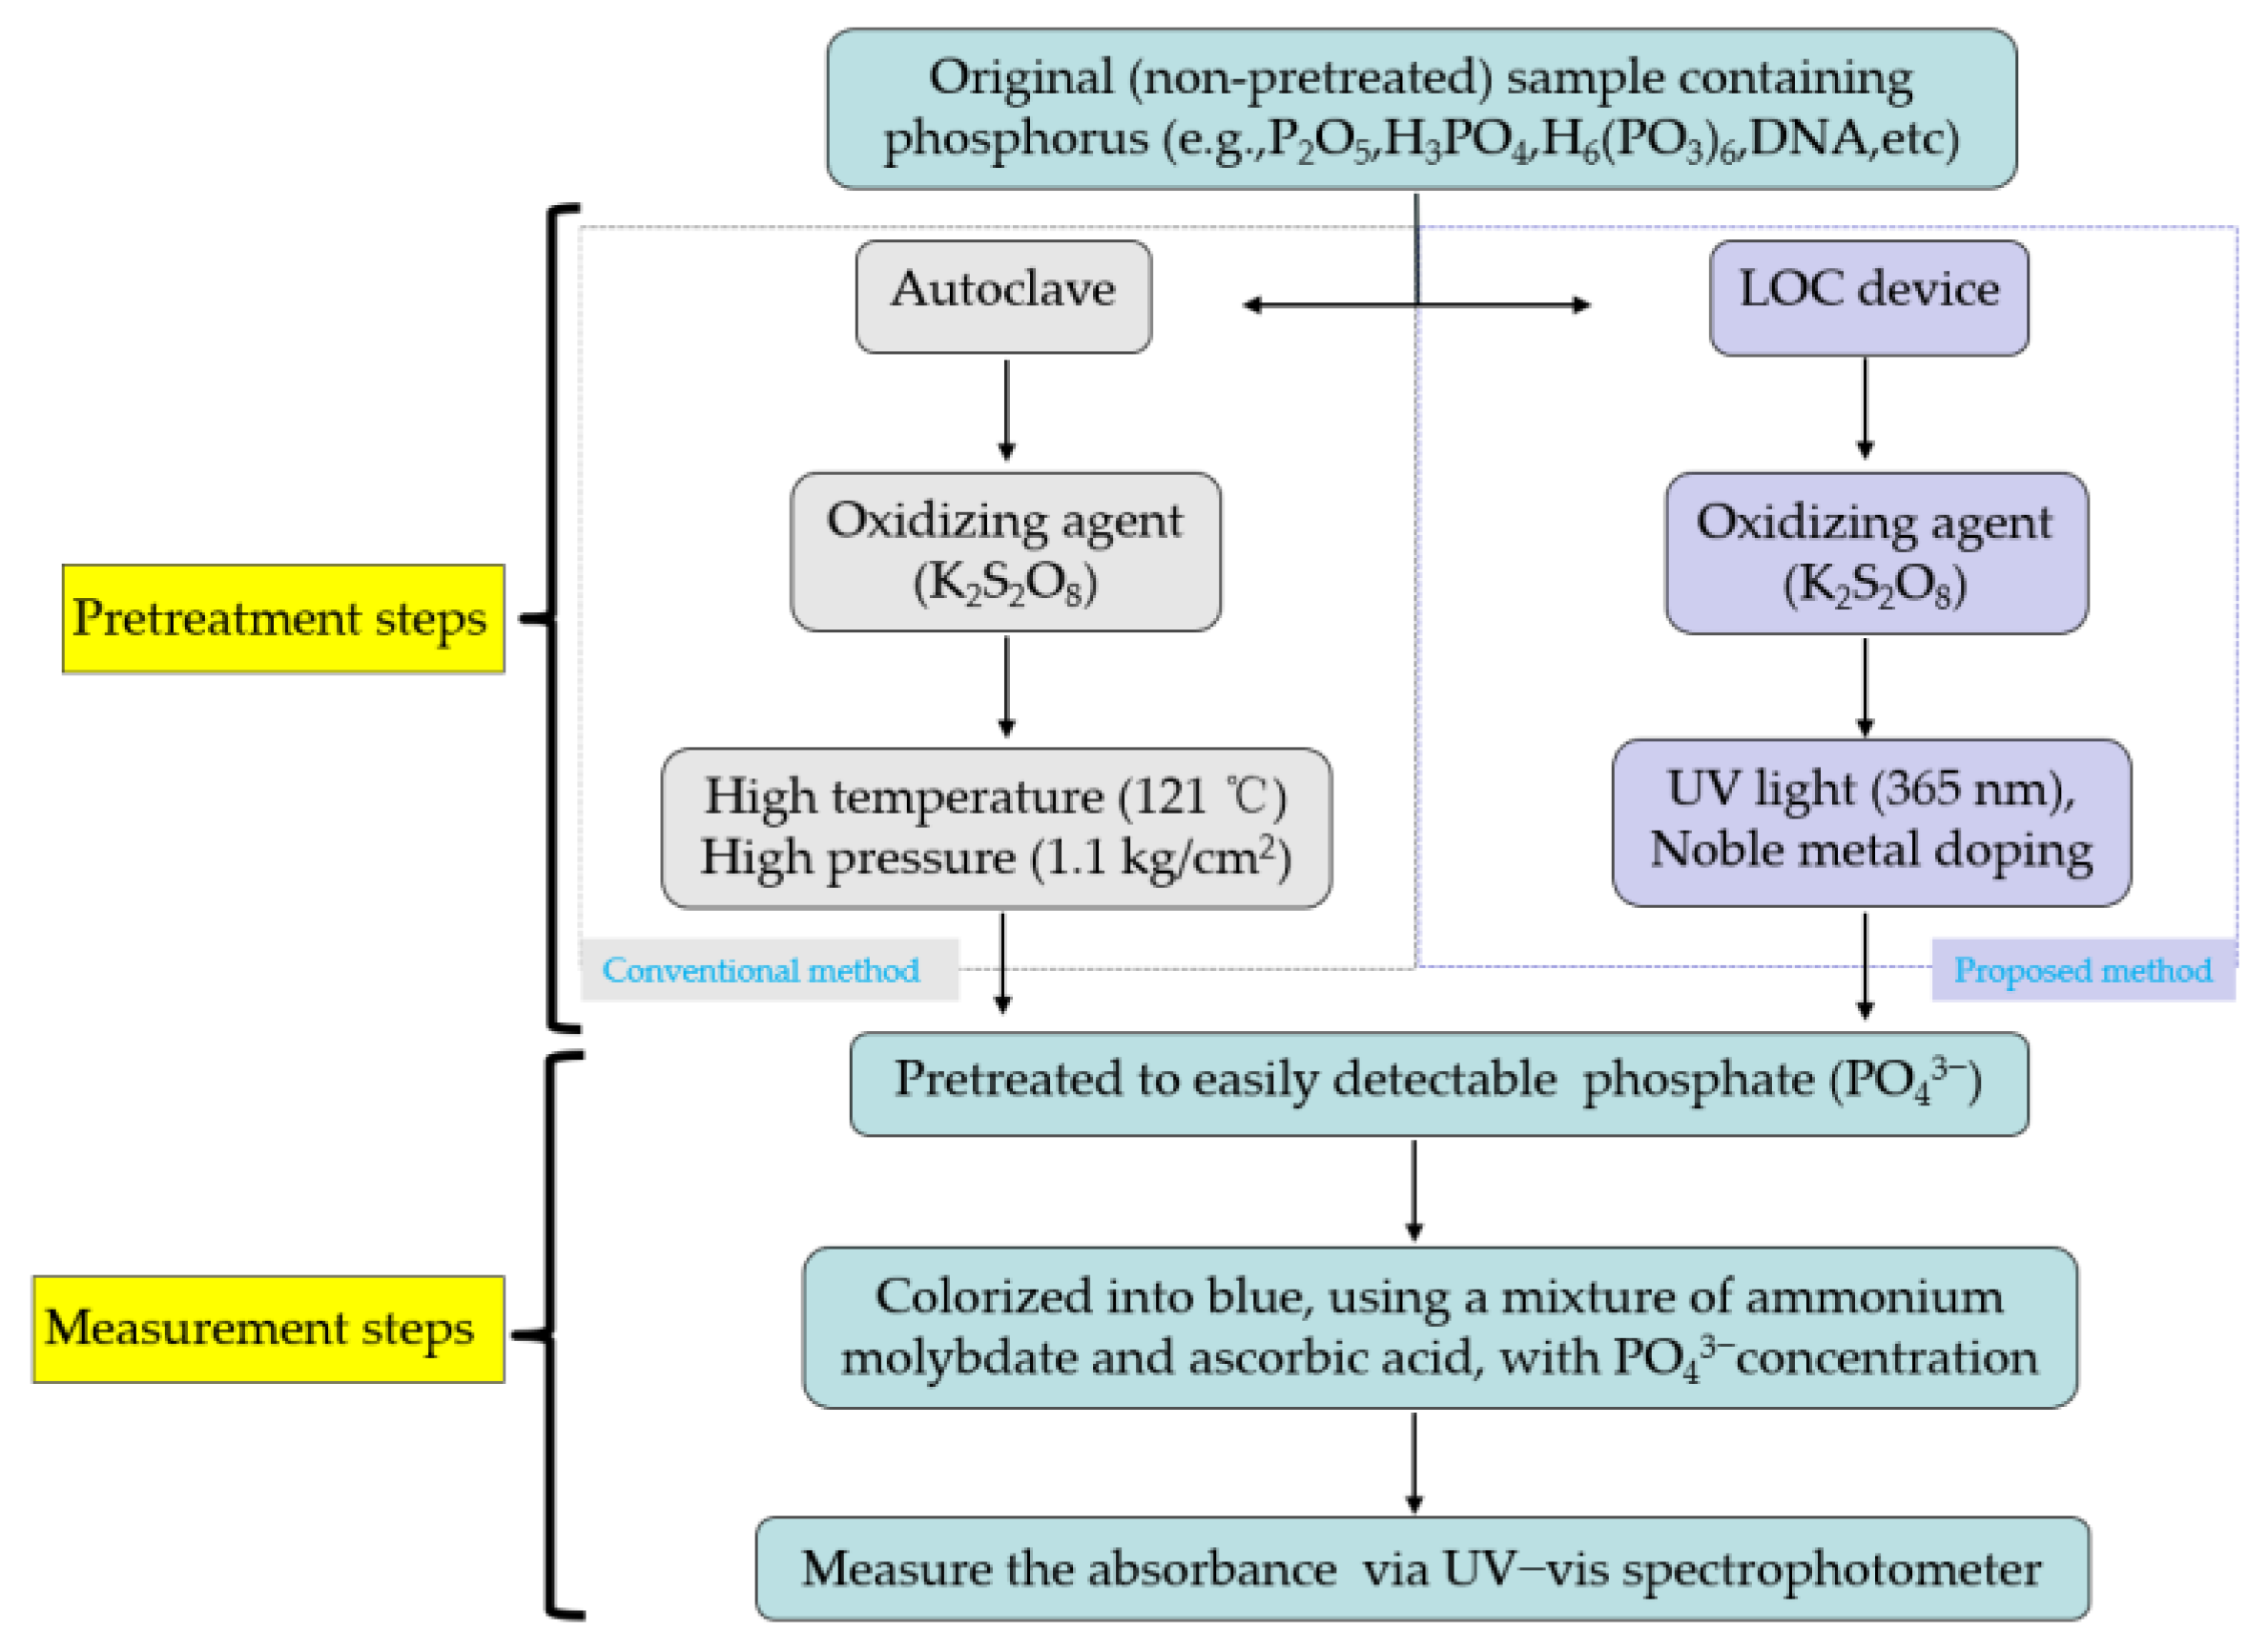
2.3. TP Experiment by LOC Device and Autoclave

Before initiating the TP experiment, it was necessary to identify the relationship between the different concentrations of the PO43−solution and their absorbance after staining using standard solutions (potassium phosphate monobasic, KH2PO4). Thus, pre-prepared PO43− solutions with different concentrations (0.0, 0.1, 0.5, 1, and 2 mg/1000 mL) were mixed with the coloring agent. The mixed liquid initially appear blue, and the color gradually darkened as the PO43− concentration increased. The relationship between the PO43− concentration and absorbance was determined using a UV–vis spectrophotometer to measure the absorbance of the blue mixture.
The relationship between PO43−concentration and absorbance was determined using a standard solution. Therefore, in the following TP experiment, sodium glycerophosphate (C3H7Na2O6P) was selected as the original phosphorus solution. To assess the pretreatment effect of phosphorus-containing compounds under different photocatalytic reaction durations, phosphorus-containing compounds with a concentration of 1 mg/1000 mL were selected as analytes. The concentration of K2S2O8 (oxidizing agent) was 8 g/1000 mL. The prepared phosphorus-containing solution and oxidizing agent were added into a vial in a 1:1 ratio (total volume of 20 mL) and placed into the reaction chamber of the autoclave for 30 min to undergo pretreatment at a high temperature (121 °C) and high pressure (1.1 kg/cm2).
The other analyte was pretreated using the LOC device with a 2 nm gold film through photocatalysis. The phosphorous solution and oxidizing agent were fed to the microchannel through micropump hoses, and the mixture produced by photocatalytic reaction was collected in a Petri dish at the output. The micropump flow rates were 11.10, 4.995, 3.885, 2.775, 2.220, and 1.665 μL/min, corresponding to photocatalytic reaction durations of 5, 10, 15, 20, 25, and 30 min, respectively. Throughout the experiments, UV light with a wavelength of 365 nm and power of 5 W was irradiated from the back. The inner diameter of the hose connecting the input to the test sample was 0.25 mm.
According to the results of these photocatalytic degradation experiments with different photocatalytic reaction durations and a comparison with the autoclave results, the LOC device and autoclave yielded similar pretreatment effects when the photocatalytic time was 15 min. To assess the feasibility and accuracy of the experimental results, solutions containing phosphorus compounds with concentrations of 0 mg/1000 mL to 1 mg/1000 mL were photocatalyzed for 15 min, and the absorbance value obtained after dyeing was compared with that obtained by the autoclave.
The PO43−concentration in the experiment was distinguished using a colorant composed of ammonium molybdate (NH4)6Mo7O24·4H2O), potassium antimony tartrate (KSbC4H4O7·1/2H2O), ascorbic acid (C6H8O6), and sulfuric acid (H2SO4). The prepared colorant and the reagent containing PO43− were mixed in a 1:1 (vol.) ratio, and the absorbance of the sample was measured by UV–vis spectrophotometry after standing for 15 min. The observed color depth varied with the PO43− concentration.

3. Results and Discussion

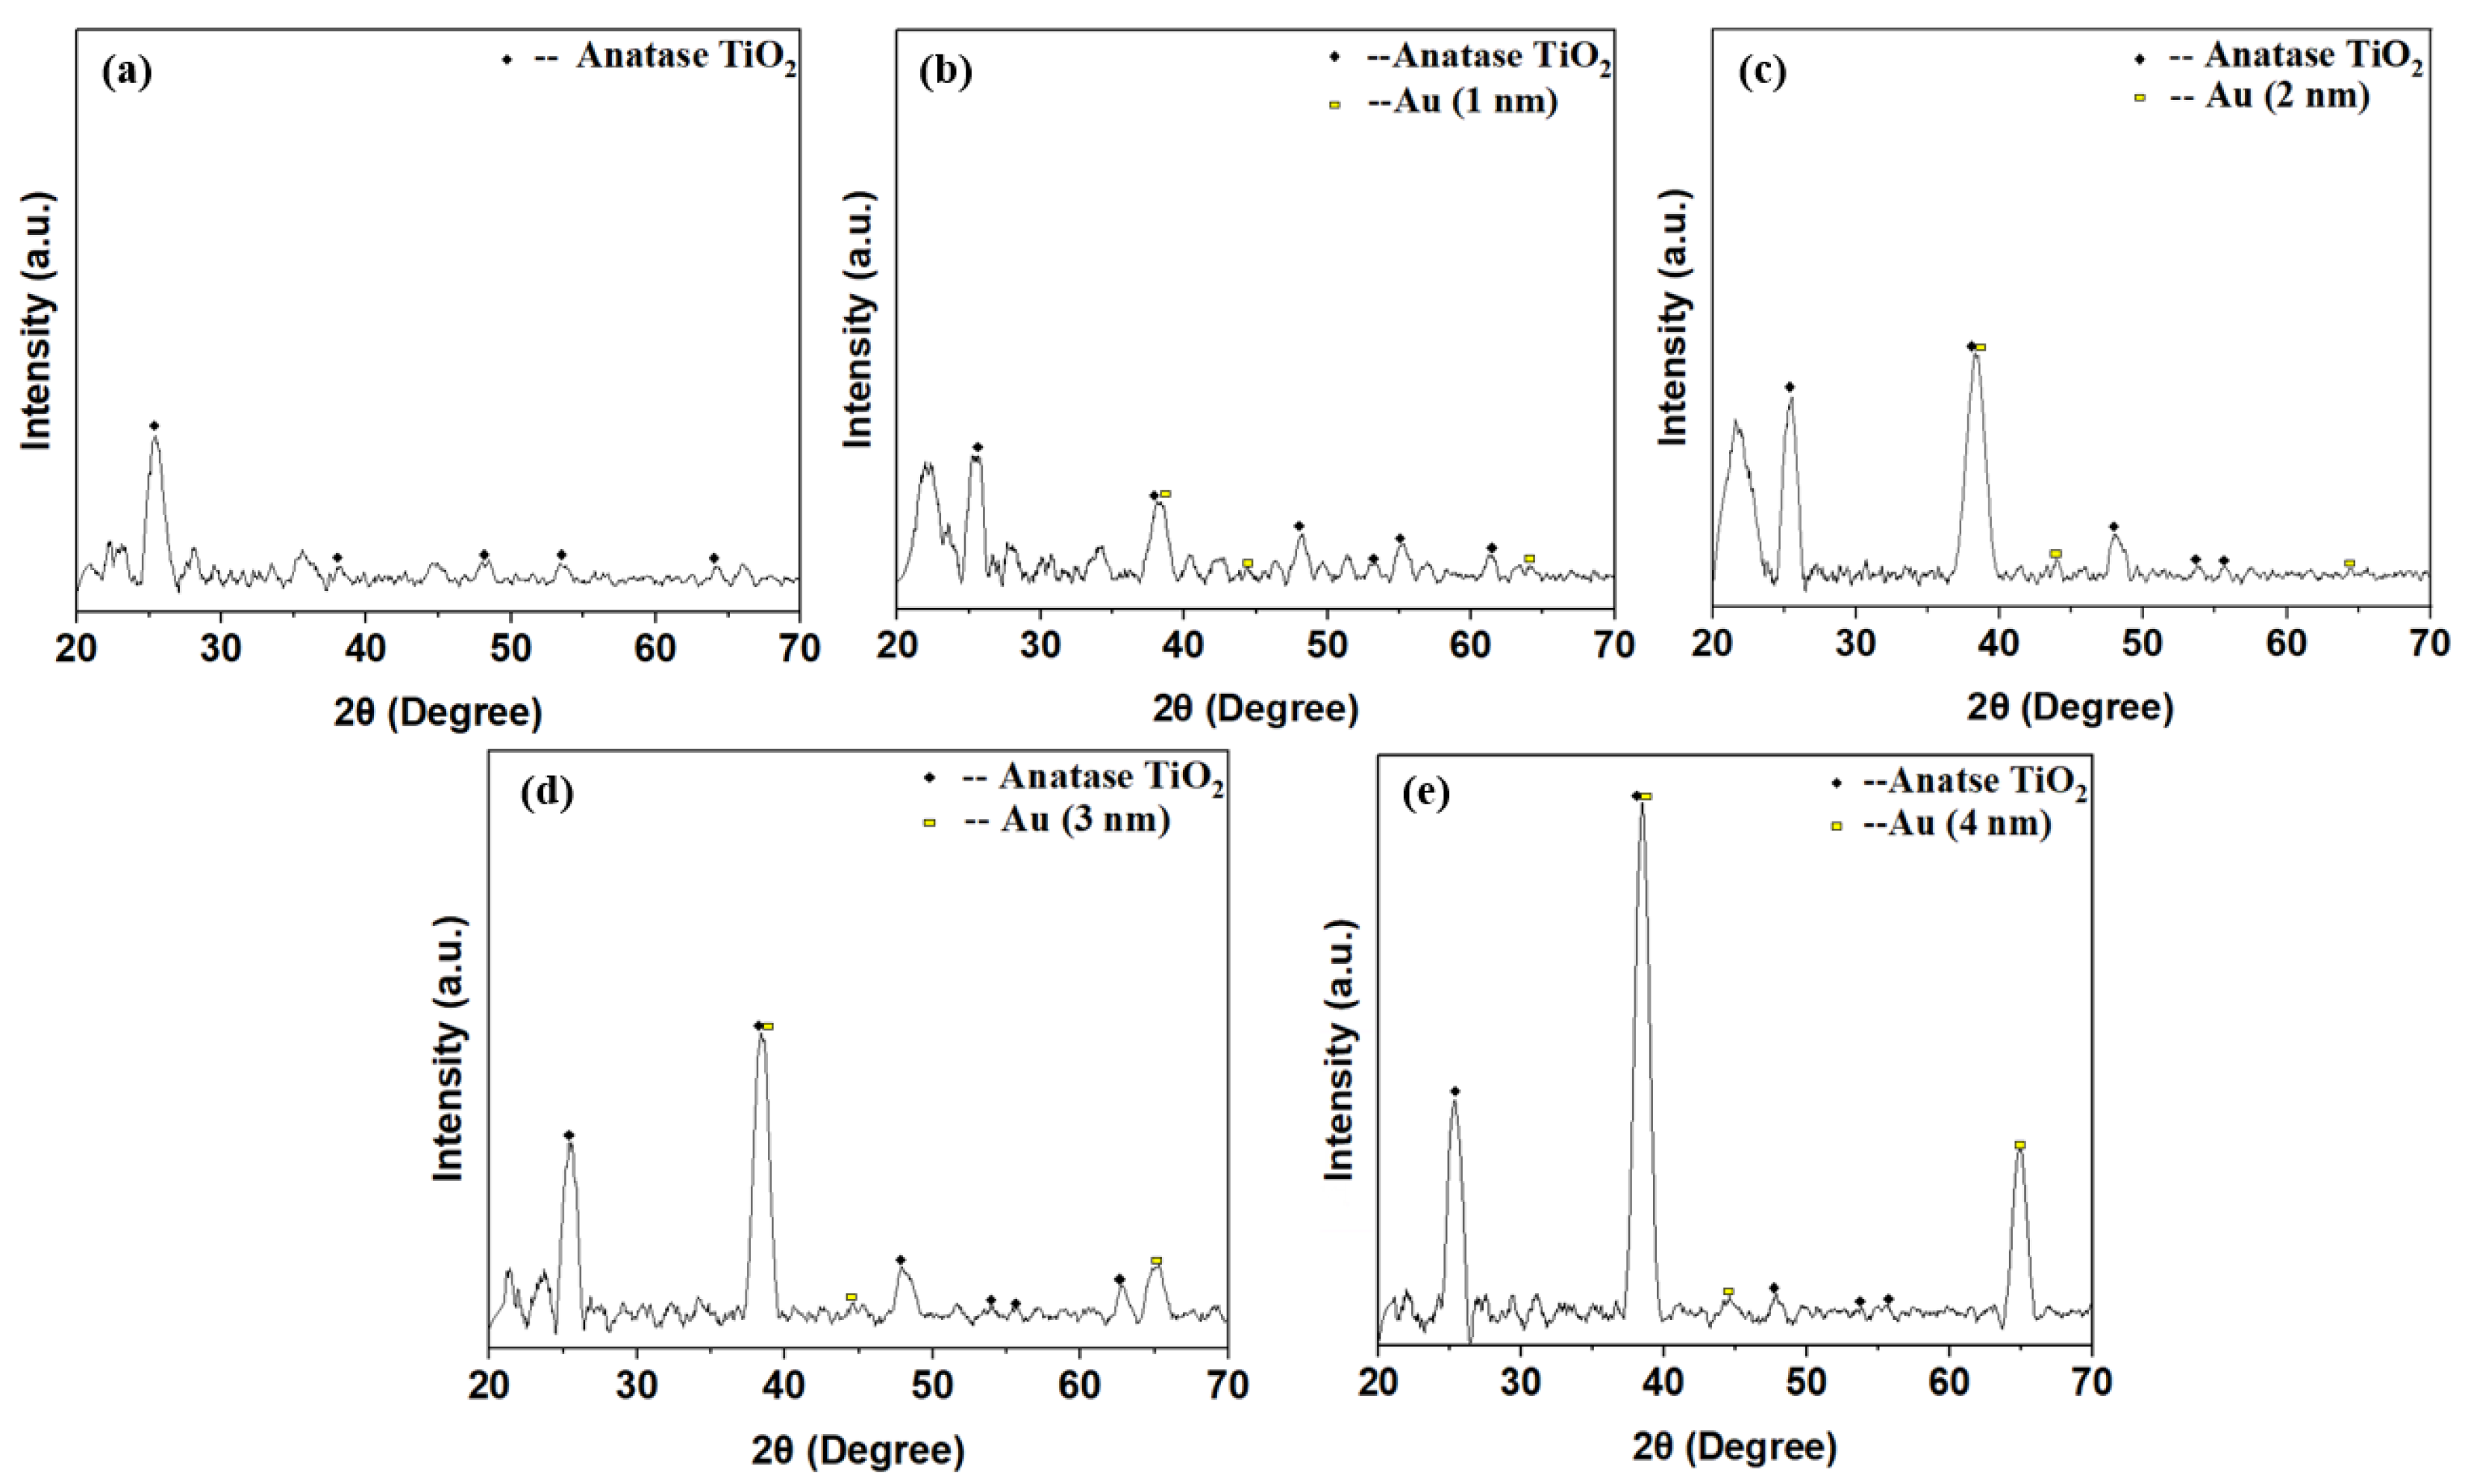
3.1. Characterization of Materials

Figure 6 shows images of gold film before annealing, heat-treated gold films, and TiO2/Au nanocomposite film on a quartz substrate, captured by scanning electron microscopy (SEM; Hitachi S-4800, Tokyo, Japan). Figure 6a–d indicate that the gold nanoparticles exhibited irregular island-like structures and were evenly distributed on the quartz substrate. After heat treatment (600 °C, 1 h), the shape of the gold nanoparticles changed to nearly spherical. The average size of the gold nanoparticles increased with the increase in the thickness of the gold film (Figure 6e–h), primarily due to the enhanced aggregation effect of gold nanoparticles during heat treatment [41,42]. The SEM images of the TiO2/Au nanocomposite film (Figure 6i–l) show that the deposited TiO2 film formed a conformal pinhole-free layer, and that heat treatment did not affect the size and distribution of the gold nanoparticles.
Figure 7 shows the X-ray diffraction (XRD; Bruker D8 Discover, Karlsruhe, Germany) patterns of the annealed TiO2 and TiO2/Au nanocomposite films. Figure 7a indicates that the pure TiO2 annealed at a high temperature (500 °C, 1 h) presented an anatase phase with high photocatalytic activity [43,44]. The peaks of the diffraction patterns appeared at 2θ = 25.24°, 38.24°, 49.52°, 53.92°, and 64.16°, corresponding to the (101), (004), (200), (105), and (116) anatase structure planes, respectively (JCPDS file no. 21-1271).
Moreover, despite being doped with gold films of varying thicknesses, the TiO2 in the doped TiO2/Au nanocomposite film exhibited an anatase structure with high photocatalytic activity (Figure 7b–e). The crystal structure of TiO2 was not affected by the deposition of the gold films with different thicknesses. For the TiO2/Au nanocomposite film with a thickness of 2 nm, diffraction peaks of Au crystal planes appeared at 2θ = 38.12°, 44.44°, and 64.16° (JCPDS file no. 04-0784). The other TiO2/Au nanocomposite films also exhibited similar diffraction peaks at these 2θ angles because the difference in the thickness of the deposited gold film led to variations in the peak diffraction height. The specific trend is that the diffraction peak of the gold film increased with the increase in deposition thickness [45,46].

3.2. Photocatalytic Degradation Performance

Figure 8a shows the absorbance of RhB by the LOC device with different gold film deposition thicknesses for a photocatalytic reaction time of 1 min. The peak absorbance after photocatalytic degradation was 550 nm. Thus, from comparing the peak values at 550 nm, the photocatalytic degradation performance of different LOC detection devices could be discerned.
The experimental results (Figure 8b) show that the deposition of gold films enhanced the photocatalytic degradation efficiency compared to that attained using pure TiO2. When the photocatalytic reaction time was 1 min, the performance difference between the various LOC detection devices was the most pronounced. As the photocatalytic reaction time increased, this gap gradually decreased, because each detection device demonstrated an almost complete degradation of RhB. When the photocatalytic time was 6 min, RhB was completely degraded, and there was no significant difference in the photocatalytic degradation performances of the LOC device with different noble metal film deposition thicknesses. However, regardless of the photocatalytic reaction period, the LOC detection device with a metal film deposition thickness of 2 nm exhibited the highest photocatalytic degradation efficiency. This observation indicates that when the thickness of the gold film is 2 nm, the UV light absorption and interface of the TiO2 and gold nanoparticles are optimized, and the highest photocatalytic degradation performance can be achieved. With further increases in the deposition thickness of the gold film, the photocatalytic efficiency decreased, which is attributable to a reduction in the direct contact surface area of the gold particles and TiO2, lowering the reaction rate. Additionally, multilayer stacking reduced light absorption and utilization. The transmittance test results of TiO2/Au nanocomposite film (Figure 9) confirm these observations. Although noble metal deposition can enhance the photocatalytic performance of TiO2, it was necessary to consider the influence of its preparation method, film deposition thickness, crystal structure, and the size and shape of noble metal particles on the photocatalytic degradation performance of TiO2 [11].
Figure 10a shows the absorbance of a standard solution with different PO43− concentrations (0.0, 0.1, 0.5, 1, 2 mg/1000 mL) after coloring. With the increase in the PO43− concentration, the absorbance gradually increases, verifying the positive correlation between PO43− concentration and absorbance. Figure 10b, showing the images of different PO43− solution concentrations after coloring, further confirms the absorbance test results discussed above. Moreover, the peak absorbance of the PO43− solution after coloring was mainly 880 nm; thus, the concentration of the PO43− solution can be determined by comparing the absorbance values at 880 nm.
Overall, the photocatalytic degradation experiment results of RhB indicate that when the deposition thickness of the noble metal film is 2 nm, the TiO2/Au nanocomposite film exhibits the highest photocatalytic degradation efficiency. Moreover, the absorbance test of PO43− standard solution with different concentrations verifies the positive correlation between the PO43− concentration and absorbance.
Figure 11a shows the absorbance of the photocatalytic degradation of a phosphorous-containing solution with a TP concentration of 1 mg/1000 mL under different photocatalytic reaction durations, using an LOC device with a gold-film deposition thickness of 2 nm and an autoclave. The peak absorbance at 880 nm is shown in Figure 11b. The absorbance increased with the increase in photocatalytic reaction time. This observation indicates that, with the increase in the photocatalytic reaction time, more phosphorus-containing compounds decompose into PO43−. However, when the photocatalytic time was greater than 25 min, the absorbance became saturated. This finding suggests that, at 25 min, the phosphorous-containing compounds with a concentration of 1 mg/1000 mL were completely decomposed, and that further prolonging the photocatalytic reaction time does not increase the PO43− concentration.
From the absorbance test results of the phosphorus-containing compound solutions with a TP concentration of 1 mg/1000 mL under different photocatalytic reaction durations, we can conclude that the LOC test device with a gold-film deposition thickness of 2 nm could replace conventional TP pretreatment equipment (autoclave) when the photocatalytic reaction time is 15 min. Therefore, an LOC test device with a gold-film deposition thickness of 2 nm was used to pretreat a phosphorous compound with concentrations ranging from 0 mg/1000 mL to 1 mg/1000 mL for a photocatalytic reaction duration of 15 min, and the results have been compared with those obtained using an autoclave. The experimental results (Figure 12) show that when the duration is 15 min, a LOC device with a deposition thickness of 2 nm can replace the conventional TP pretreatment equipment (autoclave). The measured absorbance with variations in phosphorus concentration using the LOC test device with a gold film thickness of 2 nm exhibits similar trends to those of the conventional equipment (autoclave). In general, the variations in concentration and absorbance corresponding to the LOC device and autoclave can be expressed by the following equations:
Autoclave: y(Absorbance) = 0.18427x (TP Concentration) + 0.00318
LOC Device: y(Absorbance) = 0.18384x (TP Concentration) + 0.00391
Thus, the phosphorus concentration of an unknown analyte can be calculated using the LOC device, based on the provided equation relating the phosphorus concentration to absorbance.
The results from the two different TP pretreatment experiments show that the LOC detection device is a promising substitute to the traditional autoclave equipment, effectively addressing the limitations of high cost, large volume, and prolonged response time associated with traditional equipment. Compared to traditional autoclaves, the LOC device is cost-effective and compact, in line with the increasing demand for on-site testing.

4. Conclusions

This paper introduces a TiO2/Au deposition method to address the challenges related to gold film detachment and the oxidation of gold particles during experiments. The Schottky barrier formed by the direct connection of metal nanoparticles and TiO2 film helped inhibit the recombination of electron–hole pairs [27,28,47]. The use of back irradiation increased the utilization rate of incident light and avoided the potential obstruction effects of PDMS, TP, or RhB reagents on incident light.
Subsequently, different heat-treatment temperatures were applied to the deposited gold film and TiO2 film to minimize the influence of TiO2 heat treatment on the size and distribution of the gold nanoparticles. Lastly, the photocatalytic degradation performance of TiO2 and its enhancement by gold-film doping were verified using RhB dye and K2S2O8 oxidizing agent. A comparative analysis revealed that the photocatalytic performance of TiO2 is enhanced the most when the doping thickness of gold films was 2 nm. A further increase in the deposition thickness of the gold film deteriorated the photocatalytic efficiency, owing to a reduced direct contact surface between the gold particles and TiO2, which reduced the reaction rate. Moreover, multilayer stacking reduces light absorption and utilization [48,49].
An LOC test device with a deposition thickness of 2 nm and an autoclave were used to pretreat phosphorus-containing compounds with identical concentrations. The photocatalytic time was modified by adjusting the flow rate of the micropump, and the absorbance of the pretreated sample under different photocatalytic durations was compared with that of the sample pretreated by the conventional method (autoclave). The results indicate that when the photocatalytic reaction time is 15 min, the TP pretreatment with the LOC device achieves a pretreatment performance that is nearly identical to the traditional autoclave method. Finally, the results obtained by the LOC device (reaction time: 15 min) for pretreating phosphorus-containing solutions with concentrations ranging from 0 mg/1000 mL to 1 mg/1000 mL were compared with those of the autoclave. The experimental results further verify the feasibility of the LOC equipment replacing traditional autoclave equipment.
Notably, although noble metal deposition can enhance the photocatalytic performance of TiO2, various factors such as the preparation method, film deposition thickness, crystal structure, and the size and shape of the noble metal particles also significantly influence the photocatalytic degradation performance of TiO2 and must be considered.

Author Contributions

Conceptualization, J.W. and S.-D.K.; Formal analysis, J.-Y.L. and J.-S.K.; Investigation, J.W.; Supervision, S.-D.K., M.H. and S.-H.K.; LOC device fabrication, N.J. and H.K.; Writing—Review and editing, J.W. and S.-H.K.; Sample analysis, D.-Y.K. and Y.N. All authors have read and agreed to the published version of the manuscript.

Funding

This research was supported by The Korea Innovation Foundation (INNOPOLIS) grant funded by the Korea government (MSIT) (2020-DD-UP-0348), and Ministry of Environment as “The Eco-technopia 21 projects” (RS-2023-00218010), and the BK21 FOUR project funded by the Ministry of Education, Republic of Korea (4199990113966).

Institutional Review Board Statement

Not applicable.

Informed Consent Statement

Not applicable.

Data Availability Statement

Data are contained within the article.

Conflicts of Interest

The authors declare no conflicts of interest.

References

  1. Shen, J.; Yuan, L.; Zhang, J.; Li, H.; Bai, Z.; Chen, X.; Zhang, W.; Zhang, F. Phosphorus Dynamics: From Soil to Plant. Plant Physiol. 2011, 156, 997–1005. [Google Scholar] [CrossRef] [PubMed]
  2. Conley, D.J.; Paerl, H.W.; Howarth, R.W.; Boesch, D.F.; Seitzinger, S.P.; Havens, K.E.; Lancelot, C.; Likens, G.E. Controlling Eutrophication: Nitrogen and Phosphorus. Science 2009, 323, 1014–1015. [Google Scholar] [CrossRef] [PubMed]
  3. Xiao, X.; Agustí, S.; Pan, Y.; Yu, Y.; Li, K.; Wu, J.; Duarte, C.M. Warming Amplifies the Frequency of Harmful Algal Blooms with Eutrophication in Chinese Coastal Waters. Environ. Sci. Technol. 2019, 53, 13031–13041. [Google Scholar] [CrossRef]
  4. Le, C.; Zha, Y.; Li, Y.; Sun, D.; Lu, H.; Yin, B. Eutrophication of Lake Waters in China: Cost, Causes, and Control. Environ. Manag. 2010, 45, 662–668. [Google Scholar] [CrossRef]
  5. O’Neil, J.M.; Davis, T.W.; Burford, M.A.; Gobler, C.J. The rise of harmful cyanobacteria blooms: The potential roles of eutrophication and climate change. Harmful Algae 2012, 14, 313–334. [Google Scholar] [CrossRef]
  6. Bennett, E.M.; Carpenter, S.R.; Caraco, N.F. Human impact on erodible phosphorus and eutrophication: A global perspective. Bio Sci. 2001, 51, 227–234. [Google Scholar]
  7. Smith, D.R.; Jarvie, H.P.; Bower, M.J. Carbon, Nitrogen, and Phosphorus Stoichiometry and Eutrophication in River Thames Tributaries, UK. Agric. Environ. Lett. 2017, 2, 1–4. [Google Scholar] [CrossRef]
  8. Ge, C.; Chai, Y.; Wang, H.; Kan, M. Ocean acidification: One potential driver of phosphorus eutrophication. Mar. Pollut. Bull. 2017, 115, 149–153. [Google Scholar] [CrossRef]
  9. Lee, G.F.; Clesceri, N.L.; Fitzgerald, G.P. Studies on the analysis of phosphate in algal cultures. Air Water Pollut. 1965, 9, 715–722. [Google Scholar] [PubMed]
  10. Reyes, D.R.; Iossifidis, D.; Auroux, P.A.; Manz, A. Micro Total Analysis Systems. 1. Introduction, Theory, and technology. Anal. Chem. 2002, 74, 2623–2636. [Google Scholar] [CrossRef] [PubMed]
  11. Jeffries, D.S.; Dieken, F.P.; Jones, D.E. Performance of the autoclave digestion method for total phosphorus analysis. Water Res. 1979, 13, 275–279. [Google Scholar] [CrossRef]
  12. Meinikmann, K.; Hupfer, M.; Lewandowski, J. Phosphorus in groundwater discharge—A potential source for lake eutrophication. J. Hydrol. 2015, 524, 214–226. [Google Scholar] [CrossRef]
  13. Arora, A.; Simone, G.; Salieb-Beugelaar, G.B.; Kim, J.T.; Manz, A. Latest Development in Micro Total Analysis Systems. Anal. Chem. 2010, 82, 4830–4847. [Google Scholar] [CrossRef]
  14. Li, S.S.; Cheng, C.M. Analogy among microfluidics, micromachines, and microelectronics. Lab Chip 2013, 13, 3782–3788. [Google Scholar] [CrossRef]
  15. Waggoner, P.S.; Craighead, H.G. Craighead, Micro-and annomechanical sensors for environmental, chemical, and biological detection. Lab Chip 2007, 7, 1238–1255. [Google Scholar] [CrossRef]
  16. Ma, J.; Yuan, Y.; Zhou, T.; Yuan, D. Determination of total phosphorus in natural water with a simple neutral digestion method using sodium persulfate. Limnol. Oceanogr. Methods 2017, 15, 372–380. [Google Scholar] [CrossRef]
  17. Osburn, Q.W.; Lemmel, D.E.; Downey, R.L. Automated method for ortho-,ortho-plus hydrolysable, and total phosphate in surface and wastewaters. Environ. Sci. Technol. 1974, 8, 363–366. [Google Scholar] [CrossRef]
  18. Harvey, H.W. The estimation of phosphate and total phosphorus in sea water. J. Mar. Biol. Assoc. UK 1948, 27, 337–359. [Google Scholar] [CrossRef] [PubMed]
  19. Jung, D.G.; Jung, D.; Kong, S.H. Characterization of Total-Phosphorus (TP) Pretreatment Microfluidic Chip Based on a Thermally Enhanced Photocatalyst for Portable Analysis of Eutrophication. Sensor 2019, 19, 3452. [Google Scholar] [CrossRef] [PubMed]
  20. Jung, D.G.; Jung, D.; Kong, S.H. Lab-on-a-chip based total-phosphorus analysis device utilizing a photocatalytic rection. Solid State Electron. 2018, 140, 100–108. [Google Scholar] [CrossRef]
  21. Jung, D.G.; Han, M.; Kim, S.D.; Kwon, S.Y.; Kwon, J.; Lee, J.; Kong, S.H.; Jung, D. Miniaturized Portable Total Phosphorus Analysis Device Based on Photocatalytic Reaction for the Prevention of Eutrophication. Micromachines 2019, 12, 1062. [Google Scholar] [CrossRef]
  22. Nakata, K.; Fujishima, A. TiO2 photocatalysis: 19, Design and applications. J. Photochem. Photobiol. C Photochem. Rev. 2012, 13, 169–189. [Google Scholar] [CrossRef]
  23. Wang, N.; Lei, L.; Zhang, X.M.; Tsang, Y.H.; Chen, Y.; Chan, L.W.H. A comparative study of preparation methods of nanoporous TiO2 films for microfluidic. Microelectron. Eng. 2011, 88, 2797–2799. [Google Scholar] [CrossRef]
  24. Kusiak-Nejman, E.; Morawski, A.W. TiO2/graphene-based nanocomposites for water treatment: A brief overview of charge carrier transfer, antimicrobial and photocatalytic performance. Appl. Catal. B Environ. 2019, 253, 179–186. [Google Scholar] [CrossRef]
  25. Birnal, P.; Marco de Lucas, M.C.; Pochard, I.; Herbst, F.; Heintz, O.; Saviot, L.; Domenichini, B.; Imhoff, L. Visible-light photocatalytic degradation of dyes by TiO2-Au inverse opal films synthesized by Atomic Layer Deposition. Appl. Surf. Sci. 2023, 609, 155213. [Google Scholar] [CrossRef]
  26. Armelao, L.; Barreca, D.; Bottaro, G.; Gasparotto, A.; Maccato, C.; Maragno, C.; Tondello, E.; Štangar, U.L.; Bergant, M.; Mahne, D. Photocatalytic and antibacterial activity of TiO2 and Au/TiO2 nanosystems. Nanotechnology 2007, 18, 375709. [Google Scholar] [CrossRef]
  27. Lin, L.; Zhong, Q.; Zheng, Y.; Cheng, Y.; Qi, R.; Huang, R. Size effect of Au nanoparticles in Au-TiO2−x photocatalyst. Chem. Phys. Lett. 2021, 770, 138457. [Google Scholar] [CrossRef]
  28. Linsebigler, A.L.; Lu, G.; Yates, J.Y., Jr. Photocatalysis on TiO2 surfaces: Principles, Mechanisms, and Selected Result. Chem. Rev. 1995, 95, 735–758. [Google Scholar] [CrossRef]
  29. Parka, H.; Park, Y.; Kimb, W.; Choi, W. Surface modification of TiO2 photocatalyst for environmental applications. J. Photochem. Photobiol. C Photochem. Rev. 2013, 15, 1–20. [Google Scholar] [CrossRef]
  30. Chen, D.; Cheng, Y.; Zhou, N.; Chen, P.; Wang, Y.; Li, K.; Huo, S.; Cheng, P.; Peng, P.; Zhang, R.; et al. Photocatalytic degradation of organic pollutants using TiO2-based photocatalysts: A review. J. Clean. Prod. 2020, 268, 121725. [Google Scholar] [CrossRef]
  31. Parrino, F.; Livraghi, S.; Giamello, E.; Ceccato, R.; Palmisano, L. Role of Hydroxyl, Superoxide, and Nitrate Radicals on the Fate of Bromide Ions in Photocatalytic TiO2 Suspensions. ACS Catal. 2020, 10, 7922–7931. [Google Scholar] [CrossRef]
  32. Yang, L.M.; Yu, L.E.; Ray, M.B. Photocatalytic Oxidation of Paracetamol: Dominant Reactants, Intermediates, and Reaction Mechanisms. Environ. Sci. Technol. 2009, 43, 460–465. [Google Scholar] [CrossRef] [PubMed]
  33. Kawasaki, M.; Chen, M.; Yang, J.; Chiou, W.; Shiojiri, M. Structural analysis of Au/TiO2 thin films deposited on the glass substrate. Appl. Phys. Lett. 2013, 102, 091603. [Google Scholar] [CrossRef]
  34. Reiners, M.; Xu, K.; Aslam, N.; Devi, A.; Waser, R.; Hoffmann-Eifert, S. Growth and Crystallization of TiO2 Thin Films by Atomic Layer Deposition Using a Novel Amido Guanidinate Titanium Source and Tetrakis-dimethylamido-titanium. Chem. Mater. 2013, 25, 2934–2943. [Google Scholar] [CrossRef]
  35. Byrne, C.; Fagan, R.; Hinder, S.; McCormack, D.E.; Pillai, S.C. New approach of modifying the anatase to rutile transition temperature in TiO2 photocatalysts. RCS Adv. 2016, 6, 95232–95238. [Google Scholar] [CrossRef]
  36. Mathpal, M.C.; Tripathi, A.K.; Singh, M.K.; Gairola, S.P.; Pandey, S.N.; Agarwal, A. Effect of annealing temperature on Raman spectra of TiO2 nanoparticles. Chem. Phys. Lett. 2013, 555, 182–186. [Google Scholar] [CrossRef]
  37. Lu, Y.; Chen, S.; Quan, X.; Yu, H. Fabrication of a TiO2/Au Nanorod Array for Enhanced Photocatalysis. Chin. J. Catal. 2011, 32, 1838–1843. [Google Scholar] [CrossRef]
  38. Zhuang, J.; Dai, W.; Tian, Q.; Li, Z.; Xie, L.; Wang, J.; Liu, P.; Shi, X.; Wang, D. Photocatalytic Degradation of RhB over TiO2 Bilayer Films: Effect of Defects and Their Location. Langmuir 2010, 26, 9686–9694. [Google Scholar] [CrossRef]
  39. Rizzo, L.; Koch, J.; Belgiorno, V.; Anderson, M.A. Removal of methylene blue in a photocatalytic reactor using polymethylmethacrylate supported TiO2 nanofilm. Desalination 2007, 211, 1–9. [Google Scholar] [CrossRef]
  40. Wang, X.; Hu, Z.; Chen, Y.; Zhao, G.; Liu, Y.; Wen, Z. A novel approach towards high-performance composite photocatalyst of TiO2 deposited on activated carbon. Appl. Surf. Sci. 2009, 255, 3953–3958. [Google Scholar] [CrossRef]
  41. Alizadeh, S.; Nazari, Z. A Review on Gold Nanoparticles Aggregation and Its Application. Chem. Rev. 2020, 2, 228–242. [Google Scholar]
  42. LeGore, L.J.; Lad, R.J.; Vetelino, J.F.; Frederick, B.G.; Kenik, E.A. Aggregation and sticking probability of gold on tungsten trioxide films. Sens. Actuators B Chem. 2001, 76, 373–379. [Google Scholar] [CrossRef]
  43. Lin, C.P.; Chen, H.; Nakaruk, A.; Koshy, P.; Sorrell, C.C. Effect of Annealing Temperature on the Photocatalytic Activity of TiO2 Thin Films. Energy Procedia 2013, 34, 627–636. [Google Scholar] [CrossRef]
  44. Sankapal, B.R.; Lux-Steiner, M.C.; Ennaoui, A. Synthesis and characterization of anatase-TiO2 thin films. Appl. Surf. Sci. 2005, 239, 165–170. [Google Scholar] [CrossRef]
  45. Kim, D. Influence of Au thickness on the optical and electrical properties of transparent and conducting TiO2/Au multilayer films. Opt. Commun. 2010, 283, 1792–1794. [Google Scholar] [CrossRef]
  46. Sriubas, M.; Kavaliunas, V.; Bockute, K.; Palevicius, P.; Kaminskas, M.; Rinkevicius, Z.; Ragulskis, M.; Laukaitis, G. Formation of Au nanostructure on the surface of annealed TiO2 thin film. Surf. Interfaces 2021, 25, 101239. [Google Scholar] [CrossRef]
  47. Sakthivel, S.; Shankar, M.V.; Palanichamy, M.; Arabindoo, B.; Bahnemann, D.W.; Murugesan, V. Enhancement of photocatalytic activity by metal deposition: Characterization and photonic efficiency of Pt, Au and Pd deposited on TiO2 catalyst. Water Res. 2004, 38, 3001–3008. [Google Scholar] [CrossRef]
  48. Arabatzis, I.M.; Stergiopoulos, T.; Andreeva, D.; Kitova, S.; Neophytides, S.G.; Falaras, P. Characterization and photocatalytic activity of Au/TiO2 thin films for azo-dye degradation. J. Catal. 2003, 220, 127–135. [Google Scholar] [CrossRef]
  49. Wu, Y.; Liu, H.; Zhang, J.; Chen, F. Enhanced Photocatalytic Activity of Nitrogen-Doped Titania by Deposited with Gold. J. Phys. Chem. C 2009, 113, 14689–14695. [Google Scholar] [CrossRef]
Figure 1. Process flow of total phosphorus (TP) analysis using an autoclave and an LOC device.
Applsci 14 01774 g001
Figure 2. Schematic of the pollutant degradation mechanism of TiO2/Au nanocomposite film under UV irradiation.
Applsci 14 01774 g002
Figure 3. (a) Top view of the pre-designed microchannel of the LOC device and (b) schematic of the photocatalytic microfluidic reactor.
Applsci 14 01774 g003
Figure 4. (a) Fabrication process of the PDMS mold and PDMS, (b) 3D diagram of the LOC test device, and (c) the fabrication process of the TiO2/Au nanocomposite film on a quartz substrate.
Applsci 14 01774 g004
Figure 5. 3D layered structure diagram of the LOC device.
Applsci 14 01774 g005
Figure 6. SEM images of gold film before annealing (ad) and gold film (eh) and TiO2/Au nanocomposite film (il) after annealing. (Au: 600 °C, 1 h. TiO2/Au: 500 °C, 1 h).
Applsci 14 01774 g006
Figure 7. XRD patterns of the pure TiO2 (a) and TiO2/Au nanocomposite films, (b): TiO2/Au (1 nm), (c): TiO2/Au (2 nm), (d): TiO2/Au (3 nm), (e): TiO2/Au (4 nm) after annealing.
Applsci 14 01774 g007
Figure 8. (a) Absorbance of RhB when the photocatalytic reaction time was 1 min, and (b) RhB degradation graph at 550 nm with different LOC devices under different photocatalytic reaction durations.
Applsci 14 01774 g008
Figure 9. Transmittance of TiO2 and TiO2/Au nanocomposite films with different deposition thicknesses of gold films.
Applsci 14 01774 g009
Figure 10. (a) Measured absorbance of standard solution with different concentrations of phosphate and (b) images of solutions with different phosphate concentrations after coloring.
Applsci 14 01774 g010
Figure 11. (a) Measured absorbance of phosphorus-containing analyte using the autoclave and LOC device under different photocatalytic reaction durations and (b) peak values at 880 nm.
Applsci 14 01774 g011
Figure 12. Comparative results of the LOC device and autoclave used to determine the relationship between the TP concentrations and absorbance. (wavelength = 880 nm; photocatalytic reaction time of 15 min).
Applsci 14 01774 g012
Disclaimer/Publisher’s Note: The statements, opinions and data contained in all publications are solely those of the individual author(s) and contributor(s) and not of MDPI and/or the editor(s). MDPI and/or the editor(s) disclaim responsibility for any injury to people or property resulting from any ideas, methods, instructions or products referred to in the content.

