Abstract
In order to quantitatively assess the risk of deeply buried tunnel construction in the case of a hidden karst cave at the bottom of the tunnel, the first deeply buried tunnel construction failure model (PH−1) is firstly proposed based on the upper bound theorem of limit analysis and Protodyakonov’s theory. Thereafter, based on the upper bound theorem of limit analysis and the energy dissipation theory, the second deeply buried tunnel construction failure model (PH−2) is proposed. Furthermore, on the basis of the reliability theory, the dimensionless performance functions of each damage region under these two deeply buried tunnel construction damage modes are constructed. Finally, the instability probability of each damage region under the two damage modes is calculated using the Monte Carlo sampling method. This study suggests that the PH−1 failure model is not suitable for analysing the probability of instability in tunnel construction in hard plastic red clay strata, while the PH−2 failure model is appropriate for analysing the probability of instability in tunnel construction in hard plastic red clay strata. The worse the geological conditions, the larger the diameter of the cavern, the smaller the clearance between the cavern and the tunnel, and the greater the threat to safe tunnel construction.
1. Introduction
Tunnel construction in karst areas [1] could suffer from the risk of geological disasters such as karst water and mud inrush [2] and landslides. Regarding the tunnelling, the specific spatial dimensions of the karst cave, the specific orientation of the karst cave, the presence or absence of a filling medium inside the karst cave, and the pressure of the filling medium inside the karst cave will all have an impact on the ability of the tunnel to pass through the karst area [3], which is fraught with safety hazards. In comparison with the continuous homogeneous single-phase medium stratum, the stratum of a karst region is subject to the combined effect of the gas phase, liquid phase and solid phase, which will easily lead to the expansion and complication of the security risk of tunnel construction [4] if it is constructed blindly or handled inappropriately. Therefore, it is necessary to assess the safety risk of tunnel construction in karst areas and lay a theoretical foundation for preventing and resolving the major risks of tunnel construction in karst areas.
In recent years, a number of scholars at home and abroad have established a safety evaluation system and method for tunnel construction in karst areas by applying theoretical methods, such as fuzzy comprehensive evaluation method [5], analytic hierarchy process [6], attribute recognition theoretical model [7] and other theoretical methods, to predict and analyse the possibility of geological hazards occurring during the construction of the tunnels and to judge the safety risk level of karst tunnel construction. However, the fuzzy comprehensive evaluation method [8] and the attribute recognition theoretical [9] model require the high reliability of data, and there are certain subjective considerations. And the hierarchical analysis method requires a large amount of data statistics, the weights are difficult to determine, and the human subjective factors have a greater impact on the whole comprehensive evaluation process. The analytic hierarchy process [10] requires a large amount of data statistics, the weights are difficult to determine, and human subjective considerations have a significant impact on the overall comprehensive evaluation process. For the purpose of objectively identifying the disaster risk of water and mud inrush during tunnel construction in karst areas, several scholars at home and abroad have taken elastic–plastic mechanics [11], damage and fracture mechanics [12], fluid mechanics [13,14] and other theoretical bases, and revealed and analysed the disaster mechanism of karst water and mud inrush under the action of high-pressure karst water in tunnel construction through researching and analysing the minimum safe thickness of the rock and soil bodies against breakout between the karst tunnel space and the space containing high-pressure medium. Although the method for calculating the minimum safe thickness [15,16] of the rock and soil masses for preventing the breakout could effectively determine the interaction mechanism between the tunnel and the karst water, for complex geological conditions such as large buried depth and the randomness of geotechnical parameters, the risk level of water surge in deeply buried tunnels in karst regions under complex circumstances could not be determined in a satisfactory way.
In view of the large influence of human subjective considerations in the evaluation of the tunnel risk level in the above research status, firstly, based on the upper bound theorem of limit analysis [17] and Protodyakonov’s theory, the first damage model for deep-buried tunnel construction should be proposed. And based on the upper bound theorem of limit analysis and energy dissipation theory, the second damage model for deeply buried tunnel construction should be proposed. Thereafter, the velocity field expressions, the expressions of the energy dissipation rate, and the expressions for the power of the external work under self-weight for each damage region in these two deep-buried tunnel construction damage models should be derived. Furthermore, based on the reliability theory [18], the performance function expressions for each damage region under these two deeply buried tunnel construction damage modes should be established. And based on the Monte Carlo sampling method, the expressions of the instability probability of each damage region should be proposed when the karst cave is at the bottom of the tunnel under the two damage modes of deep-buried tunnel construction.
Secondly, the safety factors of a deeply buried tunnel with a karst cave at the bottom of the tunnel should be calculated by applying the non-intrusive stochastic finite element method [19] and the finite element strength reduction method [20]. Comparative analysis should be carried out with the safety factors obtained from two methods of calculating the probability of instability in the deep-buried tunnel construction. Thus, the reasonableness of these two damage modes for the construction of a deep-buried tunnel with a karst cave located at the bottom of the tunnel and the validity of this method of instability probability for the construction of deeply buried karst tunnels could be verified.
Thirdly, this method of calculating the instability probability of deep-buried tunnel construction where a karst cave is located at the bottom of the tunnel would be applied to practical engineering, and the consequences of the tunnel diameter, the cohesion of the rock and soil masses, the medium pressure inside the karst cave, and the clear distance between the tunnel and the karst cave on the safety and stability of the tunnel structure would be analysed and studied. The research results would provide a theoretical basis for the design and construction safety of deeply buried tunnels [21] where a karst cave is located at the bottom of the tunnel. The annotated list of the symbols involved in the article is shown in Table 1.

Table 1.
Symbol annotation table.
2. Damage Model of a Karst Tunnel
On the basis of the upper bound theorem of limit analysis for geotechnical masses, it is impossible for the geotechnical mass to withstand the imposed loads if the force exerted by the external force on any hypothetical destructive mechanism in the tunnel is greater than the rate of energy dissipation within the area. Consequently, for any destructive mechanism in the geotechnical masses, when the external power exerted by the external force is equal to the internal energy dissipation rate, the upper limit solution for the destructive or ultimate load is obtained by solving the equations established in this way. In reference [18], the karst cave is hidden below the tunnel design axis, which is the most dangerous situation when the karst cave is directly below the tunnel excavation faces. Construction damage models for shallow-buried karst tunnels have been given in the literature, while the proposed construction damage models for deep-hidden karst tunnels have rarely been reported. Therefore, according to the upper bound theorem of limit analysis and Protodyakonov’s theory [22], the first construction damage model of deeply buried tunnel construction with hidden karst cave at the bottom is proposed.
Protodyakonov’s theory was first proposed in 1907. According to Protodyakonov’s theory, the damage to deeply buried tunnels occurs only at the tunnel vault. The surrounding rock pressure results from the loosening pressure at the tunnel vault, and the magnitude of the surrounding rock pressure depends on the weight of the rock and soil masses under the collapse arch, and it is only relevant to the tunnel span and the physical property indices of the rock and soil masses, but not to the tunnel depth. Thus, in the case of increasing tunnel depth, the first karst tunnel construction damage model is still applicable when Protodyakonov’s pressure arch is formed. According to the energy dissipation theory [23], rock exchanges material and energy with the external environment at all times during the damage process, which is a dynamic damage evolution process of energy dissipation. Nevertheless, at greater burial depths, the energy exchange in the rock and soil masses above the collapse arch needs to be considered. And upon this point, the first model of destruction becomes no longer applicable. Consequently, on the basis of the upper bound theorem of limit analysis and energy dissipation theory, the second damage model for deeply buried tunnel construction in a bottom hidden karst cave is proposed.
For the convenience of presentation, the first hidden bottom karst cave deeply buried tunnel construction damage mode is named PH−1, and the second hidden bottom karst cave deeply buried tunnel construction damage mode is named PH−2. The PH−1 failure model, based on the limit analysis upper bound method and Protodyakonov’s theory, consists of two damage zones, M−1 and M−2. The M−1 block consists of the triangle block and n − 1 triangular blocks . The left side of the M−2 region consists of the polygonal block and n − 1 triangular blocks , and the right side of the M−2 region consists of the polygonal block and n − 1 triangular blocks , as shown in Figure 1a.
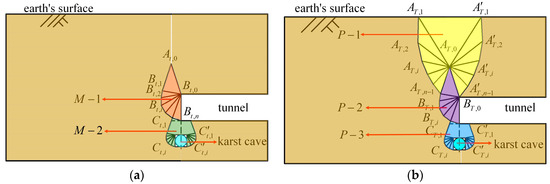
Figure 1.
The failure modes: (a) PH−1 failure model; and (b) PH−2 failure model.
The PH−2 failure mode, based on the upper bound theorem of limit analysis and energy dissipation theory, consists of three failure zones: P−1, P−2 and P−3. The P−1 region consists of the triangular block , n − 1 triangular blocks and n − 1 triangular blocks . The P−2 block consists of the triangle block and n − 1 triangular blocks . The left side of the P−3 region consists of the polygonal block and n − 1 triangular blocks , and the right side of the P−3 region consists of the polygonal block and n − 1 triangular blocks , as shown in Figure 1b.
In view of the complexity of the practical projects, in order to facilitate the calculation of the analytical solution of deeply buried tunnel excavation when the cavern is at the bottom of the tunnel, the complicated and diverse karst caves are simplified into a circular cavity, and the tunnel model could be simplified to the plane strain problem. Consequently, the following basic assumptions should be considered for the model of the deeply buried tunnel:
- (1)
- The constitutive model of the rock and soil masses follows the Mohr–Coulomb strength criterion and the geotechnical body obeys the associated flow rule when the plastic yielding occurs.
- (2)
- The tunnel diameter is , the diameter of the karst cave is , the buried depth of the tunnel is , the heights of the collapsing bodies and are , the clear distance between the karst cave and the tunnel is , the geotechnical weight is , the internal friction angle is , and the cohesion of the rock and soil masses is c.
- (3)
- The karst cave would be assumed to be empty or filled with the filling medium.
- (4)
- The physical property parameters of the geotechnical body have been assumed to conform to the Gaussian distribution.
2.1. Velocity Field
For the purpose of more clearly describing the limit state of deep-buried tunnel construction when the karst cave is at the bottom of the tunnel, the velocity field of each damage region in the deep-buried karst tunnel construction damage model was firstly established.
Following the upper bound theorem of limit analysis for geotechnical masses, the discontinuity between the neighbouring blocks is called the velocity discontinuity line [24], and plastic flow occurs only on the velocity discontinuity line. As shown in Figure 2a,b, it is assumed that the velocity of the triangular block is . The velocity expressions for the velocity discontinuity lines and in the M−1 region are given in Equations (1) and (2), respectively.
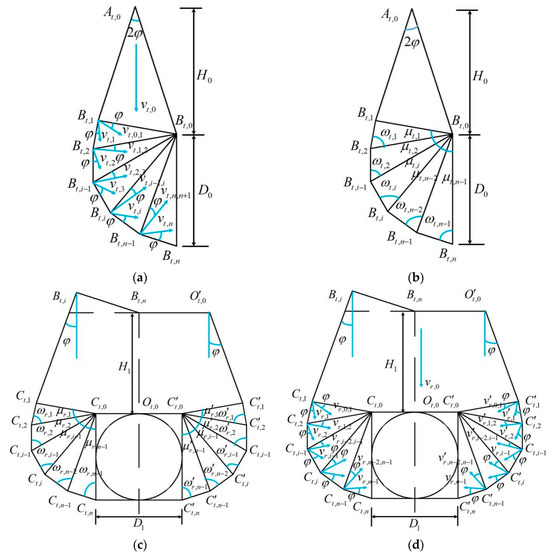
Figure 2.
Velocity fields, angles and dimensions of the PH−1 failure model: (a) velocity field in the M−1 region; (b) angles and dimensions of the M−1 region; (c) angles and dimensions of the M−2 region; and (d) velocity field in the M−2 region.
The velocity expressions for the velocity discontinuity lines and in the M−1 region are given in Equations (3) and (4), respectively.
As shown in Figure 2c,d, the velocity expressions for the velocity discontinuity lines and in the M−2 region are given in Equations (5) and (6), respectively.
It is shown in Figure 3a,b that the velocity of the triangular block is , and the velocity expressions for the velocity discontinuity line and are Equations (7) and (8), respectively.
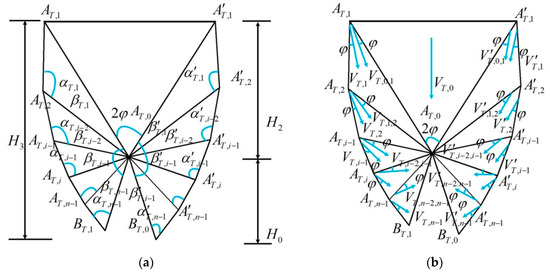
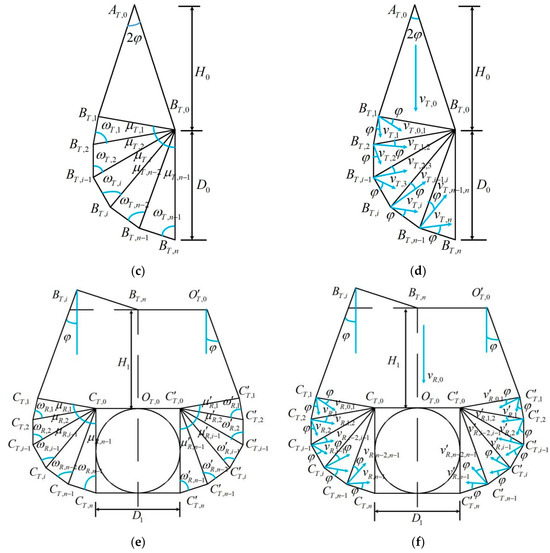
Figure 3.
Velocity fields, angles and dimensions of the PH−2 failure model: (a) angles and dimensions of the P−1 region; (b) velocity field in the P−1 region; (c) angles and dimensions of the P−2 region; (d) velocity field in the P−2 region; (e) angles and dimensions of the P−3 region; and (f) velocity field in the P−3 region.
As shown in Figure 3a,b, the velocity expressions for the velocity discontinuity lines and in the P−1 region are given in Equations (9) and (10), respectively.
And the velocity expressions for the velocity discontinuity lines and in the P−1 region are given in Equations (11) and (12), respectively.
And, as shown in Figure 3c,d, the velocity expressions for the velocity discontinuity lines and in the P−2 region are given in Equations (13) and (14), respectively.
And, as shown in Figure 3e,f, the velocity of the velocity discontinuity line in the P−3 region is . The velocity expressions for the velocity discontinuity lines and on the left side of the P−3 region are given in Equations (15) and (16), respectively.
The velocity expressions for the velocity discontinuity lines and on the right side of the P−3 region are given in Equations (17) and (18), respectively.
2.2. Energy Dissipation Rate
In the upper bound theorem of limit analysis, the magnitude of the load-bearing capacity of the geotechnical body is expressed in the form of the magnitude of the energy dissipation rate within the rock and soil mass.
Energy dissipation within geotechnical masses occurs only on the velocity discontinuity surfaces between the blocks, and it is necessary to calculate the lengths and velocities of the velocity discontinuity lines between the blocks. The energy dissipation rate in the interior of the rock and soil mass could be calculated from the product of the length and velocity of the velocity discontinuity lines between the blocks. As shown in Figure 2a,b, the expression for the energy dissipation rate of the velocity discontinuity lines , , and in the M−1 region is given by Equation (19).
As shown in Figure 2c,d, the expression for the energy dissipation rate of the velocity discontinuity lines , and on the left side of the M−2 region is given by Equation (20).
As shown in Figure 3a,b, the expressions , for the energy dissipation rate of the velocity discontinuity lines , , and on the left side of the P−1 region are given by Equations (21) and (22), respectively.
As shown in Figure 3c,d, the expression for the energy dissipation rate of the velocity discontinuity lines , , and on the left side of the P−2 region is given by Equation (23).
As shown in Figure 3e,f, the expression for the energy dissipation rate of the velocity discontinuity lines , and on the left side of the P−3 region in the PH−2 damage mode are given in Equation (24).
2.3. Power Exerted by the External Force
In the upper bound theorem of limit analysis, the damage areas could be divided into a number of rigid polygonal blocks. The loading effect of the rock and soil masses around the deeply buried tunnel when the karst cave is located at the bottom of the tunnel could be represented by calculating the external power of the polygonal blocks in each damage region under the action of self-weight.
According to the upper bound theorem of limit analysis for geotechnical masses, the power contributed by each computational region under the self-weight of the geotechnical mass is the product of the self-weight of the geotechnical body in that region and the vertical component of the velocity of the centre of gravity in that region. As shown in Figure 2a,b, the expression for the power of the external work of the triangular blocks and under its own weight is given by Equation (25).
It is shown in Figure 2c,d that the expression for the power of the external work of the polygonal block and the triangle block in the M−2 region under self-weight is given by Equation (26).
where and are the area of the polygonal block and the triangle block , respectively.
The karst cave medium fills the karst cave and the karst cave medium pressure applies forces on the inner surface of the karst cave. In the PH−1 failure mode, the power of the external work performed by the pressure of the karst cave medium is expressed as:
where K is the lateral pressure coefficient on the geotechnical mass.
It is shown in Figure 3a,b that the expression for the power of the external work of the triangle blocks , and in the P−1 region under self-weight in the PH−2 failure model is given by Equation (28).
where , , and are the area of the triangle blocks , , and , respectively.
It is shown in Figure 3c,d that the expression for the power of the external work of the triangle blocks and in the region P−2 under self-weight in the PH−2 failure model is given by Equation (29).
As shown in Figure 3e,f, the expression for the power of the external work of the polygonal block and the triangle block in the P−3 region under self-weight in the PH−2 failure model is given by Equation (30).
where and are the area of the polygonal block and the triangle block , respectively.
In the PH−2 failure mode, the power of the external work performed by the pressure of the karst cave medium is expressed as:
where K is the lateral pressure coefficient on the geotechnical mass.
With a view to applying this method of calculating the instability probability in deeply buried tunnel construction when the karst cave is located at the bottom of the tunnel to practical engineering, the expressions of the analytical solutions for each damage region in these two deeply buried tunnel failure modes have to fulfil the specific geometrical constraints. Hence, the expressions for the geometrical constraints of the M−1 region in the PH−1 failure model are given in Equation (32).
And the expressions for the geometrical constraints of the M−2 region in the PH−1 failure model are Equation (33).
And the expressions for the geometrical constraints of the P−1 region in the PH−2 failure model are Equation (34).
And the expressions for the geometrical constraints of the P−2 region in the PH−2 failure model are Equation (35).
And the expressions for the geometrical constraints of the P−3 region in the PH−2 failure model are Equation (36).
2.4. Performance Functions
With an emphasis on the application of the reliability method of the deep-buried karst tunnel stability with the random field of the geotechnical parameters, the energy evolution state of the deep-buried tunnel structure could be characterised by the performance function of the deeply buried tunnel structure with the karst cave located at the bottom of the tunnel.
In accordance with the reliability theory, the performance of the structure is the general designation for the structural loading capacity, adaptive performance, and durability performance. Through establishing the performance function of the structure to characterise the limit state of the structure, and for the uncertainty and ambiguity of the spatial probability distribution of the physical characteristic indices of the geotechnical mass due to the shortage of geological exploration sample points, a random field model is established to solve the problems of tunnelling and underground engineering, and the geological parameters of the geotechnical mass should be characterised as random variables [25]. Taking the expression of the internal energy dissipation rate in the damage area as the denominator, and the expression of the external power under the self-weight of each block in the damage area as the numerator, the dimensionless performance function of the deeply buried tunnel of the hidden karst cave is established. The performance function expression of the structure for the M−1 region is:
The performance function expression of the structure for the M−2 region is given in Equation (38).
The performance function expression of the structure for the P−1 region and the P−2 region in the PH−2 failure mode is Equation (39).
The performance function expression of the structure for the P−3 region in the PH−2 failure mode is Equation (40).
Moreover, MATLAB software could be applied to simulate the randomness of the physical property parameters of geotechnical bodies, such as cohesion, internal friction angle and gravity, using the Monte Carlo sampling method [26], thereby calculating the instability probability in deeply buried tunnel construction when the karst cave is located at the bottom of the tunnel.
The instability probability in the M−1 region in the PH−1 failure mode is given by:
where is the function of the M−1 region, and a is the critical value for determining whether the region is damaged or not.
The instability probability in the M−2 region in the PH−1 failure mode is given by:
where is the function of the M−2 region, and a is the critical value for determining whether the region is damaged or not.
The instability probability in the P−1 region and P−2 region in the PH−2 failure mode is given by:
where is the function of the P−1 region and the P−2 region, and a is the critical value for determining whether the region is damaged or not.
The instability probability in the P−3 region in the PH−2 failure mode is given by:
where is the function of the P−3 region, and a is the critical value for determining whether the region is damaged or not.
3. Comparison and Verification
The finite element strength reduction method could achieve the ultimate failure state of the deeply buried tunnel construction failure model when the karst cave is located at the bottom of the tunnel by establishing the elastic–plastic finite element model and continuously reducing the internal friction angle and the cohesion of the rock and soil mass, so as to obtain the failure state of the deeply buried karst tunnel model and calculate the corresponding safety factors.
Firstly, the two-dimensional numerical simulation model of deeply buried tunnel construction when the karst cave is located at the bottom of the tunnel should be established. The tunnel is 100 m long, the buried depth of the tunnel is 50 m, the diameter of the tunnel is 6.7 m, the diameter of the karst cave is 3 m, and the clear distance between the karst cave and the tunnel is 3 m.
Secondly, the upper boundary of the numerical simulation model of the deeply buried karst tunnel is a free surface, the displacement constraint perpendicular to the boundary direction should be imposed on the side boundary, and the bottom boundary should be subjected to displacement constraints in two directions. The numerical simulation model only considers the self-weight effect of the rock and soil masses.
Thirdly, the numerical simulation model of the deeply buried karst tunnel could adopt the physical property indices of the moderately weathered dolomite, as shown in Table 1. The internal friction angle and the cohesion of the rock and soil masses could be reduced once, and the finite element calculation model could be automatically iteratively calculated once until the construction of the deeply buried karst tunnel is simulated and destroyed, so as to obtain the corresponding safety factor.
The non-intrusive stochastic finite element method for deep-buried karst tunnels could combine the finite element numerical simulation batch-processing calculations with the stochastic analysis theory, and it should establish the interface framework between the instability probability analysis in the construction of deep-buried karst tunnels and the universal finite element software after taking into account the effects of the random distribution of the parameters of the rock and soil bodies, so as to calculate the safety coefficients of the construction of the deep-buried karst tunnels.
Firstly, the finite element strength reduction method could be applied to calculate the safety factors for the construction of the deeply buried karst tunnels.
Secondly, the geotechnical body parameters could be simulated by means of the random field, thus obtaining n samples of the input variables and generating n finite element run codes by means of the editing program.
Thirdly, these n code files of the finite element models could be operated, so as to calculate the ultimate stress value under the damage state of n deep-buried karst tunnel construction and compare with the ultimate stress value when the safety factor is 1. Eventually, the instability probability in the construction of the deep-buried karst tunnel could be statistically determined.
Through comparing and analysing with the safety coefficients calculated by two methods, such as the non-intrusive stochastic finite element method and the finite element strength reduction method, therefore, the reasonableness of the calculation method of the instability probability of the deeply buried tunnel construction could be verified when the karst cave is located at the bottom of the tunnel.
And the safety factors calculated by the four methods, namely, the non-intrusive stochastic finite element method, the finite element strength reduction method, the PH−1 failure mode, and the PH−2 failure mode, should be compared. In addition, in the non-intrusive stochastic finite element method, the random sample of 1500 was drawn from the range of internal friction angle 42°–52°.
Figure 4a demonstrates the logarithmic strain of the rock and soil mass around the tunnel when the tunnel burial depth is 30 m and the plastic strain zone in the figure has gone through to the Earth’s surface. It is evident that at this point, considering only the effect of the geotechnical weight forces in the loose circle of the tunnel surrounding rock, this does not completely reveal the mechanical characteristics of tunnel construction. Figure 4b demonstrates the logarithmic strain of the rock and soil mass around the tunnel when the tunnel burial depth is 60 m, the plastic strain zone in the figure is concentrated with respect to the tunnel face and adjacent to the cavern, and it is also more widely distributed above the tunnel excavation faces. Therefore, the validity and applicability of the PH−1 damage mode and the PH−2 damage mode should be further determined after comparative analyses of the calculation results obtained through inputting the physical property parameters of the rock–soil mass.
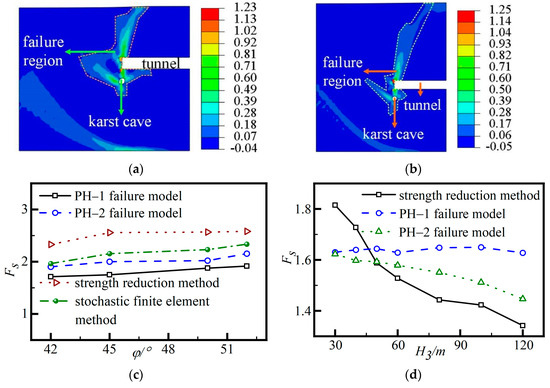
Figure 4.
Contrast verification: (a) the diagram of the logarithmic strain (i.e., LE, ); (b) the diagram of the logarithmic strain (i.e., LE, ); (c) the internal friction angle; and (d) the buried depth of the tunnel.
As shown in Figure 4c, when , the safety factor for the M−1 area in the PH−1 failure model is 12.59% smaller than that for the P−1 area and the P−2 area in the PH−2 failure model. And the safety factor in the P−1 region and the P−2 region in the PH−2 failure mode is 7.13% smaller than that in the non-intrusive stochastic finite element method. The safety factor obtained by the finite element strength discounting method is 31.62% greater than that obtained for the M−1 zone in the PH−1 failure model and 21.76% greater than that obtained for the P−1 zone and the P−2 zone in the PH−2 failure model. In conclusion, the largest factor of safety could be obtained by applying the finite element strength reduction method, while the result calculated on the basis of the PH−1 failure model could be the smallest.
As shown in Figure 4d, when the tunnel depth is 50 m, the safety factor achieved by the finite element strength reduction method is 0.30% larger than that of the PH−2 failure model. The safety factor obtained in the PH−1 failure model is 3.10% greater than that calculated in the PH−2 failure model. At a tunnel depth of 100 m, the safety factor obtained in the PH−1 failure model is 8.38% greater than in the PH−2 failure model. The safety factor obtained in the PH−2 failure mode is 5.84% greater than that calculated by the finite element strength reduction method. This study has revealed that the safety factor obtained by the finite element strength reduction method and the safety factor [27] based on the PH−2 failure model decreases significantly with an increasing tunnel depth. The curve of the safety factor in the PH−1 failure model fluctuates only slightly with an increasing tunnel depth.
However, this is attributed to the consideration of the full self-weight of the overburden above the tunnel excavation face by the finite element strength reduction method and the calculation method for the analytical solution of instability probability based on the PH−2 failure model, whereas the analytical solution for the instability probability based on the PH−1 failure model only takes into account the gravitational force of the structural block within the range of the disturbance area.
4. Engineering Application
4.1. General Engineering Situation
The subway section is the underground engineering of an urban public transport support project in a city, and the engineering geological profile is shown in Figure 5. Karst is more developed in the region, and the diameter of the karst cave is in the range of 1.5 m–17.0 m. The metro tunnel was constructed via the shield-driving method, and the shield tunnel passes through different strata such as hard plastic red clay, moderately weathered dolomite and slightly weathered dolomite. The index table of the physical property parameters of the stratum is shown in Table 2.
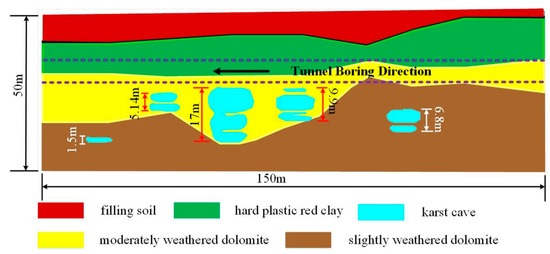
Figure 5.
The engineering geologic profile.
Table 2.
The index table of the physical property parameters of the stratum.
4.2. Influence of the Tunnel Diameter on the Tunnel Surrounding Rock
According to Code for risk management of underground works in urban rail transit (GB50652-2011) [28], when the probability value of the risk is greater than 10%, the occurrence probability of the risk is classified as level 1. And when the probability value of the risk is between 1% and 10%, the occurrence probability of the risk is classified as level 2. With a view to analysing the influence of the tunnel diameter on the instability probability of the tunnel’s surrounding rock under the PH−1 failure model and the PH−2 failure model, as shown in Figure 6a, when the tunnel diameter is 3 m and the tunnel is boring in slightly weathered dolomite strata, the instability probability of the M−1 region in the PH−1 failure mode and the instability probability of the P−1 zone and the P−2 zone in the PH−2 failure mode is 5.5% and 2.86%, respectively. And the difference in the instability probability calculated for the two damage modes is 2.6%. When the tunnel diameter is 8 m and the tunnel is boring in moderately weathered dolomite strata, the instability probability of the M−1 region in the PH−1 failure mode and the instability probability of the P−1 zone and the P−2 zone in the PH−2 failure mode is 7.76% and 7.8%, respectively. And the difference in the instability probability calculated for the two damage modes is 0.04%. When the tunnel diameter is 15 m and the tunnel is boring in the hard plastic red clay strata, the instability probability of the M−1 region in the PH−1 failure mode and the instability probability of the P−1 zone and the P−2 zone in the PH−2 failure mode is 37.59% and 21.95%, respectively. And the difference in the instability probability calculated for the two damage modes is 15.64%.
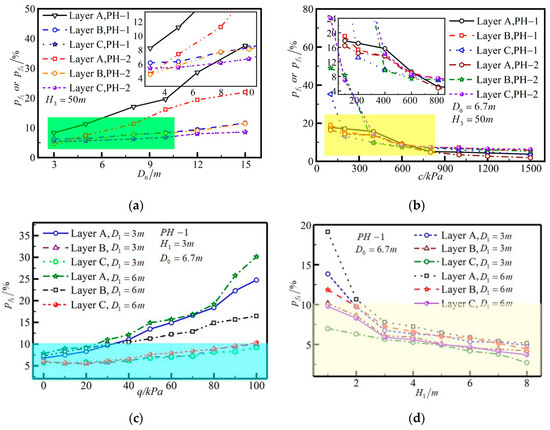
Figure 6.
Parameter analysis: (a) the tunnel diameter; (b) the cohesion of the rock-soil mass; (c) the medium pressure of the karst cave; and (d) the clear distance between the karst cave and the tunnel; The curve in the green area is denser. In order to see more clearly, the enlarged curve is in the upper right corner of Figure 6a. The curve in the yellow area is denser. In order to see more clearly, the enlarged curve is in the upper right corner of Figure 6b. Note: the hard plastic red clay strata—Layer A, the moderately weathered dolomite strata—Layer B, the slightly weathered dolomite strata—Layer C, —the clearance between the karst cave and the tunnel, and —the diameter of the karst cave.
This investigation shows that when the tunnel passes through the moderately weathered dolomite strata and slightly weathered dolomite strata, there is not much difference between the results of the PH−1 failure mode and the PH−2 failure mode. However, the instability probability calculated from the PH−1 failure model and the instability probability calculated from the PH−2 failure model differ considerably when tunnelling in hard plastic red clay strata. This is owing to the good stratigraphic integrity of the moderately weathered dolomite strata and slightly weathered dolomite strata and the high self-supporting capacity of the tunnel surrounding rock. Nevertheless, the cohesion of the hard plastic red clay is relatively weak, and the self-supporting capacity of the tunnel surrounding rock is also relatively weak.
Hence, both the PH−1 failure mode and the PH−2 failure mode are appropriate for analysing the instability probability in tunnel construction in moderately weathered dolomite and slightly weathered dolomite formations. However, the PH−1 failure model is not suitable for analysing the probability of instability in tunnel construction in hard plastic red clay strata, while the PH−2 failure model is appropriate for analysing the probability of instability in tunnel construction in hard plastic red clay strata.
4.3. Influence of the Cohesion on the Tunnel Surrounding Rock
The instability probability curve of the tunnel’s surrounding rock is shown in Figure 6b. When the tunnel passes through the slightly weathered dolomite strata, with the tunnel depth of 50 m, the tunnel diameter of 6.7 m and the cohesion of the rock–soil mass of 400 kPa, the instability probability of the M−1 region in the PH−1 failure mode and the instability probability of the P−1 zone and the P−2 zone in the PH−2 failure mode is 9.82% and 14.26%, respectively. And the difference in the instability probability calculated for the two damage modes is 4.44%. When the cohesion of the rock–soil mass is 200 kPa, the instability probability of the M−1 region in the PH−1 failure mode and the instability probability of the P−1 zone and the P−2 zone in the PH−2 failure mode is 13.18% and 42.57%, respectively. And the difference in the instability probability calculated for the two damage modes is 29.39%. The curve slope of the instability probability for the tunnel’s surrounding rock in the slightly weathered dolomite strata suddenly becomes steeper after the cohesion of the rock–soil mass is less than 400 kPa. This is due to the fact that after the cohesion is reduced to 400 kPa, the energy dissipation rate of the slightly weathered dolomite in the PH−2 failure mode is less than the external power under the self-weighting effect of the geotechnical body. The curve slope of the instability probability for the tunnel surrounding rock in the moderately weathered dolomite strata also suddenly steepens after the cohesion of the rock–soil mass is less than 200 kPa.
When the tunnel passes through the hard plastic red clay strata and the cohesion of the rock–soil mass is 100 kPa, the instability probability of the M−1 region in the PH−1 failure mode and the instability probability of the P−1 zone and the P−2 zone in the PH−2 failure mode is 17.82% and 16.42%, respectively. And the difference in the instability probability calculated for the two damage modes is 1.4%. It is illustrated that the method for calculating the instability probability in tunnel construction based on the two failure modes is applicable when the tunnel is constructed in the hard plastic red clay stratum with the cohesion of 100 kPa.
4.4. Impact of the Medium Pressure on the Tunnel Structure
The principal difference between the PH−1 failure mode and the PH−2 failure mode is that the PH−2 failure mode takes into account the self-weight of the blocks in the P−1 region, yet the PH−1 failure model does not take into account the effect of self-gravity in this area. In addition, the damage pattern in the M−2 region of the PH−1 damage pattern and the P−2 region of the PH−2 damage pattern could be considered to be identical. Therefore, it is only necessary to discuss the effect of the pressure magnitude of the karst cave medium in the M−2 region of the PH−1 failure model on the instability probability of the tunnel structure during the tunnel construction.
As shown in Figure 6c, when the tunnel passes through the hard plastic red clay layer, with the medium pressure of 100 kPa, the diameter of karst cave of 3 m, the instability probability of the M−2 region in the PH−1 failure mode is 9.19%, thus the occurrence probability of the risk is classified as level 2. However, when the tunnel passes through the moderately weathered dolomite layer, the instability probability of the M−2 region in the PH−1 failure mode is 10.01%. And when the tunnel passes through the hard plastic red clay layer, the instability probability of the M−2 region in the PH−1 failure mode is 24.76%. At this time, the calculated instability probability for above both cases is greater than 10% and the occurrence probability of the risk is classified as level 1.
When the tunnel passes through the hard plastic red clay stratum and the diameter of the karst cave is 3 m and 6 m, respectively, the medium pressure of the karst cave is 30 kPa and the instability probability of the M−2 region is 9.71% and 11.00%, respectively. Therefore, the occurrence probability of the risk in the former case is ranked as level 2, while the occurrence probability of the risk in the latter case is ranked as level 1. When the tunnel passes through the moderately weathered dolomite layer and the diameter of the cavern is 3 m and 6 m, respectively, the medium pressure of the karst cave is 40 kPa and the instability probability of the M−2 region is 6.13% and 10.44%, respectively. Therefore, the occurrence probability of the risk in the former case is ranked as level 2, while the occurrence probability of the risk in the latter case is ranked as level 1. It has been demonstrated that the worse the geological conditions and the larger the diameter of the karst cave, the greater the threat to the safe construction of the tunnel.
4.5. Impact of the Clear Distance between Karst Cave and Tunnel on the Tunnel Structure
As shown in Figure 6d, when the tunnel passes through the slightly weathered dolomite strata and the diameter of the karst cave is 3 m and 6 m, respectively, the karst cave is empty, and the clear distance between the karst cave and the tunnel is 4 m, the instability probability of the M−2 region in PH−1 failure mode is 5.27% and 5.59%, respectively. Thus, the degree of occurrence probability of the above two conditions is classified as level 2.
When the tunnel passes through the hard plastic red clay layer and the karst cave is empty, the diameter of the karst cave is 6 m, and the clear distance between the karst cave and the tunnel is 2 m and 6 m, respectively, the instability probability of the M−2 region in PH−1 failure mode is 10.66% and 5.89%, respectively. Therefore, the occurrence probability of the risk in the former case is ranked as level 1, while the occurrence probability of the risk [29] in the latter case is ranked as level 2. Therefore, it has been suggested that the smaller the clearance between the karst cave and the tunnel, and the larger the diameter of the karst cave, the more vulnerable the tunnel structure becomes.
5. Conclusions
Aiming to quantitatively assess the risk of deeply buried tunnel construction in the case of a hidden karst cave at the bottom of the tunnel, the first deeply buried tunnel construction failure model (PH−1) is firstly proposed based on the upper bound theorem of limit analysis and Protodyakonov’s theory. Thereafter, based on the upper bound theorem of limit analysis and energy dissipation theory, the second deeply buried tunnel construction failure model (PH−2) is proposed. Furthermore, on the basis of the reliability theory, the dimensionless performance functions of each damage region under these two deeply buried tunnel construction damage modes are constructed. Finally, the instability probability of each damage region under the two damage modes is calculated using the Monte Carlo sampling method. Through comparison and analysis with the safety coefficients obtained by the non-intrusive stochastic finite element method and finite element strength reduction method, the effectiveness and feasibility of the calculation method of the instability probability for deeply buried tunnel construction in the case of a hidden karst cave at the bottom of the tunnel are verified. These two methods of calculating the instability probability in deeply buried tunnel construction were applied to actual projects to analyse and study the consequences of the tunnel diameter, the cohesion of rock and soil masses, the medium pressure inside the karst cave, and the clear distance between the tunnel and the karst cave on the safety and stability of the tunnel structure. The conclusions of the research are the following:
- (1)
- The results calculated on the basis of the PH−1 failure model could be the smallest, and the results could be more conservative than the safety factors calculated by applying the strength reduction method. And the safety factors based on the PH−2 failure model decreases significantly with increasing tunnel depth. The curve of the safety factors in the PH−1 failure model fluctuates only slightly with an increasing tunnel depth.
- (2)
- When the tunnel passes through the moderately weathered dolomite strata and slightly weathered dolomite strata, there is not much difference between the results of the PH−1 failure mode and the PH−2 failure mode. However, the instability probability calculated from the PH−1 failure model and the instability probability calculated from the PH−2 failure model differ considerably when tunnelling in hard plastic red clay strata. Hence, both the PH−1 failure mode and the PH−2 failure mode are appropriate for analysing the instability probability in tunnel construction in moderately weathered dolomite and slightly weathered dolomite formations. Moreover, the PH−1 failure model is not suitable for analysing the probability of instability in tunnel construction in hard plastic red clay strata, while the PH−2 failure model is appropriate for analysing the probability of instability in tunnel construction in hard plastic red clay strata.
- (3)
- The method of calculating the instability probability in tunnel construction based on the two failure modes is applicable when the tunnel is constructed in hard plastic red clay stratum with the cohesion of 100 kPa. And the worse the geological conditions and the larger the diameter of the karst cave, the greater the threat to the safe construction of the tunnel. Furthermore, the smaller the clearance between the karst cave and the tunnel, and the larger the diameter of the karst cave, the more vulnerable the tunnel structure becomes.
Author Contributions
Conceptualization, B.W. and W.S.; methodology, B.W. and W.S.; writing—original draft, W.S.; writing—review and editing, B.W.; supervision, B.W. All authors have read and agreed to the published version of the manuscript.
Funding
This work was supported by the National Natural Science Foundation of China (Nos. 52278397, 52168055) and the Jiangxi Natural Science Foundation Program (No. 20212ACB204001). The financial support is gratefully acknowledged.
Institutional Review Board Statement
Not applicable.
Informed Consent Statement
Not applicable.
Data Availability Statement
The original contributions presented in the study are included in the article, further inquiries can be directed to the corresponding author.
Acknowledgments
The authors thank the reviewers for their great help with the article during its review progress.
Conflicts of Interest
The authors declare no conflicts of interest.
References
- Zhang, K.; Tannant, D.D.; Zheng, W.; Chen, S.; Tan, X. Prediction of karst for tunnelling using fuzzy assessment combined with geological investigations. Tunn. Undergr. Space Technol. 2018, 80, 64–77. [Google Scholar] [CrossRef]
- Li, S.; Zhou, Z.; Li, L.; Xu, Z.; Zhang, Q.; Shi, S. Risk assessment of water inrush in karst tunnels based on attribute synthetic evaluation system. Tunn. Undergr. Space Technol. 2013, 38, 50–58. [Google Scholar] [CrossRef]
- Cui, Q.; Wu, H.; Shen, S.; Xu, Y.; Ye, G. Chinese karst geology and measures to prevent geohazards during shield tunnelling in karst region with caves. Nat. Hazards 2015, 77, 129–152. [Google Scholar] [CrossRef]
- Li, S.; Wu, J.; Xu, Z.; Zhou, L.; Zhang, B. A possible prediction method to determine the top concealed karst cave based on displacement monitoring during tunnel construction. Bull. Eng. Geol. Environ. 2019, 78, 341–355. [Google Scholar] [CrossRef]
- Lin, L.; Xia, Y.; Wu, D. A hybrid fuzzy multiple criteria decision-making approach for comprehensive performance evaluation of tunnel boring machine disc cutter. Comput. Ind. Eng. 2020, 149, 106793. [Google Scholar] [CrossRef]
- Xu, X.; Tong, L.; Liu, S.; Li, H. Evaluation model for immersed tunnel health state: A case study of Honggu Tunnel, Jiangxi Province, China. Tunn. Undergr. Space Technol. 2019, 90, 239–248. [Google Scholar] [CrossRef]
- Xu, Z.; Cai, N.; Li, X.; Xiao, M.; Dong, T. Risk assessment of loess tunnel collapse during construction based on an attribute recognition model. Bull. Eng. Geol. Environ. 2021, 80, 6205–6220. [Google Scholar] [CrossRef]
- Wang, Y.; Liu, B.; Qi, Y. A Risk Evaluation Method with an Improved Scale for Tunnel Engineering. Arab. J. Sci. Eng. 2018, 43, 2053–2067. [Google Scholar] [CrossRef]
- Wang, J.; Li, S.; Li, L.; Lin, P.; Xu, Z.; Gao, C. Attribute recognition model for risk assessment of water inrush. Bull. Eng. Geol. Environ. 2019, 78, 1057–1071. [Google Scholar] [CrossRef]
- Wu, J.; Zhou, Z. Risk assessment of seepage failure in deep excavations based on fuzzy analytic hierarchy process and cloud model. Acta Geotech. 2023, 18, 5635–5658. [Google Scholar] [CrossRef]
- Gao, F.; Li, S. Elastic-plastic analysis of circular tunnel based on unified strength theory and considering multiple plastic zones. Adv. Mech. Eng. 2023, 15, 16878132221146392. [Google Scholar] [CrossRef]
- Yan, J.; Zou, Z.; Guo, S.; Zhang, Q.; Hu, X.; Luo, T. Mechanical behavior and damage constitutive model of granodiorite in a deep buried tunnel. Bull. Eng. Geol. Environ. 2022, 81, 118. [Google Scholar] [CrossRef]
- Zhang, S.; Ye, F.; Fu, W. An Analytical Model for Water Inflow into a Karst Tunnel in Vuggy and Fractured Porous Rock Aquifers. Int. J. Geomech. 2022, 22, 04022222. [Google Scholar] [CrossRef]
- Xie, Q.; Cao, Z.; Sun, W.; Fumagalli, A.; Fu, X.; Wu, Z.; Wu, K. Numerical simulation of the fluid-solid coupling mechanism of water and mud inrush in a water-rich fault tunnel. Tunn. Undergr. Space Technol. 2023, 131, 104796. [Google Scholar] [CrossRef]
- Xu, Z.; Huang, X.; Li, S.; Lin, P.; Shi, X.; Wu, J. A new slice-based method for calculating the minimum safe thickness for a filled-type karst cave. Bull. Eng. Geol. Environ. 2020, 79, 1097–1111. [Google Scholar] [CrossRef]
- Duan, Y.; Zhang, X.; Zhou, X.; Ou, X. Research on the Mechanism and Safe Thickness of Karst Tunnel-Induced Water Inrush under the Coupling Action of Blasting Load and Water Pressure. Appl. Sci. 2022, 12, 11891. [Google Scholar] [CrossRef]
- Wu, W.; Liu, X.; Guo, J.; Sun, F.; Huang, X.; Zhu, Z. Upper limit analysis of stability of the water-resistant rock mass of a Karst tunnel face considering the seepage force. Bull. Eng. Geol. Environ. 2021, 80, 5813–5830. [Google Scholar] [CrossRef]
- Wu, B.; Sun, W.; Cai, G.; Meng, G. Reliability analysis of shallow-buried tunnel construction adjacent to karst cave. Comput. Geotech. 2022, 145, 104673. [Google Scholar] [CrossRef]
- Jiang, S.; Li, D.; Zhang, L.; Zhou, C. Slope reliability analysis considering spatially variable shear strength parameters using a non-intrusive stochastic finite element method. Eng. Geol. 2014, 168, 120–128. [Google Scholar] [CrossRef]
- Zheng, Y.; Xu, H.; Wang, C.; Xiao, Q. Failure mechanism of tunnel and dividing line standard between shallow and deep bury. J. Zhejiang Univ. (Eng. Sci.) 2010, 44, 1851–1856+1875. (In Chinese) [Google Scholar]
- Dong, L.; Wang, H.; Song, D.; Chen, J.; Liu, C. Analysis of the catastrophe mechanism and treatment countermeasures of a sudden water inrush disaster in a long and deeply buried tunnel in the karst area. J. Perform. Constr. Facil. 2023, 37, 06023002. [Google Scholar] [CrossRef]
- Li, P.; Wang, F.; Fan, L.; Wang, H.; Ma, G. Analytical scrutiny of loosening pressure on deep twin-tunnels in rock formations. Tunn. Undergr. Space Technol. 2019, 83, 373–380. [Google Scholar] [CrossRef]
- Zhang, L.; Liu, Y.; Yang, Q. Study on time-dependent behavior and stability assessment of deep-buried tunnels based on internal state variable theory. Tunn. Undergr. Space Technol. 2016, 51, 164–174. [Google Scholar] [CrossRef]
- Chen, W. Limit Analysis and Soil Plasticity; Elsevier: Amsterdam, The Netherlands, 1975. [Google Scholar]
- Pandit, B.; Babu, G.L.S. Probabilistic stability assessment of tunnel-support system considering spatial variability in weak rock mass. Comput. Geotech. 2021, 137, 104242. [Google Scholar] [CrossRef]
- Pan, Q.; Dias, D. An efficient reliability method combining adaptive Support Vector Machine and Monte Carlo Simulation. Struct. Saf. 2017, 67, 85–95. [Google Scholar] [CrossRef]
- Huang, F.; Zhang, D.; Sun, Z.; Jin, Q. Upper bound solutions of stability factor of shallow tunnels in saturated soil based on strength reduction technique. J. Cent. South Univ. 2012, 19, 2008–2015. [Google Scholar] [CrossRef]
- GB50652-2011; Management of Underground Works in Urban Rail Transit. China Architecture & Building Press: Beijing, China, 2011.
- Liu, W.; Chen, E.J.; Yao, E.; Wang, Y.; Chen, Y. Reliability analysis of face stability for tunnel excavation in a dependent system. Reliab. Eng. Syst. Saf. 2021, 206, 107306. [Google Scholar] [CrossRef]
Disclaimer/Publisher’s Note: The statements, opinions and data contained in all publications are solely those of the individual author(s) and contributor(s) and not of MDPI and/or the editor(s). MDPI and/or the editor(s) disclaim responsibility for any injury to people or property resulting from any ideas, methods, instructions or products referred to in the content. |
© 2024 by the authors. Licensee MDPI, Basel, Switzerland. This article is an open access article distributed under the terms and conditions of the Creative Commons Attribution (CC BY) license (https://creativecommons.org/licenses/by/4.0/).