Article

Performance Study of Black Shale Modified Soil for Road Use Based on Eshelby–Mori–Tanaka Theory

School of Civil Engineering, Changsha University of Science & Technology, Changsha 410114, China
*
Authors to whom correspondence should be addressed.
Appl. Sci. 2024, 14(4), 1636; https://doi.org/10.3390/app14041636
Submission received: 12 January 2024 / Revised: 12 February 2024 / Accepted: 14 February 2024 / Published: 18 February 2024
(This article belongs to the Section Civil Engineering)

Abstract

:
Black shale, as a type of soft rock, exhibits high strength when freshly exposed. However, it easily disintegrates upon contact with water, making it unsuitable for direct use in roadbed construction. Using it as discarded material not only increases construction costs but also pollutes the environment. Therefore, the reuse and modification of black shale have become particularly important. Based on the theory of composite material equivalent inclusions, this study investigates the strength and water stability characteristics of black shale gravel after being mixed with cement and compacted with clay. The results show that the strength of cemented soil increases linearly with the cement content. The water absorption properties of the modified soils with different amounts of black shale added are similar, with an average water absorption rate of about 2.53%. The strength of black shale modified soil is generally positively correlated with the cement content, although the linear correlation is not significant. The modified black shale soil used in the experiment is suitable for the subgrade of medium- and light-grade secondary roads and below. The recommended mass ratio is Mshale:Mclay:Mcement = 70:21:9. The unconfined compressive strength of the material under 7-day curing is 1.36 MPa. The relationship between the strength of modified soil, clay strength, cement content, and gravel addition has been established, clarifying the physical significance of each parameter. The “drying and soaking” cycle can accelerate the strength degradation of modified soil. It is recommended to strengthen the construction of roadbed drainage facilities during construction to maintain a stable and dry environment for the modified soil as a roadbed filling material. The research results not only provide clear technical indicators for the reuse of discarded black shale in engineering but also serve as a basis for proportion of crushed stone discarded material as roadbed fill.

1. Introduction

Black shale is a sedimentary rock formed by the cemented deposition of components such as quartz, pyrite, chlorite, and clay minerals, creating a layered structure. It is widely distributed worldwide, including in the eastern and central United States, the Liard Basin in Canada, and southern China (especially in Sichuan, Guizhou, Hunan, Guangxi), among other regions [1,2,3,4]. Fresh black shale has high strength, but it tends to disintegrate and soften when exposed to water [5], making it unstable. Its properties vary depending on factors such as location, rock layer, and environment. In road construction, excavated black shale is usually treated as waste material. When exposed to air, piled black shale is prone to weathering, leading to reduced stability of the accumulation and the diffusion of trace heavy metal elements into the surrounding environment with moisture. This not only pollutes the surrounding soil and water resources [6,7,8,9] but also poses potential geological hazards [10]. In developing countries, there is still a need for the construction of a large amount of infrastructure such as roads and railways, and it is difficult to avoid areas with black shale. Therefore, the rational disposal of black shale in road construction holds significant economic and ecological value.
Many scholars have explored the feasibility of using black shale as a road material in road construction to avoid the aforementioned problems and reduce construction costs. Therefore, numerous scholars have conducted feasibility studies on its use as a road material. Yu-Ling Yang et al. [11], through indoor disintegration resistance tests, found that the disintegration index of carbonaceous rocks in the Guangxi region decreased with the increase in clay mineral content, showing a power law relationship. Bryson L.S., Gomez-Gutierrez I.C., and others [12,13] suggested that compacted shale exhibits acceptable engineering properties and performance ranges. However, over time, under humid conditions, compacted shale may disintegrate and expand, leading to a reduction in durability, resulting in decreased stability and loss of bearing capacity.
Zhengfu Liu et al., through dynamic triaxial tests, investigated the influence of grading, confining pressure, moisture content, and compaction degree on the dynamic properties of carbonaceous shale coarse-grained soil. They confirmed that carbonaceous mudstone coarse-grained soil can be used for filling highway subgrades with light to medium traffic loads [14]. Ling Zeng et al. [15] used a triaxial test to study the changes in strength of disintegrated carbonaceous mudstone from the Long Lang highway in Loudi, Hunan Province, by adding fly ash, clay, and cement. They found that cement had the most significant effect on improving the cohesion of the mixed soil, followed by clay. Mao [16], through cement addition to modify weathered soft rocks along the Shiyan–Tianmen route, found that the California Bearing Ratio (CBR) and compressive strength could meet the requirements of highway engineering.
The above studies fully demonstrate the feasibility of using carbonaceous shale gravel as highway subgrade fill material. However, modification is needed, and determining the type of modifier and controlling its content pose a challenging problem. The strength and performance of expansive soil cannot be improved through simple mechanical stabilization (compaction). Generally, chemical additives are used to achieve the desired strength. Calcium-based additives (such as cement and lime) are widely used for the stabilization of clay and some expansive roadbeds [17].
Compared to lime, cement has a relatively significant impact on the mechanical properties of mountain soils. Using cement to solidify samples for 28 days can increase the compressive strength by four to six times compared to untreated samples [18]. Therefore, clay and cement can be mixed into black shale gravel particles to enhance the strength and water stability of the fill material. The particle composite material composed of black shale crushed stone and cement-soil has extremely uneven stress and strain fields, and it is extremely difficult to describe the mechanical properties of such materials using traditional homogeneous elastoplastic mechanics. In material mechanics, the effective mechanical properties of multiphase composite materials are usually evaluated using the continuous medium micromechanical equation derived from the Eshelby solution based on ellipsoidal inclusion problems. From the perspective of micromechanics, it can better describe the macroscopic mechanical properties of two-phase particle composite materials and predict the effective elastic modulus of materials [19,20,21]. In the field of geotechnical engineering, many scholars have adopted this theory to study the mechanical properties of geotechnical materials and achieved very good results [22,23]. Minghui R et al. used this method to study the mechanical properties of geotechnical materials and established a constitutive equation in the elastic state, which can be used to predict the effective Young’s modulus [24]. By considering the cement-clay mixture as the matrix and black shale gravel as the inclusion, predicting the influence of black shale content on fill strength through the average Eshelby tensor solution of the two-phase inclusion material is a promising avenue of research.
In summary, scholars have varying conclusions regarding whether easily disintegrating and softening shale can be directly used as roadbed fill material. Additionally, there is limited research on the modification of black shale aggregate. In this paper, black shale mixed with cement-soil (clay and cement mixture) was modified as road base materials. Through indoor experiments, the mechanical properties were measured to provide reference for addressing similar engineering problems in the future.

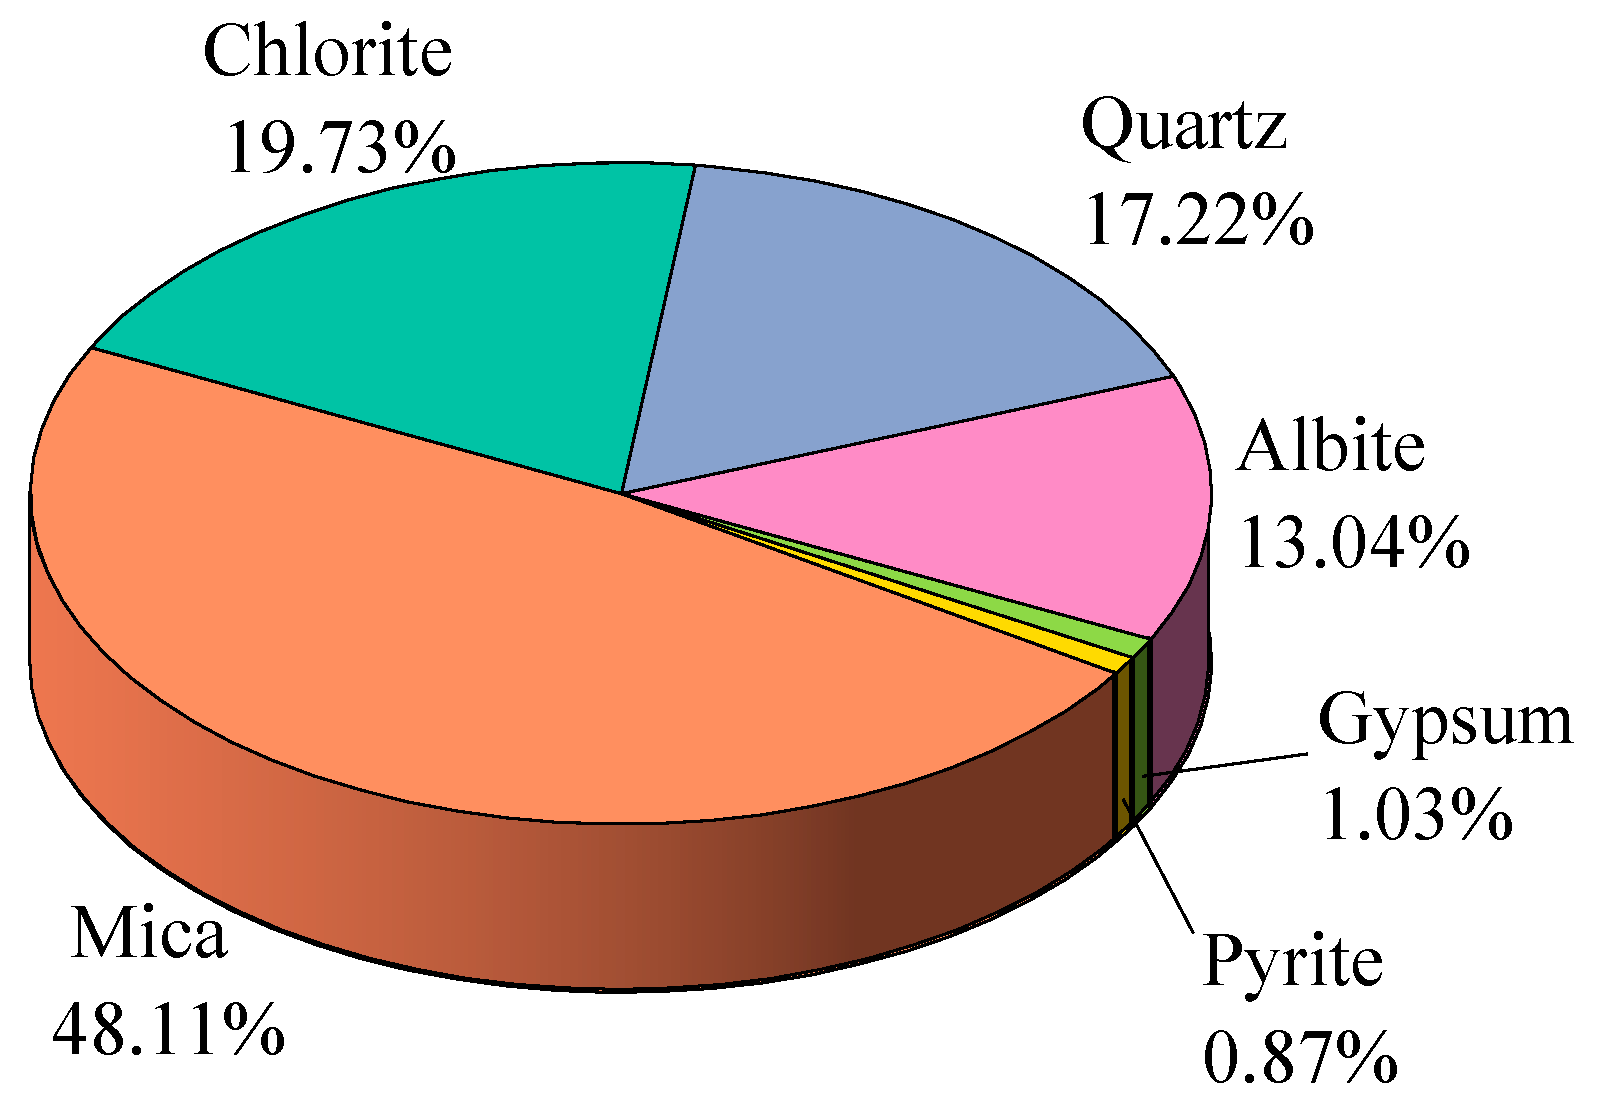
2. Experimental Materials and Their Physical Properties

This experiment primarily investigates the physical and mechanical properties of black shale aggregate as roadbed fill material. Due to the susceptibility of black shale to disintegration in alternating wet and dry environments, it is necessary to incorporate a suitable amount of low-permeability clay to prevent further disintegration of the shale aggregate, as clay can envelop the aggregate and provide a more stable environment. However, clay has poor water stability and low strength when wet, so further incorporation of cement is required to enhance the water stability of the clay. Under the combined action of clay and cement, the mechanical properties of the black shale aggregate remain stable.
Therefore, this paper explores the feasibility of using black shale aggregate as a highway subbase material through a strength test of the clay, cement, and black shale mixture. The experimental materials mainly include black shale aggregate, clay, and cement. The strength of the roadbed material depends on the comprehensive strength of the aggregate and binding materials (cement and clay, among others). This paper begins by conducting experimental research on the ratio and strength characteristics of cement-soil (a mixture of cement and clay). Combining the strength patterns of cement-soil, the paper further explores the feasibility of using cement-soil for the improvement of the performance of black shale aggregate and determines the optimal ratio for the black shale mixture.
The experimental black shale used in this study was extracted from the newly excavated bedrock on a slope along the Zhangjiajie-to-Sangzhi Expressway. The surface black shale aggregate was collected after being exposed in the open for 15 to 30 days. The apparent density of the shale is ρshale = 2.73 g/cm3. X-ray diffraction (XRD) analysis revealed that the main mineral components of the black shale include mica, chlorite, quartz, sodium feldspar, as well as small amounts of gypsum and pyrite (Figure 1). In its slightly weathered or unweathered state, the overall integrity of the black shale bedrock is good, Longmaxi black shale outcrop in Shizhu Country, Chongqing city, China. The peak stress of samples ranges from 100 to 195 MPa, whereas Young’s modulus changes from 22.22 to 42.31 GPa [25]. The unconfined compressive strength of the exposed black shale from the Longmaxi Formation in Changning, Sichuan is between 80MPa and 200Mpa [26]. However, upon exposure to the environment, it is prone to weathering and disintegration. The strength of pre-disintegrating carbonaceous shale can meet the requirement of roadbed filling, but it is not suitable to be used as roadbed filling directly [27]. The rock block in Figure 2b disintegrated into the state shown in Figure 2c after undergoing five cycles of wet and dry conditions. The strength of the shale aggregate decreases as the degree of disintegration deepens.
To understand the particle size distribution of the shale aggregate, sieving was conducted using the screening method, and the particle size distribution curve of the shale aggregate was obtained, as illustrated in Figure 3. The unevenness coefficient of the particle size distribution curve is 11.6, and the curvature coefficient is 1.12. This indicates that the particle size distribution of the shale aggregate under natural disintegration is relatively uniform, and the gradation is good, meeting the recommended gradation upper and lower limits specified in the “Technical Guidelines for Road Surface Base Construction” [28] (JTG/T F20-2015).
The clay used in the experiment was sourced from an excavated hillside at a construction site in Changsha, Hunan province. The soil samples were collected, air-dried, pulverized, and sieved to obtain samples with particle sizes not exceeding 3 mm for experimental purposes. Following the specifications outlined in the “Geotechnical Testing Procedures for Highway Engineering” [29] (JTG 3430-2020), various tests were conducted, including the determination of the soil’s Atterberg limits, compaction test (lightweight), particle relative density, and other tests, resulting in the basic physical properties of the soil (as shown in Table 1).According to the “Classification and Codes for Engineering Soils” [30] (GB/T 50145-2007), the soil was identified as a high liquid limit clay (CH).
The cement used in the experiment is produced by Hunan Pingtang Southern Cement Co., Ltd., and it is a masonry cement with a strength grade of M32.5.

3. Study on Cement-Soil Mix Proportions

3.1. Experimental Design

According to the statistical analysis of the mechanical performance indicators of cement-treated soil by Chen Changfu [31], the commonly used cement mixing ratio in engineering falls between 10% and 25%. To expand the research scope on cement mixing ratios, this experiment adopts a mass ratio denoted as S = Mcement:Mcement-soil (where Mcement-soil = Mclay + Mcement), with cement mixing ratios of 10%, 15%, 20%, 25%, and 30%. After mixing with water and compaction, cylindrical cement-soil specimens with a diameter of 100 mm and height of 120 mm were prepared. The optimal moisture content (ωop) of the clay was used as the reference to control the moisture content of the cement specimens. For each mixing ratio, at least five specimens with different moisture contents were prepared, with a 1~3% difference between adjacent moisture contents. In the case of higher cement content (30%), a 3% difference was chosen, while for lower cement contents, 1% or 2% differences were selected. For instance, for a cement content of 10%, target moisture contents were set as (ωop − 2%), (ωop − 1%), ωop, (ωop + 1%), and (ωop + 2%), followed by mixing with water and compaction, and the actual moisture content was measured.
After compaction tests according to the specifications of the “Geotechnical Testing Procedures for Highway Engineering” (JTG 3430-2020), the compacted specimens were placed in a standard curing chamber at a temperature of 20 ± 2 °C and a relative humidity of over 95% for a curing period of 7 days. Subsequently, the specimens were taken out for unconfined compressive strength testing.

3.2. Experimental Results

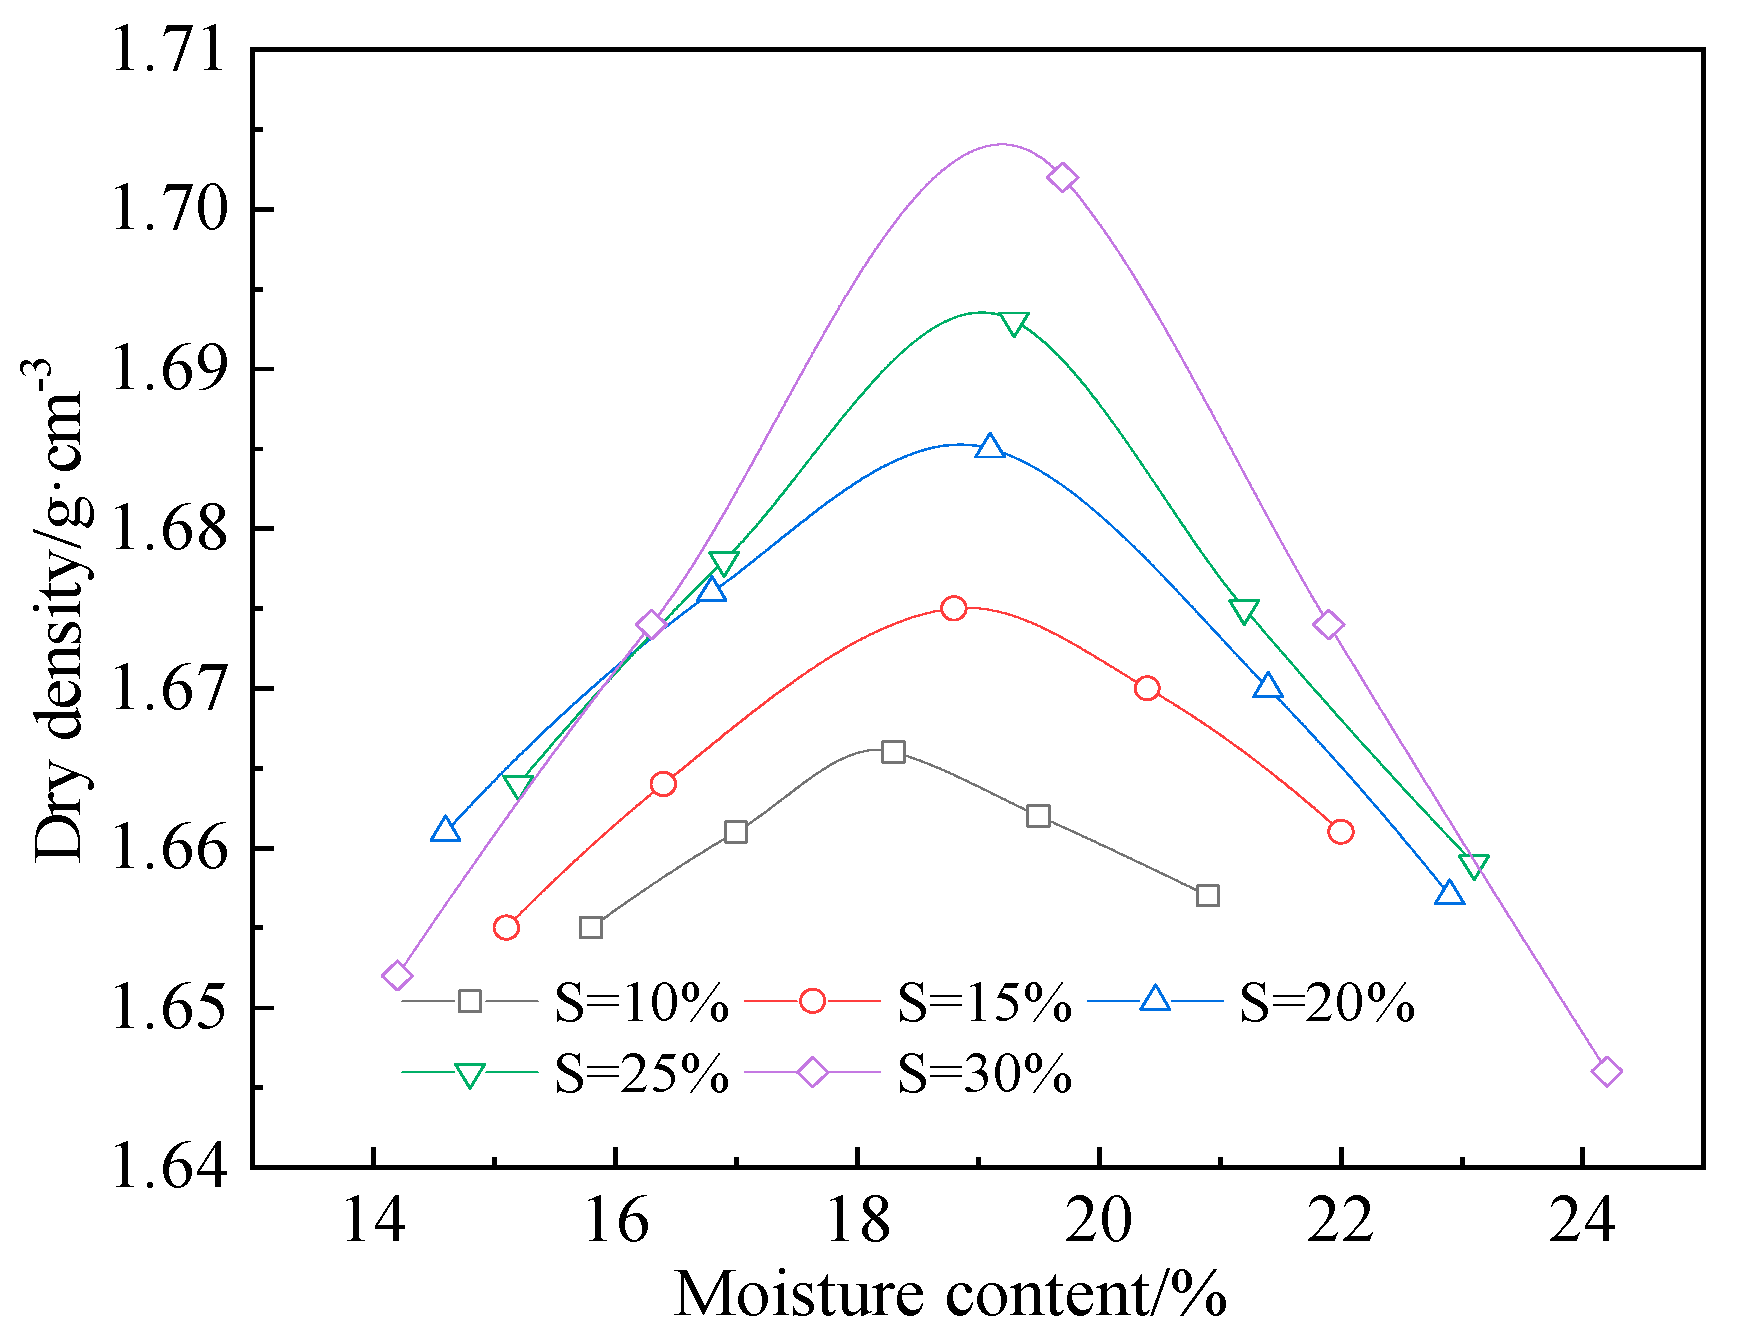
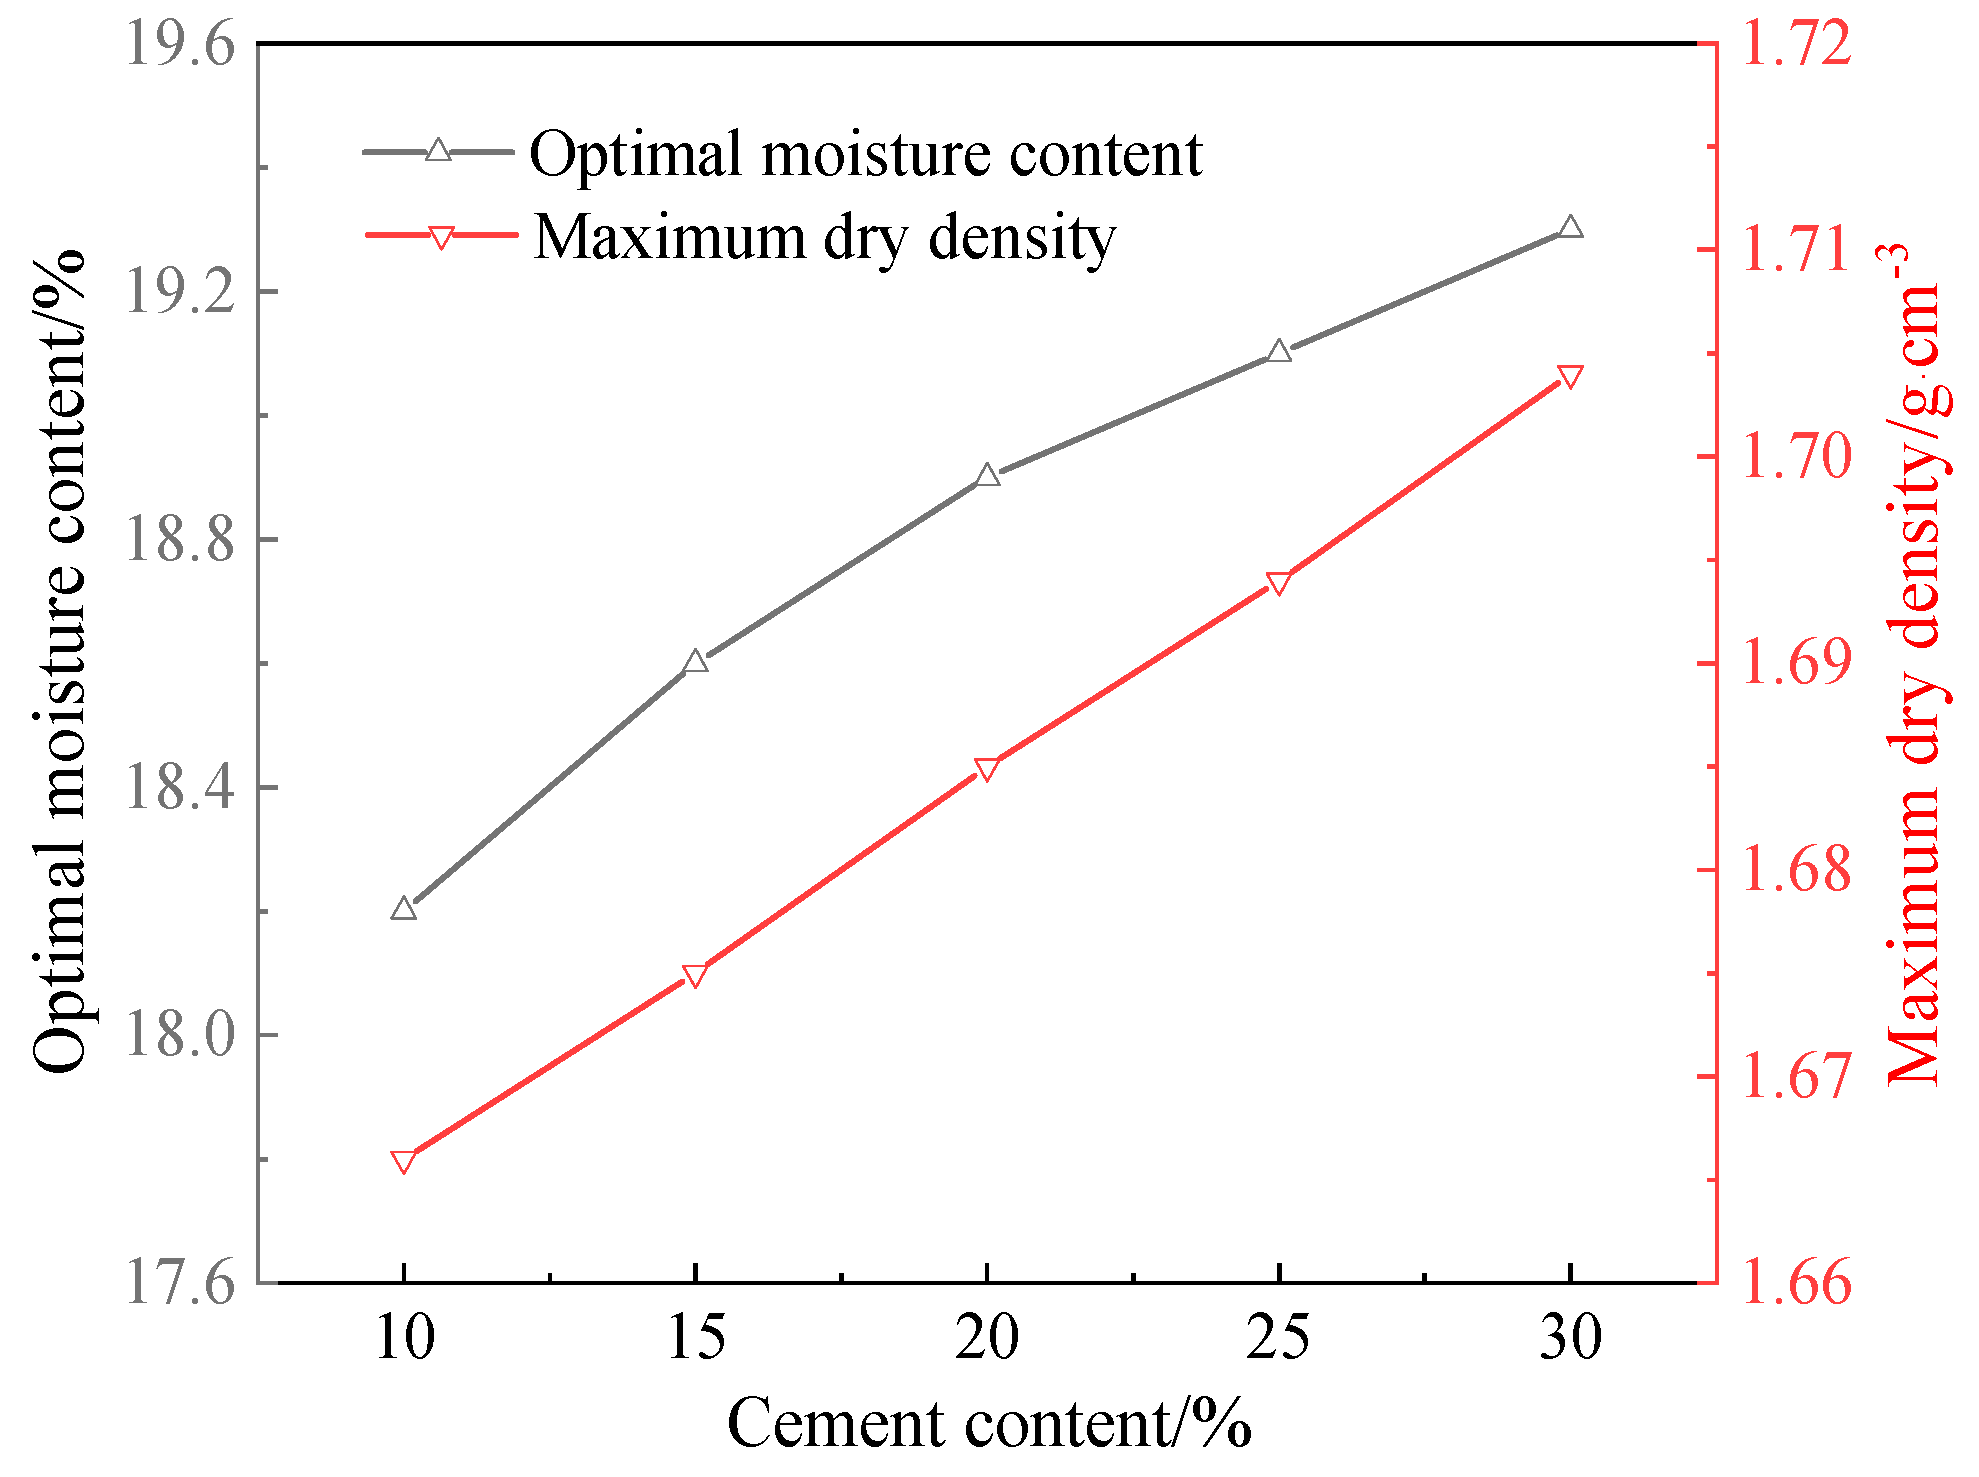
3.2.1. Compaction Characteristics of Cement-Soil

Figure 4 depicts the compaction test curves for cement-soil with different cement mixing ratios. It is evident that the moisture content-dry density curves for specimens with low cement content are relatively flat, while those with higher cement content exhibit steeper curves. This suggests that cement-soil with higher cement content is more sensitive to water, and the optimal moisture content for specimens with different cement contents is within the range of 18% to 20%, with a difference of only 2%. This indicates that the impact of the cement mixing ratio on the optimal moisture content is relatively small.
Furthermore, within the moisture content range of 15% to 23%, the dry density varies between 1.65 g/cm3 and 1.71 g/cm3, with a moisture content difference of up to 8%. In contrast, the maximum difference in dry density is only 0.06 g/cm3, representing a variation of approximately 3.6%. This implies that moisture content has a minor impact on the dry density of cement-soil, which is advantageous for construction and quality control.
Figure 5 illustrates the relationship between the optimal moisture content and the maximum dry density of cement-soil. Overall, there is an increasing trend in both the optimal moisture content and maximum dry density with the increase in cement content. This trend indicates that the hydration process of cement consumes a certain amount of water, and the physical and chemical reactions of cement result in denser soil structure.

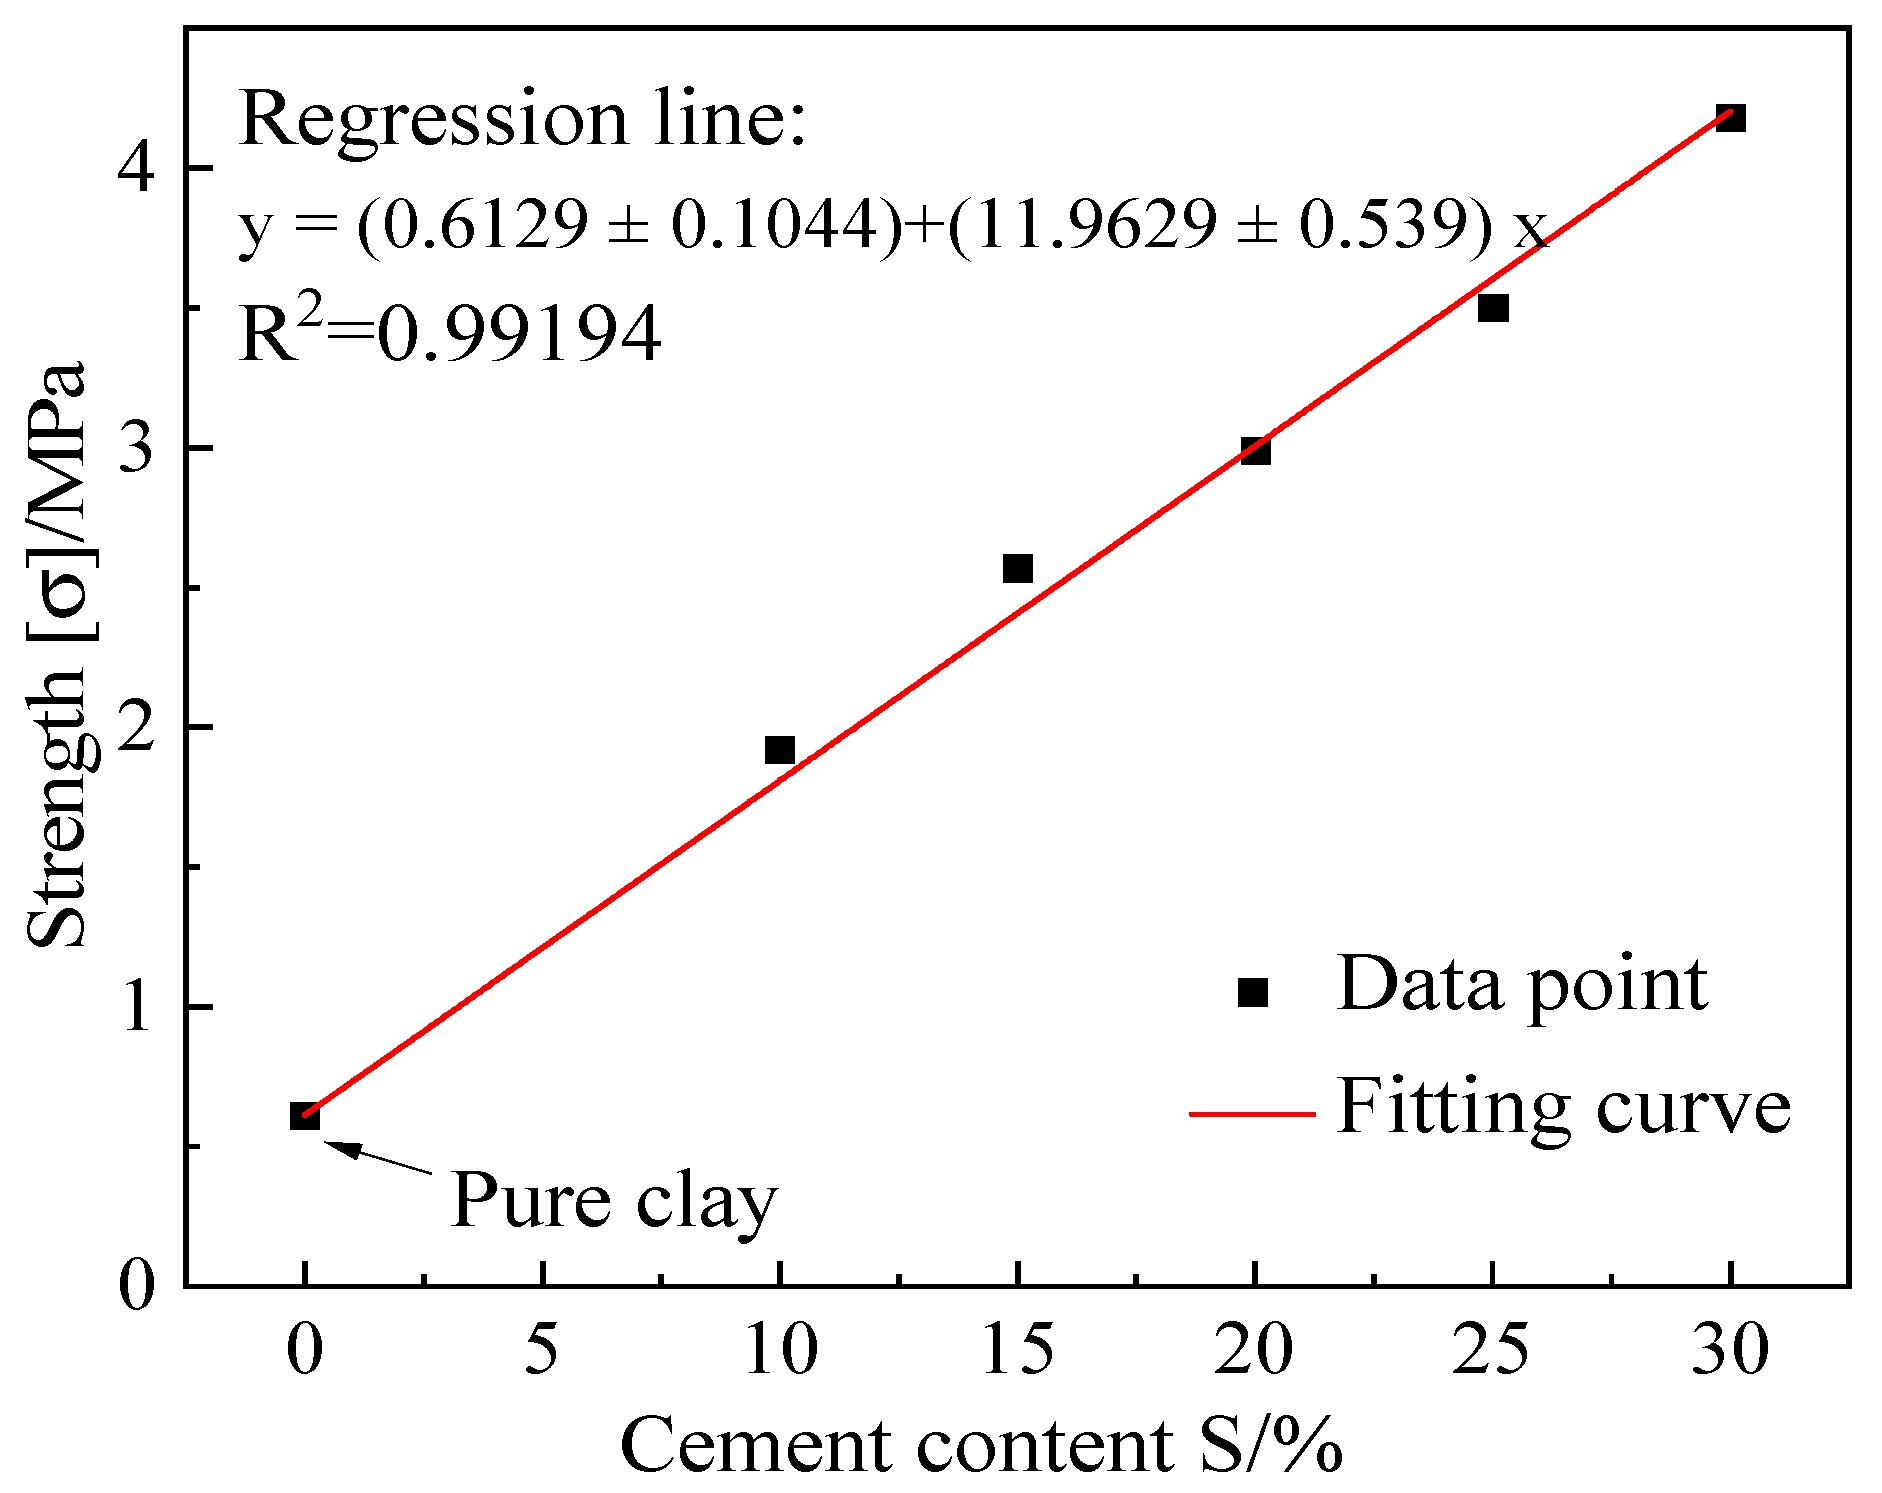
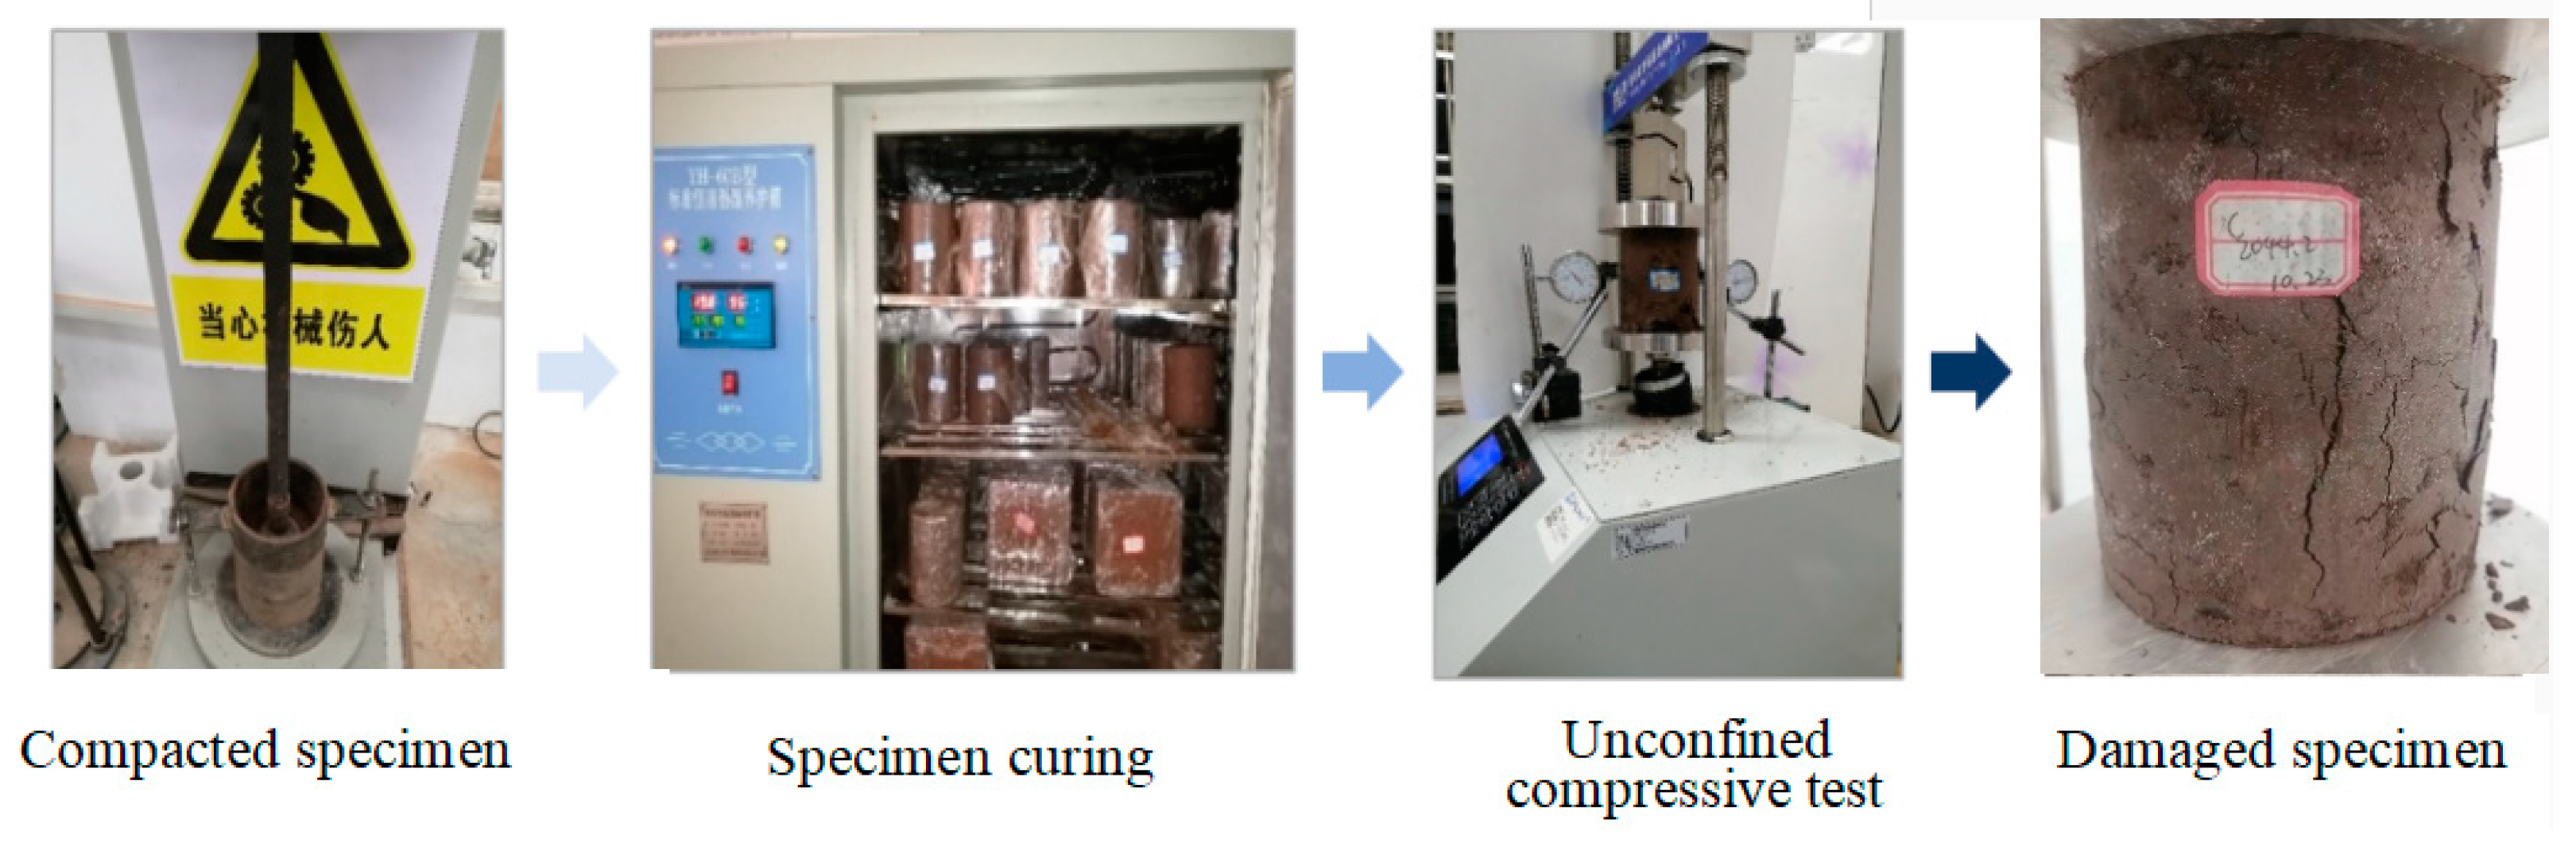
3.2.2. Unconfined Compressive Strength of Cement-Soil

After 7 days of curing in a constant temperature and humidity chamber, unconfined compressive strength tests were conducted on specimens compacted at the maximum dry density for various cement mixing ratios. The test results indicate that the unconfined compressive strength increases with the increase in cement content and shows a significant linear correlation (see Figure 6). Linear fitting of the experimental data reveals a functional relationship between the unconfined compressive strength of cement-soil and the cement content.
σ c e m e n t - s o i l = σ s o i l + k S = 0.613 + 11.963 S ,
In the equation:
σ s o i l  represents the unconfined compressive strength of maximum dry density pure clay.
σ c e m e n t - s o i l represents the unconfined compressive strength of maximum dry density cement-soil specimens.
k is a constant closely related to cement strength.
S is the cement content in the cement-soil.
By nondimensionalizing the constant k in Equation (1) as  γ , the strength of cement-soil can be expressed as:
σ c e m e n t - s o i l = σ s o i l ( 1 + γ S ) ,
In the equation, γ = k σ s o i l = 19.51
From Formula (2), it can be seen that the strength of cement-soil is closely related to the strength of clay and the content of cement. The main reason is that cement, as a hydraulic inorganic gel material, cements loose particles into a whole to improve its strength, but the lack of strength of soil itself will also affect the overall strength.

4. Study on Modified Soil Mix Proportions with Black Shale

4.1. Experimental Design

Combining relevant theories of two-phase composite materials, the modified soil with black shale can be viewed as a two-phase composite material with a base of cement-soil and interspersed black shale fragments. In this context, the base material is considered as the cement-soil with the target moisture content corresponding to the maximum dry density obtained in the compaction tests for various cement mixing ratios (designated as S10, S15, S20, S25, and S30, representing cement mixing ratios of 10%, 15%, 20%, 25%, and 30%, respectively). The black shale is mixed with the base cement-soil in proportions denoted as R = Mshale:Mtotal = 40%, 55%, 70% (where Mtotal = Mshale + Mclay + Mcement). To prevent the black shale from absorbing water and causing poor adhesion with the surrounding cement-soil, the surface of the black shale is moistened before mixing. Following the requirements of the “Test Code for Stabilized Materials with Inorganic Binders in Highway Engineering” [32] (JTG E51-2009), compaction samples were prepared, cured in a standard curing chamber for 7 days (with one day of water immersion before the test), and subjected to unconfined compressive strength tests at a loading rate of 0.5 mm/min, with relevant data recorded (Table 2). The test procedure is illustrated in Figure 7.
Building on the results of the cement-soil ratio test and the preliminary ratio test for black shale modified soil, considering the economic feasibility of engineering construction, and analyzing the relationship among strength, cement content, and black shale mixing ratio, the criteria were set to satisfy the strength requirements of highway subgrade specifications. The goal was to maximize the consumption of black shale while minimizing the use of cement, adhering to the principle of reducing construction costs. The optimal mix ratio was selected based on these considerations.
For the specimens with the optimal mix ratio, further unconfined compressive strength tests were conducted at curing ages of 7 days, 14 days, and 28 days. At the same time, to simulate the actual service environment of the roadbed (dry, long-term immersion, “drying and soaking” cycle), the stability of the samples that have been cured for 7 days are further tested under indoor long-term dry conditions, long-term immersion conditions, and “drying and soaking” conditions. Among them, a “drying and soaking” cycle (1 day) goes through “11 h drying → 1 h cooling → 11 h soaking → 1 h drying”.

4.2. Analysis of Results

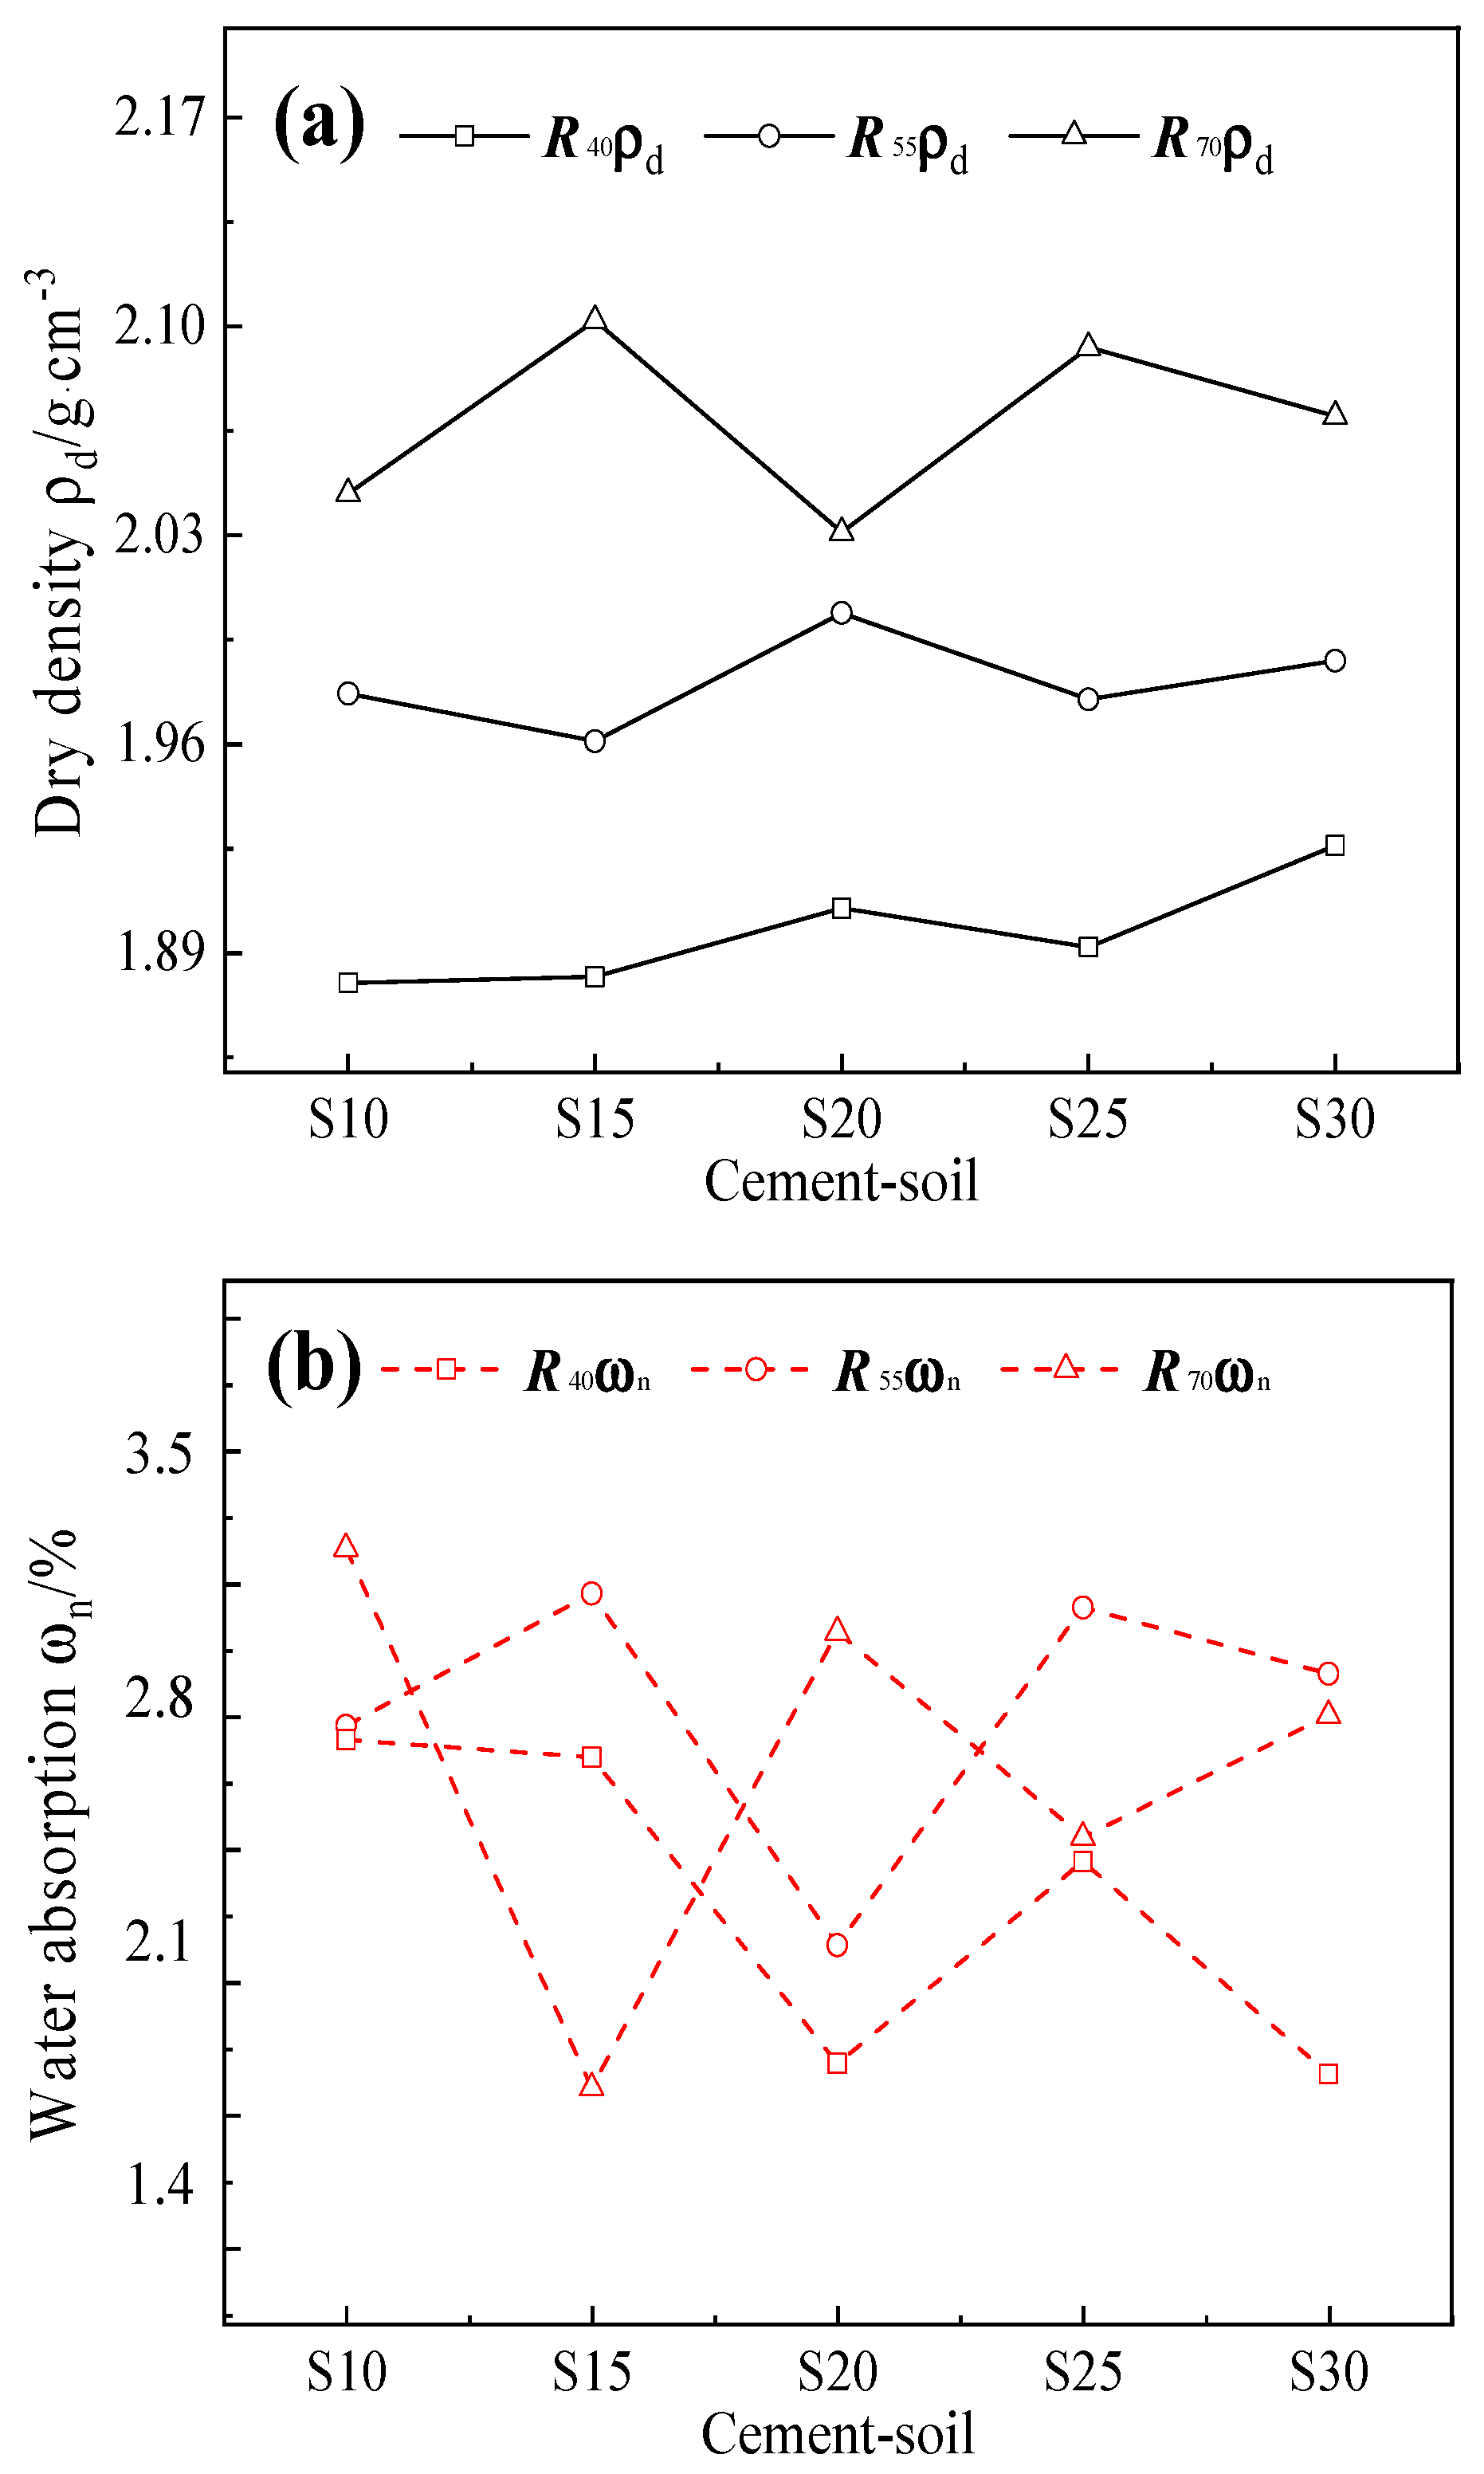
4.2.1. Compaction Characteristics of Black Shale Modified Soil

Figure 8 shows the relationship between the dry density, water absorption rate, and ratio of black shale content in the black shale modified soil. The dry density of specimens with black shale content of 40%, 55%, and 70% fluctuates around 1.90 g/cm3, 1.98 g/cm3, and 2.07 g/cm3, respectively. The greater the content of black shale, the larger the fluctuation range. This is consistent with samples with a high content of gravel, where the proportion of coarse particles is relatively high, leading to a more complex internal contact and greater discreteness.
The dry density of modified soil shows a positive correlation with the amount of black shale added, as the density of black shale is higher than that of cement-soil. The water absorption characteristics of specimens with different black shale content are relatively similar, with an overall average water absorption rate of approximately 2.53%. Under the same black shale content, the trend of the water absorption rate curve is exactly opposite to that of the dry density curve, indicating that samples with higher density have a more compact internal structure, making it more resistant to water infiltration.

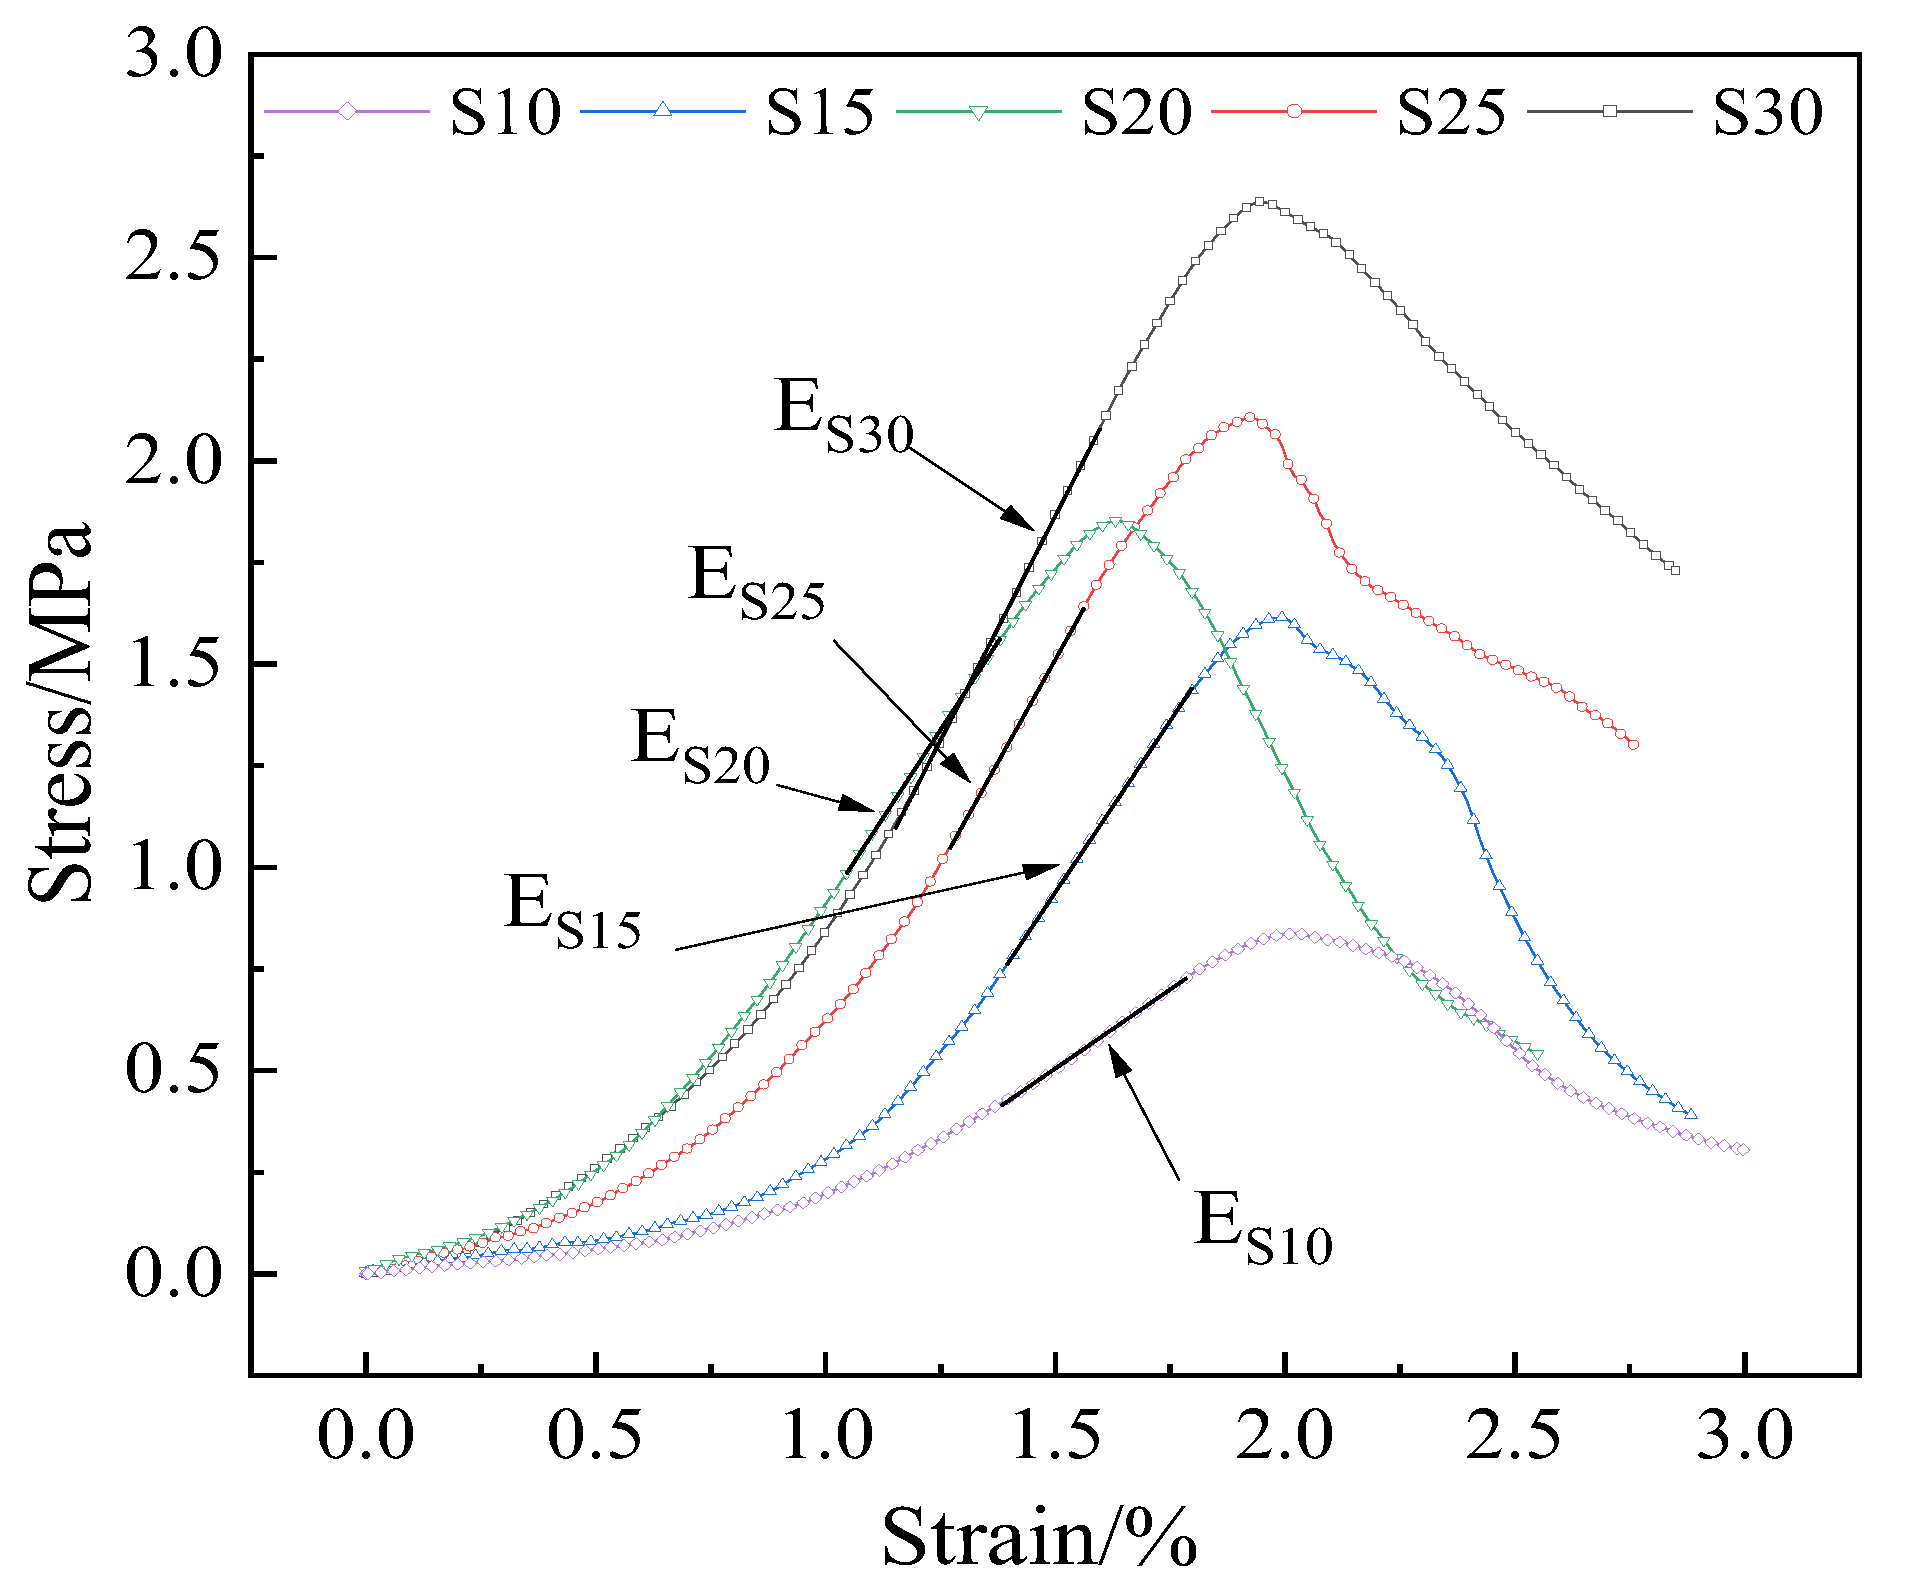
4.2.2. Basic Mechanical Properties of Black Shale Modified Soil

For specimens with the same black shale content, the slope of the stress–strain curve increases with the increase in cement content. Figure 9 shows the stress–strain curve for the modified soil with 40% black shale content (R40 series), and Table 3 presents the elastic modulus values for the R40 series modified soil. It is observed that with a constant black shale content, the elastic modulus increases with the increase in cement content.
Figure 10 shows the relationship between the unconfined compressive strength of black shale-modified soil and cement content. It is observed that the strength of the modified soil is generally positively correlated with the cement content, but the linear correlation is not significant. For samples with a 40% black shale content, the cement content increases from 6% to 18% in 3% increments, and the strength increases from 0.85 MPa to 2.70 MPa in order of 0.78 MPa, 0.20 MPa, 0.24 MPa, and 0.63 MPa increments. Referring to the standards for unconfined compressive strength of inorganic stabilized materials in the “Highway Asphalt Pavement Design Specification” [33] (JTG D50-2017), except for Y4S10, Y5S10, Y7S10, and Y7S15, the rest meet the requirements for subgrade layers of secondary and below-grade highways with medium to light traffic, as Table 4 shows.

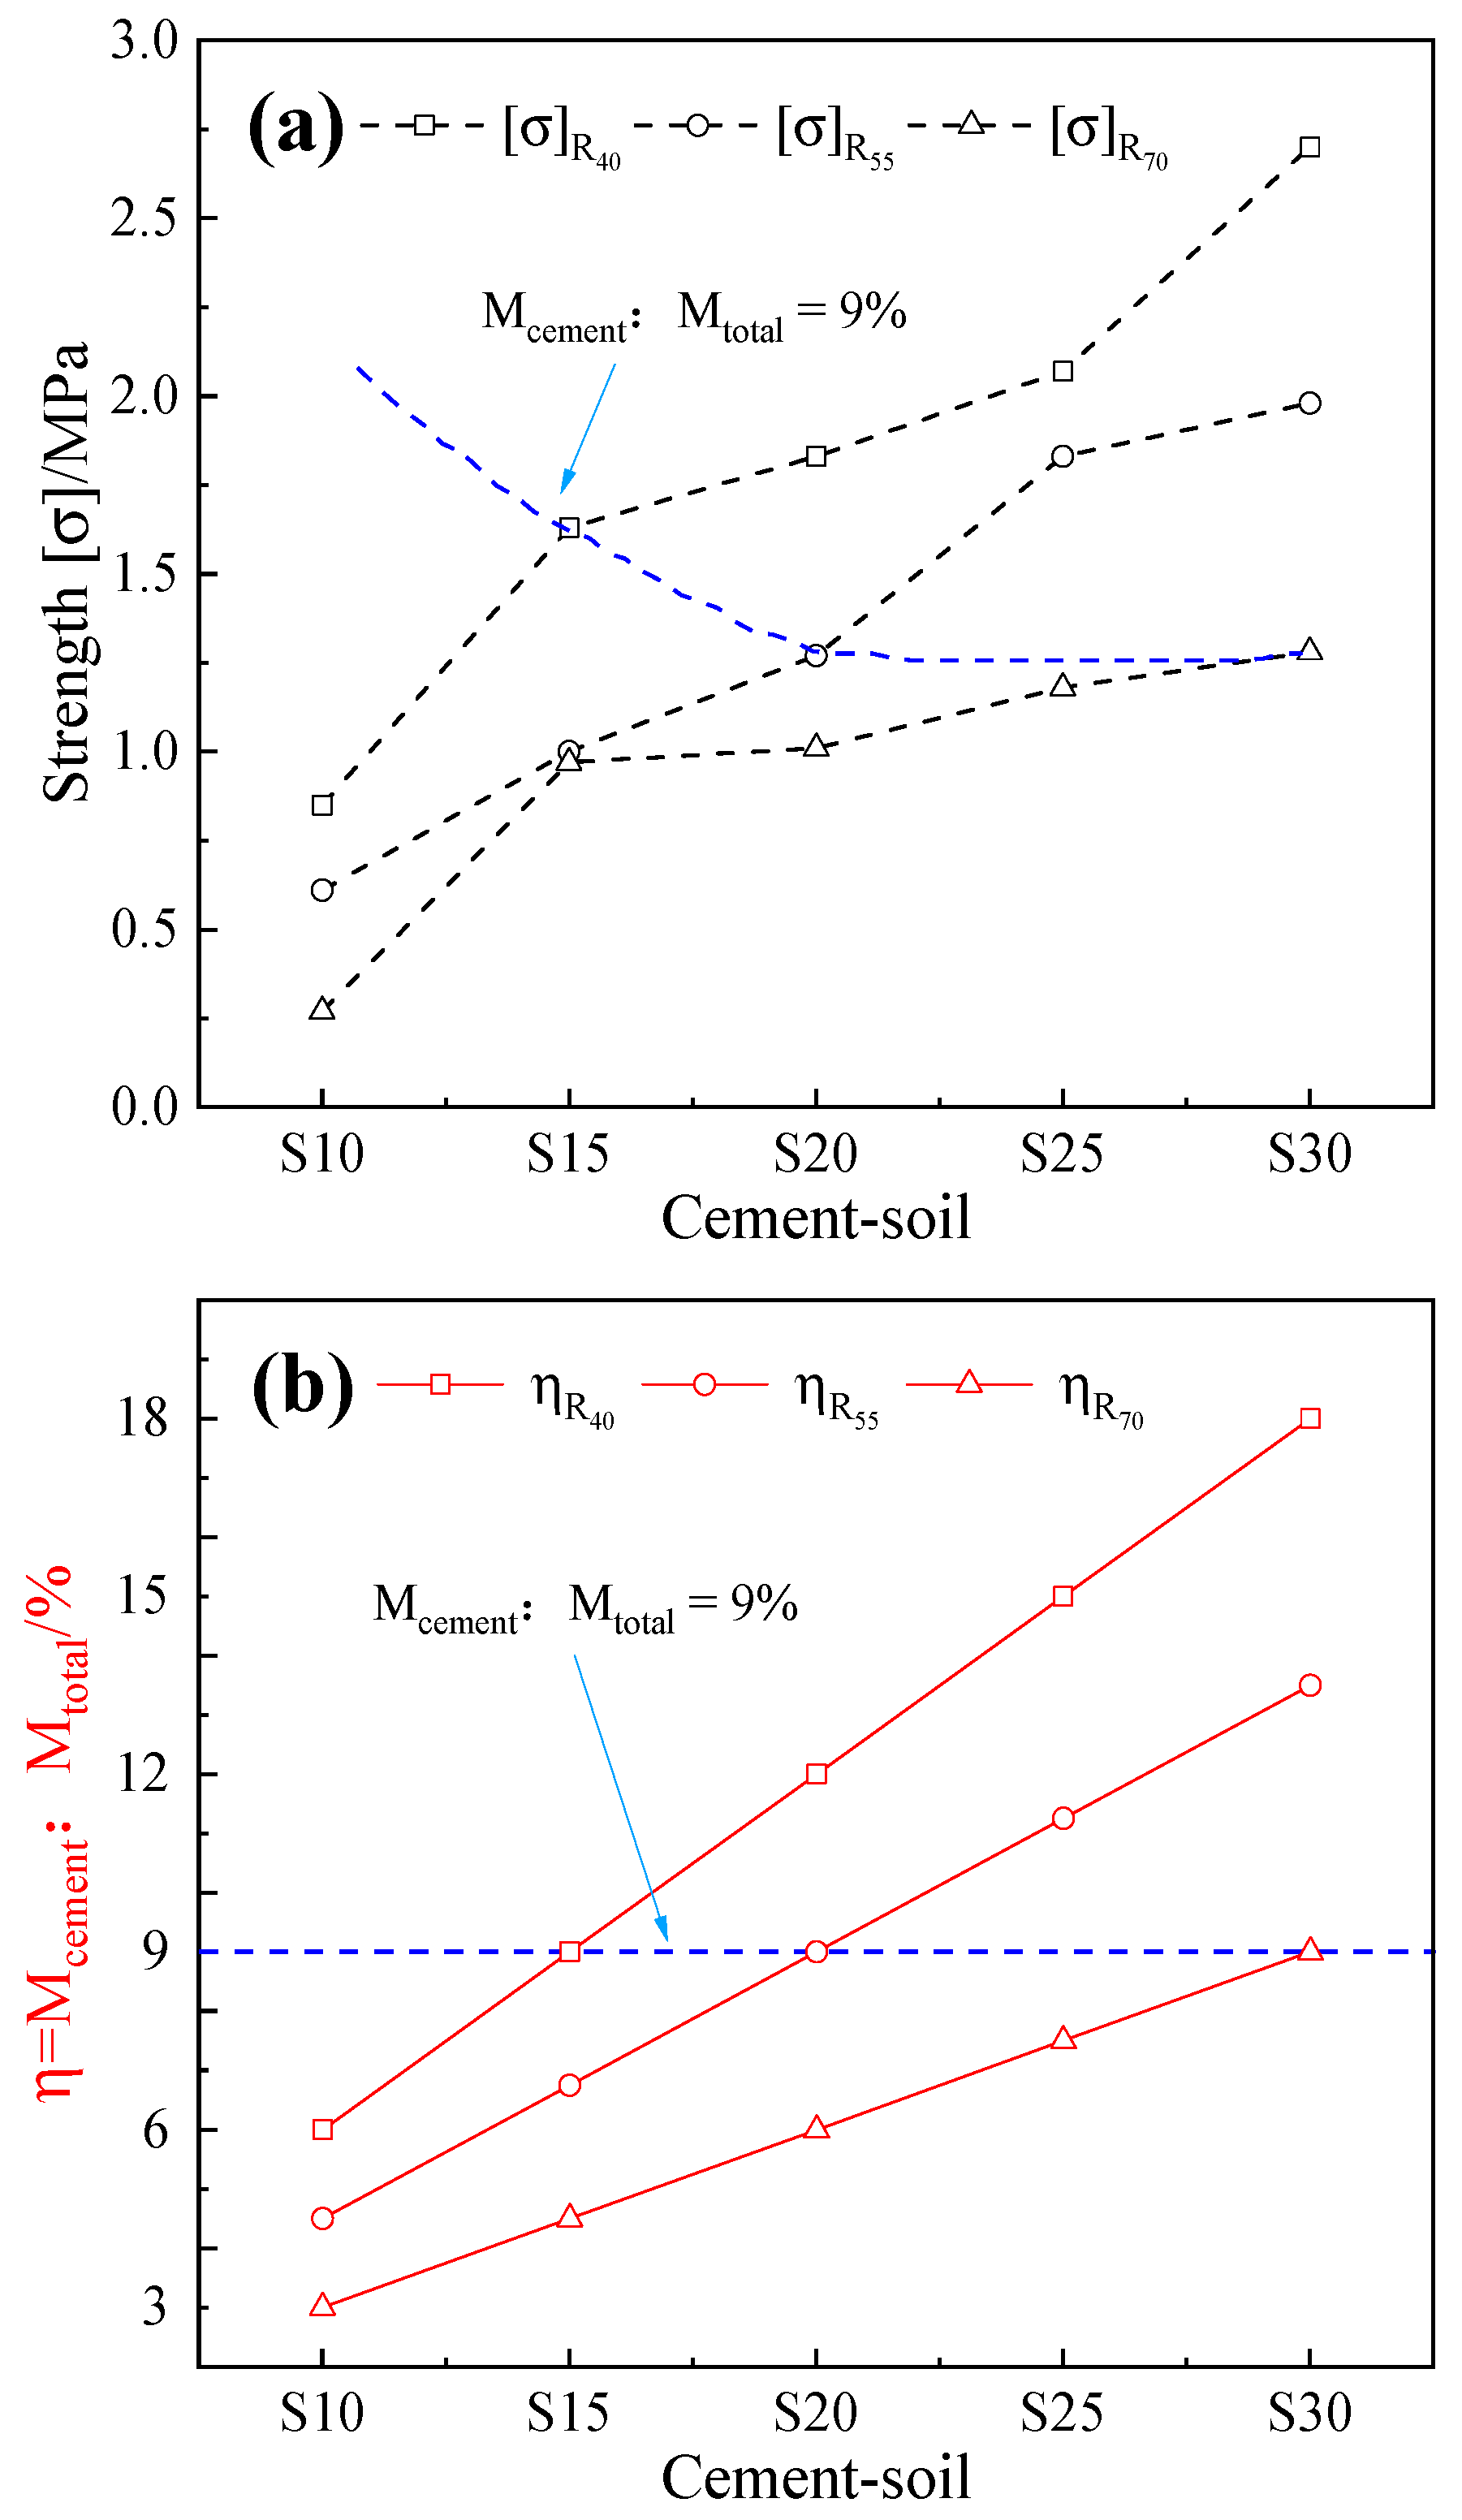
4.2.3. Analysis of the Optimal Ratio for Black Shale-Modified Soil

Considering the economic feasibility of engineering construction and analyzing the relationship among strength, cement content, and black shale admixture, the standard for selecting the optimal ratio of materials is to meet the strength requirements of highway subgrade specifications. The principle is to consume as much black shale as possible, minimize the use of cement, and reduce construction costs. Table 2 shows that some composite materials (Y4S25, Y4S30, and Y5S30) can meet the requirements of high-grade highway subbases for medium-duty and light traffic and the requirements of grade two and below highway base for medium-duty and light traffic. However, the cement consumption is too high, making it impractical. When the cement content is 9%, the strength of the modified soil decreases with the increase in black shale admixture (as shown in Figure 10). However, with the black shale admixture increasing from 55% to 70%, the strength does not significantly decrease and meets the relevant requirements. Comprehensive analysis indicates that the mass ratio corresponding to composite material Y7S30 (Mshale:Mclay:Mcement = 70:21:9) is optimal.
(1)
Physical and Mechanical Properties of the Optimal Modified Soil Y7S30
The results of the strength test and water absorption test for the Y7S30 specimens during the 7-day, 14-day, and 28-day curing periods are shown in Figure 11. It can be clearly observed that the total water absorption of the sample increases with the increase in curing age, while the rate of water absorption decreases. The 14-day strength is 1.22 times of the 7-day strength, and the 28-day strength is 1.05 times of the 14-day strength, reaching 1.66 MPa. The notable increase in material strength is attributed to the hydration reaction of cement with water, binding the surrounding substances into a solid structure. This reaction requires a substantial amount of water, and as the curing period increases, the hydration reaction gradually reaches its limit, leading to a stabilization of the strength of the modified soil.
Figure 12 illustrates the strength and mass loss of Y7S30-type specimens after 7-day curing and different “drying and soaking” cycles. The specimens in indoor conditions show almost no mass loss, and the strength gradually increases, although at a slower rate compared to the specimens under the same age-standard curing conditions. The specimens under immersion conditions exhibit minimal mass loss in the first 10 days, stabilizing afterward, and their strength shows an increasing–decreasing trend with 10 days as the turning point. The early strength is higher than that in indoor conditions, indicating that early immersion promotes more extensive hydration of cement, thereby enhancing strength. However, prolonged immersion weakens strength as water gradually infiltrates the interior.
For specimens subjected to “drying and soaking” cycles, significant mass loss occurs, increasing over time. The first 10 cycles have little impact on strength, but after 10 cycles, the effect becomes pronounced. It is evident that repeated “drying and soaking” environments progressively damage the specimens from the surface to the interior. Additionally, there is slight mass loss before water exposure, attributed to the shedding of debris from the specimen’s surface and edges.
Through indoor simulations of three different environments, it is observed that the most detrimental environment for the material is the “drying and soaking” cycle, followed by immersion and indoor conditions. Therefore, when used as a base material, appropriate drainage measures should be implemented to avoid the adverse effects of the mentioned environments.
(2)
Analysis of the Failure Process of Optimal Modified Soil Y7S30
The failure process of composite material specimen Y7S30, as shown in Figure 13 and Figure 14, can be divided into four stages, namely Stages I, II, III, and IV.
Contact Stage (Stage I): Under the continuous vertical load, the uneven parts at both ends of the specimen are continuously flattened. The stress–strain curve shows a right half “concave” shape, and the growth rate of the elastic modulus increases continuously. There is almost no lateral deformation, and the slight fluctuation in the dial gauge at the 0 value is caused by the vibration during the test.
Elastic Deformation Stage (Stage II): The material is in the elastic stage, and its stress–strain curve is linear. The elastic modulus is a constant value, and lateral deformation is not significant.
Elastic-Plastic Deformation Stage (Stage III): The material enters the elastic-plastic stage, and the growth rate of the elastic modulus continuously decreases to zero. Plastic deformation increases, microcracks form, and there is a noticeable lateral deformation. Due to the non-uniformity of the internal material, there is a significant difference between the values of the left and right dial gauges.
Failure Stage (Stage IV): Microcracks continue to expand, forming through cracks. The crack width expands, stress values decrease sharply, and lateral deformation increases rapidly. There are residual stress and residual strain.

5. Strength Model of Black Shale Modified Soil

Establishing a mechanical model for material strength based on existing experimental data and previous theoretical foundations is crucial. It not only helps systematically summarize and integrate existing experimental results but also provides a more extensive and comprehensive understanding of material performance. In this study, cement-soil (cement + clay) is considered as the matrix, and black shale fragments are treated as the inclusion material, forming a two-phase composite material (Figure 15). Using the Eshelby–Mori–Tanaka equivalent method, a mechanical model is established that predicts the strength of black shale modified soil based on three indicators: soil strength, gravel content, and cement content.
According to Hu Min et al.’s study [23] based on the Eshelby–Mori–Tanaka equivalent method for the equivalent elastic modulus of sandy gravel soil, the relationship between the equivalent elastic modulus of sandy gravel soil and the matrix elastic modulus can be expressed as:
E = E 0 ( a v 3 + b v 2 + c v + 1 ) ,
In the formula, E is the elastic modulus of sandy gravel soil, E 0 is the matrix elastic modulus, v is the volume fraction of the inclusion material, and a , b , c are constants.
As per the literature [34], it is known that σ E  and m v , which implies:
[ σ ] = [ σ 0 ] ( a m 3 + b m 2 + c m + 1 ) ,
where [ σ ] is the composite material strength, [ σ 0 ] is the matrix strength, a , b , c are constants related to the strength of the inclusion material, and m  is the mass fraction of the inclusion material.
The transformed equation for [ σ ]  in Equation (4) is given by
[ σ ] [ σ 0 ] = a m 3 + b m 2 + c m + 1 ,
Through numerical fitting, as shown in Figure 16, we know that, a = 2.255 , b = 2.468 , c = 0.321 , correlation coefficient r = 0.955 , and
[ σ ] [ σ 0 ] = 2.255 m 3 - 2.468 m 2 - 0.321 m + 1 ,
As [ σ 0 ] = [ σ c e m e n t - s o i l ] , then,
[ σ ] = [ σ c e m e n t - s o i l ] ( 2.255 m 3 - 2.468 m 2 - 0.321 m + 1 ) ,
Substituting γ = 19.51 and Equation (2) into Equation (7), we can obtain
[ σ ] = [ σ s o i l ] ( 1 + 19.51 S ) ( 2.255 m 3 - 2.468 m 2 - 0.321 m + 1 ) ,
where S is the cement content of the cement-soil.
From Equation (8), it is known that replacing the soil with higher strength or increasing the cement content can improve the composite material strength.
Taking the partial derivative of M in Equation (8), it is obtained that
[ σ ] m = [ σ s o i l ] ( 1 + 19.51 S ) ( 3 × 2.255 m 2 - 2 × 2.468 m - 0.321 ) ,
Setting  3 × 2.255 m 2 2   ×   2.468   m 0.321  to 0 yields  m 1 = 0.06 , m 2 = 0.79 . As m [ 0 , 1 ] , then when 0 < m < 0.79 and [ σ ] m < 0 , [ σ ]  is monotonically decreasing when m [ 0 , 0.79 ] , and when 0.79 < m < 1 , [ σ ]  is monotonically increasing when m [ 0.79 , 1 ] . The composite material strength [ σ ] shows a decreasing trend followed by an increase with the increase in the black shale content. However, due to the lack of bonding force between the black shale particles, when the shale content is too high, the overall strength is low. Therefore, the formula is more accurate when the shale content is less than 79%. When the shale content exceeds 79%, the closer it gets to 100%, the larger the error. By linearly fitting the dry density of the composite material with the shale content, it is obtained that when the shale content is 79%, the dry density of the composite material ρ c   is   2.12   g / c m 3 . The shale content corresponds to the volume fraction v = m ρ c ρ s h a l e = 61 % , which is close to the boundary value for predicting errors with a volume fraction of 50% as mentioned in the literature [30].
In the ratio design study, the mass of the composite material is considered as ‘1’, and the cement content is represented as ‘1 − m’, then 1 × η = S × ( 1 m ) ,we can obtain:
S = η / ( 1 m ) ,
where η is the cement content of the composite material.
Substituting Equation (10) into Equation (8), we can obtain
[ σ ] = [ σ s o i l ] ( 1 + 19.51 × η 1 m ) ( 2.255 m 3 - 2.468 m 2 - 0.321 m + 1 ) ,
A series of fitting values are obtained by substituting the black shale content and cement content from Table 2 into Equation (11), and comparing them with the measured values (as shown in Figure 17). The fitted values are close to the measured values, with small errors. Thus, for the selected materials in this study, the strength of black shale modified by strength, gravel content, and cement content can be predicted using these three indicators.
Substituting Equations (2) and (10) into Equation (4), subsequently, the general form of the strength law for black shale modified soil can be derived, as is shown in Equation (12).
[ σ ] = [ σ s o i l ] ( 1 + γ η 1 m ) ( a m 3 + b m 2 + c m + 1 ) ,
where [ σ ] is the strength of modified soil, [ σ s o i l ] is the strength of soil, γ is a constant which is related to the strength of cement, η is the cement content of the composite material, m is the mass fraction of the inclusion material, and a , b , c are constants closely related to the strength of black shale.
From Equation (12), it can be inferred that the constants a , b , c , and γ  related to the strength of the soil, cement, and black shale (or other crushed stone materials) can be determined through experiments, which means the strength characterization curve of the modified soil can be obtained.

6. Conclusions

This paper explores the strength characteristics of black shale gravel bodies with cement and clay admixtures through indoor experiments, and assesses their suitability for roadbed filling. Based on the Mori–Tanaka equivalent stress principle, a strength characterization relationship for black shale modified soil is established. The conclusions are as follows:
(1)
Cement-soil is used to improve the strength of black shale gravel. When the cement content is 10% to 30%, the optimal moisture content is 18.2~19.4%, the maximum dry density is 1.66~1.71 g/cm3, and the maximum unconfined compressive strength is 2.0~4.0 Mpa. The optimal moisture content, maximum dry density, and maximum unconfined compressive strength increase with the increase in cement content.
(2)
The elastic modulus of black shale modified soil is positively correlated with the cement content. Based on economic principles and highway specifications, the experimentally used black shale modified material is suitable for the subbase of medium to light secondary and below-secondary highways. The optimal mixing ratio is Mshale:Mclay:Mcement = 70:21:9. The unconfined compressive strength of the material under 7-day curing is 1.36 MPa.
(3)
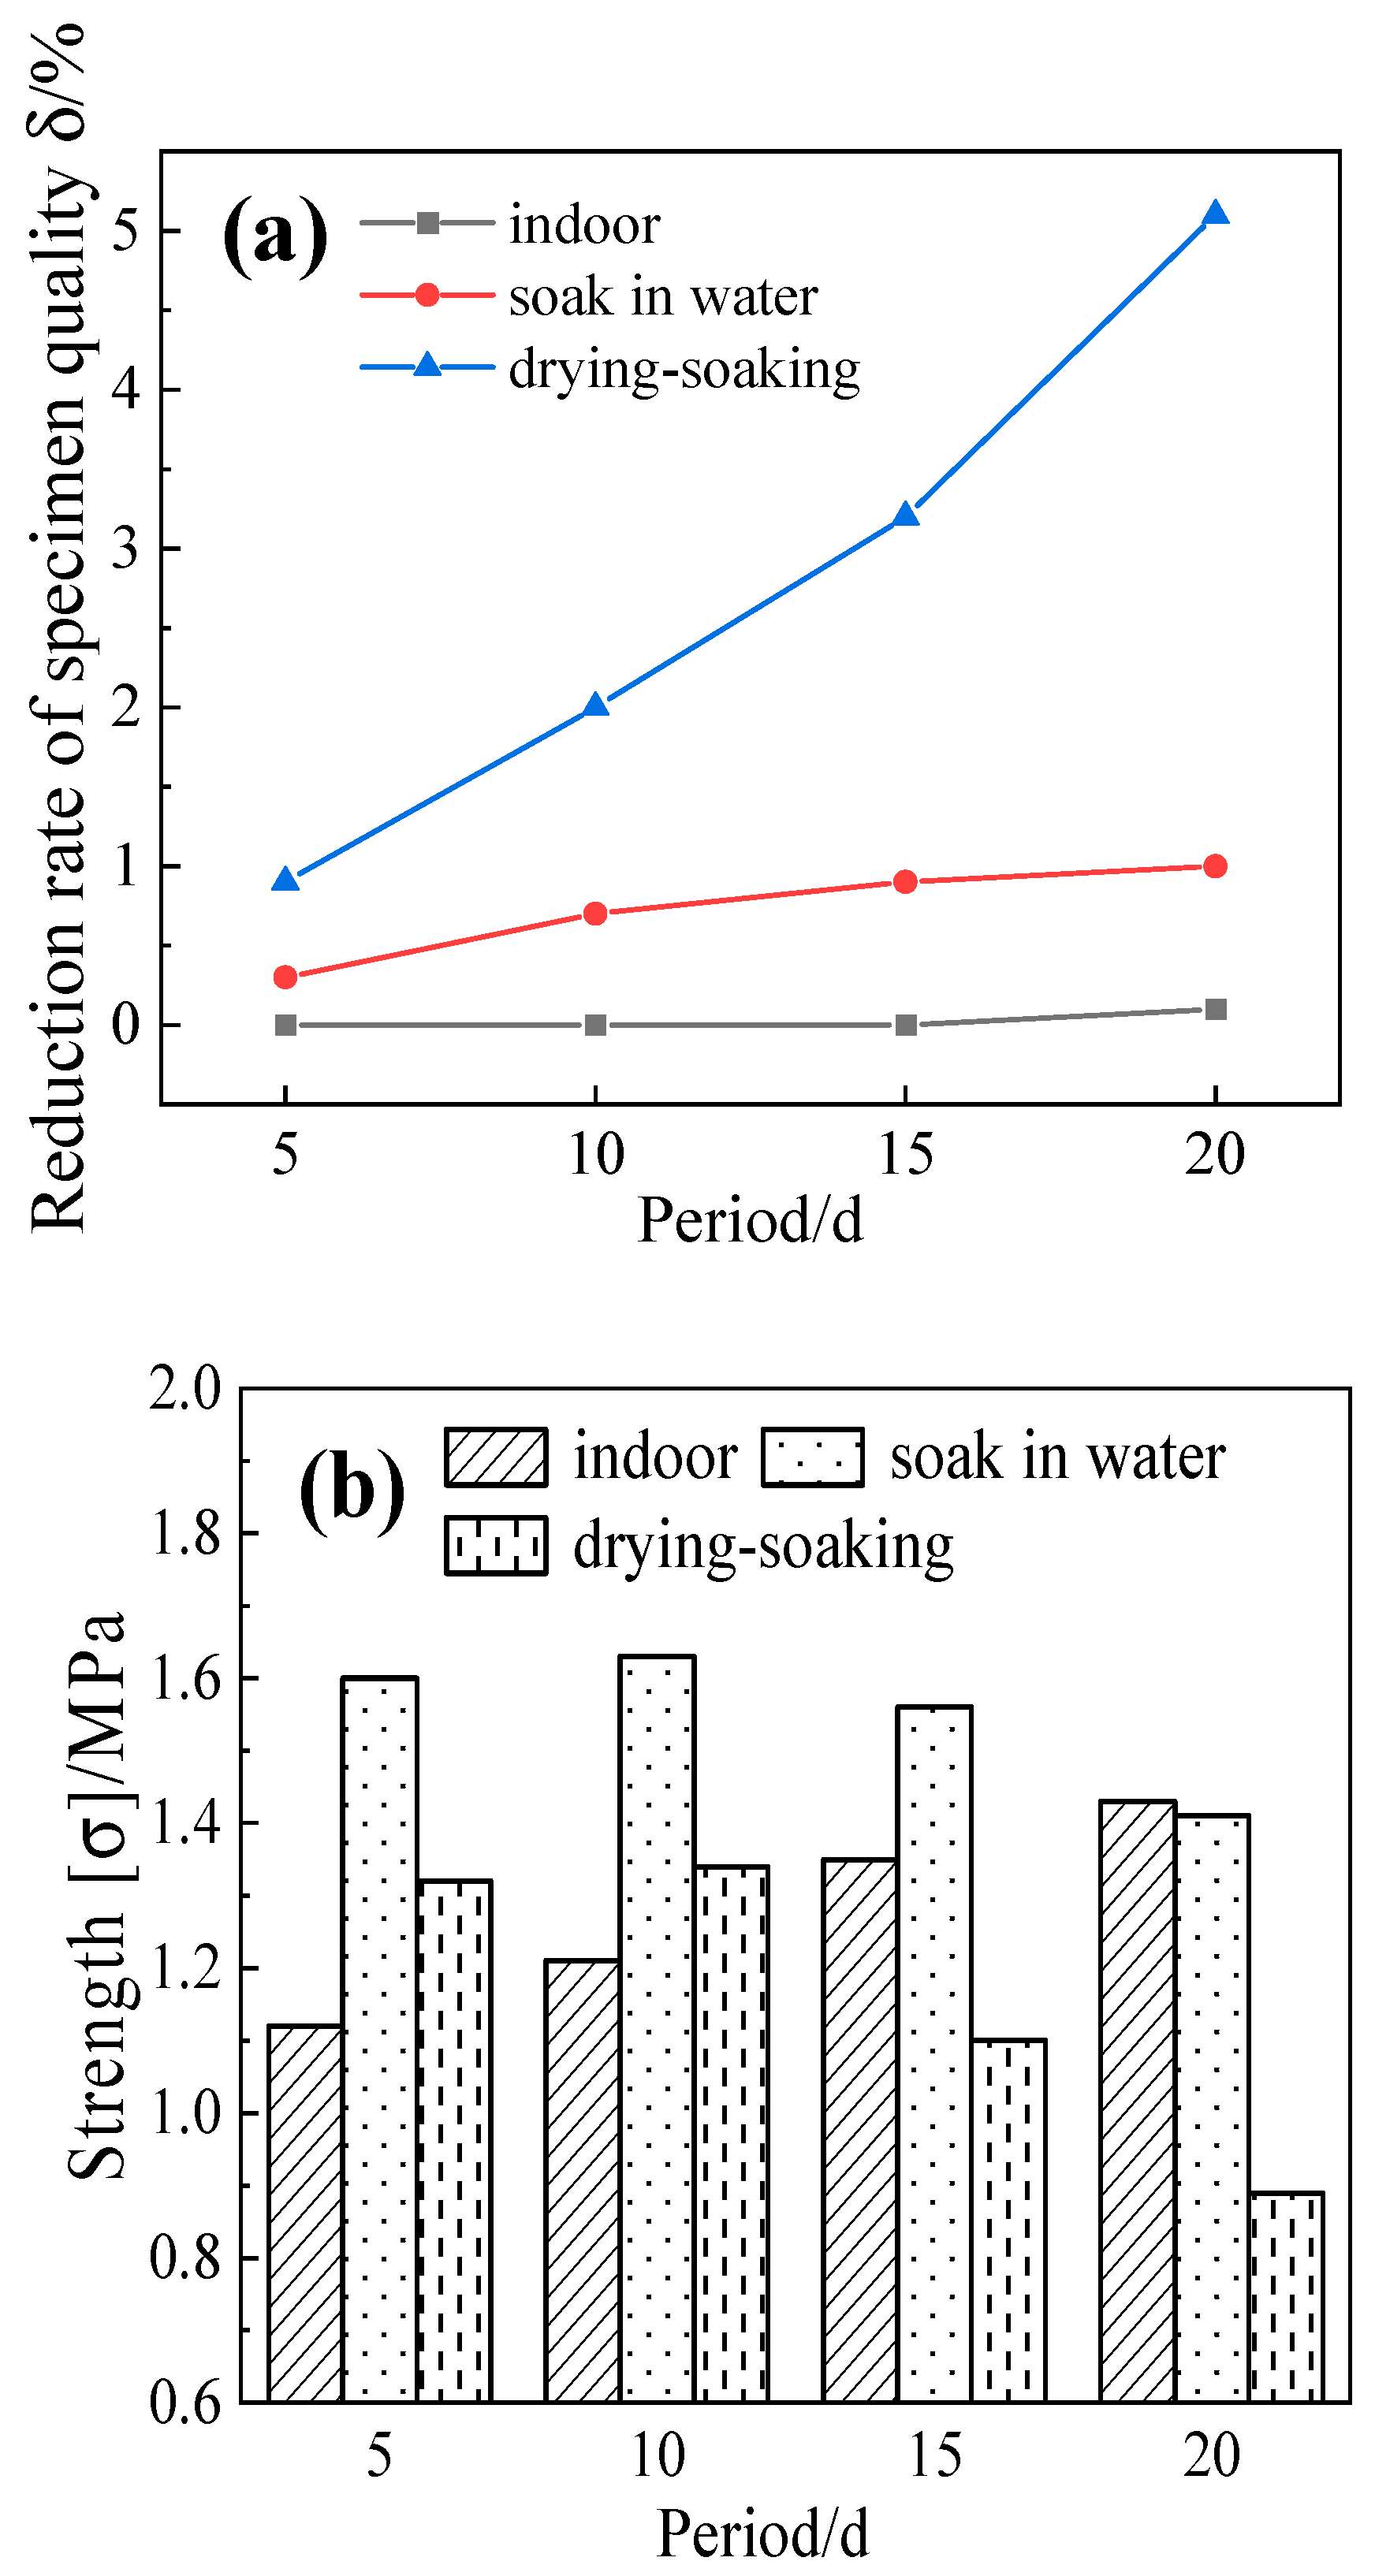
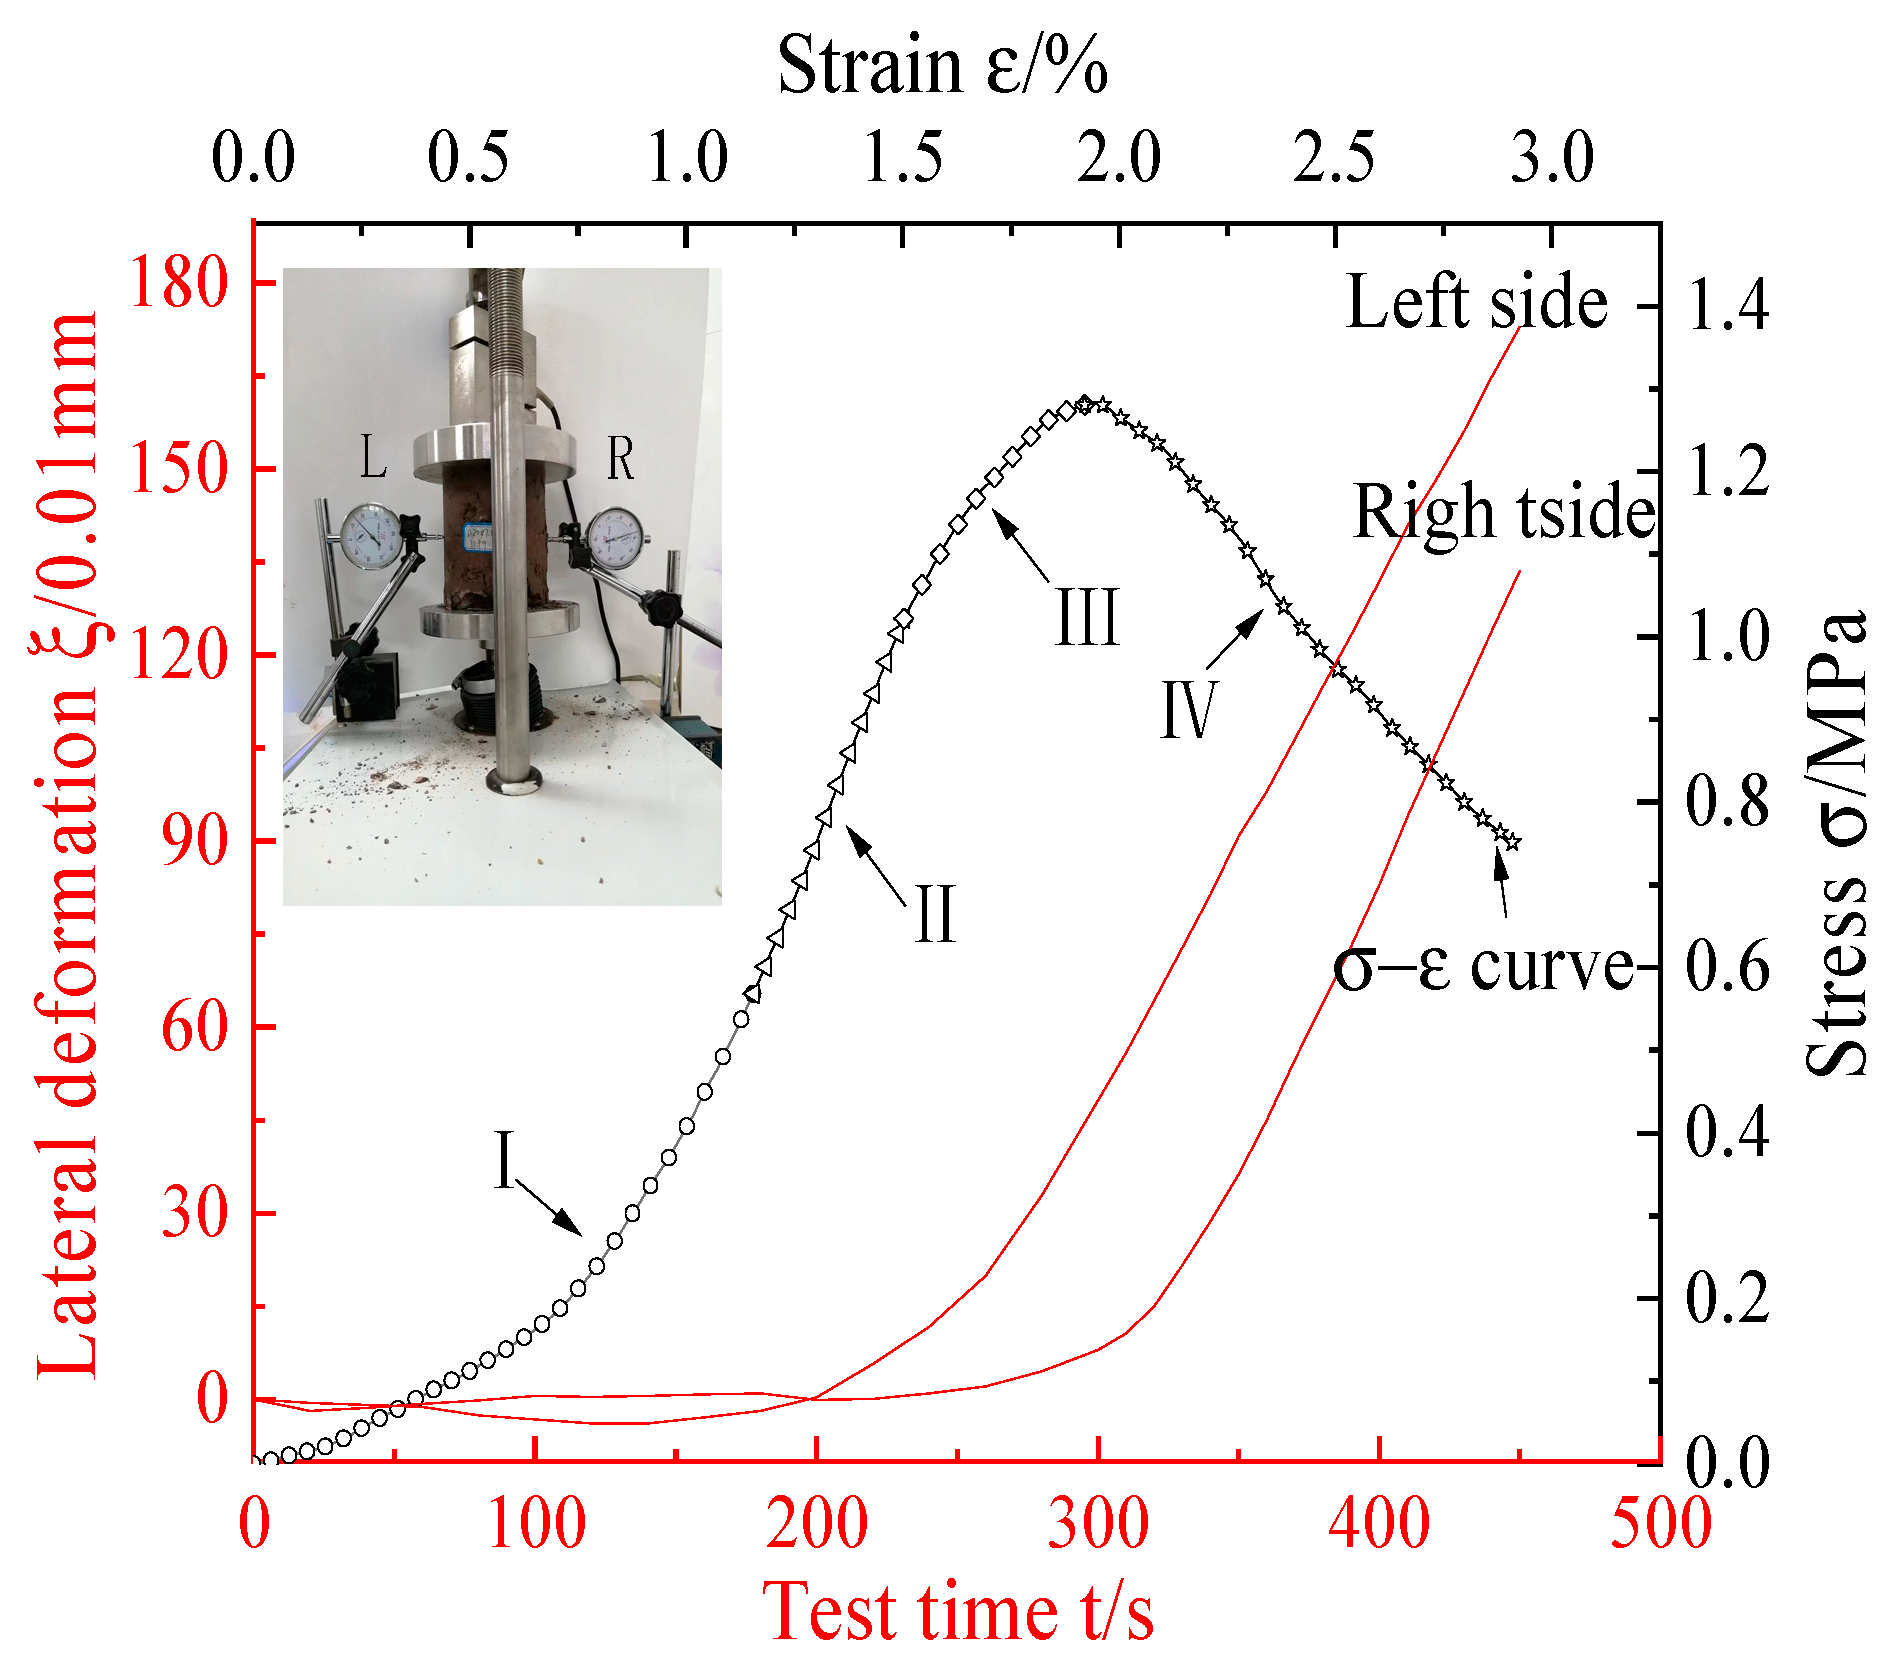
For the optimally mixed black shale modified soil, cement hydration is nearly complete before 14 days, and the strength stabilizes around two weeks. The repeated “drying and soaking” environment is the most unfavorable for this modified soil, followed by prolonged immersion. Before entering the elastic-plastic deformation stage, the lateral deformation of the modified soil specimens is not significant. Afterward, lateral deformation develops rapidly.
(4)
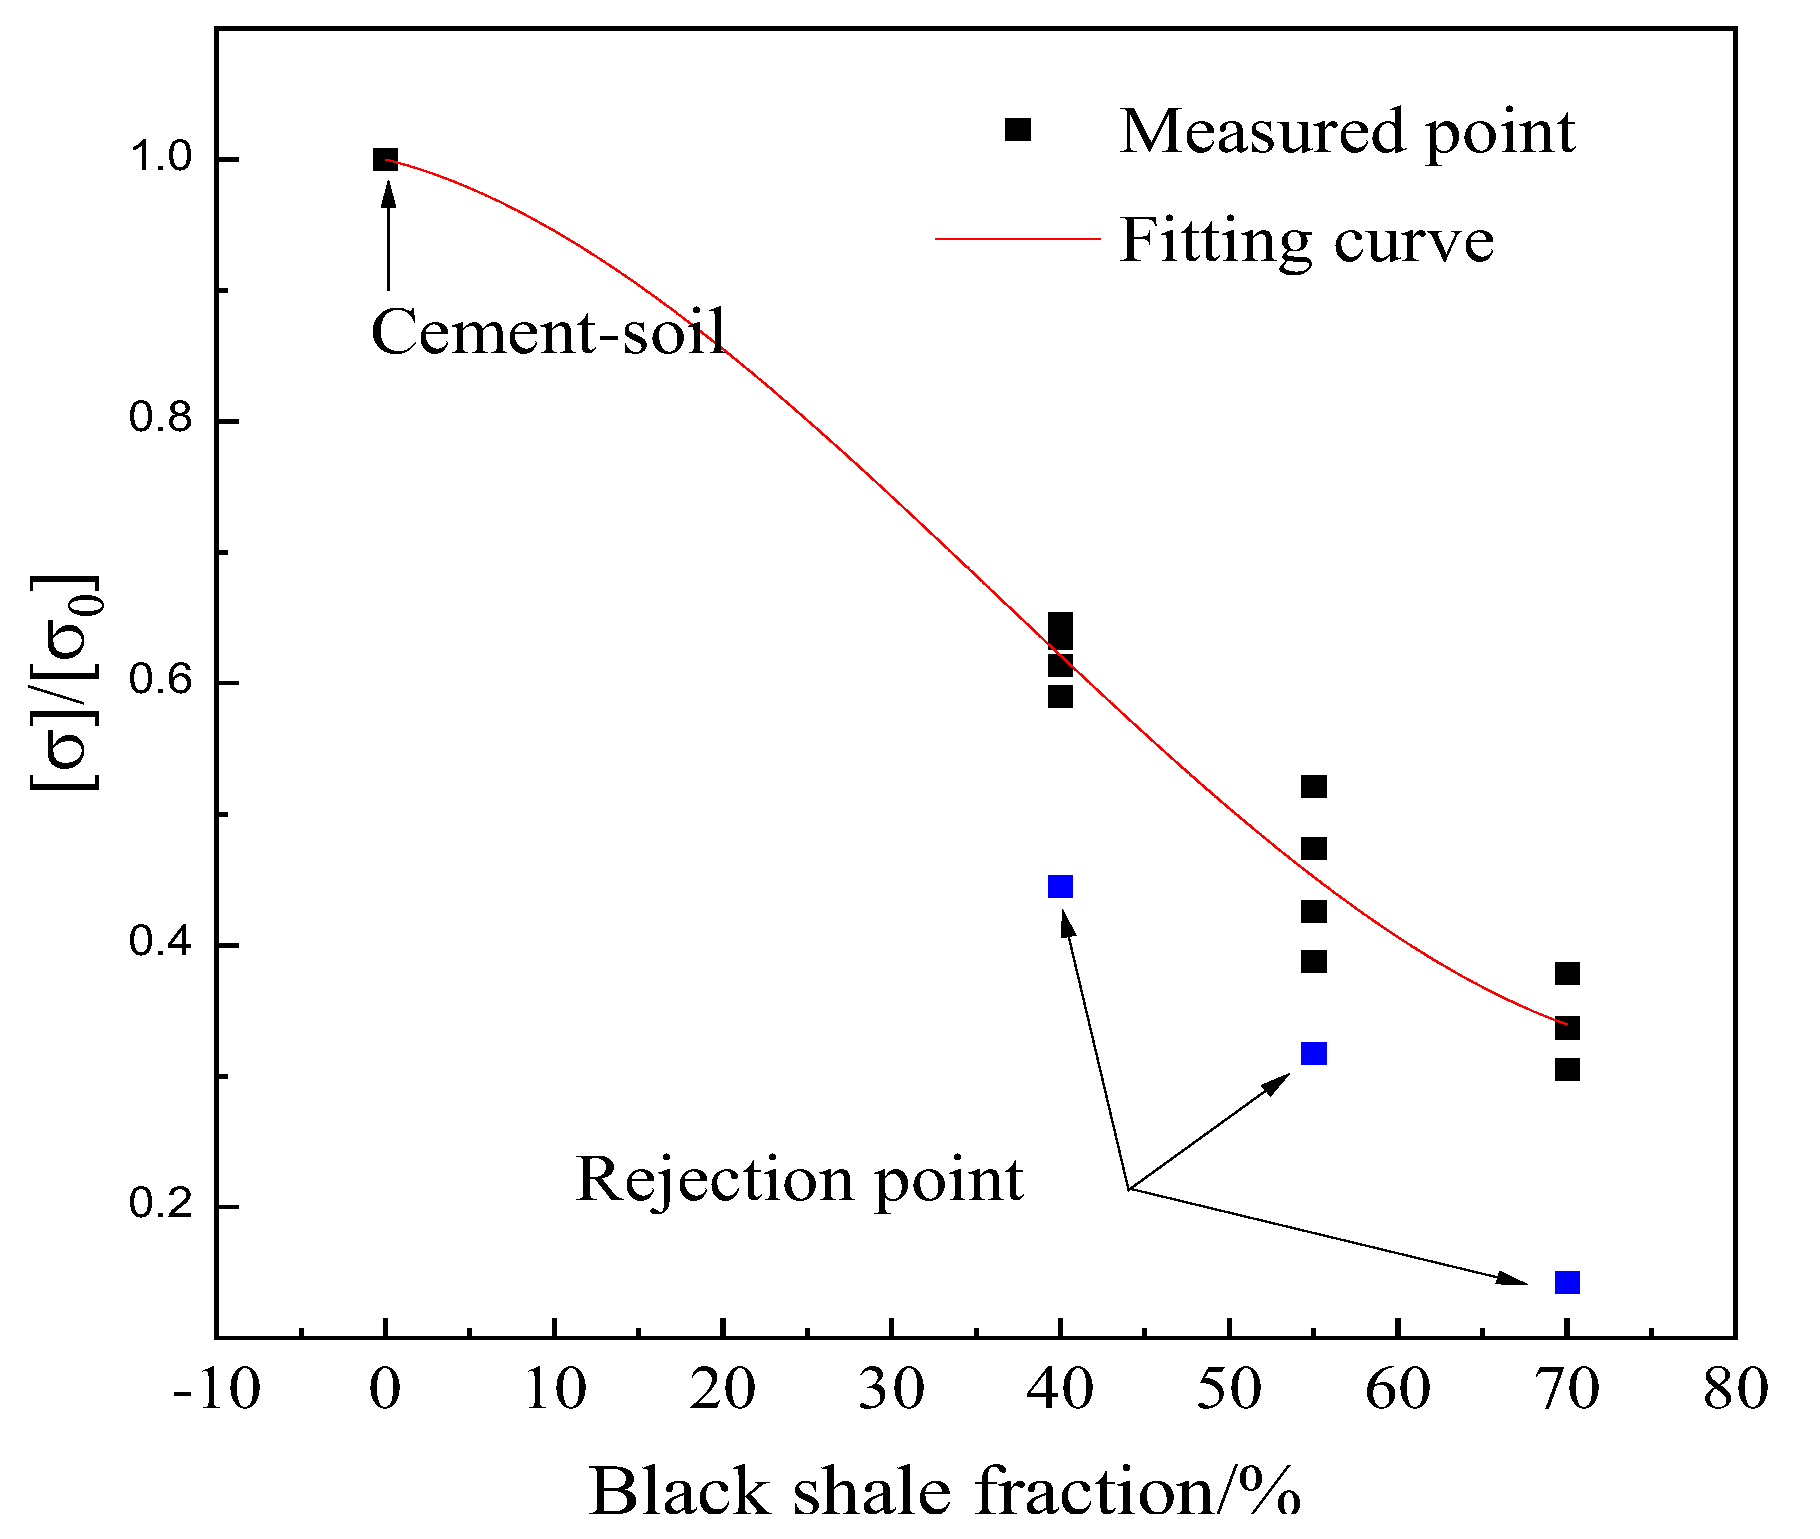
The relationship between the strength of black shale modified soil and the content of cement, black shale gravel, and the strength of the soil can be expressed as follows: [ σ ] = [ σ ] ( 1 + γ η 1 m ) ( a m 3 + b m 2 + c m + 1 ) . Using this strength relationship, the impact of the mix ratio on the strength of the modified soil can be accurately predicted.

Author Contributions

The contributions of all the authors to this manuscript are as follows: 1. M.H.: The person in charge of the research group, proposes the research topic, formulates a detailed research plan, is responsible for coordinating all the work of the research, providing research funds and supporting equipment, and revising the paper. 2. Z.H.: Perform the experimental tasks involved in this study, collect and sort out experimental data and analyze experimental results, and write the main chapters of the paper. 3. J.C.: summarize the latest research results, theories and practical experience in related fields, construct the theoretical framework of this research, and revise the paper. 4. Y.G.: Revised and improved the experimental plan, guided Z.H. and D.L. to conduct experiments, and analyzed the experimental results. 5. Y.Z.: Revised and improved the experimental plan, guided Z.H. and D.L. to conduct experiments, and revised and proofread the papers. 6. D.L.: Assist Z.H. to carry out experiments, collect and sort out experimental data. 7. R.G.: Organize the experimental data and proofread the paper. All authors have read and agreed to the published version of the manuscript.

Funding

This work is founded by the National Natural Science Foundation of China Youth Program No. 51908065 and No. 52008038, the Science and Technology Progress and Innovation Program Project of the Hunan Provincial Department of Transportation No. 201938, the Scientific Research Project of the Hunan Provincial Department of Education No. 20B010, 21C0219, the Hunan Natural Science Youth Foundation No. 2021JJ40579, and the Open Fund for Changsha University of Science and Technology Bridge Engineering No. 15KC03.

Institutional Review Board Statement

Not applicable.

Informed Consent Statement

Not applicable.

Data Availability Statement

The data presented in this study are available on request from the corresponding author.

Conflicts of Interest

The authors declare no conflicts of interest. The funders had no role in the design of the study; in the collection, analyses, or interpretation of the data; in the writing of the manuscript; or in the decision to publish the results.

References

  1. Petersen, H.I. Morphology, formation and palaeo-environmental implications of naturally formed char particles in coals and carbonaceous mudstones. Fuel 1998, 77, 1177–1183. [Google Scholar] [CrossRef]
  2. Yu, C.; Peng, B.; Peltola, P.; Tang, X.; Xie, S. Effect of weathering on abundance and release of potentially toxic elements in soils developed on Lower Cambrian black shales, PR China. Environ. Geochem. Health 2012, 34, 375–390. [Google Scholar] [CrossRef]
  3. Park, S.Y.; Lee, H.S.; Kim, S.; Jeon, H.; Choi, J.; Han, Y. Correlation between adsorbed methane concentration and pore structure of organic-rich black shale from the Liard Basin, Canada. J. Nat. Gas Sci. Eng. 2021, 95, 104226. [Google Scholar] [CrossRef]
  4. Lin, X.; Kai, S.; Hao, Y.; Peng, Y.; Xue, F. Black shale hosted Ni-Co deposit: Research progress and prospect. Acta Petrol. Sin. 2022, 38, 3052–3066. [Google Scholar]
  5. Bell, F.G.; Entwisle, D.C.; Culshaw, M. A geotechnical survey of some British Coal Measures mudstones, with particular emphasis on durability. Eng. Geol. 1997, 46, 115–129. [Google Scholar] [CrossRef]
  6. Duan, Y.; Yang, Z.; Yu, T.; Yang, Q.; Liu, X.; Ji, W.; Jiang, H.; Zhuo, X.; Wu, T.; Qin, J. Geogenic cadmium pollution in multi-medians caused by black shales in Luzhai, Guangxi. Environ. Pollut. 2020, 260, 113905. [Google Scholar] [CrossRef]
  7. Charbonnier, Q.; Bouchez, J.; Gaillardet, J.; Calmels, D.; Dellinger, M. The influence of black shale weathering on riverine barium isotopes. Chem. Geol. 2022, 594, 120741. [Google Scholar] [CrossRef]
  8. Parviainen, A.; Loukola-Ruskeeniemi, K. Environmental impact of mineralised black shales. Earth-Sci. Rev. 2019, 192, 65–90. [Google Scholar] [CrossRef]
  9. Li, F.; Yu, T.; Huang, Z.; Jiang, T.; Wang, L.; Hou, Q.; Tang, Q.; Liu, J.; Yang, Z. Leaching experiments and risk assessment to explore the migration and risk of potentially toxic elements in soil from black shale. Sci. Total Environ. 2022, 844, 156922. [Google Scholar] [CrossRef]
  10. Sun, C.; Ling, S.; Wu, X.; Li, X.; Chen, J.; Jiang, W. Oxidation of black shale and its deterioration mechanism in the slip zone of the Xujiaping landslide in Sichuan Province, Southwestern China. CATENA 2021, 200, 105139. [Google Scholar] [CrossRef]
  11. Yang, Y.; Zhang, T.; Luo, J. Evaluation of slake durability for carbonaceous rocks exposed to water soaking using electrical resistivity. Constr. Build. Mater. 2023, 408, 133785. [Google Scholar] [CrossRef]
  12. Bryson, L.; Gomez-Gutierrez, I.; Hopkins, T. Correlations between durability and geotechnical properties of compacted shales. In Geo-Frontiers 2011: Advances in Geotechnical Engineering; American Society of Civil Engineers: Reston, VA, USA, 2011; pp. 4109–4118. [Google Scholar]
  13. Gomez-Gutierrez, I.; Bryson, L.; Hopkins, T. Correlations between geotechnical properties and the swell behavior of compacted shales. In Geo-Frontiers 2011: Advances in Geotechnical Engineering; American Society of Civil Engineers: Reston, VA, USA, 2011; pp. 4119–4128. [Google Scholar]
  14. Liu, Z.; He, Z.; Zhang, W.; Luo, S. Laboratory test and prediction model of dynamic resilient modulus of carbonaceous mudstone coarse-grained soil. Case Stud. Constr. Mater. 2023, 18, e01887. [Google Scholar] [CrossRef]
  15. Zeng, L.; Yu, H.; Gao, Q.; Bian, H. Mechanical behavior and microstructural mechanism of improved disintegrated carbonaceous mudstone. J. Cent. South Univ. 2020, 27, 1992–2002. [Google Scholar] [CrossRef]
  16. Mao, X.; Zhou, L.; Zheng, X.; Ma, B.; Liang, J. Performance Improvement of Soft Rock as Filling Material for Subgrade. Adv. Mater. Res. 2011, 250, 3444–3448. [Google Scholar] [CrossRef]
  17. Behnood, A. Soil and clay stabilization with calcium-and non-calcium-based additives: A state-of-the-art review of challenges, approaches and techniques. Transp. Geotech. 2018, 17, 14–32. [Google Scholar] [CrossRef]
  18. Sharma, L.; Sirdesai, N.; Sharma, K.; Singh, T. Experimental study to examine the independent roles of lime and cement on the stabilization of a mountain soil: A comparative study. Appl. Clay Sci. 2018, 152, 183–195. [Google Scholar] [CrossRef]
  19. Huang, Y.; Hu, K.; Wei, X.; Chandra, A. A generalized self-consistent mechanics method for composite materials with multiphase inclusions. J. Mech. Phys. Solids 1994, 42, 491–504. [Google Scholar] [CrossRef]
  20. Wu, Y.; Jia, M.; Gou, X.; Xu, W. Average Eshelby tensor of an arbitrarily shaped inclusion from convexity to non-convexity: Effective elastic properties of composites. Int. J. Solids Struct. 2023, 269, 112183. [Google Scholar] [CrossRef]
  21. Song, Z.; Peng, X.; Tang, S.; Fu, T. A homogenization scheme for elastoplastic composites using concept of Mori-Tanaka method and average deformation power rate density. Int. J. Plast. 2020, 128, 102652. [Google Scholar] [CrossRef]
  22. Office, J.E.; Cavalli, M.C.; Chen, D.; Chen, Q.; Chen, Y.; Falchetto, A.C.; Fang, M.; Gu, H.; Han, Z.; He, Z. Review of advanced road materials, structures, equipment, and detection technologies. J. Road Eng. 2023, 3, 370–468. [Google Scholar]
  23. Hu, M.; Xu, G.; Hu, S. Study on equivalent elastic modulus of sandy pebble soil based on Eshelby tensor and Mori-Tanaka equivalent method. Rock Soil Mech. 2013, 34, 1437–1442+1448. [Google Scholar]
  24. Ren, M.; Zhao, G.; Zhou, Y. Elastic stress transfer model and homogenized constitutive equation for the multi-phase geomaterials. Eng. Geol. 2022, 306, 106631. [Google Scholar] [CrossRef]
  25. Wang, Y.; Li, C.; Hu, Y. Experimental investigation on the fracture behaviour of black shale by acoustic emission monitoring and CT image analysis during uniaxial compression. Geophys. J. Int. 2018, 213, 660–675. [Google Scholar] [CrossRef]
  26. Sun, Q.; Zhang, Z.; Li, P.; Sun, Z.; Lu, D.; Gao, F. Study on bedding effect and damage constitutive model of black shale under dynamic loading. Chin. J. Rock Mech Eng. 2019, 38, 1319–1331. [Google Scholar]
  27. Gen, L.; Hong, F.; Wei, H. Experimental study on road performance of carbonaceous shale after pre-disintegration treatment. J. China Foreign Highw. 2012, 32, 34–37. [Google Scholar]
  28. JTG/T F20-2015[S]; Ministry of Transport of the People’s Republic of China: Technical Specification of Highway Pavement Base Construction. Beijing China Communications Press: Beijing, China, 2015.
  29. JTG 3430-2020; Ministry of Transport of the People’s Republic of China Highway Geotechnical test Code. Beijing China Communications Press: Bejing, China, 2020.
  30. GB/T 50145-2007; Ministry of Water Resources of the People’s Republic of China Engineering classification standard of soil. Beijing China Planning Press: Beijing, China, 2008.
  31. Chang, C.; Zhao, C.; Song, G. Interval Regression Analysis on Mechanical Property Index Evolution Law of Cement-soil Based on Bayesian Bootstrap Method. J. Henan Norm. Univ. 2023, 50, 227–234. [Google Scholar]
  32. JTG E51-2009; Ministry of Transport of the People’s Republic of China: Test Regulation of Inorganic Bond Stabilized Materials for Highway Engineering. Beijing China Communications Press: Beijing, China, 2009.
  33. JTG D50-2017; Ministry of Transport of the People’s Republic of China: Code for Design of Highway Asphalt Pavement. Beijing China Communications Press: Beijing, China, 2017.
  34. Wen, L.; Yun, H.; Shuai, H. Study on the influence of sulfate on the relationship between uniaxial compressive strength and elastic modulus of cemented backfill. China Coal. 2016, 42, 102–105. [Google Scholar]
Figure 1. Mineral content of black shale.
Applsci 14 01636 g001
Figure 2. Black shale disintegration process (Chinese letters in the figure means Length × Width × Height).
Applsci 14 01636 g002
Figure 3. Particle size grading curve.
Applsci 14 01636 g003
Figure 4. Compaction test of cement-soil with different cement content.
Applsci 14 01636 g004
Figure 5. Optimum moisture content and maximum dry density of cement-soil.
Applsci 14 01636 g005
Figure 6. Relationship between unconfined compressive strength and cement content of cement-soil specimen with maximum dry density.
Applsci 14 01636 g006
Figure 7. Test procedure the experiments on black shale modified soil.
Applsci 14 01636 g007
Figure 8. (a) Relationship between dry density and cement-soil ratio of black shale. (b) Relationship between water absorption and cement-soil ratio of black shale. R 40 ω n is the water absorption curve of the sample with 40% black shale content; R 40 ρ d refers to the dry density curve of the specimen with 40% black shale content. S15 and S25 refer to cement content of cement-soil of 15% and 25%, respectively.
Applsci 14 01636 g008
Figure 9. Stress–strain curve of  R 40 .
Applsci 14 01636 g009
Figure 10. (a) Relationship between unconfined compressive strength of black shale modified soil and cement content. (b) Black shale modified soil with different cement content.
Applsci 14 01636 g010
Figure 11. (a) Relationship between curing age and strength. (b) Relationship between curing age and mass increase rate of specimen after water absorption.
Applsci 14 01636 g011
Figure 12. (a) Relationship between quality loss rate and cycle period of black shale in different environments. (b) Relationship between strength and cycle period of black shale under different environments.
Applsci 14 01636 g012
Figure 13. Unconfined compression test of test piece Y7S30.
Applsci 14 01636 g013
Figure 14. Picture of unconfined compression test 21.“I. Contact Stage” refers to the stage when the specimen is fully in contact with the test machine and device; “IV. Failure Stage” refers to the stage when the specimen is obviously damaged.
Applsci 14 01636 g014
Figure 15. Schematic diagram of composite material formation process.
Applsci 14 01636 g015
Figure 16. Test result fitting curve.
Applsci 14 01636 g016
Figure 17. Measured value and fitting value.
Applsci 14 01636 g017
Table 1. Basic physical properties of soil.
Particle Specific Gravity
GS
Liquid Limit
ω L /%
Plastic Limit
ω P /%
Plasticity Index
I P
Maximum Dry Density
ρ d m a x /g·cm−3
Optimal Moisture Content
ω o p /%
2.7155.626.329.31.65217.5
Table 2. Test results of the experiments on black shale modified soil.
Name of
Composite Material
Crushed Stone
Content R/%
Cement-SoilCement Content
η /%
Dry Density
ρ d /g·cm−3
Water
Absorption
ω n /%
Strength
[σ]/MPa
Y4S1040S106.001.8802.680.85
Y4S15S159.001.8822.631.63
Y4S20S2012.01.9051.751.83
Y4S25S2515.01.8922.332.07
Y4S30S3018.01.9261.722.70
Y5S1055S104.501.9772.720.61
Y5S15S156.751.9613.101.00
Y5S20S209.002.0042.091.27
Y5S25S2511.251.9753.061.83
Y5S30S3013.501.9882.872.02
Y7S1070S103.002.0443.230.27
Y7S15S154.502.1021.680.97
Y7S20S206.002.0312.991.01
Y7S25S257.502.0932.401.18
Y7S30S309.002.0702.751.28
Note:   R 40 —The blending amount of black shale is 40%; ② η = Mcement:Mtotal; ③ ω n = (Mbefore specimen curing − Mafter specimen curing)/Mbefore specimen curing; ④ Y5S10—a composite material composed of 55% black shale and S10 cement-soil.
Table 3. R 40 elastic modulus value (MPa).
ES10ES15ES20ES25ES30
Elastic modulus value77.8168.8172.3202.4220.7
Correlation coefficient r0.99910.99960.99980.99980.9997
Table 4. Seven day unconfined compressive strength standard of inorganic binder stabilized materials (MPa) [33].
MaterialStructure LayerHighway GradeExtremely Heavy, Extra Heavy TrafficHeavy TrafficMedium, Light Traffic
Cement stabilized classHighway baseHigh grade5.0~7.04.0~6.03.0~5.0
Low grade4.0~6.03.0~5.02.0~4.0
Highway SubbaseHigh grade3.0~5.02.5~4.52.0~4.0
Low grade2.5~4.52.0~4.01.0~3.0
Note: ① High-grade: high-speed, first-class highways; ② Low Grade: Grade II and below highways.
Disclaimer/Publisher’s Note: The statements, opinions and data contained in all publications are solely those of the individual author(s) and contributor(s) and not of MDPI and/or the editor(s). MDPI and/or the editor(s) disclaim responsibility for any injury to people or property resulting from any ideas, methods, instructions or products referred to in the content.

