Article

Development of a Fault Detection and Localization Model for a Water Distribution Network

by
Christogonus U. Onukwube
1,
Daniel O. Aikhuele
1,* and
Shahryar Sorooshian
2,*
1
Department of Mechanical Engineering, University of Port Harcourt, East-West Road, PMB 5323 Choba, Port Harcourt 500004, Nigeria
2
Department of Business Administration, University of Gothenburg, 41124 Gothenburg, Sweden
*
Authors to whom correspondence should be addressed.
Appl. Sci. 2024, 14(4), 1620; https://doi.org/10.3390/app14041620
Submission received: 12 December 2023 / Revised: 20 January 2024 / Accepted: 29 January 2024 / Published: 17 February 2024
(This article belongs to the Special Issue Pathways for Water Conservation)

Abstract

:
Water distribution networks are complex systems that aid in the delivery of water to residential and non-residential areas. However, the networks can be affected by different types of faults, which could lead to the wastage of treated water. As such, there is a need to develop a reliable leakage detection and localization system that can detect leak occurrences in the network. This study, using a simulated dataset from EPANET, presents the application of supervised machine learning classifiers for leak detection and localization in the water distribution network of the University of Port Harcourt Choba campus. The study compared three machine learning classification tools that are used in pattern recognition analysis: the support vector machine, k-nearest neighbor, and artificial neural network. The robustness and effectiveness of the proposed approach are compared with those of the performance of the classifiers for leakage detection in the network of the case study. The results show that the support vector machine performs the best, with 79% accuracy, while the respective accuracies for the remaining classifiers are 70% for the k-nearest neighbor and 61% for the artificial neural networks. The high accuracy demonstrated by the models shows that they are able to detect and address issues relating to fault detection in a water distribution network. This model could provide a leakage detection system to be applied to buildings for the efficient management of water in their networks.

1. Introduction

One of the problems facing humanity in the twenty-first century is that of the scarcity of water. This problem can be linked to the increased pressure from demographic, socioeconomic, and environmental causes, such as accelerated population growth, rapid urbanization, unsustainable consumption patterns, and the depletion and contamination of aquifers as well as the increasingly dramatic environmental variations due to the climatic effects of global warming that are a result of demand for freshwater supplies [1]. Construction activities have also led to the gradual depletion of water resources in certain countries, whereas certain areas are facing issues of quantity and quality in relation to the accessibility of underground water, which is also affected by the extent of underground water extraction [2].
The literature shows that water utility companies lose an estimated amount of USD 9.6 billion annually as a result of excessive leakage in water distribution networks despite the fact that over USD 184 billion is spent on the provision of clean water worldwide [3]. The literature demonstrates that many fault detection techniques have been explored and developed in the literature, especially in the area of leakage detection. A variety of fault-finding techniques, such as leak noise correlators, the acoustic detection of the water balance, and pressure controls have been presented in [4,5,6,7]. The use of sonic detection techniques has been explored in the literature; the techniques make use of geophones, valves, and hydrants that allow for direct ground-level listening and also make use of a listening device that makes contact with the structure [8]. Yang et al. [9] explored the use of acoustic signals for buried water distribution pipelines based on the correlation technique. Abdulshaheed et al. [10] studied the use of the hydraulic technique for leak detection and localization in a water distribution network. Studies of the techniques have mainly focused on the comparison of data with predictions produced through hydraulic models [3,11,12,13,14].
The use of time series and pattern recognition algorithms to predict leaks and for the localization of zones where leaks are detected has been explored in the literature [15]. Lee and Yoo [16] created a data-driven leak detection model using the deep learning technique; the model was used to simulate a real leaking accident, and its performance was assessed. Guo et al. [17] proposed the use of deep learning for predicting water demand, and the results showed that the method improves the performance of water demand predictions. The application of the support vector machine has increased in comparison with other modeling methods, and this can be attributed to the high efficiency of the method and the effectiveness of the method when working with a low dataset, as reported in [18].
There are examples in the literature that support the use of support vector machine learning in modeling the relationships between the inputs and outputs in classification and regression problems that are encountered across many engineering processing fields [19,20,21,22,23,24]. Kang et al. [25] explored the use of convolution neural networks, the support vector machine, and graph-based models for leakage localization and detection in a water distribution network. The method involved taking features from convocation neural networks (CNNs) and feeding them into multi-layer perceptrons and supporting the vector machines as inputs. The use of multi-level artificial neural networks (ANNs) to detect burst events in a water distribution network was explored in [26]. The technique consist of two levels, where the first level is used for the identification of leak occurrences in the network and the second level is used for the location and magnitude of leaks in the network.
Aksela et al. [27] explored the use of clustering models for leak detection in a water distribution network. The method involved the segmentation of the network into various clusters as this process can be used to locate any potential leak points in the water distribution network. Wu et al. [28] investigated the application of the unsupervised clustering burst detection approach to a district metered area with numerous inlets and outputs. The use of the multiclass support vector machine model for the leakage detection in a large scale network has been explored in [24]. This method involves the subdivision of the water networks into leakage zones, and data were generated using the Monte Carlo method together with the hydraulic model. The result shows that the model could identify the leakage zones using the flow and pressure data. The drawback of this method is that of determining the number of clusters and the impact of the randomization of the first cluster on the clustering process. The use of the Bayesian system identification method for leakage detection in a water distribution network was proposed in [12,29].
Soldevila et al. [30] proposed a mixed model based on a data-driven approach to leak localization in a water distribution network; EPANET software 2.21 version was adopted to model the water networks after the calibration. The data used in training the models were obtained from the EPANET software for each possible fault, as well as different operating and uncertain conditions. The literature shows that much research has been conducted on the deployment of machine learning models for the detection and localization of leak events in a water distribution network. However, much of the literature is still lacking in comparisons between different machine learning classifiers for leak detection and localization in a water distribution network. The present study, however, proposes to fill this gap in the knowledge by comparing the ability and robustness of various supervised machine learning models to detect and localize leak events in a water distribution system that is based on the water network of the University of Port Harcourt, Nigeria.

2. Materials and Methods

2.1. Research Methodology

The study aimed to develop a leak detection and localization machine learning model for a water distribution networks using pressure residuals [31]. EPANET software simulated different leakage scenarios in the water distribution system. The software emitter coefficient was created to simulate fire hydrants and sprinklers but may also be modified to simulate leak occurrence in a water distribution network. The nodal pressures from the two hydraulic areas were used as training and testing datasets. The data generated from the leakage scenarios with various emitter coefficients were then used to train and test the three classifiers. The models’ comparative performance was exhaustively evaluated using the parameter accuracy, receiver operating curve (ROC), confusion matrix table, precision, recall, and F1-score. These machine learning performance evaluation metrics were deployed in assessing the overall performance of each model in leak detection and localization.

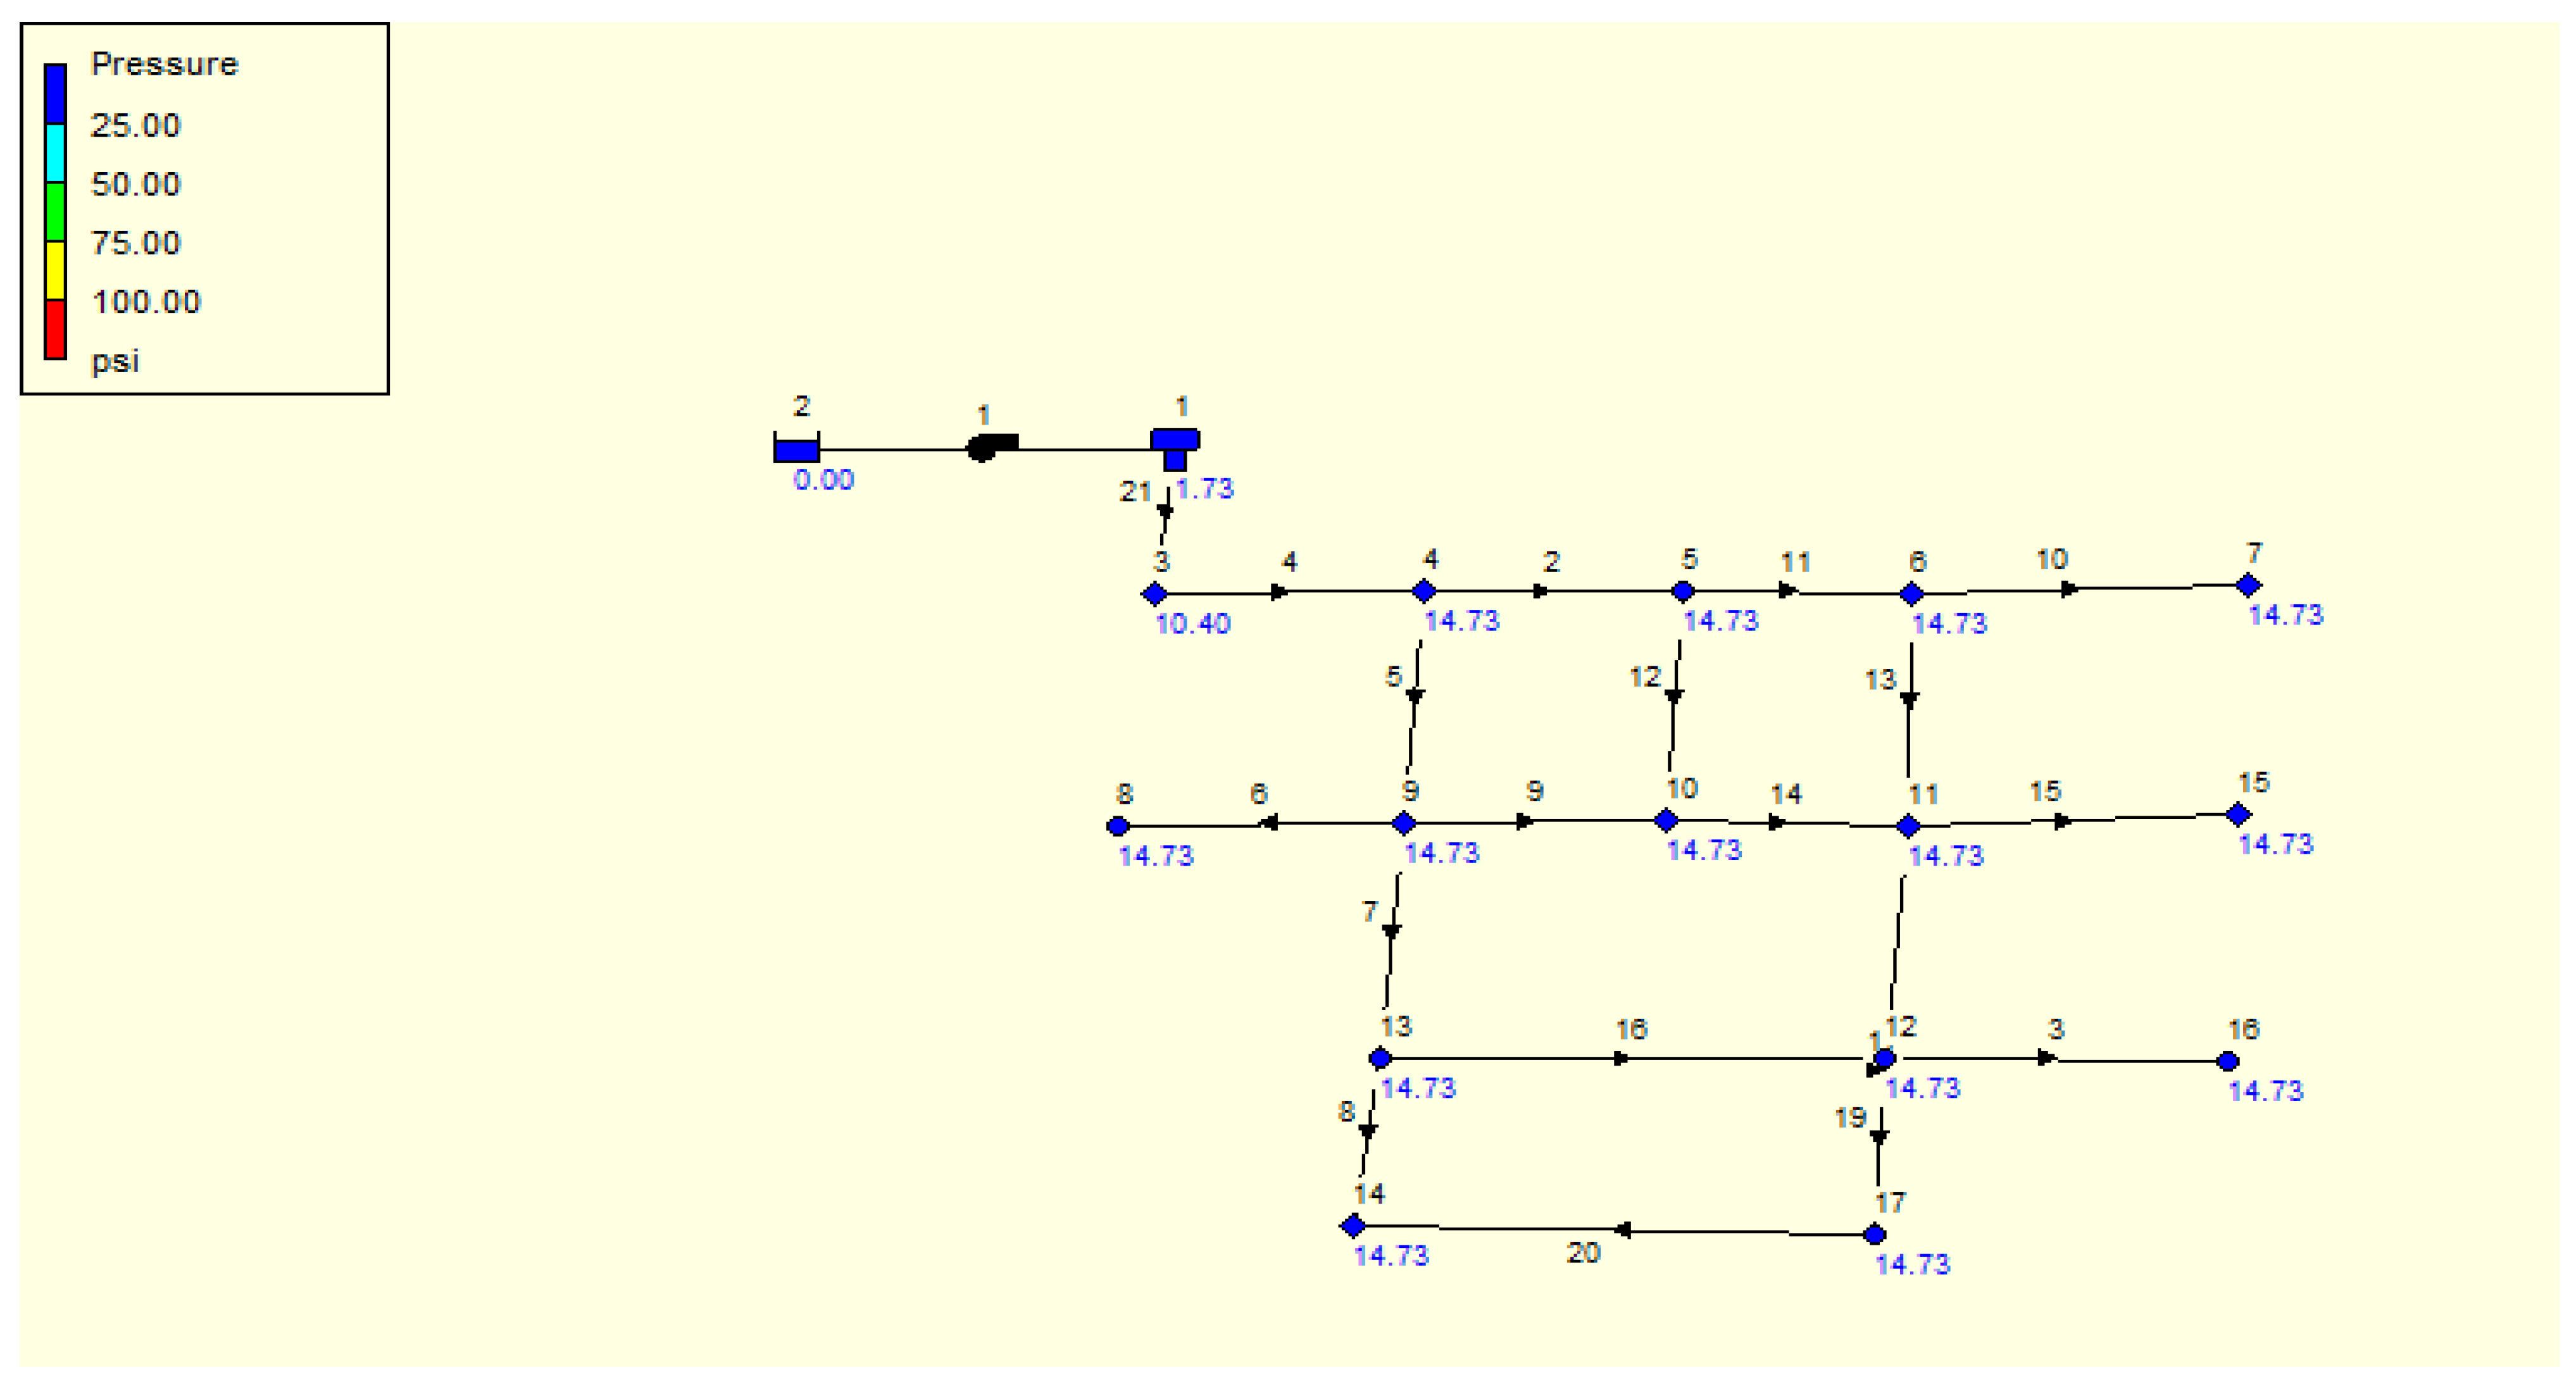
2.2. Data Generation

Choba Park at the University of Port Harcourt serves as the study location. The university comprises of three campuses, Choba Park, Abuja Park, and Delta Park, all within 1.2 km of one another, and each has its separate water supply system. Choba Park, on the other hand, has a 2500 m perimeter, 121 acres of land, four huge hostel blocks, engineering, educational, and agricultural scientific institutions, and business centers with banks, canteens, and photocopying facilities. Choba Park is a five-sided polygon because of the five coordinates that define its perimeter. It suffices to enter any one of the five locations, such as 40°53′44″ N, 60°54′24.65″ E, to access the study area’s map on Google. The existing water distribution network of Choba Park can be found in [32]. In contrast, the EPANET hydraulic model of the University of Port Harcourt Choba campus is shown in Figure 1.
The water distribution network was split into two zones: Zone 1 (LZ1), which contains eight candidate nodes, and Zone 2 (LZ2), which contains seven candidate nodes [15]. The emitter coefficient used in the simulation of leak occurrence in the nodes is based on the classical Torricelli equation for flow through an orifice.
q = C * A * p p e x p
where C represents a coefficient, A represents the orifice aperture area, p is the fluid pressure, and p e x p is the pressure exponent. In the Epanet software, the pressure exponent, by default, is set to 0.5. The Epanet software applies a simple definition for the emitter function:
e C = q / p p e x p
Data were generated by modeling the leak occurrence in the water network according to the number of candidate leak nodes, and 15 leaks are summarized in Table 1. Zone 1 contains 8 candidate leak nodes, while Zone 2 has 7 candidate leak nodes. The dataset generated comprised 8 features of the network, such as pipe roughness, estimated demand, cinematic viscosity, fluid density, piezometric head, gravity acceleration, and valve coefficient and pipe length. The dataset sample used in the training and testing of the model were 480 samples on hourly average. The uncertainty conditions in the dataset used in training and testing the model were affected by a noise level of an amplitude within the range of [−4, 5%]. The WDN simulation results are directly impacted by the model’s pipe roughness parameter uncertainty. Since pipe deterioration causes the roughness to diminish with time, it is difficult to accurately identify in WDNs, since it cannot be measured directly. It is unnecessary and can be removed. Therefore, the coefficient of Hazen–Williams (CHW) is simulated, such that CHW ∈ [125, 130]. Water demand uncertainty is considered for each node in the water distribution network ˜d ∈ [−10%, 10%].

2.3. Methods

Three supervised machine learning classifiers (support vector machine, artificial neural network, and K-nearest neighbor) were evaluated for the research analysis. Artificial neural networks are used as machine learning classifiers modeled after how the nervous system and brain work. This classifier was chosen because it offers a method of simulating non-linear connections between systems. According to [33], the multi-layered feed-forward neural network is commonly adopted to analyze pattern recognition tasks. The layers are three stages that receive information; the output is where the processing results are given and hidden, and the layers are between input and output. Each layer comprises a central unit called the perceptron unit, modeled by the McCulloch–Pitts [33] equation, given below.
φ k r = k ( i = 1 p ω i k   r i + b k )
where r corresponds to the input vector, b k is a bias, ω i k is a weight coefficient, and k is a non-linear activation function.
The hyperparameter settings for this classifier comprise four hidden layers with a corresponding number of 192, 32, 24, and 1 neurons per layer, chosen to increase the model’s performance. The batch size of the neural network, in addition to the layers of the neurons, is 512, with an optimal learning rate of 0.01 and an epoch of 20.
The support vector machine is a supervised learning technique widely used for classification and regression based on structural risk minimization. This technique creates a decision boundary between classes by mapping the training data onto a higher-dimensional space and then obtaining the maximum margin hyperplane within that space [34]. The objective of the techniques is achieved by locating the optimal separating hyper plane that maximizes the margin between the closest sample points in the training dataset, which are called support vectors [33].
Χ [ k i , y i ] n represents a dataset with two classes, and k R p denotes the measured variables. In order to determine the hyper plane g(r), n is the number of the training samples, while the label vector is Y [ 1 , 1 ] where the classes are separated by g(r) = W t r + b . The position of a separating hyperplane is determined by W and b (bias). The geometric separation of the mapped data in the high-dimensional space is defined by the term γ in this context.
Discriminant techniques are used to extend two-class classification problems to multi-class classification problems. In the present study, the hyperparameter for the support vector machine model is given Equation (4), which represents the radial basis function kernel that was selected because of its generality and successful results in fault diagnosis applications.
K r i , r j = e x p γ | | r i r j | | 2
The k-NN algorithm is based on the principle that the most similar samples belonging to the same class have a high probability [35]. Using the the K-NN algorithm, the Euclidean distance function is applied to calculate the similarity or difference between classes. The features of the system consist of measurement, which represents the class. Furthermore, if the classification algorithm is trained with a set of points such as,
ζ = ζ 1 , ζ 2 , ζ 3 , ζ n
and ψ = ψ 1 , ψ 2 , ψ 3 ψ n , then this values represents the new system values and the algorithm defines the class using the distance equation for a two-dimensional space.
D ζ , ψ = i = 1 n ζ i , ψ i 2
The algorithm’s output is usually the class with the highest frequency among the k-nearest neighbors. In the analysis of the work described in this paper, the K-neighbors classifier hyperparameter was used to obtain the best performance of the model, and the Euclidean distance with 5 neighbors was sufficient to obtain the required separability, as this corresponds with the University of Port Harcourt Network.

3. Results and Discussion

The training phase of the machine learning classifiers was conducted with 80% of the data, while 20% were used to test model testing. Different machine learning classifiers’ performance metrics were used to assess the performance of each model in detecting and localizing leakage in the water distribution of the campus, and they are discussed and compared in the following subsections.

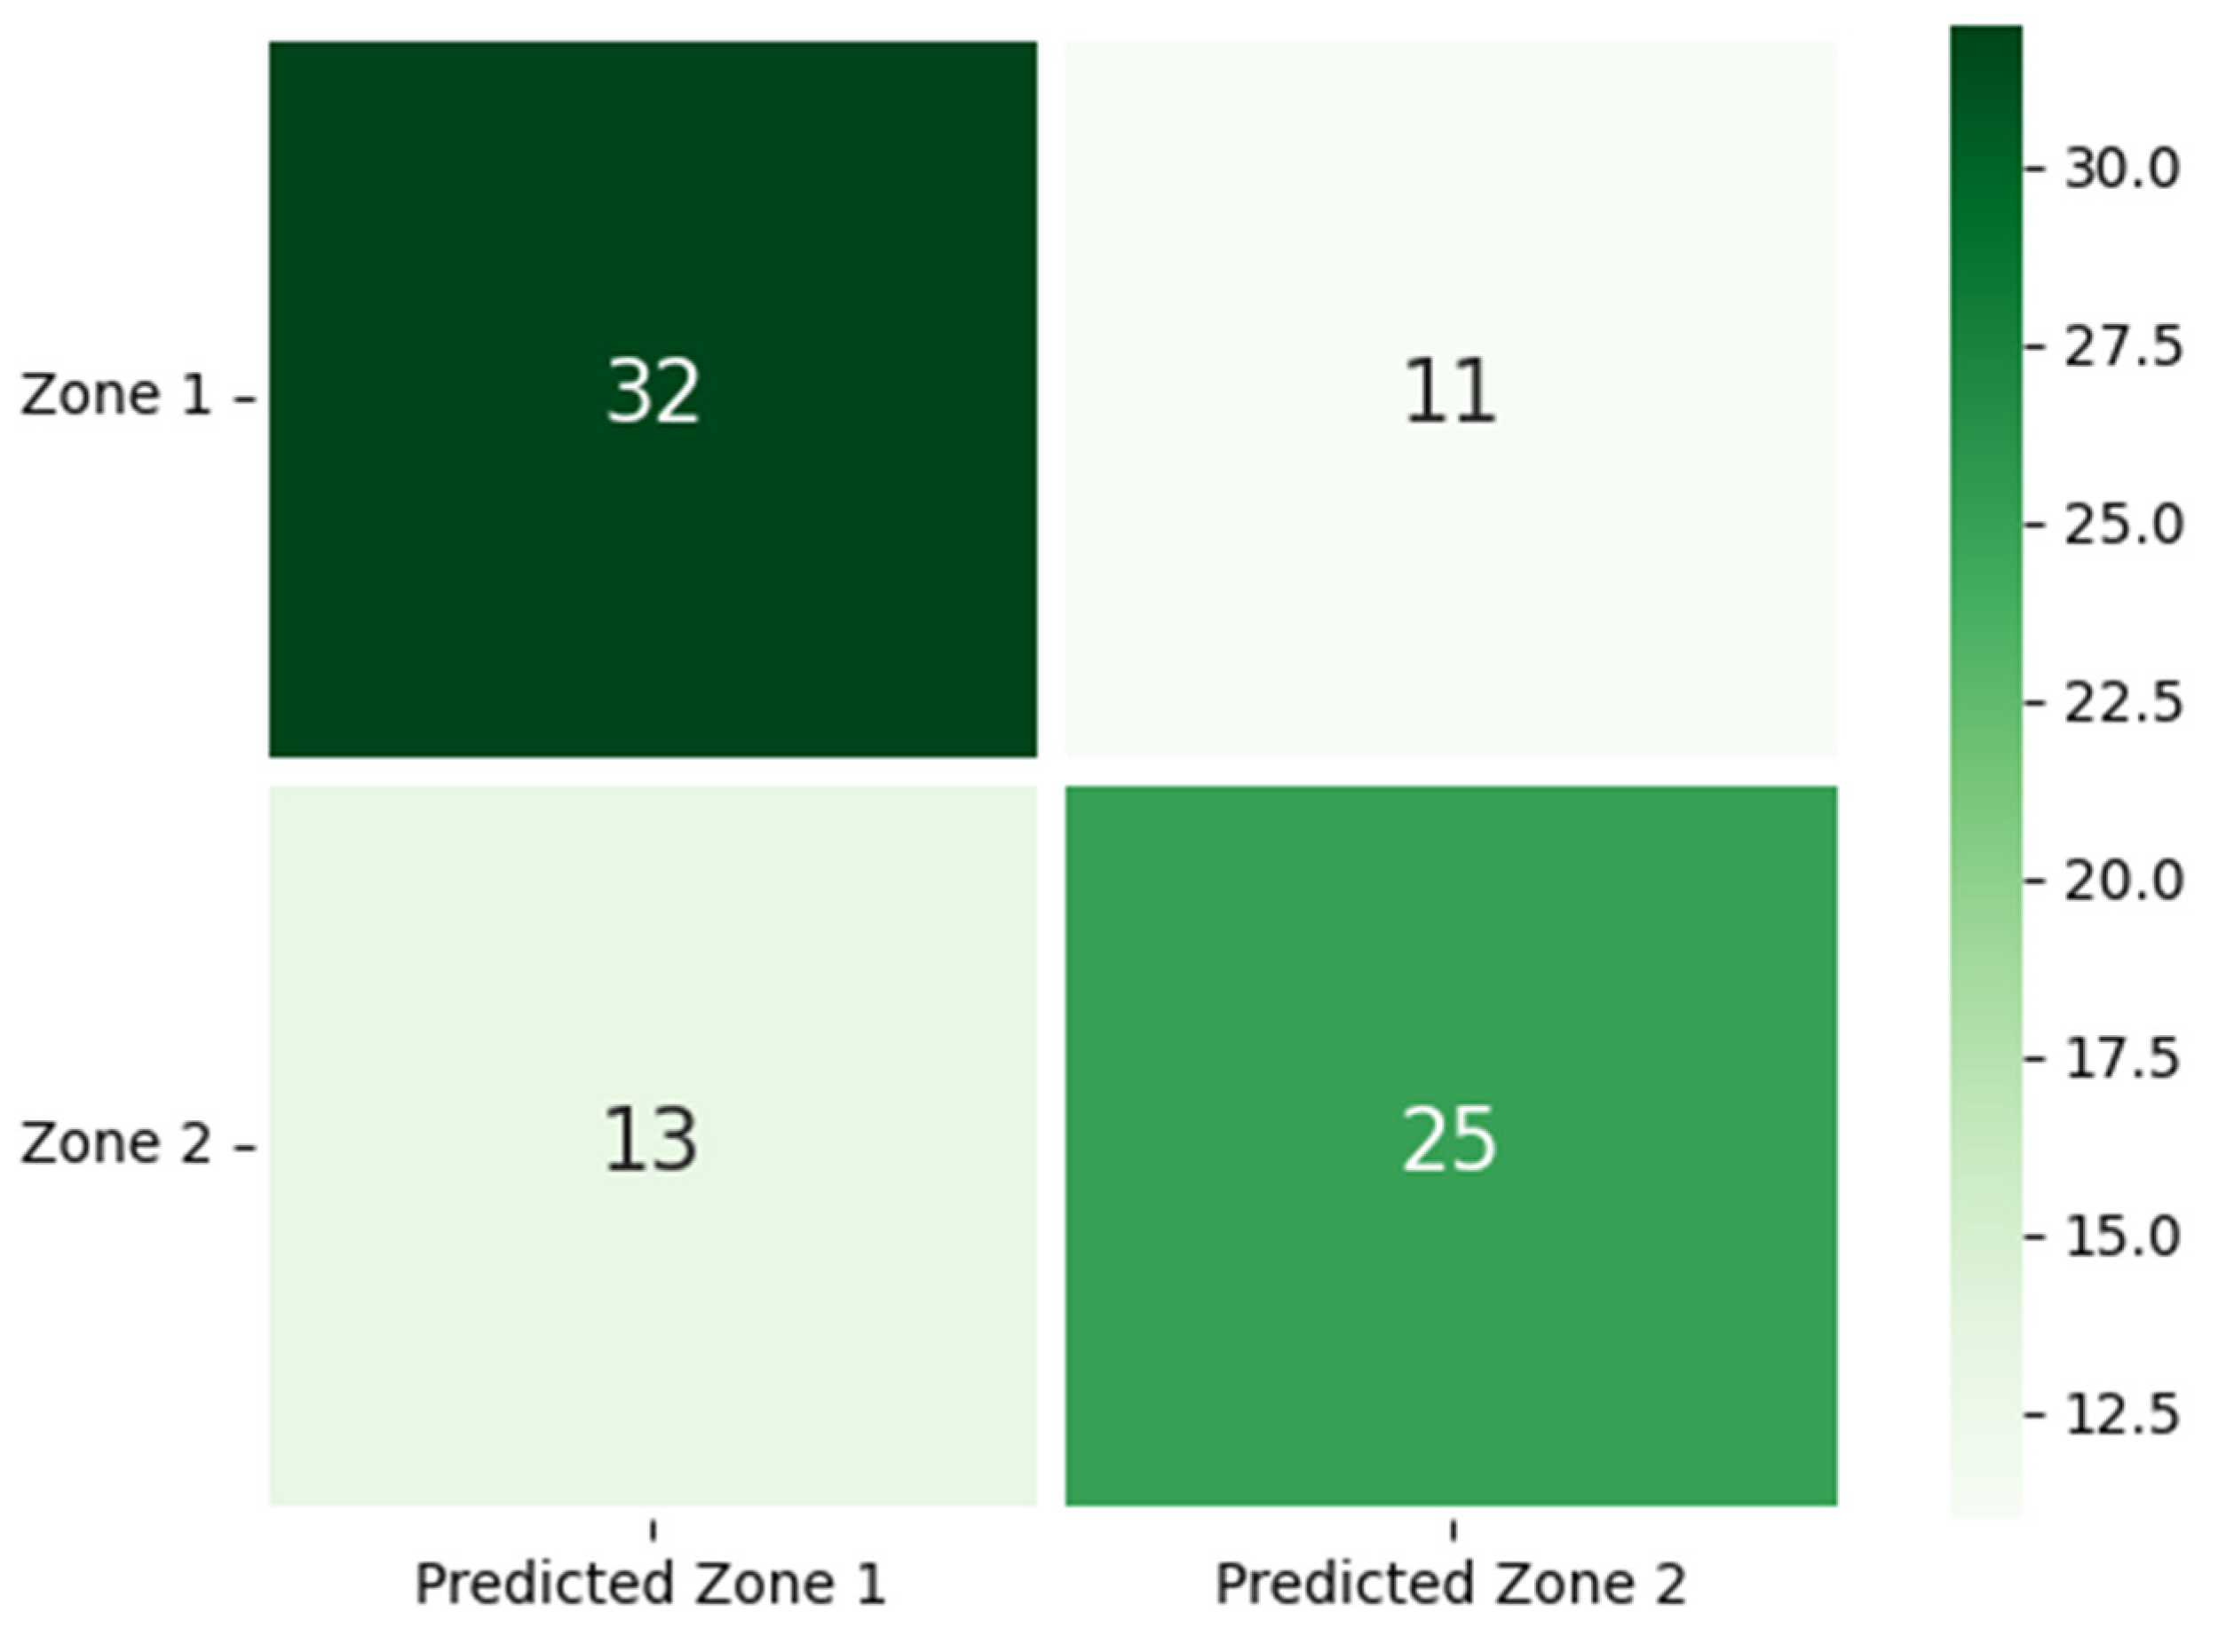
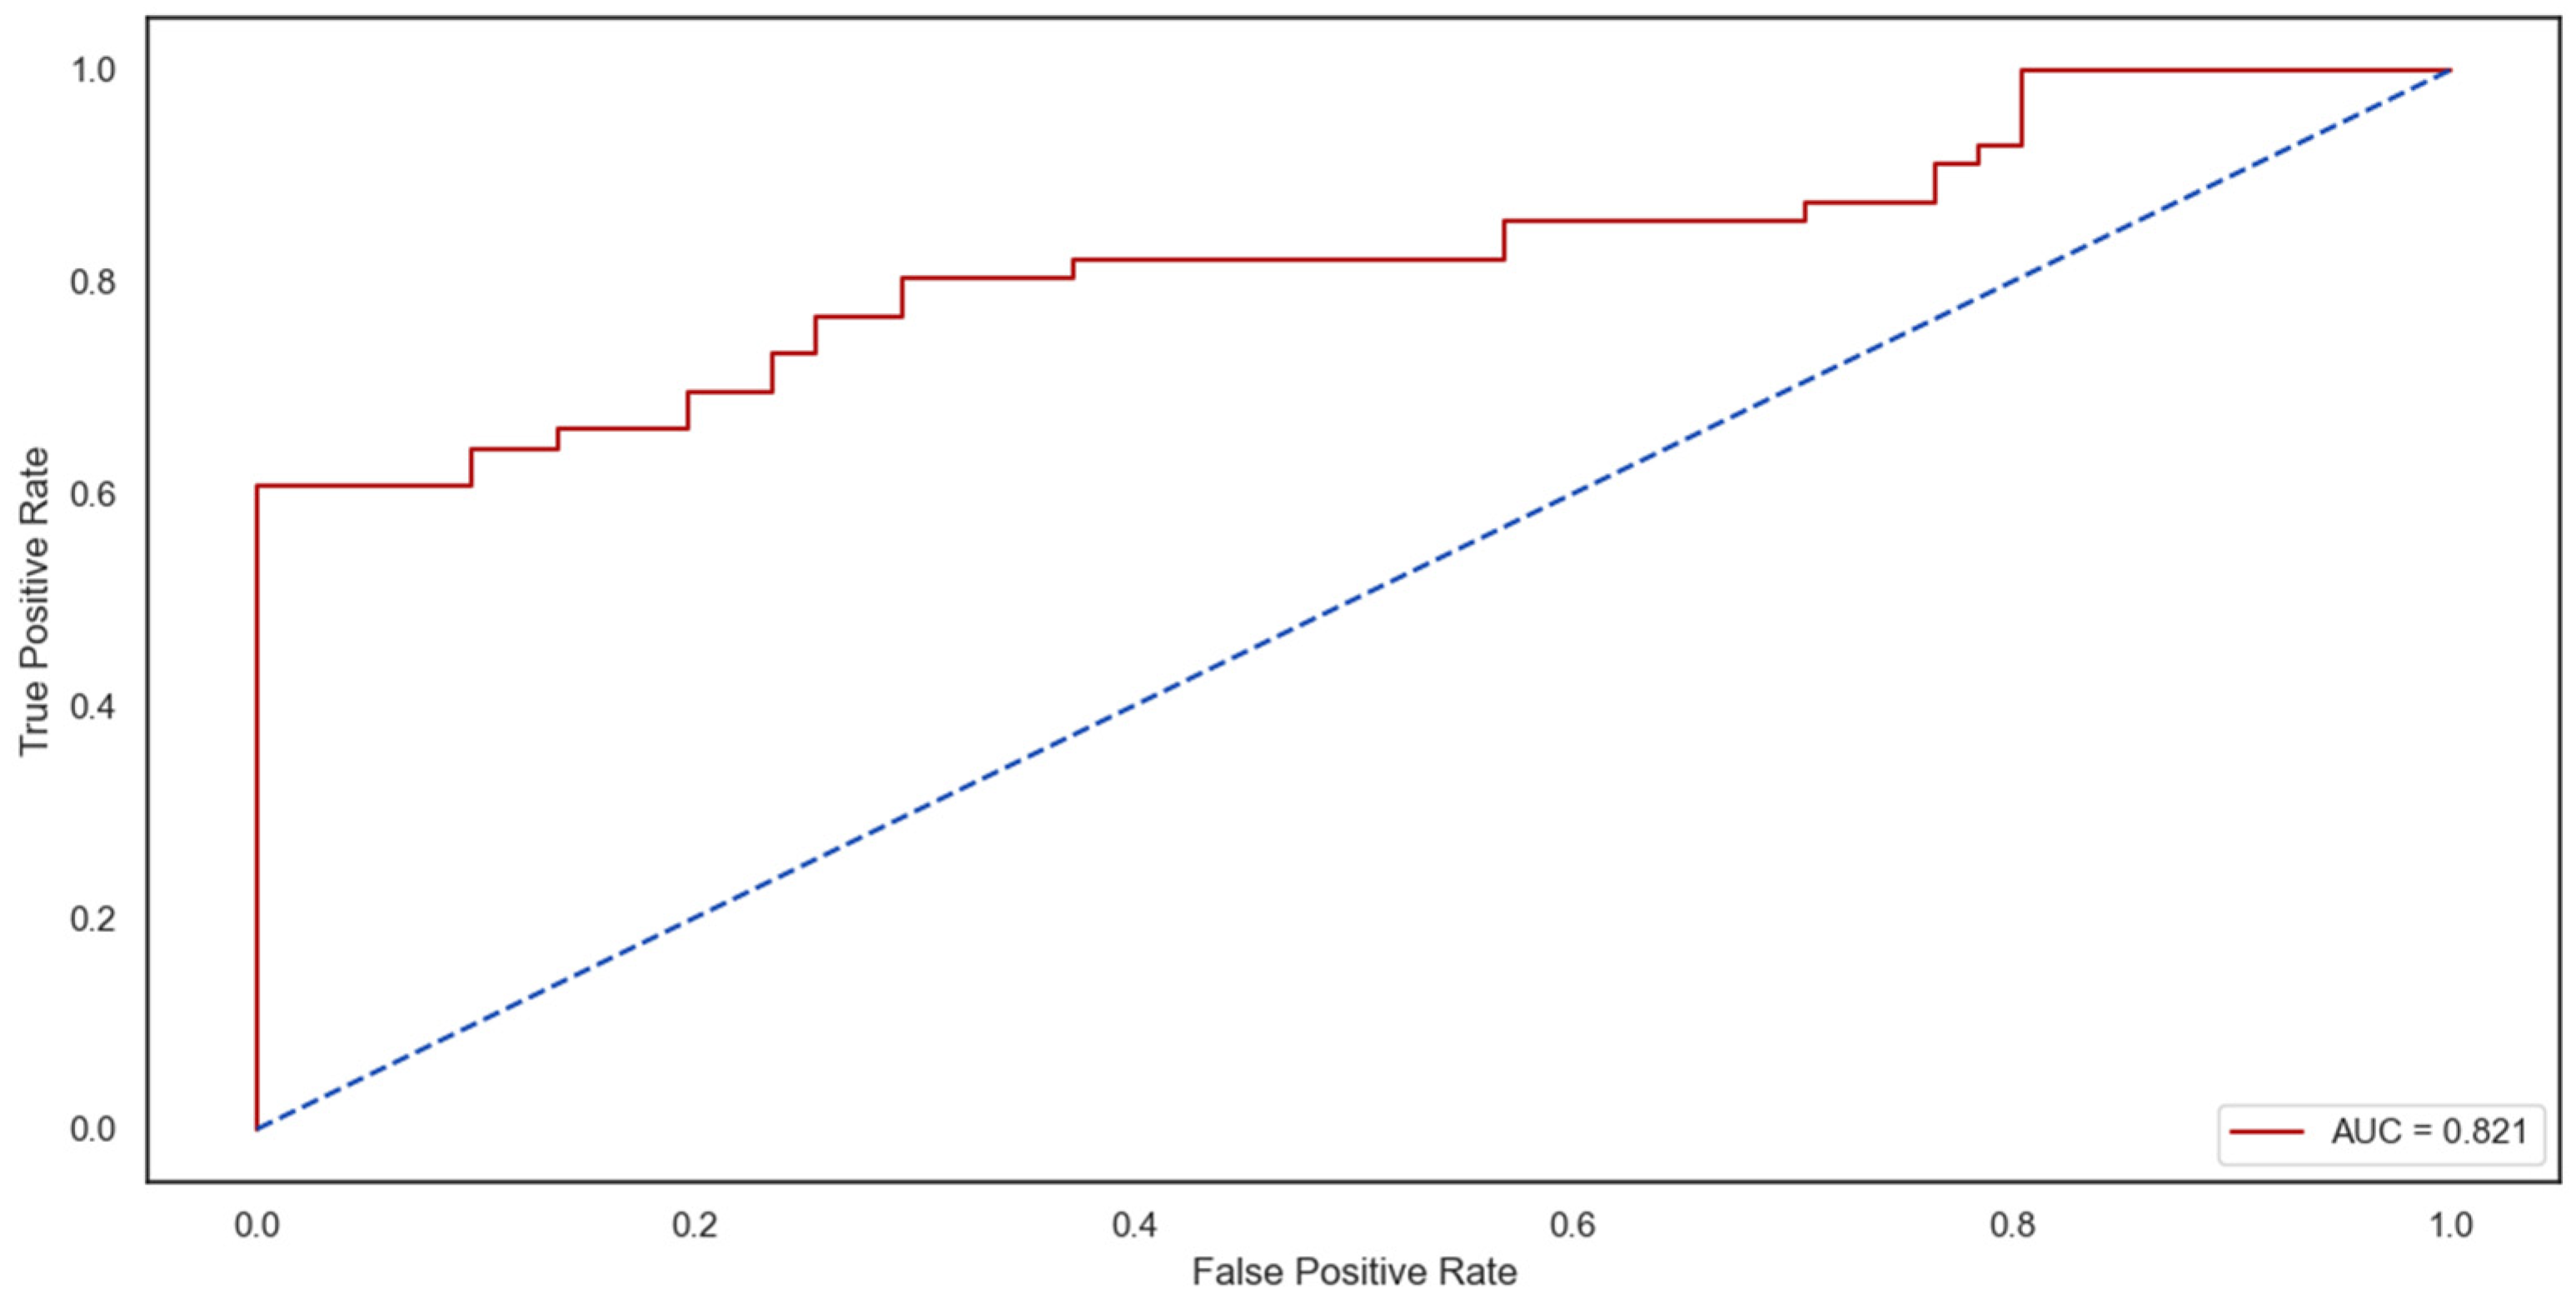
3.1. K-Nearest Neighbor

Table 2 summarizes the results obtained with the pressure residuals of the water distribution network. The model’s performance was assessed by the model’s confusion matrix, accuracy report, receiver operating curve, precision, recall, and F1-score. The table shows that the K-NN classifier performed well with leakage localization and detection accuracy of 0.70%, recall = 0.70, F1-score = 0.70, and precision = 0.70%.
Additionally, Figure 2 shows the model’s performance in leak detection and localization across each zone. The figure indicates the model’s performance in zone 1 and zone 2. The zone, recall, precision, and F1-score results were 0.74, 0.71, and 0.73, respectively. At the same time, zone 2 recall, precision, and F1-score results were 0.66, 0.69, and 0.68. Furthermore, the receiver operating curve ROC (Figure 3) indicates that the model has an area under the curve AUC of 0.775, which indicates the model’s good performance in leak detection and localization using the simulated dataset.
The use of the K-NN classifier in leak localization across the two zones in order to provide the possible locations of leak events within the water distribution network can be identified in several possible locations, and the magnitudes of such leaks are 30, 35, 40, and 45 L/s for each node. Uncertainty conditions, such as noise and demand uncertainty, influenced the overall performance of the model; the uncertainty metrics were factored into the quality of data used in the training and testing of the model.

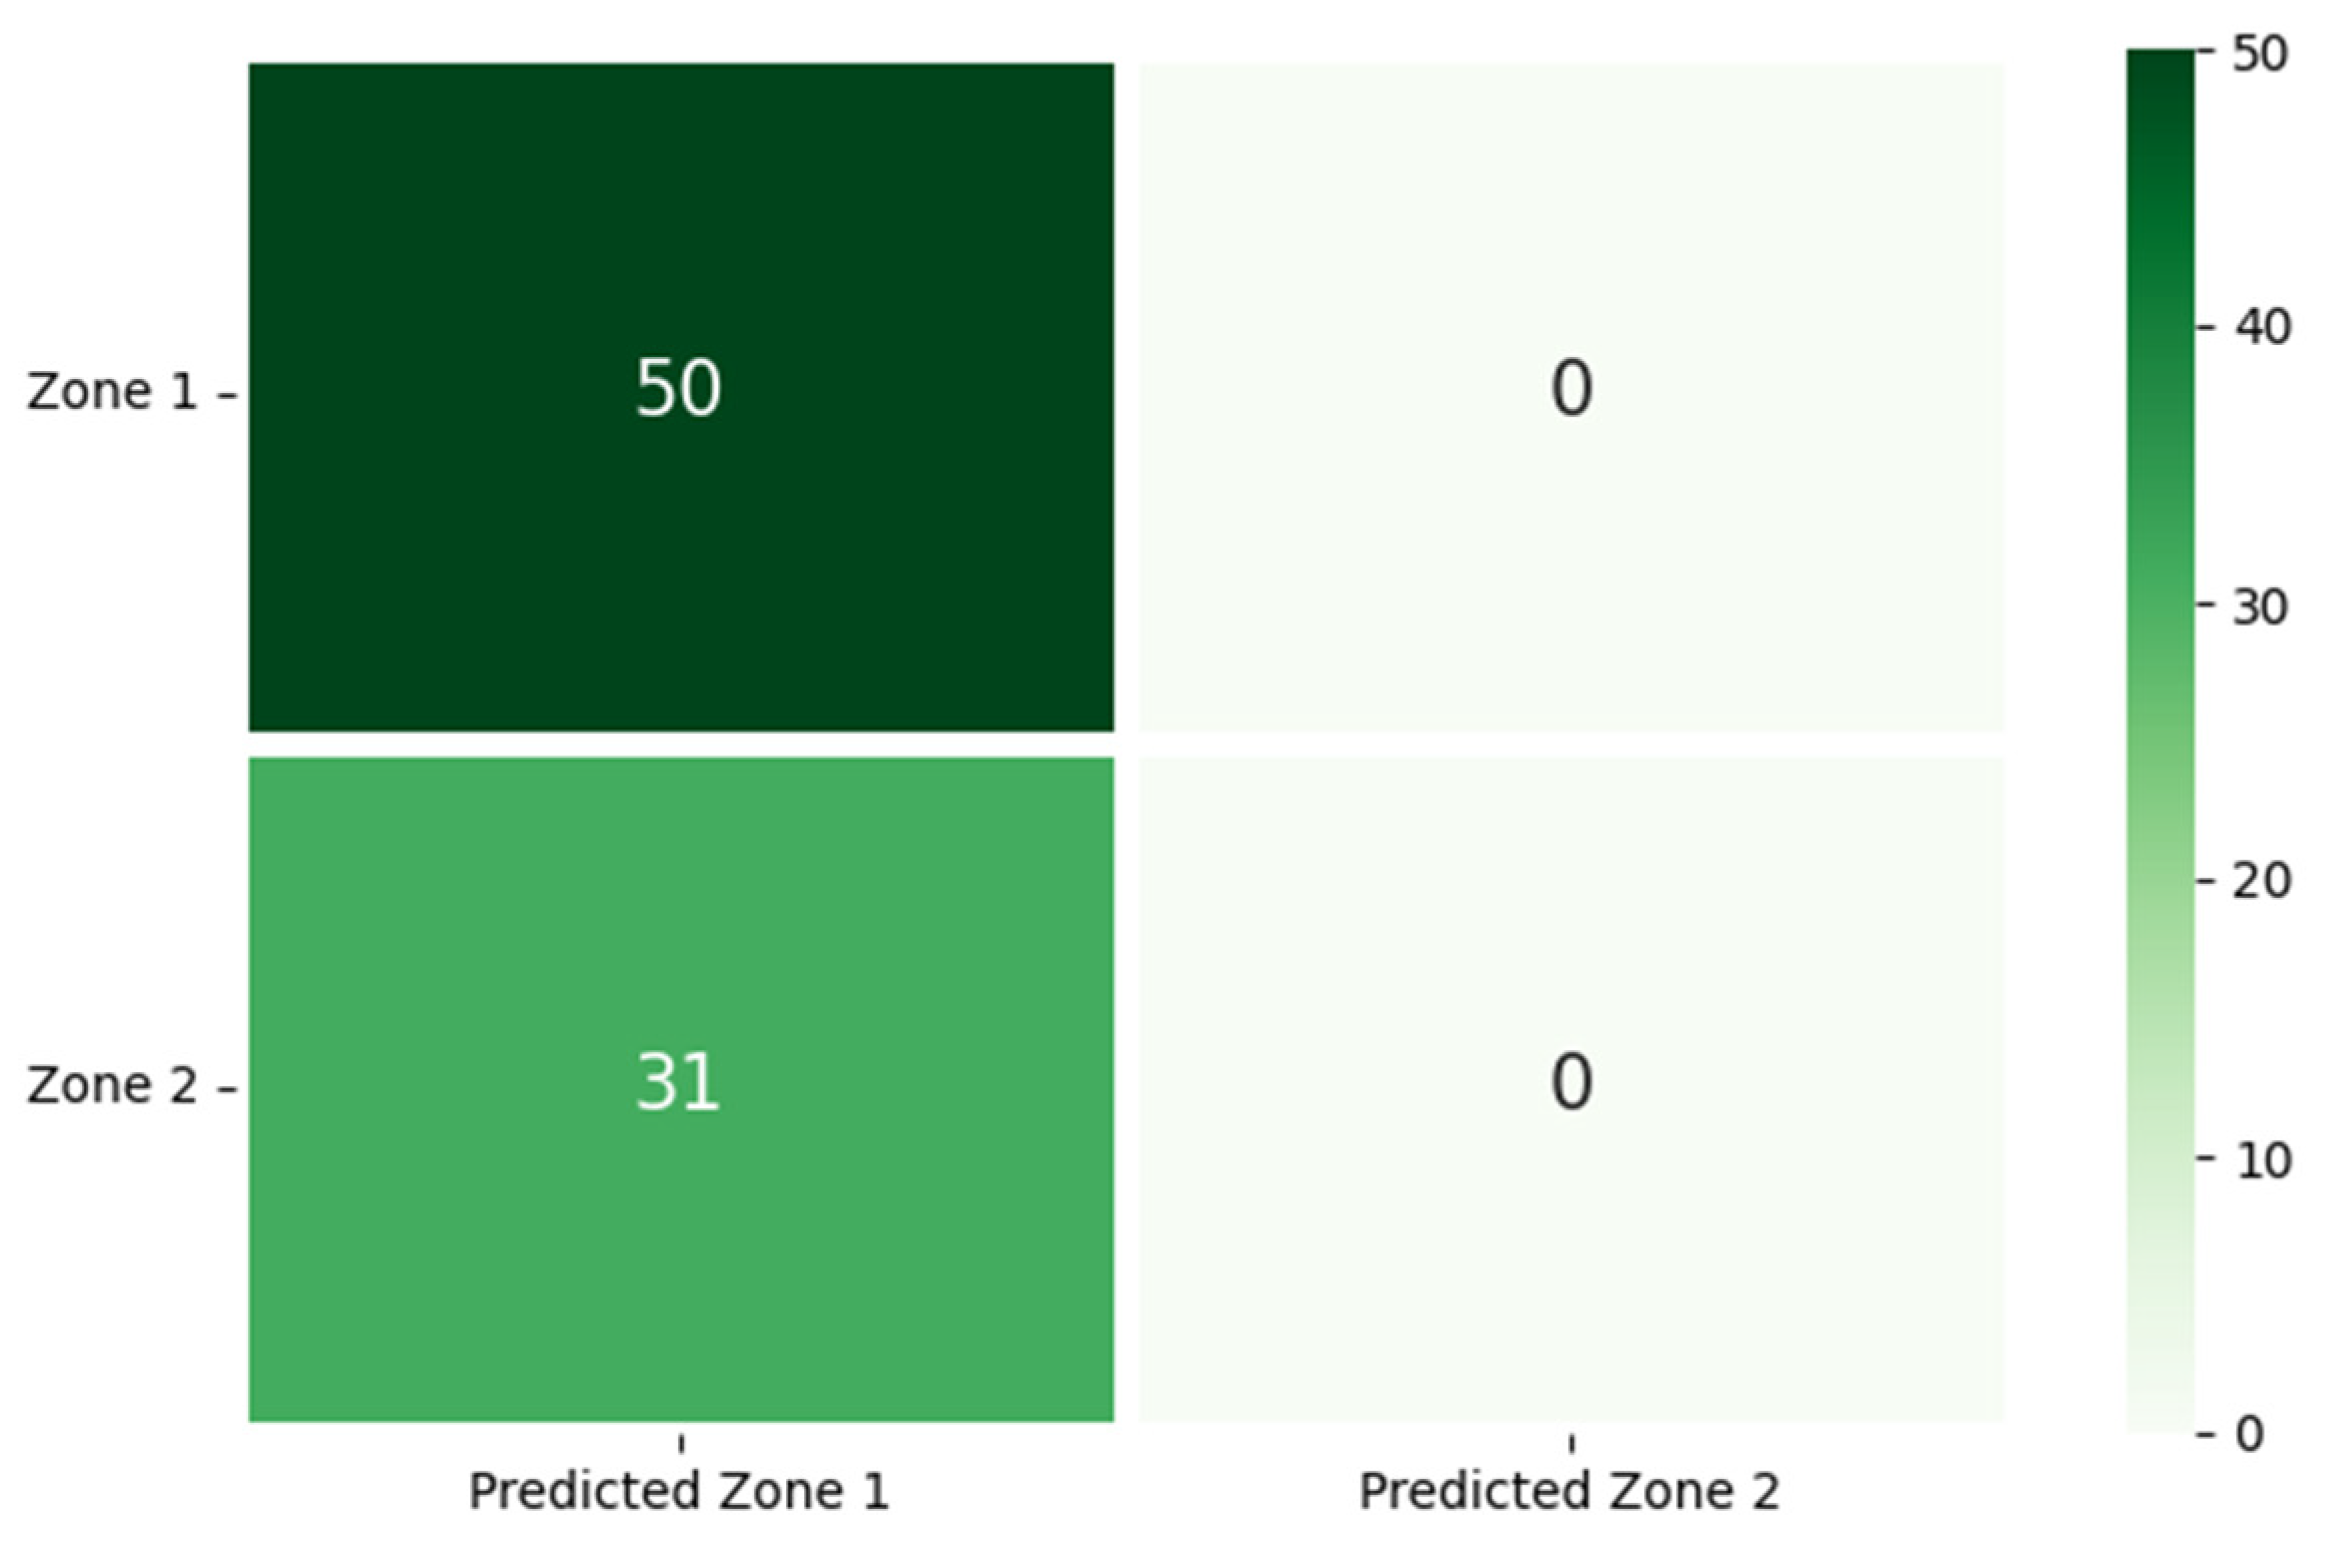
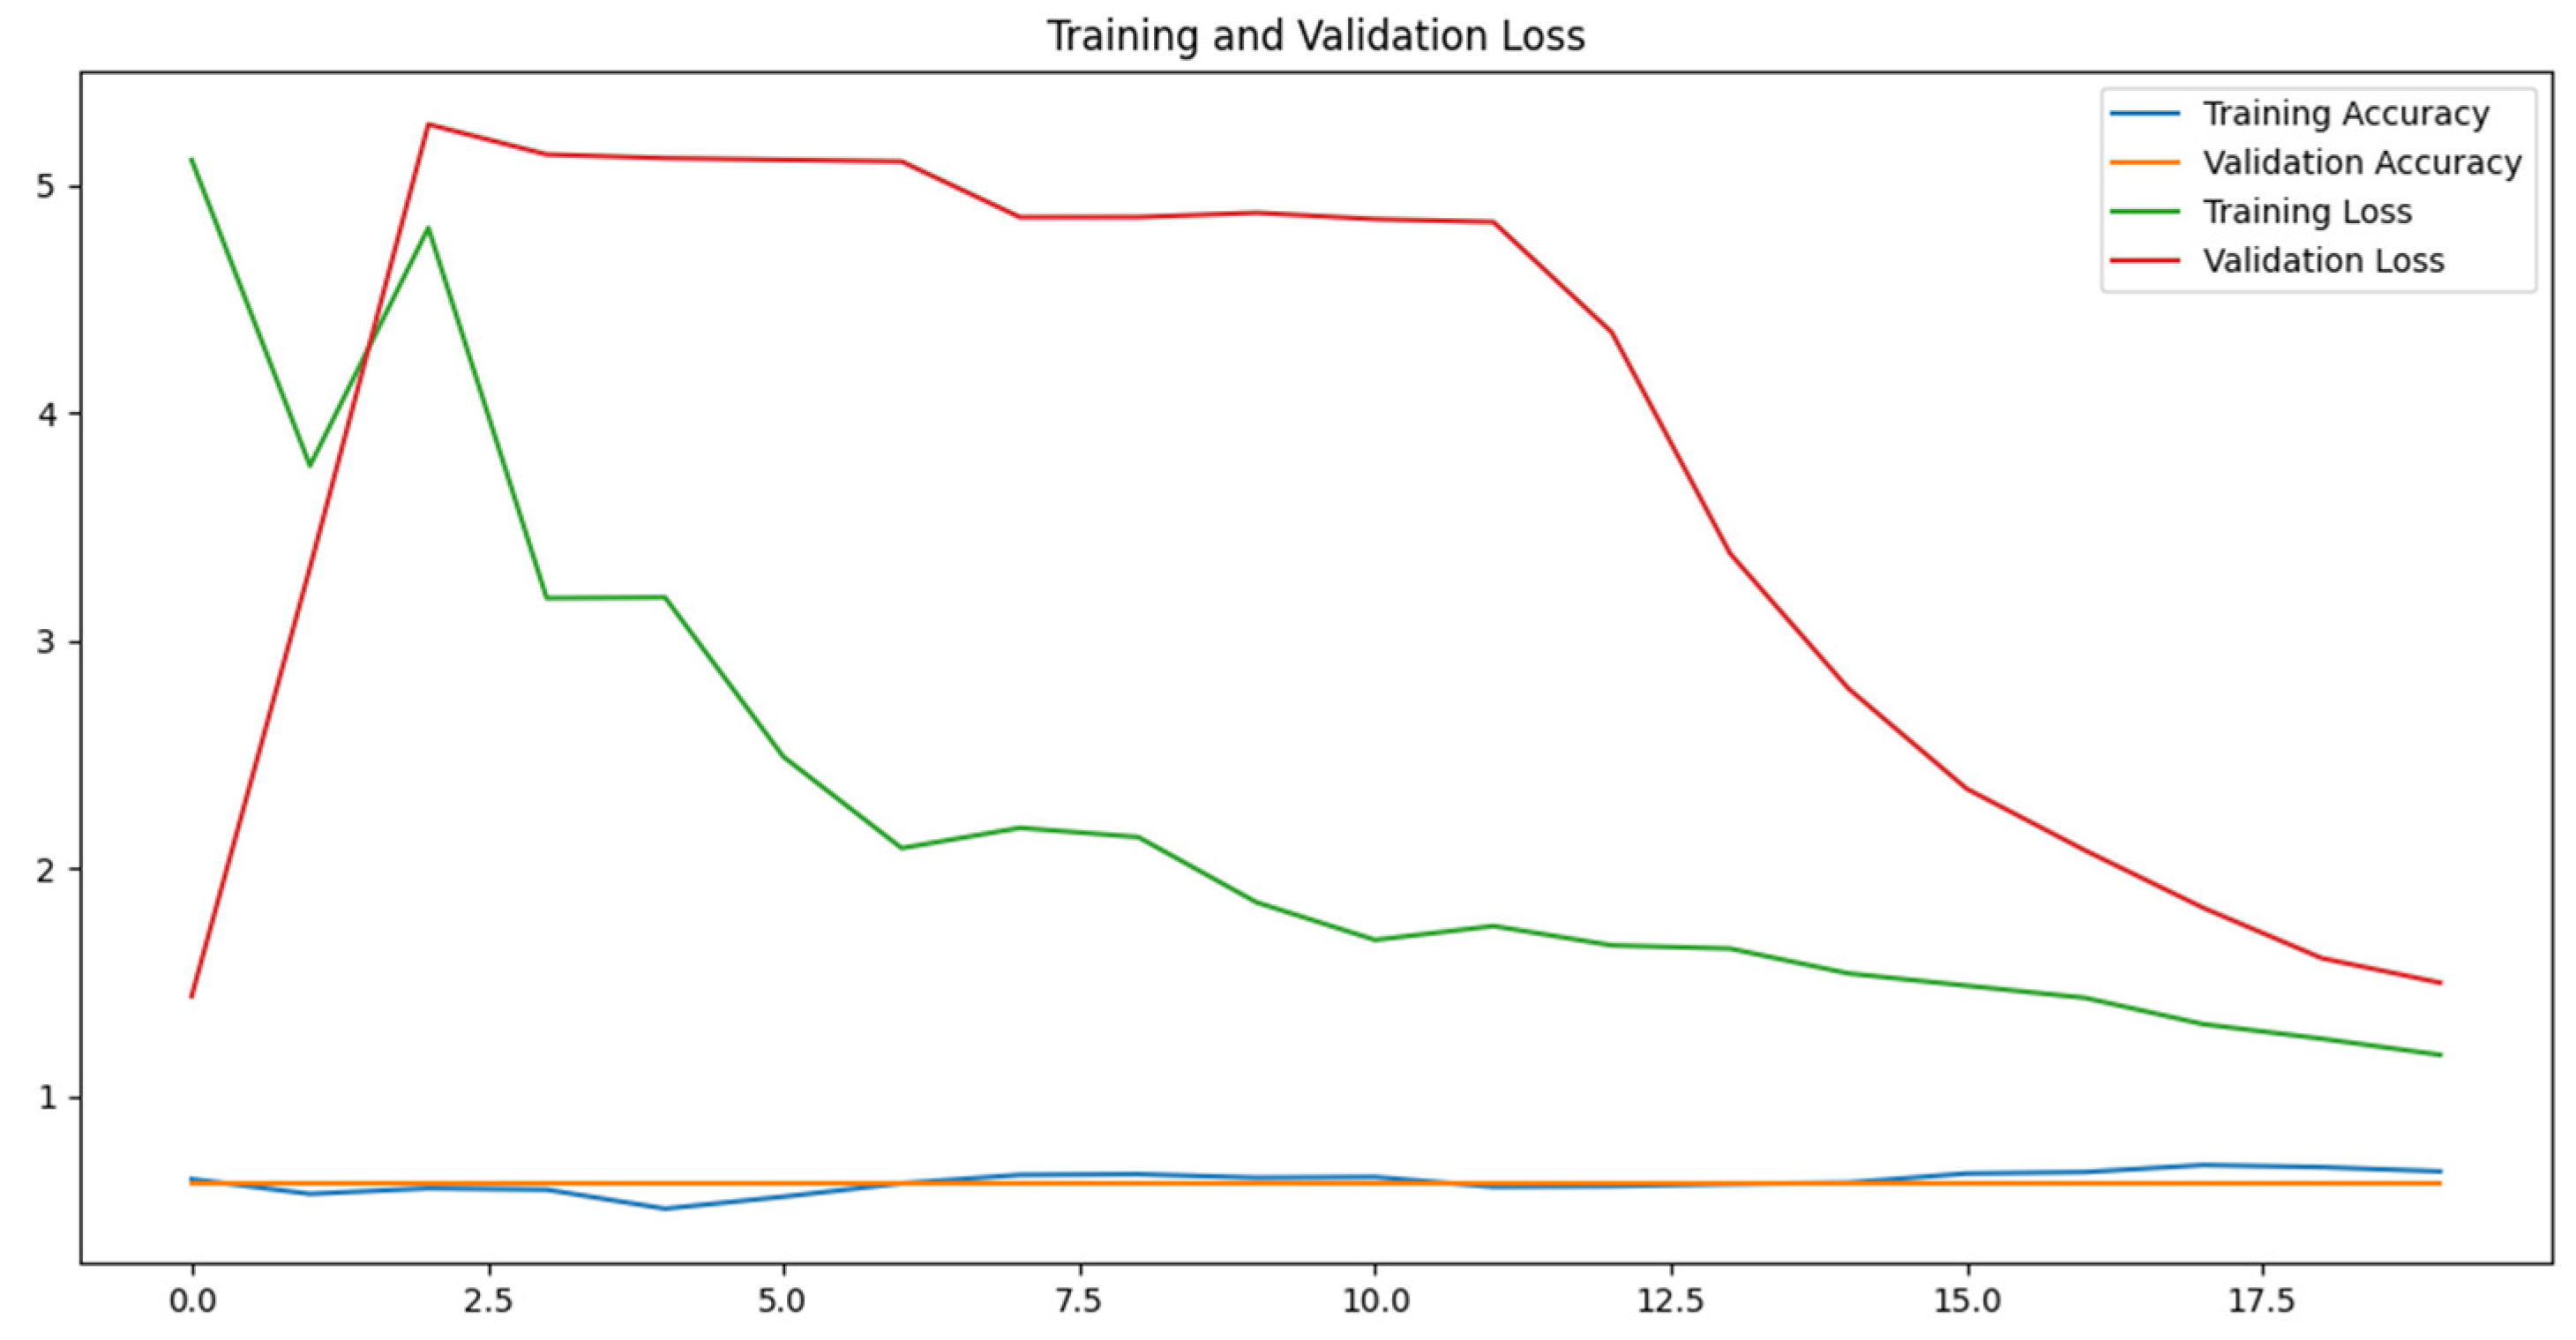
3.2. Artificial Neural Network

Table 3 summarizes the results obtained with the pressure residuals of the water distribution network. The model’s performance was awarded by the model’s confusion matrix, accuracy report, receiver operating curve, precision, recall, and F1-score. The table shows that the ANN classifier performed well, with a leakage localization and detection accuracy of 0.61, recall = 0.61, F1-score = 0.61, and precision = 0.61%.
Additionally, Figure 4 shows the model’s performance in leak detection and localization across each zone. The figure indicates the model’s performance in zone 1 and zone 2. For zone 1, the recall, precision, and F1-score results were 1.0, 0.61, and 0.76, respectively, while the zone 2 recall, precision, and F1-score results were 0.0, 0.0, and 0.0. When the artificial neural model is applied in the analysis of the data simulated from EPANET, the effect of uncertainty conditions corresponds to [−4,5] of the network, meaning that the demand uncertainty and noise level uncertainty also contributed in the overall performance of the classifier. The use of this classifier in leak localization across the zones is to provide possible leak locations within the water distribution network, which can be in several possible locations, and the magnitudes of such leaks are 30, 35, 40, 45 L/s for each node. Furthermore, the receiver operating curve (ROC) indicates the model’s performance regarding leak detection and localization. Figure 5 shows the model’s training history for accuracy, validation loss, model loss, validation accuracy, and training loss.

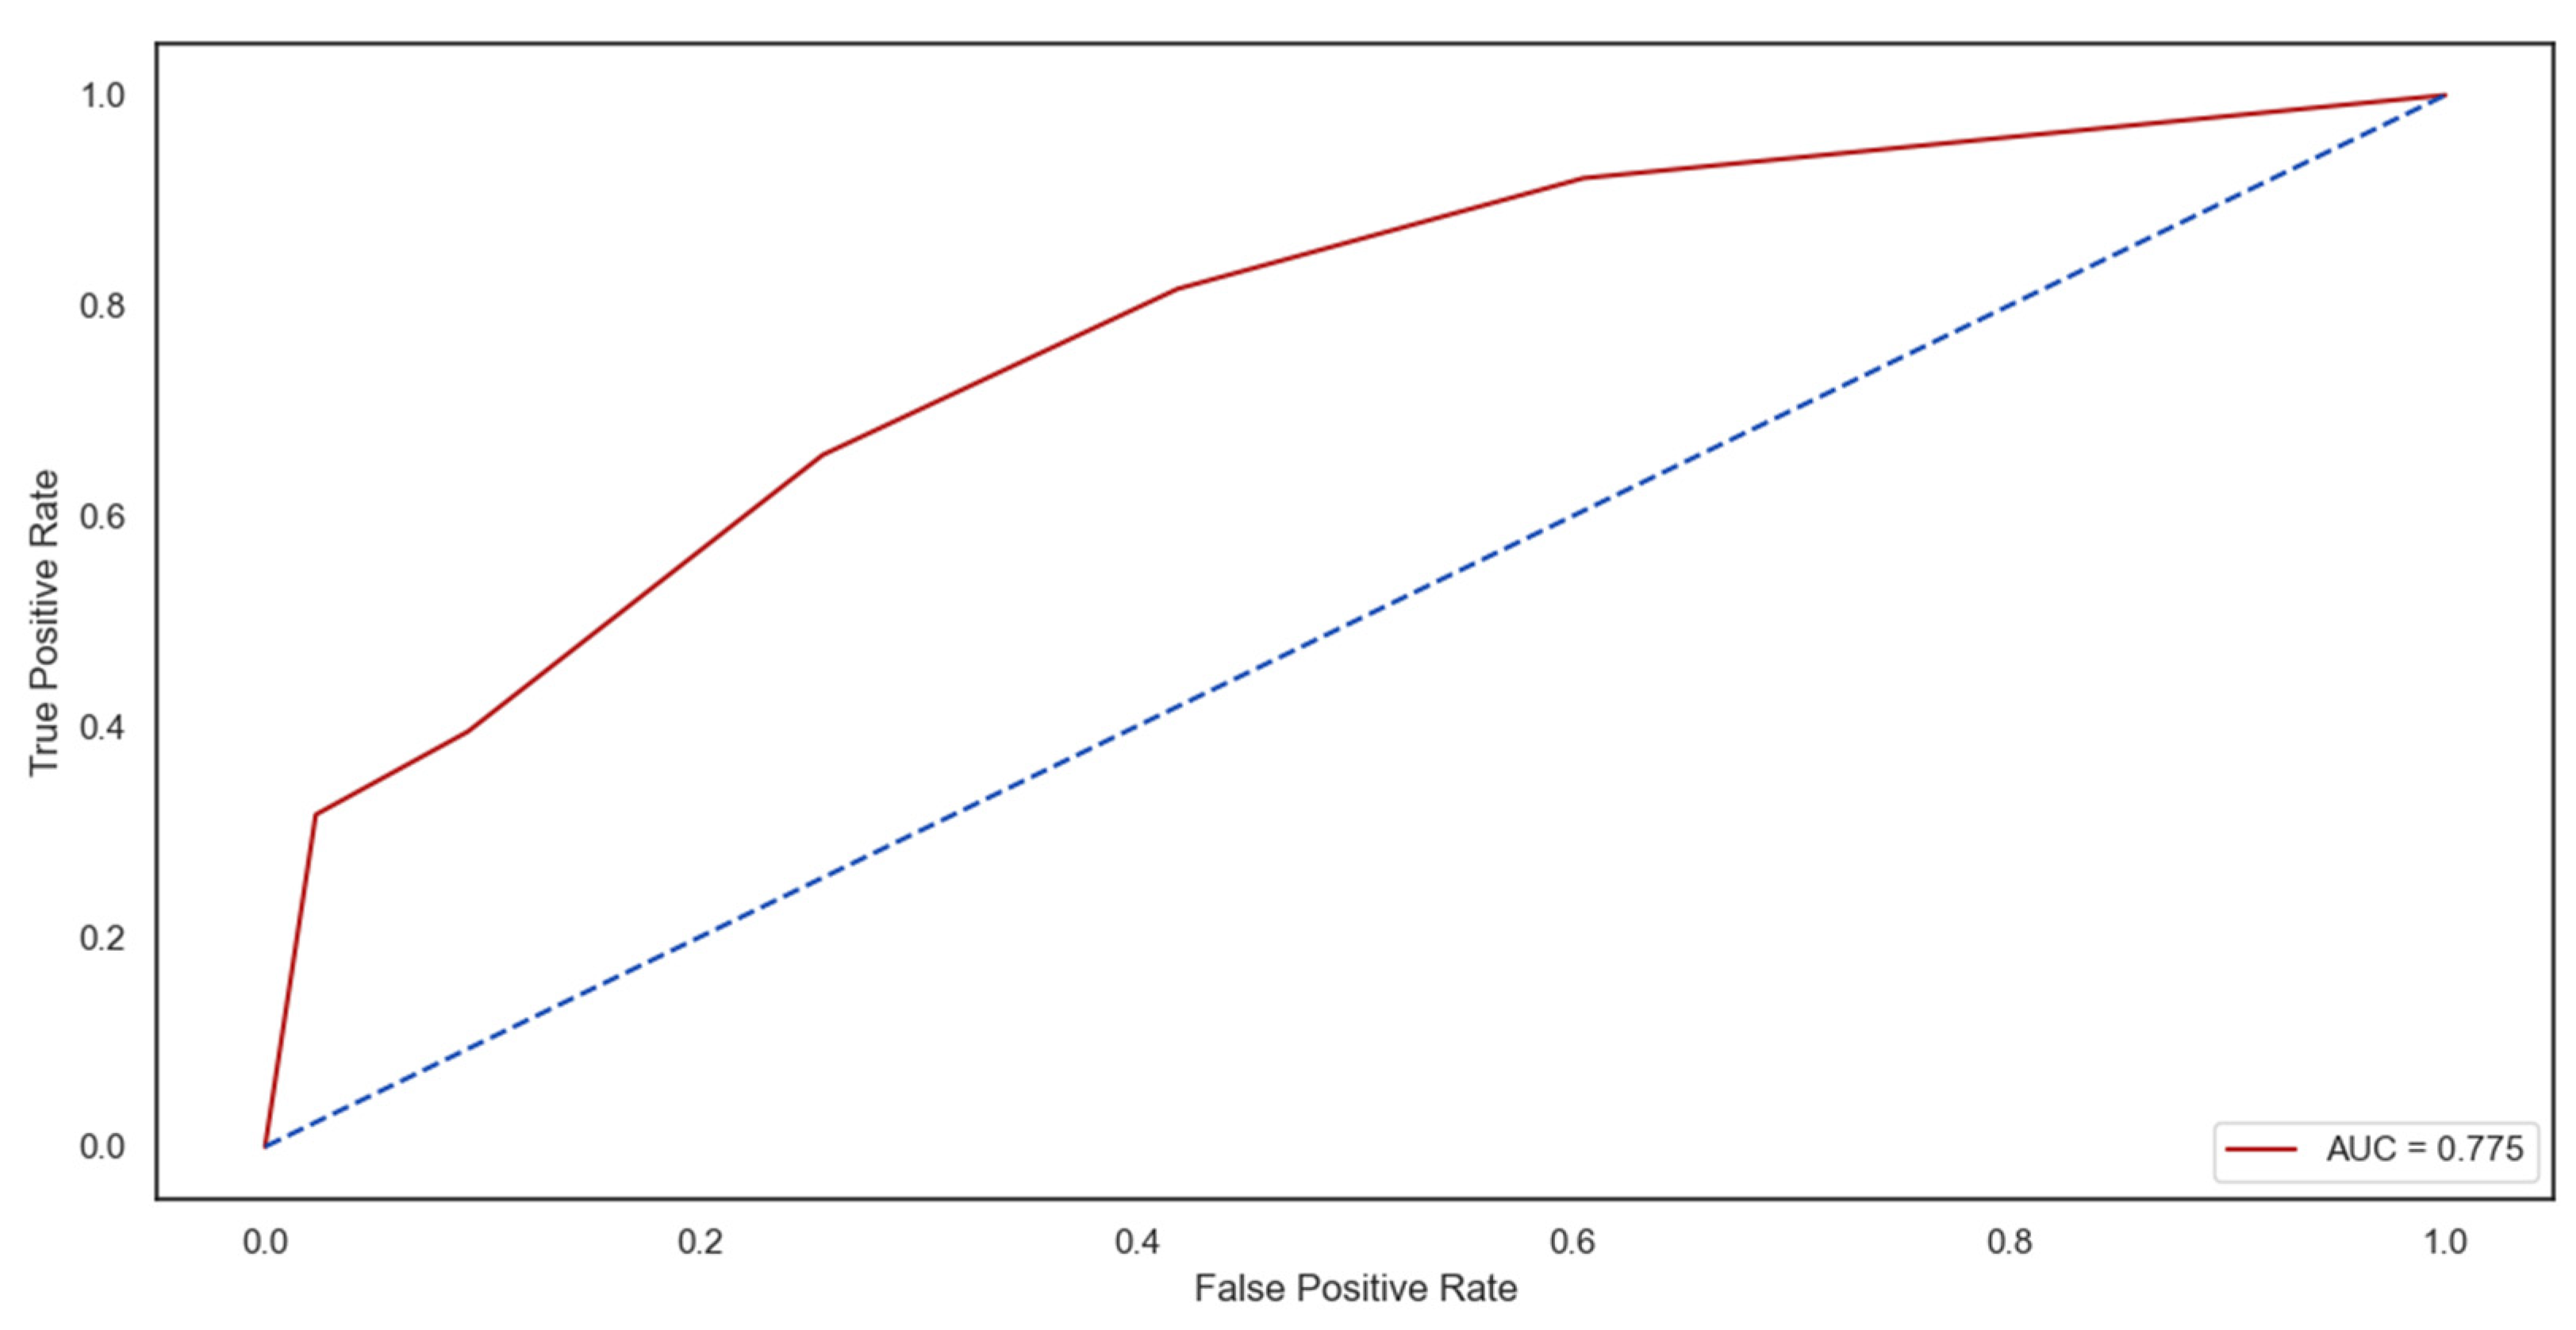
3.3. Support Vector Machine

In Table 4, the results of the validation of the model with the pressure residuals of the water distribution network for 20 epochs have been presented. Furthermore, the model performance was assessed and evaluated using its confusion matrix, accuracy report, receiver operating curve, precision, recall, and F1-score. This result is shown in Table 5, which reports the results of the SVM classifier, which gave an excellent performance, with a leakage localization and detection accuracy of 0.79, recall = 0.79, F1-score = 0.79, and precision = 0.79%.
Additionally, Figure 6 shows the model’s performance in leak detection and localization across each zone. The figure indicates the model’s performance in zone 1 and zone 2. For zone 1, the recall, precision, and F1-score results were 1.0, 0.70, and 0.82, respectively. In zone 2, the recall, precision, and F1-score results were 1.0, 0.61, and 0.76.
The application of the SVM classifier in the leak location process for the zones was adapted to provide possible leak locations within the water distribution pipeline. This can occur in several locations, and the magnitudes of such leaks are 30, 35, 40, and 45 L/s for each node. The effect of uncertainty conditions when modeling the network on EPANET was also considered; these uncertainty conditions, which correspond to [−4, 5] of the network, such as the demand and noise level uncertainty, also contributed to the overall performance of the classifier. Furthermore, the receiver operating curve (ROC) (Figure 7) indicates that the model has an area under the curve (AUC) of 0.821, which indicates the model’s excellent performance in leak detection and localization using the simulated dataset.

4. Conclusions

This paper presents a comparative study on using supervised machine learning classifiers to detect and localize leaks in a water distribution network; the network was divided into two hydraulic zones with leak scenarios in each zone. The capacity of three supervised machine learning classifier tools has been studied for leak detection and localization in the water distribution network of the University of Port Harcourt Choba campus. For the development of the three machine learning models, as well as for the training and testing of the model, the study employed the sklearn library, which is a machine learning analysis tool written in the Python programming language.
The literature shows that the studies applying machine learning models to water distribution network problems are still in the research stage. The research indicates that the combination of support vector machine, K-nearest neighbor, and artificial neural network machine learning techniques for leak detection have yet to be explored. This study contributed to closing this knowledge gap by advancing the deployment of a machine-learning model for detecting and localizing leaks in the water distribution system.
The data used in the training and testing of the models were generated using EPANET software, where uncertainty conditions for the water distribution network were also factored into simulating the network model on EPANET. The uncertainty conditions in the model development correspond to uncertainty of demand and leak noise [−4, 5]. The study showed the excellent performance of the support vector machine over K-nearest neighbor and the artificial neural network in leakage detection and localization when pressure residuals data were used. The results obtained from each model are based on a dataset generated from the EPANET software across the network nodes. The study did not cover the use of the selected machine learning models to determine the magnitude of the detected and localized leaks in the water distribution network. Future research should focus on adding fault warnings when a leak is discovered in the network, enhancing the study’s applicability. Also, in the future, researchers should consider evaluating the influence of sensor placement in a network, because the topology of the water distribution network was not considered in this analysis.

Author Contributions

C.U.O. and D.O.A. were involved in the conceptualization, methodology and analysis, validation, and writing and editing of the original draft. S.S. assist in the writing and editing of the original draft. All authors have read and agreed to the published version of the manuscript.

Funding

This research received no external funding.

Institutional Review Board Statement

Not applicable.

Informed Consent Statement

Not applicable.

Data Availability Statement

The datasets generated during and/or analyzed during the current study are available from the corresponding author on reasonable request.

Conflicts of Interest

All authors certify that they have no affiliations with or involvement in any organization or entity with any financial interest or non-financial interest in the subject matter or materials discussed in this manuscript.

References

  1. Romano, M.; Kapelan, Z.; Savić, D.A. Automated Detection of Pipe Bursts and Other Events in Water Distribution Systems. J. Water Resour. Plan. Manag. 2014, 140, 457–467. [Google Scholar] [CrossRef]
  2. Mckenzie, R.; Seago, C.; Square, B. Assessment of real losses in potable water distribution systems. Water Sci. Technol. Water Supply 2005, 5, 33–40. [Google Scholar] [CrossRef]
  3. Moser, G.; Paal, S.G.; Smith, I.F.C. Performance comparison of reduced models for leak detection in water distribution networks. Adv. Eng. Inform. 2015, 29, 714–726. [Google Scholar] [CrossRef]
  4. Robles, D.; Puig, V.; Ocampo-Martinez, C.; Garza-Castañón, L.E. Reliable fault-tolerant model predictive control of drinking water transport networks. Control Eng. Pract. 2016, 55, 197–211. [Google Scholar] [CrossRef]
  5. Cugueró-Escofet, M.; Quevedo, J.; Alippi, C.; Roveri, M.; Puig, V.; García, D.; Trovò, F. Model- vs. data-based approaches applied to fault diagnosis in potable water supply networks. J. Hydroinform. 2016, 18, 831–850. [Google Scholar] [CrossRef]
  6. Pérez, R.; Sanz, G.; Cugueró, M.À.; Blesa, J.; Cugueró, J. Parameter uncertainty modelling in water distribution network models. Procedia Eng. 2015, 119, 583–592. [Google Scholar] [CrossRef]
  7. Mannan, M.; Al-Ghamdi, S.G. Environmental impact of water-use in buildings: Latest developments from a life-cycle assessment perspective. J. Environ. Manag. 2020, 261, 110198. [Google Scholar] [CrossRef] [PubMed]
  8. Ben-Mansour, R.; Habib, M.A.; Khalifa, A.; Youcef-Toumi, K.; Chatzigeorgiou, D. Computational fluid dynamic simulation of small leaks in water pipelines for direct leak pressure transduction. Comput. Fluids 2012, 57, 110–123. [Google Scholar] [CrossRef]
  9. Yang, J.; Wen, Y.; Li, P. Leak location using blind system identification in water distribution pipelines. J. Sound Vib. 2008, 310, 134–148. [Google Scholar] [CrossRef]
  10. Abdulshaheed, A.; Mustapha, F.; Ghavamian, A. A pressure-based method for monitoring leaks in a pipe distribution system: A Review. Renew. Sustain. Energy Rev. 2017, 69, 902–911. [Google Scholar] [CrossRef]
  11. Salam, A.E.U.; Tola, M.; Selintung, M.; Maricar, F. Application of SVM and ELM Methods to Predict Location and Magnitude Leakage of Pipelines on Water Distribution Network. Int. J. Adv. Comput. Res. 2015, 5, 139–144. [Google Scholar]
  12. Soldevila, A.; Fernandez-Canti, R.M.; Blesa, J.; Tornil-Sin, S.; Puig, V. Leak localization in water distribution networks using Bayesian classifiers. J. Process Control 2017, 55, 1–9. [Google Scholar] [CrossRef]
  13. Sedki, A.; Ouazar, D. Hybrid particle swarm optimization and differential evolution for optimal design of water distribution systems. Adv. Eng. Inform. 2012, 26, 582–591. [Google Scholar] [CrossRef]
  14. Perfido, D.; Messervey, T.; Zanotti, C.; Raciti, M.; Costa, A. Automated Leak Detection System for the Improvement of Water Network Management. Proceedings 2016, 1, 28. [Google Scholar] [CrossRef]
  15. Mashhadi, N.; Shahrour, I.; Attoue, N.; El Khattabi, J.; Aljer, A. Use of Machine Learning for Leak Detection and Localization in Water Distribution Systems. Smart Cities 2021, 4, 1293–1315. [Google Scholar] [CrossRef]
  16. Lee, C.; Yoo, D. Development of Leakage Detection Model and Its Application for Water Distribution Networks Using RNN-LSTM. Sustainability 2021, 13, 9262. [Google Scholar] [CrossRef]
  17. Guo, G.; Liu, S.; Wu, Y.; Li, J.; Zhou, R.; Zhu, X. Short-Term Water Demand Forecast Based on Deep Learning Method. J. Water Resour. Plan. Manag. 2018, 144, 04018076. [Google Scholar] [CrossRef]
  18. Xu, X.; Wang, H.; Zhang, N.; Liu, Z.; Wang, X. Review of the Fault Mechanism and Diagnostic Techniques for the Range Extender Hybrid Electric Vehicle. IEEE Access 2017, 5, 14234–14244. [Google Scholar] [CrossRef]
  19. Kouziokas, G.N. SVM kernel based on particle swarm optimized vector and Bayesian optimized SVM in atmospheric particulate matter forecasting. Appl. Soft Comput. J. 2020, 93, 106410. [Google Scholar] [CrossRef]
  20. Akil, M.; Tittelein, P.; Defer, D.; Suard, F. Statistical indicator for the detection of anomalies in gas, electricity and water consumption: Application of smart monitoring for educational buildings. Energy Build. 2019, 199, 512–522. [Google Scholar] [CrossRef]
  21. Gautam, J.; Chakrabarti, A.; Agarwal, S.; Singh, A.; Gupta, S.; Singh, J. Monitoring and forecasting water consumption and detecting leakage using an IoT system. Water Sci. Technol. Water Supply 2020, 20, 1103–1113. [Google Scholar] [CrossRef]
  22. Liu, Y.; Ma, X.; Li, Y.; Tie, Y.; Zhang, Y.; Gao, J. Water pipeline leakage detection based on machine learning and wireless sensor networks. Sensors 2019, 19, 5086. [Google Scholar] [CrossRef] [PubMed]
  23. El-Zahab, S.; Abdelkader, E.M.; Zayed, T. An accelerometer-based leak detection system. Mech. Syst. Signal Process. 2018, 108, 58–72. [Google Scholar] [CrossRef]
  24. Zhang, Q.; Wu, Z.Y.; Zhao, M.; Qi, J.; Huang, Y.; Zhao, H. Leakage Zone Identification in Large-Scale Water Distribution Systems Using Multiclass Support Vector Machines. J. Water Resour. Plan. Manag. 2016, 142, 1–15. [Google Scholar] [CrossRef]
  25. Kang, J.; Park, Y.J.; Lee, J.; Wang, S.H.; Eom, D.S. Novel leakage detection by ensemble CNN-SVM and graph-based localization in water distribution systems. IEEE Trans. Ind. Electron. 2018, 65, 4279–4289. [Google Scholar] [CrossRef]
  26. Tao, T.; Huang, H.; Li, F.; Xin, K. Burst Detection Using an Artificial Immune Network in Water-Distribution Systems. J. Water Resour. Plan. Manag. 2014, 140, 1–10. [Google Scholar] [CrossRef]
  27. Aksela, K.; Aksela, M.; Vahala, R. Leakage detection in a real distribution network using a SOM. Urban Water J. 2009, 6, 279–289. [Google Scholar] [CrossRef]
  28. Wu, Y.; Liu, S.; Wu, X.; Liu, Y.; Guan, Y. Burst detection in district metering areas using a data driven clustering algorithm. Water Res. 2016, 100, 28–37. [Google Scholar] [CrossRef]
  29. Poulakis, Z.; Valougeorgis, D.; Papadimitriou, C. Leakage detection in water pipe networks using a Bayesian probabilistic framework. Probabilistic Eng. Mech. 2003, 18, 315–327. [Google Scholar] [CrossRef]
  30. Soldevila, A.; Blesa, J.; Tornil-Sin, S.; Duviella, E.; Fernandez-Canti, R.M.; Puig, V. Leak localization in water distribution networks using a mixed model-based/data-driven approach. Control Eng. Pract. 2016, 55, 162–173. [Google Scholar] [CrossRef]
  31. Bermúdez, J.R.; López-Estrada, F.R.; Besançon, G.; Torres, L.; Santos-Ruiz, I. Leak-Diagnosis Approach for Water Distribution Networks based on a k-NN Classification Algorithm. IFAC-PapersOnLine 2020, 53, 16651–16656. [Google Scholar] [CrossRef]
  32. Henshaw, T.; Nwaogazie, I.L. Improving water distribution network performance: A comparative analysis. Pencil Pub. Phys. Sci. Eng. 2015, 1, 21–33. [Google Scholar]
  33. Quiñones-Grueiro, M.; Lázaro, J.M.B.-D.; Verde, C.; Prieto-Moreno, A.; Llanes-Santiago, O. Comparison of Classifiers for Leak Location in Water Distribution Networks. IFAC-PapersOnLine 2018, 51, 407–413. [Google Scholar] [CrossRef]
  34. Hashim, H.; Ryan, P.; Clifford, E. A statistically based fault detection and diagnosis approach for non-residential building water distribution systems. Adv. Eng. Inform. 2020, 46, 101187. [Google Scholar] [CrossRef]
  35. Zhang, S.; Cheng, D.; Deng, Z.; Zong, M.; Deng, X. A novel kNN algorithm with data-driven k parameter computation. Pattern Recognit. Lett. 2018, 109, 44–54. [Google Scholar] [CrossRef]
Figure 1. EPANET hydraulic model of the University of Port Harcourt Choba campus with 17 pipes and 15 node junctions.
Applsci 14 01620 g001
Figure 2. Confusion table showing the detection and localization of leak events across the two leak zones by the K-NN model.
Applsci 14 01620 g002
Figure 3. ROC curves for K-nearest neighbor simulation, showing that the curves have an AUC of 0.775.
Applsci 14 01620 g003
Figure 4. Confusion table showing the detection and localization of leak events across the two leak zones using an ANN model.
Applsci 14 01620 g004
Figure 5. ROC curves for artificial neural networks, which shows the model’s training accuracy, validation accuracy, training loss, and validation loss.
Applsci 14 01620 g005
Figure 6. Confusion table showing the detection and localization of leak events across the two leak zones by SVM model.
Applsci 14 01620 g006
Figure 7. The ROC curve for a support vector machine with an AUC of 0.821.
Applsci 14 01620 g007
Table 1. Candidate leak zones used for the generation of the dataset for model training.
ZoneCandidate Leak Nodes in the Network for Each Zone
Zone 1
(8 candidate leak nodes)
N d 4 ,   N d 5 ,   N d 3 ,   N d 7 , N d 9 ,   N d 8 ,   N d 11 ,   N d 13
Zone 2
(7 candidate leak nodes)
N d 14 ,   N d 17 ,   N d 12 ,   N d 15 ,   N d 16 ,   N d 10 ,   N d 6
Table 2. Classification report for the K-nearest neighbor model.
MethodAccuracyPrecisionRecallF1-Score
K-nearest neighbor0.700.700.700.70
Table 3. Classification report for the artificial neural network model.
MethodAccuracyPrecisionRecallF1-Score
Artificial neural network0.610.610.610.61
Table 4. Shows the validation loss and accuracy history of the data being analyzed by the neural network.
Epoch NumberStepLossAccuracyValidation LossValidation Accuracy
12 s 2 s/step5.10780.63891.44090.6173
20 s 48 ms/step3.76680.57413.32020.6173
30 s 53 ms/step4.81010.59885.26380.6173
40 s 52 ms/step3.18660.59265.13190.6173
50 s 52 ms/step3.18950.50935.11570.6173
60 s 48 ms/step2.4911056175.10880.6173
70 s 49 ms/step2.09020.62045.10100.6173
80 s 49 ms/step2.09020.65744.85670.6173
90 s 49 ms/step2.13850.66054.85710.6173
100 s 51 ms/step1.85210.64514.87610.6173
110 s 59 ms/step1.68770.64814.84810.6173
120 s 51 ms/step1.74860.60494.83590.6173
130 s 52 ms/step1.68390.60804.35220.6173
140 s 60 ms/step1.64970.61733.38230.6173
150 s 51 ms/step1.54070.62352.79010.6173
160 s 48 ms/step1.48710.66362.35020.6i73
170 s 43 ms/step1.43360.66982.08010.6173
180 s 47 ms/step1.31820.70061.82800.6173
190 s 45 ms/step1.25440.69141.60760.6173
200 s 49 ms/step1.18360.67281.49990.6173
Table 5. Classification report of the support vector machine.
MethodAccuracyPrecisionRecallF1-Score
Support vector machine0.790.790.790.79
Disclaimer/Publisher’s Note: The statements, opinions and data contained in all publications are solely those of the individual author(s) and contributor(s) and not of MDPI and/or the editor(s). MDPI and/or the editor(s) disclaim responsibility for any injury to people or property resulting from any ideas, methods, instructions or products referred to in the content.

