1. Introduction
Understanding human cognitive capabilities and limitations in work environments are the essential objectives and main requirements specified by the International Labor Organization (ILO) for the design and management of work systems [
1,
2]. Among the cognitive determinants that proficiently influence human behavior are some factors pertaining to knowledge and strategic considerations. These factors play a pivotal role in realizing the primary objectives of a given task despite the conflicting demands and attentional fluctuations that govern the allocation of cognitive resources. The concept of situational awareness (SA) is relevant in the realm of the aforementioned attentional dynamics [
3].
“SA refers to the perception of the elements in the environment within a volume of time and space, the comprehension of their meaning and the projection of their status of the near future” [
4]. This domain encompasses the examination of diverse cognitive mechanisms, including the discernment of surroundings, assimilation of information, and anticipation of choices. From the viewpoint of human factors engineering (HFE), SA emerges as a focal point within an expansive realm of investigation pertaining to interactive human–machine systems [
5,
6].
SA may be assessed through both subjective and objective methodologies. In the former type, evaluations by observers or self-assessments by participants constitute the primary metrics; an example is the utilization of the situational awareness rating technique. In the latter type, freeze-probe methods are commonly used. In this latter approach, participants are prompted to respond to a series of queries at a specific juncture during task execution; the task is then momentarily suspended, with or without prior notification, and the provided responses are juxtaposed with the prevailing circumstances; an example of a freeze-probe method is the situational awareness global assessment technique. Eye tracking is another objective technique that is conducive to real-time participant analysis and involves physiological measurements.
Eye tracking has been extensively employed for quantifying human performance and behavior. It presents a promising and viable alternative for appraising SA, and it can overcome the constraints associated with alternate approaches. This technique offers the distinct advantage of facilitating real-time measurements or assessments within simulated contexts while minimizing disruptions [
7]. It mitigates problems such as participants resorting to long-term memory utilization, which is encountered in freeze-probe methods, to elucidate subtasks or elaborate on task-specific details [
8]. Eye tracking is one of the most commonly used techniques in SA research [
9].
In HFE, operational difficulties can occur during an activity when SA is lost or when mental breakdowns occur during complex tasks [
3]. SA assumes a pivotal role in the examination of performance in intricate tasks. It is characterized by the swift assimilation of stimuli and environmental information, coupled with the demand for long-term memory utilization. Thus, SA plays a particularly salient role in scenarios marked by persistent disruptions that originate from shifting surroundings and necessitate a discerning decision-making process about impending events. An important example of such multifaceted tasks is the act of driving [
5,
10,
11,
12].
SA has received immense attention over the past years in different fields of study, particularly in the field of driving [
5,
13]. The cognitive functioning and measurement of the SA is a key field of study of the performance and behavior of drivers. For instance, a previous study reported that 87.5% of drivers identified distracted driving as a greater concern compared to the past, while 87.9% perceived drowsiness as a safety threat [
14].
The utilization of an eye-tracking device is a prevalent and extensively employed methodology for quantifying user performance and behavior. This technology facilitates capturing the human eye movement via pupillometry and a dedicated sensor; thus, the gaze points that signify the focal points within a given stimulus environment are recorded. This mechanism further permits quantification of the frequency of gaze point registrations per unit of time and is often measured in gaze points per second [
15,
16,
17].
Eye tracking has been commonly used to identify the area of interest (AOI) of the gaze, behavior, and attention of drivers. In naturalistic driving, eye tracking has been used by harvester operators in the field of forestry and to track mine workers and train traffic monitoring; it has also been applied in autonomous vehicles [
18]. Simulation driving presents boundless opportunities to measure the three levels of SA using, for instance, remotely controlled cars, commercial vehicles, autonomous vehicles, truck platooning, and crawler and wheeled excavators.
Considering the lacunae in research on the relation between eye-tracking metrics and SA in the domain of driving, this study conducted a novel approach to this domain. The principal aim was to provide a substantive contribution to this field of study by elucidating the discernible relationship between eye-tracking metrics and SA in the context of driving, as well as the principal eye-tracking devices used, experimental designs, and a discussion.
The rest of the paper is organized as follows:
Section 2 describes the methodology used for selecting the studies for review, the exclusion criteria, and the information that was extracted for this review.
Section 3 discusses scientometric and demographic analyses, the physiological measures and oculomotor events, experimental environments, definitions and types of eye trackers, and the relationship between SA and eye tracking in the field of driving. The final section concludes the article.
2. Materials and Methods
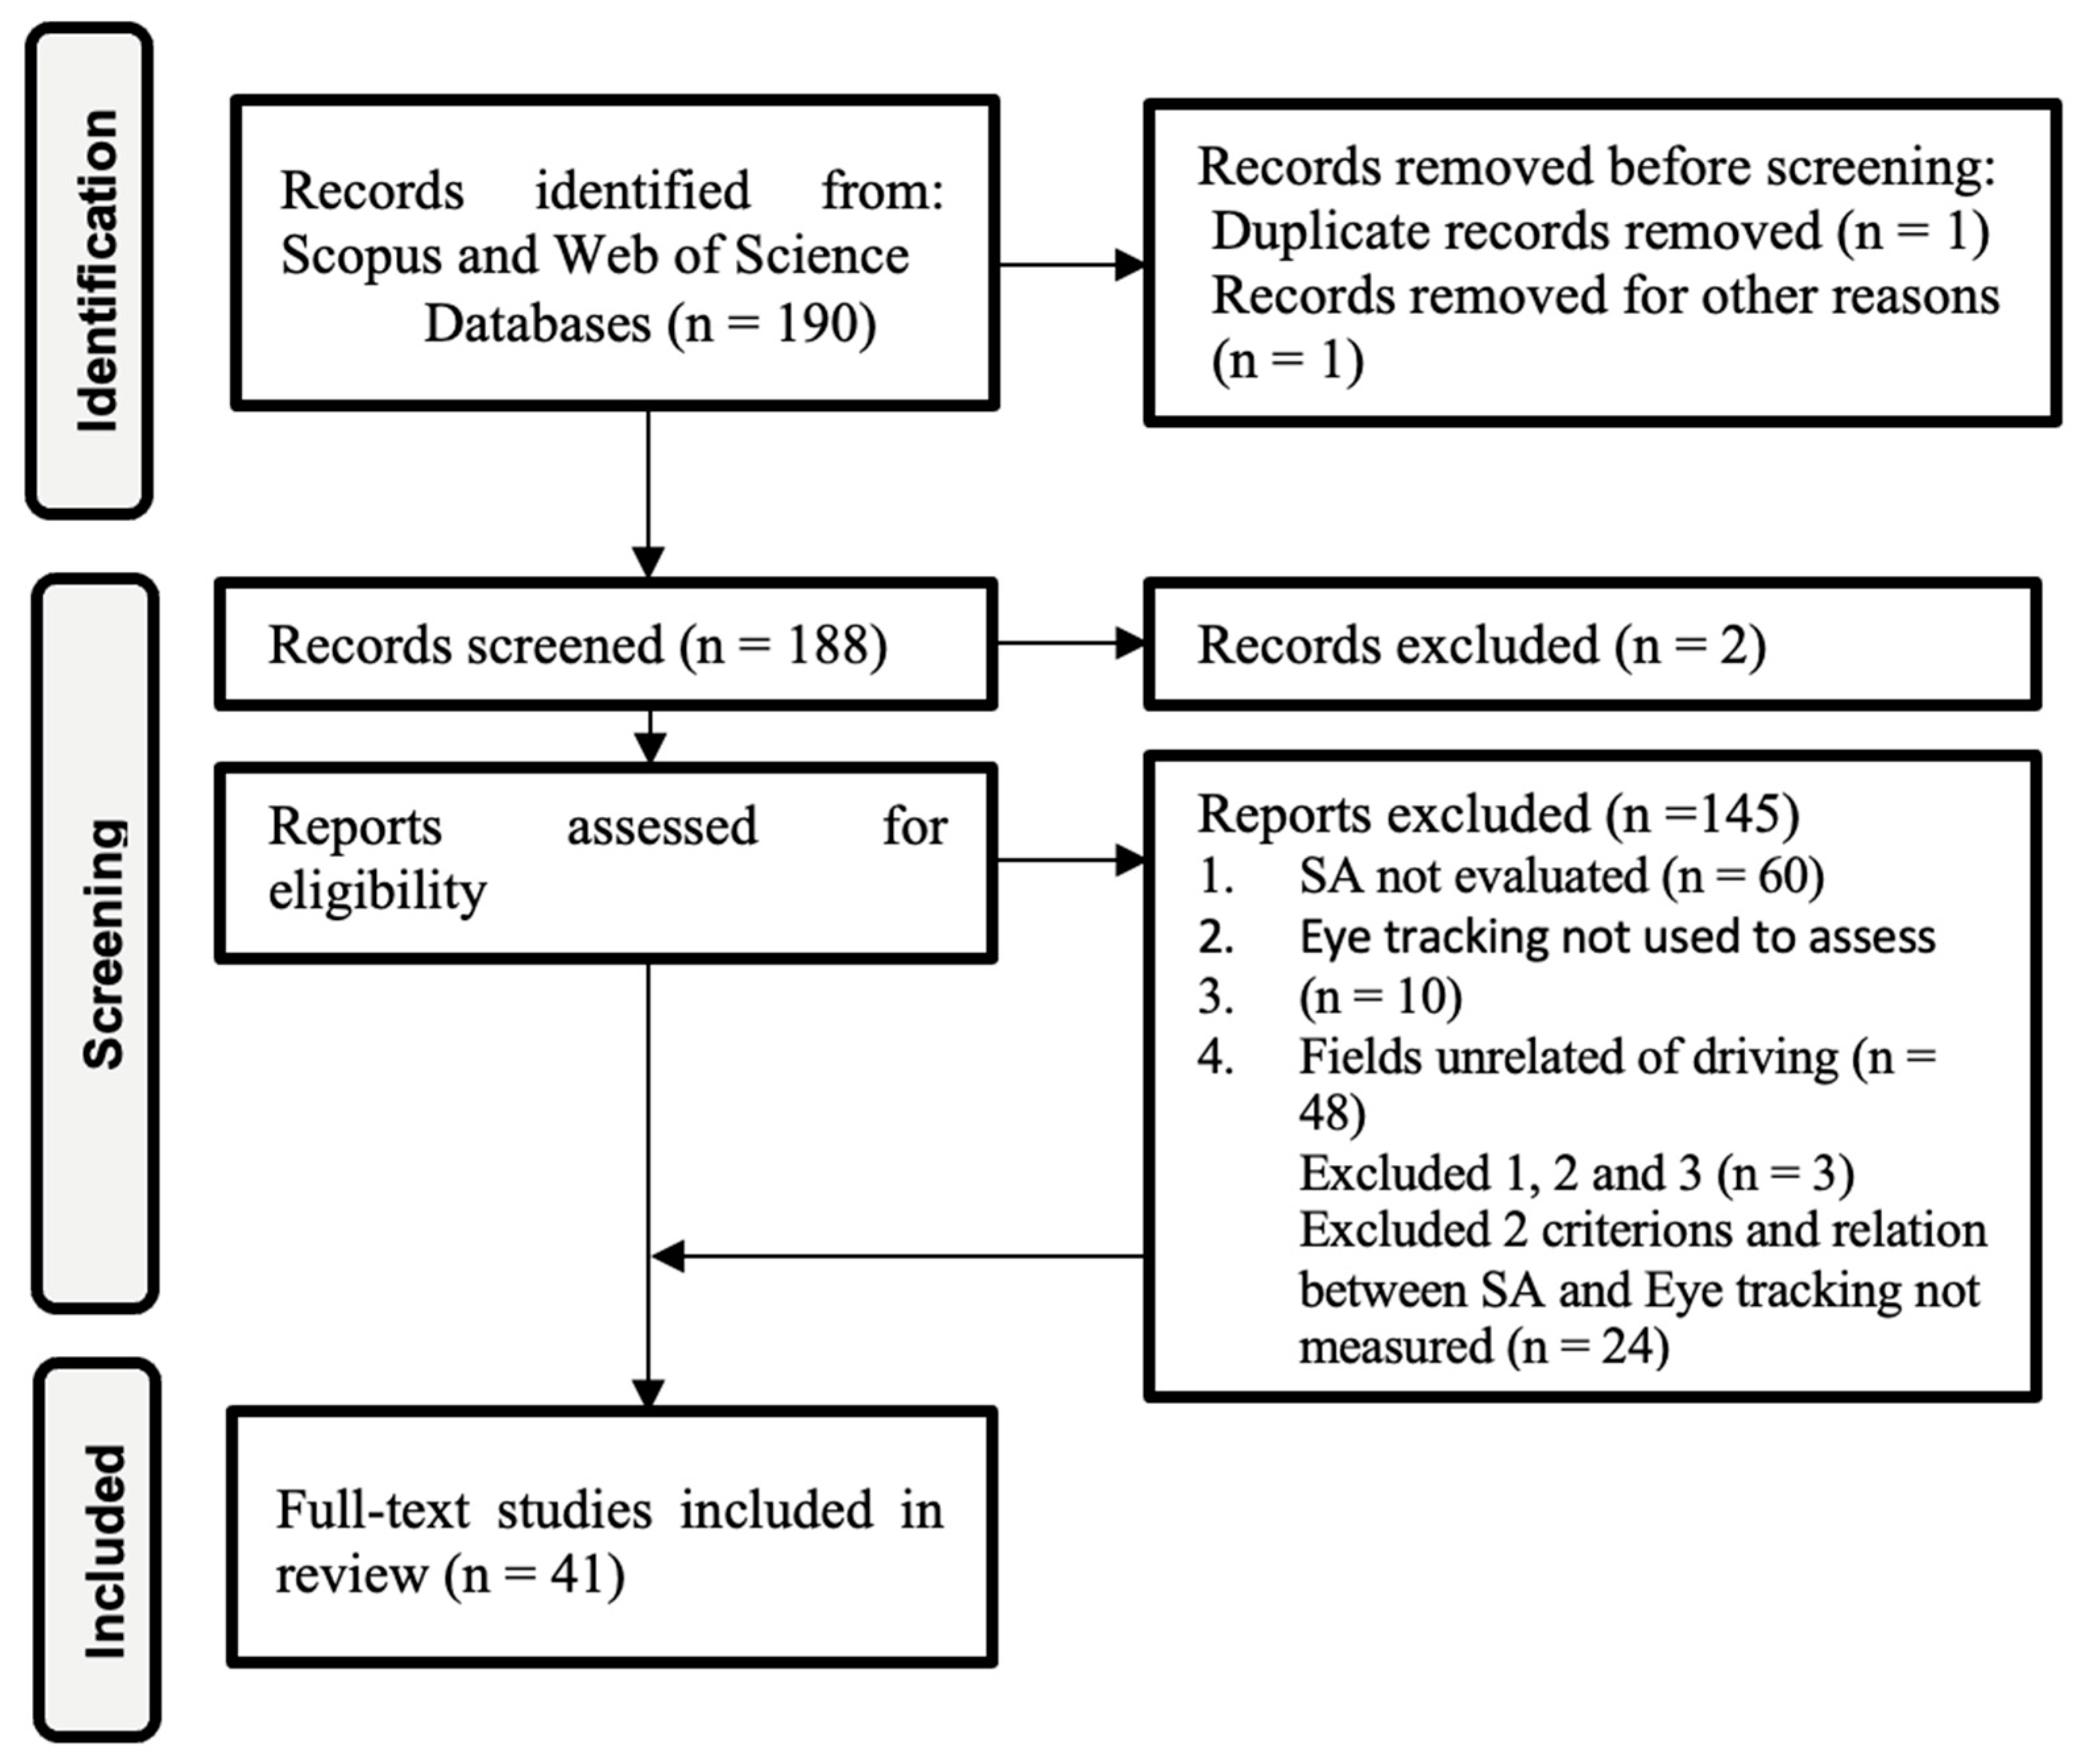
For this review, this study performed a systematic and descriptive analysis to identify the most relevant literature. The methodology employed in selecting noteworthy studies is graphically depicted in
Figure 1. The review comprises three phases: identification, screening, and inclusion of records. In the first phase of identification, the preliminary search generated a list of 190 documents, and two records were removed before screening. In this phase, the strategy involved formulating a guiding question to facilitate the identification, evaluation, and synthesis of research in the domain of driving while assessing its relevance throughout the review process. The search strategy employed allowed us to potentially identify as many eligible studies as possible. In identification phase, all reviewers actively participated in determining the eligibility of a record for inclusion in the review. Scopus and Web of Science databases were systematically queried to source a spectrum of the current research, encompassing diverse domains and potential areas of inquiry [
19].
To curate the search terms for the databases, we adopted a bifurcated approach. First, the recent literature review of [
9] was used to extract multiple variations and acronyms of the keyword “situational awareness”, i.e., “SA”, “situation awareness” and “awareness state”; similarly, for the second keyword, i.e., “eye-tracking”, we used multiple variations: “eye-tracking”, “eye-tracker”, “eye movements”, “gaze patterns”, “eye moves”, “eye track”, and “gaze behavior” (including those that assess visual attention, gaze behavior, and perception).
Psychological measurements or data obtained from humans by using sensors [
9] and oculomotor events were defined and classified based on the recent reviews by [
9,
21].
Second, we focused on keywords covering the scope of study delineated in this review—specifically, the domain of driving. Hence, we considered terms such as “driving”, “drive”, “drives”, “automobilist”, “chauffeur”, and “vehicle operator”, among others, across contexts that included autonomous, semiautonomous motor, commercial, and heavy vehicles, within the realms of both naturalistic driving and driving simulation. The terminology “naturalistic driving” refers to experiments conducted in authentic field settings, while “driving simulation” refers to experiments conducted via laboratory simulations or virtual reality. To facilitate the bibliographic exploration within the databases, the Boolean operators “AND” and “OR” were judiciously employed.
For the screening phase, 188 reports were assessed for eligibility, and the citations and bibliographical information, abstracts, and keywords were extracted and screened. The following inclusion criteria were used: articles dealing with (1) assessment of SA in humans, (2) assessment of SA with eye tracking (these may contain additional assessment tools, i.e., questionnaires, encephalograms, etc.), and (3) application of assessment of SA in the domain of driving. Restrictions on eligibility criteria, such as language, were considered; only records in English were kept in the sample, and access restrictions (publication status) were considered.
Furthermore, we used the following exclusion criteria: (1) SA was not evaluated; instead, only the stress or mental workload was measured. However, these articles were included if they measured a psychological variable other than SA. (2) Eye tracking was not used to assess SA. (3) The study pertained to fields unrelated to driving. Throughout this phase, all reviewers participated in addressing selection bias as part of adherence to eligibility criteria. Any disagreements regarding adherence were reviewed and discussed among the reviewers to reach consensus. Similarly, an author took samples from the excluded records to verify that the eligibility criteria had been applied correctly. Records selected were organized in an Excel spreadsheet and shared with the author reviewers for subsequent reading. In total, 145 reports were excluded, and 41 documents were selected for full-text review. In the review, each selected document was studied, and the following information was extracted:
Citation and bibliographical information, keywords, and sources (for the scientometric analysis);
Demographic information of the experiments, i.e., sample size, gender, age, and the field of application;
Eye-tracking metrics and oculomotor events;
Experimental environment, i.e., naturalistic driving or driving simulation
Type of eye trackers used;
Discussion of the relationship between SA and eye tracking in the context of driving.
The selected papers were managed using Mendeley Reference Manager. To conduct the citation in the desired style, the Zotero Reference Manager was employed. Furthermore, in the final stages of the review, we included three records through the use of additional search query combinations for a total of 41 documents selected for full-text review. Throughout this phase, the review authors actively engaged in independent reading of the articles and shared their findings during meeting sessions to resolve discrepancies.
In the total documents selected for a full-text review, efforts were made to ensure that the collected data were sufficient for both the review authors and readers, aligning the extracted information with the research question. Additionally, all data were systematically collected and cataloged in an Excel spreadsheet for easy reference.
3. Results
A total of 41 reports were selected for this literature review. These pertained to various topics such as the evaluation of SA, use of eye tracking, main physiological variables measured in gaze behavior, and experimental designs. Furthermore, these reports also describe the methodologies that revealed patterns in the three levels of SA.
3.1. Scientometric Analysis
Based on the analysis of the 41 documents selected for full-text review and using the freely accessible software Bibliometrix version 4.1.4 [
22], we described the growth trend of the study of SA with eye tracking in the field of driving in terms of citation and bibliographical information.
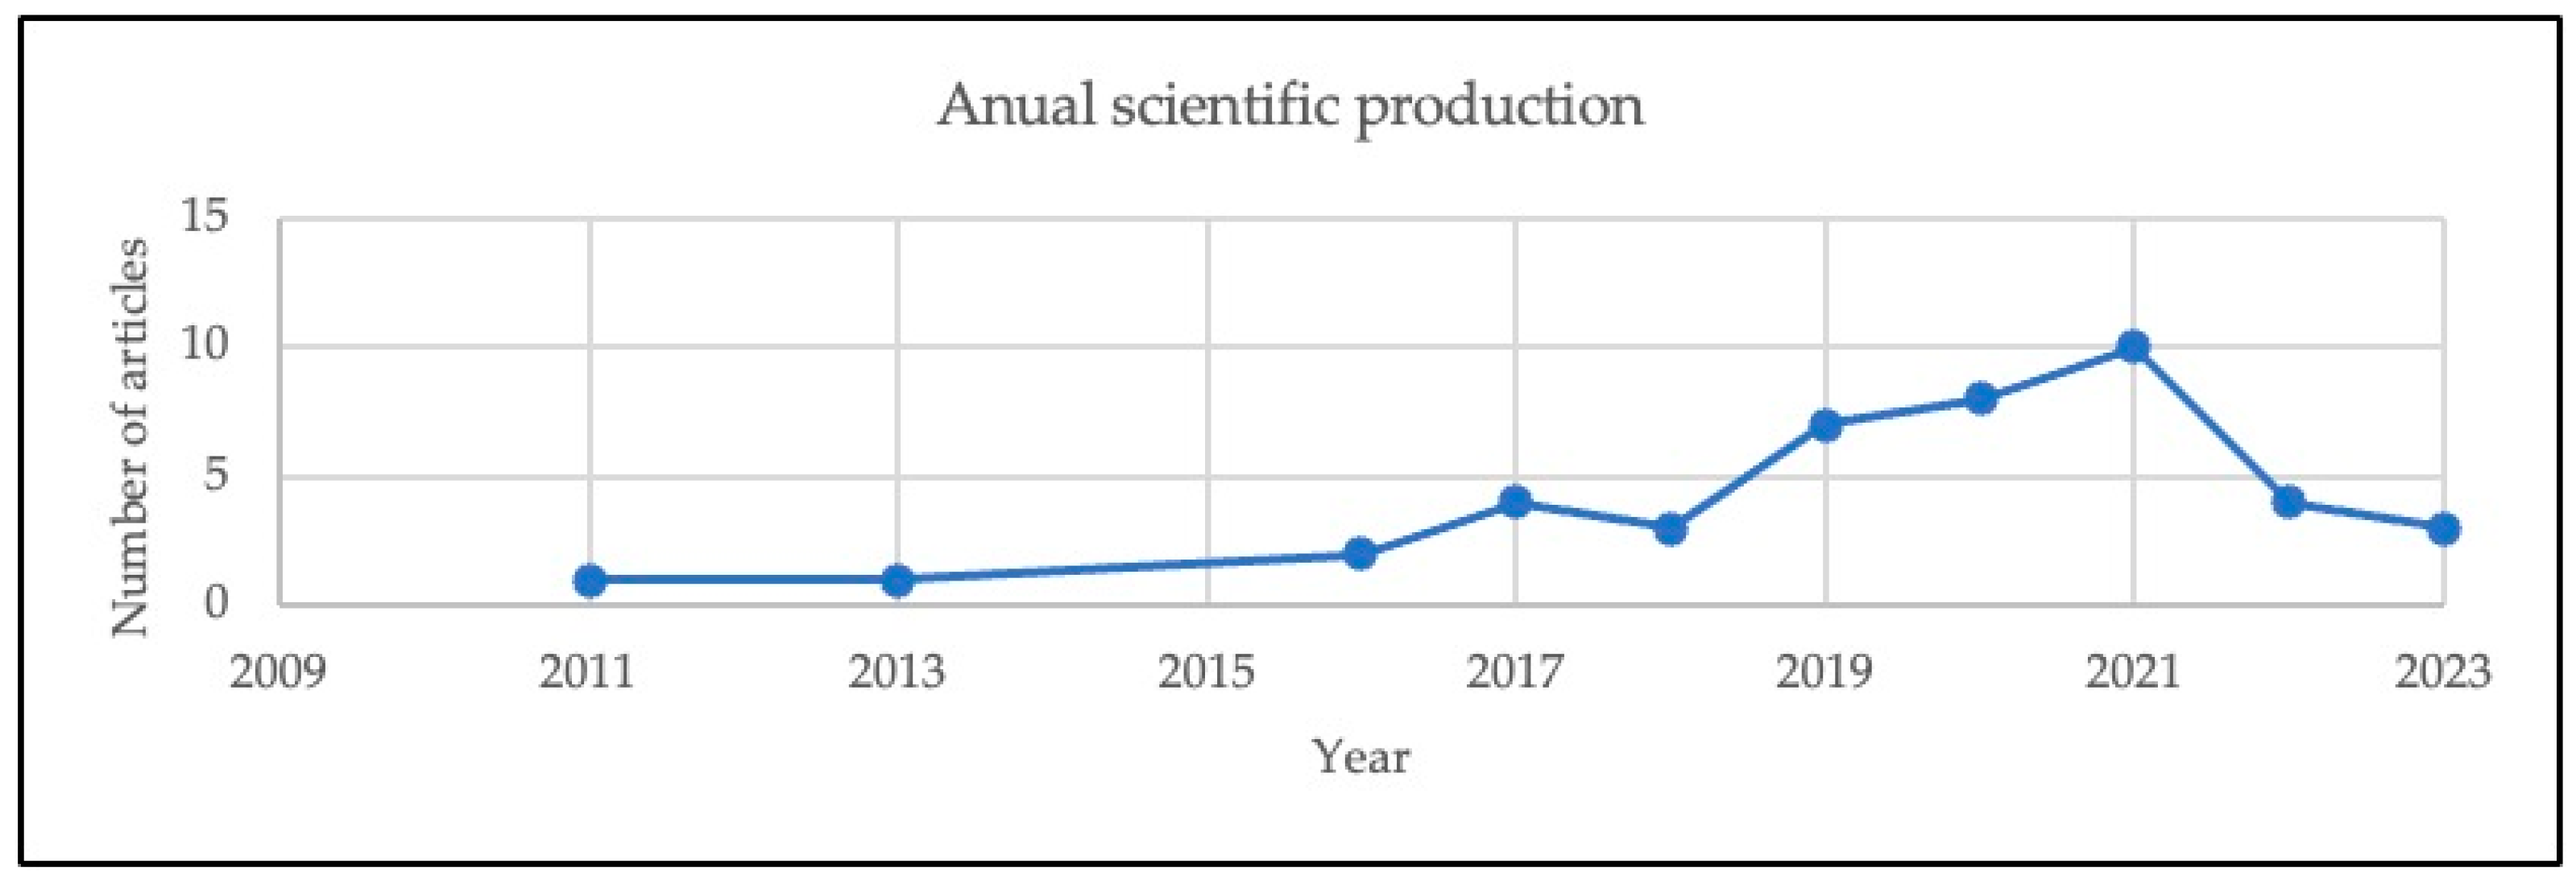
The line chart in
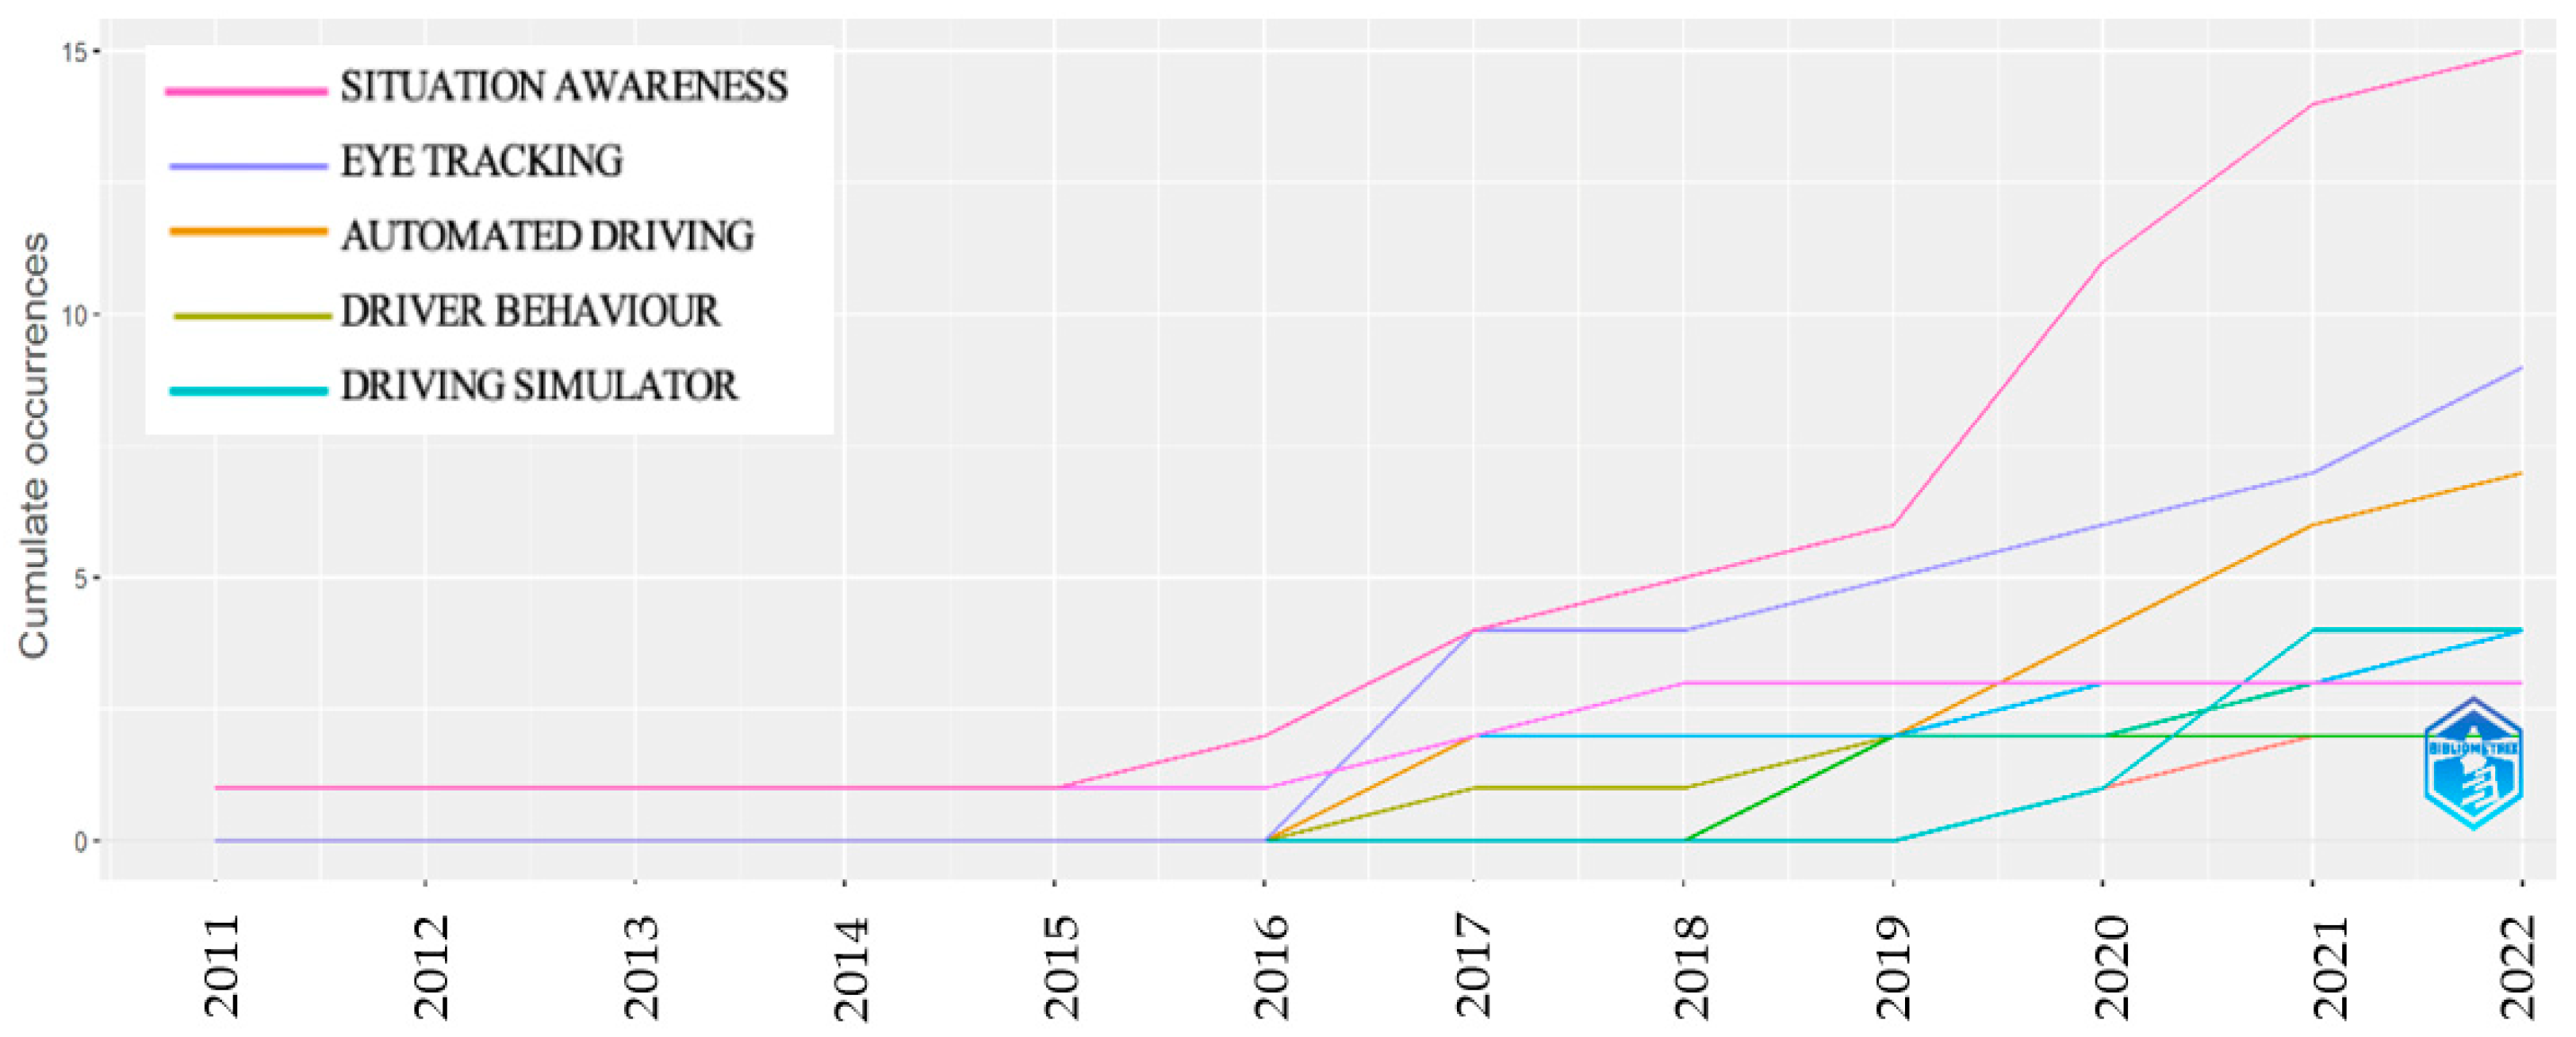
Figure 2 gives information on the annual scientific production in the study of SA based on eye tracking in the field of driving for the period 2011–2023. Annual scientific production over five years from 2011 remained steady, while it underwent an irregular fluctuation in the period 2016–2018. However, for 2018, we see a steady but remarkable rise in the number of articles. This is also seen in
Figure 3, which shows the accumulated rise in the number of occurrences of the keywords “SA”, “eye-tracking”, and “driving” within the literature. Eye tracking related to the study of physiological measures of SA experienced a rapid surge in 2015 and reached a point of inflection in 2019.
Moreover, out of the 41 selected documents, 29 were published in different scientific journals and 12 in conference proceedings. The most relevant sources are summarized in
Table 1;
Human Factors and
Transportation Research Part F: Traffic Psychology and Behavior are the main journals in which the research was published. In all, 97% of the articles belong to quartiles of scientific journals Q1 and Q2, and the review included an average of 3.5 authors per document, with 40 multi-author papers and one single-authored article.
Furthermore, about 133 authors were devoted to the study of SA with eye tracking in the context of driving. The most relevant and cited authors who have contributed to this topic are Curry R., de Winter J., Gabbard J., Happe R., and Katrahmani A. Furthermore, the number of citations of each article was reviewed to identify papers with major impacts; these papers include those of [
23,
24,
25], with 358 citations in total. The most relevant affiliations and countries are listed in
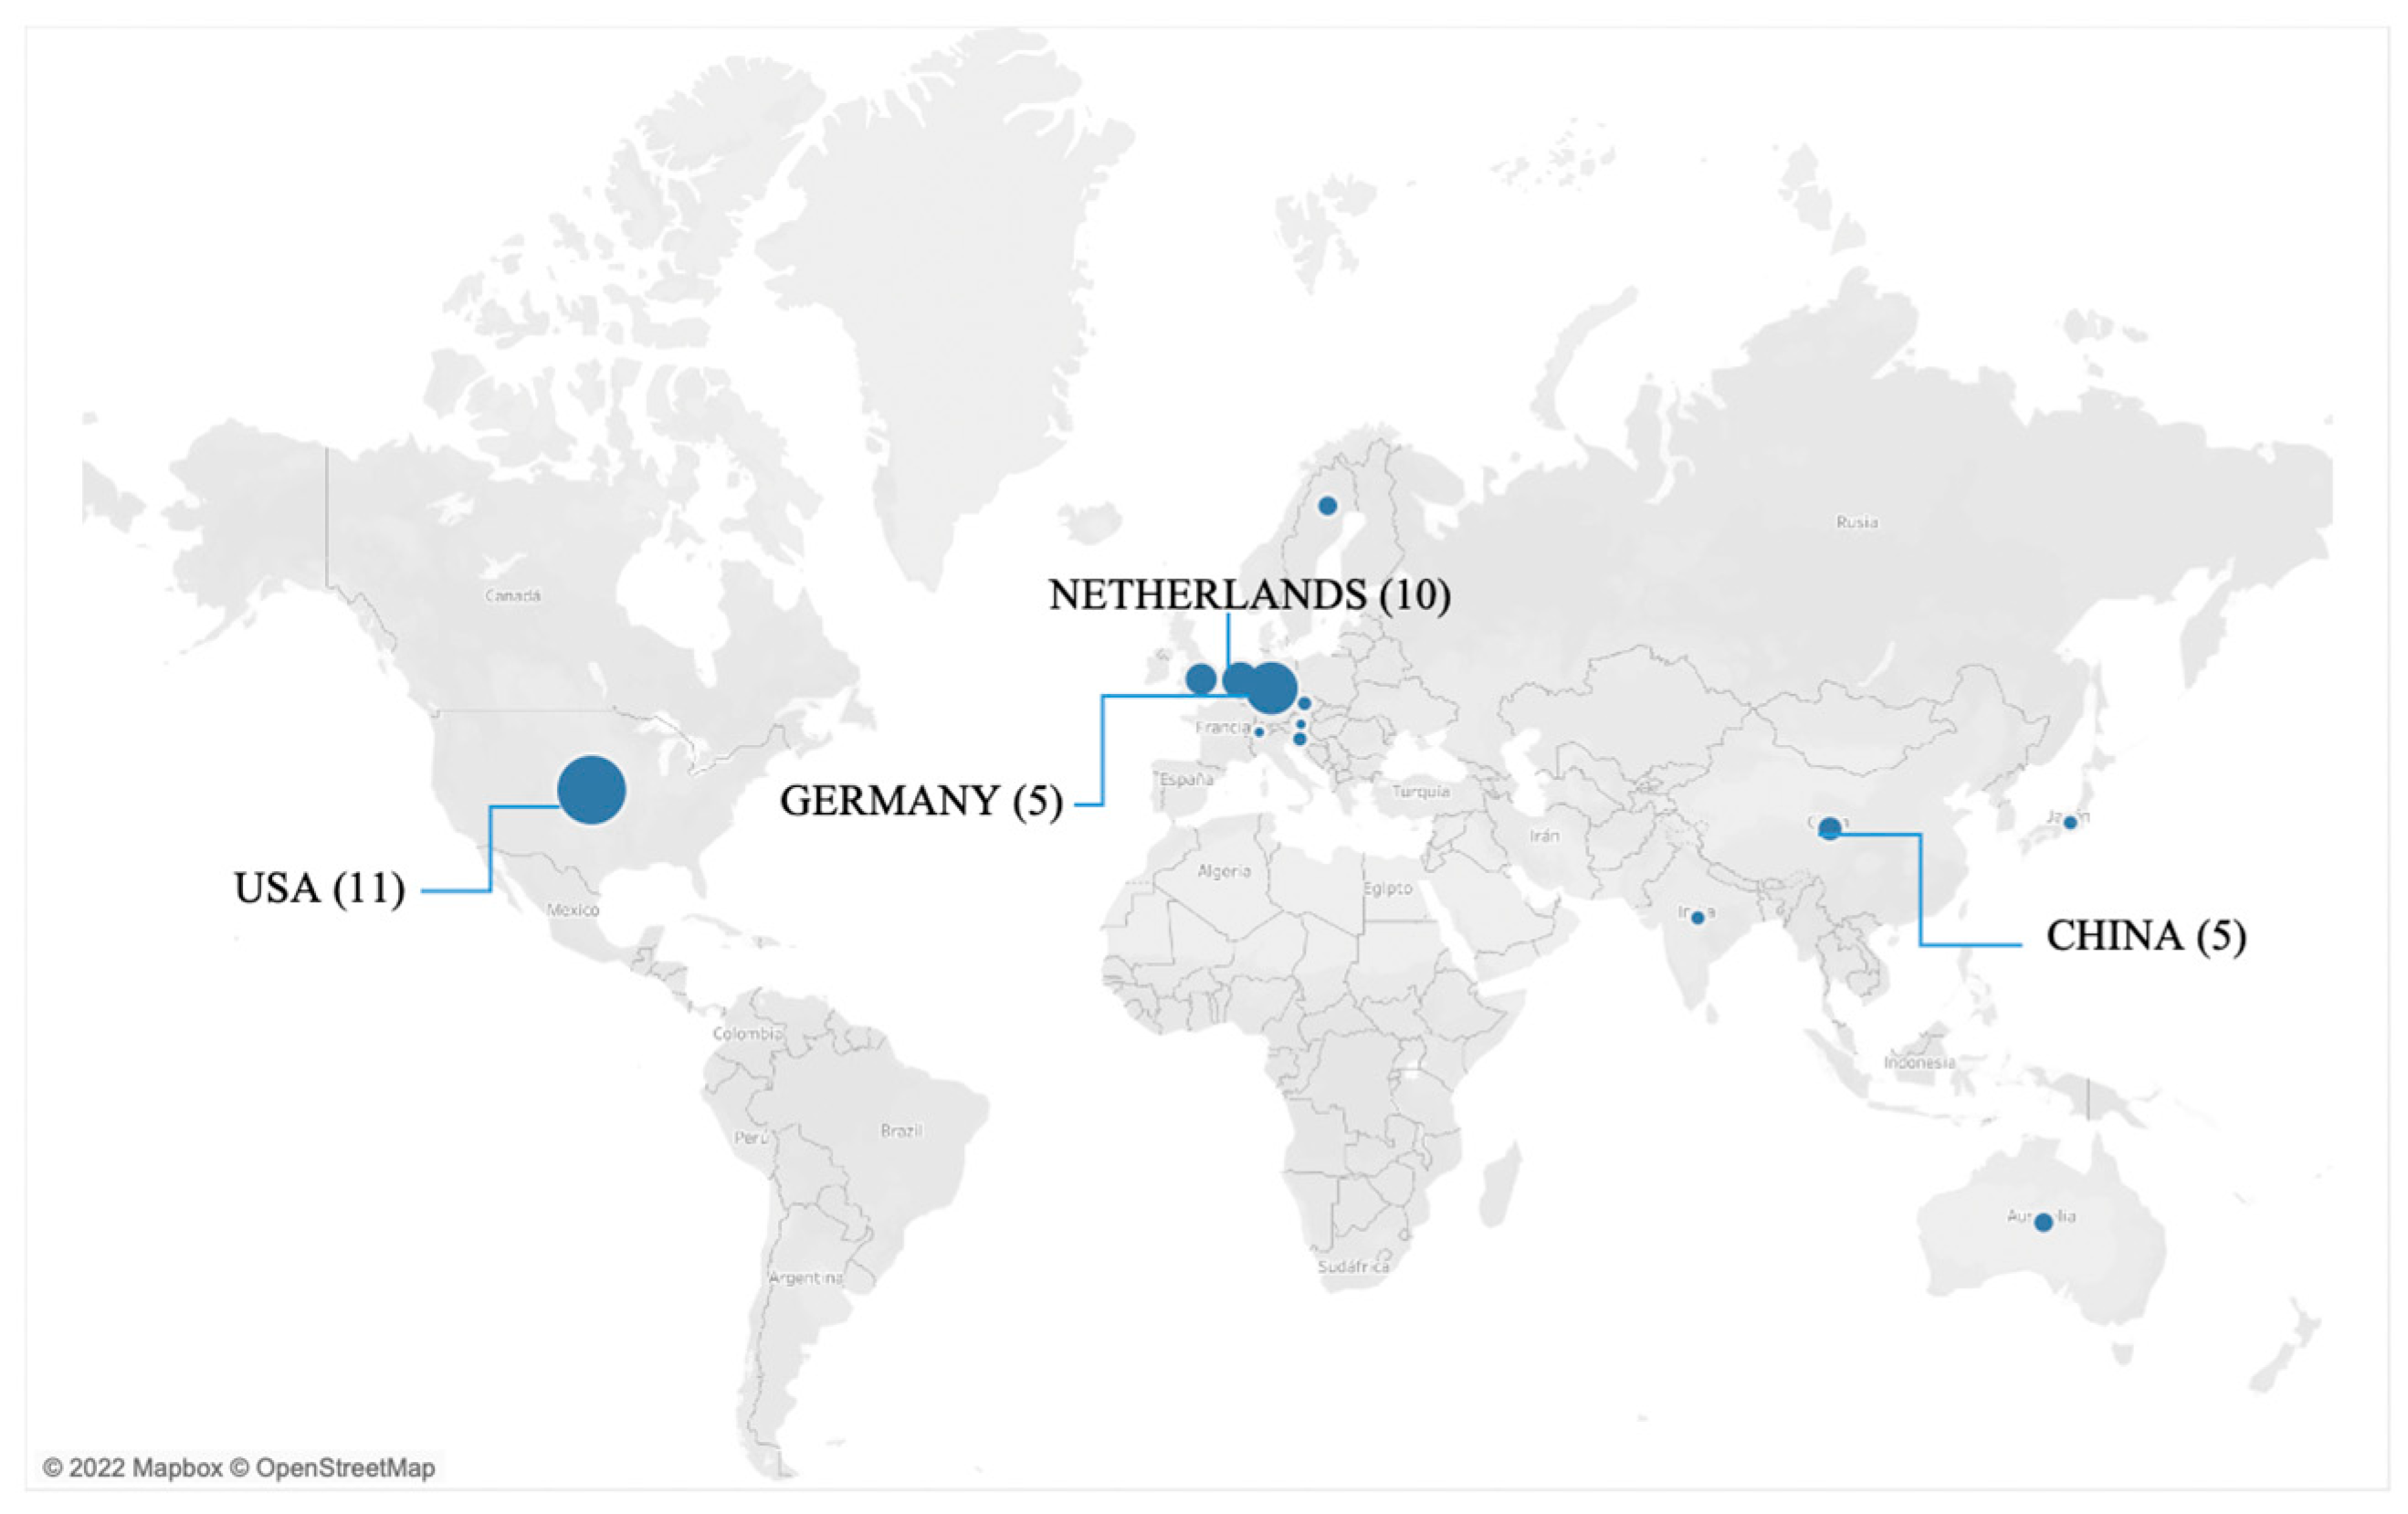
Table 2 and
Figure 4, with Purdue University (USA) as the predominant institution, followed by the Delft University of Technology (the Netherlands), reporting on this topic. Only two studies originated from developing nations.
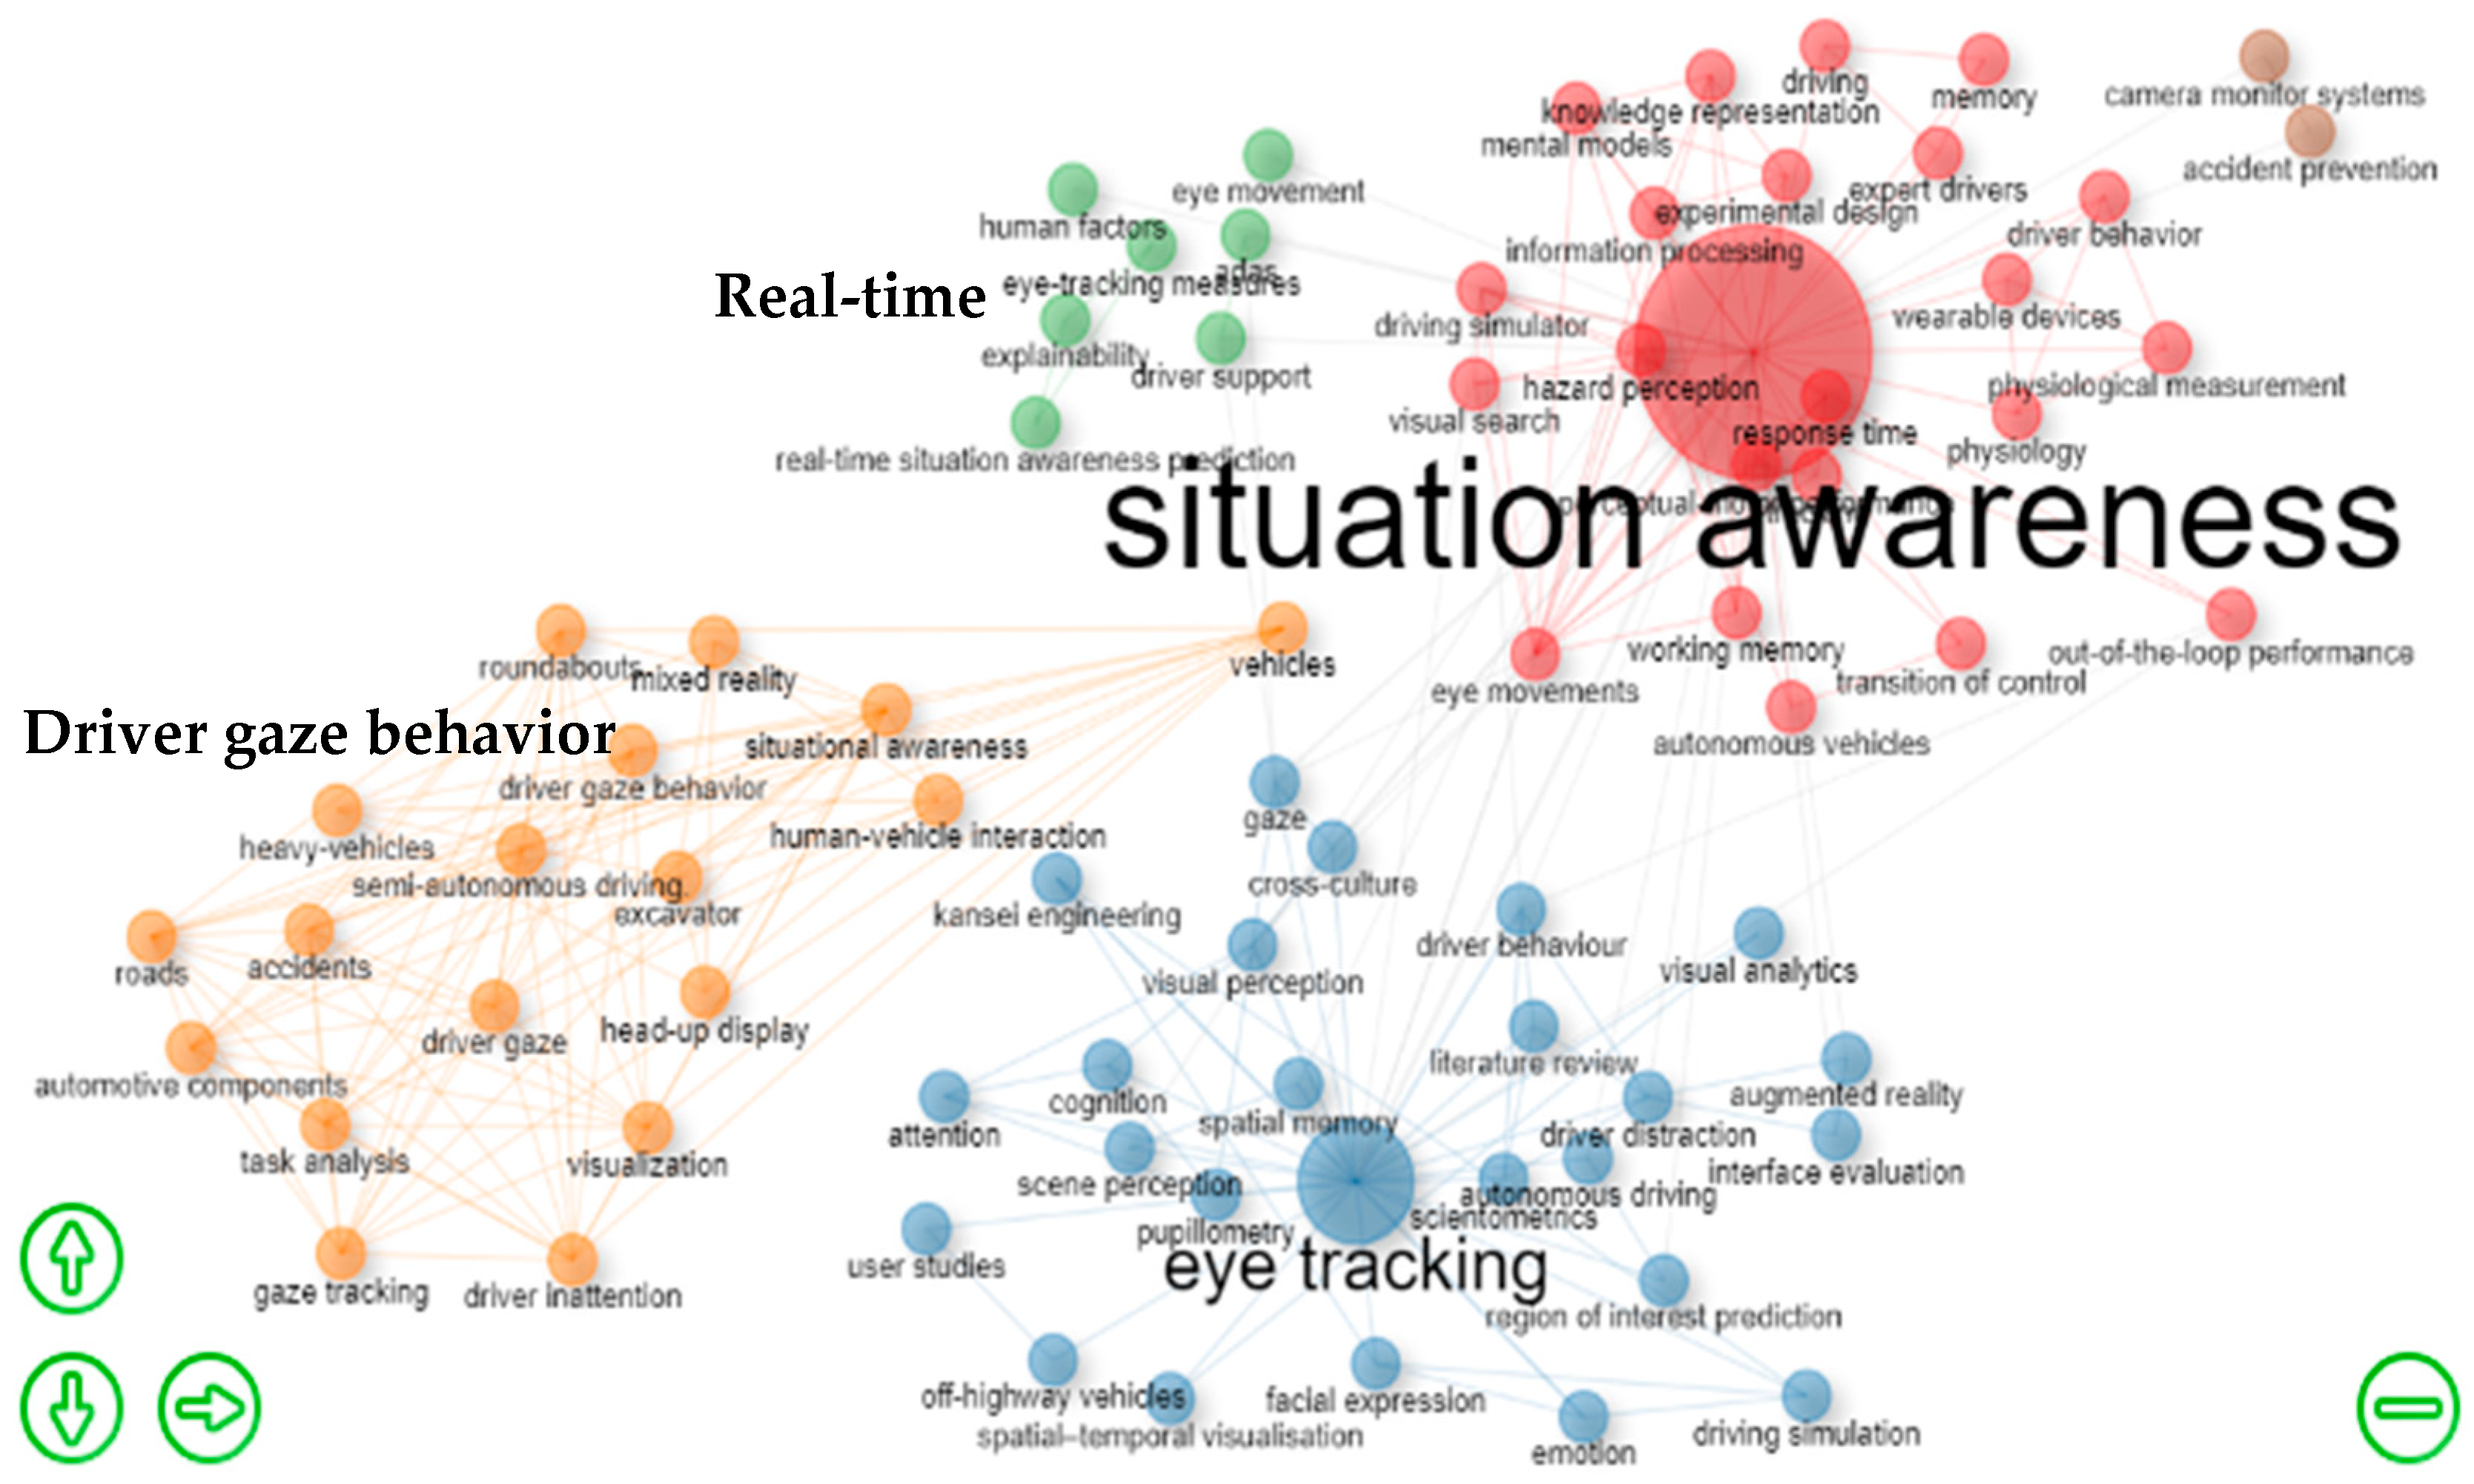
Furthermore, we performed a keyword analysis. This analysis allows us to capture the fundamental content of the documents and aims to distinguish meaningful research topics in SA, eye tracking, and driving. A keyword co-occurrence network is shown in
Figure 5. In this figure, the research topics are shown in the context of our literature review. In the plot, large circles represent the main keyword in the review, and the lines between keywords show the strengths of their correlation [
26].
In
Figure 5, four keyword clusters show the relationship among the main keywords, and synonyms and keywords with common meanings were identified in the review. The first category encompasses the examination of SA, delving into physiological measurement and the apprehension of driver behavior (indicated in red). Similarly, the second category pertains to eye tracking, encompassing driver behavior, pupillometry, and visual perception (represented in blue). The third category deals with driver gaze behavior, encompassing human–vehicle interactions and accidents (indicated in orange). Finally, the fourth category deals with real-time SA in conjunction with human factors and driver support (represented in green).
3.2. Demographic Analysis of the Experiments
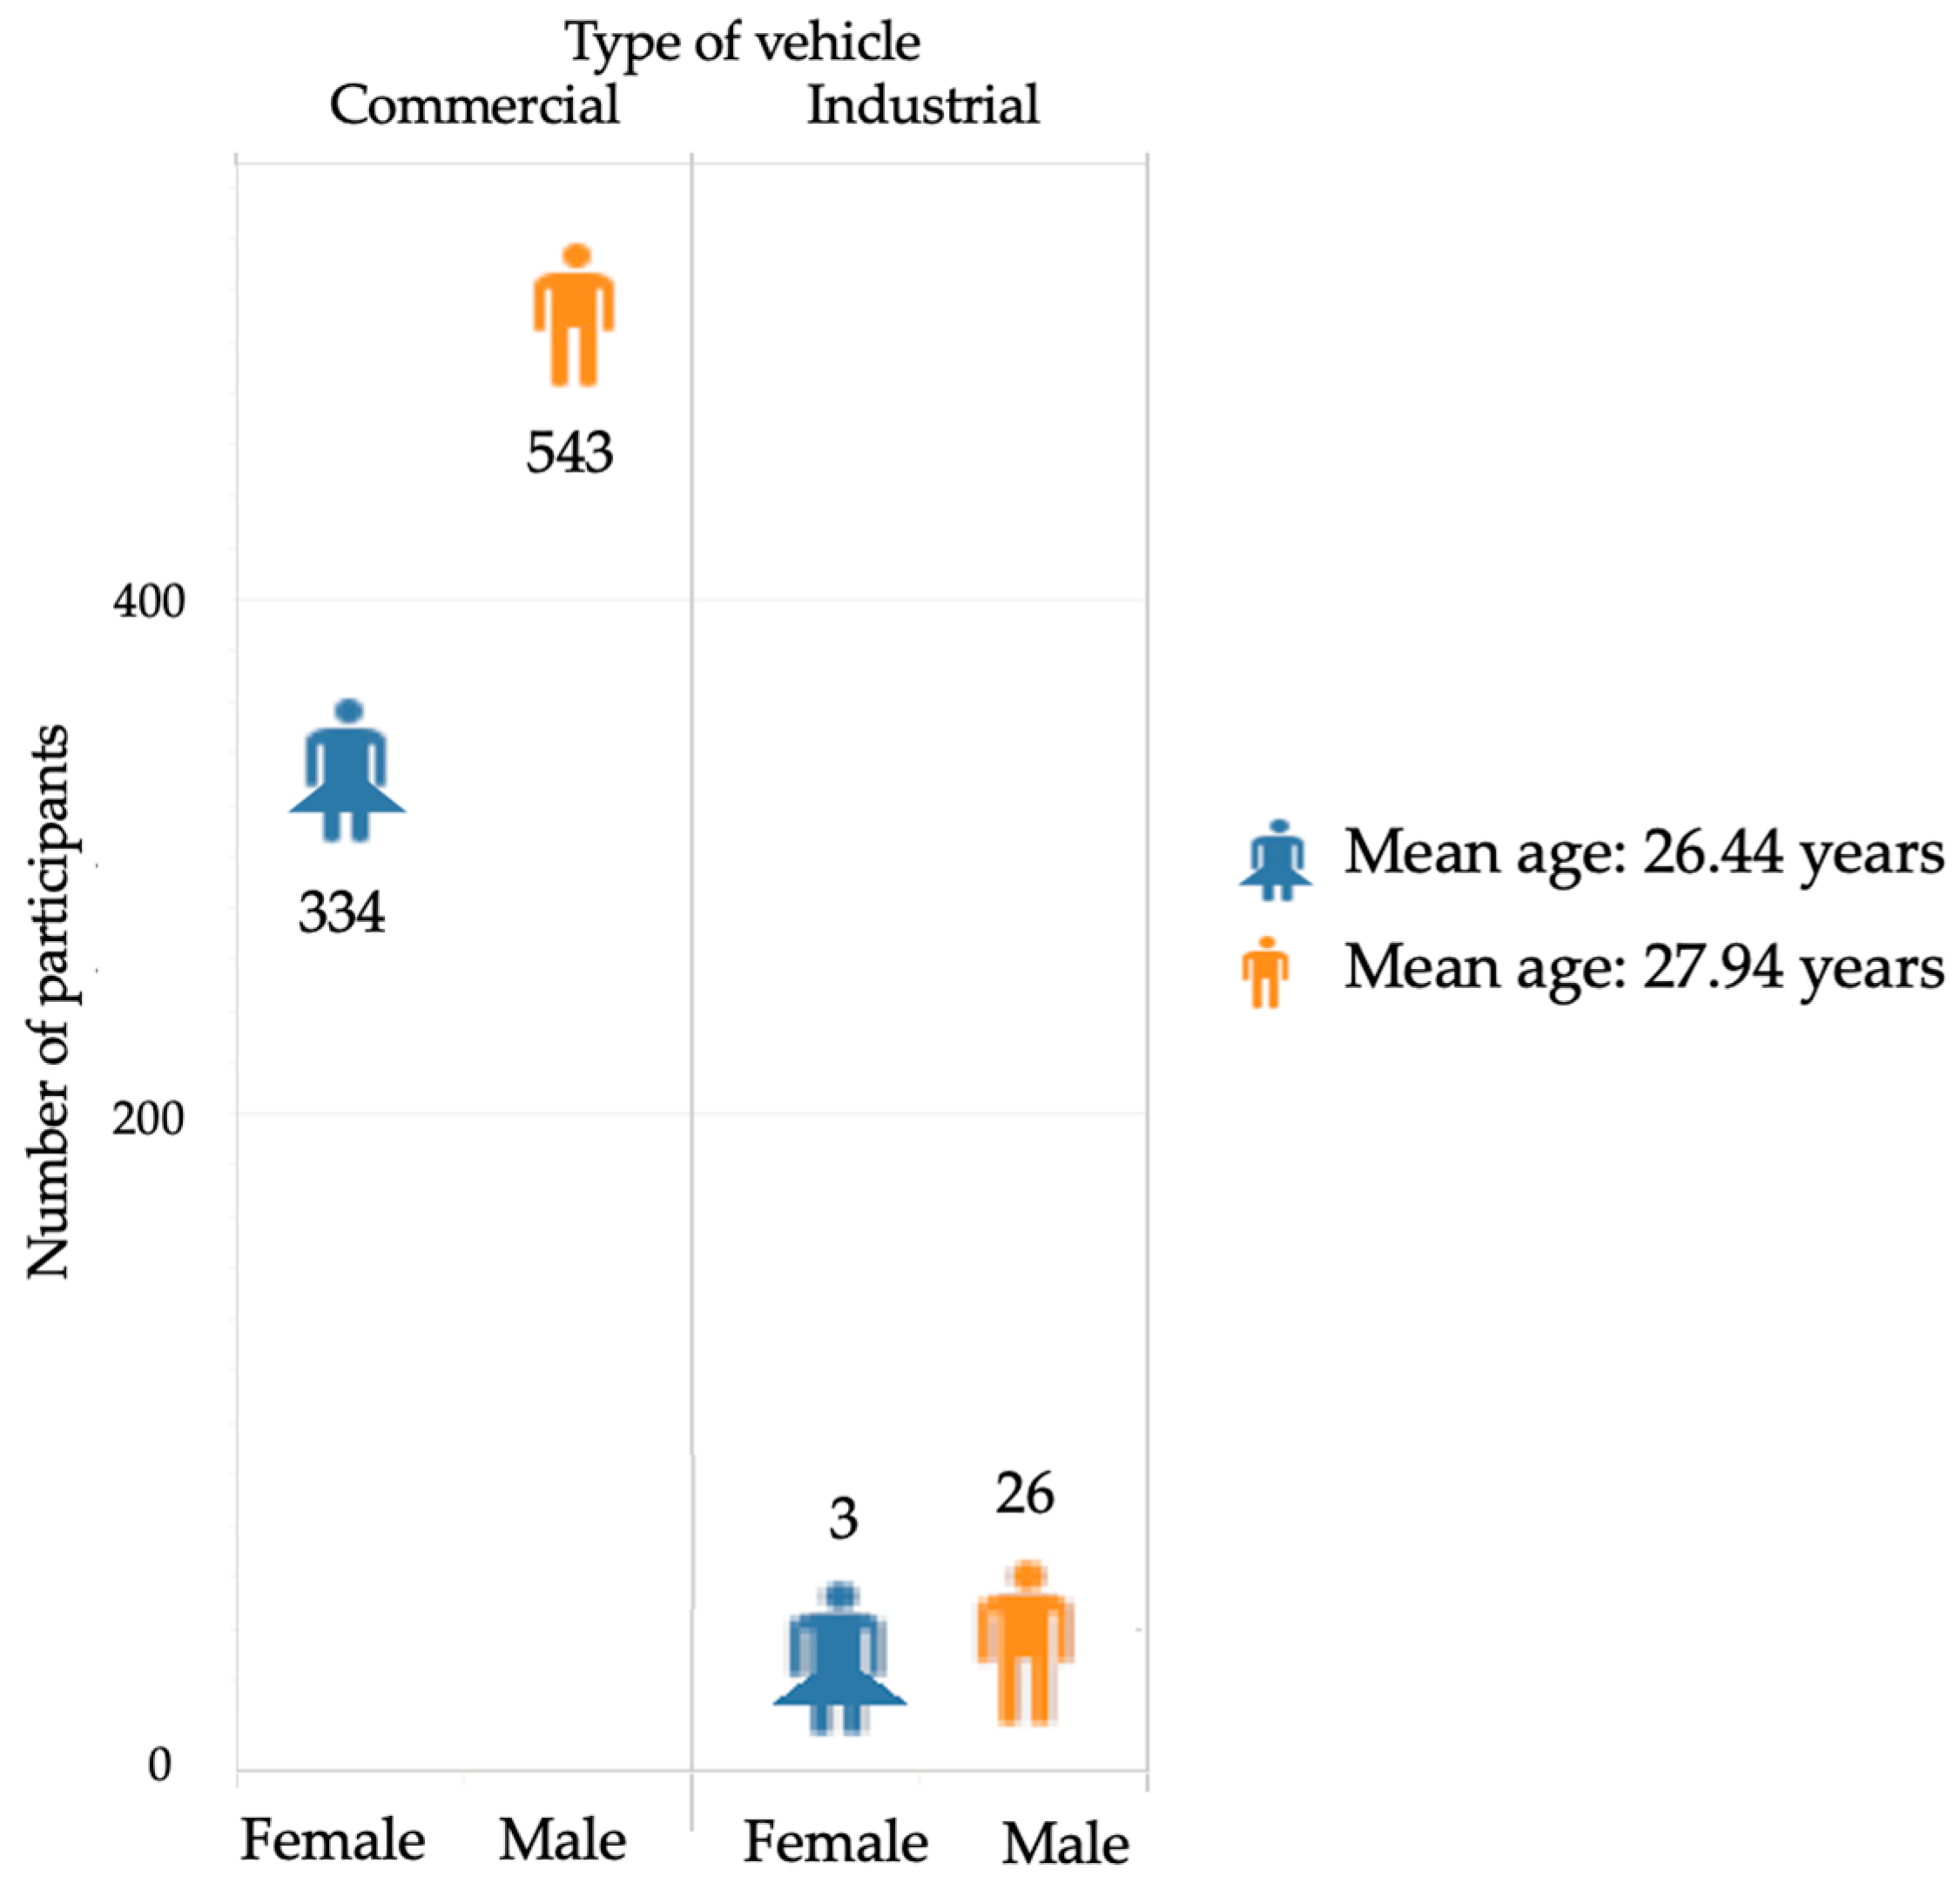
Within the compiled body of studies, a discernible pattern emerged: experiments pertaining to the measurement of SA in drivers via eye tracking, along with metrics analyzing driver behavior covering aspects such as hazard perception, attention allocation, driver distraction, visual perception, and vigilance, consistently featured a selection of two distinct vehicle categories for experimental trials—commercial and industrial vehicles.
For the scope of this review, commercial vehicles refer to vehicles designed to transport products or passengers with or without business purposes, and industrial vehicles refer to any vehicle that is used to lift, stow, load, push, or stack materials. Within the sample of 35 articles that dealt with driving experiments, 29 of them were based on commercial vehicles, which represent 85.4% of the sample; the remaining 14.6% of the sample dealt with industrial vehicles.
The primary category of industrial vehicles considered in studies on SA included covered forestry harvesters, wheel loaders, excavators, dump trucks, wheeled excavators, mobile cranes [
18], truck platooning [
27], forklifts [
28], and crawler and wheeled excavators [
29,
30]. The commercial vehicles were mainly passenger and goods vehicles [
31,
32,
33,
34], school vehicles [
35], and automated vehicles [
36,
37,
38].
Conversely, with regard to the gender-based distribution of participation, a discernible and noteworthy trend was observed in the significant involvement of male participants. All the selected studies taken together involved 906 participants. In the experiments on commercial vehicles, the participants were composed of 543 men and 334 women. Similarly, the participants in the experiments on industrial vehicles comprised three women and 26 men, as presented in
Figure 6.
The age range of participants revealed that the average ages of male and female drivers were 26.44 and 27.94 years, respectively. In some of the studies, participant eligibility criteria included being the age of 18 years or more and holding a valid driver’s license, as per the data collection protocol in those studies [
36,
39].
3.3. Eye-Tracking Metrics and Oculomotor Events
Appendix A succinctly encapsulates the collective scholarly contributions of authors within the realm of the investigated eye-tracking metrics, as delineated and covered within this comprehensive literature review. The importance of their contributions has been reported in the literature [
9,
21].
Eye tracking has been increasingly used in studies on human behavior since 2002, perhaps following one of the largest studies on human behavior in the analysis of gaze patterns carried out by [
40], with a significant rise in the field of study of driver behavior in 2013 [
41]. Similarly, the use of eye tracking as an objective method and its rise as the commonly used method in studies on SA has witnessed a significant rise [
9].
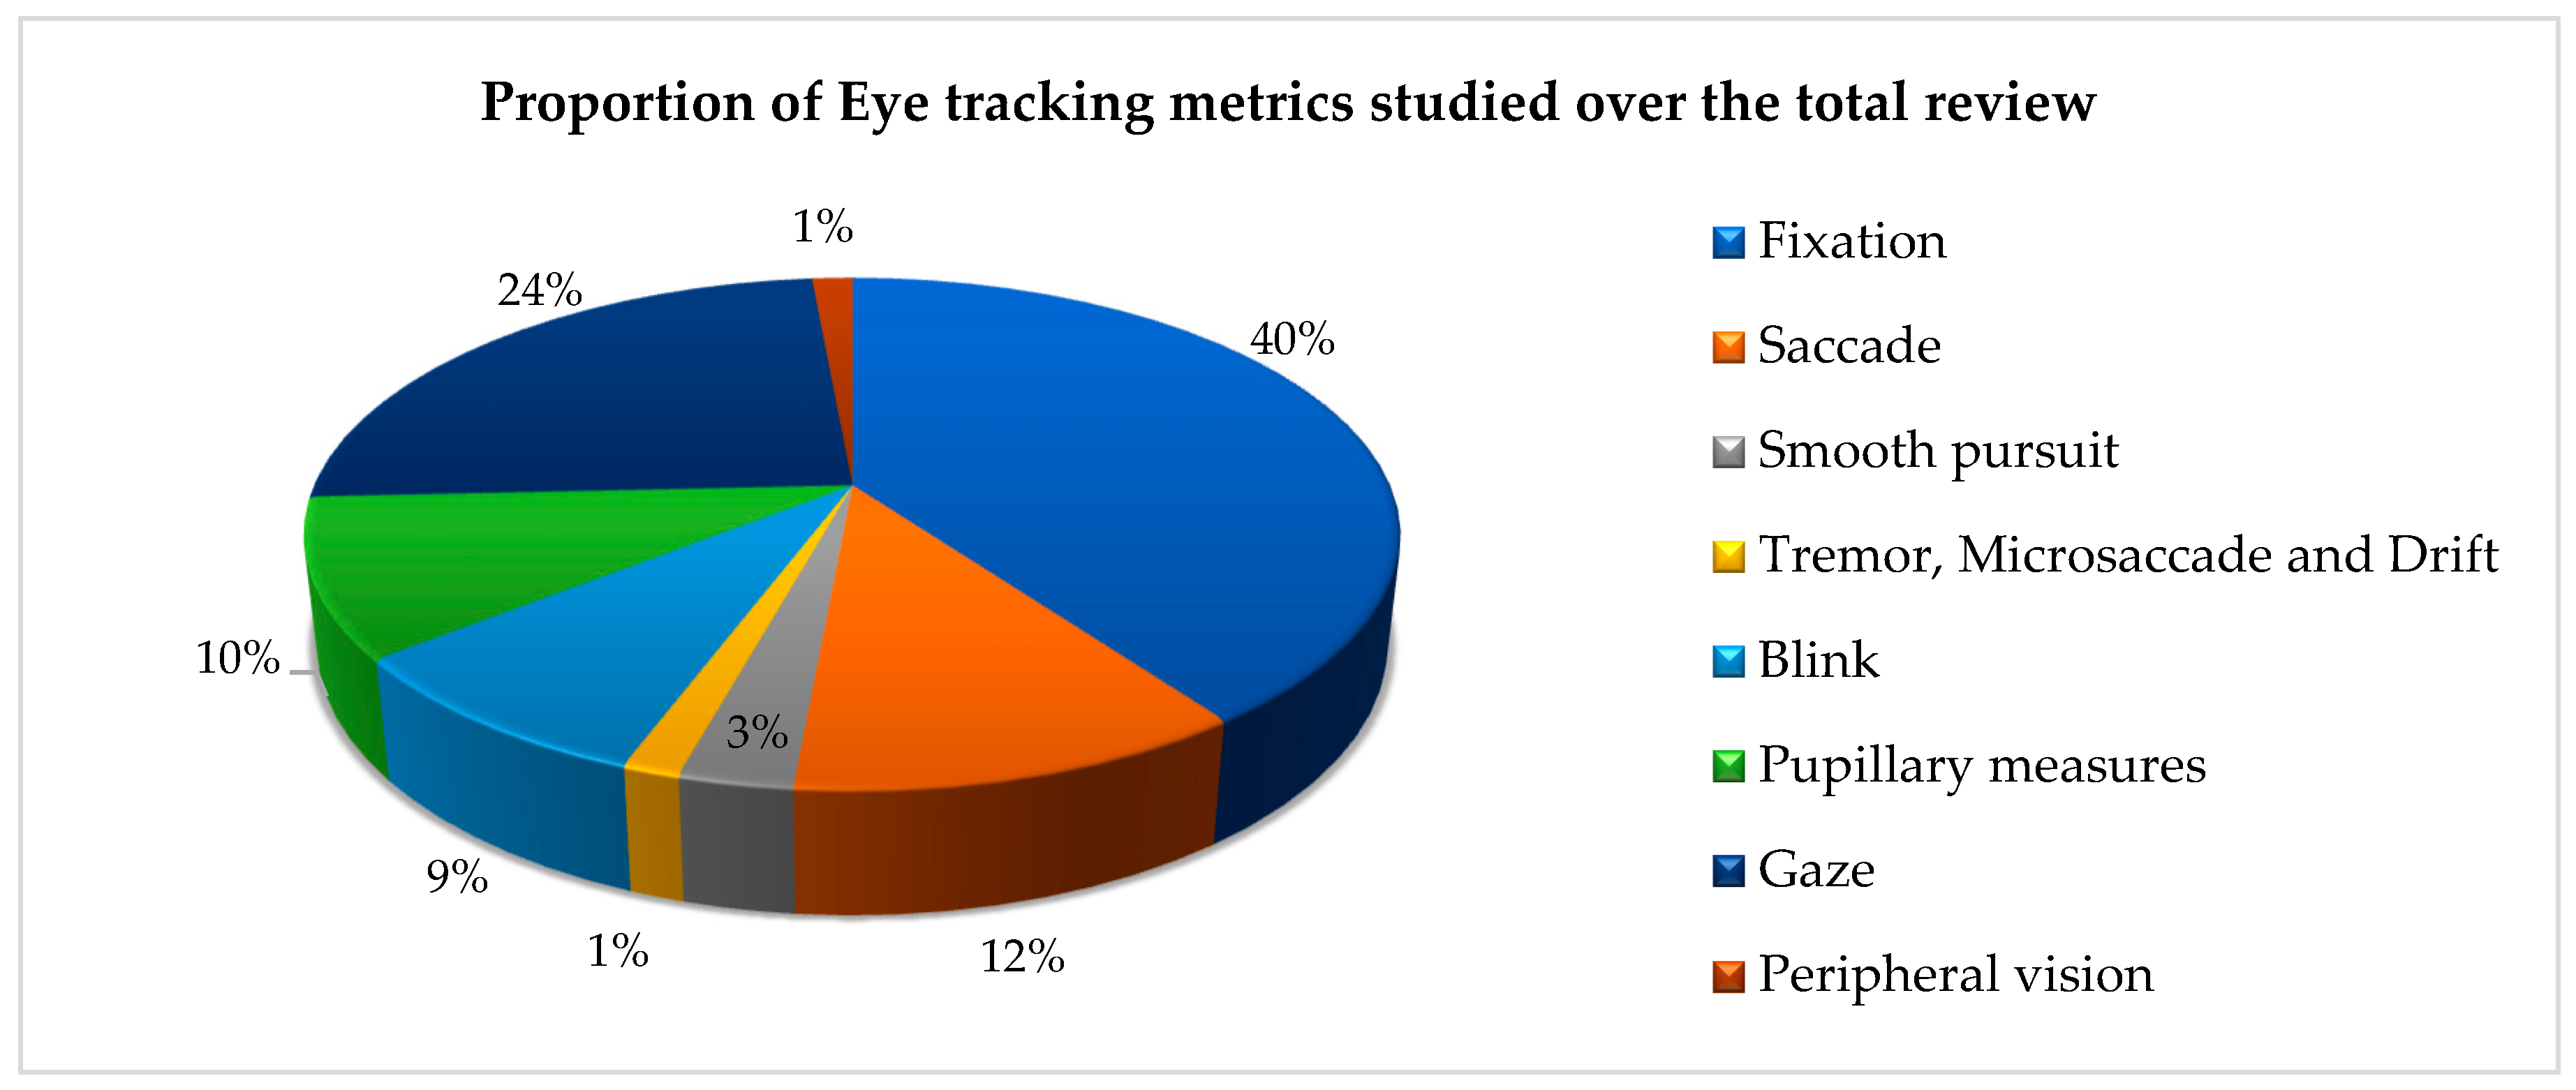
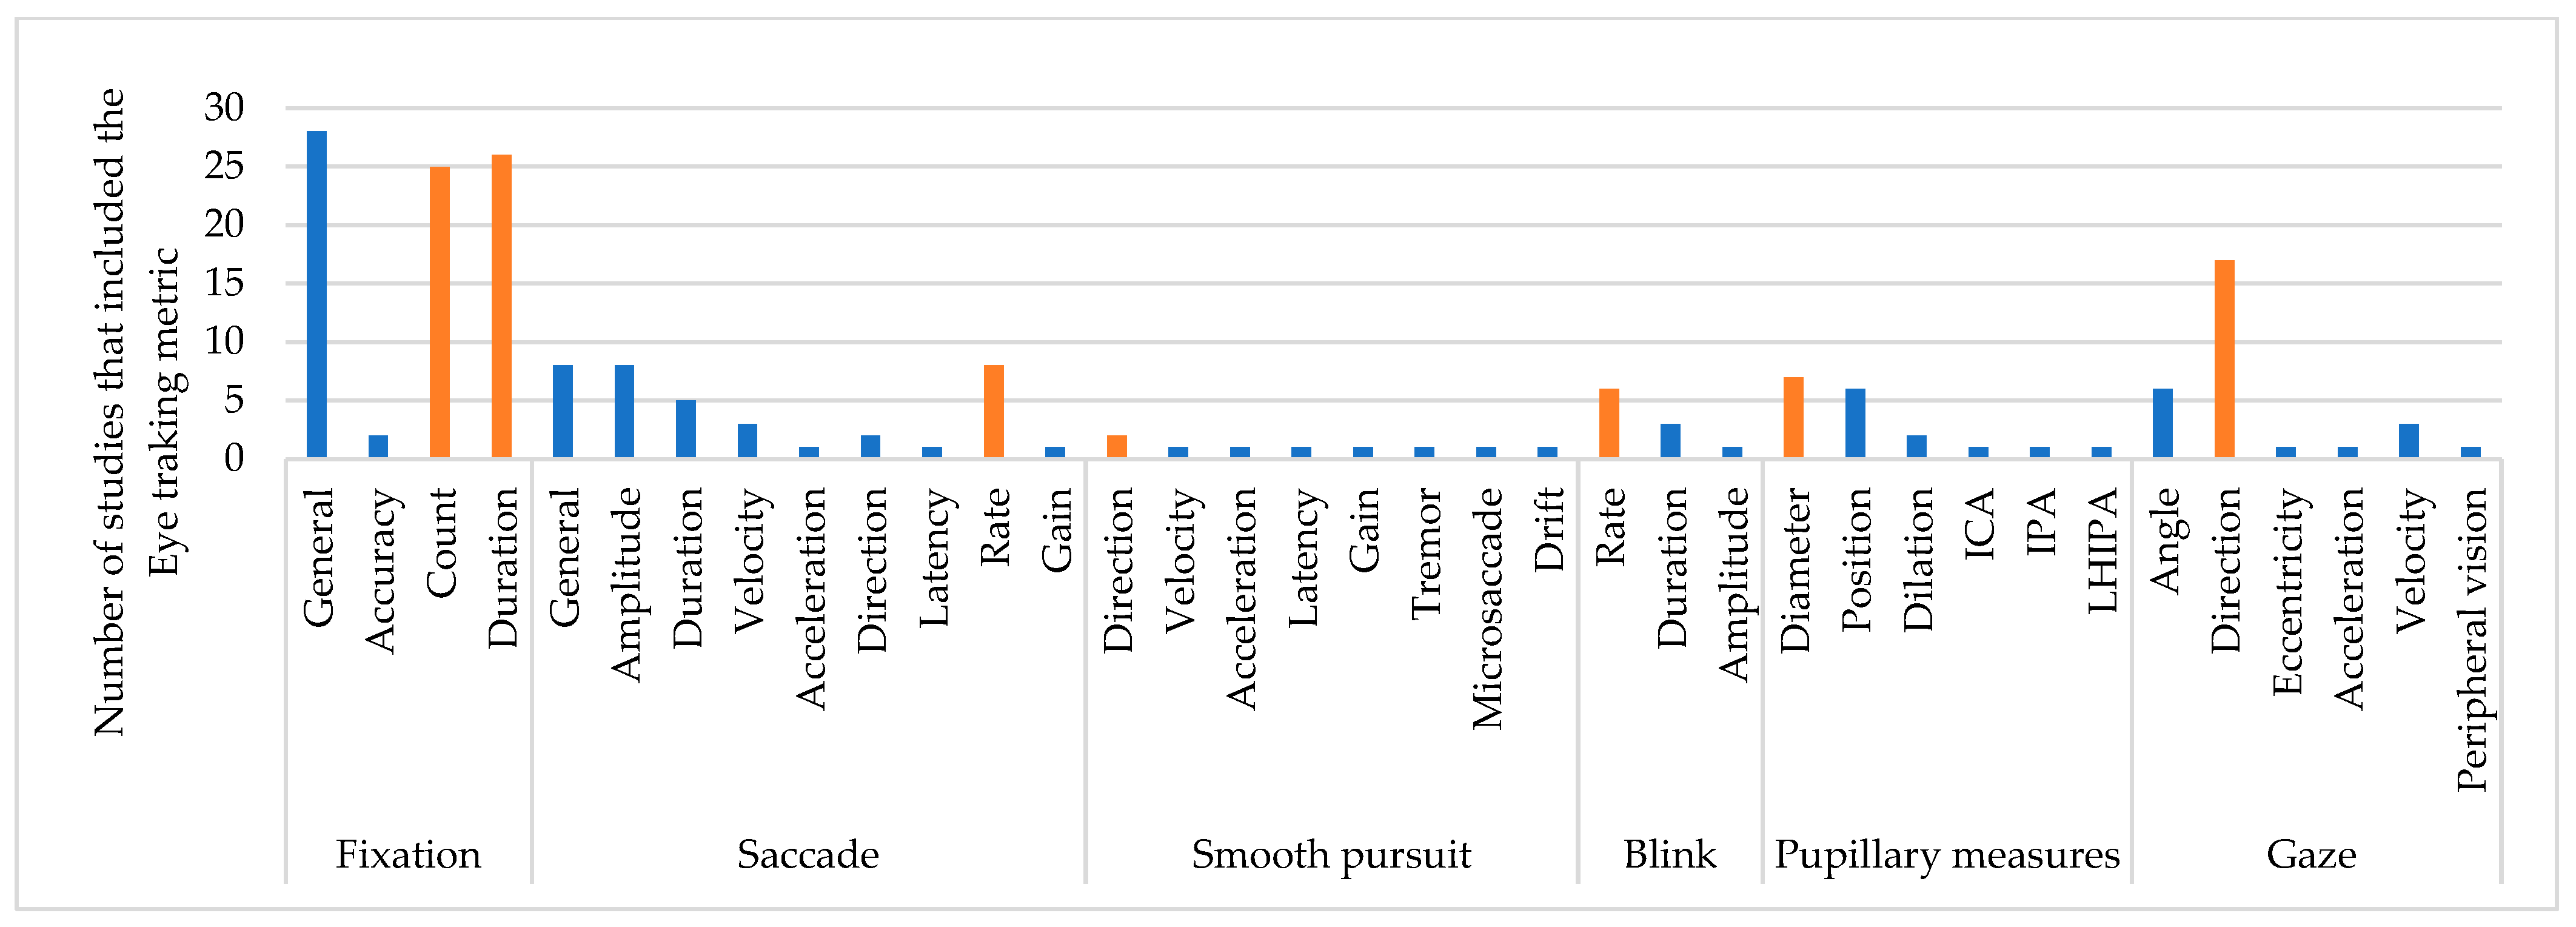
Among the selected studies in this review, 41 studies dealt with the use of eye tracking to investigate SA in drivers. In these studies, a total of 36 distinct oculomotor events—events pertaining to activities governed by the ocular motor system, facilitating the preservation of visual stability, and orchestrating gaze-oriented motions—were discerned and cataloged. For categorizing the metrics, we considered the classification and studies of [
21] and [
9], which were used as a reference. The oculomotor events that we examined are fixation, saccade, smooth pursuit, blinking, pupillometry measures, gaze, peripheral vision, tremors, microsaccade, and drift, with their respective metrics.
Figure 7 shows the proportion of eye-tracking measures in relation to the comprehensive scope of this review. Among the 41 studies incorporated within the review, 31 studies used the fixation metric as the fundamental component to study SA; 29 used count fixation and 25 used duration fixation for SA measurement; 17 studies used gaze direction; and 8 studies used the amplitude and rate of the saccade.
These studies revealed a direct relationship between physiological measures obtained through eye tracking and its emergence as the commonly used method in studies assessing SA. For instance, ref. [
12] built a prediction model named light gradient boosting machine from the data collected with eye tracking to predict SA during the takeover transition period in conditionally automated driving; they recreated simulated driving scenarios with videos and by using PreScan 8.0.0. They found that fixations, followed by pupil diameter and saccades, had the highest importance in predicting SA. Reference [
21] reported in their review that distracted drivers had higher fixation durations and lower fixation counts on the mirror or speedometer.
Likewise, ref. [
32] observed that in a traffic scenario at an intersection in which the participants were instructed to memorize information and to build an understanding of the situation, commonly, participants fixed deflated spatial locations associated with the relevant information (level 3 of SA); in addition, when retrieving information associated with other road users, participants made considerably more saccades between empty locations on the screen.
Furthermore, ref. [
31] examined instances in which drivers exhibited diminished awareness when approaching and entering a roundabout. They used three distinct eye-tracking devices and relied on metrics such as fixation duration, fixation count, and gaze direction to reveal that drivers, on average, allocated approximately 28.36% of their temporal focus to non-driving-related areas (NDRAs). Likewise, ref. [
42] revealed consistency between fixation count and fixation duration on an object and showed that SA during simulated automated driving might be attributed to visual fixation patterns for various traffic scene elements. Similarly, ref. [
43] investigated the safety implications of environment self-explaining design on drivers’ situational awareness; it was noted that drivers exhibited the highest percentage of fixation number and fixation duration while traversing the yellow-green adorned sidewall tunnel.
Eight studies used pupillary measures for oculomotor movements. Reference [
12] commented on the need for further research to understand the relationship between pupil diameter and SA and ranked pupil diameter as one of the most important measures for predicting SA when drivers scan their driving scenarios. In addition, ref. [
32] measured pupil dilation during a memory task to evaluate the effects of mental workload in SA. Reference [
44] developed assessments of driver situational awareness utilizing sensor-based methods, especially focusing on road signs. For this experiment, eye-tracking metrics such as average pupil size, eye blinks, and gaze-related features, including gaze visits and total fixation time, were employed. This method allowed AI systems to predict driver situational awareness in relation to levels 1 and 2 of the Endsley model (perception and comprehension). Reference [
45], in their literature review, additionally highlighted that pupil measurements, specifically focusing on pupil diameter, may serve as an indication of the user’s emotional arousal.
Additionally, ref. [
34] established a safety analysis of work zone complexity with respect to driver characteristics by using fixations and pupillary measures and situation awareness, with longitudinal control, lateral control, gaze behavior, and daze behavior in the event of changes in SA because of the involvement of secondary visual tasks, for instance, text entry into a GPS unit in an active work zone and a lower perception of hazards.
Similarly, ref. [
46] reported a relationship between the increase in pupil diameter and situations perceived as risky, showing that danger provokes a stress response that can be represented in terms of pupil diameter. However, it is not possible to establish this conclusively since videos on monitors were used in the experiment, and the pupil is sensitive to changes in light. Nonetheless, it is possible to measure whether these hazardous situations can be qualified as more dangerous than the nonhazardous situations from oculomotor metrics such as pupil diameter [
46]. In addition, ref. [
47] considered the effects of pre-takeover visual engagement or takeover request (TOR) warning and risk perception and revealed a correlation between the change in pupil diameter and visual attention—the more dispersed the visual attention, the greater the SA.
Other metrics included the blink rate, pupil position, and gaze angle, each of which was utilized in six studies. For instance, ref. [
39] studied the role of an in-vehicle digital voice-assistant in conditionally automated vehicles; they stated that drivers could trust driving by an automatic vehicle and tend to fall asleep, thereby suspending the process of becoming alert, as measured by the rate and duration of saccades, as well as the pupil diameter.
Reference [
48] examined the implications of uncertainty communication for automation and saccades and fixations with eye tracking. They reported that, presumably, operators could adjust their gaze behavior to the level of uncertainty. Reference [
49] explored gaze prediction for drivers and used the probability for motion hypotheses and an approach based on a dynamic Bayesian network of fixations and saccades considering human gaze motion characteristics. Similarly, metrics such as smooth pursuit direction, blink rate and duration, pupil dilation, gaze velocity, and peripheral vision were used in studies on driver’s gaze prediction in dynamic environments and in the study on driver distraction.
In
Figure 8, we provide an overview of the eye-tracking metrics systematically categorized and identified within the context of this review. Orange bars indicate the primary metric associated with each distinct oculomotor event. In a majority of the studies, the assessment of SA in drivers was based on the deployment of metrics related to gaze fixation, gaze direction, pupil measurements, and saccades. In a relatively smaller proportion, relatively less importance was given to metrics such as smooth pursuit and blink measures. Furthermore, notably, the joint measurement of fixation and saccades was employed in 30% of the studies; a similar distribution was observed in the case of the joint measurement of pupil diameter and gaze fixation metrics.
In the experiments on industrial vehicles, 100% of the cases involved the use of gaze fixation in AOI, followed by the gaze direction, and finally, the position of the pupil and general evaluation of the saccade. In commercial vehicles, gaze fixation was used in 82% of the studies; this metric was followed by saccades, gaze direction, and pupillary measurements. Likewise, in experiments on automated vehicles, the amplitude and rate of the saccade, as well as the diameter of the pupil, were used as additional metrics along with gaze fixation to analyze differences in driver’s SA and mental stress over time (level 1 of SA).
3.4. Experimental Environment: Naturalistic or Driving Simulation
Among the diverse factors contributing to the potential variance in assessing SA in drivers based on eye tracking, the contextual environment within which the experiment was conducted assumes pronounced importance. In this review, studies were categorized into driving simulation and naturalistic driving. Of the total number of studies reviewed, 76% were simulated driving experiments, and 24% were naturalistic driving experiments.
Table 3 lists the driving simulators or simulation software used in the studies.
Of the studies that used a driving simulator, 94% were simulated driving scenarios comprising video-based laboratory experiments, and 6% were a mix of virtual reality (VR) for instance [
44], augmented reality (AR), and driving simulator experiments [
30,
56,
57]. For the simulations, the authors used different types of software to recreate simulated driving scenarios with videos in testing laboratories.
Similarly, ref. [
12] tested 32 simulated driving scenarios with six lengths for durations of 1–20 s using PreScan 8.0.0. The purpose of their study was to create a model that allowed real-time monitoring and predicting of SA in automated driving. It is significant that the study recommends conducting the study in high-fidelity driving simulators or naturalistic driving based on data collection in a low-fidelity setup [
47].
Moreover, ref. [
32] conducted a video-based laboratory experiment to evaluate the SA and its effects on working memory. In all, 18 traffic scenarios and three practice videos were used; the total duration was 7000 ms, and the scenarios were created by Vicom Editor. Dynamic traffic scenarios were designed, and participants were trained to memorize the information and interpret the situation. Nonetheless, the study suggests that further studies can be realized in a dynamic situation. Likewise, ref. [
50] performed a high-fidelity simulator study in the Advanced Driving Simulator of the Center of Accident Research and Road Safety, Queensland (CARRS-Q, QUT). They evaluated three interventions, namely, uncertainty display, interruption of non-driving-related tasks (NDRTs), and a combination of both, to evaluate the interfaces that address the difficulty of missing the SA or being out-of-the-loop.
Reference [
47] used a medium-fidelity fixed-base driving simulator of the National Advanced Driving Simulator (NADS), miniSim™, to evaluate the relation of the pre-takeover state of drivers in the context of NDRTs and to evaluate how this state affects level 3 SA. The study highly recommends validating the results in an automated driving vehicle in real time in more naturalistic environments. Further, reference [
51] analyzed the driver’s emotional state and physiological feelings using OpenDS driving simulation software in the Ergonomics lab of the University of Missouri (Columbia). The simulation can contribute to advanced driver assistance systems in the future; nevertheless, it remains subjective and does not capture the feelings induced in the driver by simulated surrounding road environments in real time.
Research conducted in authentic, real-world environments is regarded optimal for validating study variables. While it can be posited that such an approach incurs high costs and necessitates more extensive investment in the formulation of ethical, safety, and data collection protocols, the advantages are notable. The advantages include the capacity to capture the nuanced dynamics of the environment and the real-time analysis of driver emotions, reactions, attentional patterns, and perceptions of the contextual elements. In doing so, this approach counters the potential subjectivity inherent in simulations, while also examining the prospective trajectory of research within the majority of studies included in this review.
Amid the array of naturalistic studies incorporated within the scope of this review, reference [
18] evaluated SA in diverse industrial vehicles in naturalistic driving scenarios. The vehicles considered include a forestry harvester, a wheel loader, an excavator, a dump truck, a wheeled excavator, and a mobile crane. The study evaluates how eye tracking can be used to evaluate the attention of operators. The major activities evaluated and measured were cutting, unloading, reversing, and lifting. These activities were evaluated using cameras and sensors to range visualization around the vehicle. The study highlights the need for more studies focused on the industrial environment since such studies are rare; there are considerable advantages of being able to use real data without interfering with the work being carried out.
Furthermore, ref. [
37] studied the visual load and the associated loss of SA by examining the takeover and driving NDRT performance. A relevant conclusion of the study validates that in the real world, drivers’ responses are primarily instinctive and swifter than those observed in simulators, whereas physical and cognitive loads may not have a significant impact on reaction times, as suggested in some simulated studies.
On the other hand, ref. [
27] evaluated the SA and perceived sleepiness of 10 professional truck drivers who worked with a two-vehicle platooning system. One of the discussions deals with the number of participants since, although the experiment was conducted under naturalistic conditions, it also dealt with a smaller sample compared to laboratory experiments, and the eye-tracking measurement was less reliable than in laboratory settings because of variable light conditions.
In a notable study by [
61], emphasis was placed on the examination of natural gaze patterns within street intersections. The primary objective was to glean insights into the capacity of gaze behavior to serve as an indicator of driver awareness, thereby facilitating predictions of SA. They examined the potential utility of gaze metrics in relation to distinct road users while also highlighting the significance of obtaining pertinent information of the entirety of the visual field. The study underscored the challenges associated with recreating the dynamic real-world environment and authentic AOIs within experimental methodologies.
Likewise, ref. [
33] found that the relevance of data collection from experiments in real environments relapses; for instance, in the design of future advanced driver assistance systems (ADAS), if the SA of the driver is known, the ADAS will administer critical information to the driver in risky situations or when required. Thus, the driver’s SA can be regained more rapidly and confidently. Reference [
58] also demonstrated that the driver first tries to obtain a mental map of the situation by looking around rather than by paying attention to the road and its risks, as predicted by the recovery of SA theory.
Let us discuss the naturalist experiments to explore two phases, the training and the assessment of the participants, as conducted by [
35]. For instance, a 30 min long training session was completed at the Center for Advanced Training Research and Naturalistic Studies; this training system is called the engaged driver training system (EDTS), and it allows us to elevate the hazard perception skills of the drivers and helps examine the effectiveness of the EDTS training program on drivers.
Finally, in the study of [
29] relevant information was obtained for reversing movements in crawlers and wheeled excavators by using mirrors during regular work on construction; most of the studies in their review dealt with the importance of helping workers become accustomed to the measurement equipment prior to data collection, the use of written informed consents, and approval of data collection protocols; thus, they explored the means that allow establishing safer behaviors and helping to reduce accidents by increasing levels of SA in drivers via assistance tools.
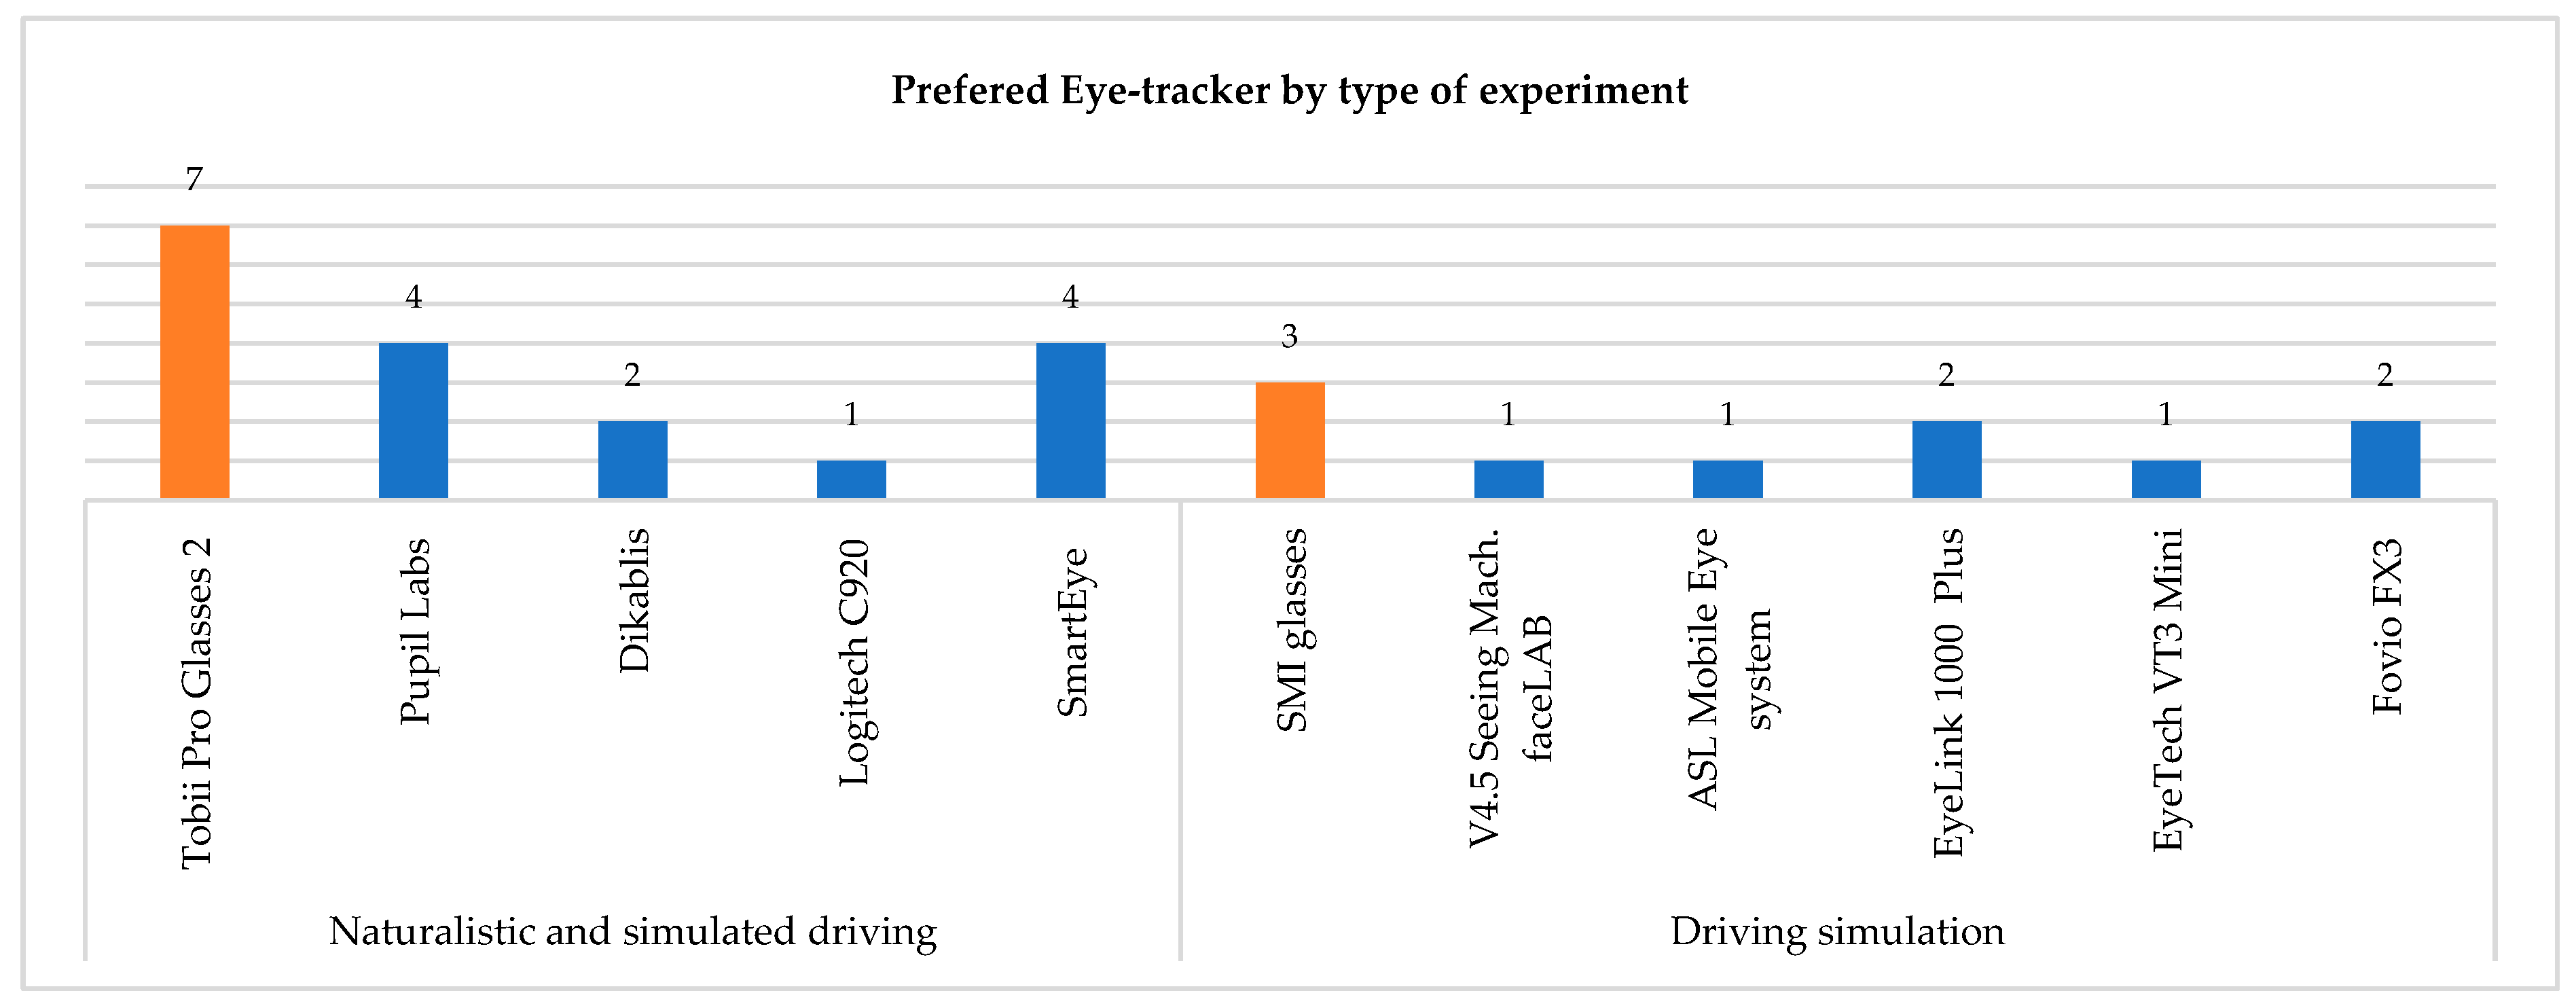
3.5. Eye Trackers: Definition and Types
In this review, we identified and examined a total of 24 distinct eye-tracking devices, each playing a role in the conducted experiments. These findings are documented in
Table A2 of
Appendix A; these findings are further shown in
Figure 9. Tobbi Pro and X2-60 glasses were the most used eye trackers in all the studies considered in this review, and Pupil Lab using Python API was the second most used eye tracker. SmartEye Pro and DR120 were the third most used eye trackers, and Fovio and Eyelink with Eye Works Suite were used, albeit less frequently, within studios.
An eye tracker is a device based on pupillometry, and a sensor captures the human eye movement by recording gaze points that indicate where a human is looking in an environment with a stimulus and measuring how many gaze points are registered per second [
15,
16,
17].
The advantages of each eye tracker are interpreted by the communication between the device and data storage, analysis software, ease of interpreting the data, and data visualization, as well as the fact that the equipment is as less intrusive as possible for the operator; less intrusive equipment allows the process to continue without interruptions and ensure proper calibration time. With regard to demographics and cultural characteristics, reference [
31] considered the difference in pupil color between Asians and Caucasians, and [
42] reported large cultural SA differences between drivers hailing from Japan and the USA. In addition, reference [
59] found that teenage drivers have a lower level of SA than adults while driving.
In the experiments, particularly in naturalistic driving experiments, daylight can be unpredictable because of dynamic conditions and can cause difficulties in reading the device data by the human eye; hence, reference [
31] used illuminators to illuminate the driver’s retina to compensate for the dim ambient light. Reference [
33] used an infrared (IR) illuminator to reduce the effects of poorly illuminated environments; because IR is not visible to the human eye, it does not distract the driver. Additionally, note that several of the eye trackers generate some interference with the equipment used by the operator, and frequencies greater than 50 Hz are preferable for eye trackers.
Finally, it is noteworthy that, for the assessment of potential biases arising from incomplete or unavailable data, a manual approach was employed for the total of reviewers. At the outset, a comprehensive search strategy was accomplished within the literature review to minimize the risk of overlooking relevant studies. The use of databases and conference proceedings contributed to this endeavor. In some instances, authors were contacted to gain access to their studies. For instance, Gwangbin Kim [
44] affably provided complete access to his publication.
Additionally, the reviewers systematically categorized the criteria used to determine which results were eligible for inclusion. In this context, the criteria were grouped into the following: (1) Keywords and co-occurrence analysis in publications for scientometric analysis. (2) Demographic information, including sample size, gender, age, and any other relevant factors such as experience in the function. (3) The type of vehicle used in the experiment, categorized as either commercial or industrial. Metrics that were collected through eye tracking and reported included fixations, saccades, smooth pursuit, tremor, microsaccades, drift, blinks and their classifications, pupillary measures, gaze, and peripheral vision.
Furthermore, the reviewers included a synthesis of the experimental environment in the results. These were grouped into naturalistic driving or driving simulations, selected from the reports, and documented the specifics of each experiment. For naturalistic settings, details included the type of activity conducted, while for simulated settings, information covered the types of simulators used and the software supporting data analysis. In the reporting of the types of eye trackers used, it was necessary to mention the brand and analysis software, but only if reported. Certainly, attention was paid to the points where the authors focused their efforts to demonstrate or present the existing relationships between eye-tracking metrics for the subjective assessment of situational awareness in the driving experiment. This compilation of categorizations and criteria allowed us to define which results were eligible for inclusion in each synthesis.
Lastly, regarding the selected studies, data were available either in the main article or appendices. Within this study, it is crucial to consider that minimizing biases in studies can also be achieved by exploring metrics different from the common ones, as reported in this literature review, aligning with the objectives of research designs in evaluating situational awareness in the field of driving.
4. Discussion
In this literature review, one of the principal aims was to investigate the objective assessment of situational awareness in drivers based on physiological metrics obtained through eye tracking. Our approach utilized a systematic literature review, and papers dealing with the assessment of SA in humans with eye tracking in the domain of driving were incorporated. Furthermore, our literature review encompassed a scientometric analysis, which identified prevalent authors and topics in the field. Similarly, we conducted a demographic analysis of the experiments and a compiled and comprehensive list of the eye-tracking metrics employed in these experiments. Additionally, we incorporated a compilation of experimental environments, classifying them into real (naturalistic) and simulated environments, and documented the primary devices utilized in these studies. The potential utility of gaze metrics in the assessment of SA was observed.
Several explanations included in this review substantiate the robust relation between gaze behavior and SA, particularly within the context of driving activities that are characterized by their predominantly visual nature. These relationships are consistent with literature reviews such as that conducted by [
9], where, among all the identified physiological measures, the eye-tracking technique is the most prevalent to assess SA.
This alignment could enable the authors to explore how gaze behavior can signify various cognitive aspects of driver awareness and behavior, such as visual attention distribution, attentional patterns, distraction, remembered information, mental workload, decision-making, and prediction models of SA.
Central to this understanding is the exploration of visual attention and attentional patterns inherent in the execution of complex tasks by individuals [
8]. The first investigations of patterns in driving and visual attention with the use of eye trackers date back to the works of Mourant and Rockwell (1970, 1972) using an eye-marker camera and a stabilization unit [
11].
Reference [
18] performed research on measuring attention in the visualization of the graphical interface in different industrial vehicles and reported that by measuring the pupil position and the duration and count of fixations on and off the screen, it is possible to observe the spatial awareness and monitor the points of attention of the operator.
For example, ref. [
29] investigated the use of mirrors for eye tracking during work at construction sites. Surprisingly, they found something different than expected: the operator spent less than 7% of his attention on the display. Studies on eye tracking open the door to obtaining objective information from the operator to make decisions regarding display design, for example, the use of head-up displays in the driver’s line of sight and support training of the operators to increase the SA of the driver as demonstrated by [
35], who reported that trained drivers had better performance and SA.
Reference [
24] performed a similar study and evaluated the visual attention distribution of drivers during automation and examined the influence of the scenarios around the driver on the increase in SA. These studies show that gaze fixation, pupil diameter, and saccades are the major metrics for predicting SA. As evidence, the study finds that a high number of fixations can be associated with the difficulty of gathering information, and additionally, saccade amplitudes are negatively correlated with SA, and the results have a high similitude to the study of [
62]. The observations further underscore the intricate interplay between visual search patterns and error reduction.
Similarly, ref. [
47] investigated adaptable systems. They examined the effects of pre-takeover visual engagement on situation awareness during automated driving. Their results suggested that natural driving without previously marked tasks benefits drivers’ SA more than asking drivers to pay more attention to the path when driving. The eye-tracking metrics, such as peripheral vision, pupil diameter, rate of saccades, and general fixation, suggest differences in the SA of drivers in observation windows of 7 s. They concluded that dispersed visual attention has a positive correlation with better SA. Studies such as those of [
62] support and validate the idea that SA in humans is related to the fixation of their eyes on relevant objects [
11], and various studies revealed a positive relationship between eye-tracking metrics and SA [
9].
Regarding distraction, reference [
21] presented the research of Recarte and Nunes (2000), who studied the relationship of SA with eye tracking to identify patterns in driver distraction. The review reported that higher fixation durations, higher pupil dilations, and lower fixation counts in the display of the vehicle or mirror are related to driver distraction. Likewise, the review also explained how fixations allow us to understand the visual perception processes and how much of the visual gaze is retained.
Concerning remembered information and mental workload, reference [
32] studied the count and duration of the fixations and their relation with different information retrieval patterns through the gaze; they also examined how the metrics are related to the information remembered by the driver and the behavior, as a part or due to the mental interpretation of the trajectory traversed rather than based on retrieving individual pieces of information.
Other studies [
30,
34,
54] explored the safety analysis of work zone complexity and the influence of different attention allocation strategies under mental workloads on SA based on the metrics of count and duration of fixations, diameter and position of the pupil, and gaze direction. These studies showed that an increase in the complexity of the driving zones increases the mental workload and decreases SA. Furthermore, the mental workload can increase by 37% if a secondary visual task is involved; this has immediate repercussions on the gaze behavior, leading to a lower perception of risks and a lower level of safety perception of the situation.
Additionally, ref. [
50] made an interesting statement regarding the construction of new adaptable systems that include the human–machine relationship with SA. They reported the ability of the operator to be prepared to “fallback-ready user”, even performing secondary tasks and recovering awareness in the main operation by studying SA with real-time data from eye trackers. Likewise, reference [
12] built a prediction model of SA during takeover transitions in conditionally automated driving with only eye-tracking data.
In terms of the metrics used, specifically, 89% of authors using at least three commonly employed eye-tracking metrics, such as gaze fixation, pupil diameter, and saccades, found eye tracking to be an objective indicator of SA. Fixations were the most utilized metric in the experiments, aligning with studies such as the one conducted by [
12]. It was found that within the relationships with the measurement of situational awareness in drivers, at the perceptual level (level 1), an excessive number of fixations might be associated with difficulty in gathering information during demanding tasks. Additionally, it was observed that distracted drivers had higher fixation durations. Furthermore, the mean fixation time of eye movement was noted to have the potential to measure situational awareness, as presented by [
54]. Combining saccades with fixations is the second most used metric for measuring SA, although saccade amplitudes were found to be negatively correlated with SA, as reported by [
12].
However, it is crucial to consider the limitations of using eye-tracking metrics. Certain metrics may excel in measuring perception (level 1 of SA) but may have less relevance to comprehension (level 2) and projection (level 3), as presented in the research by [
59].
In terms of the scientometric analysis, eye-tracking-related research on physiological measures of SA has experienced a rapid surge since 2015. Common themes associated with eye-tracking studies include automated driving, driver behavior, driving simulation, and SA. Most studies are concentrated on transportation research and human factors, with a higher concentration in countries such as the Netherlands, the USA, and China. This concentration provides an opportunity to delve into further research investigations from regions of the Americas. Regarding the demographic study within the compiled body of studies, a noteworthy trend was observed in the significant involvement of male participants, with a maximum of 1% being female. This gender imbalance could be a limitation and bias when generalizing outcomes predominantly from male samples. Moreover, the average age of participants is around 27 years, a factor that needs consideration in studies of assessment of SA requiring analysis of novice versus expert populations.
Furthermore, only 12.1% of studies on the assessment of SA with eye-tracking measures were conducted in real environments with industrial vehicles, presenting an opportunity for future research, such as studying industrial vehicle operators like forklift drivers. Likewise, the results suggest a need for more effort in conducting research in real-world environments for optimal validation of study variables. Although this approach may incur higher costs and require more extensive investment in ethical, safety, and data collection protocols, the advantages are notable. Similarly, the review uncovered the need for future research focused on the industrial environment, as such studies are scarce.
Likewise, concerning the measurement equipment and software used, Tobii Pro Lab, Lab version 1.232 and Tobii Pro X2-60 glasses (discontinued) were the preferred eye trackers, as reported in the majority of experiments. It is essential to note that some eye trackers may generate interference with operator equipment, and frequencies greater than 50 Hz are preferable. Additionally, in real environments, the use of wireless equipment may encounter interference due to the company’s infrastructure, potentially leading to signal loss and data loss. It is also crucial to consider the presence of natural light in the data collection space, as sunlight could interfere with data collection. Moreover, in experiment design, demographic and cultural characteristics should be considered due to differences in pupil color [
31].
Concerning the review process, the results demand a discussion regarding criteria such as validity and reliability. In terms of viability, this review presents outcomes similar to those found in existing reviews, for instance, by [
21,
41], particularly in terms of the relationships observed between physiological metrics measured with eye tracking and the assessment of SA.
Finally, regarding reliability, this review presents a systematic methodology that allowed us to compile demographic, statistical, and experimental design data, showing that the information collection remains consistent. However, further studies are necessary to identify variations across different study domains, distinct from those related to driving.
5. Conclusions
Collectively, the applications of SA evaluation have become extremely popular; however, this expansion of applications is accompanied by a wide range of challenges stemming from methodological intricacies and precision-related considerations in estimating driver awareness. In response, a combination of objective and subjective methodologies has become imperative to harmonize and align with the distinct requirements of each study. This synergy should aim to evolve into robust frameworks that can enhance the seamless integration of monitoring, measurement, and assessment of driver awareness, thereby fostering a more comprehensive and advanced approach.
In this review, we introduced driver SA assessment by the eye-tracking metrics framework and examined this framework based on a scientometric analysis, demographic comparison of experiments (sample size, gender, age, and the field of application), eye-tracking metrics, oculomotor events, the effects of the environment surrounding the experiments (naturalistic or simulated driving), the preferred type of eye-tracker devices, and emphasis on the discussion of the relationship between SA and eye tracking in the field of driving. We showed that keyword clusters for physiological measures and comprehension of driver behavior are the most used approaches in the literature reviewed.
Our results also revealed a relationship between eye-tracking metrics and SA, especially at perception level 1; furthermore, the results revealed how eye-tracking metrics contribute objectively to the assessment of the driver’s gaze behavior, mainly in simulated environments and less so in naturalistic environments.
The most popularly used eye-tracking metrics for the study of SA are fixation, saccade, and pupillary metrics. The preferred eye trackers for the experiments are those that are less intrusive for the operator and those that possess a wireless connection. These results can support decision makers in selecting appropriate eye-tracking metrics to integrate into experiments, eye-tracker types, and information for designing data collection protocols.
Future research will be based on the challenges in the studies of driver awareness, the need for efforts in the study of driver awareness in industrial environments, the inclusion of bigger samples of women drivers, and more studies in naturalistic driving environments that allow the study of real-time data from actual environments. Likewise, the review aspires to clarify the relation between SA and eye tracking toward future work in the design of driving assistance solutions based on the study of driver behavior in risk situations or situations with mental workload and by using support alert systems. Thus, safer behavior can be realized, and accidents can be reduced by improving the SA of the driver.


