Article

Nonlinear Semi-Numeric and Finite Element Analysis of Three-Point Bending Tests of Notched Polymer Fiber-Reinforced Concrete Prisms

Faculty of Civil Engineering, Transportation Engineering and Architecture, University of Maribor, Smetanova ulica 17, 2000 Maribor, Slovenia
*
Authors to whom correspondence should be addressed.
Appl. Sci. 2024, 14(4), 1604; https://doi.org/10.3390/app14041604
Submission received: 21 December 2023 / Revised: 29 January 2024 / Accepted: 14 February 2024 / Published: 17 February 2024
(This article belongs to the Special Issue Mechanical and Structural Behavior of Fiber-Reinforced Concrete)

Abstract

:
A nonlinear semi-numeric and finite element analysis of three-point bending tests of notched polymer fiber-reinforced concrete prisms was performed. The computational and experimental results were compared in terms of the load-displacement behavior. The vertical midspan displacement and the crack mouth opening displacement results were considered. The nonlinear semi-numeric computational procedure involved the moment-curvature relation, calculated by considering the constitutive material law from the fib Model Code for Concrete Structures 2010, and considered a plastic hinge mechanism to simulate the cracked region behavior. Two sets of tensile mechanical properties were considered for the constitutive material law: back-calculated (by an inverse analysis) tensile strength properties from the experimental results, and tensile strength properties calculated by simplified expressions from the fib Model Code for Concrete Structures 2010. Other mechanical properties were determined by additional compressive tests and standard relations for the dependency of various mechanical properties on the concrete compressive strength. The nonlinear finite element analysis incorporated the Menetrey-Willam material model to simulate the fiber-reinforced concrete behavior. The nonlinear semi-numeric analysis load-displacement results based on the back-calculated tensile strength properties relatively accurately matched with the experimental results, whereas the nonlinear semi-numeric analysis load-displacement results based on tensile strength properties calculated by simplified expressions from the fib Model Code for Concrete Structures 2010 and the nonlinear finite element analysis load-displacement results showed certain shortcomings.

1. Introduction

Fiber-reinforced concrete is a widely used material nowadays. The most common fiber type is steel fiber [1], but in recent years, polymer fibers have gained popularity [2] due to their insensitivity to corrosive environments. Adding polymer fibers to concrete does not significantly increase the concrete tensile strength (stress that results in crack formation). However, the fiber dosage heavily influences the residual tensile strength of concrete in terms of the load-bearing capacity after crack formation. Subjecting structural components made of polymer fiber-reinforced concrete to uniform tensile loading leads to nonlinear load-displacement behavior, with flexural loading accentuating this effect even further.
Different computational procedures were developed to capture fiber-reinforced concrete’s highly nonlinear load-displacement behavior. The most common is the plastic hinge approach, as mentioned in [3], where three different kinematic assumptions are also mentioned, which are usually considered for the plastic hinge. The first assumption considers that the crack surface remains plane and the crack opening angle equates to the overall angular deformation of the nonlinear plastic hinge [4]. The second assumption is similar to the first one as it (in addition to the first assumption) considers that the curvature varies parabolically across the plastic hinge length between the uncracked cross-section and the cracked cross-section [5]. The third assumption considers that the crack surface does not remain plane [6]. With the resulting relation (based on one of the three assumptions) between the plastic hinge rotation and the bending moment, the load-displacement relation, according to [3], can be calculated as the sum of the classical beam theory displacement and the displacement due to the plastic hinge rotation according to rigid body rotation. In [7], a semi-analytical model for the flexural behavior of fiber-reinforced concrete was presented, where the midspan displacement was calculated as the sum of the classical beam theory displacement and displacement due to a rotation at the crack. The rotation at the crack was calculated as the ratio of the crack width to the crack depth. The crack width was calculated by expressions from [8], which directly relate the crack width to the acting bending moment. In [9], closed-form solutions for the flexural response of fiber-reinforced concrete members were presented based on a simplified constitutive model where linear elastic behavior up to the tensile strength, a constant residual tensile strength, and the elastoplastic behavior under compression were considered. A simplified bilinear moment-curvature relation was calculated and used to calculate the displacements with Mohr’s moment-area method. In [10], similar closed-form solutions for the flexural response of fiber-reinforced concrete members were presented, with the main difference being in considering a four-linear constitutive model for tension and a parabola-rectangle constitutive model for the fiber-reinforced concrete. The study [11] compared the load-displacement responses of a concrete beam reinforced with classical steel and fiber reinforcement, calculated based on different constitutive models for fiber-reinforced concrete. A numerical model based on the moment-curvature relation and Mohr’s moment-area method was used for calculating the load-displacement behavior. While most studies on fiber-reinforced concrete consider rectangular cross-sections, in [12], a study on the load-bearing behavior of polymer fiber-reinforced concrete tetrapods with circular cross-sections is presented.
The finite element method is also an essential computational procedure for evaluating fiber-reinforced elements’ flexural behavior. Different approaches are used for the consideration of fibers and concrete. Usually, fiber-reinforced concrete is modeled as one material, for example, in [13], where a finite element analysis was used to simulate uniaxial tensile tests and four-point bending tests of fiber-reinforced concrete samples, or in [14], where the suitability of constitutive models of concrete for polyolefin fiber-reinforced concrete was evaluated by finite element numerical simulations of three-point bending tests. A different approach is the discrete modeling of randomly distributed and oriented fibers inside a concrete body, for example, in [15], where tensile and bending tests were simulated. As explained in [16], two primary modeling approaches can be discerned for conducting fracture analysis, which also covers the analysis of fiber-reinforced concrete elements. The two approaches are the discrete crack model and the smeared crack model. While the discrete crack model depicts cracks discretely and targets to simulate the initiation and propagation of predominant cracks, the smeared crack model captures the degradation process using a constitutive relation, thereby spreading the cracks across the continuum, which is a significant simplification of the problem in terms of required solver complexity. Moreover, an important factor for choosing the finite element modeling approach is the number of required input parameters and the complexity of determining the input parameters.
The predominant focus in current research addressing the load-displacement behavior of fiber-reinforced concrete revolves around steel fibers. After all, the guidelines and expressions for fiber-reinforced concrete outlined in the fib Model Code for Concrete Structures 2010 [17] primarily derive from experiences with steel fiber-reinforced concrete. This article, therefore, addresses the load-displacement behavior of polymer fiber-reinforced concrete, providing a focused examination distinct from the prevalent emphasis on steel fibers in the existing literature. The content of this article stems from an attempt to determine the mechanical properties of a certain polymer fiber-reinforced concrete mixture, which was experimentally tested with standardized compressive tests on cubic samples and with standardized three-point bending tests on notched prisms. Two computational procedures were employed to assess the experimental results and to determine the mechanical properties. The first computational procedure was a nonlinear semi-numeric analysis, which included the calculation of the moment-curvature relation for multiple cross-sections of the notched prisms by the bisection method and the displacement calculation at the prism midspan by the virtual work method, where a plastic hinge mechanism captured the cracked region behavior. The second computational procedure was a nonlinear finite element analysis that employed the Menetrey-Willam material model to simulate the behavior of fiber-reinforced concrete. The load-displacement results from the nonlinear semi-numeric analysis and the nonlinear finite element analysis were analyzed and compared with the experimental load-displacement results. The applicability and limitations of the employed computational procedures based on the material model for fiber-reinforced concrete of the fib Model Code for Concrete Structures 2010 [17] (used for the semi-numeric calculation) and of the Menetrey-Willam material model [18] (used for the finite element analysis) were addressed to ensure a comprehensive understanding of their effectiveness in simulating the behavior of polymer fiber-reinforced concrete.

2. Materials and Methods

Six polymer fiber-reinforced concrete prisms were tested under three-point bending conditions according to the EN14651 standard [19]. The prisms were designated with the names B23258/1–B23258/6. The bending tests were conducted at the Slovenian National Building and Civil Engineering Institute. The prisms had a length of 600 mm and a rectangular cross-section with a height (h) and width (b) of 150 mm. The prisms were notched at the midspan. The notched cross-section height (hsp) was 125 mm. The measurement of the notched cross-sections showed that the tolerance for the prism dimensions could be assumed to be less than 1 mm (Table 1). Each prism’s notched cross-section width was measured four times, while the height was measured two times, and then the measurements were averaged.
The three-point bending configuration can be seen in Figure 1. The span length was 500 mm. Instead of measuring the crack mouth opening displacement (CMOD), the vertical midspan displacement was measured (with a linear transducer). Although the test procedure of the EN14651 standard [19] was designed to determine the CMOD and residual tensile strength (understood as the tensile strength after crack formation), the standard gives the option to measure vertical midspan displacements instead. In order to determine the CMOD values, the EN14651 standard [19] gives a relation between the CMOD and vertical midspan displacement (δ) values, equal to:
δ = 0.85 · CMOD + 0.04   ( CMOD   and   δ   in   mm ) .
According to Equation (1), the specified CMOD load rates were transformed into vertical displacement load rates. Up to a vertical displacement of 0.13 mm, the displacements were increased at a constant rate of 0.08 mm/min. After reaching the displacement of 0.13 mm, the displacements were increased at a constant rate of 0.21 mm/min.
The concrete composition (mix design) can be found in Table 2. The concrete mix herein presented was designed to reach a characteristic compressive strength (on cylinders, according to the EN1992-1-1 standard [20]) of at least 25 MPa, respectively, the properties of strength class C25/30. After concrete pouring, the concrete prisms were wrapped in polyethylene foil and stored at room temperature, approximately 20 degrees Celsius. The bending tests were performed 49 days after concrete pouring.
In addition to the regular concrete components, 5 kg of the Barchip 48 [21] polymer fibers were added per cubic meter of the concrete composition. The fibers were added by hand into the batching plant’s concrete-mixing machine. The chosen polymer fibers were high-performance macro-synthetic polypropylene fibers designed for structural reinforcement in precast, paving, and flooring works [21]. They can be classified as Class-II fibers (according to the EN 14889-2 standard [22]), generally used where an increase in residual flexural strength is required. Table 3 summarizes the properties of BarChip 48 fibers.
In order to disclose the potential impact of the relatively high fiber dosage on the compressive strength, compression tests following the EN12390-3 standard [23] were performed (Figure 2). The compression tests were performed on three cubes without fibers (designated with the names BV1–BV3) and three cubes with fibers (designated with the names ZV1–ZV3). After concrete pouring, the cubes were wrapped in polyethylene foil and stored at room temperature, approximately 20 degrees Celsius. The compression tests were performed on cubes with side lengths of 15 cm, 37 days after concrete pouring.

3. Results

The results of the load-versus-displacement curves for the midspan displacement in the vertical direction are shown in Figure 3. The tests were stopped at a displacement of around 3.5 mm, as this displacement already covers all the questioned CMOD values. For prisms B23258/2 and B23258/3, where data-compiling errors occurred, the results are only given for displacements of up to approximately 2.5 mm.
The residual load-bearing capacities were determined for the marked displacement values in Figure 3 (0.47 mm, 1.32 mm, 2.17 mm, and 3.02 mm), which, according to the EN14651 standard [19], correspond to the specified CMOD values (0.5 mm, 1.5 mm, 2.5 mm, and 3.5 mm). The maximum force (Fmax) and force (Fi) values corresponding to the specified displacements (F0.47, F1.32, F2.17, and F3.02) are given in Table 4. The corresponding stress values (residual flexural tensile strength values (σi)) were calculated by considering the notched cross-section dimensions in Table 1 under the assumption of a linear stress distribution (as specified by the EN14651 standard [19]). The results’ average and standard deviation values are in the last four columns (Faver.i, Fsd.i, σaver.i, and σsd.i).
The results show that the residual tensile strength (a result of the fibers) values were smaller than the tensile strength values of the concrete (it was assumed that the fibers did not affect the concrete’s mechanical properties prior to crack formation), usually described as softening behavior. However, after crack formation, the loads increased with increasing displacements (and CMOD values), which is described as post-crack hardening behavior (see [17]). All fiber-reinforced prisms failed in the same way. A crack formed at the notch and propagated toward the point of load application, which is the desired failure mode, as per the EN14651 standard [19]. The fiber-reinforced prisms can be seen in Figure 4.
The results of the compression tests can be found in Table 5. The individual cube results are designated as fc, while the averaged results for the compressive strength are designated as fc.aver.
The results of the compression tests show that the fibers, to some extent, negatively affected the compressive strength of the concrete. This might be the consequence of the relatively high fiber dosage, which is in line with the explanation in [17], where it is stated that the fiber’s effect on elastic properties and compressive strength is usually not significant, with the exemption of a high fiber dosage. The typical failure modes of the concrete cubes are shown in Figure 5.
The failure modes of the unreinforced and reinforced cubes were satisfactory according to the EN12390-3 standard [23]. However, despite the cracks, the fiber-reinforced cubes retained some of their form, and only after removing the cracked parts by hand could the actual failure modes (or failure planes) be seen. It can be concluded that the failure modes of both the unreinforced and reinforced cubes were similar.
In order to compare the anticipated strength values at an age of 28 days after concrete pouring and the measured concrete compressive strength values, the following equation from the EN1992-1-1 standard [20] for estimating the development of the mean compressive strength of concrete (fcm(t)) was used:
f cm ( t ) = exp s · 1 28 t 1 2 · f c m . 28 ,
where t is the concrete age after pouring (in days), s is a coefficient that depends on the type of cement (equal to 0.2 for the used cement), and fcm.28 is the mean compressive strength of the concrete at age 28 days after pouring. Considering the age of the fiber-reinforced concrete cubes at testing (37 days), the mean compressive strength at an age of 28 days after pouring was estimated to be 44.17 MPa for cubes and 35.34 MPa for cylinders. A value of 1.25 was considered for the ratio of the compressive strength determined on cubes and cylinders (at a concrete age of 37 days after pouring, the estimated “cylinder” mean compressive strength was 36.26 MPa). The characteristic compressive strength determined on cylinders was assumed to be 27.34 MPa (8 MPa difference was considered for the difference between concrete’s characteristic and mean compressive strength). The used relations between the characteristic, mean, “cube” and “cylinder” compressive strength values were from the EN1992-1-1 standard [20]. It can be concluded that the chosen concrete composition (Table 2) resulted in a slightly higher compressive strength as anticipated by the mix-design.

4. Calculation

Two computational procedures were used to calculate the load-displacement response of the fiber-reinforced concrete prisms. The first type was a nonlinear semi-numeric computational procedure based on the moment-curvature relation and the virtual work method, while the second type was a nonlinear finite element analysis.

4.1. Moment-Curvature Relation Calculation

The moment-curvature relation of the notched cross-section was calculated to determine the mechanical properties of the fiber-reinforced concrete material. The calculation was based on the fiber-reinforced concrete constitutive model from the fib Model Code for Concrete Structures 2010 [17]. To construct the constitutive law of fiber-reinforced concrete in tension, the crack widths (w) must be converted into strains (ε). This can be performed using the following relation:
ε = w l cs ,
where lcs is the characteristic structural length, considered equal to the cross-section height for elements without conventional reinforcement. The crack width (w), according to the fib Model Code for Concrete Structures 2010 [17], is considered equal to the crack mouth opening displacement (CMOD), which is measured at the bottom of the concrete prism (at the notch start), while the crack tip opening displacement (CTOD), measured at the notch end, is the more precise measure for the crack width (w). The CMOD and CTOD measurement locations are shown in Figure 6.
This inconsistency is partially compensated by considering simplified stress distributions across the cross-section height, as discussed in [13]. Hence, in this study, the CTOD values were considered for the crack widths, and the residual strength values at different crack widths were calculated by matching the internal bending moment to the applied bending moment (calculated from the experimental results). To calculate the CTOD, the following relation from the EN14651 standard [19] was considered: CMOD = 1.2 ∙ CTOD. The constitutive model for fiber-reinforced concrete is given in Figure 7, where all the important key points (coordinates) are marked.
The parabolic constitutive model for compression in Figure 7a takes into account the strain (εc1) at the maximum compressive stress (in our case, fcm), calculated by the following equation from the EN1992-1-1 standard [20]:
ε c 1 = 0.7 · f cm 0.31 ,
where εc1 is calculated in ‰, and fcm needs to be in MPa. The experimentally determined mean compressive strength of concrete was adjusted considering different ages of the concrete at compressive (37 days) and bending testing (49 days) according to Equation (2).
The modulus of elasticity at the concrete age of 28 days (Ecm.28) was also calculated from the mean compressive strength at the concrete age of 28 days with the following equation:
E cm . 28 = 22 · f cm . 28 10 0.3 ,
where Ecm.28 is calculated in GPa, and fcm.28 (the mean compressive strength of concrete at the age of 28 days needs to be in MPa). For the age of 49 days, the adjusted modulus of elasticity was calculated with:
E cm ( t ) = exp 0.3 · s   · 1 28 t 1 2 · E cm . 28 .
The multilinear constitutive model for tension in Figure 7b,c considers that the tensile stress-strain relation up to 90% of the tensile strength (fctm) is linear considering the modulus of elasticity Ecm. The strain at the tensile strength is equal to εP. After reaching the tensile strength, the stress-strain diagram curve (line) continues in the direction of the coordinate (εQ, 0.2∙fctm) but only up to the strain εc, which is calculated as the intersection point of the negative slope line of the stress-strain relation of plain concrete, after reaching the tensile strength, and of the line of the stress-strain relation of fiber-reinforced concrete between the coordinates (εSLS, fFts) and (εULS, fFtu) (see Figure 7b,c). The strain εQ can be calculated with:
ε Q = G F f ctm · l cs + ε P 0.8 · f ctm E cm ,
where GF is the fracture energy of plain concrete. GF can be calculated with:
G F = 0.73 · f cm 0.18 .
where GF is calculated in N/m (fcm needs to be in MPa). The strains εSLS and εULS correspond to the CMOD values of 0.5 mm and 2.5 mm. However, as explained before, the CTOD values are considered for calculating the strains (according to the relation ε = CTOD l cs ). The part of the constitutive law in Figure 7b,c with tensile strains larger than εc differs from the constitutive law of plain concrete. It indicates the specifics (differences) of the mechanism of fiber-reinforced concrete’s behavior compared with plain concrete. The fiber action is activated at larger strains (strain values at crack formation) and starts to dominate at larger strains (at larger crack widths).
The multilayer method was chosen to calculate the moment-curvature relation (refer to [24] for a detailed explanation). It was decided to divide the cross-section into 1500 layers. The bisection method was employed to calculate the strain at the bottom edge of the cross-section for different curvature values. The corresponding loads (forces) were calculated from the resulting bending moment in the cross-section (by applying equilibrium conditions for forces and bending moments in the cross-section). The expressions of the equilibrium of forces and moments in the cross-section section were incorporated as:
i = 1 1500 σ i · b · t sl = 0 ,
M Ed i = 1 1500 σ i · b · t sl · y sl , i = 0 ,
where σ i is the stress in the i-th layer of the cross-section (calculated for the strain of the i-th layer ε i from the stress-strain relation presented in Figure 7), and y sl , i is the distance of each layer’s center of gravity to the cross-section’s bottom edge.
A loop calculation was carried out by varying the tensile strength of the concrete f ctm and the residual strengths f Fts and f Ftu . The calculation was repeated until the difference between the experimental and calculated maximum load-bearing capacities, the residual load capacities at a CMOD of 0.5 mm, and the residual load-bearing capacities at a CMOD of 2.5 mm were less than 1 N. The input parameters and the back-calculated tensile strength value results of the calculation are given in Table 6.
The fib Model Code for Concrete Structures 2010 [17] also gives expressions for determining the residual tensile strength values at CMOD values of 0.5 mm ( f Fts ) and 2.5 mm ( f Ftu ). Two simplified stress–crack opening constitutive laws for considering different stress distributions are defined: the rigid plastic model with constant tensile stresses in the cross-section (meant only for calculating the load-bearing capacity at a CMOD value of 2.5 mm) and the linear model (with different stress distributions at CMOD values of 0.5 mm and 2.5 mm). Based on the average experimental results for the rigid plastic model, the resulting f Ftu value is 0.90 MPa, whereas for the linear model, the resulting f Fts value is 0.94 MPa, and the resulting f Ftu value is 0.93 MPa. Compared with the calculation results for f Fts and f Ft u in Table 6, there are noticeable differences. As a result, the linear model assumes almost constant tensile stresses between CMOD values of 0.5 mm and 2.5 mm. Contrary to the experiments, the linear model even assumes a slight stress decrease for increasing CMOD values. This is a consequence of the assumption in the fib Model Code for Concrete Structures 2010 [17], where a value of 0.5 for the ratio of the residual flexural tensile strength values (σi in Table 4) at CMOD values of 2.5 mm and 0.5 mm is considered to calculate the residual tensile strength value ( f Ftu ) at the CMOD value of 2.5 mm (an explanation is given in [13]). The fib Model Code for Concrete Structures 2010 [17] also relates the flexural tensile strength to the (uniaxial) tensile strength. This relation results in an estimated tensile strength (based on the average maximum load in Table 4) of 2.89 MPa (for the considered cross-section height of 125 mm, the calculated ratio of the flexural tensile strength and the tensile strength is 1.57), which is close to the tensile strength result of the inverse analysis in Table 6. Interestingly, in [13], expressions for f Ftu and f Fts are presented, which are the basis of the fib Model Code for Concrete Structures 2010 [17] expressions; however, they are in a less-simplified form. The expressions are derived by considering a linear distribution of stresses in the cross-section (linear model) and the equilibrium conditions of forces and moments in the cross-section. The resulting residual strength values (0.77 MPa and 0.98 MPa, according to expressions from [13]) are relatively closer to the back-calculated values in Table 6.
The resulting bending moment versus curvature relation for the notched and the gross (without notch) cross-section is given in Figure 8. The bending moment versus curvature relation for the notched cross-section, based on tensile strength values resulting from the simplified expressions of the fib Model Code for Concrete Structures 2010 [17], is given for additional comparison. For the strains of εc, εSLS, and εULS, the values 4.088 × 10⁻⁴, 4 × 10⁻³, and 2 × 10⁻² were considered. Note that for the moment-curvature relation (based on the simplified expressions for the tensile strength values from the fib Model Code for Concrete Structures 2010 [17]), the strains εSLS and εULS were calculated considering the CMOD values for the crack width in Equation (3).
In Figure 8, key strains at the notched cross-section’s bottom edge (εbot) are additionally marked. The maximum load-bearing capacity is reached after the cross-section cracks and the load slightly increases. The strain at the bottom of the notched cross-section, corresponding to the maximum load, also marked in Figure 8, is greater than the strain corresponding to the tensile strength (εP). The comparison of the bending moment versus curvature relations of the notched and the gross cross-section shows how the chosen notch depth ensures that at the load corresponding to crack formation in the notched cross-section, the gross cross-section curvature is still in the elastic region. The comparison of the bending moment versus curvature relations of the notched cross-section based on the constitutive law in Figure 7 and based on the constitutive law with tensile strength values according to the simplified expressions of the fib Model Code for Concrete Structures 2010 [17]) shows how the latter assumes an almost constant load-bearing capacity for large strains and how the latter results in a greater load-bearing capacity for strain values close to the strain εSLS.
The normal stress distributions on the notched cross-section for the load stages corresponding to the marked strains at the bottom of the notched cross-section in the moment-curvature diagram in Figure 8 are given in Figure 9.
The stress distributions across the notched cross-section height in Figure 9 show how the cross-section is already partially plasticized (cracked, respectively) when the maximum load-bearing capacity is reached. When the strain at the bottom of the cross-section increases, the plasticized region increases almost to the top of the cross-section, as does the crack (see Figure 6). This fact is also used for the rigid plastic model from the fib Model Code for Concrete Structures 2010 [17], where the compressive stress distribution is considered as a concentrated compression force at the top of the notched cross-section, and tensile stresses equal to the residual tensile stress f Ftu are evenly distributed over the whole cross-section.

Load-Displacement Calculation

A force-displacement relation calculation was performed to evaluate the two bending moment-curvature relations for the notched cross-section in Figure 8. The total deflection was calculated as the sum of the deflection from flexural and shear deformation. The displacement was calculated for load steps (values) corresponding to each curvature (κ) value from the moment-curvature relation (Figure 8) of the notched cross-section. For the load steps corresponding to the curvatures (κ) of the notched cross-section less than the curvature corresponding to the maximum bending moment (κ(Mmax)), the flexural deflection was calculated by integrating the curvature over the prism length (κ(x)) with the virtual bending moments resulting from a vertical virtual unit force at the midspan. For load steps corresponding to larger curvature values of the notched cross-section (κ > κ(Mmax)), the plastic hinge approach was applied. Many studies state different values for the appropriate plastic hinge lengths, as shown in [25], where different studies’ plastic-hinge lengths range from half of the cross-section height to twice the cross-section height for steel fiber-reinforced concrete. The plastic hinge length (Lp) applied for the deflection calculation in this study was equal to the height of the notched cross-section. After all, this value was already used (as the characteristic or structural characteristic length) for transforming the stress versus crack width relation to the stress versus strain relation in Figure 7.
For load steps corresponding to smaller curvature values of the notched cross-section (κ < κ(Mmax)), the notch effect was considered by linearly varying the curvature over the plastic hinge between the curvature of the gross cross-section (cross-section without the notch) and the curvature of the notched cross-section (Figure 10a). For load steps corresponding to larger curvatures of the notched cross-section (κ > κ(Mmax)), it was considered that the curvature over the plastic hinge is constant and equal to the notched cross-section curvature (Figure 10b). On the interval 0 ≤ x ≤ (L − Lp)/2, the curvature distribution (κ(x)) for each load step was determined from the gross cross-section bending moment versus the curvature relation.
It must be noted that if the flexural deflection for larger curvatures (κ > κ(Mmax)) was also calculated by integrating the curvatures and the virtual bending moments, a discontinuity in the load-displacement diagram would occur. Therefore, an approximation was used, where the contribution of the plastic hinge rotation to the displacement of a load step was accounted for by considering a plastic hinge rotation (φpl) equal to:
φ pl = ( κ κ 1 ) · L p 2 ,
where κ is the curvature of the notched cross-section, and κ1 is the curvature of the notched cross-section read from the positive slope part (with κ1 < κ(Mmax)) of the moment-curvature diagram in Figure 8. As shown in Figure 11, κ1 corresponds to a bending moment equal to the bending moment of the current load step (M(κ1) = M(κ)).
As the (quasi)elastic rotation (φel) of the prism segment of the plastic hinge is already counted in by the integration of the curvature over the prism length (κ(x)) with virtual bending moments, the curvature κ1 is subtracted from the total curvature of the notched cross-section κ in Equation (11). Finally, the flexural deflection (Δfl) of a load step is calculated with:
Δ fl = 2 · 0 L 2 κ ( x ) · M ( x ) ¯ dx   for   load   steps   with   κ   κ ( M max ) ,
Δ f l = 2 · 0 L 2 κ ( x ) · M ( x ) ¯ d x + φ p l · L 2   for   load   steps   with κ > κ ( M max ) ,
where M ( x ) ¯ are the virtual bending moments, L is the span length,   κ ( x ) is the curvature distribution over the prism length (with maximum value at the notch equal to κ(Mmax)), and κ is the curvature of the notched cross-section. Note that the curvature distributions (κ(x)) considered in Equations (12) and (13) both correspond to the curvature distribution in Figure 10a.
The shear displacement contribution was calculated by integrating the shear forces (for each load step) with the virtual shear forces and considering the shear correction factor (κS) equal to 0.83 (as, for example, per [26]). The shear displacement Δs was calculated with:
Δ s = 2 · 0 L 2 V ( x ) · V ( x ) ¯ E cm 2 · 1 + ν · κ S · A x dx ,
where A(x) is the cross-section area at location x (on the interval 0 ≤ x ≤ (L − Lp)/2 equal to the gross cross-section area and on the interval (L − Lp)/2 ≤ x ≤ L/2 equal to the notched cross-section area), V(x) is the shear force distribution, V ( x ) ¯ is the virtual shear force distribution, and ν is Poisson’s ratio for concrete (0.2). The total deflection (vertical displacement at the midspan) was calculated as the sum of the flexural (Δfl) and shear displacement (Δs). The results in the form of a load-displacement curve are given in Figure 12. The load-displacement results are also depicted based on the moment-curvature relation calculated by considering the tensile strength values determined directly by applying the expressions from the fib Model Code for Concrete Structures 2010 [17].
The results of the load-displacement calculation based on the back-calculated tensile strength values (by inverse analysis) in Figure 12 show post-crack hardening behavior, whereas the load-displacement results based on the tensile strength values from the expressions in the fib Model Code for Concrete Structures 2010 [17] show an almost constant load-bearing capacity for larger displacements. Besides the load evaluation at different load stages, the calculated displacement values can be compared with the displacement relations from the EN14651 standard [19]. As the calculation model relates the curvature values (κ) of the notched cross-section directly to the crack tip opening displacement (CTOD) values and crack mouth opening displacement (CMOD) values, the calculated values (δcalculated) and the displacement values defined as per the EN14651 standard [19] (δstandard), which correspond to specific CMOD values and CTOD values, are, together with the corresponding loads (F), given in Table 7 (based on the back-calculated tensile strength values) and Table 8 (based on the tensile strength values from expressions in the fib Model Code for Concrete Structures 2010 [17]) for comparison.
Noting that the EN14651 standard [19] relations are based on rigid body rotations due to the rotation at the notch, the comparison of the δcalculated and δstandard values in Table 7 suggests that the presented calculation model (with the back-calculated tensile strength values) matches with the EN14651 standard [19] relations between, on one side, the CMOD and CTOD values and, on the other side, the vertical displacement values. The comparison of the δcalculated and δstandard values in Table 8, with the results based on the tensile strength values from the expressions in the fib Model Code for Concrete Structures 2010 [17]), shows much larger discrepancies, with the difference between the δcalculated and δstandard displacement values being larger than 0.6 mm for larger displacements. This is a consequence of the fib Model Code for Concrete Structures 2010’s [17] consideration of the CMOD values as the crack width values. The actual CMOD value is larger than the crack width (CTOD) value. Consequently, for the load stage denoted by CMOD = 2.5 mm in Table 8 for the M-κ (fib) model, the displacements correspond to about 20% larger CMOD values. If this is considered, the actual displacements of the M-κ (fib) calculation at the actual CMOD values of 0.5 mm and 2.5 mm are equal to 0.480 mm and 2.220 mm, which are much closer to the δstandard values.

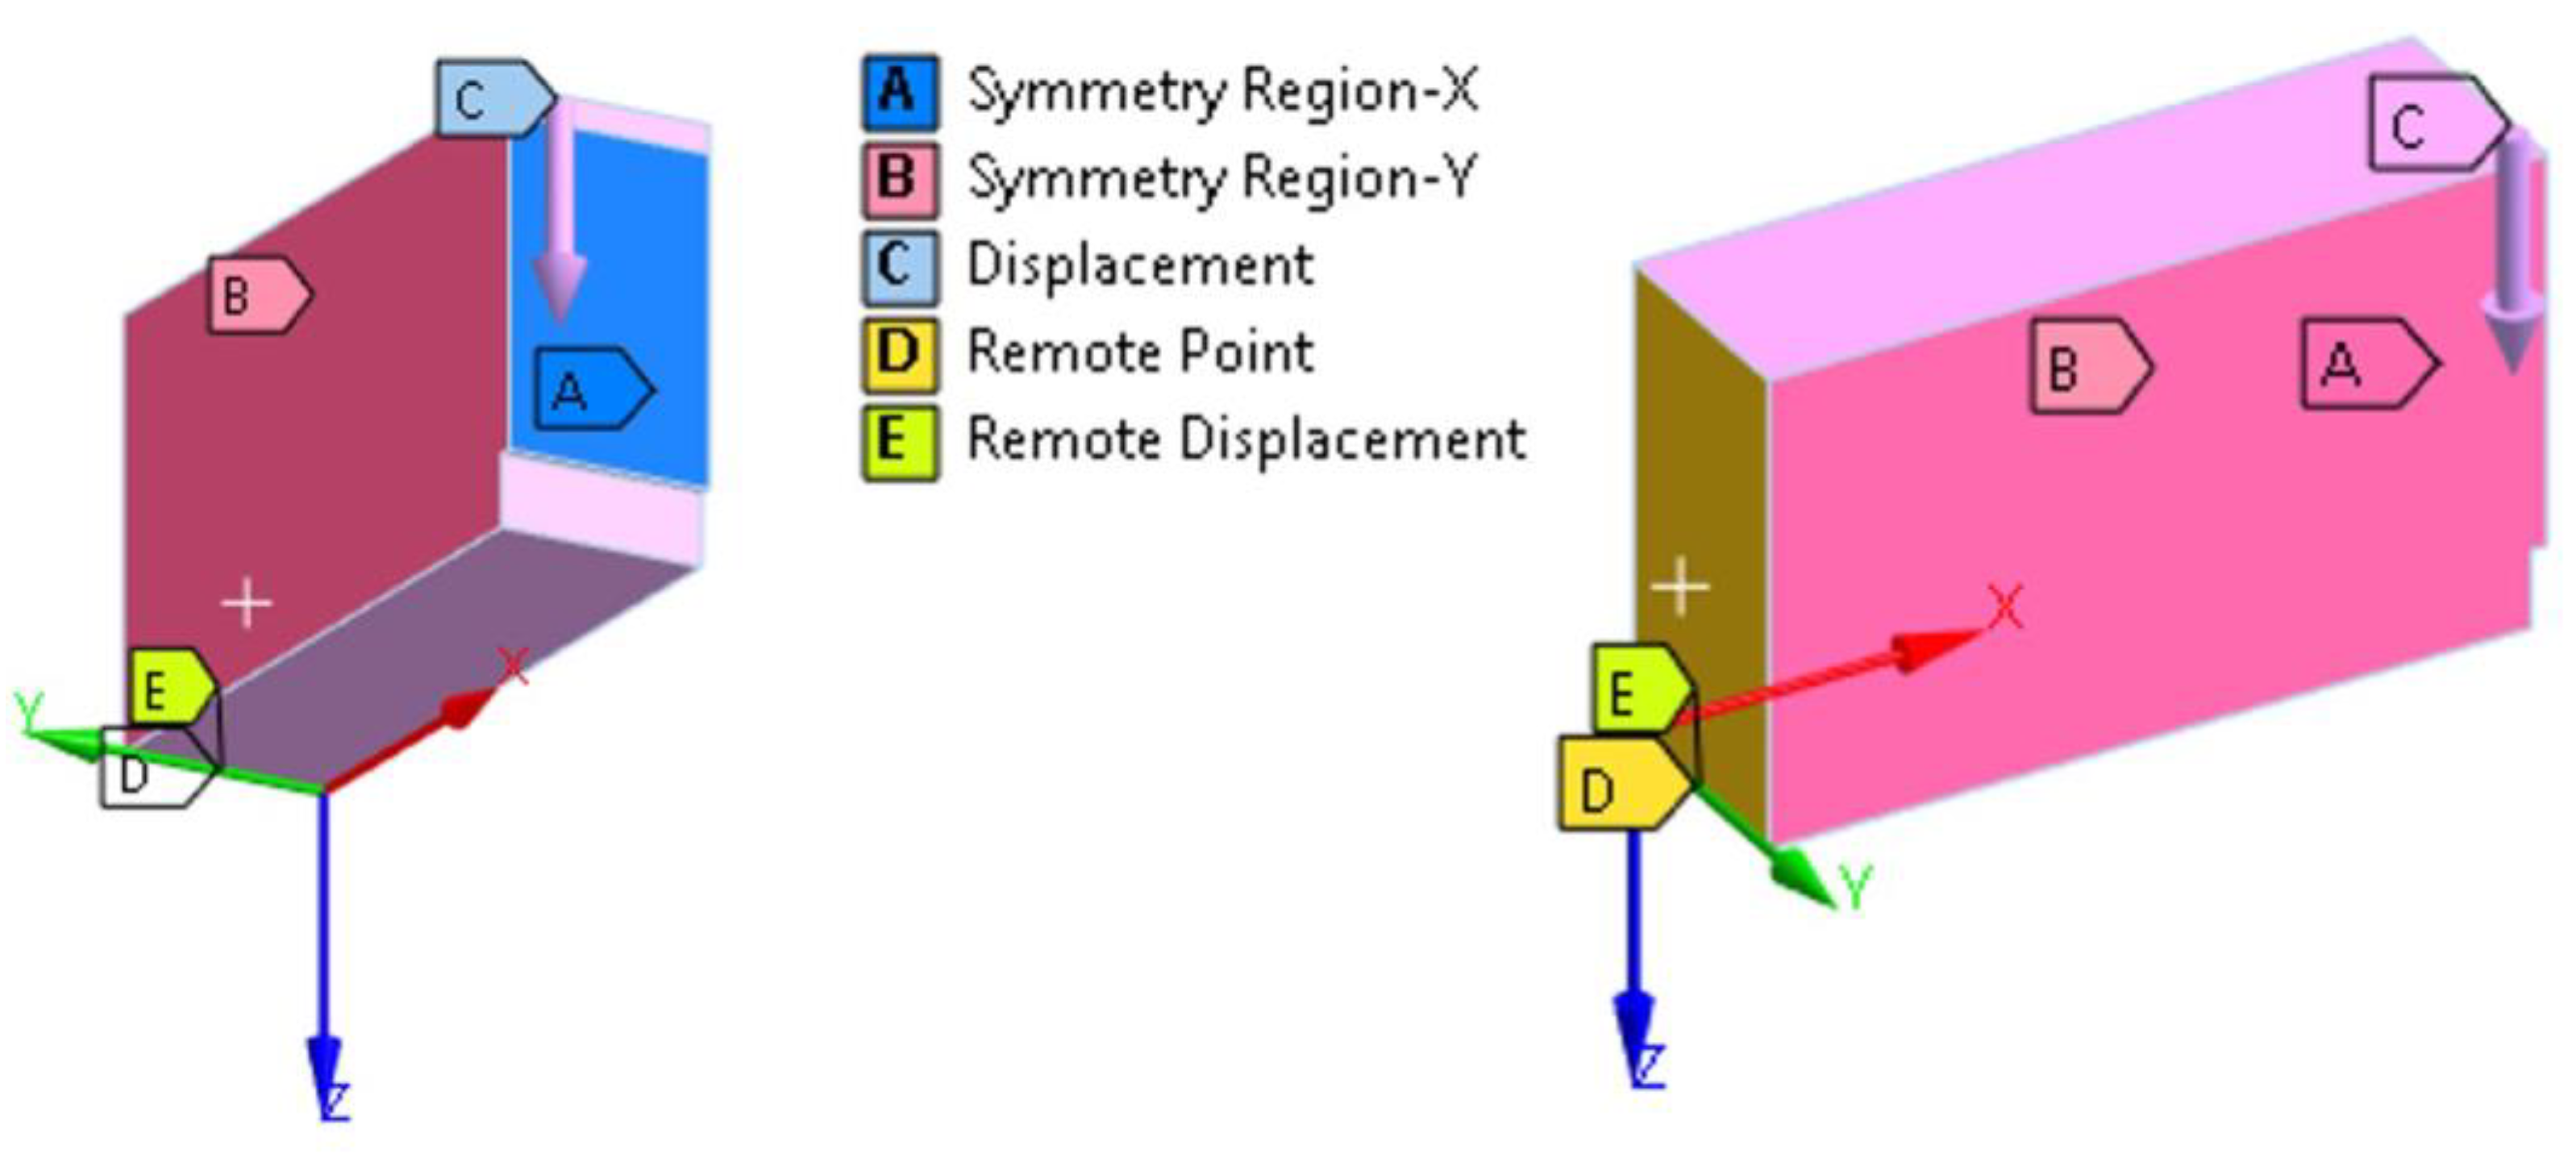
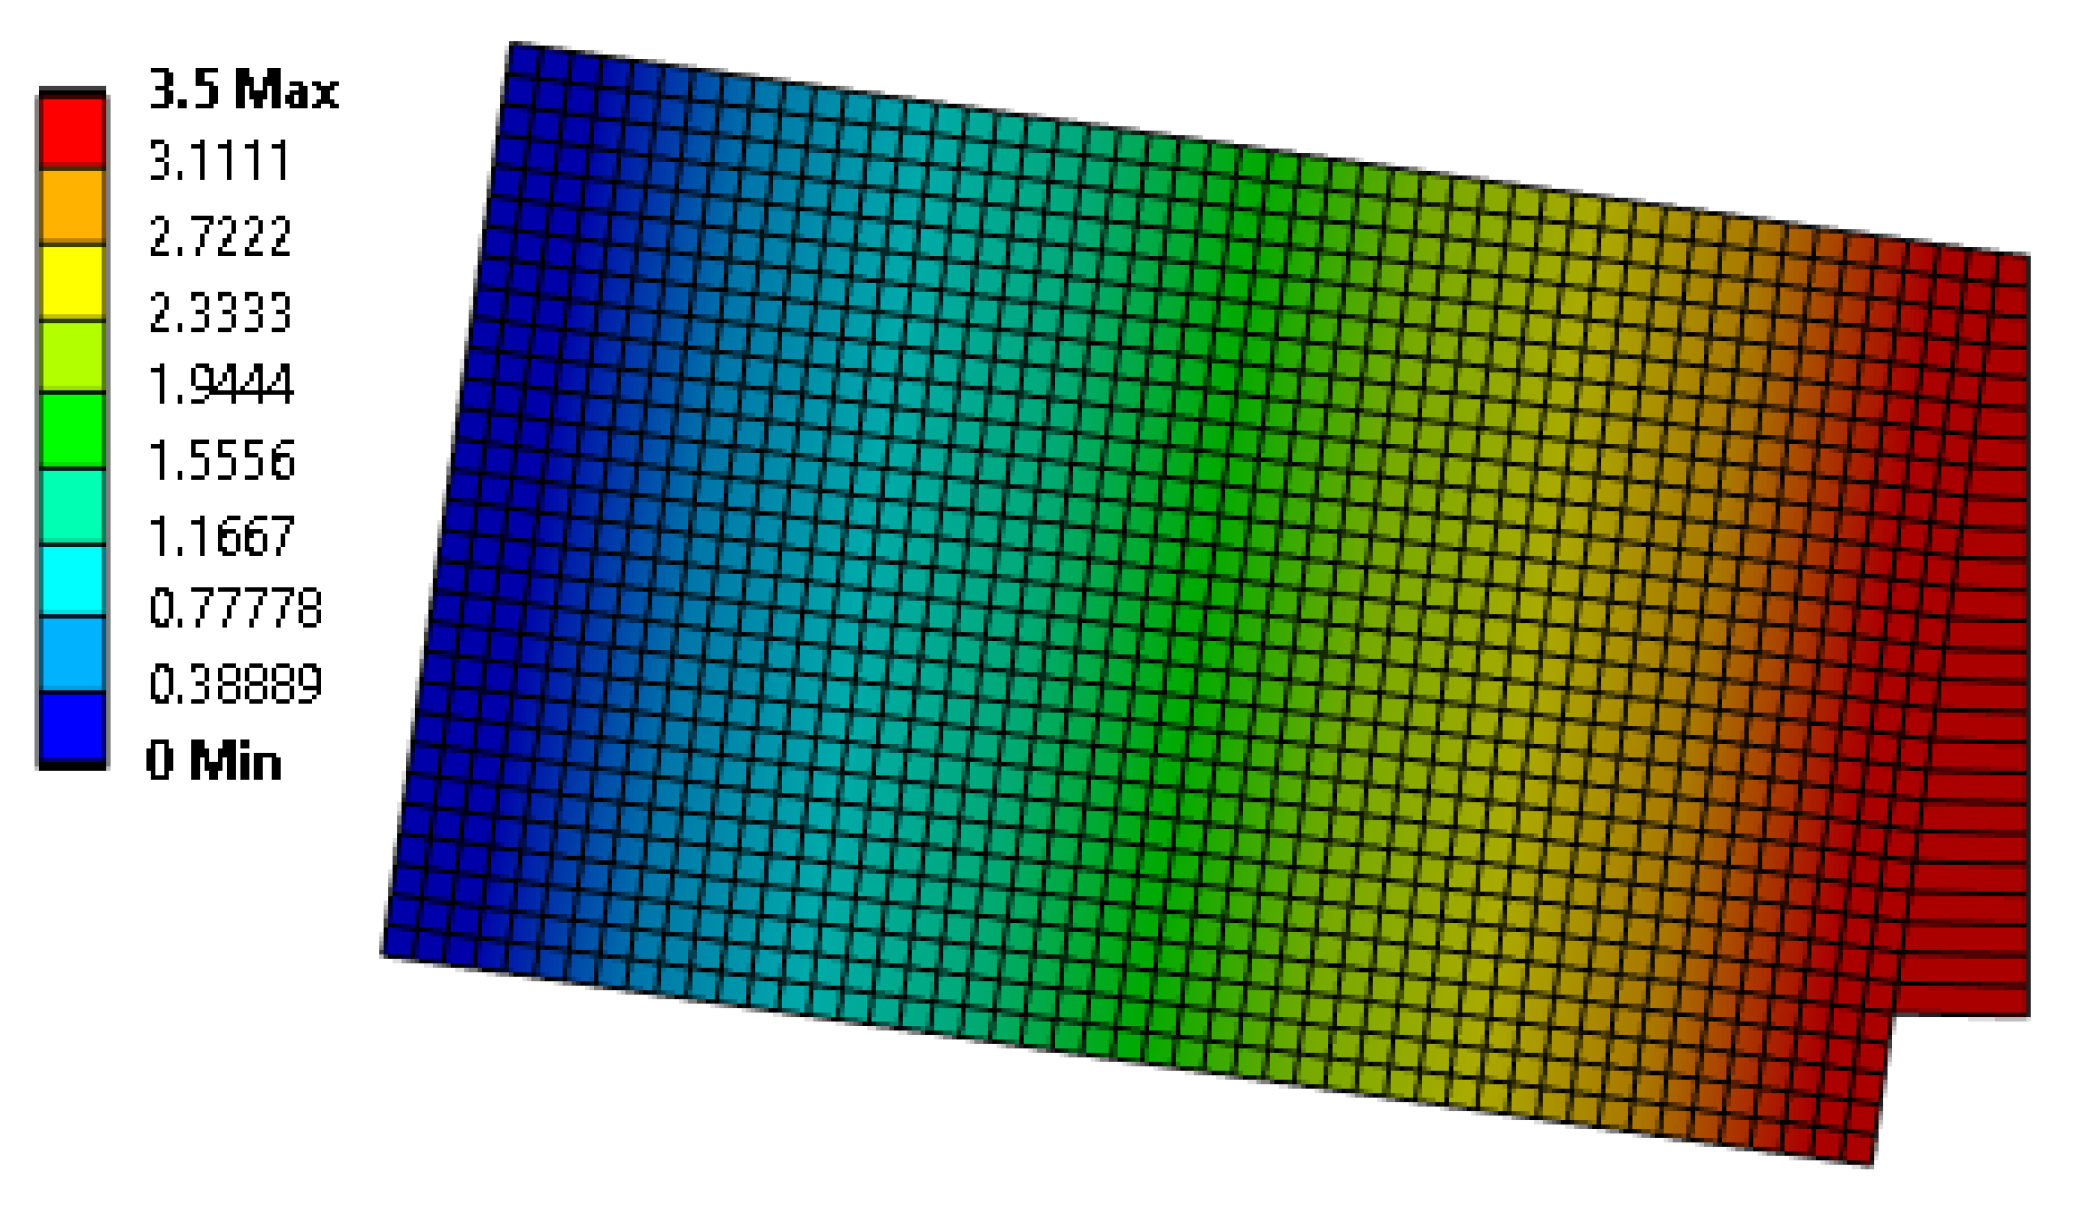
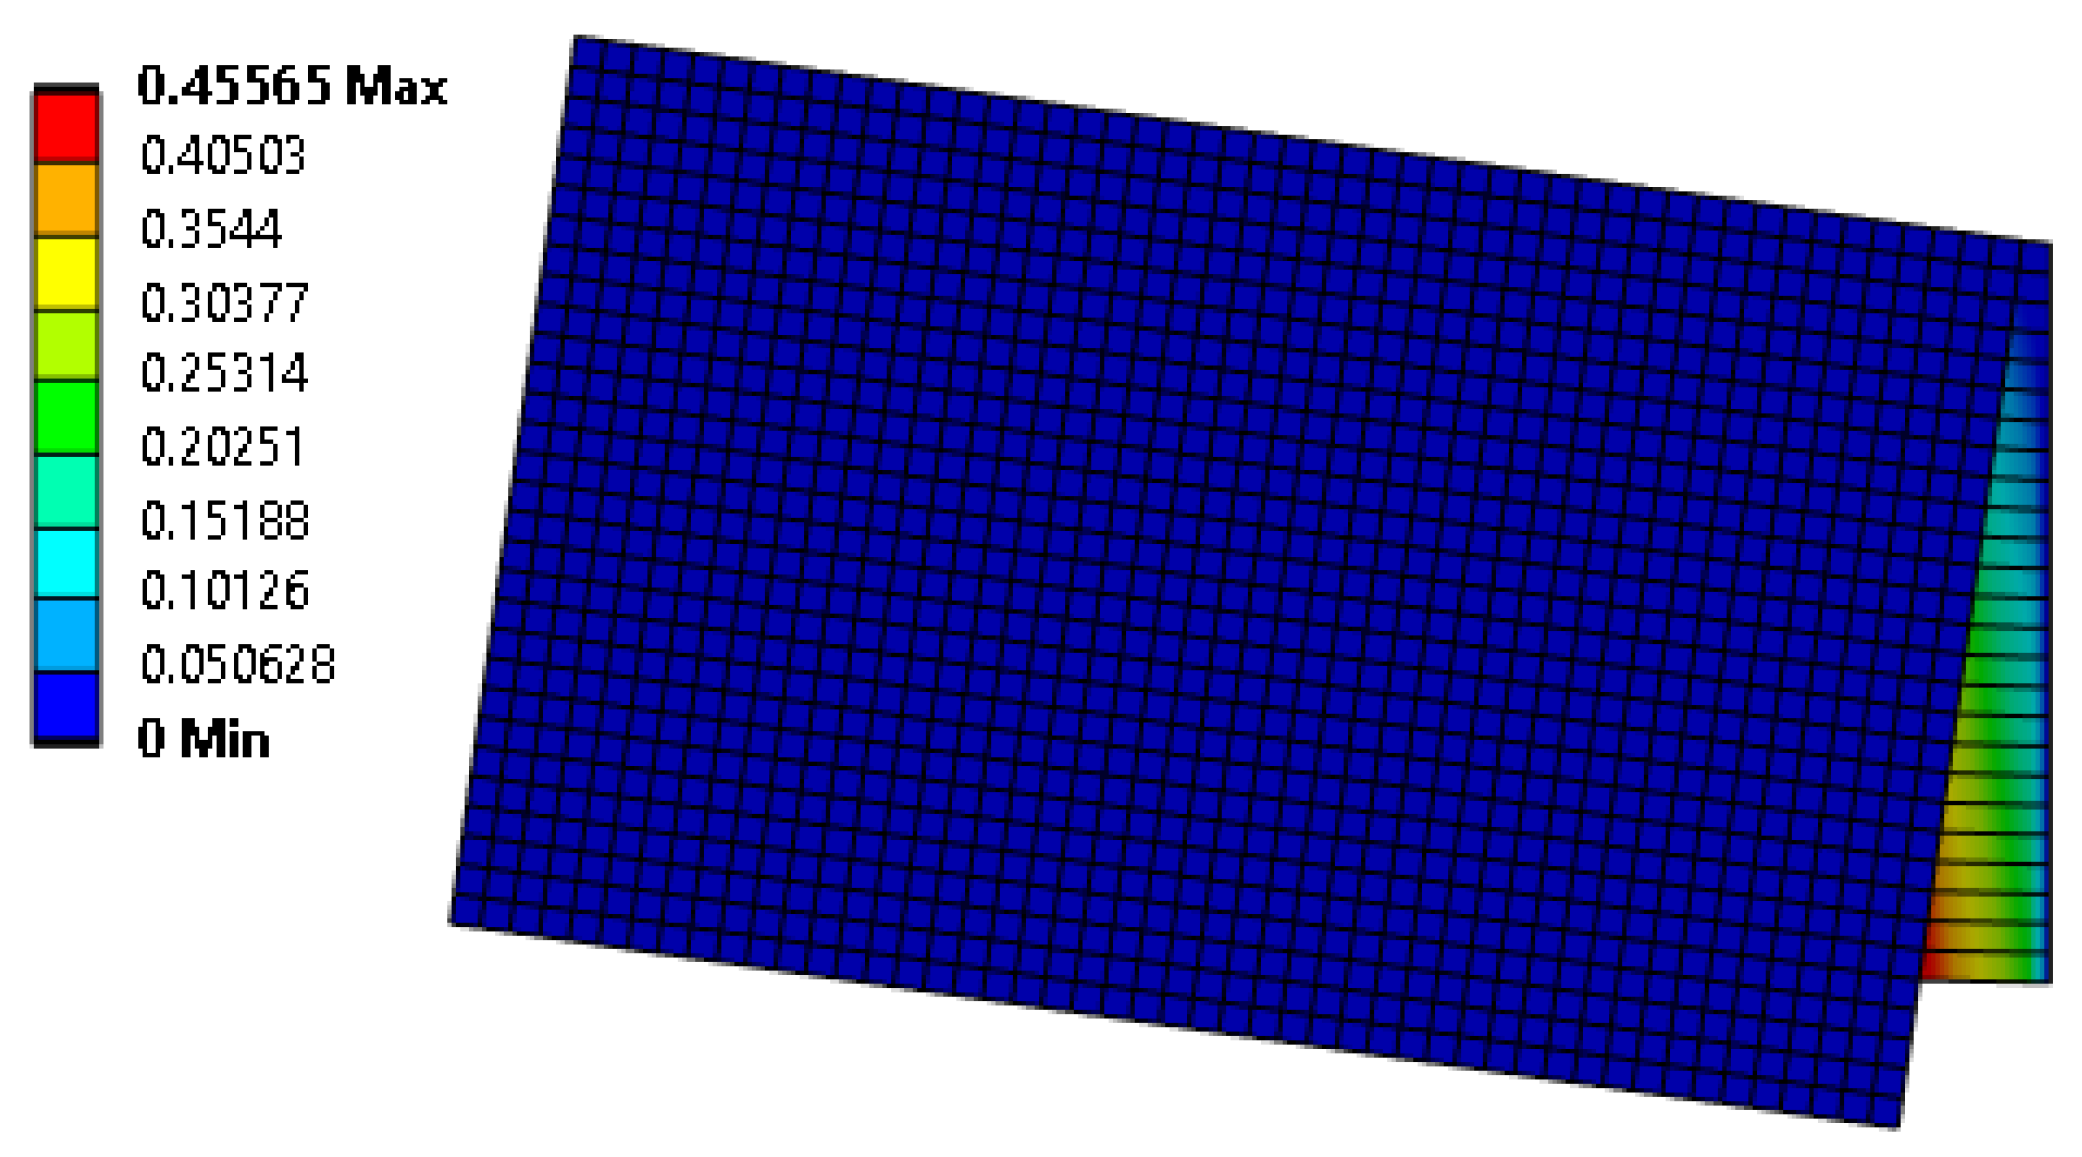
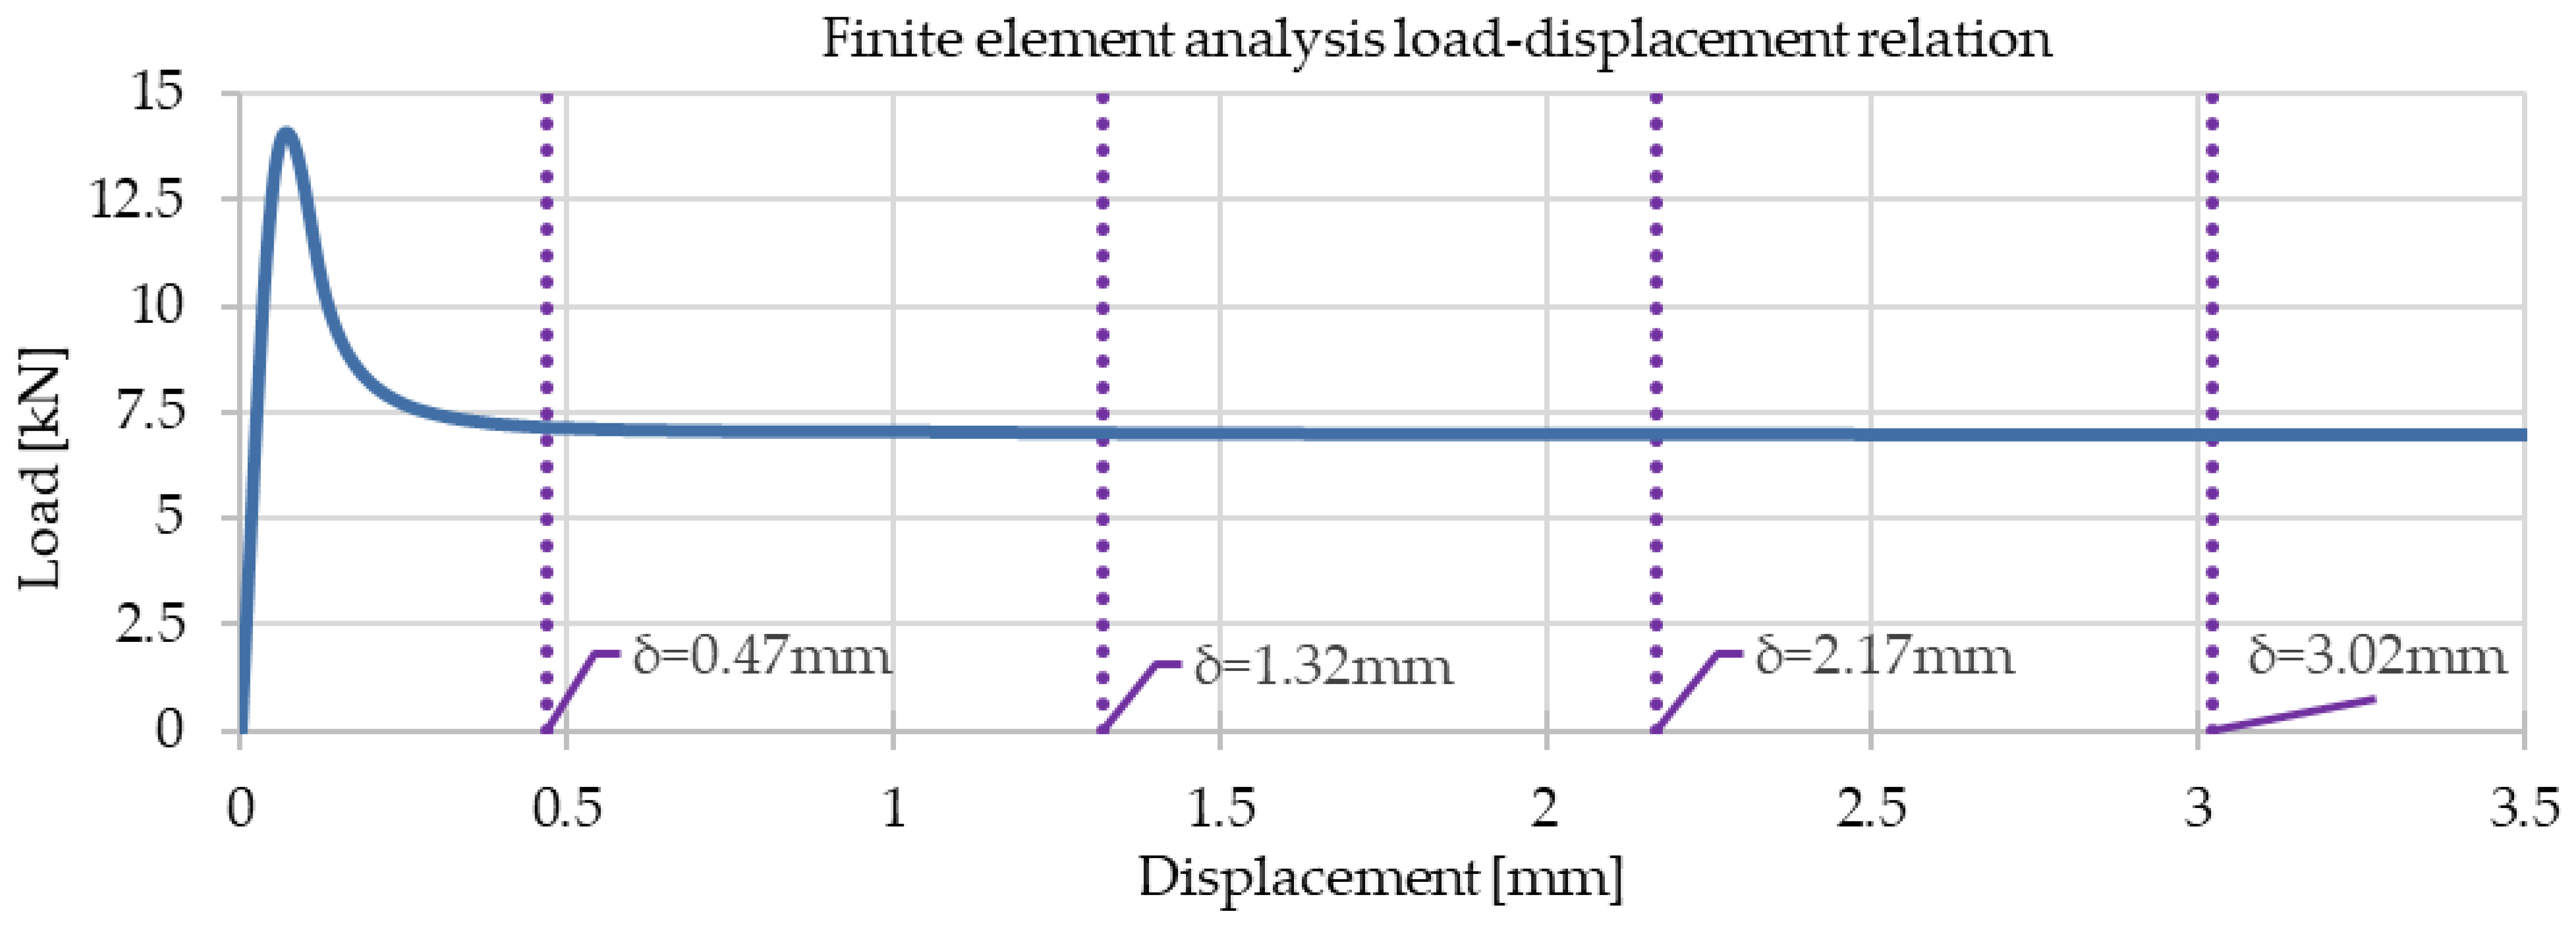
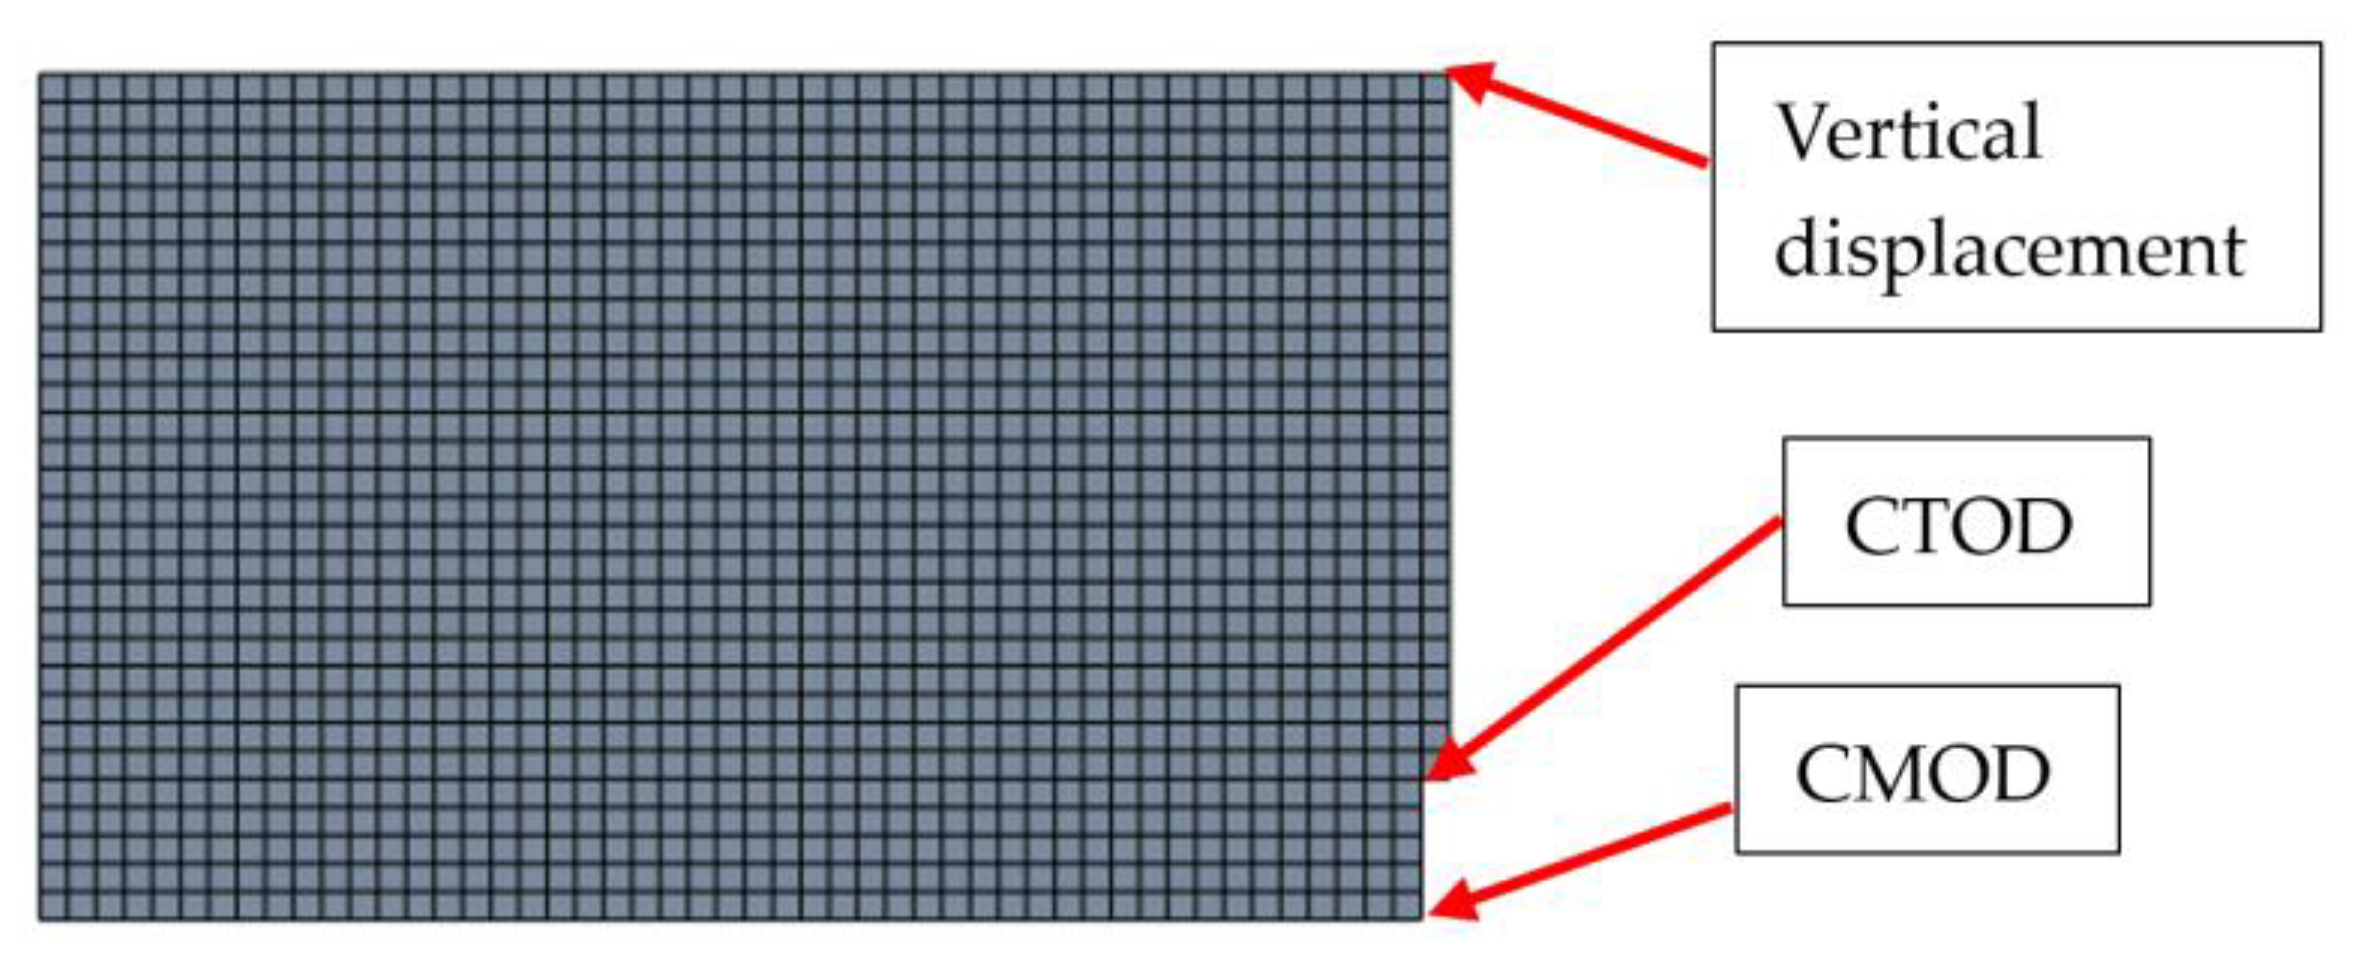
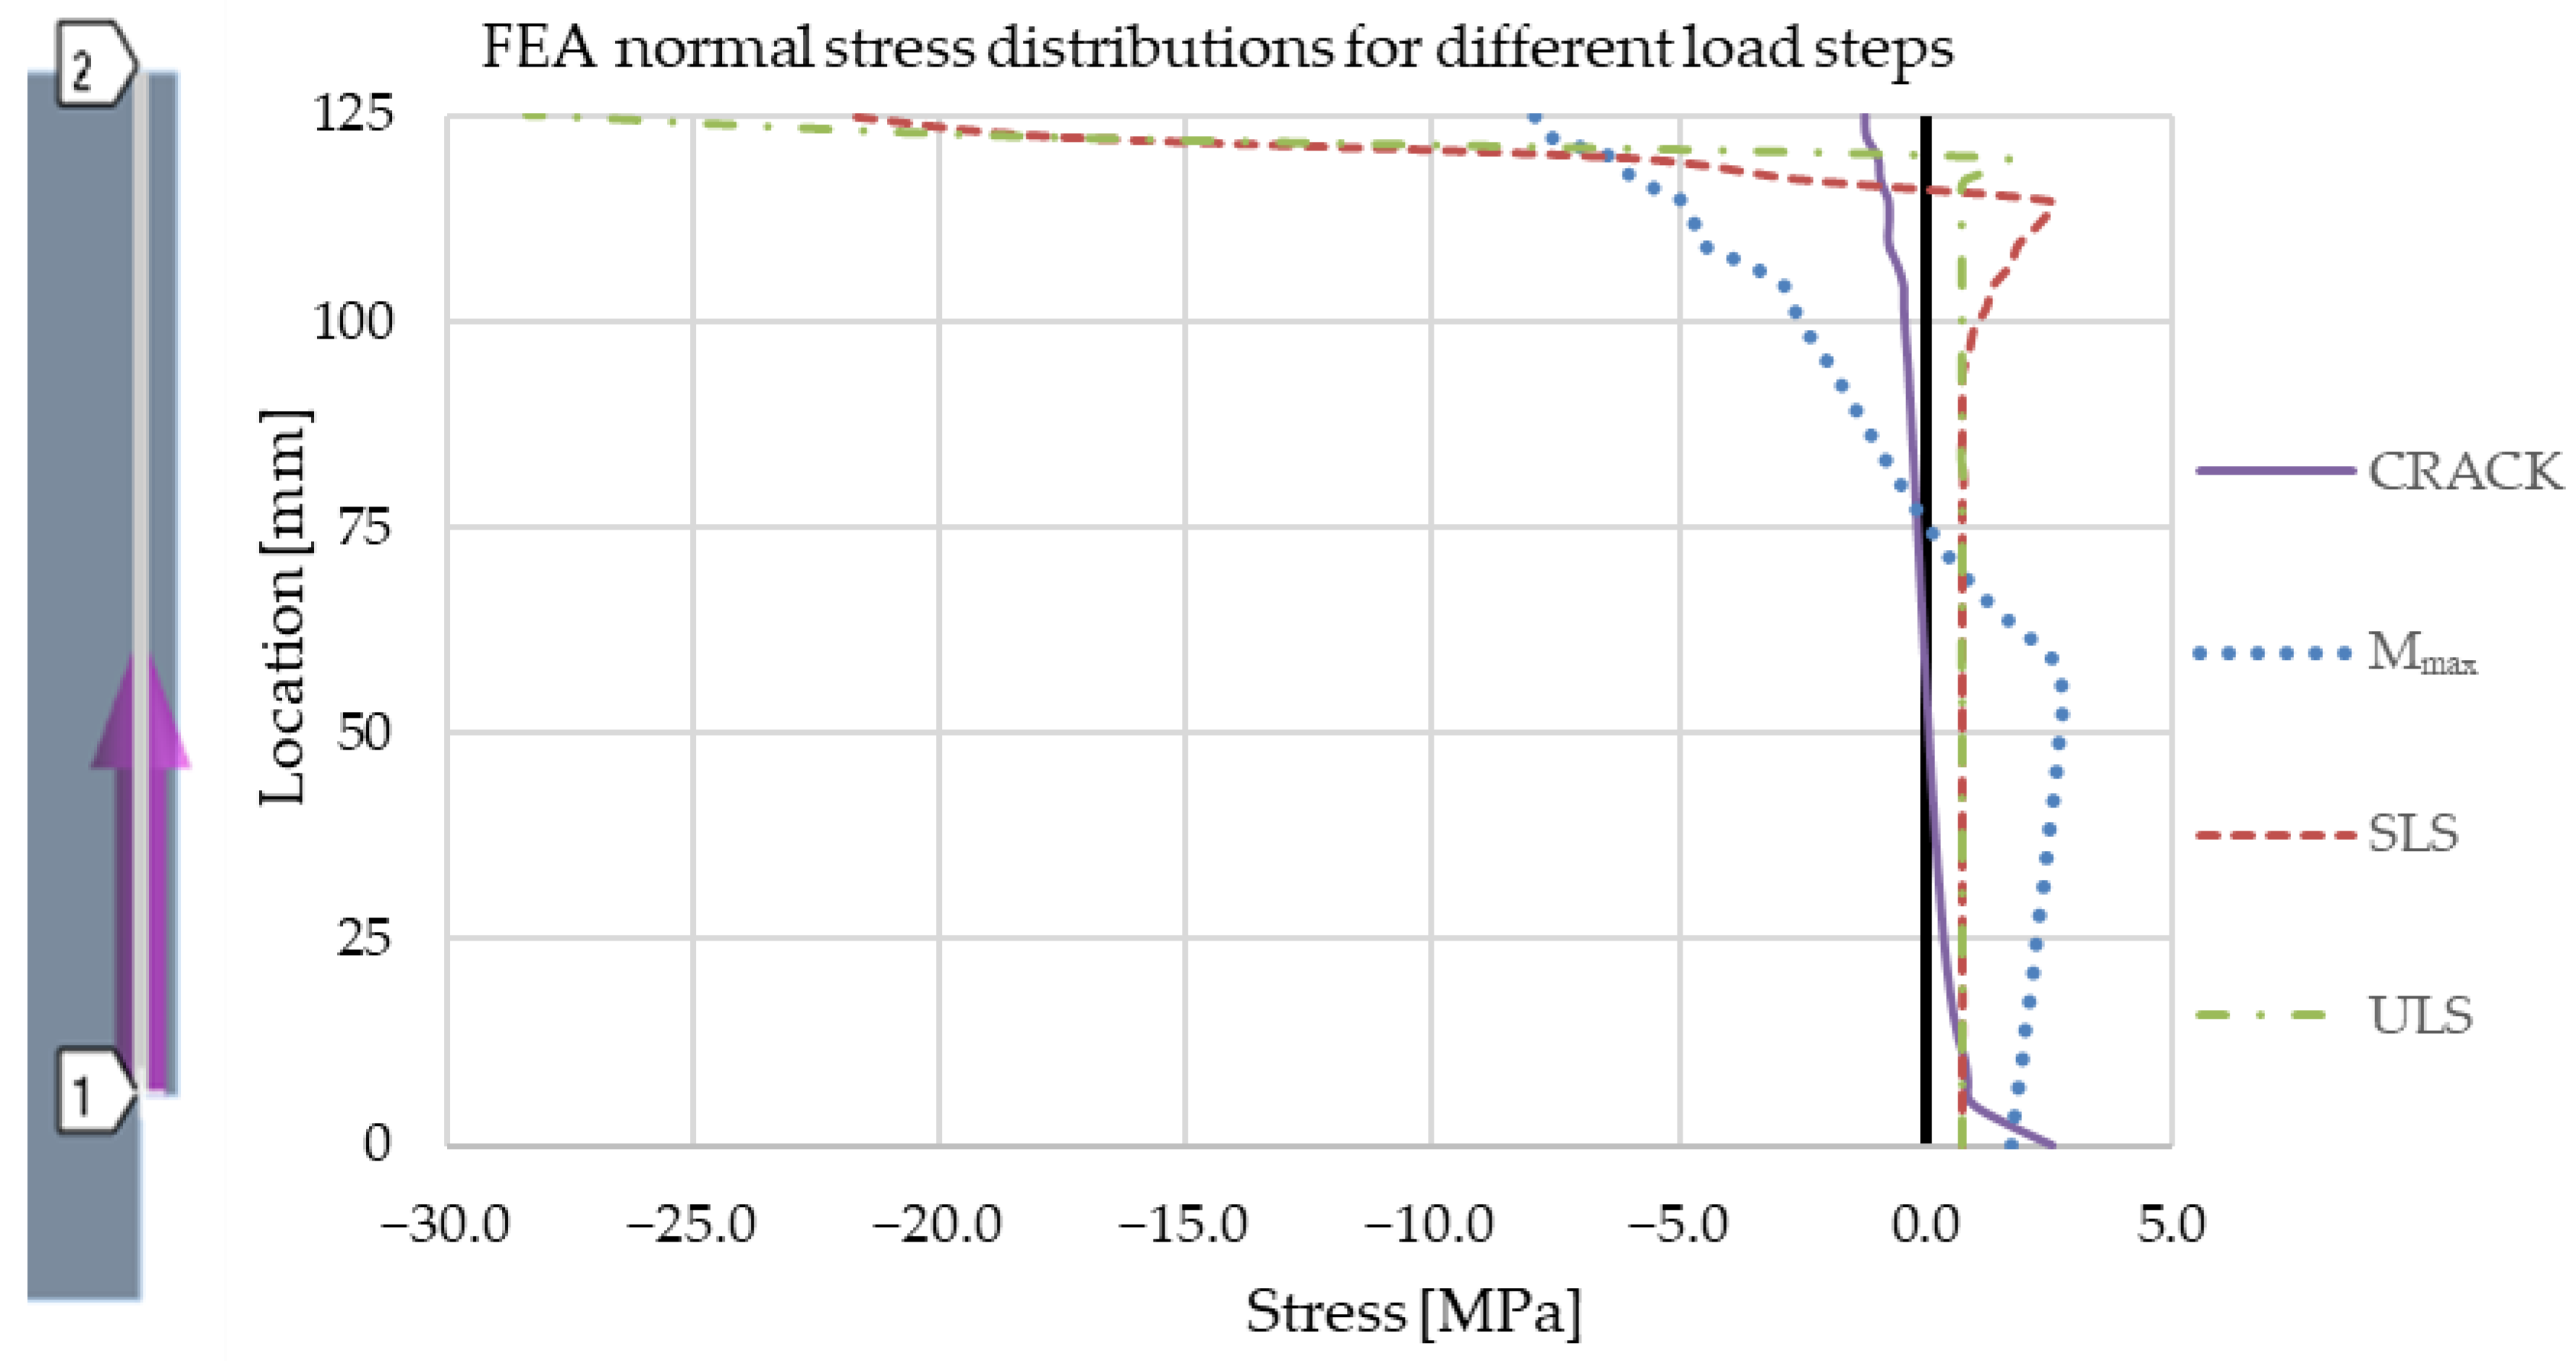
4.2. Finite Element Simulation of the Three-Point Bending Test

For additional evaluation of the back-calculated tensile strength values, a nonlinear finite element simulation of the three-point bending test was performed with the computer program Ansys® Mechanical, Release 2022 R2 [27]. Symmetry boundary conditions were applied, and only a quarter of the concrete prism was modeled. The geometry, coordinate system, loads, and support conditions can be seen in Figure 13.
A prescribed vertical displacement (in the global Z-direction) of 3.5 mm was applied as the load (C in Figure 13) to a strip at the top of the notched cross-section with a length equal to the width of the end face of the model and with a height of 10 mm. The vertical support is marked as E (remote displacement) in Figure 13. The support E was connected to the end face of the model with a rigid element D (remote point) in Figure 13. Therefore, the displacement of the finite element model (C in Figure 13) has the same meaning as the displacement measured in the experiments, as the possible local displacement due to the support conditions is ruled out. The symmetry conditions are denoted with A and B in Figure 13. Solid finite elements of the type SOLID186 with a side length of 5 mm were used across the whole model. The SOLID186 element, a higher-order 3D 20-node solid element, displays quadratic displacement behavior and is defined by 20 nodes, each with three degrees of freedom in the nodal x-, y-, and z-directions [28]. The finite element mesh in the region of the notch can be seen in Figure 14.
As shown in Figure 14, the notch width was equal to the mesh size (due to symmetry, only half of the notch width was modeled). The material model for the fiber-reinforced concrete was the Menetrey-Willam material model with exponential softening (see [18] for detailed information). A key motivation for using the specific material model was the relatively straightforward determination of input parameters. The Menetrey-Willam material model is the chosen material model in many studies on concrete elements (see, for example, [29]). It has also been successfully applied to steel fiber-reinforced elements (see, for example, [30]). The selected material model employs the smeared crack concept, where the mesh-dependent softening behavior is mitigated by the fracture energy model being normalized using an effective element length equal to the cube root of the integration-point volume of 3D elements. The properties (input parameters) of the used material can be found in Table 9.
The material properties in Table 9 mostly coincide with those in Table 6. However, to better match the experimental and numerical load-displacement curve after cracking, a lower value was considered for the mode 1 area specific fracture energy (compared with the value resulting from Equation (8)). It was found that a value resulting from the CEB-FIP Model Code 1990 [31] equation for the fracture energy gave a better match. The equation used was:
G F = G F o · f c m f c m o 0.7 ,
where GFo is the base fracture energy dependent on the maximum aggregate size. In our case, the maximum aggregate size was 16 mm, and the base fracture energy was equal to 30 N/m. The parameter fcmo is equal was 10 MPa. It must be noted that the fracture energy impacts the calculation in Chapter 4.1 only in the sense of the strain at which the fiber action starts to dominate. In contrast, for the Menetrey-Willam material model, the fracture energy is the most important parameter for defining the exponential yield function in tension.
Moreover, in addition to the fracture energy, the other important material property is the residual tensile relative stress. The experiments showed post-crack hardening behavior, meaning the residual tensile stress values increased with the strains (after the crack). The limitation of the Menetrey-Willam material model, where the residual tensile stresses can only be considered as constant values, was the deciding factor for considering the residual tensile stress fFts (as the lower value of fFts and fFtu) in Table 6 as the residual tensile stress in the Menetrey-Willam material model. In this sense, the finite element analysis results can be considered a lower-bound approximation of the structural behavior.
The decision to employ the arc-length method was made to tackle the finite element problem. A total of 361 load steps were calculated as part of this approach. This choice and the extensive sub-step calculations were undertaken to enhance the precision and robustness of the solution. The deformed shape for a midspan displacement of 3.5 mm can be seen in Figure 15.
It can be seen from the deformed shape in Figure 15 that most of the displacement is the result of the deformation of the finite element layer at the notch. The 5 mm wide layer at the notch acts as a crack band over which the crack is smeared. This is even clearer when looking at the equivalent plastic strain results in Figure 16 (for a midspan displacement of 3.5 mm).
The highest equivalent plastic strain was not calculated at the midspan (symmetry plane) but at the location of the corner edge of the notch, which is a geometrical stress concentration point. However, due to the relatively small mesh size of 5 mm (relative to the prism size), this discrepancy did not affect the results. The finite element results in terms of load-displacement relations are given in Figure 17.
The results in Figure 17 show post-crack softening behavior, but the slope of the decreasing part of the load-displacement curve for larger displacements (greater than 0.5 mm) is relatively small. The vertical displacements and CMOD and CTOD values were read at points on the symmetry plane, as depicted in Figure 18.
Table 10 shows the finite element analysis results of the CMOD, CTOD, vertical displacement (δ), and loads (F) for the corresponding load steps. The CMOD and CTOD values were calculated by multiplying the horizontal displacement results of the marked points in Figure 18 by two (due to symmetry). The load value was calculated by multiplying the vertical support force by four (as one-quarter of the prism was modeled).
The first row in Table 10 corresponds to the last load step with no equivalent plastic strain. The load value is relatively low and results from the geometric stress concentration region at the notch, which means that different geometric representations of the notch and corresponding meshes would impact the load value of the crack formation. The second row in Table 10 corresponds to the load step with the maximum load. The comparison of the CMOD and CTOD values from the finite element analysis with the CMOD and CTOD values from the calculation based on the moment-curvature relations in Table 7 shows large differences for the loads (or load steps) before reaching the maximum load. An additional reason (to the previously mentioned stress concentration in the finite element model) for this discrepancy is the difference in the stress-strain relations in the tensile stress region up to the tensile strength. While linear elastic behavior up to the tensile strength was considered in the finite element analysis, the calculation based on the moment-curvature relations considered a more realistic stress-strain relation in the same region (see Figure 7b). However, the CMOD/CTOD ratio (see Table 10), again, as expected, for larger CMOD values approaches the EN14651 standard [19] value for this ratio (1.2). The normal stress (in the global X-direction, as per Figure 13) distributions on a path (Figure 19 (left)) starting at the notched edge, for the same load steps as the row results in Table 10, are given in Figure 19 (right).
As equivalent plastic strains first occur at point 1 in Figure 19 (left), it was chosen as the starting point of the stress path. The normal stress results are averaged nodal results. From the normal stress distribution of the last load step prior to the occurrence of equivalent plastic strain, it can be seen how near point 1, the stress increases, but away from this region, the normal stress distribution is rather uniform and can be described as linear. The cross-section is already partially plasticized (cracked, respectively) for the load step with the maximum load. As for the stress distributions of the calculation based on the moment-curvature relation in Figure 9, with increasing displacement, the plasticized region increases almost to the top of the cross-section.

4.3. Comparison of the Experimental, Moment-Curvature-Based Calculation, and Finite Element Analysis Results

The averaged load-displacement results of the experiments, the calculations based on the back-calculated tensile strength values, the calculations based on tensile strength values from the expressions in the fib Model Code for Concrete Structures 2010 [17], and the finite element analysis are collected in Figure 20. The experimental results are additionally depicted with a shaded area representing the envelope of all six tested fiber-reinforced concrete prisms’ load-displacement results.
It is evident in Figure 20 that all considered computational procedures show similar results for displacements smaller than the displacement corresponding to the maximum load and are in agreement with the averaged experimental results. The force-displacement results of the calculation based on the back-calculated tensile strength values (M-κ) and the finite element analysis are for all displacements inside the gray area, which represents the region of the experimentally determined load-displacement relations of all test specimens. This is not the case for the force-displacement results of the calculation based on the tensile strength values from expressions in the fib Model Code for Concrete Structures 2010 [17] (M-κ (fib)), which overestimates the loads in the region between the displacement corresponding to the maximum load and the displacement of 0.47 mm. The M-κ calculation results match the averaged experimental results at the displacements of 0.47 mm and 2.17 mm, for which the residual tensile strength values were determined and between which the residual tensile strength was assumed to be linearly varying. The M-κ (fib) calculation results match the averaged experimental results only at the displacement of 2.17 mm. The finite element analysis results are not necessarily less accurate for other displacements, even though a constant residual strength (equal to fFts) was considered in the material model. The chosen constant residual tensile strength value equal to fFts is also the reason that for the corresponding displacement of 0.47 mm. The finite element results are quite close to the average experimental results. The load and displacement result values at the maximum load, the crack mouth opening displacement of 0.5 mm, and the crack mouth opening displacement of 2.5 mm are collected in Table 11.
Table 11 shows that the finite element analysis maximum load is slightly lower than the experimentally determined average maximum load and that the maximum load of the calculation based on the tensile strength values from expressions in the fib Model Code for Concrete Structures 2010 [17] is slightly higher than the average maximum load of the experiments. As expected for the finite element analysis, the difference is larger for higher crack mouth opening values. The finite element analysis load at CMOD = 0.5 mm exceeds the experimental load. At CMOD = 2.5 mm, it results in lower loads compared with the experiment. The load of the calculation based on the tensile strength values from the expressions in the fib Model Code for Concrete Structures 2010 [17] (M-κ (fib)) at CMOD = 0.5 mm exceeds the experimental load, and at CMOD = 2.5 mm, it results in an almost equal load compared with the experiment. Note that the load values of the calculation based on the back-calculated tensile strength values match the experimental ones as the M-κ relation was synchronized with the experiments by varying the tensile strength and residual tensile strength values at CMOD values of 0.5 mm and 2.5 mm.
The experimental and calculated displacements from the M-κ and M-κ (fib) relation are especially close at the maximum load. The finite element analysis displacements also do not significantly differ (the slightly larger difference may be attributed to the crack occurrence at a lower load due to the geometric stress concentration). In general, the displacements in the experiments, the finite element analysis, and the calculation based on the M-κ and M-κ (fib) relation differ for less than 0.1 mm for different load stages (at the maximum load and different CMOD values), which is a relatively small difference compared with 3 mm, which is the maximum displacement of interest for the three-point bending tests in the EN14651 standard [19]. An important discrepancy of the M-κ (fib) load-displacement results is only in the region of the crack width value of 0.5 mm, where the load is overestimated. This is a consequence of the assumed (almost) constant residual tensile strength according to the fib Model Code for Concrete Structures 2010 [17] simplified expressions for residual tensile strength values.

5. Conclusions

This paper presented the characterization of fiber-reinforced concrete mechanical properties by three-point bending tests of fiber-reinforced concrete prisms and compressive tests of plain and fiber-reinforced concrete cubes. The focus of interest of this study was on the post-cracking behavior and the computational simulation of this behavior. Two computational procedures for the structural analysis (load-displacement calculations) of fiber-reinforced concrete elements were presented. The first computational procedure, a nonlinear semi-numeric procedure, was based on the moment-curvature relation, plastic hinge approach, and virtual work method. Two calculations were performed with the nonlinear semi-numeric computational procedure: one with back-calculated (by an inverse analysis based on the moment-curvature relation) tensile strength properties, and one with tensile strength properties calculated with simplified expressions from the fib Model Code for Concrete Structures 2010 [17]. The second computational procedure was a nonlinear finite element analysis considering the Menetrey-Willam material model. The experimental and computational results were compared. The following conclusions could be drawn from the present research:
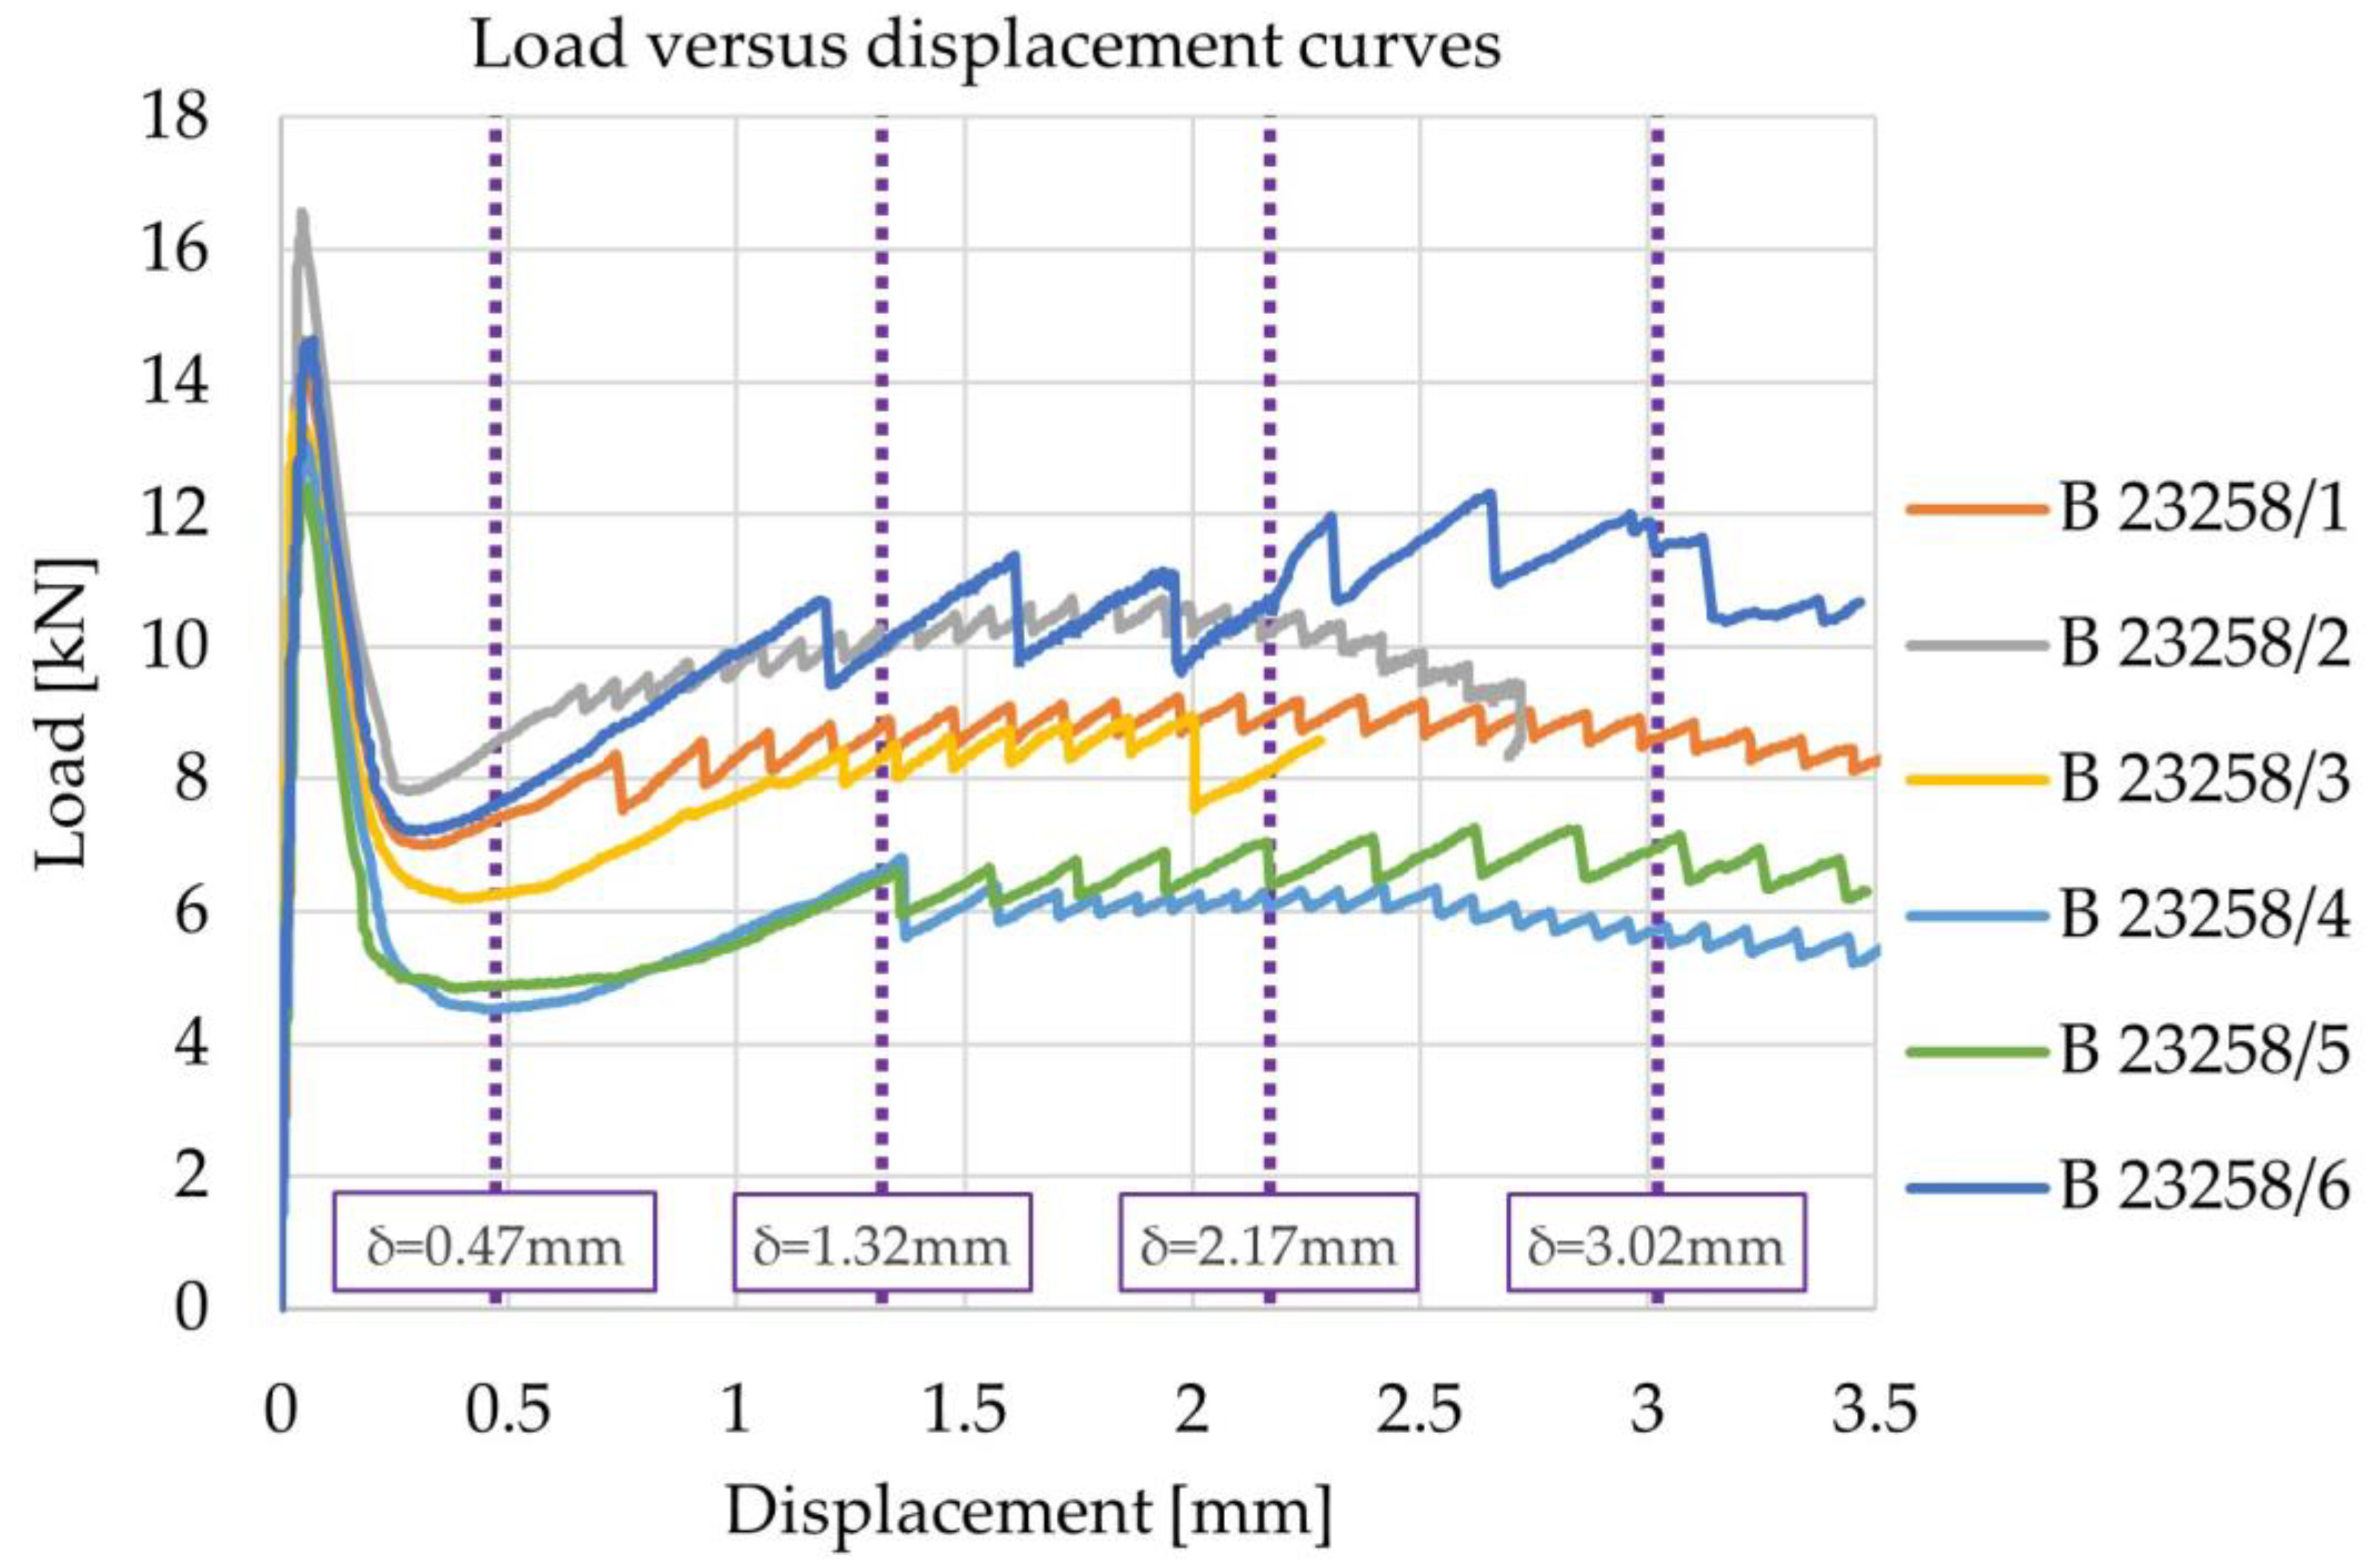
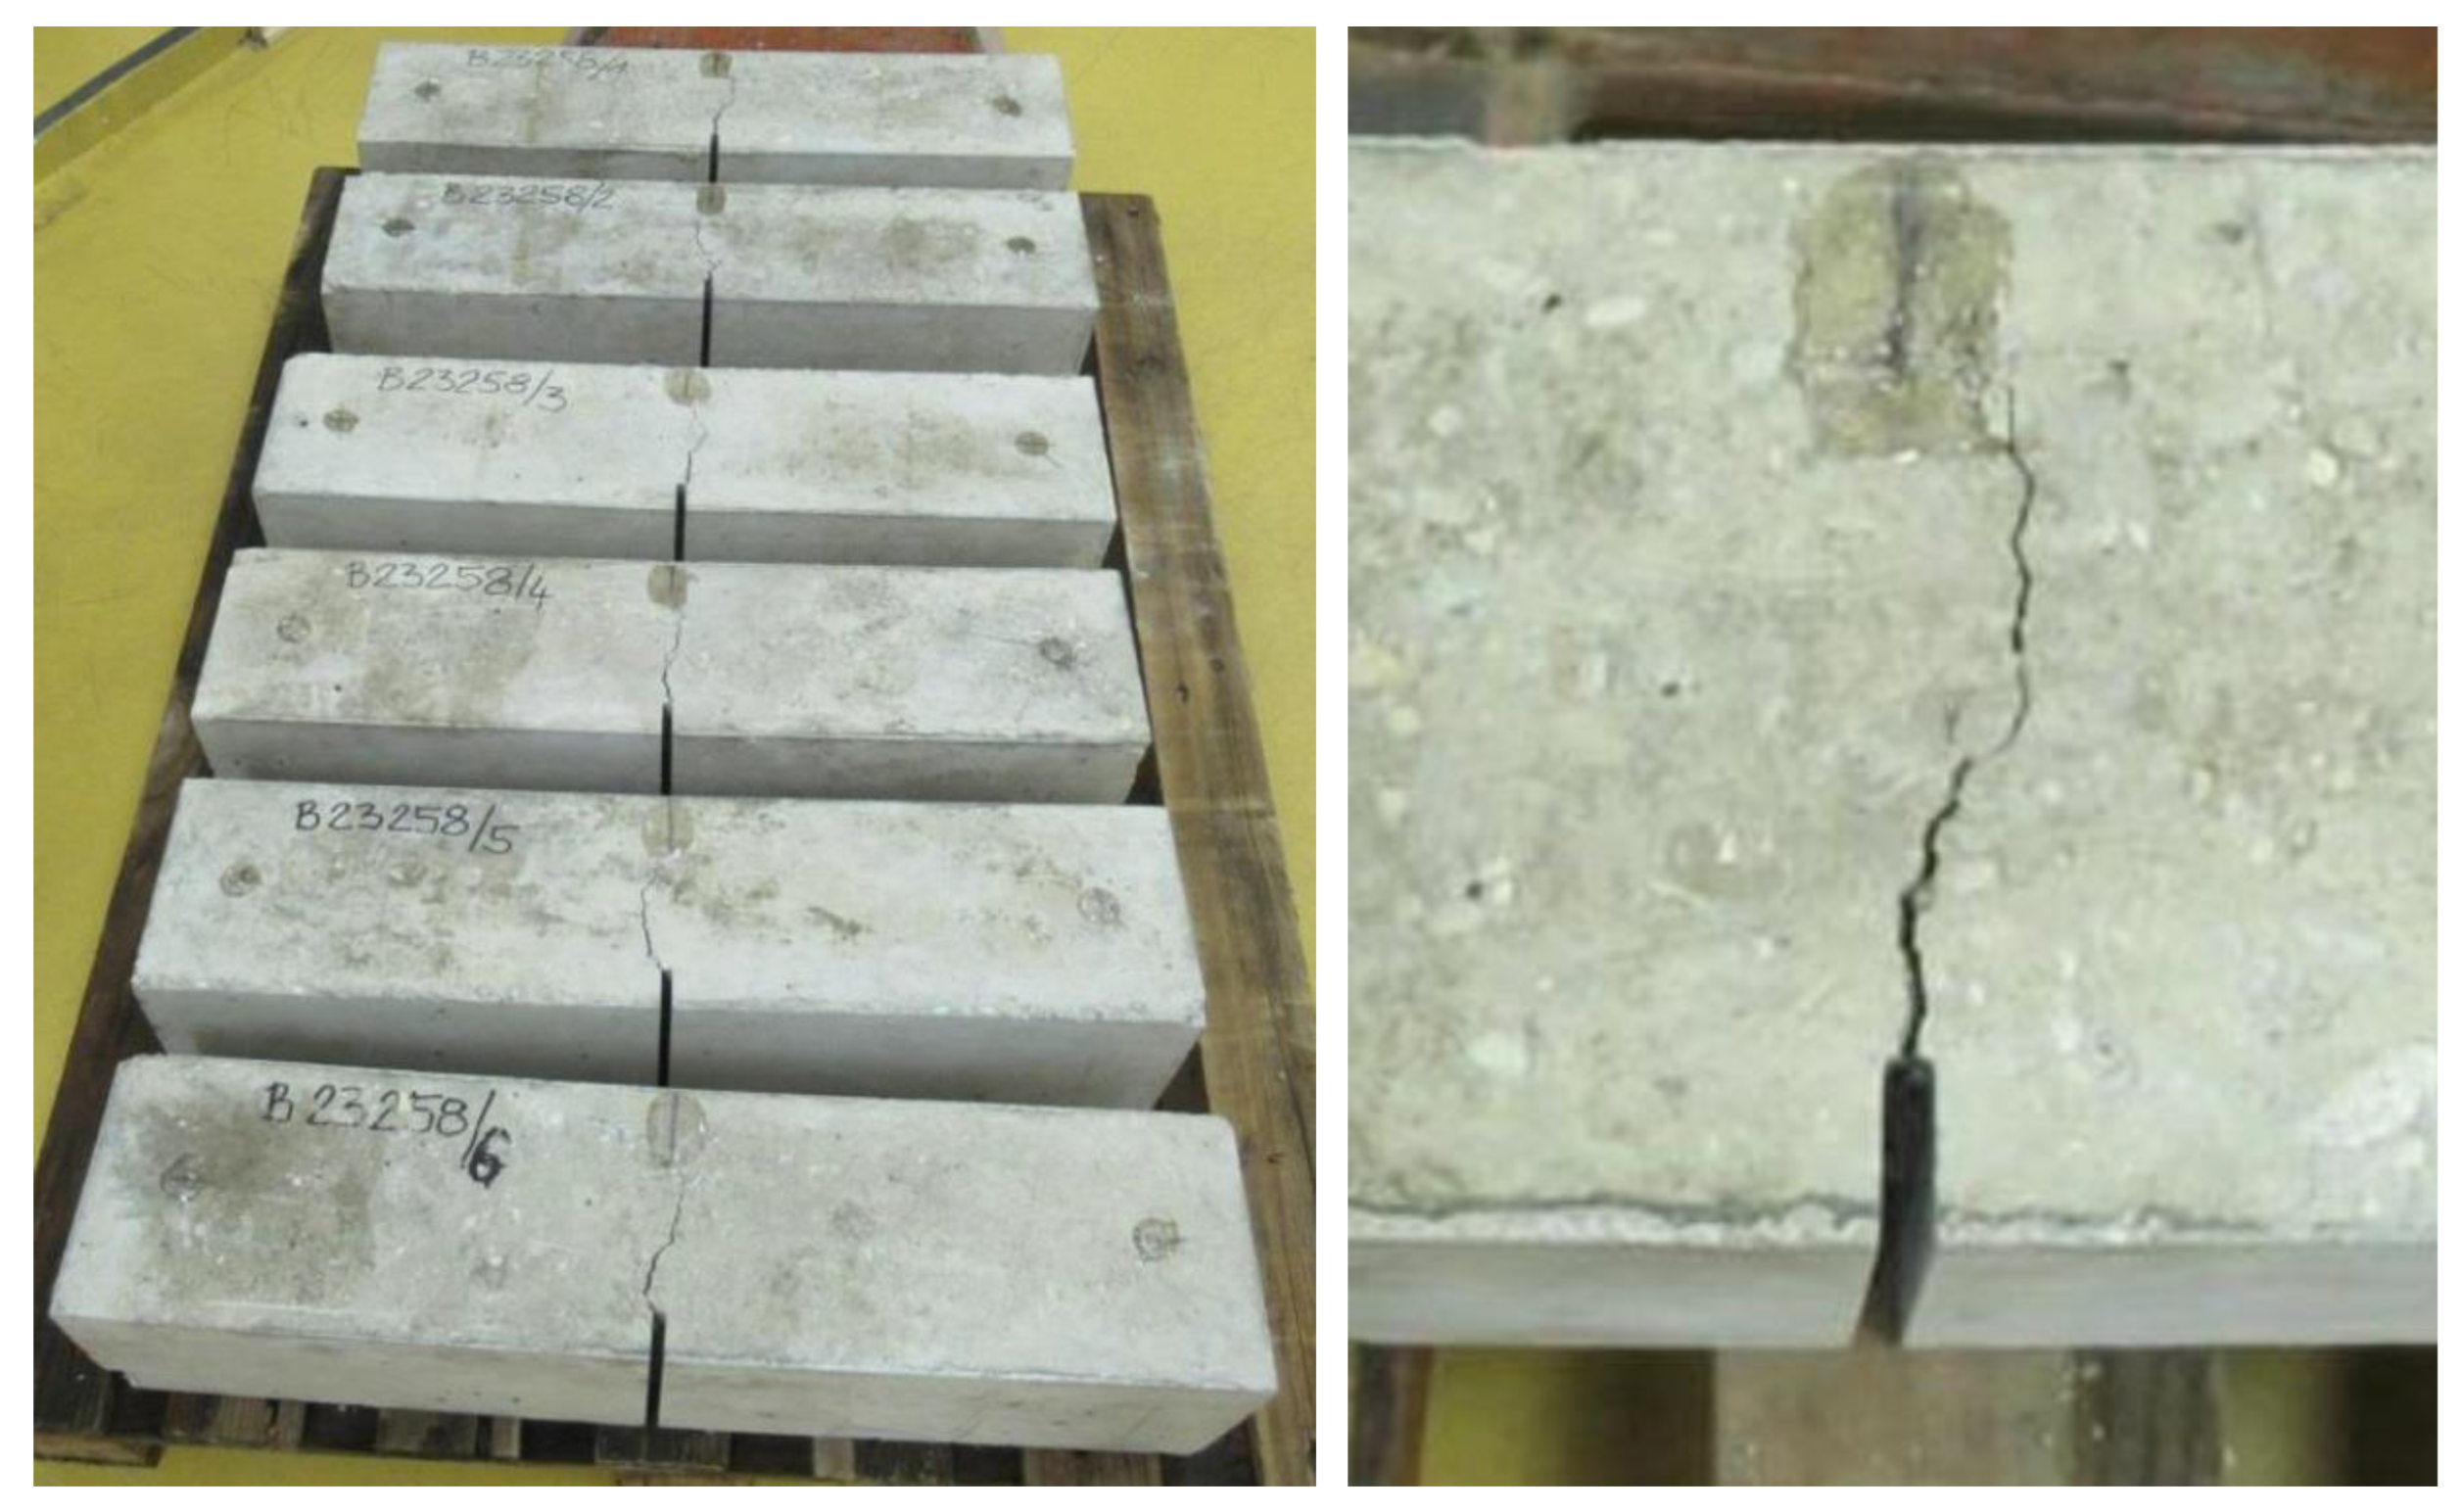
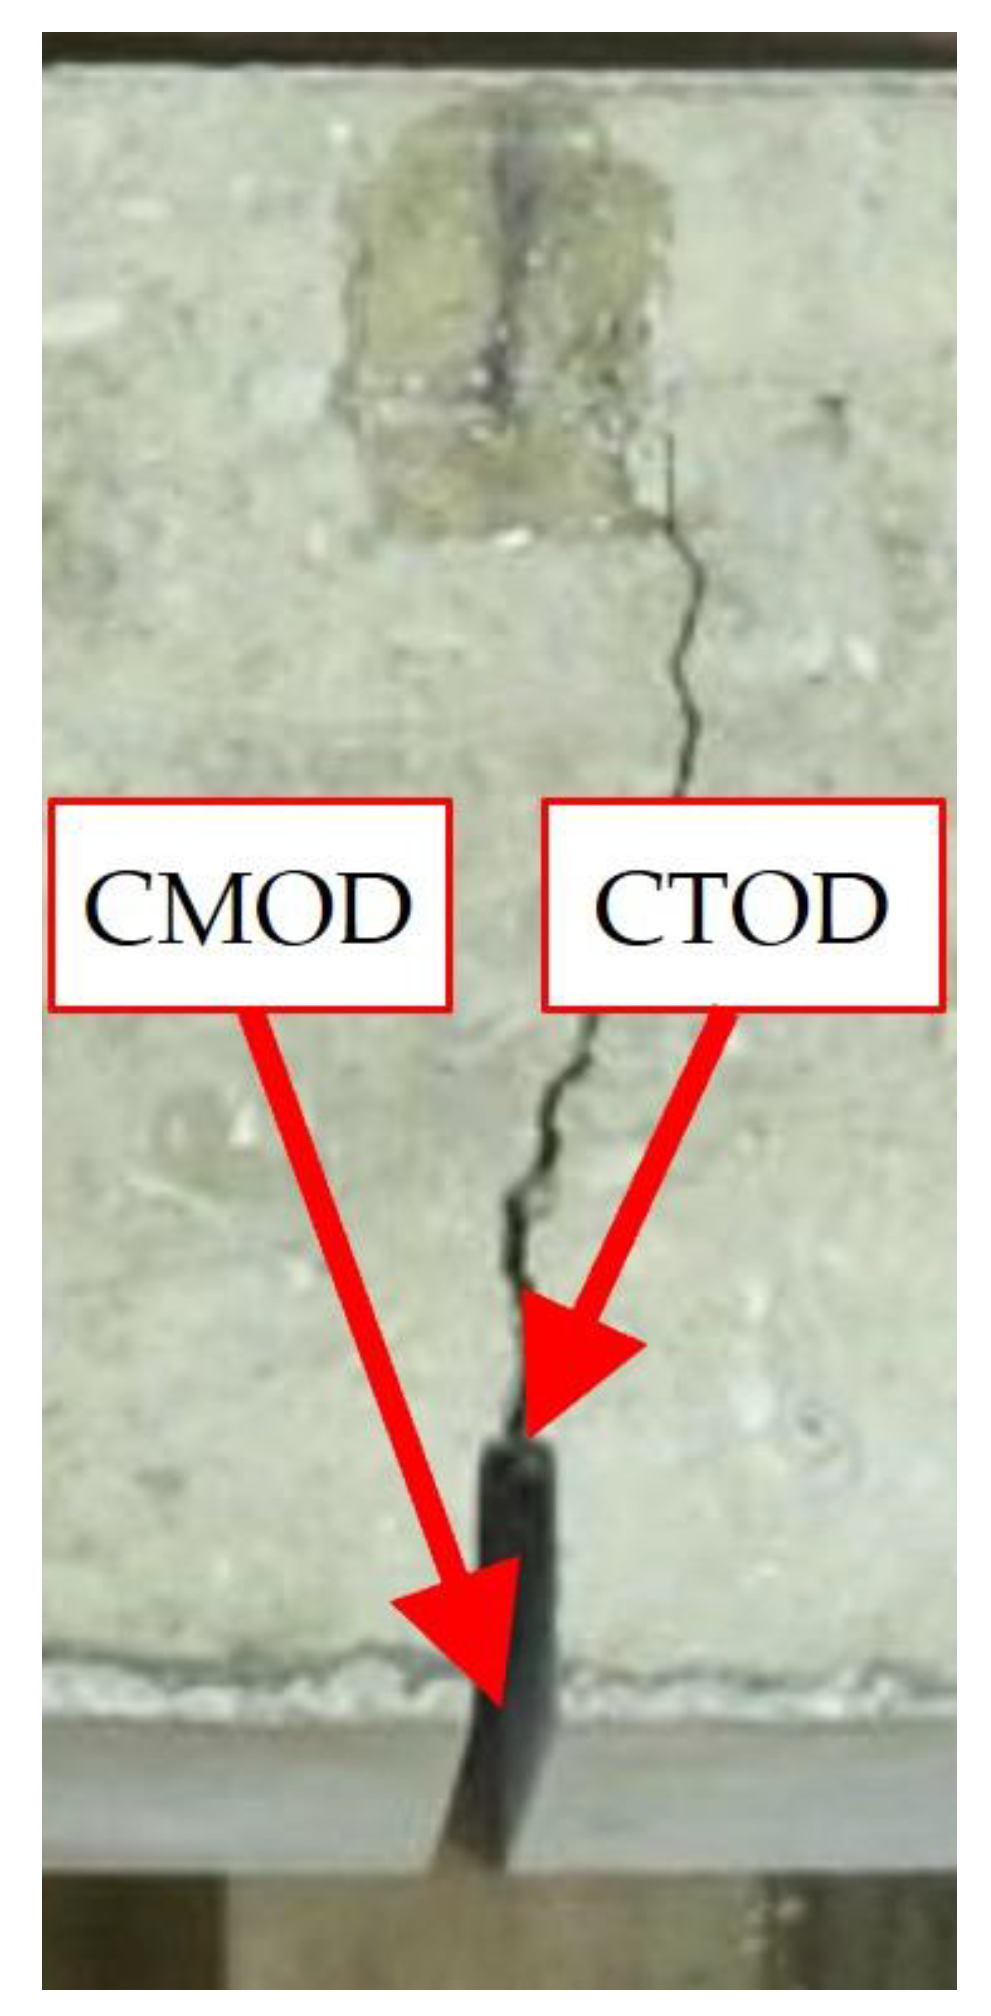
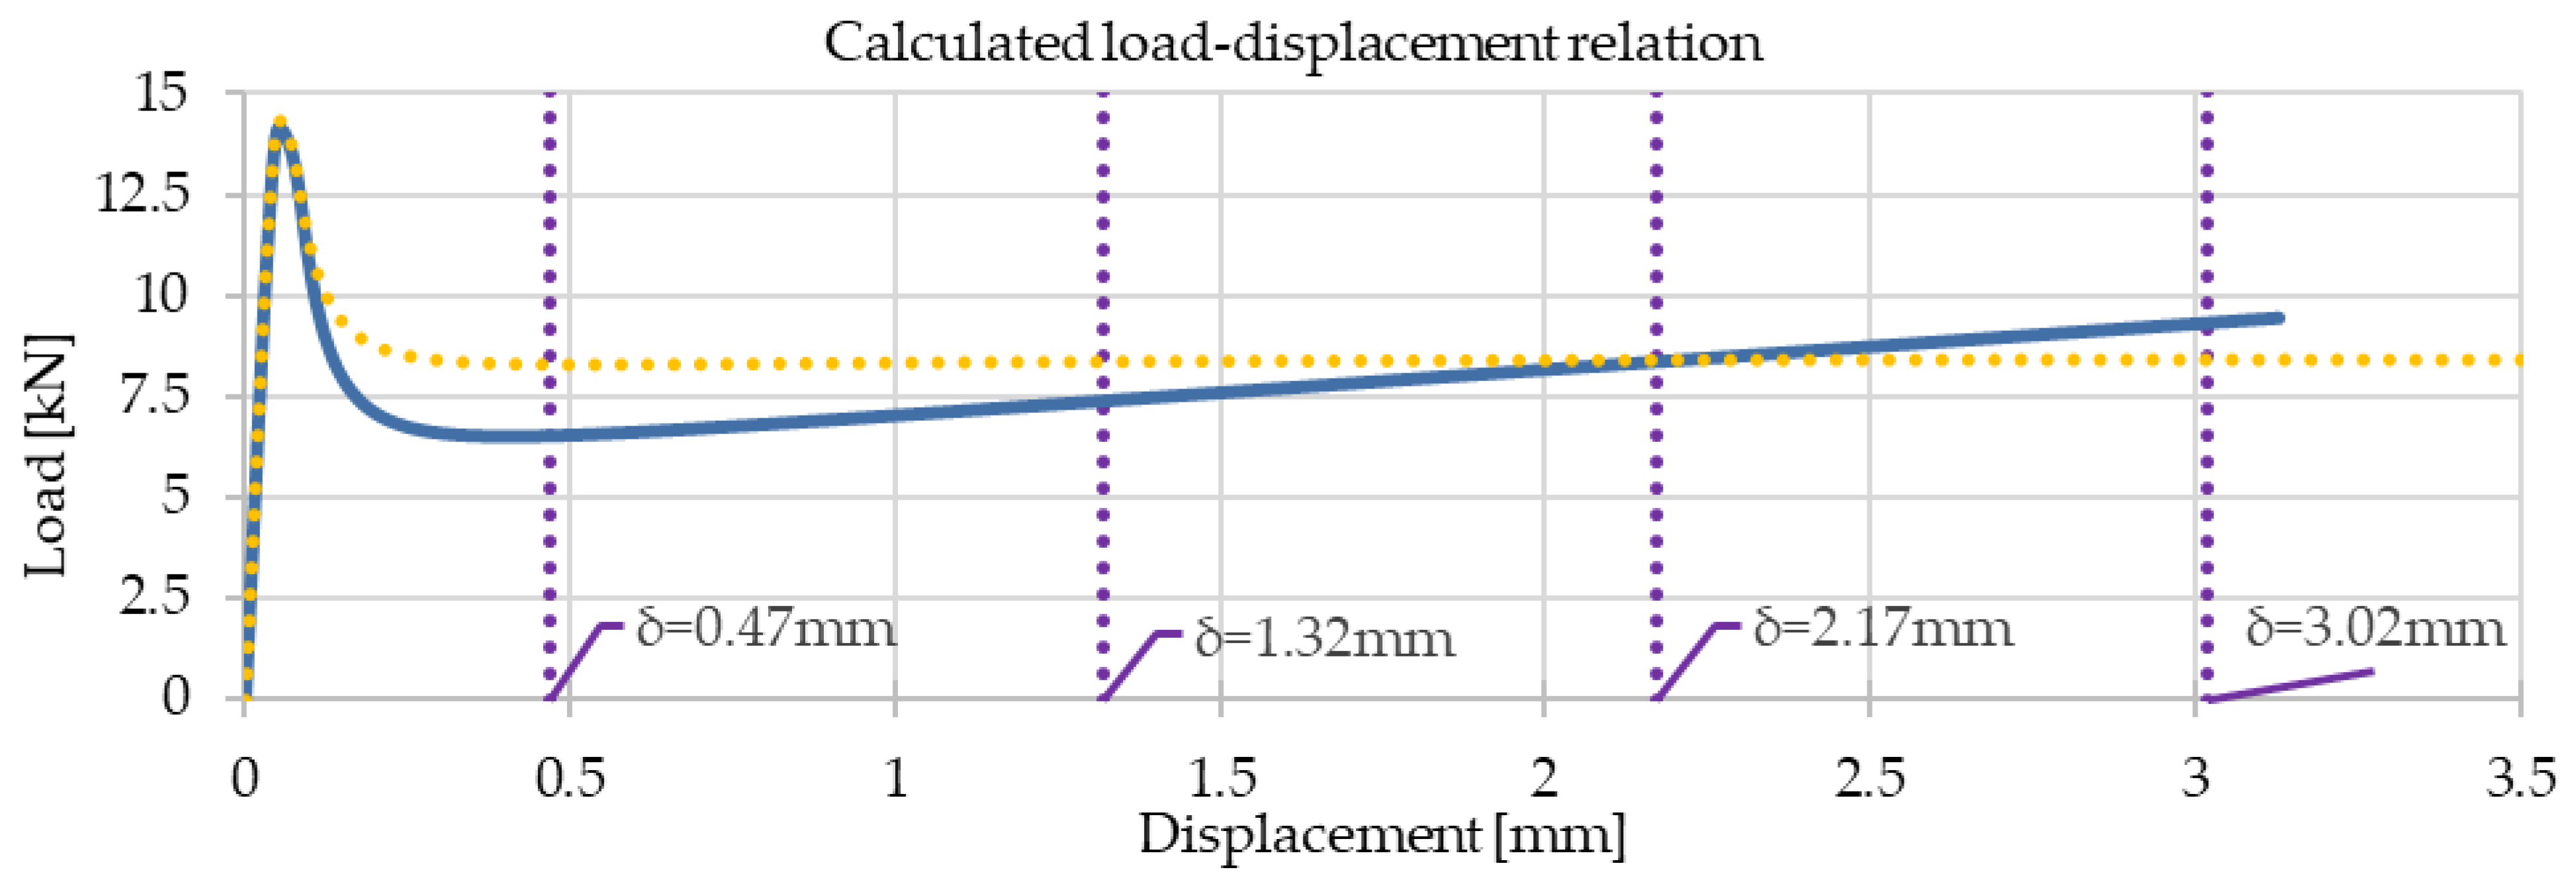
  • All fiber-reinforced prisms showed the same failure mode: a crack occurred at the notched cross-section. The fiber-reinforced prisms showed softening behavior (the residual load-bearing capacity was less than the load at (or shortly after) crack formation). However, the load started to increase again for larger displacements. This behavior can be described as post-crack hardening behavior.
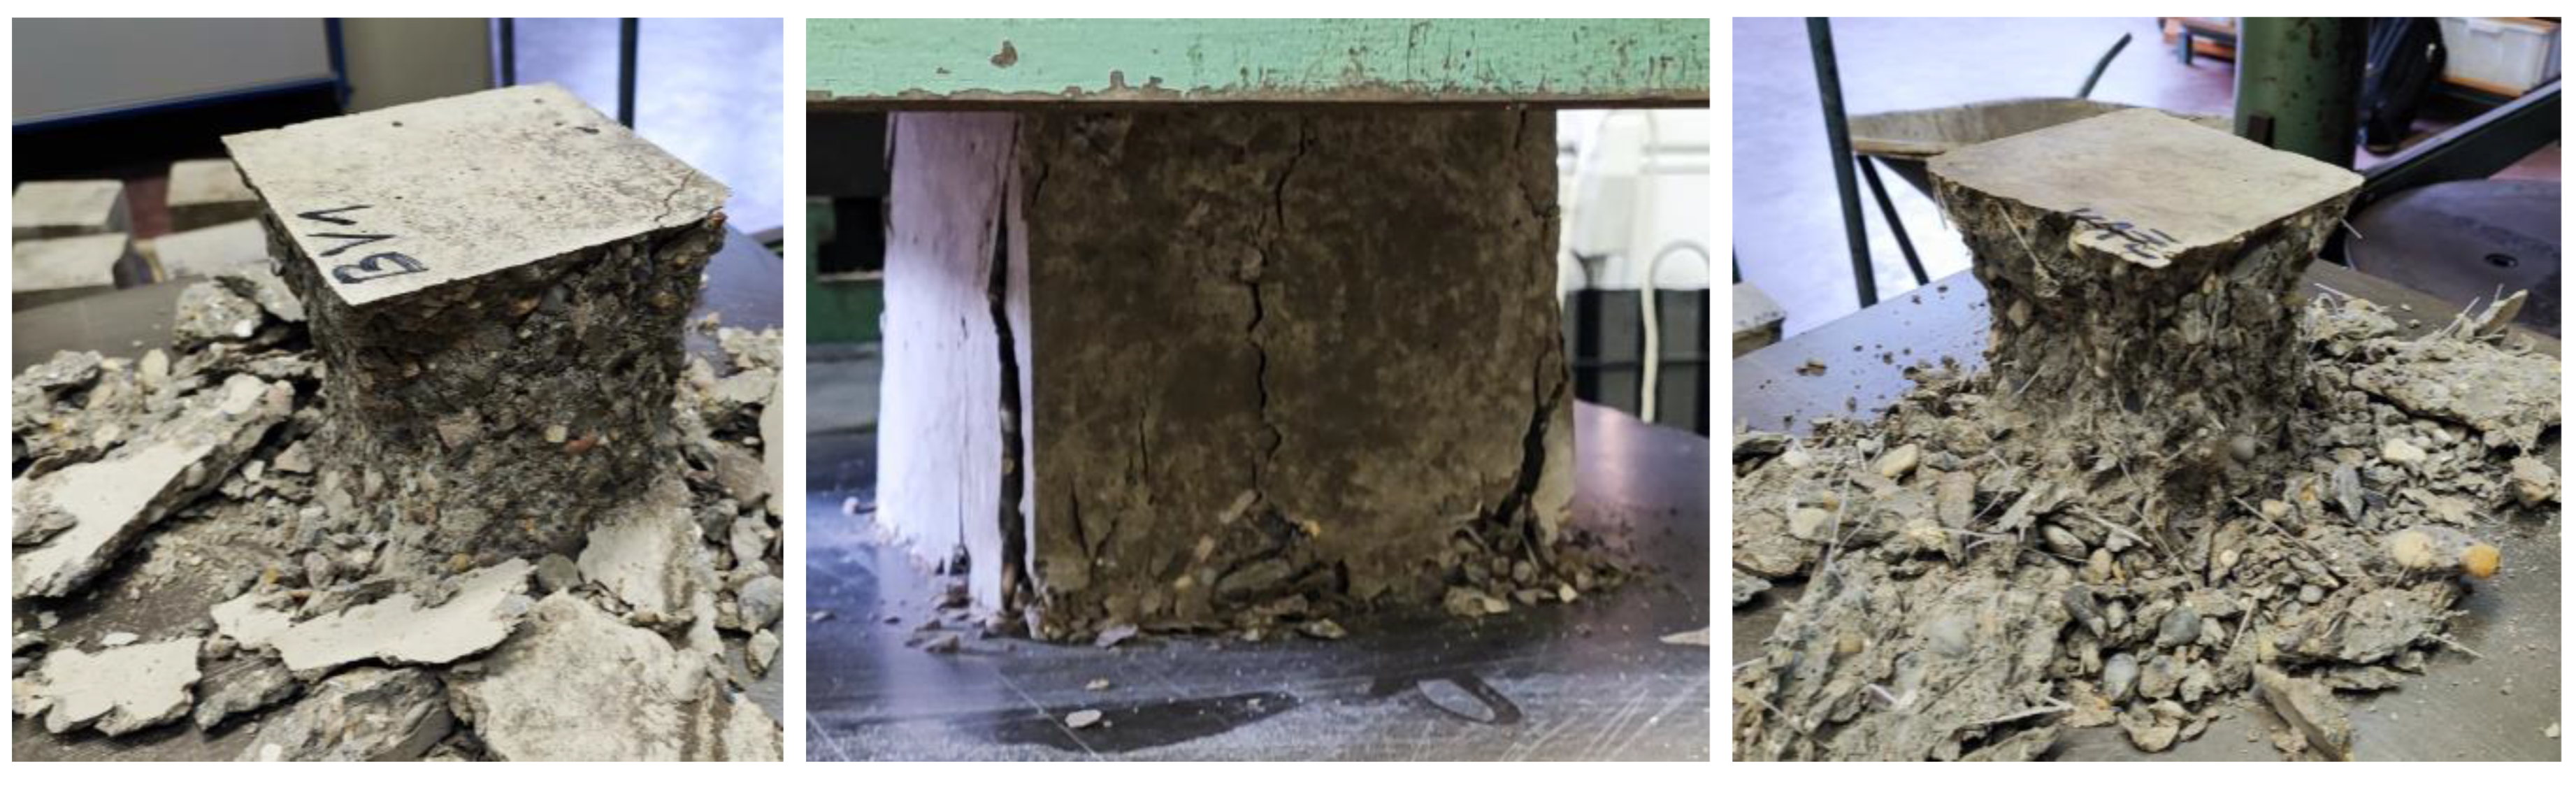
  • The compressive strength of the fiber-reinforced concrete cubes was slightly lower than the compressive strength of the plain concrete cubes. This can be attributed to the relatively high fiber dosage.
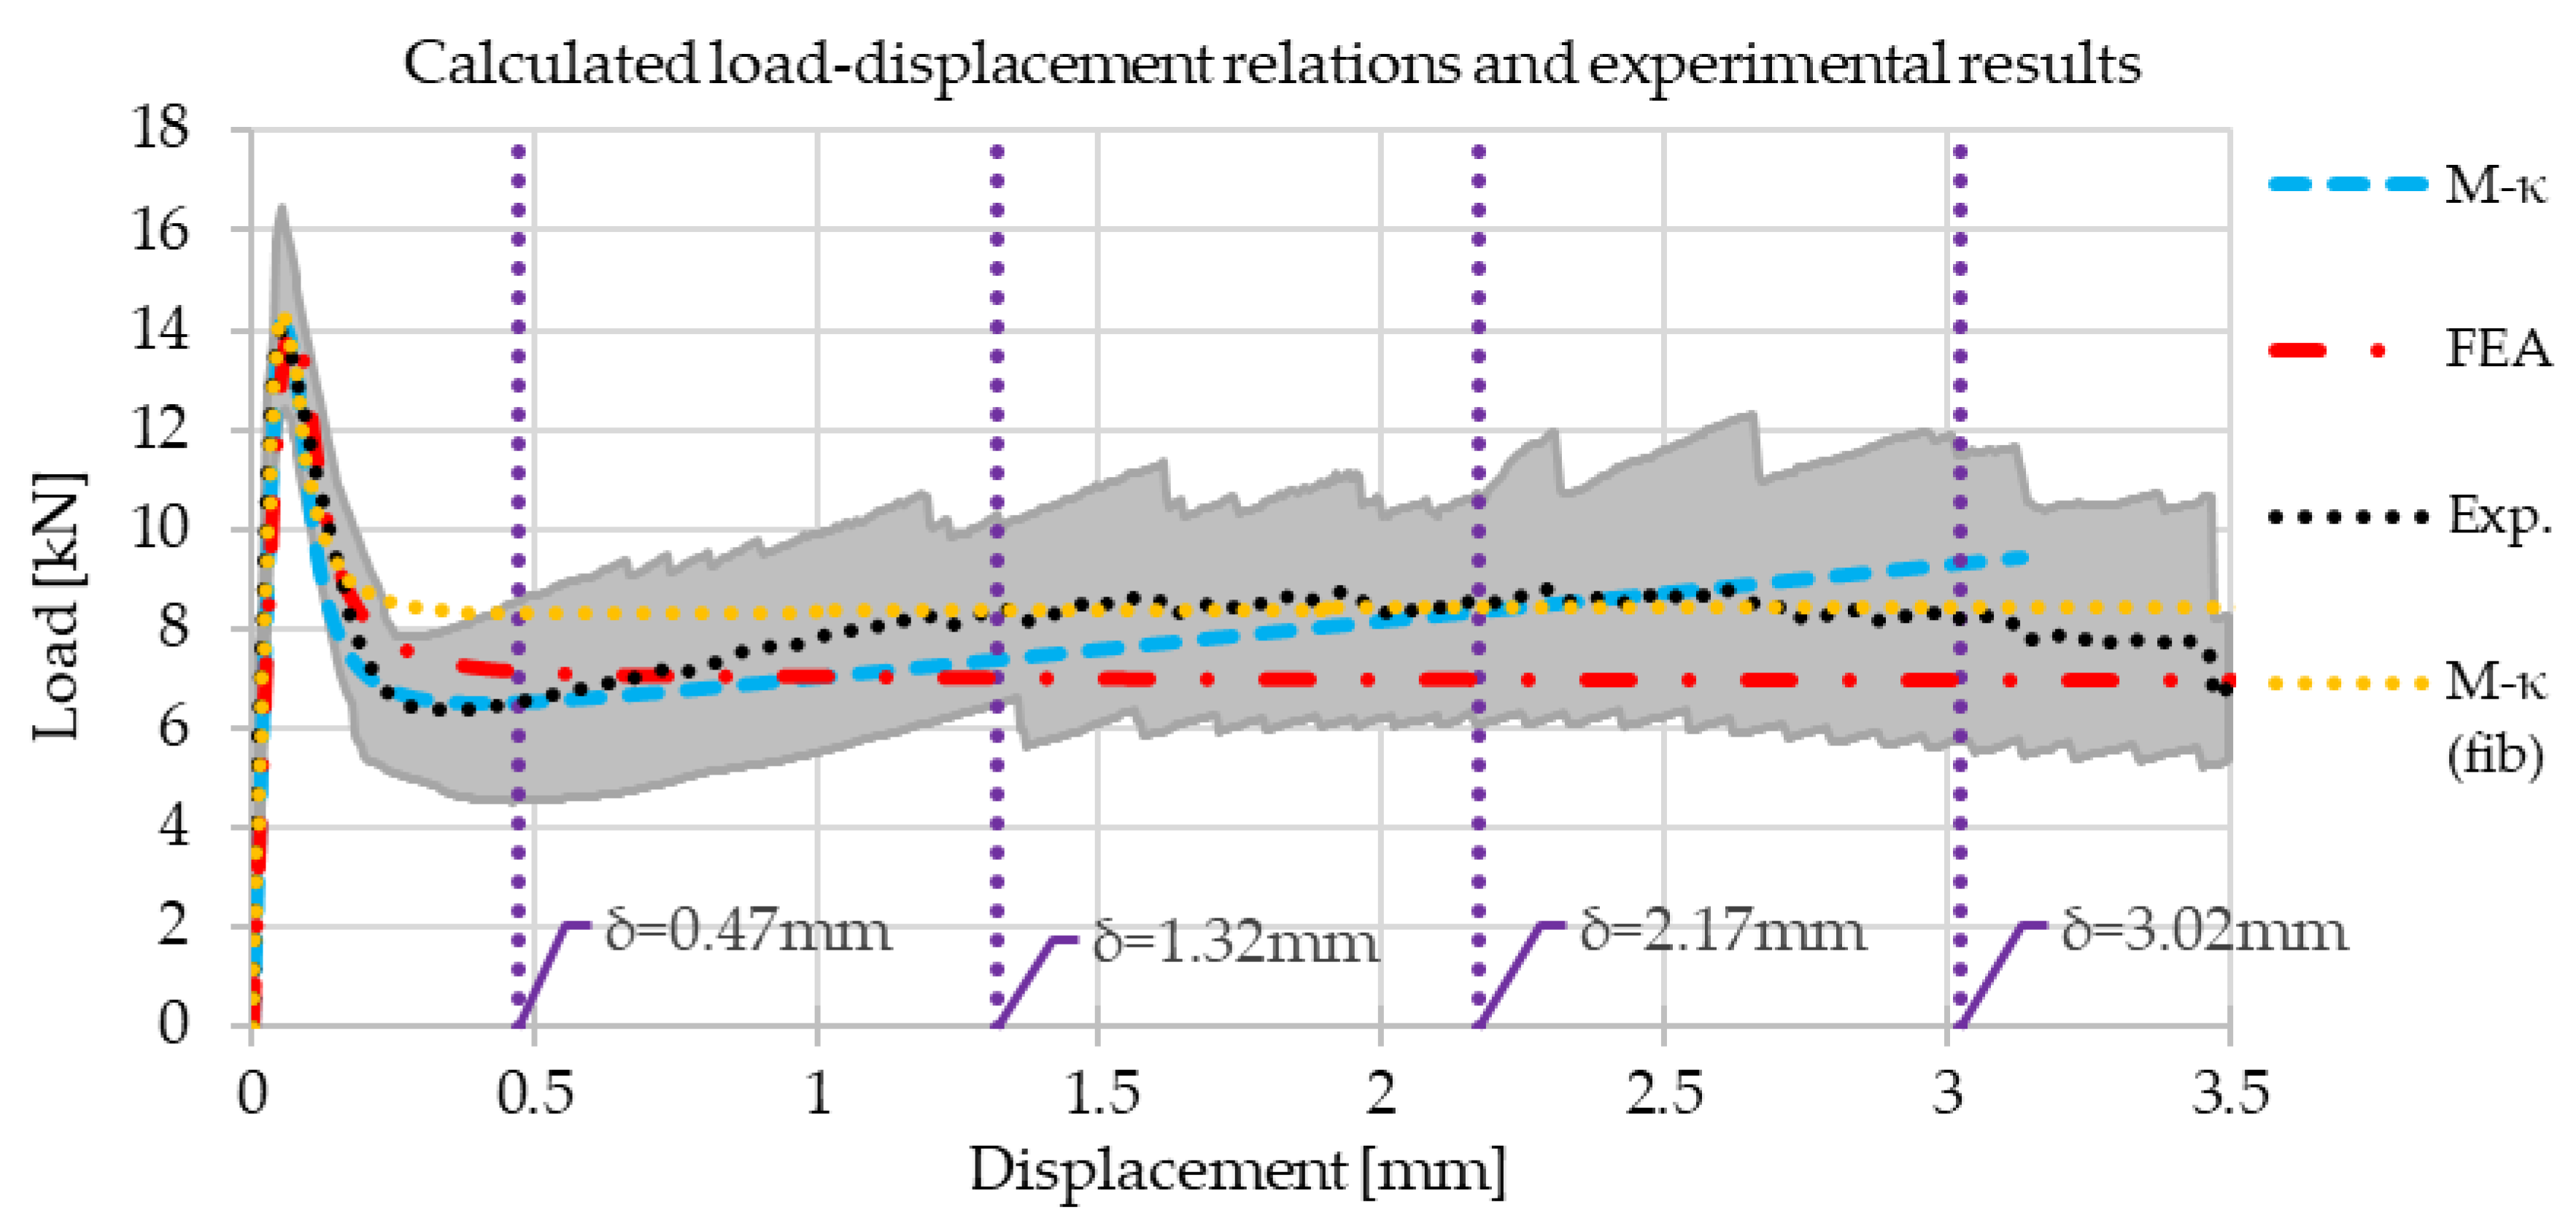
  • The nonlinear semi-numeric computational procedure based on the moment-curvature relation with back-calculated tensile strength properties agreed with the averaged experimental results. The result matching was especially good at the maximum load and CMOD values of 0.5 mm and 2.5 mm. The calculated load-displacement curve matched (accurate to around 0.05 mm) the averaged experimental results at the maximum load and at CMOD values of 0.5 mm and 2.5 mm. This agreement can be attributed to the fact that the tensile strength properties for the calculation were determined by an inverse analysis, where the maximum load and loads at presumed CMOD values of 0.5 mm and 2.5 mm were matched with the experimental results. The load-displacement calculation proves that the back-calculated (by inverse analysis) mechanical properties (tensile strength and residual tensile strengths at CMOD values of 0.5 mm and 2.5 mm) are correct.
  • The nonlinear semi-numeric computational procedure based on the moment-curvature relation with tensile strength properties calculated with simplified expressions from the fib Model Code for Concrete Structures 2010 [17] was in relatively lesser agreement with the averaged experimental results, whereas the calculated load-displacement curve closely aligned with the averaged experimental result at the maximum load, with an accuracy of approximately 0.02 mm and 0.19 kN, and at the CMOD value of 2.5 mm, with an accuracy of approximately 0.06 mm and 0.01 kN, the alignment of the load-displacement results demonstrated less than satisfactory alignment for the CMOD value of 0.5 mm, with an accuracy of approximately 0.02 mm and 1.75 kN, indicating a notable discrepancy between the experimental and computational outcomes. The relatively lesser agreement can be attributed to the fact that tensile strength properties were calculated with simplified expressions from the fib Model Code for Concrete Structures 2010 [17], which resulted in a notably higher residual tensile strength at the CMOD value of 0.5 mm and a lower residual tensile strength at the CMOD value of 2.5 mm compared with the back-calculated residual tensile strength values. Contrary to the experimental observations and contrary to the back-calculated residual tensile strength values, the residual tensile strength values calculated with simplified expressions from the fib Model Code for Concrete Structures 2010 [17] give an impression of post-crack softening behavior (with the difference between the residual tensile strength at the CMOD value of 0.5 mm being approximately 0.01 kN lower than the residual tensile strength at the CMOD value of 2.5 mm).
  • The finite element analysis with the Menetrey-Willam material model, which used the back-calculated tensile strength and considered a constant residual tensile strength equal to the back-calculated residual tensile strength at the CMOD value of 0.5 mm, was in expectedly lesser agreement with the averaged experimental results compared with the computational procedure based on the moment-curvature relation with back-calculated tensile strength properties. In comparison with the computational procedure relying on the moment-curvature relation, wherein tensile strength properties were determined through simplified expressions drawn from the fib Model Code for Concrete Structures 2010 [17], the correlation between the finite element analysis load-displacement outcomes and the experimental results did not exhibit a degradation in quality: the results at the maximum load were accurate to 0.02 mm and 0.05 kN, at the CMOD value of 0.5 mm the results were accurate to 0.02 mm and 0.61 kN, and the results at the CMOD value of 2.5 mm were accurate to approximately 0.05 mm and 1.44 kN. Considering the straightforward Menetrey-Willam material model with its concise input parameters, performing finite element analyses with this material model and a carefully chosen constant residual tensile strength presents a practical way to analyze structural elements made of fiber-reinforced concrete. In this study, we picked the lowest value of the residual tensile strength within the CMOD range of 0.5 mm to 2.5 mm for the constant residual tensile strength. Consequently, the finite element analysis results present a lower limit of the investigated fiber-reinforced concrete prisms’ behavior within the CMOD range of 0.5 mm to 2.5 mm. Although the force results slightly overestimated the load-bearing capacity around a CMOD value of 0.5 mm, the calculated forces still came closer to the experimentally determined value (at a CMOD of 0.5 mm) compared with the results of the nonlinear semi-numeric computational procedure based on the moment-curvature relation where tensile strength properties were determined using simplified expressions from the fib Model Code for Concrete Structures 2010 [17].

Author Contributions

Conceptualization, Ž.U. and M.K.; methodology, Ž.U. and M.K.; software, Ž.U.; validation, Ž.U. and M.K.; formal analysis, Ž.U. and M.K.; investigation, Ž.U. and M.K.; resources, Ž.U. and M.K.; data curation, Ž.U. and M.K.; writing—original draft preparation, Ž.U.; writing—review and editing, Ž.U. and M.K.; visualization, Ž.U.; supervision, M.K.; project administration, Ž.U.; funding acquisition, Ž.U. All authors have read and agreed to the published version of the manuscript.

Funding

This research was funded by the Slovenian Research Agency (project number Z2-4425).

Data Availability Statement

The raw data supporting the conclusions of this article will be made available by the authors on request.

Acknowledgments

The authors appreciate BarChip EMEA Ltd. (Dublin, Ireland) for supplying Barchip 48 fibers and offering technical support.

Conflicts of Interest

The authors declare no conflicts of interest.

References

  1. Balea, A.; Fuente, E.; Monte, M.C.; Blanco, Á.; Negro, C. 20—Fiber Reinforced Cement Based Composites. In Fiber Reinforced Composites; Joseph, K., Oksman, K., George, G., Wilson, R., Appukuttan, S., Eds.; Woodhead Publishing Series in Composites Science and Engineering; Woodhead Publishing: Duxford, UK, 2021; pp. 597–648. ISBN 978-0-12-821090-1. [Google Scholar]
  2. Amin, A.; Foster, S.J.; Gilbert, R.I.; Kaufmann, W. Material Characterisation of Macro Synthetic Fibre Reinforced Concrete. Cem. Concr. Compos. 2017, 84, 124–133. [Google Scholar] [CrossRef]
  3. Design of Steel Fibre Reinforced Concrete Using the σ-w Method: Principles and Applications. Mater. Struct. 2002, 35, 262–278. [CrossRef]
  4. Pedersen, C. New Production Processes, Materials and Calculation Techniques for Fibre Reinforced Pipes. Ph.D. Thesis, Technical University of Denmark, Kongens Lyngby, Denmark, 1996. [Google Scholar]
  5. Casanova, P.; Rossi, P. Analysis and Design of Steel Fiber Reinforced Concrete Beams. Struct. J. 1997, 94, 595–602. [Google Scholar]
  6. Stang, H.; Olesen, J.F. On the Interpretation of Bending Tests on FRC-Materials. In Proceedings of the FRAMCOS-3, Gifu, Japan, 12–16 October 1998; Aedificatio Publishers: Freiburg, Germany, 1998; pp. 511–520. [Google Scholar]
  7. Zhang, J.; Stang, H. Applications of Stress Crack Width Relationship in Predicting the Flexural Behavior of Fibre-Reinforced Concrete. Cem. Concr. Res. 1998, 28, 439–452. [Google Scholar] [CrossRef]
  8. Tada, H.; Paris, P.C.; Irwin, G.R. The Stress Analysis of Cracks Handbook, 2nd ed.; Paris Productions & (Del Research Corp.): St. Louis, MI, USA, 1985. [Google Scholar]
  9. Soranakom, C.; Mobasher, B. Closed-Form Solutions for Flexural Response of Fiber-Reinforced Concrete Beams. J. Eng. Mech. 2007, 133, 933–941. [Google Scholar] [CrossRef]
  10. Volpatti, G.; Martínez, J.A.; Diaz, J.C.; Zampini, D. Advanced Closed-Form Moment-Curvature Formulation for Fiber-Reinforced Concrete Members. Compos. Struct. 2022, 279, 114755. [Google Scholar] [CrossRef]
  11. Blanco, A.; Pujadas, P.; De la Fuente, A.; Cavalaro, S.; Aguado, A. Application of Constitutive Models in European Codes to RC–FRC. Constr. Build. Mater. 2013, 40, 246–259. [Google Scholar] [CrossRef]
  12. Unuk, Ž.; Kuhta, M. Full-Scale Test and Load-Bearing Capacity Evaluation of Synthetic-Polymer-Fiber-Reinforced Concrete Tetrapods under Quasi-Static Loading. Buildings 2022, 12, 2143. [Google Scholar] [CrossRef]
  13. Di Prisco, M.; Colombo, M.; Dozio, D. Fibre-reinforced Concrete in Fib Model Code 2010: Principles, Models and Test Validation. Struct. Concr. 2013, 14, 342–361. [Google Scholar] [CrossRef]
  14. Enfedaque, A.; Suárez, F.; Alberti, M.G.; Gálvez, J.C. Suitability of Constitutive Models of the Structural Concrete Codes When Applied to Polyolefin Fibre Reinforced Concrete. Materials 2022, 15, 2323. [Google Scholar] [CrossRef] [PubMed]
  15. Zhang, H.; Huang, Y.J.; Yang, Z.J.; Xu, S.L.; Chen, X.W. A Discrete-Continuum Coupled Finite Element Modelling Approach for Fibre Reinforced Concrete. Cem. Concr. Res. 2018, 106, 130–143. [Google Scholar] [CrossRef]
  16. Farsi, A.; Bedi, A.; Latham, J.P.; Bowers, K. Simulation of Fracture Propagation in Fibre-Reinforced Concrete Using FDEM: An Application to Tunnel Linings. Comput. Part. Mech. 2020, 7, 961–974. [Google Scholar] [CrossRef]
  17. Fédération Internationale Du Béton/International Federation for Structural Concrete (fib). fib Model Code for Concrete Structures 2010; Wilhelm Ernst & Sohn, Verlag für Architektur und Technische Wissenschaften GmbH & Co. KG: Berlin, Germany, 2013. [Google Scholar]
  18. Ansys® Mechanical APDL, Release 2022 R2, Help System, Material Reference; ANSYS, Inc.: Canonsburg, PA, USA, 2022.
  19. EN 14651: 2005+A1: 2007; Test Method for Metallic Fibre Concrete–Measuring the Flexural Tensile Strength (Limit of Proportionality (LOP), Residual). European Committee for Standardization: Brussels, Belgium, 2007.
  20. EN 1992-1-1; Eurocode 2: Design of Concrete Structures—Part 1-1: General Rules and Rules for Buildings. European Committee for Standardization: Brussels, Belgium, 2004.
  21. Leaders in Concrete & Concrete Products: BarChipInc. Available online: https://barchip.com/product/ (accessed on 13 November 2023).
  22. EN 14889-2:2006; Fibres for Concrete Polymer Fibres. Definitions, Specifications and Conformity. European Committee for Standardization: Brussels, Belgium, 2006.
  23. EN 12390-3; Testing Hardened Concrete–Part 3: Compressive Strength of Test Specimens. European Committee for Standardization: Brussels, Belgium, 2019.
  24. Hordijk, D. Local Approach to Fatigue of Concrete. Ph.D. Thesis, Delft University and Technology, Delft, The Netherlands, 1991. [Google Scholar]
  25. de Montaignac, R.; Massicotte, B.; Charron, J.-P. Design of SFRC Structural Elements: Flexural Behaviour Prediction. Mater. Struct. 2012, 45, 623–636. [Google Scholar] [CrossRef]
  26. Krastev, R. Consistent Presentation of the Beam Deflection Theory Including Shear Correction. Int. Sci. J. Math. Model. 2021, 5, 120–123. [Google Scholar]
  27. Ansys® Mechanical, Release 2022 R2, Help System, Mechanical User’s Guide; ANSYS, Inc.: Canonsburg, PA, USA, 2022.
  28. Ansys® Mechanical APDL, Release 2022 R2, Help System, Element Reference; ANSYS, Inc.: Canonsburg, PA, USA, 2022.
  29. Park, S.H.; Bang, K.H.; Cho, J.R. Structural Integrity Evaluation of a Reactor Cavity during a Steam Explosion for External Reactor Vessel Cooling. Energies 2021, 14, 3605. [Google Scholar] [CrossRef]
  30. Pokorska, I.; Poński, M.; Kubissa, W.; Libura, T.; Brodecki, A.; Kowalewski, Z. Computational Fracture Evolution Analysis of Steel-Fiber-Reinforced Concrete Using Concrete Continuous Damage and Fiber Progressive Models. Materials 2023, 16, 5635. [Google Scholar] [CrossRef] [PubMed]
  31. CEB-FIP MODEL CODE 1990; Thomas Telford Publishing: London, UK, 1993.
Figure 1. Three-point bending test configuration (the specimen B23258/1 is shown).
Applsci 14 01604 g001
Figure 2. Compression test.
Applsci 14 01604 g002
Figure 3. Load-versus-displacement curves (midspan displacement in the vertical direction).
Applsci 14 01604 g003
Figure 4. Fiber-reinforced prisms after bending tests (left) and the notched region (right) with the crack after the bending test (prism B23258/1).
Applsci 14 01604 g004
Figure 5. Concrete cubes after the compression test: unreinforced cube BV1 (left); fiber-reinforced cube ZV1 after the compression test (center); and fiber-reinforced cube ZV1 after the compression test and removal of the cracked parts by hand (right).
Applsci 14 01604 g005
Figure 6. CMOD and CTOD measurement locations.
Applsci 14 01604 g006
Figure 7. Constitutive law of fiber-reinforced concrete according to the fib Model Code for Concrete Structures 2010 [17] (the graphs have different scales for clarity): (a) in compression; (b) in tension for small strains of < 1‰; and (c) in tension for large strains of > 1‰.
Applsci 14 01604 g007
Figure 8. Calculated bending moment versus curvature relation for the gross cross-section, for the notched cross-section with tensile strength values determined from expressions in the fib Model Code for Concrete Structures 2010 [17], and for the notched cross-section with marked strains at the bottom edge (εbot) of the notched cross-section (corresponding to specific curvature values).
Applsci 14 01604 g008
Figure 9. Stress distributions for different load stages (CRACK–load of crack occurrence (εbot = εP), Mₘₐₓ—maximum bending moment (εbot = 0.262∙10⁻³), SLS—load of CMOD = 0.5 mm (εbot = εSLS), and ULS—load of CMOD = 2.5 mm (εbot = εULS)).
Applsci 14 01604 g009
Figure 10. Considered curvature distributions over the prism length prior to reaching the maximum load (a) and after reaching the maximum load (b), and definition of the angle of rotation at the notch after reaching the maximum load (c).
Applsci 14 01604 g010
Figure 11. Specific points of the bending moment versus curvature relation considered for the displacement calculation.
Applsci 14 01604 g011
Figure 12. Calculated load-displacement relation (the dotted line presents the results based on tensile strength values from expressions of the fib Model Code for Concrete Structures 2010 [17]).
Applsci 14 01604 g012
Figure 13. Geometry, coordinate system, loads, and support conditions of the finite element model (left: view of the notched side of the model; right: view of the end face of the model).
Applsci 14 01604 g013
Figure 14. Finite element mesh in the region of the notch.
Applsci 14 01604 g014
Figure 15. The deformed shape and visible mesh deformation with vertical displacements contour (displacements in mm) for the final load step with midspan displacement of 3.5 mm.
Applsci 14 01604 g015
Figure 16. Deformed shape with (unaveraged) equivalent plastic strain contour (strain is unitless) for the final load step with midspan displacement of 3.5 mm.
Applsci 14 01604 g016
Figure 17. Finite element analysis load-displacement relation.
Applsci 14 01604 g017
Figure 18. Finite element analysis load-displacement relation.
Applsci 14 01604 g018
Figure 19. Stress path (left) and normal stress distributions (right) for different load steps (CRACK—last load step prior to occurrence of equivalent plastic strain, Mₘₐₓ—load step with maximum bending moment (or load) at the notched cross-section, SLS—load step corresponding to CMOD = 0.5 mm, and ULS—load step corresponding to CMOD = 2.5 mm).
Applsci 14 01604 g019
Figure 20. Averaged experimental values (Exp.), values calculated based on the back-calculated tensile strength (M-κ), and values calculated based on tensile strength values from expressions in the fib Model Code for Concrete Structures 2010 [17] (M-κ (fib)) and finite element analysis (FEA) load-displacement relations (with the shaded area representing the envelope of all experimental results).
Applsci 14 01604 g020
Table 1. Averaged notched cross-section dimensions.
B23258/1B23258/2B23258/3B23258/4B23258/5B23258/6
B [mm]150.33149.57149.62149.21149.87150.96
Hn [mm]125.06125.03125.01125125.2125.06
Table 2. Concrete composition.
ComponentDosage [kg/m3]
Aggregate (maximum grain size: 16 mm)711
Cement (CEM II/A-S 52.5 N)135
Total water71.4
Plasticizer0.4
Barchip 48 fibers5
Table 3. Barchip 48 fiber properties.
PropertyValue/Description
Tensile strength [MPa]640
Young’s modulus [GPa]12
Length [mm]48
Base materialVirgin polypropylene
Table 4. Three-point bending test results.
B23258/1B23258/2B23258/3B23258/4B23258/5B23258/6
iFi
[kN]
σi
[MPa]
Fi
[kN]
σi
[MPa]
Fi
[kN]
σi
[MPa]
Fi
[kN]
σi
[MPa]
Fi
[kN]
σi
[MPa]
Fi
[kN]
σi
[MPa]
Faver.i
[kN]
Fsd.i
[kN]
σaver.i
[MPa]
σsd.i
[MPa]
Max.14.634.6716.575.3113.534.3413.064.2012.433.9714.644.6514.141.3454.520.43
0.477.402.368.562.756.272.014.531.464.881.567.592.416.541.4622.090.47
1.328.802.8110.113.248.322.676.612.136.482.0710.023.188.391.4492.680.46
2.178.962.8610.223.288.152.616.071.956.422.0510.713.408.421.7492.690.55
3.028.622.75////5.711.846.962.2211.493.658.202.1662.610.68
Table 5. Compression test results.
Without FibersWith Fibers
BV1BV2BV3ZV1ZV2ZV3
fc48.5348.4447.6445.3844.7645.87
fc.aver.48.2145.33
Table 6. Input parameters of the stress-strain diagram in Figure 7 (with tensile strength results).
PropertyUnitValue
fcm [MPa]37.10
Ecm [GPa]32.60
εc1 [10−3]−2.15
GF [N/m]139.90
εP [10−3]0.15
εC [10−3]0.45
εSLS [10−3]3.33
εULS [10−3]16.67
fctm [MPa]2.82
fFts [MPa]0.75
fFtu [MPa]1.07
Table 7. Comparison of the calculated values (δcalculated), based on the back-calculated tensile strength values, and displacement values defined as per EN14651 standard [19] (δstandard), corresponding to specific CMOD values (with corresponding CTOD values, calculated curvature values (κ) of the notched cross-section, and load values (F)).
CMOD
[mm]
CTOD
[mm]
κ
[1/m]
δstandard
[mm]
δcalculated
[mm]
F
[kN]
0.02.27 × 10−30.040.0412.31
2.11 × 10−21.76 × 10−20.00360.060.0514.14
0.50.420.03010.470.476.54
1.51.250.08601.321.357.43
2.52.080.14162.172.228.42
3.52.920.19713.023.089.40
Table 8. Comparison of the calculated values (δcalculated), based on tensile strength values from expressions in the fib Model Code for Concrete Structures 2010 [17]), and displacement values defined as per EN14651 standard [19] (δstandard) corresponding to specific CMOD values (with corresponding CTOD values, calculated curvature values (κ) of the notched cross-section, and load values (F)).
CMOD
[mm]
CTOD
[mm]
κ
[1/m]
δstandard
[mm]
δcalculated
[mm]
F
[kN]
002.24 × 10−30.040.0412.35
2.09 × 10−21.74 × 10−20.00360.060.0514.33
0.50.420.03620.470.578.29
1.51.250.10321.321.628.38
2.52.080.16942.172.658.41
3.52.920.23543.023.688.41
Table 9. Material properties for the Menetrey-Willam material model.
PropertyUnitValue
Young’s modulus MPa3.26 × 104
Poisson’s ratio /2.00 × 10−1
Bulk modulus MPa1.81 × 104
Shear modulus MPa1.36 × 104
Uniaxial compressive strengthMPa3.71 × 101
Uniaxial tensile strengthMPa2.82 × 100
Biaxial compressive strengthMPa4.31 × 101
Plastic strain at uniaxial Compressive strength/1.69 × 10−3
Plastic strain at transition from power law to exponential softening/3.04 × 10−3
Relative stress at start of nonlinear hardening/3.66 × 10−1
Residual relative stress at transition from power law to exponential softening/5.11 × 10−1
Residual compressive relative stress/2.00 × 10−1
Mode 1 area specific fracture energyN/m7.51 × 101
Residual tensile relative stress/2.66 × 10−1
Dilatancy angle°9
Table 10. Finite element analysis results for CMOD, CTOD, vertical displacement (δ), and load (F) (the row values correspond to the same load step).
CMOD
[mm]
CTOD
[mm]
F
[kN]
δ
[mm]
CMOD/CTOD
[/]
0.00320.00073.010.014.79
0.04170.027114.090.071.54
0.50360.41137.150.451.22
2.49782.06946.982.121.21
Table 11. Comparison of measured and calculated load values at certain displacements.
Average
Experimental
Load
Corresponding
Experimental
Displacement
M-κ
Calculated
Load
M-κ
Calculated
Displacement
M-κ (fib)
Calculated
Load
M-κ (fib)
Calculated
Displacement
FEA
Load
FEA
Displacement
[kN][mm][kN][mm][kN][mm][kN][mm]
Max. load14.140.053 *14.140.05114.330.05114.090.067
CMOD = 0.5 mm6.540.4656.540.4738.290.4807.150.452
CMOD = 2.5 mm8.422.1658.422.2168.412.2206.982.117
* Average value of displacements at maximum loads of all fiber-reinforced prisms.
Disclaimer/Publisher’s Note: The statements, opinions and data contained in all publications are solely those of the individual author(s) and contributor(s) and not of MDPI and/or the editor(s). MDPI and/or the editor(s) disclaim responsibility for any injury to people or property resulting from any ideas, methods, instructions or products referred to in the content.

